32
First published in June 1999 National Pollutant Inventory Emission Estimation Technique Manual for Phosphate Manufacturing

First published in June 1999
National Pollutant Inventory
Emission EstimationTechnique Manual
for
PhosphateManufacturing
Phosphate Manufacturing i
EMISSION ESTIMATION TECHNIQUES
FOR
PHOSPHATE MANUFACTURING
TABLE OF CONTENTS
1.0 INTRODUCTION....................................................................................................... 1
2.0 PROCESSES AND EMISSIONS.............................................................................. 2
2.1 Process Description ....................................................................................... 22.1.1 Normal Superphosphate........................................................................ 22.1.2 High Analysis Superphosphate ............................................................ 52.1.3 Ammonium Phosphate .......................................................................... 6
2.2 Emissions to Air ............................................................................................. 82.3 Emissions to Water ........................................................................................ 82.4 Emissions to Land.......................................................................................... 9
3.0 EMISSION ESTIMATION TECHNIQUES ........................................................... 10
3.1 Using Sampling or Direct Measurement .................................................. 123.1.1 For Emissions to Atmosphere ............................................................... 123.1.2 For Emissions to Water .......................................................................... 16
3.2 Using Mass Balance....................................................................................... 173.3 Using Emission Factors................................................................................. 193.4 Using Engineering and Site-Specific Equations...................................... 21
3.4.1 Fugitive Emissions.................................................................................. 22
4.0 EMISSION ESTIMATION TECHNIQUES: ACCEPTABLE RELIABILITY ANDUNCERTAINTY .......................................................................................................... 27
4.1 Direct Measurement...................................................................................... 274.2 Mass Balance .................................................................................................. 274.3 Engineering Calculations............................................................................. 274.4 Emission Factors ............................................................................................ 28
5.0 REFERENCES .............................................................................................................. 29
Phosphate Manufacturing ii
PHOSPHATE FERTILSER MANUFACTURING
LIST OF FIGURES AND TABLES
Figure 1 - Normal Superphosphate Process Flow Diagram Showing EmissionSources ................................................................................................................... 4
2 - Dorr-Oliver Process for Granular High Analysis SuperphosphateProduction ............................................................................................................. 6
3 - Ammonium Phosphate Process Flow Diagram........................................ 7
Table 1 - Common Emissions of NPI-Listed Substances from PhosphateManufacturing Processes ................................................................................... 8
2 - List of Variables and Symbols..................................................................... 11
3 - Stack Sample Test Results............................................................................ 13
4 - Emission Factors for the Production of Normal Superphosphate ........ 20
5 - Emission Factors for Speciated and Total Volatile Organic Compoundsfrom Phosphate Manufacturing........................................................................ 20
6 - Controlled Emission Factors for the Production of High AnalysisSuperphosphates ................................................................................................. 21
7 - Controlled Emission Factors for the Production of AmmoniumPhosphates ............................................................................................................ 21
8 - Correlation Equations, Default Zero Emission Rates, and Pegged EmissionRates for Estimating Fugitive Emissions ........................................................ 23
9 - Emission Factors for Equipment Leaks...................................................... 26

Phosphate Manufacturing 1
1.0 Introduction
The purpose of all Emission Estimation Technique (EET) Manuals in this series is to assistAustralian manufacturing, industrial and service facilities to report emissions of listedsubstances to the National Pollutant Inventory (NPI). This Manual describes theprocedures and recommended approaches for estimating emissions from facilitiesengaged in Phosphate Manufacturing.
EET MANUAL: Phosphate Manufacturing
HANDBOOK: Fertiliser Manufacturing
ANZSIC CODES : 2531
This Manual was drafted by the NPI Unit of the Queensland Department of Environmentand Heritage on behalf of the Commonwealth Government. It has been developedthrough a process of national consultation involving State and Territory environmentalauthorities and key industry stakeholders.
Phosphate Manufacturing 2
2.0 Processes and Emissions
The following section presents a brief description of the Phosphate Manufacturingindustry and identifies likely sources of emissions of NPI-listed substances.
2.1 Process Description
Phosphate fertilisers are classified into three groups of chemical compounds. Two of thesegroups are known as superphosphates and are defined by the percentage of phosphorusas phosphorus pentoxide (P2O5). Normal superphosphates contain between 15 and 21percent phosphorus as P2O5 whereas triple superphosphate contains over 40 percentphosphorus. The remaining phosphate fertiliser group is ammonium phosphate(NH4H2PO4).
Phosphoric acid is an important industrial acid used in the manufacture of fertilisers, forthe corrosion treatment of metals and in the production or inorganic phosphates,especially detergent and food grade polyphosphates.
Fertiliser grade phosphoric acid is manufactured by treating rock phosphate with excesssulfuric acid, a process that produces considerable amounts of waste calcium sulfate(gypsum). The Inorganic Chemical Manufacturing EET Manual contains information onphosphoric acid manufacture, associated emissions, and the techniques for estimatingemissions associated with its production.
If phosphoric acid is used, either in place of, or partly as a replacement for sulfuric acid, ahigher analysis phosphate fertiliser is produced called double and triple phosphate. Thisform of phosphate fertiliser contains more phosphorus (typically to 20 percent asphosphorus). High analysis fertiliser is therefore more economic at locations distant fromplace of manufacture or supply. To address this shift in demand favouring higher analysisfertiliser, certain Australian manufacturers are producing phosphoric acid to replacesulfuric acid. The weight or bulk of fertiliser required to apply the phosphorus is less thanhalf the single strength form.
High analysis phosphates are also currently imported (especially ammonium phosphateswith a high concentration of nitrogen and phosphorus) and often blended with locallyproduced single strength superphosphate to provide a double strength fertiliser. Singlestrength superphosphate is under considerable competitive pressure from high analysisforms resulting in flat and even declining demand. It generally contains only 9 percentphosphorus.
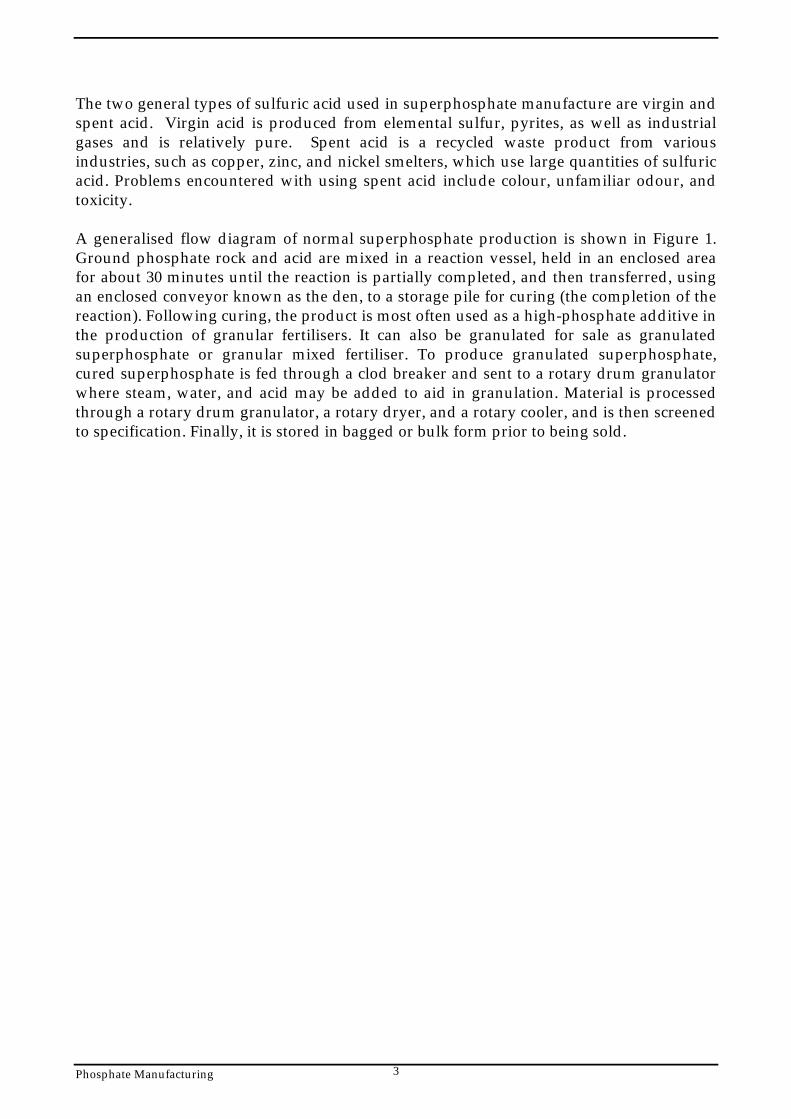
2.1.1 Normal Superphosphate
Normal superphosphates are prepared by reacting ground phosphate rock with 65 to 75percent sulfuric acid. An important factor in the production of normal superphosphates isthe amount of iron and aluminium in the phosphate rock. Aluminium (as Al2O3) and iron(as Fe2O3) above five percent imparts an extreme stickiness to the superphosphate andmakes it difficult to handle.
Phosphate Manufacturing 3
The two general types of sulfuric acid used in superphosphate manufacture are virgin andspent acid. Virgin acid is produced from elemental sulfur, pyrites, as well as industrialgases and is relatively pure. Spent acid is a recycled waste product from variousindustries, such as copper, zinc, and nickel smelters, which use large quantities of sulfuricacid. Problems encountered with using spent acid include colour, unfamiliar odour, andtoxicity.
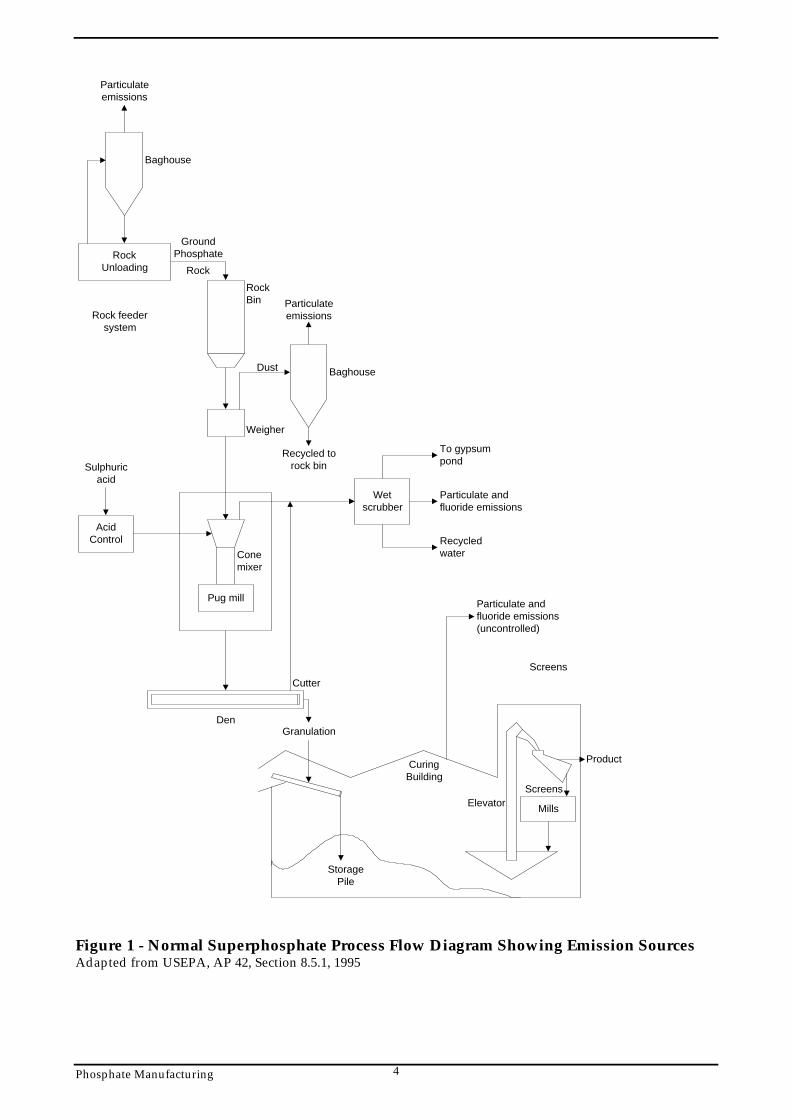
A generalised flow diagram of normal superphosphate production is shown in Figure 1.Ground phosphate rock and acid are mixed in a reaction vessel, held in an enclosed areafor about 30 minutes until the reaction is partially completed, and then transferred, usingan enclosed conveyor known as the den, to a storage pile for curing (the completion of thereaction). Following curing, the product is most often used as a high-phosphate additive inthe production of granular fertilisers. It can also be granulated for sale as granulatedsuperphosphate or granular mixed fertiliser. To produce granulated superphosphate,cured superphosphate is fed through a clod breaker and sent to a rotary drum granulatorwhere steam, water, and acid may be added to aid in granulation. Material is processedthrough a rotary drum granulator, a rotary dryer, and a rotary cooler, and is then screenedto specification. Finally, it is stored in bagged or bulk form prior to being sold.
Phosphate Manufacturing 4
RockUnloading
Particulateemissions
Baghouse
GroundPhosphate
Rock
RockBin
Rock feedersystem
Particulateemissions
Baghouse
Recycled torock bin
Pug mill
AcidControl
Sulphuricacid
Conemixer
Wetscrubber
To gypsumpond
Particulate andfluoride emissions
Recycledwater
Cutter
Den
Mills
Screens
Product
Elevator
CuringBuilding
StoragePile
Particulate andfluoride emissions(uncontrolled)
Screens
Dust
Weigher
Granulation
Figure 1 - Normal Superphosphate Process Flow Diagram Showing Emission SourcesAdapted from USEPA, AP 42, Section 8.5.1, 1995
Phosphate Manufacturing 5
2.1.2 High Analysis Superphosphate
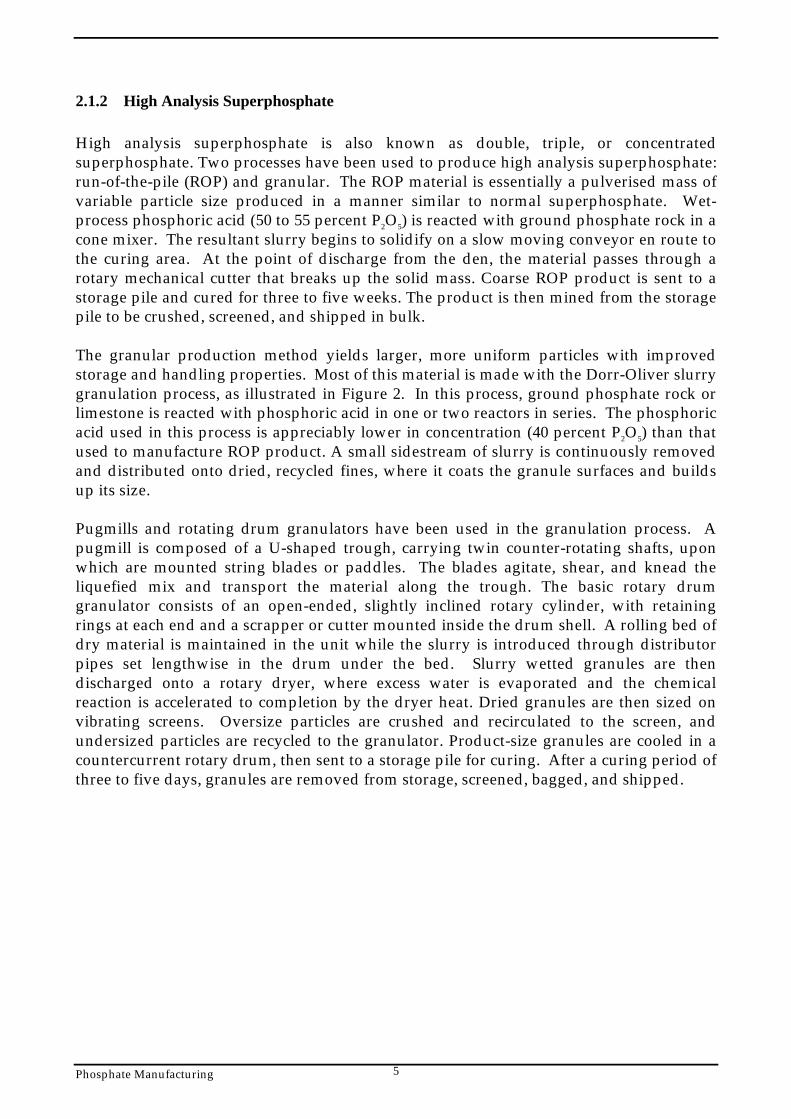
High analysis superphosphate is also known as double, triple, or concentratedsuperphosphate. Two processes have been used to produce high analysis superphosphate:run-of-the-pile (ROP) and granular. The ROP material is essentially a pulverised mass ofvariable particle size produced in a manner similar to normal superphosphate. Wet-process phosphoric acid (50 to 55 percent P2O5) is reacted with ground phosphate rock in acone mixer. The resultant slurry begins to solidify on a slow moving conveyor en route tothe curing area. At the point of discharge from the den, the material passes through arotary mechanical cutter that breaks up the solid mass. Coarse ROP product is sent to astorage pile and cured for three to five weeks. The product is then mined from the storagepile to be crushed, screened, and shipped in bulk.
The granular production method yields larger, more uniform particles with improvedstorage and handling properties. Most of this material is made with the Dorr-Oliver slurrygranulation process, as illustrated in Figure 2. In this process, ground phosphate rock orlimestone is reacted with phosphoric acid in one or two reactors in series. The phosphoricacid used in this process is appreciably lower in concentration (40 percent P2O5) than thatused to manufacture ROP product. A small sidestream of slurry is continuously removedand distributed onto dried, recycled fines, where it coats the granule surfaces and buildsup its size.
Pugmills and rotating drum granulators have been used in the granulation process. Apugmill is composed of a U-shaped trough, carrying twin counter-rotating shafts, uponwhich are mounted string blades or paddles. The blades agitate, shear, and knead theliquefied mix and transport the material along the trough. The basic rotary drumgranulator consists of an open-ended, slightly inclined rotary cylinder, with retainingrings at each end and a scrapper or cutter mounted inside the drum shell. A rolling bed ofdry material is maintained in the unit while the slurry is introduced through distributorpipes set lengthwise in the drum under the bed. Slurry wetted granules are thendischarged onto a rotary dryer, where excess water is evaporated and the chemicalreaction is accelerated to completion by the dryer heat. Dried granules are then sized onvibrating screens. Oversize particles are crushed and recirculated to the screen, andundersized particles are recycled to the granulator. Product-size granules are cooled in acountercurrent rotary drum, then sent to a storage pile for curing. After a curing period ofthree to five days, granules are removed from storage, screened, bagged, and shipped.

Phosphate Manufacturing 6
ParticulateEmissions
Baghouse
RockUnloading
GroundPhosphate Rock
AcidControl
Wet ProcessPhosphorusAcid
RockBin
WeigherFeeder
Baghouse
ParticulateEmissions
Rock Dust
Reactor
Scrubber
Scrubber
Particulateand FluorideEmissions
Granulator DryerAir
Fuel
Scrubber
Scrubber
DustCyclone
DustCyclone
Crusher
Cooler
Over-SizeScreen
ProductScreen
Recycled toGranulator
Elevator
Air
Particulate
Cyclone
Curing Building
Scrubber
Particulateand FluorideEmissions
RecycledPond Water
Figure 2 - Dorr-Oliver Process for Granular High Analysis Superphosphate ProductionSource: USEPA, AP 42, Section 8.5.2, 1995
2.1.3 Ammonium Phosphate
Ammonium phosphate (NH4H2PO4) is produced by reacting phosphoric acid (H3PO4) withanhydrous ammonia (NH3). Ammoniated superphosphates are produced by addingnormal superphosphate or high analysis superphosphate to the mixture.
Two basic mixer designs are used by ammoniation-granulation plants: the pugmillammoniator and the rotary drum ammoniator. The basic rotary drum ammoniator-granulator consists of a slightly inclined open-end rotary cylinder with retaining rings ateach end, and a scrapper or cutter mounted inside the drum shell. A rolling bed ofrecycled solids is maintained in the unit.
Ammonia-rich offgases pass through a wet scrubber before exhausting to the atmosphere.Primary scrubbers use raw materials mixed with acids (eg. scrubbing liquor) andsecondary scrubbers use gypsum pond water.
In the rotary drum process, phosphoric acid is mixed in an acid surge tank with 93 percentsulfuric acid (H2SO4) which is used for product analysis control, and with recycled acidfrom wet scrubbers. A schematic diagram of the ammonium phosphate process flow
Phosphate Manufacturing 7
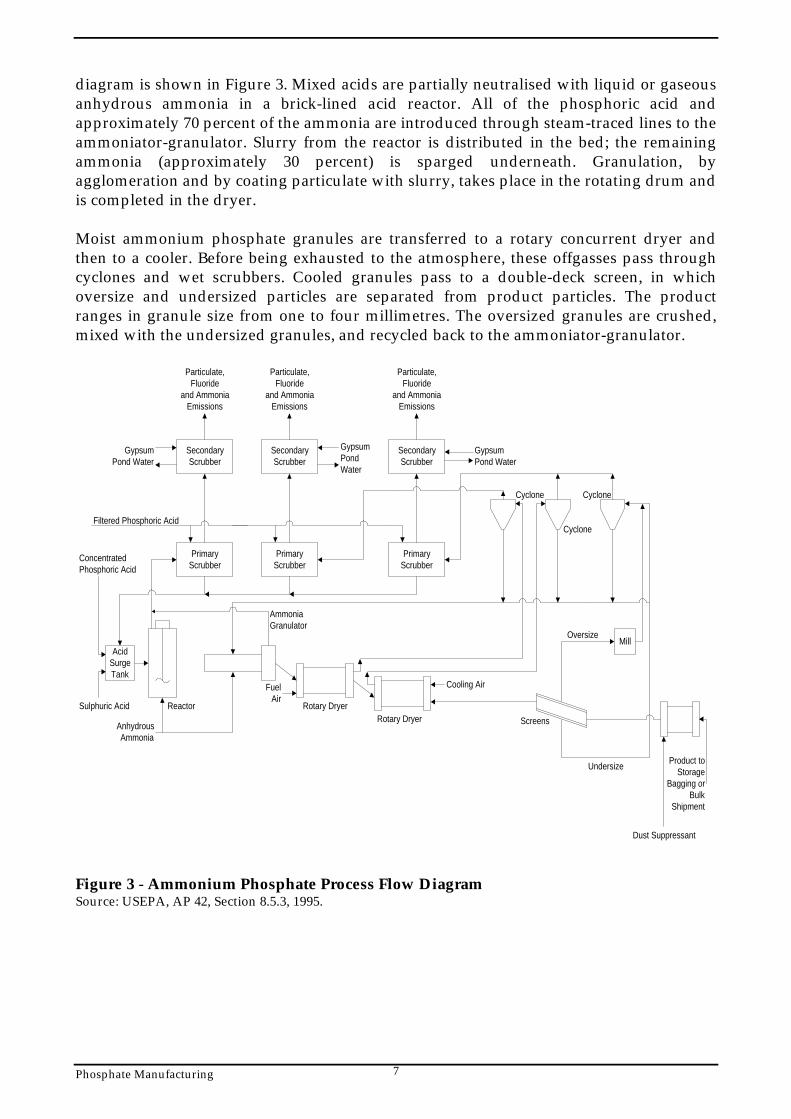
diagram is shown in Figure 3. Mixed acids are partially neutralised with liquid or gaseousanhydrous ammonia in a brick-lined acid reactor. All of the phosphoric acid andapproximately 70 percent of the ammonia are introduced through steam-traced lines to theammoniator-granulator. Slurry from the reactor is distributed in the bed; the remainingammonia (approximately 30 percent) is sparged underneath. Granulation, byagglomeration and by coating particulate with slurry, takes place in the rotating drum andis completed in the dryer.
Moist ammonium phosphate granules are transferred to a rotary concurrent dryer andthen to a cooler. Before being exhausted to the atmosphere, these offgasses pass throughcyclones and wet scrubbers. Cooled granules pass to a double-deck screen, in whichoversize and undersized particles are separated from product particles. The productranges in granule size from one to four millimetres. The oversized granules are crushed,mixed with the undersized granules, and recycled back to the ammoniator-granulator.
SecondaryScrubber
SecondaryScrubber
SecondaryScrubber
PrimaryScrubber
PrimaryScrubber
PrimaryScrubber
GypsumPond Water
Particulate,Fluoride
and AmmoniaEmissions
Particulate,Fluoride
and AmmoniaEmissions
Particulate,Fluoride
and AmmoniaEmissions
GypsumPondWater
GypsumPond Water
Filtered Phosphoric Acid
Cyclone
Cyclone
Cyclone
AcidSurgeTank
Reactor Rotary Dryer
FuelAir
Rotary Dryer
Cooling Air
AmmoniaGranulator
Mill
Product toStorage
Bagging orBulk
Shipment
Dust Suppressant
Undersize
Screens
Oversize
ConcentratedPhosphoric Acid
Sulphuric Acid
AnhydrousAmmonia
Figure 3 - Ammonium Phosphate Process Flow DiagramSource: USEPA, AP 42, Section 8.5.3, 1995.

Phosphate Manufacturing 8
2.2 Emissions to Air
Air emissions may be categorised as either fugitive or point source emissions.
Fugitive Emissions
These are emissions that are not released through a vent or stack. Examples of fugitiveemissions include dust from stockpiles, volatilisation of vapour from vats, open vessels, orspills and materials handling. Emissions emanating from ridgeline roof-vents, louvres,and open doors of a building as well as equipment leaks, and leaks from valves andflanges are also examples of fugitive emissions.
Point Source Emissions
These emissions are exhausted into a vent or stack and emitted through a single pointsource into the atmosphere. Table 1 highlights common air emissions of NPI-listedsubstances from Phosphate Manufacturing processes.
Table 1 - Common Emissions of NPI-Listed Substances from Phosphate Manufacturing Processes
Emission MediaSubstance To Atmosphere To Water Via Solid Waste
Ammonia X X XSulfates and sulfur dioxide XTotal Phosphorus XFluoride compounds X X XParticulate Matter (PM10) XVolatile Organic Compounds(VOCs)
X
Source: Queensland Department of Environment and Heritage, 1998
2.3 Emissions to Water
Emissions of substances to water can be categorised as discharges to:
• Surface waters (eg. lakes, rivers, dams, and estuaries);• Coastal or marine waters; and• Stormwater.
Because of the significant environmental hazards posed by emitting toxic substances towater, most facilities emitting NPI-listed substances to waterways are required by theirrelevant State or Territory environment agency to closely monitor and measure theseemissions. This existing sampling data can be used to calculate annual emissions. If no wastewater monitoring data exists, emissions to process water can be calculatedbased on a mass balance or using emission factors.
Phosphate Manufacturing 9
The discharge of listed substances to a sewer or tailings dam does not require reporting tothe NPI. However, leakage and other emissions (including dust) from a tailings storagefacility are reportable. (See also Section Three of The NPI Guide.)
2.4 Emissions to Land Emissions of substances to land on-site include solid wastes, slurries, and sediments.Emissions arising from spills, leaks, and storage and distribution of materials containinglisted substances may also occur to land. These emission sources can be broadlycategorised as:
• surface impoundments of liquids and slurries; and• unintentional leaks and spills.

Phosphate Manufacturing 10
3.0 Emission Estimation Techniques
This sections presents equations and examples of calculations for estimating emissions ofparticulate matter (PM10), total VOCs, speciated organics (formaldehyde and methanol),and inorganic substances (ammonia, total nitrogen) from Phosphate Manufacturingprocesses.
Estimates of emissions of NPI listed substances to air, water and land should be reportedfor each substance that triggers a threshold. The reporting list and detailed information onthresholds are contained in The NPI Guide at the front of this Handbook.
In general, there are four types of emission estimation techniques (EETs) that may be usedto estimate emissions from your facility. The four types described in the NPI Guide are:
• sampling or direct measurement;• mass balance;• fuel analysis or other engineering calculations; and• emission factors.
Select the EET (or mix of EETs) that is most appropriate for your purposes. For example,you might choose to use a mass balance to best estimate fugitive losses from pumps andvents, direct measurement for stack and pipe emissions, and emission factors whenestimating losses from storage tanks and stockpiles.
If you estimate your emission by using any of these EETs, your data will be displayed onthe NPI database as being of ‘acceptable reliability’. Similarly, if your relevantenvironmental authority has approved the use of emission estimation techniques that arenot outlined in this Handbook, your data will also be displayed as being of ‘acceptablereliability’.
This Manual seeks to provide the most effective emission estimation techniques for theNPI substances relevant to this industry. However, the absence of an EET for a substancein this Manual does not necessarily imply that an emission should not reported to the NPI.The obligation to report on all relevant emissions remains if reporting thresholds havebeen exceeded.
You are able to use emission estimation techniques that are not outlined in thisdocument. You must, however, seek the consent of your relevant environmentalauthority. For example, if your company has developed site-specific emission factors,you may use these if approved by your relevant environmental authority.
In general, direct measurement is the most accurate method for characterising emissionsand, where available, such data should be used in preference to other EETs presented inthis Manual. However, additional direct measurement is not required under the NPIMeasure. Direct monitoring may be undertaken as an element of other EETs.
Phosphate Manufacturing 11
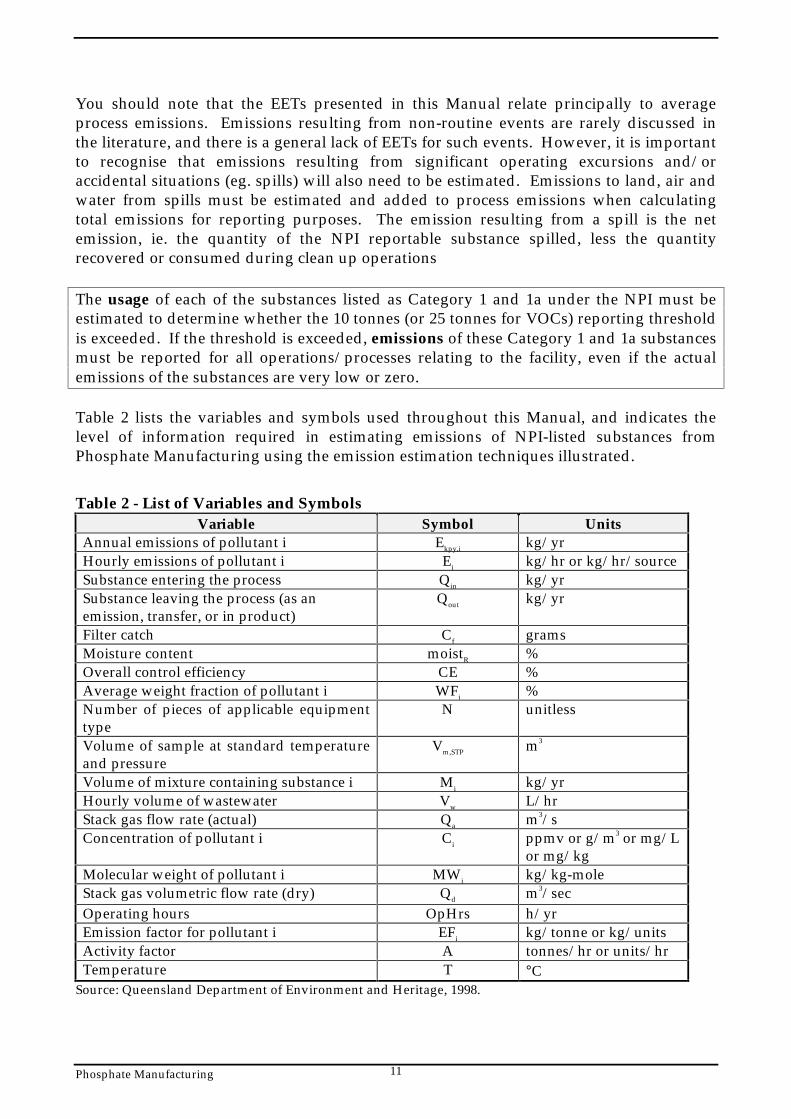
You should note that the EETs presented in this Manual relate principally to averageprocess emissions. Emissions resulting from non-routine events are rarely discussed inthe literature, and there is a general lack of EETs for such events. However, it is importantto recognise that emissions resulting from significant operating excursions and/oraccidental situations (eg. spills) will also need to be estimated. Emissions to land, air andwater from spills must be estimated and added to process emissions when calculatingtotal emissions for reporting purposes. The emission resulting from a spill is the netemission, ie. the quantity of the NPI reportable substance spilled, less the quantityrecovered or consumed during clean up operations
The usage of each of the substances listed as Category 1 and 1a under the NPI must beestimated to determine whether the 10 tonnes (or 25 tonnes for VOCs) reporting thresholdis exceeded. If the threshold is exceeded, emissions of these Category 1 and 1a substancesmust be reported for all operations/processes relating to the facility, even if the actualemissions of the substances are very low or zero.
Table 2 lists the variables and symbols used throughout this Manual, and indicates thelevel of information required in estimating emissions of NPI-listed substances fromPhosphate Manufacturing using the emission estimation techniques illustrated.
Table 2 - List of Variables and SymbolsVariable Symbol Units
Annual emissions of pollutant i Ekpy,i kg/yrHourly emissions of pollutant i Ei kg/hr or kg/hr/sourceSubstance entering the process Qin kg/yrSubstance leaving the process (as anemission, transfer, or in product)
Qout kg/yr
Filter catch Cf gramsMoisture content moistR %Overall control efficiency CE %Average weight fraction of pollutant i WFi %Number of pieces of applicable equipmenttype
N unitless
Volume of sample at standard temperatureand pressure
Vm,STP m3
Volume of mixture containing substance i Mi kg/yrHourly volume of wastewater Vw L/hrStack gas flow rate (actual) Qa m3/sConcentration of pollutant i Ci ppmv or g/m3 or mg/L
or mg/kgMolecular weight of pollutant i MWi kg/kg-moleStack gas volumetric flow rate (dry) Qd m3/secOperating hours OpHrs h/yrEmission factor for pollutant i EFi kg/tonne or kg/unitsActivity factor A tonnes/hr or units/hrTemperature T °C
Source: Queensland Department of Environment and Heritage, 1998.

Phosphate Manufacturing 12
3.1 Using Sampling or Direct Measurement
3.1.1 For Emissions to Atmosphere
Particulate Matter (PM10) Emissions
Stack sampling test reports often provide emissions data in terms of kilograms per hour orgrams per cubic meter (dry standard). Annual emissions for NPI reporting can becalculated from this data. Stack tests for NPI reporting should be performed underrepresentative or normal operating conditions. Some tests undertaken for a State orTerritory license condition may require that the test be taken under maximum emissionsrating, where emissions are likely to be higher than when operating under normaloperating conditions. Data from these tests may need to be scaled back for NPI reportingpurposes.
An example summary of a test method is shown in Table 3. The table shows the results ofthree different sampling runs conducted during one test event. The source parametersmeasured as part of the test run include gas velocity and moisture content, which are usedto determine exhaust gas flow rates in cubic meters. The filter weight gain is determinedgravimetrically and divided by the volume of gas sampled (as shown in Equation 1) todetermine the PM concentration in grams per cubic meter.
Pollutant concentration is then multiplied by the volumetric flow rate to determine theemission rate in kilograms per hour, as shown in Equation 2. Example 1 illustrates theapplication of Equation 1 and Equation 2.
Equation 1CPM = Cf / Vm,STP
where:
CPM = concentration of PM or gram loading, g/m3
Cf = filter catch, gVm,STP = metered volume of sample at standard
temperature and pressure, m3
Equation 2EPM = CPM * Qd * 3.6 * [273 / (273 + T)]
where:
EPM = hourly emissions of PM, kg/hrCPM = concentration of PM or gram loading, g/m3
Qd = stack gas volumetric flow rate, m3/s, dry3.6 = 3600 seconds per hour multiplied by 0.001 kilograms per gramT = temperature of the gas sample, °C

Phosphate Manufacturing 13
Table 3 - Stack Sample Test ResultsParameter Symbol Test 1 Test 2 Test 3
Total sampling time (sec) 7 200 7 200 7 200Moisture collected (g) gMOIST 395.6 372.6 341.4Filter catch (g) Cf 0.0851 0.0449 0.0625Average sampling rate (m3/s) 1.67 * 10-4 1.67 * 10-4 1.67 * 10-4
Standard metered volume (m3) Vm, STP 1.185 1.160 1.163Volumetric flow rate (m3/s), dry Qd 8.48 8.43 8.45Concentration of particulate (g/m3) CPM 0.0718 0.0387 0.0537
Queensland Department of Environment and Heritage 1998
Example 1 - Estimating Particulate Matter (PM10) Emissions
PM emissions calculated using Equation 1 and Equation 2 and the stack sampling data forTest 1 (presented in Table 3, and an exhaust gas temperature of 150°C (423K)) are shownbelow:
CPM = Cf / VSTP
= 0.085 / 1.185= 0.072 g/ m3
EPM = CPM * Qd * 3.6 * [273 ÷ (273 + T)]= 0.072 * 8.48 * 3.6 * (273/423K)= 1.42 kg/hr
The information from some stack tests may be reported in grams of particulate per cubicmetre of exhaust gas (wet). Use Equation 3 to calculate the dry particulate emissions inkilograms per hour.
Equation 3EPM = Qa * CPM * 3.6 * (1 - moistR/100) * [273 / (273 + T)]
where:
EPM = hourly emissions of PM in kilograms per hour, kg/hrQa = actual (ie. wet) cubic metres of exhaust gas per second, m3/sCPM = concentration of PM or gram loading, g/m3
3.6 = 3600 seconds per hour multiplied by 0.001 kilograms per grammoistR = moisture content, %273 = 273 K (0°C)T = stack gas temperature, °C
Total suspended particulates (TSP) are also referred to as total particulate matter (total PM). Todetermine PM10 from total PM emissions, a size analysis may need to be undertaken. The weightPM10 fraction can then be multiplied by the total PM emission rate to produce PM10 emissions.Alternatively, assume that 100% of PM emissions are PM10; ie. assume that all particulate matteremitted to air has an equivalent aerodynamic diameter of 10 micrometres or less ie. ≤10µm.
Phosphate Manufacturing 14
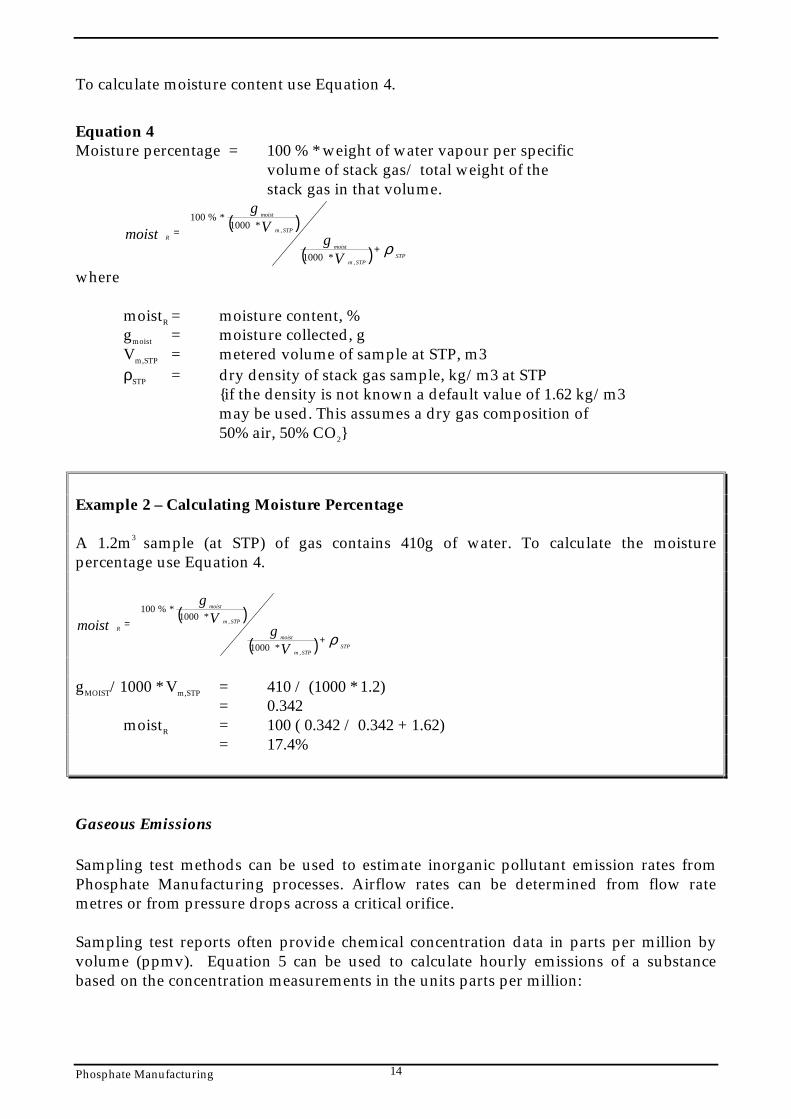
To calculate moisture content use Equation 4.
Equation 4Moisture percentage = 100 % * weight of water vapour per specific
volume of stack gas/ total weight of thestack gas in that volume.
( )
( ) ρSTP
STPm
moist
STPm
moist
R
Vg
Vg
moist+
=
,
,
*1000
*1000*%100
where
moistR = moisture content, %gmoist = moisture collected, gVm,STP = metered volume of sample at STP, m3ρSTP = dry density of stack gas sample, kg/m3 at STP
{if the density is not known a default value of 1.62 kg/m3may be used. This assumes a dry gas composition of50% air, 50% CO2}
Example 2 – Calculating Moisture Percentage
A 1.2m3 sample (at STP) of gas contains 410g of water. To calculate the moisturepercentage use Equation 4.
( )
( ) ρSTP
STPm
moist
STPm
moist
R
Vg
Vg
moist+
=
,
,
*1000
*1000*%100
gMOIST/1000 * Vm,STP = 410 / (1000 * 1.2)= 0.342
moistR = 100 ( 0.342 / 0.342 + 1.62)= 17.4%
Gaseous Emissions
Sampling test methods can be used to estimate inorganic pollutant emission rates fromPhosphate Manufacturing processes. Airflow rates can be determined from flow ratemetres or from pressure drops across a critical orifice.
Sampling test reports often provide chemical concentration data in parts per million byvolume (ppmv). Equation 5 can be used to calculate hourly emissions of a substancebased on the concentration measurements in the units parts per million:

Phosphate Manufacturing 15
Equation 5Ei = (C * MW * Qd * 3 600) / [22.4 * (T+273/273) * 106]
where:Ei = emissions of pollutant i, kg/hrC = pollutant concentration, ppmvd
MW = molecular weight of the pollutant, kg/kg-moleQd = stack gas volumetric flow rate, m3/s, dry3 600 = conversion factor, s/hr22.4 = volume occupied by one mole of gas at standard
temperature and pressure (0°C and 101.3 kPa), m3/kg-moleT = temperature of gas sample, °C
Emissions in kilograms per year can be calculated by multiplying the average hourlyemission rate (kg/hr) from Equation 5 by the number of operating hours (shown inEquation 6 below) or by multiplying an average emission factor (kg/L) by the total annualamount of material used (L).
Equation 6Ekpy,i = Ei * OpHrs
where:
Ekpy,i = annual emissions of pollutant i, kg/yrEi = total hourly emissions of pollutant i, kg/hrOpHrs = annual operating hours, hr/yr
Concentration data obtained from source testing may come in a variety of units, includingparts per million volume (ppmv), or grams per cubic metre (g/m3), and in a variety ofconditions, such as wet, dry, or excess O2. This may require conversion of concentrationdata to consistent units for compatibility with the equations given above. Example 3illustrates the use of Equation 5 and Equation 6.
Phosphate Manufacturing 16
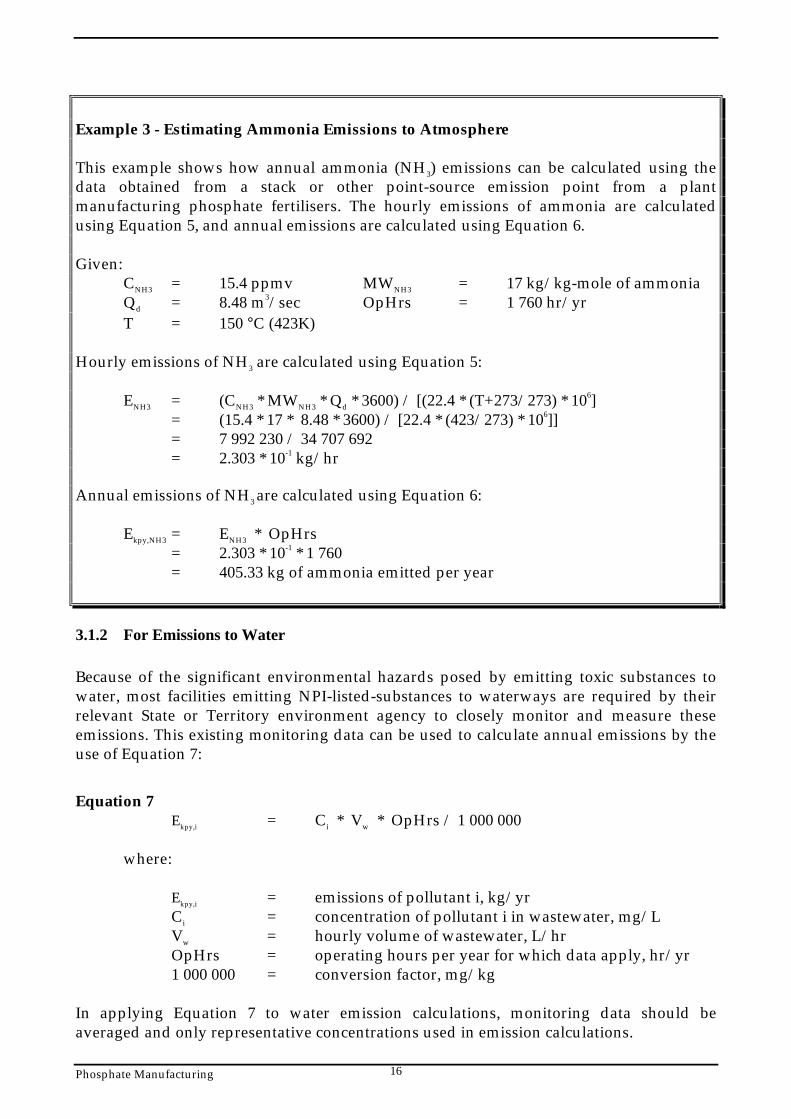
Example 3 - Estimating Ammonia Emissions to Atmosphere
This example shows how annual ammonia (NH3) emissions can be calculated using thedata obtained from a stack or other point-source emission point from a plantmanufacturing phosphate fertilisers. The hourly emissions of ammonia are calculatedusing Equation 5, and annual emissions are calculated using Equation 6.
Given:CNH3 = 15.4 ppmv MWNH3 = 17 kg/kg-mole of ammoniaQd = 8.48 m3/sec OpHrs = 1 760 hr/yrT = 150 °C (423K)
Hourly emissions of NH3 are calculated using Equation 5:
ENH3 = (CNH3 * MWNH3 * Qd * 3600) / [(22.4 * (T+273/273) * 106]= (15.4 * 17 * 8.48 * 3600) / [22.4 * (423/273) * 106]]= 7 992 230 / 34 707 692= 2.303 * 10-1 kg/hr
Annual emissions of NH3 are calculated using Equation 6:
Ekpy,NH3 = ENH3 * OpHrs= 2.303 * 10-1 * 1 760= 405.33 kg of ammonia emitted per year
3.1.2 For Emissions to Water
Because of the significant environmental hazards posed by emitting toxic substances towater, most facilities emitting NPI-listed-substances to waterways are required by theirrelevant State or Territory environment agency to closely monitor and measure theseemissions. This existing monitoring data can be used to calculate annual emissions by theuse of Equation 7:
Equation 7Ekpy,i = Ci * Vw * OpHrs / 1 000 000
where:
Ekpy,i = emissions of pollutant i, kg/yrCi = concentration of pollutant i in wastewater, mg/LVw = hourly volume of wastewater, L/hrOpHrs = operating hours per year for which data apply, hr/yr1 000 000 = conversion factor, mg/kg
In applying Equation 7 to water emission calculations, monitoring data should beaveraged and only representative concentrations used in emission calculations.
Phosphate Manufacturing 17
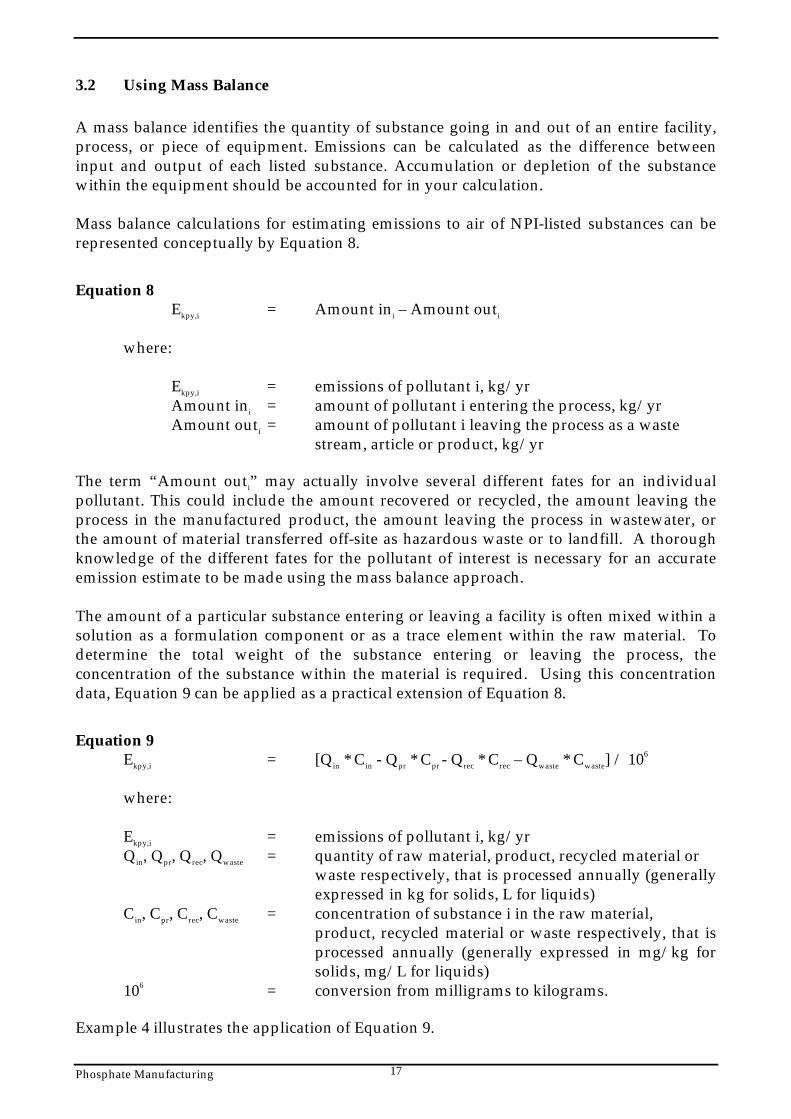
3.2 Using Mass Balance
A mass balance identifies the quantity of substance going in and out of an entire facility,process, or piece of equipment. Emissions can be calculated as the difference betweeninput and output of each listed substance. Accumulation or depletion of the substancewithin the equipment should be accounted for in your calculation.
Mass balance calculations for estimating emissions to air of NPI-listed substances can berepresented conceptually by Equation 8.
Equation 8Ekpy,i = Amount ini – Amount outi
where:
Ekpy,i = emissions of pollutant i, kg/yrAmount ini = amount of pollutant i entering the process, kg/yrAmount outi = amount of pollutant i leaving the process as a waste
stream, article or product, kg/yr
The term “Amount outi” may actually involve several different fates for an individualpollutant. This could include the amount recovered or recycled, the amount leaving theprocess in the manufactured product, the amount leaving the process in wastewater, orthe amount of material transferred off-site as hazardous waste or to landfill. A thoroughknowledge of the different fates for the pollutant of interest is necessary for an accurateemission estimate to be made using the mass balance approach.
The amount of a particular substance entering or leaving a facility is often mixed within asolution as a formulation component or as a trace element within the raw material. Todetermine the total weight of the substance entering or leaving the process, theconcentration of the substance within the material is required. Using this concentrationdata, Equation 9 can be applied as a practical extension of Equation 8.
Equation 9Ekpy,i = [Qin * Cin - Qpr * Cpr - Qrec * Crec – Qwaste * Cwaste] / 106
where:
Ekpy,i = emissions of pollutant i, kg/yrQin, Qpr, Qrec, Qwaste = quantity of raw material, product, recycled material or
waste respectively, that is processed annually (generallyexpressed in kg for solids, L for liquids)
Cin, Cpr, Crec, Cwaste = concentration of substance i in the raw material,product, recycled material or waste respectively, that isprocessed annually (generally expressed in mg/kg forsolids, mg/L for liquids)
106 = conversion from milligrams to kilograms.
Example 4 illustrates the application of Equation 9.

Phosphate Manufacturing 18
Example 4 - Using a Mass Balance for Cobalt Emission
A phosphate fertiliser manufacturer uses phosphate rock as a raw material in theproduction of a normal superphosphate fertiliser. The rock contains trace amounts ofcobalt (Co). The facility uses 143 700 tonnes of phosphate rock per year to manufactureapproximately 100000 tonnes of calcium dihydrogen phosphate (Ca(H2PO4)2). Theconcentration of cobalt initially in the phosphate rock is 1.0 mg/kg. The concentration ofcobalt in the calcium dihydrogen phosphate is 0.48 mg/kg. Assuming no cobalt is lost towastewater and there are no recycling activities taking place, annual emissions to air couldbe determined using Equation 9:
Ekpy,Co = [Qin * Cin - Qpr * Cpr - Qrec * Crec – Qwaste * Cwaste ] / 106
= [143 700 000 * 1.0 – 100 000 000 * 0.48 – 0 – 0] / 106
= 96 kilograms of Co emitted per year.
Where a facility uses a listed mineral acid or base, with this acid or base being effectivelyneutralised in use or during wastewater treatment (to a pH of 6 to 8, as required by mostState and Territory effluent standards), no emission quantities should be reported. If theacid or base is itself transformed into another listed substance, however, the quantity ofthis substance coincidentally produced must be determined to assess if a threshold valuehas been reached. For example, sulfuric acid often yields hydrogen sulfide in effluentstreams, which is itself a listed substance and require reporting where annual emissionstotal 10 tonnes or more.
Wastewater treatment may precipitate the reportable chemical in a sludge. Facilities areoften required to obtain data on the concentration of metals or other substances in sludgesas part of their licensing requirement and this data can be used to calculate the emissionsas kilograms of sludge multiplied by the concentrations of the substance in the sludge.Although listed substances in sludges transferred off-site do not require reporting,determining this loss can assist with determining other process losses or may requirereporting if the sludge is disposed of on-site.
For many chemicals used and emitted during chemical processes, some degradation intreatment may occur so that all the chemical is not transferred to the sludge. Facilities canestimate the amount of reportable compounds in the sludge by using measured data, or bysubtracting the amount biodegraded from the total amount removed in treatment. Theamount of removal can be determined from operating data, and the extent ofbiodegradation might be obtained from published studies. If the biodegradability of thechemical cannot be measured or is not known, reporting facilities should assume that allremoval is due to absorption to sludge.

Phosphate Manufacturing 19
3.3 Using Emission Factors
An emission factor is a tool that is used to estimate emissions to the environment. In thisManual, it relates the quantity of substances emitted from a source to some commonactivity associated with those emissions. Emission factors are obtained from US,European, and Australian sources and are usually expressed as the weight of a substanceemitted divided by the unit weight, volume, distance, or duration of the activity emittingthe substance, for example, kilograms of ammonia emitted per tonne of phosphatefertiliser. Emission factors relating to the production of phosphate fertiliser are listed inTable 4 to 7.
Equation 10 is used to estimate a facility’s emissions from application of emission factors.
Equation 10Ekpy,i = [A * OpHrs] * EFi* [1 - (CEi/100)]
where:
Ekpy,i = emission rate of pollutant i, kg/yrA = activity rate, t/hrOpHrs= annual operating hours, hr/yrEFi = uncontrolled emission factor of pollutant i, kg/tCEi = overall control efficiency for pollutant i, %
Emission control technologies, such as electrostatic precipitators, fabric filters orbaghouses, and wet scrubbers, are commonly installed to reduce the concentration ofparticulates in process off-gases before stack emission. Where such emission abatementequipment has been installed, and where emission factors from uncontrolled sources havebeen used in emission estimation, the collection efficiency of the abatement equipmentneeds to be considered.
With regards to emission controls for PM10, in the absence of measured data, or knowledgeof the collection efficiency for a particular piece of equipment, an efficiency of 90% shouldbe used in the emission factor equation to calculate actual mass emissions. This defaultshould only be used if there is no other available control efficiency.
Application of Equation 10 is illustrated by Example 5.
Phosphate Manufacturing 20
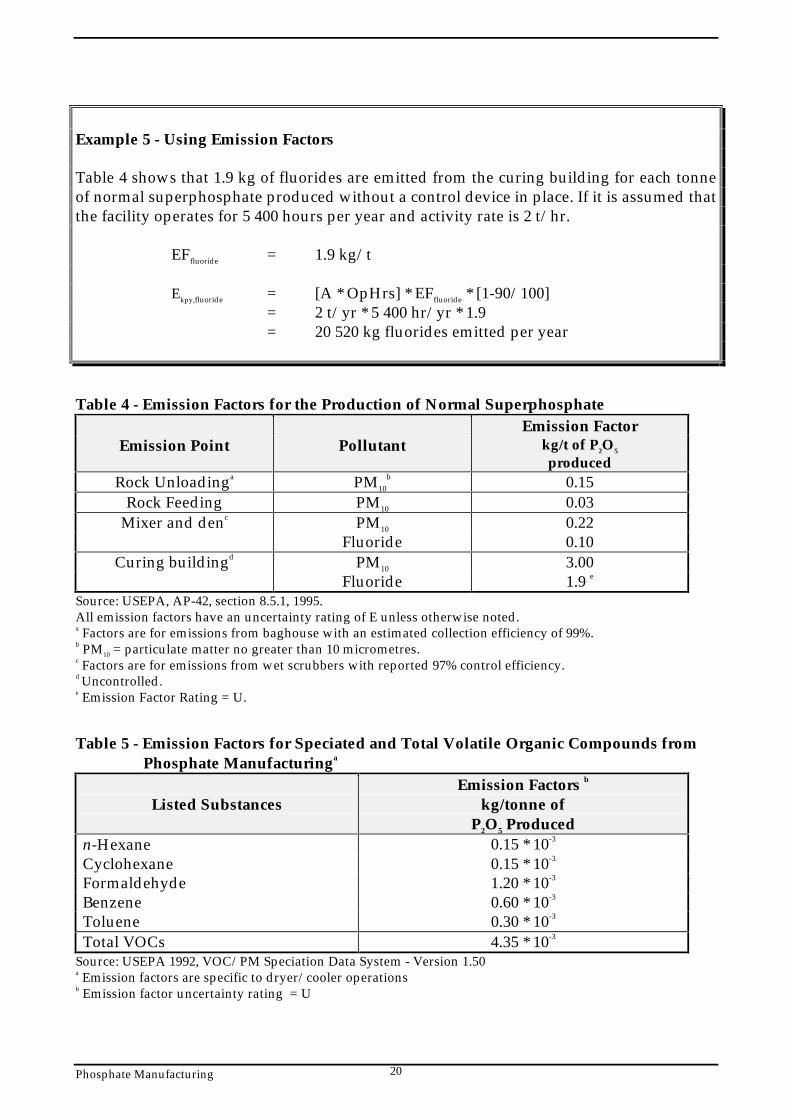
Example 5 - Using Emission Factors
Table 4 shows that 1.9 kg of fluorides are emitted from the curing building for each tonneof normal superphosphate produced without a control device in place. If it is assumed thatthe facility operates for 5 400 hours per year and activity rate is 2 t/hr.
EFfluoride = 1.9 kg/t
Ekpy,fluoride = [A * OpHrs] * EFfluoride * [1-90/100]= 2 t/yr * 5 400 hr/yr * 1.9= 20 520 kg fluorides emitted per year
Table 4 - Emission Factors for the Production of Normal SuperphosphateEmission Factor
Emission Point Pollutant kg/t of P2O5
producedRock Unloadinga PM10
b 0.15Rock Feeding PM10 0.03
Mixer and denc PM10 0.22Fluoride 0.10
Curing buildingd PM10 3.00Fluoride 1.9 e
Source: USEPA, AP-42, section 8.5.1, 1995.All emission factors have an uncertainty rating of E unless otherwise noted.a Factors are for emissions from baghouse with an estimated collection efficiency of 99%.b PM10 = particulate matter no greater than 10 micrometres.c Factors are for emissions from wet scrubbers with reported 97% control efficiency.d Uncontrolled.e Emission Factor Rating = U.
Table 5 - Emission Factors for Speciated and Total Volatile Organic Compounds from Phosphate Manufacturinga
Listed SubstancesEmission Factors b
kg/tonne ofP2O5 Produced
n-Hexane 0.15 * 10-3
Cyclohexane 0.15 * 10-3
Formaldehyde 1.20 * 10-3
Benzene 0.60 * 10-3
Toluene 0.30 * 10-3
Total VOCs 4.35 * 10-3
Source: USEPA 1992, VOC/PM Speciation Data System - Version 1.50a Emission factors are specific to dryer/cooler operationsb Emission factor uncertainty rating = U

Phosphate Manufacturing 21
Table 6 - Controlled Emission Factors for the Production of High Analysis SuperphosphatesGranular Triple Controlled Emission Factor a
SuperphosphateProcess
Pollutant kg/tonne ofProduct
Rock unloading PM10b 0.04
Rock feeding PM10 0.01Reactor, granulator, dryer,cooler and screens
PM10
Fluoride0.040.12
Curing buildingc PM10
Fluoride0.080.02
Source: USEPA, AP-42, Section 8.5.2, 1995.a Controlled emission factor rating = E.s PM10 = Particulate matter with a diameter of less than 10 micrometres.c Factors are for emissions from wet scrubbers with an estimated 97% control efficiency.
Table 7 - Controlled Emission Factors for the Production of Ammonium Phosphatesa
Fluoride PM10
b Ammonia SO2
Emission Point kg/tonneof product
kg/tonneof product
kg/tonneof product
kg/tonneof product
Reactor/ ammoniator-granulator
0.02 0.76 ND c NA d
Dryer/cooler 0.02 0.75 NA NAProduct sizing andmaterial transfere
0.001 0.03 NA NA
Total plant emissions 0.02 a 0.34 a 0.07e 0.04Source: USEPA, AP42, section 8.5.3, 1995.All emission factors have an uncertainty rating of E unless otherwise noteda Emission factor uncertainty rating = A.b PM10 = Particulate matter with a diameter of less than 10 micrometres.c ND = no data.d NA = not applicable.e Represents only 1 sample
Emission factors developed from measurements for a specific process may sometimes beused to estimate emissions at other sites. Should a company have several processes ofsimilar operation and size, and emissions are measured from one process source, anemission factor can be developed and applied to similar sources. You are required to havethe emission factor reviewed and approved by State or Territory environment agenciesprior to its use for NPI estimations.
3.4 Using Engineering and Site-Specific Equations
Theoretical and complex equations or models can be used for estimating emissions fromphosphate fertiliser manufacturing. Inputs for theoretical equations generally fall into thefollowing categories:
• chemical/physical properties of the material involved, such as vapour pressure andvapour molecular weight;
• operating data, such as the amount of material processed and operating hours; and• physical characteristics and properties of the source, such as tank colour and diameter.
Phosphate Manufacturing 22
Use of engineering equations to estimate emissions from phosphate fertilisermanufacturing processes is a more complex and time-consuming process than the use ofemission factors. Engineering equations require more detailed inputs than the use ofemission factors but they do provide an emission estimate that is based on facility-specificconditions.
Engineering equations are suitable for estimating emissions from several chemicalmanufacturing processes. For example, for any process involving a transfer of a chemicalspecies from the liquid phase to the vapour phase, the saturation or equilibrium vapourpressure and exhaust flow rate from the process can be used to establish the upper limit ofemissions from that particular process. This is a conservative approach because of theassumption that the total airflow is saturated. An alternative method based on masstransfer kinetics does not assume airflow saturation and results in a lower emission rateestimate than would be obtained assuming saturation. For details of the use of vapourpressure and mass transfer based equations, refer to the Emission Estimation TechniqueManual for Fugitive Emissions.
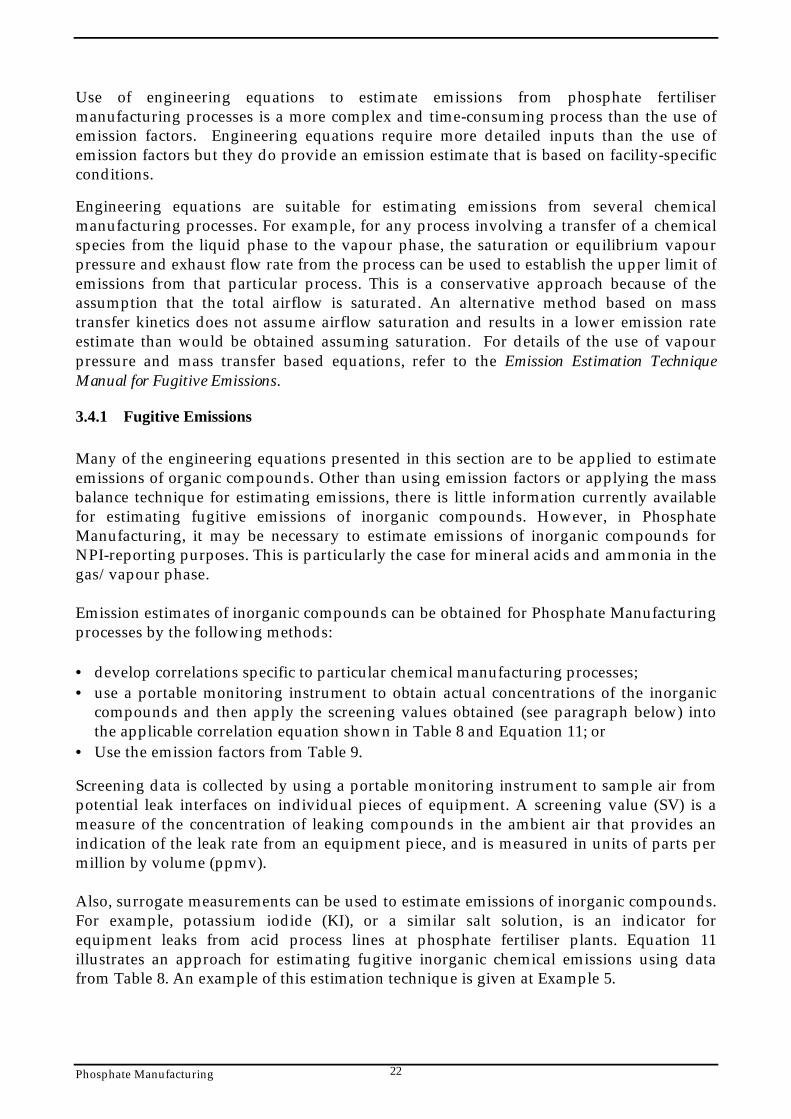
3.4.1 Fugitive Emissions
Many of the engineering equations presented in this section are to be applied to estimateemissions of organic compounds. Other than using emission factors or applying the massbalance technique for estimating emissions, there is little information currently availablefor estimating fugitive emissions of inorganic compounds. However, in PhosphateManufacturing, it may be necessary to estimate emissions of inorganic compounds forNPI-reporting purposes. This is particularly the case for mineral acids and ammonia in thegas/vapour phase.
Emission estimates of inorganic compounds can be obtained for Phosphate Manufacturingprocesses by the following methods:
• develop correlations specific to particular chemical manufacturing processes;• use a portable monitoring instrument to obtain actual concentrations of the inorganic
compounds and then apply the screening values obtained (see paragraph below) intothe applicable correlation equation shown in Table 8 and Equation 11; or
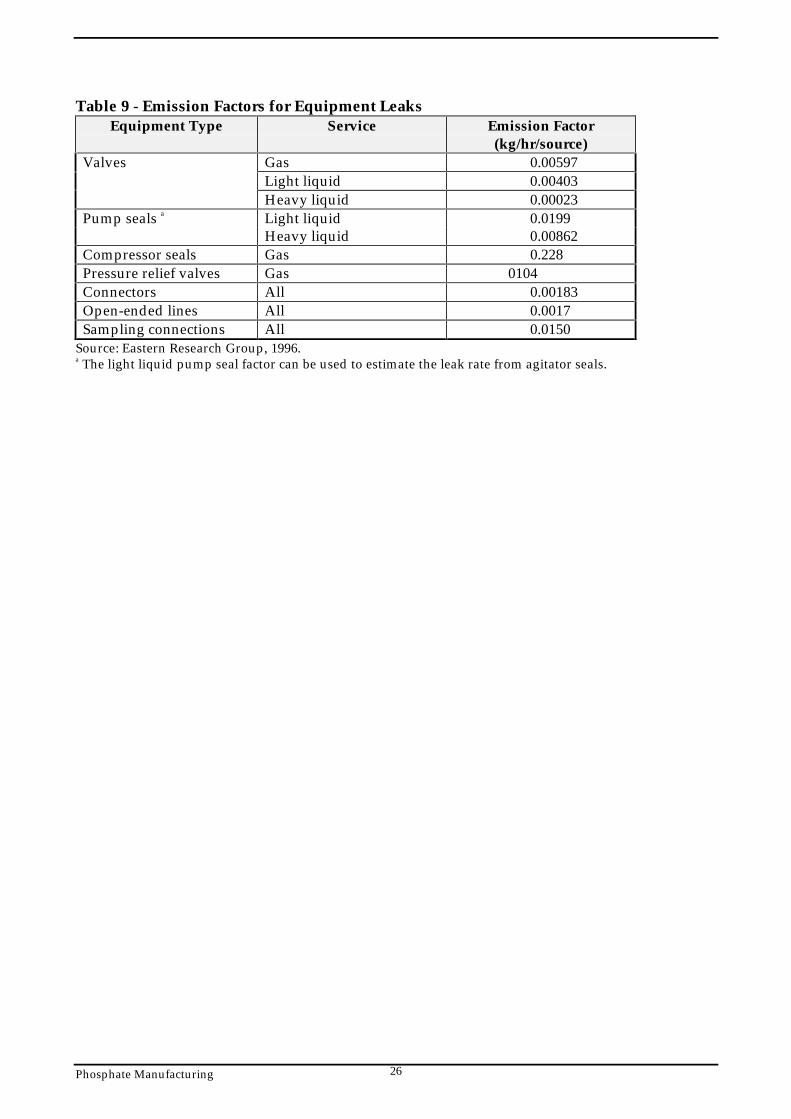
• Use the emission factors from Table 9.
Screening data is collected by using a portable monitoring instrument to sample air frompotential leak interfaces on individual pieces of equipment. A screening value (SV) is ameasure of the concentration of leaking compounds in the ambient air that provides anindication of the leak rate from an equipment piece, and is measured in units of parts permillion by volume (ppmv).
Also, surrogate measurements can be used to estimate emissions of inorganic compounds.For example, potassium iodide (KI), or a similar salt solution, is an indicator forequipment leaks from acid process lines at phosphate fertiliser plants. Equation 11illustrates an approach for estimating fugitive inorganic chemical emissions using datafrom Table 8. An example of this estimation technique is given at Example 5.
Phosphate Manufacturing 23
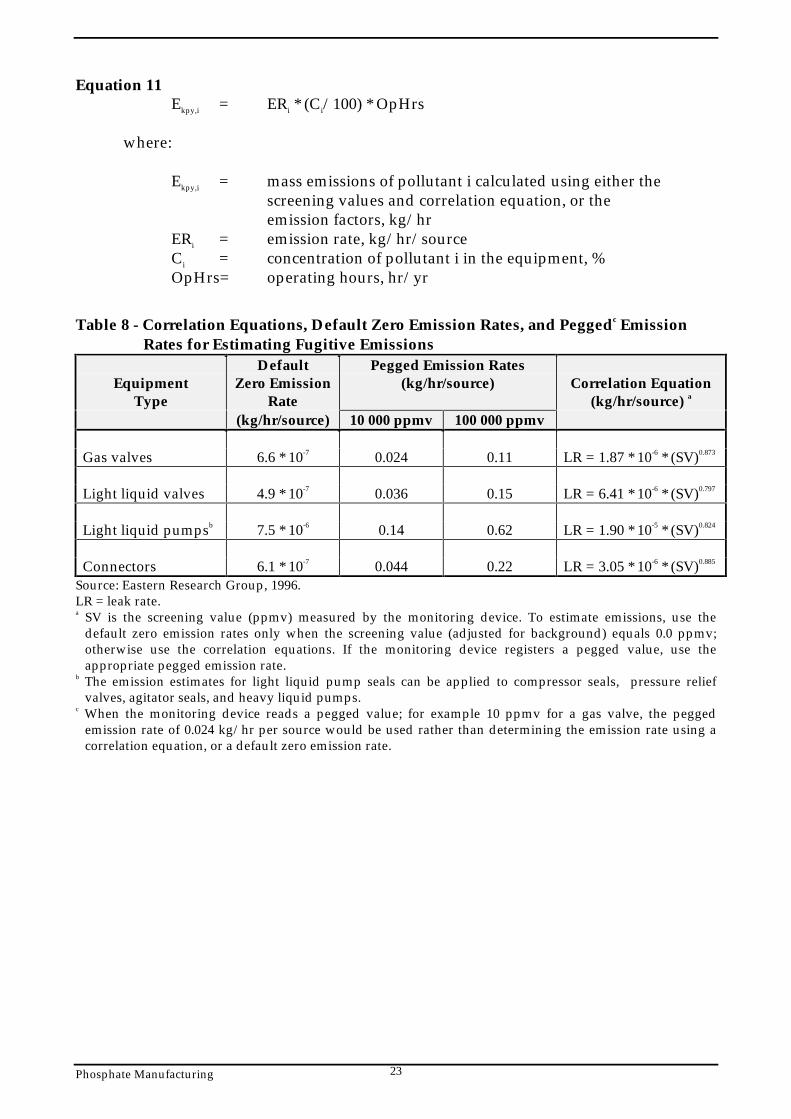
Equation 11Ekpy,i = ERi * (Ci/100) * OpHrs
where:
Ekpy,i = mass emissions of pollutant i calculated using either thescreening values and correlation equation, or theemission factors, kg/hr
ERi = emission rate, kg/hr/sourceCi = concentration of pollutant i in the equipment, %OpHrs= operating hours, hr/yr
Table 8 - Correlation Equations, Default Zero Emission Rates, and Peggedc Emission Rates for Estimating Fugitive Emissions
EquipmentType
DefaultZero Emission
Rate
Pegged Emission Rates(kg/hr/source) Correlation Equation
(kg/hr/source) a
(kg/hr/source) 10 000 ppmv 100 000 ppmv
Gas valves 6.6 * 10-7 0.024 0.11 LR = 1.87 * 10-6 * (SV)0.873
Light liquid valves 4.9 * 10-7 0.036 0.15 LR = 6.41 * 10-6 * (SV)0.797
Light liquid pumpsb 7.5 * 10-6 0.14 0.62 LR = 1.90 * 10-5 * (SV)0.824
Connectors 6.1 * 10-7 0.044 0.22 LR = 3.05 * 10-6 * (SV)0.885
Source: Eastern Research Group, 1996.LR = leak rate.a SV is the screening value (ppmv) measured by the monitoring device. To estimate emissions, use the
default zero emission rates only when the screening value (adjusted for background) equals 0.0 ppmv;otherwise use the correlation equations. If the monitoring device registers a pegged value, use theappropriate pegged emission rate.
b The emission estimates for light liquid pump seals can be applied to compressor seals, pressure reliefvalves, agitator seals, and heavy liquid pumps.
c When the monitoring device reads a pegged value; for example 10 ppmv for a gas valve, the peggedemission rate of 0.024 kg/hr per source would be used rather than determining the emission rate using acorrelation equation, or a default zero emission rate.

Phosphate Manufacturing 24
Example 6 - Calculating Fugitive Chemical Leaks
A phosphate fertiliser plant operates a light-liquid pump on an 80 percent ammoniasolution storage tank. The pump is run for 8 760 hours during the year.
For a Screening Value of zero ppmv
OpHrs = 8 760 hr/yrSV (screening value) = 0 ppmvDefault-zero emission rate = 7.5 * 10-6 kg/hr/source
NH3 emissions = ERx * Cx * OpHrs= 7.5 * 10-6 * (80/100) * 8 760= 5.26 * 10-2 kg/hr
For a Screening Value of 20 ppmv
OpHrs = 8 760 hr/yrSV (screening value) = 20 ppmv
NH3 emissions = 1.90 * 10-5 (SV)0.824
Hourly emissions = 1.90 * 10-5 (20)0.824
= 2.24 * 10-4 kg/hr
NH3 emissions = 2.24 * 10-4 * 8 760 * (80/100)Annual emissions = 1.68 kg NH3/yr
The average emission factor approach is commonly used to calculate emissions when site-specific screening data is unavailable. To estimate emissions using the emission factors inTable 9, the concentration in weight percent of the pollutant of interest within theequipment is needed. This is important because equipment with higher pollutantconcentrations tend to have higher emission leak rates. The equipment should be groupedinto streams, such that all equipment within a stream has approximately the same pollutantweight percent.
This approach for estimating emissions allows use of average emission factors incombination with unit-specific data that is relatively simple to obtain. This data includes:
• the number of each type of component in a unit (valve, connector, etc.);• the service each component is in (gas, light liquid, or heavy liquid);• the pollutant concentration of the stream; and• the time period each component was in that service during the NPI reporting year.
Equation 12 can be used to estimate emissions from all of the equipment of a givenequipment type in a stream using the emission factors from Table 9.
Phosphate Manufacturing 25
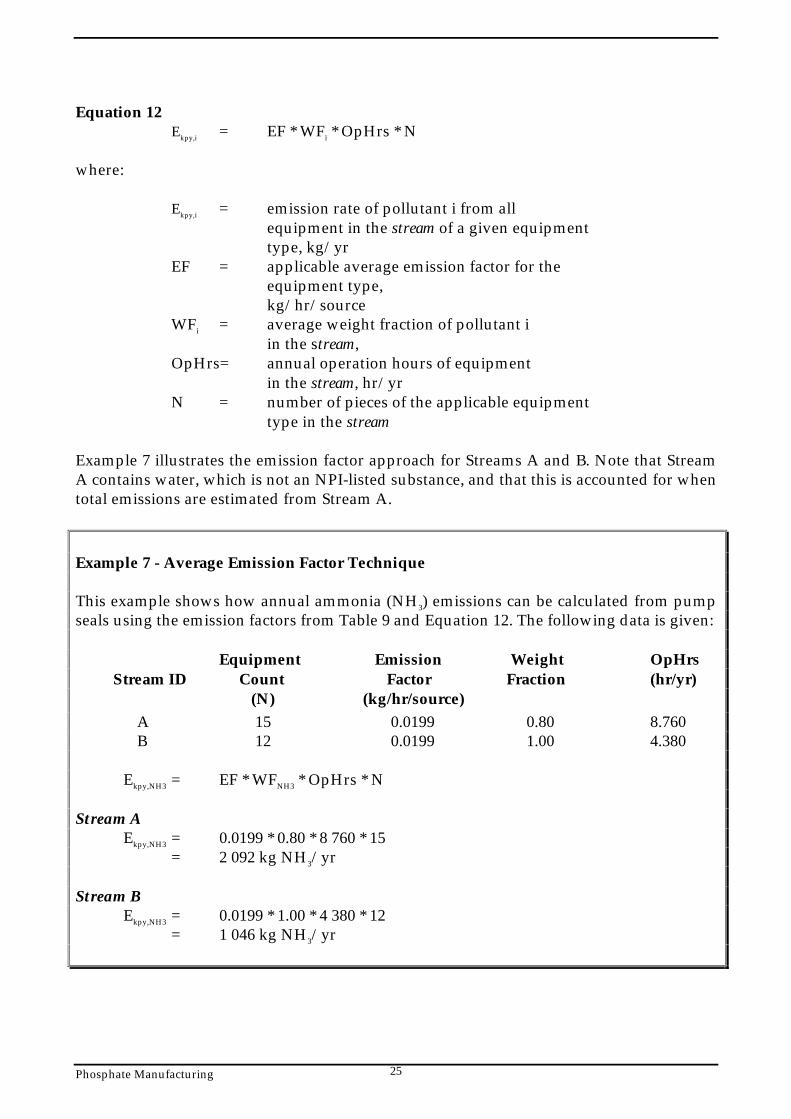
Equation 12Ekpy,i = EF * WFi * OpHrs * N
where:
Ekpy,i = emission rate of pollutant i from allequipment in the stream of a given equipmenttype, kg/yr
EF = applicable average emission factor for theequipment type,kg/hr/source
WFi = average weight fraction of pollutant iin the stream,
OpHrs= annual operation hours of equipmentin the stream, hr/yr
N = number of pieces of the applicable equipmenttype in the stream
Example 7 illustrates the emission factor approach for Streams A and B. Note that StreamA contains water, which is not an NPI-listed substance, and that this is accounted for whentotal emissions are estimated from Stream A.
Example 7 - Average Emission Factor Technique
This example shows how annual ammonia (NH3) emissions can be calculated from pumpseals using the emission factors from Table 9 and Equation 12. The following data is given:
Equipment Emission Weight OpHrsStream ID Count Factor Fraction (hr/yr)
(N) (kg/hr/source) A 15 0.0199 0.80 8.760 B 12 0.0199 1.00 4.380
Ekpy,NH3 = EF * WFNH3 * OpHrs * N
Stream AEkpy,NH3 = 0.0199 * 0.80 * 8 760 * 15
= 2 092 kg NH3/yr
Stream BEkpy,NH3 = 0.0199 * 1.00 * 4 380 * 12
= 1 046 kg NH3/yr
Phosphate Manufacturing 26
Table 9 - Emission Factors for Equipment LeaksEquipment Type Service Emission Factor
(kg/hr/source)Valves Gas 0.00597
Light liquid 0.00403Heavy liquid 0.00023
Pump seals a Light liquid 0.0199Heavy liquid 0.00862
Compressor seals Gas 0.228Pressure relief valves Gas 0104Connectors All 0.00183Open-ended lines All 0.0017Sampling connections All 0.0150
Source: Eastern Research Group, 1996.a The light liquid pump seal factor can be used to estimate the leak rate from agitator seals.

Phosphate Manufacturing 27
4.0 Emission Estimation Techniques: Acceptable Reliability andUncertainty
This section is intended to give a general overview of some of the inaccuracies associatedwith each of the techniques. Although the National Pollutant Inventory does not favourone emission estimation technique over another, this section does attempt to evaluate theavailable emission estimation techniques with regards to accuracy.
Several techniques are available for calculating emissions from Phosphate Manufacturingfacilities. The technique chosen is dependent on available data, available resources, andthe degree of accuracy sought by the facility in undertaking the estimate. In general, site-specific data that is representative of normal operations is more accurate than industry-averaged data, such as the emission factors presented in Section 3.0 of this Manual.
4.1 Direct Measurement
Use of stack and/or workplace health and safety sampling data is likely to be a relativelyaccurate method of estimating air emissions from Phosphate Manufacturing facilities.However, collection and analysis of samples from facilities can be very expensive andespecially complicated where a variety of NPI-listed substances are emitted and wheremost of these emissions are fugitive in nature. Sampling data from one specific processmay not be representative of the entire manufacturing operation and may provide onlyone example of the facility’s emissions.
To be representative, sampling data used for NPI reporting purposes needs to be collectedover a period of time, and to cover all aspects of production of phosphate fertiliser.
In the case of CEMS, instrument calibration drift can be problematic and uncaptured datacan create long-term incomplete data sets. However, it may be misleading to assert that asnapshot (stack sampling) can better predict long-term emission characteristics. It is theresponsibility of the facility operator to properly calibrate and maintain monitoringequipment and the corresponding emissions data.
4.2 Mass Balance
Calculating emissions from a Phosphate Manufacturing facility using mass balanceappears to be a straightforward approach to emissions estimations. However, it is likelythat few Australian industries consistently track material usage and waste generation withthe overall accuracy needed for application of this method. Inaccuracies associated withindividual material tracking or other activities inherent in each material handling stagecan often result in large deviations of total facility emissions. Because emissions fromspecific materials are typically below 2 percent of gross consumption, an error of only ± 5percent in any one step of the operation can significantly skew emission estimations.
4.3 Engineering Calculations
Theoretical and complex equations or models can be used for estimating emissions fromphosphate manufacturing processes.
Phosphate Manufacturing 28
Use of emission equations to estimate emissions from Phosphate Manufacturing facilitiesis a more complex and time-consuming process than the use of emission factors. Emissionequations require more detailed inputs than the use of emission factors but they doprovide an emission estimate that is based on facility-specific conditions.
4.4 Emission Factors
Every emission factor has an associated emission factor rating (EFR) code. This ratingsystem is common to EETs for all industries and sectors and therefore, to all IndustryHandbooks. They are based on rating systems developed by the United StatesEnvironmental Protection Agency (USEPA), and by the European Environment Agency(EEA). Consequently, the ratings may not be directly relevant to Australian industry.Sources for all emission factors cited can be found in Section 5.0 of this Manual. Theemission factor ratings will not form part of the public NPI database.
When using emission factors, you should be aware of the associated EFR code and whatthat rating implies. An A or B rating indicates a greater degree of certainty than a D or Erating. The less certainty, the more likely that a given emission factor for a specific sourceor category is not representative of the source type. These ratings notwithstanding, themain criterion affecting the uncertainty of an emission factor remains the degree ofsimilarity between the equipment/process selected in applying the factor, and the targetequipment/process from which the factor was derived.
The EFR system is as follows:
A - ExcellentB - Above AverageC - AverageD - Below AverageE - PoorU - Unrated

Phosphate Manufacturing 29
5.0 References
ACTED Consultants, 1997, Phosphate Fertiliser, Phosphoric Acid, and Calcium Phosphate, URL:http://jimi.vianet.net.au/~acted/ammonia.html.
National Pollutant Inventory Homepagehttp://www.environment.gov.au/epg/npi/home.html
USEPA, October 1992, VOC / PM Speciation Data System - Version 1.50, United StatesEnvironmental Protection Agency, Office of Air Quality, Planning and Standards,Research Triangle Park, NC, USA.
USEPA, January 1995, Compilation of Air Pollutant Emission Factors, Volume 1: StationaryPoint and Area Sources, fifth edition, AP-42. Section 8.5.1 Normal Superphosphate, United StatesEnvironmental Protection Agency, Office of Air Quality Planning and Standards, ResearchTriangle Park, NC, USA.http://www.epa.gov/ttn/chief/ap42.html
USEPA, January 1995, Compilation of Air Pollutant Emission Factors, Volume 1: StationaryPoint and Area Sources, fifth edition, AP-42. Section 8.5.2 Triple Superphosphate, United StatesEnvironmental Protection Agency, Office of Air Quality Planning and Standards, ResearchTriangle Park, NC, USA.
USEPA, January 1995, Compilation of Air Pollutant Emission Factors, Volume 1: StationaryPoint and Area Sources, fifth edition, AP-42. Section 8.5.3 Ammonium Phosphate, United StatesEnvironmental Protection Agency, Office of Air Quality Planning and Standards, ResearchTriangle Park, NC, USA.
The following Emission Estimation Technique Manuals are available at the NPIHomepage and from your local environmental protection agency (see the front of the NPIGuide for details):
• Emission Estimation Technique Manual for Synthetic Ammonia Manufacturing;• Emission Estimation Technique Manual for Urea Manufacturing;• Emission Estimation Technique Manual for Ammonium Sulfate Manufacturing; and• Emission Estimation Technique Manual for Sewage and Wastewater Treatment.


