29
Emission of pollutants into the atmosphere Katarina Mareckova, EMEP Centre on Emission Inventories and Projections 4 July 2012, Geneva TF on Indicators
| Date post: | 18-Dec-2015 |
| Category: |
Documents |
| Upload: | lynn-bennett |
| View: | 217 times |
| Download: | 0 times |

Emission of pollutants into the atmosphere
Katarina Mareckova, EMEP Centre on Emission Inventories and
Projections
4 July 2012, Geneva
TF on Indicators
Content
IntroductionEstimation and reporting of emissions
What is NIS and why we need itStatus of reporting under CLRTAP in EECCA and WB
Indicators

Emission sources Releases to air occurring
by anthropogenic activities (combustions of fuels, agriculture activities, mining, industrial processes, leakages from equipment's, pipelines…)
Natural emissions (volcano eruptions, forest fires, releases from soil, vegetation,..
Type of source
Point sources
Area sources Linear sources (diffuse emissions)

A. Direct measurements of emissions e.g. in chimney measurements
B. Estimation by calculation Emission factor (mass pollutant per unit activity) Activity data
C. Inverse modeling (e.g. based on air quality measurements)
Emission estimation

Quality parametersof emission inventory
T TCCCA
Timeliness
Transparency
Consistency
Comparability
Completeness and
Accuracy
Review process of emissions inventories is established under all Conventions and Protocols Automated tests on imported
data: format, timeliness, trends…
Semi-automated tests on completeness, consistency ,IEF, recalculations,…
In-depth review of methods, EF and AD, documentation…
Quality control

What is National Inventory System (NIS) A national inventory system
incorporates all the elements necessary to estimate, report and archive emissions and sinks,
i.e.Legal
arrangements
Institutional
arrangements
Procedural
arrangements
High quality inventory that meets needs of policy-makers, researchers and public

Legal arrangements (Act , decree,…)
Ensures resources
Ensures access to inventory data for
inventory compilers
Establish system for collecting the
data
Define responsibilities (legal entity)

Institutional and procedural arrangements
Team coordinat
or
Sectoral experts
Cooperating institutions
Strategy /
workplan in
place
QA/QC plan
developed
Reporting system in place
Data providers (StatOff,
Industries, …
Documentation and
Archiving system in
place
Leading institution
QA/QC manager
DB manager
ConsultantsResearch inst.
Universities
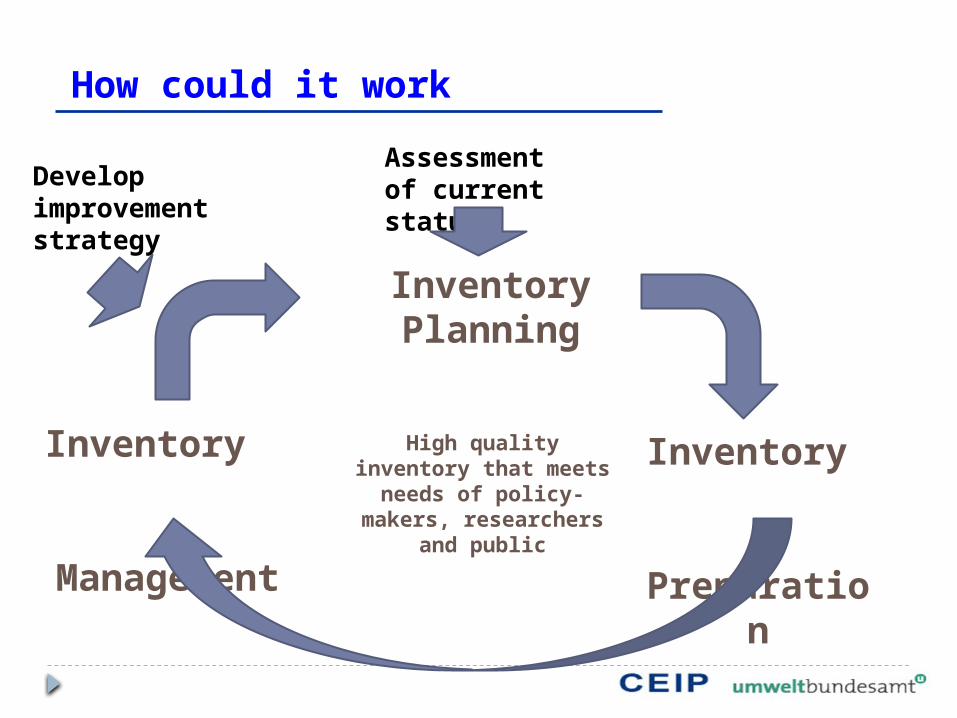
How could it work
High quality inventory that meets needs of policy-makers,
researchers and public
Inventory Planning
Inventory
Management
Inventory Preparation
Assessment of current statusDevelop
improvement strategy

Existing reporting obligation
LRTAP Convention (21 pollutants: acidifying, ozone precursors, PM, HMs, POPs); 51 Parties 8 protocols
UNFCCC (GHGs: CO2, N2O, CH4, F-gases) 123 Parties Kyoto protocol
Montreal protocol – Ozone depleting pollutants Aarhus Convention -
E-PRTR protocol – industrial point sources – 91 pollutants …….
EIONET framework (EEA) – annual priority data flows

Overview of reporting under CLRTAP in 2010; EECCA and WB countries
PARTY Submission Date EMEP
Resubmission Date
IIR 2010
SO2 NOx CO NH3 NMVOC
Cd,Hg, PbPM2.5, PM10
TSPPOPs (PAH DIOX HCB)
Activity Data
Albania 12.04.2012 31.05.2012 1990 - 2009 1990 - 2009 1990 - 2009 2008, 2009 1990 - 2009
Armenia 26.04.20122005, 2006, 2008 - 2010
2005, 2006, 2008 - 2010*
2005, 2006, 2008 - 2010*
AzerbaijanBelarus 15.02.2012 15.03.2012 2010 2010 2010 2010 2010 2010Bosnia & Herzegovina
Croatia 14.02.2012 19.04.2012 1990 - 2010 1990 - 2010 1990 - 2010 1990 - 20101990 - 2010*
1990 - 2010
Georgia 22.02.2012 06.03.20122005 - 2010*
2005 - 2010*
2005 - 2010*
Kazakhstan
Kyrgyzstan
Montenegro 10.04.2012 18.06.20121990 - 2010*
1990 - 2010*
1990 - 2010*
2010*1990 - 2010*
Republic of Moldova
FYR of Macedonia 13.02.2012 14.03.2012 2010 1990 - 2010 2010 2010
Russian Federation 30.03.2012 27.04.2012 2010 2010 2010
Serbia 10.02.2012 2000 - 2010 2000 - 2010 2000 - 2010 2000 - 2010 2000 - 2010 2000 - 2010
Ukraine 15.02.2012 2010 2010 2010 2010 2010 2010

MS inventories MS inventories
MS inventories Parties to the CLRTAP
Central DB
UNECE Secretariat
EEA, ETC ACM
RepDab EMEP SB
Data flow
modelers
reviewGrid
ded datain
vento
ries
testing
Eurostat
CRF, NECD
Surrogate data
Status reports
EMEP EBC
ou
ntr
y
rep
ort
s
Notification forms

Resources for emission inventory compilers:

Guidebooks and Tools
EMEP/ EEA Inventory Guidebook 2009http://www.eea.europa.eu/publications/emep-eea-emission-inventory-guidebook-2009
http://www.eea.europa.eu/publications-ru/emep-eea/
EMEP Emission Reporting Guidelines ECE/EB.AIR/97http://www.ceip.at/fileadmin/inhalte/emep/reporting_2009/Rep_Guidelines_ECE_EB_AIR_97_e.pdf
COPERT road transport software
CollectER emission inventory DB
E-PRTR Guidance

Existing Guidebooks and tools UNFCCC reporting guidelines
IPCC Inventory Guidebooks and IPCC Good Practice Guidance http://www.ipcc.ch/ipccreports/methodology-reports.htm
IPCC Softwarehttp://www.ipcc-nggip.iges.or.jp/software/new.html

Existing reporting formats
NFR/CRF sectors, categories
E-PRTR activities
Other Main pollutants(from 1980)
NFR sectors to be reported to LRTAP
NFR Aggregation for Gridding and LPS (GNFR)
NFR Code
anno
tatio
n
Longname Notes: Gg NO2 Gg Gg SO2 Gg Gg Gg Gg Gg Mg Mg Mg
A_PublicPower 1 A 1 a (a) 1 A 1 a Public Electricity and Heat Production 65.3 0.8 65.8 0.1 2.0 3.5 4.2 17.5 3.1 0.3 0.8B_IndustrialComb 1 A 1 b (a) 1 A 1 b Petroleum refining 14.8 0.4 29.2 NA 0.6 0.9 1.3 6.3 0.4 0.1 0.1B_IndustrialComb 1 A 1 c (a) 1 A 1 c Manufacture of Solid Fuels and Other Energy Industries 3.1 3.3 2.9 NA 0.7 0.9 1.2 12.8 0.0 0.0 0.0
B_IndustrialComb 1 A 2 a (a)1 A 2 a Stationary Combustion in Manufacturing Industries and Construction: Iron and Steel
13.6 1.4 17.7 NA 2.5 3.0 3.2 508.5 33.9 0.7 0.3
B_IndustrialComb 1 A 2 b (a)1 A 2 b Stationary Combustion in Manufacturing Industries and Construction: Non-ferrous Metals
1.6 0.1 0.3 NA 0.0 0.1 0.1 0.7 0.8 0.2 0.0
B_IndustrialComb 1 A 2 c (a)1 A 2 c Stationary Combustion in Manufacturing Industries and Construction: Chemicals
29.1 0.7 20.7 NA 1.0 1.9 2.3 7.2 0.1 0.0 0.2
B_IndustrialComb 1 A 2 d (a)1 A 2 d Stationary Combustion in Manufacturing Industries and Construction: Pulp, Paper and Print
12.6 0.4 1.8 NA 2.7 3.5 4.6 10.3 3.1 0.0 0.0
B_IndustrialComb 1 A 2 e (a)1 A 2 e Stationary Combustion in Manufacturing Industries and Construction: Food Processing, Beverages and Tobacco
14.4 0.5 5.1 NA 1.2 1.5 2.0 7.2 1.3 0.0 0.1
B_IndustrialComb 1 A 2 f i1 A 2 f i Stationary Combustion in Manufacturing Industries and Construction: Other
49.1 4.4 30.2 0.9 4.0 5.2 6.4 55.8 7.9 0.6 0.6
I_OffRoadMob 1 A 2 f ii1 A 2 f ii Mobile Combustion in Manufacturing Industries and Construction
22.6 4.4 1.7 NA 2.1 2.3 3.1 13.9 NA NA NA
J_AviLTO 1 A 3 a ii (i) 1 A 3 a ii (i) Civil Aviation (Domestic, LTO) 3.0 0.6 0.3 NA 0.2 0.2 0.3 3.4 6.0 NA NAJ_AviLTO 1 A 3 a i (i) 1 A 3 a i (i) International Aviation (LTO) 7.3 0.8 0.6 NA 0.2 0.3 0.5 4.7 NA NA NAG_RoadRail 1 A 3 b i 1 A 3 b i Road Transport:, Passenger cars 244.5 47.0 0.5 6.4 14.7 16.0 16.0 439.6 1.3 0.3 NAG_RoadRail 1 A 3 b ii 1 A 3 b ii Road Transport:, Light duty vehicles 97.5 12.2 0.2 0.4 7.5 8.2 8.2 97.4 0.3 0.1 NAG_RoadRail 1 A 3 b iii 1 A 3 b iii Road Transport:, Heavy duty vehicles 248.2 8.5 0.2 0.1 4.0 4.4 4.4 45.6 0.3 0.0 NAG_RoadRail 1 A 3 b iv 1 A 3 b iv Road Transport:, Mopeds & Motorcycles 3.7 27.5 0.0 0.0 0.4 0.5 0.5 114.1 0.1 0.0 NAG_RoadRail 1 A 3 b v 1 A 3 b v Road Transport:, Gasoline evaporation NA 15.8 NA NA NA NA NA NA NA NA NA
Cd
Hg
FR: 09.02.2012:
2010
PM
10
Particulate Matter(from 2000)
TS
P
Main Pollutants(from 1980)
SO
x
Priority Heavy Metals(from 1990)
NO
x
CO
NM
VO
C
PM
2.5
NH
3
Pb

IMPORTANT NOTE
Do not start to develop new emissions/ emission inventory system before assessing previous relevant activities in your country
Establish cooperation , use existing experience of inventory experts in your country,
Support your national inventory experts by providing activity data in required formats and on time

Use of the indicator

Emission trends
Trends in air quality
Implementation of abatement measures
Economical development
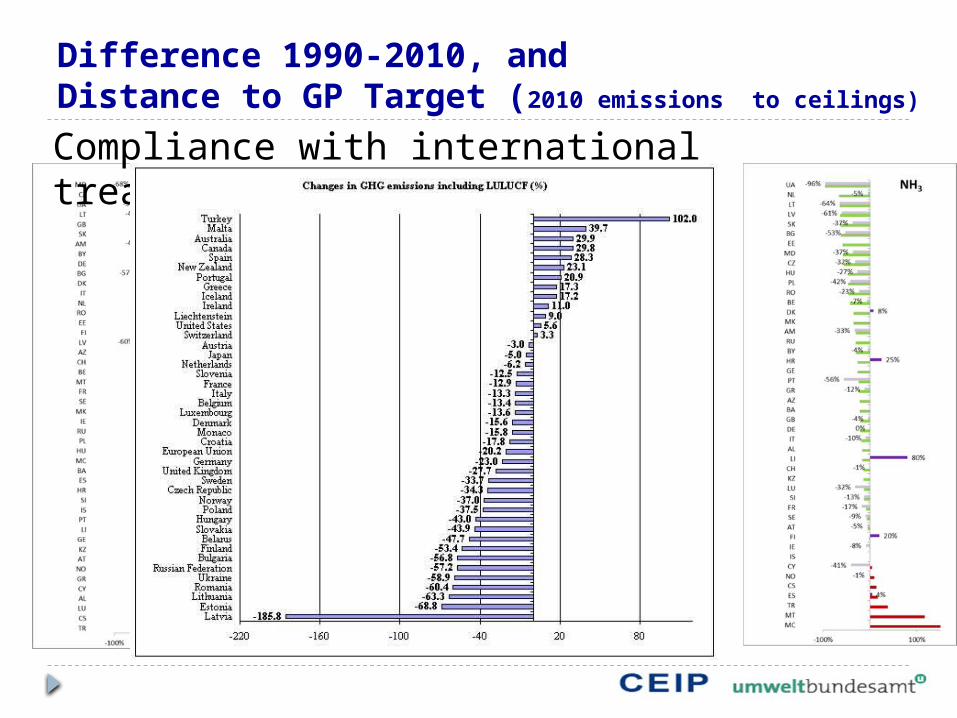
Difference 1990-2010, and Distance to GP Target (2010 emissions to ceilings)
Compliance with international treaties

Identification of main sectors to total emissions
S1- Combustion in energy and transformation industries,
S2-Non-industrial combustion plants,
S3-Combustion in manufacturing industry,
S4-Production processes, S5-Extraction and
distribution of fossil fuels and geothermal energy
S6-Solvent use and other product use,
S7-Road transport S8-Other mobile sources and
machinery, S9-Waste treatment and
disposal S10-Agriculture

Key categories
• 1A1a Public Electricity and Heat Production”, • “1A fi Stationary Combustion in Manufacturing industries and
Construction: Other” • “2C1 Iron and Steel Production”.• 1A2b Stationary Combustion in Manufacturing Industries and
Construction: Non-ferrous Metals• 1A4bi Residential: Stationary plants

Emissions and projections (example)

Emission per GNI, per capita

Spatial distribution of emissions
SOx
NH3
max
min
max
min

Distribution of LPS, 2012
MAIN PM
HMPOPs

Large industrial facilities with releases to air (cca 27 000) E-PRTR 2009

E-PRTR Time series - Air

Discussion items How to ensure /improve communication between data
providers and inventory compilers How to improve quality of reported emissions
Where are the problems ? AD : accessibility, availability, completeness,
confidentiality, ….. EFs : applicability, uncertainty,…. Tools: guidance, software, literature, database,.. Legal barriers,… awareness of decision maker, data providers…
What can we do?


![Transport processes Emission – [mass/time] pollutants released into the environment Imission – [mass/volume] amount of pollutants received by a living.](https://static.documents.pub/doc/80x56/56649f4e5503460f94c6f192/transport-processes-emission-masstime-pollutants-released-into-the-environment.jpg)


