79% 21% June 30, 2021 Tokyo Metropolitan Government Bureau of Environment In FY2019, emissions from covered facilities achieved a 27% reduction from the base-year emissions *1 as a result of continuous energy efficiency efforts and increased use of low-carbon electricity or heat (see reference), therefore achieving approximately 21.9 million tonnes in reduced emissions over the five years of the second compliance period. The Tokyo Metropolitan Government (TMG) will continue to encourage CO2 reductions in the third compliance period (FY2020 to FY2024) to enable all covered facilities to meet their obligations. *1 Base-year emission is the average emissions of three consecutive fiscal years selected by facilities between FY2002-FY2007. (Aggregated value resulting from emission factors for electricity, etc. in the second compliance period) (Contact Information) Emission Cap and Trade Section, Climate Change & Energy Division, Bureau of Environment Tel: +81 3 5388 3485 E-mail: [email protected][Results of Tokyo Cap-and-Trade Program in the Second Compliance Period] Emission Reduction of Approximately 21.9 Million Tonnes over 5 Years - Achieved by Continued Reduction Measures throughout the Period - Million t-CO2 Second Compliance Period (17% or 15%) First Compliance Period (Compliance Factor: 8% or 6%) 27% 13% 22% 22% 23% 25% 26% 26% 27% 27% Base-year Emission Base-year 2010 2011 2012 2013 2014 2015 2016 2017 2018 2019 16.5 12.25 12.13 12.03 12.11 12.06 *2 Facilities likely to meet obligations through their own measures ・ Approximately 80% of covered facilities achieved reductions over their compliance factors for the second compliance period. ・ Facilities plan to take further energy-saving measures and expand the use of renewable energy in the future. 〇 About the Tokyo Cap-and-Trade Program In FY2010, TMG started the Tokyo Cap-and-Trade Program for large facilities according to the Tokyo Metropolitan Environmental Security Ordinance. ・ Compliance factors: 8% or 6% in the first compliance period from FY2010 to FY2014 17% or 15% in the second compliance period from FY2015 to FY2019 27% or 25% in the third compliance period from FY2020 to FY2024 ・ Covered facilities: Approximately 1,200 facilities which have an annual energy usage equivalent to 1,500 kL or more of crude oil equivalent. *2 Aggregated value as of May 31, 2021 resulting from emission factors for electricity, etc. in the second compliance period ■ Continued high emission reductions throughout the second compliance period ■ Prospects for compliance with obligations in the second compliance period *3 Facilities unlikely to meet obligations through their own measures *3 The deadline for the fulfillment of obligations in the second compliance period is the end of January 2022. 17 15 13 11 9 7
Transcript
79%
21%
June 30, 2021
Tokyo Metropolitan Government
Bureau of Environment
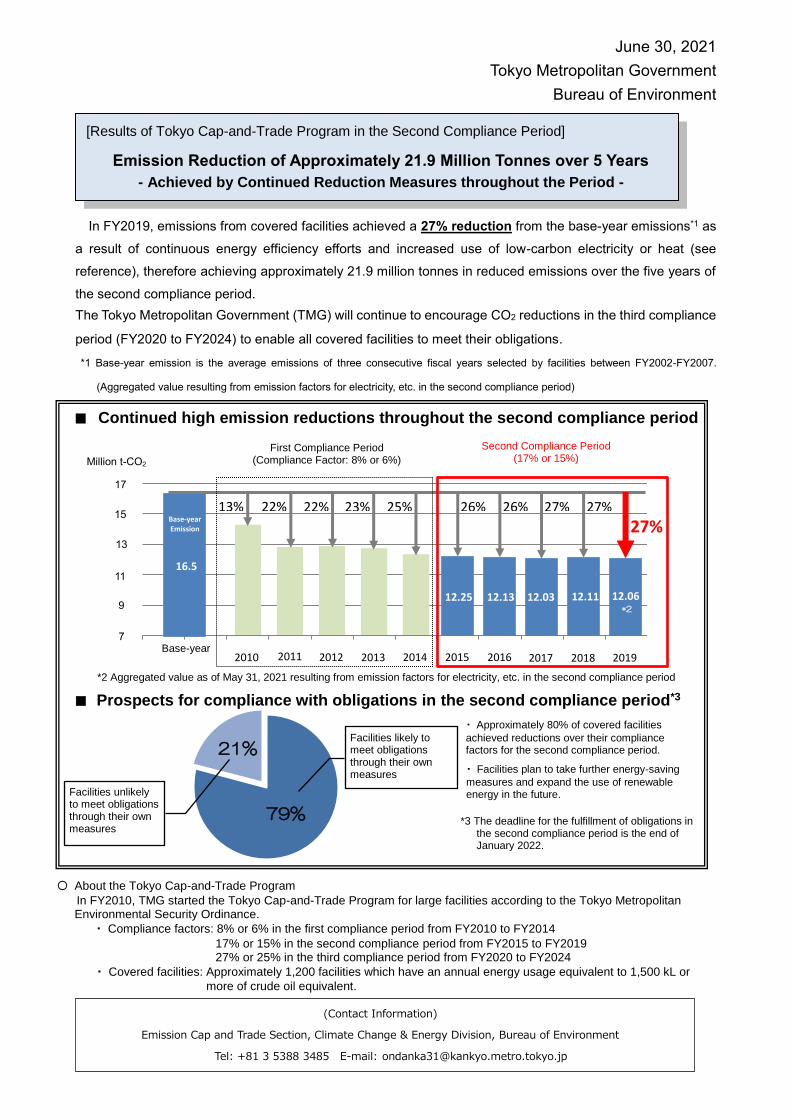
In FY2019, emissions from covered facilities achieved a 27% reduction from the base-year emissions*1 as
a result of continuous energy efficiency efforts and increased use of low-carbon electricity or heat (see
reference), therefore achieving approximately 21.9 million tonnes in reduced emissions over the five years of
the second compliance period.
The Tokyo Metropolitan Government (TMG) will continue to encourage CO2 reductions in the third compliance
period (FY2020 to FY2024) to enable all covered facilities to meet their obligations.
*1 Base-year emission is the average emissions of three consecutive fiscal years selected by facilities between FY2002-FY2007.
(Aggregated value resulting from emission factors for electricity, etc. in the second compliance period)
(Contact Information)
Emission Cap and Trade Section, Climate Change & Energy Division, Bureau of Environment
* Certification requirements of suppliers in the second compliance period
Low-Carbon Electricity: a) 0.4t-CO2 /1,000 kWh or less, and introduction rate of renewable energy of 20% or more
b) 0.4t-CO2 /1,000 kWh or less, and introduction rate of low-carbon thermal power of 40% or more
Low-Carbon Heat : CO2 emission factor of 0.058 t-CO2 / GJ or less
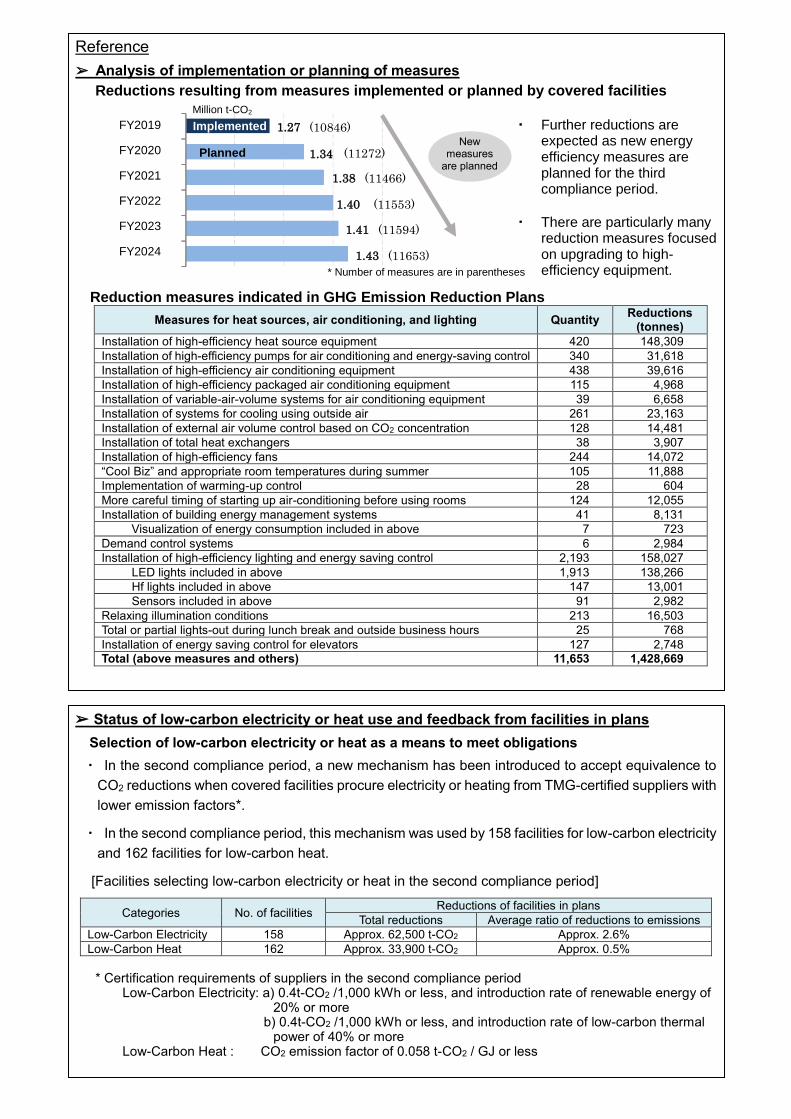
FY2019
FY2020
FY2021
FY2022
FY2023
FY2024
1.27 (10846)
1.34 (11272)
1.38 (11466)
1.40 (11553)
1.41 (11594)
1.43 (11653)
Implemented
Planned
・ Further reductions are expected as new energy efficiency measures are planned for the third compliance period.
・ There are particularly many reduction measures focused on upgrading to high-efficiency equipment.
Million t-CO2
* Number of measures are in parentheses
New measures
are planned
Feedback from facilities in plans (regarding introduction of renewable energy, etc.)
✔ Considering measures for effective use of renewable energy (procurement of electricity sourced from more renewable energy, corporate PPAs, certificate acquisition, etc.) to achieve the 2030 and 2050 targets for GHG emission reduction
✔ Planning to install renewable energy equipment during facility renovations
✔ Anticipating implementation of policies for technological innovations, stable supply of renewable energy (such as enhancement mechanism for selecting low-carbon electricity or heat)
➢ Comparison with national levels
・ Trend of CO2 emissions from facilities under the program* shows that the facilities have achieved
continued significant reductions more than national levels compared to those in energy consumption
in the business sector across Japan and the industrial and commercial sectors of Tokyo.
[Comparison of reductions in CO2, etc. in the business sector across Japan, in the industrial and
commercial sectors of Tokyo, and at facilities covered by Tokyo Cap-and-Trade Program]
* The changes in CO2 emissions from facilities covered by the Tokyo Cap-and-Trade Program almost correspond to those in energy consumption at the facilities as the emissions are calculated by fixing CO2 emission factors.
Data sources: ・ Final energy consumption across Japan announced by the Agency for Natural Resources and Energy: