Research ArticleEmission and Performance Optimization of Marine Four-StrokeDual-Fuel Engine Based on Response Surface Methodology
Huaiyu Wang Huibing Gan Guanjie Wang and Guoqiang Zhong
Marine Engineering College Dalian Maritime University Dalian 116026 China
Correspondence should be addressed to Huibing Gan ghbzqdlmueducn
Received 4 September 2019 Accepted 30 December 2019 Published 24 January 2020
Academic Editor Hua Fan
Copyright copy 2020 HuaiyuWang et al+is is an open access article distributed under the Creative Commons Attribution Licensewhich permits unrestricted use distribution and reproduction in any medium provided the original work is properly cited
As the emissions regulations have become more stringent reducing NOX emissions is of great importance to the shippingindustry Due to the price and emissions advantages of natural gas the diesel-natural gas engines have become an attractivesolution for engine manufacturers Firstly in this paper the NOX emissions prediction model of a large marine four-stroke dual-fuel engine is built by using AVL-BOOST In addition the model is further calibrated to calculate the performance and emissionsof the engine +en the influences of boost pressure compression ratio and the timing of intake valve closing on engineperformance and emissions are analyzed Finally the response surface methodology is used to optimize the emissions andperformance to obtain the optimal setting parameters of the engine +e results indicate that the response surface method is ahighly desirable optimization method which can save a lot of repeated research Compared with the results from manufactureddata the power is increased by 055 and the BSFC the NOX emissions and the peak combustion pressure are decreased by060 1321 and 151 respectively at low load
1 Introduction
In the past few years the increasing emissions of the marineengine including CO2 NOX and SOX account for 2-3 ofglobal emissions In order to reduce the shipbuildingindustryrsquos impact on the environment IMO built a lot oflaws and regulations to protect the environment IMOadvocates EEDI (Energy Efficiency Design Index) and EEOI(Energy Efficiency Operation Index) for improving theenergy efficiency of ships and reducing greenhouse gasemissions from ships In addition DNV GL classificationsociety [1] demonstrates various implementation schemes tomeet Tier III requirements such as the EGR (Exhaust GasRecirculation) [2] SCR (Selective Catalytic Reduction) al-ternative fuels [3] engine inner reconstruction cylinderdirect injection [4] FEW (fuel water emulsion) [5] andHAM (humid air Motor) [6] +e EGR method can reducecylinder combustion temperatures and reduce NOX emis-sions +e SCR method is efficient but it is expensive +eFEW and HAM methods are difficult in business [7] As analternative fuel natural gas has the superiority of emissions
reduction [8] Besides taking the market fluctuations andfuel prices into account natural gas has a more attractiveprice advantage [9] In order to meet the strict schemeinternational engine manufacturers including MAN andWartsila have turned their research focus on reducing gasemissions +e PFI (port fuel injection) method is mainlyused in the four-stroke dual engine such as Wartsila DF(dual-fuel) andMANDiesel amp Turbo DF series engines+isoperation mode approaches to the Otto cycle and feweremissions due to the lower maximum combustion tem-perature +is method is simple and easy to implement andcan be used for the retrofitting of old diesel engines Inanother way both the gas fuel injection and liquid fuelinjection are directly injected into a cylinder with differentinjection timing which is similar to the diesel cycle In theearly research there were many methods to optimize theengine performance such as the fuel injection timing [10]the Miller cycle [11] and RCCI (reactivity controlledcompression ignition) [12] However due to the expensiveexperiment of large marine engines many optimizationsfocused on the cylinder part such as the fuel injection Miller
HindawiMathematical Problems in EngineeringVolume 2020 Article ID 5268314 9 pageshttpsdoiorg10115520205268314
cycle [13] and EGR [14] by CFD (Computational FluidDynamics) tools In the previous research work Mavrelosand +eotokatos [15] built a large marine two-stroke dual-fuel engine model to optimize the engine performance viaparametric runs Stoumpos et al [16] optimized a four-stroke dual fuel engine through a similar method It is not abetter optimization method because it does not have thecombined effect of the parameters +e RSM (ResponseSurface Methodology) method is a collection of mathe-matical and statistical methods which can be used to modeland analyze problems to optimize the response affected bymultiple factors [17ndash19] In this paper the model of a marinedual-fuel engine is built to calculate and predict the per-formance and emissions +e model combines the two-zonemodel and predict model and has the ability to calculate andpredict emissions According to references [13ndash16] the ef-fects of three parameters of boost pressure compressionratio and intake valve closing on performance and emis-sions are considered +e RSM method is used to optimizethe influence factors to the emissions and performance
2 Dual-Fuel Engine Modelling and Calibration
21 Dual-Fuel Engine In this paper the type of theresearched engine is MAN 5160 DF dual-fuel engine +estructure and principle of dual-fuel engine are similar to thediesel engines while fuel type is the variable and the controlsystem is complicated In the gas mode diesel is used as thepilot fuel to ignite the natural gas and the gas mode can besmoothly switched to the diesel mode When running in thegas mode the engine can fulfil the strict IMO Tier III NOXlimitations prescribed for Emissions Control Zones [20]+emain parameters of the engine are reported in Table 1
22 Modelling and Calibration In this paper the AVL-BOOST software [21] is used to build the model and in-vestigate the performance and emissions of the dual-fuelengine All measurements of this engine are from the officialworkshop test report certified by CCS (China ClassificationSociety) and LR (Lloydrsquos Register of Shipping) +e per-formance and emissions experimental data and the MAP ofthe turbocharger required for building and calibrating areacquired from the test report and the project guide [20] +esteps to build the model are as follows Initially the modulesare selected from the model tree and arranged in a regularlocation +en the pipe is used to connect the modulesNext the required data are needed to input into the modelsFor example the general engine structural data the intakeand exhaust valve lift curve the parameter of the heattransfer model and the heat release model are required inthe cylinder module In order to simplify the modellingprocess in the first calibration only the intake manifold andthe exhaust manifold are required to the bounder conditionIn addition a turbocharger and an intercooler are added forthe second calibration Finally the parameters of the modelare fine-tuned to obtain higher accuracy Figure 1 displaysthe engine model in AVL-BOOST environment
For the cylinder part the Vibe heat release model is usedto calculate the heat release rate +e Vibe heat release law issimple and practical and has a wide range of applications[21] +e model is described as follows
dx
dα
a
Δαc
middot (m + 1) middot ym
middot eminus amiddoty(m+1)
y α minus α0Δαc
⎧⎪⎪⎪⎪⎪⎨
⎪⎪⎪⎪⎪⎩
(1)
+eWoschni heat transfer model is used to calculate theheat loss from the cylinder wall +e model convertscomplex heat transfer processes into heat transfer coeffi-cients which makes calculations simply and accurate [22]+e model is described as follows
αw C0Dminus 02
p08
Tminus 053
times C1 middot Cm + C2 middotVDT1
P1V1p minus pmot( 11138571113890 1113891
08
(2)
+e calibration results show that the shape parameters ofcombustion heat release are the same in the gas mode thecombustion duration and ignition delay also change and inthe fuel mode and the shape parameters of heat releasechange Due to the small proportion of pilot diesel in the gasmode (only 1 to 3) the Hires et al model is used topredict the heat release [23] +e model is described asfollows
Δαc Δαcref middotn
nref
middotfref
f1113888 1113889
13
middotsref
s1113874 1113875
23
id idref middotn
nref1113888 1113889
13
middotf
frefmiddotsref
s1113888 1113889
23
(3)
+e two-zone combustion model is used to calculate theburned zone (b) and unburned zone (u) temperature [24](see equation (4)) +e data of burned zone temperature isused to calculate the NOX emissions +e extended Zeldo-vich mechanism is used to calculate NOX emissions whichare calibrated for the 100 75 50 and 25 Load +etemperature distribution in the cylinder cannot be calculatedby the two-zone model and the NOX emissions only rep-resent the trends for different simulation [16] However inthis study the parameter adjustments are limited in the sameload so the two-zone model can fulfil the research
Table 1 Specification of dual-fuel engine (100 load)
Engine parameters SpecificationsCylinder number (-) 8Cylinder diameter (mm) 510Stroke (mm) 600Compression ratio (-) 133Power (kW) 8000Speed (rmiddotminminus 1) 514Fire order (-) 1-4-7-6-8-5-2-3
2 Mathematical Problems in Engineering
dmbub
dφ minus p
dVb
dφ+dQF
dφminus 1113944
dQWb
dφ+ hu
dmu
dφ
dmuuu
dφ minus p
dVu
dφminus 1113944
dQWu
dφ+ hu
dmB
dφ
⎧⎪⎪⎪⎪⎪⎪⎨
⎪⎪⎪⎪⎪⎪⎩
(4)
Table 2 shows the errors between calculated and mea-sured under different loads with all of the errors less than 3Figure 2 displays the simulated and measured cylinderpressure According to the results of the errors the accuracyof the simulation model can be demonstrated which canmeet the next research requirements
3 RSM for Optimization
31 Analysis of Influencing Factors of Engine Performance andEmissions +is section focuses on the effects of engineparameters on the performance and emissions As shown inTable 2 NOX emissions of 50 load is higher than otherloads As a generator power engine it is hard to work under25 loads so the 50 load is chosen for optimization +eengine parameters including boost pressure compressionratio and intake valve closing timing changed from minus 10 to+10 of base parameters In order to get the objective re-sults the same intake air temperature is maintained in allsimulations Figure 3 displays the performance and emis-sions based on the originated operation As it shows thePower and BSFC are more affected by compression ratio theNOX emissions is more influenced by the boost pressure andintake valve closing and the peak combustion pressure(Pmax) is more affected by compression ratio and intake valveclosing
32 RSM Model RSM is a collection of mathematical andstatistical methods which is used to modelling predictionand optimization +e general expression of the mathe-matical model is as follows [25]
y β0 + 1113944k
i1βixi + 1113944 1113944
iltjβijxixj + 1113944
k
i1βiix
2i + ε (5)
where y is the response xi are numeric values of the factorsterms β0 βi βii and βij are regression coefficients and the εis error [26] +e quadratic model is used to approximatemost engine systems [18] +e difference between the pre-dicted and actual values is called residuals Figure 4 showsthe predicted and actual values plot for Power BSFC NOXand Pmax +e predicted and the actual data are approxi-mately acceptable and there is no large deviation betweenthem
+e significant test is used to ensure the adaptability andaccuracy of the model +e evaluation parameters are shownas follows
R2
1 minusSSresidual
SSresidual + SSmodel1113890 1113891 (6)
R2 a fully fitted measure that reflects how well the re-sponse surface meets the given data which is required greaterthan 09
Adjusted-R2 representing the degree of correlationbetween all independent variables and dependent variablesthe regression effect is better when close to 1
SB1
SB2
PL1
PL2
TC1
J1 J2
1
2 3
R145
6
7
8 9 10 11 12 13 14 15
J4
J12
J8
J16
J5
J13 J17
J9J7
J15
J3
J11
J10
J18J14
J616 17 18 19 20 21 22 23
C1 C4C2 C6 C7C5 C8C3
24 25 26 27 28 29 30 31 32 33 34 35 36 37 38 39
40 41 42 43 44 45 46 47 48 49 50 51 52 53 54 55
E1
56 57 58 59 60 61 62 63
6465
MP6
MP1
MP4
MP3
MP5
MP8MP14
MP22
MP30
MP16
MP24
MP32
MP23
MP31
MP15
MP20
MP28
MP12
MP18
MP26
MP10
MP27
MP19
MP11
MP33
MP25
MP17
MP29
MP21
MP13
MP2
MP9
CO1
I5I2 I4I3 I6 I7 I8I1
MP7
Figure 1 8L5160DF engine model in the AVL-BOOST environment
Mathematical Problems in Engineering 3
R2Pred 1 minus
PRESSSSresidual + SSmodel
1113890 1113891 (8)
Predicted-R2 a measurement of the amount of variationin new data explained by the model which is usually requiredgreater than 08 and the difference value with Adjusted R2
should be within 020 In the abovementioned equations theSS PRESS and df represent the sum of squares sum of
squares of prediction errors and degree of freedom re-spectively +e ANOVA data of the Power BSFC NOX andPmax are listed in Table 3 It is shown that the R2 Adjusted-R2 and Predicted-R2 of all responses are greater than 085and the difference value of Adjusted-R2 and Predicted -R2
are less than 02 It indicates the response surface modelshave good consistency and predictability for the test results+e p value of the quadratic model is less than 005 which
Range ndash10 +10 Range ndash10 +10 Range ndash10 +10 Range ndash10 +10097
Figure 3 Effects of the boost pressure compression ratio and intake valve closing on power BSFC NOX emissions and peak combustionpressure
Table 2 Calculation error of the gas mode
Engine load () 100 75 50 25Mode Gas mode error ()Power (kW) 012 014 minus 009 038BSFC (gmiddotkminus 1Wminus 1hminus 1) minus 009 minus 011 013 minus 034Peak comb press (bar) minus 181 minus 172 044 051Intake manifold temp (K) minus 099 minus 064 034 minus 200Intake manifold press (bar) minus 004 minus 024 minus 012 minus 011Intake manifold mass flow (kgmiddotsminus 1) minus 012 minus 022 016 067Exhaust manifold temp (K) minus 198 027 010 279Exhaust manifold press (bar) 128 259 223 minus 062Exhaust manifold mass flow (kg sminus 1) minus 016 014 minus 009 038NOX emissions (gmiddotkminus 1Wminus 1hminus 1) 159 minus 243 minus 196 198
300 330 360 390 420 4500
20
40
60
80
100
120
140
160
180
Load 100Load 75
Load 50Load 25
Crank angle degree (deg)
Sim
ulat
ion
pres
sure
(bar
)
0
20
40
60
80
100
120
140
160
180
Expe
rimen
t pre
ssur
e (ba
r)
Figure 2 Comparison of simulation and experiment pressure
4 Mathematical Problems in Engineering
indicates that the model terms are significant +e weightvalue of boost pressure (x) compression ratio (y) and intakevalve closing (z) of all response models correspond to theanalysis results of Figure 3
4 Results and Discussion
41 Evaluation of Power +e developed quadratic model ofPower as fitted based on RSM in terms of the simulatedfactors corresponded to
Power 401194
+ 3047 times x + 9374 times y + 3582 times z
minus 210xy minus 1415 times xz minus 01312 times yz
minus 818x2
minus 1001 times y2
minus 2190 times z2
(9)
where Power is the engine output power (kW) x is the boostpressure (bar) y is the compression ratio (-) and the z is theintake valve closing (degC) +e predicted values of Powercalculated by equation (9) are satisfactorily close to thesimulation values
+e effects of linear factors boost pressure compressionratio and intake valve closing are found to be highly sig-nificant (all p value lt00001) on the Power All of the square
terms are also found to be significant with p value x2 (00071)y2 (00034) and z2 (00002) whichmeans there is a curved linerelationship between the variables and Power x and z are alsofound to have an interaction effect on Power with the p valuexz (lt00001) A negative sign means an antagonistic effectwhile a positive sign of the coefficient represents a synergisticeffect +e regression statistics goodness of fit (R2) thegoodness of adjustment (Adjusted-R2) and the goodness ofprediction (Predicted-R2) for the response of Power are9998 9993 and 9978 respectively All of the threevalues indicate that the model fits the data very well
+e effect of boost pressure compression ratio andintake valve closing on the Power is depicted in Figure 5+ehigher boost pressure and compression ratio and the laterintake valve closing could improve the Power [16] Amongthe abovementioned factors compression ratio has thegreatest influence on the Power +is is because highercompression ratios make the higher temperatures andpressures in the cylinder at the end of compression andincrease the charge energy in the cylinder [27]
42 Evaluation of BSFC +e developed quadratic model ofBSFC as fitted based on RSM in terms of the simulatedfactors corresponded to
3700
3800
3900
4000
4100
4200
3700 3800 3900 4000 4100 4200
Pred
icte
dPower (kW)
Actual
(a)
165
170
175
180
185
165 170 175 180 185
Pred
icte
dActual
BSFC (gkWmiddoth)
(b)
ndash20
0
20
40
60
80
ndash20 0 20 40 60 80
Pred
icte
d
Actual
NOX emissions (gkWmiddoth)
(c)
60
70
80
90
100
110
120
60 70 80 90 100 110 120
Pred
icte
d
Actual
Peak comb press (bar)
(d)
Figure 4 Comparison of predicted and actual parameters
Table 3 ANOVA table for power BSFC NOX and Pmax
Source Power (kW) BSFC (gkWh) NOX (gkWh) Pmax (bar)
TypeQuadratic Quadratic Quadratic Quadratic
p value p value p value p value Model lt00001 lt00001 00018 lt00001x lt00001 1904 lt00001 1943 00006 4356 lt00001 1541y lt00001 5858 lt00001 5861 01995 672 lt00001 4123z lt00001 2239 lt00001 2196 00003 4972 lt00001 4336xy 00779 00211 06097 00004xz lt00001 00001 00012 00002yz 08902 01534 03448 lt00001x2 00071 00099 01262 0217y2 00034 0002 0826 09557z2 00002 00002 00261 00001R2 09998 09997 09877 10000Adj-R2 09993 09992 09599 09999Pred-R2 09978 09972 08755 09995
Mathematical Problems in Engineering 5
BSFC 17216
minus 137 times x minus 413 times y minus 155 times z
+ 01548xy + 06334 times xz + 00739 times yz
+ 03494x2
+ 05402 times y2
+ 09777 times z2
(10)
where BSFC is the brake-specific fuel consumption (gkWh)x is the boost pressure (bar) y is the compression ratio (-)and z is the intake valve closing (degC)+e predicted valuesof BSFC calculated by (10) are satisfactorily close to thesimulation values
+e effects of linear factors boost pressure compressionratio and intake valve closing are found to be highly sig-nificant (all p value lt00001) on the BSFC All of the squareterms are also found to be significant with p value x2(00099) y2 (00020) and z2 (00002) which means there is acurved-line relationship between the variables and BSFC+e xy and xz are also found to have an interaction effect onBSFC with the p value xy (00211) and xz (00001) Anegative sign means an antagonistic effect while a positivesign of the coefficient represents a synergistic effect +eregression statistics goodness of fit (R2) the goodness ofadjustment (Adjusted-R2) and the goodness of prediction(Predicted-R2) for the response of BSFC are 9997 9992and 9972 respectively All of the three values indicate thatthe model fits the data very well +e effect of boost pressurecompression ratio and intake valve closing on the BSFC isdepicted in Figure 6 Similar to the Power the compressionratio has the greatest influence on BSFC [28]
43 Evaluation of NOX +e developed quadratic model ofNOX emissions as fitted based on RSM in terms of thesimulated factors corresponded to
NOX 523
+ 523 times x minus 1559 times y + 241 times z
minus 1780xy minus 09689 times xz + 1429 times yz
minus 187x2
minus 07412 times y2
+ 1089 times z2
(11)
where NOX is the engine NOX emissions (gkWh) x is theboost pressure (bar) y is the compression ratio (-) and the z
is the intake valve closing (degC) +e predicted values ofNOX calculated by (11) are satisfactorily close to the sim-ulation values +e effects of linear factors boost pressureand intake valve closing are found to be highly significant (pvalue 00006 and 00003) on the NOX +e z square termsare also found to be significant with p value z2 (00261)which means there is a curved line relationship between thevariables and NOX x and z are also found to have an in-teraction effect on NOX with the p value xz (00012) Anegative sign means an antagonistic effect while a positivesign of the coefficient represents a synergistic effect +eregression statistics goodness of fit (R2) the goodness ofadjustment (Adjusted-R2) and the goodness of prediction(Predicted-R2) for the response of NOX are 9877 9599and 8755 respectively Compared with other responsethe regression effect of NOX is not good which is also relatedto the limitation of the two-zone model [29] +e effect ofboost pressure compression ratio and intake valve closingon the NOX are depicted in Figure 7
44 Evaluation of Pmax +e developed quadratic model ofPmax as fitted based on RSM in terms of the simulatedfactors corresponded to
Pmax 9101
+ 374 times x + 1000 times y + 1052 times z
+ 06096xy + 07907 times xz + 132 times yz
minus 01503x2
minus 00061 times y2
minus 154 times z2
(12)
where Pmax is the engine peak combustion pressure (bar) xis the boost pressure (bar) y is the compression ratio (-) andthe z is the intake valve closing (degC) +e predicted valuesof Power calculated by (12) are satisfactorily close to thesimulation values
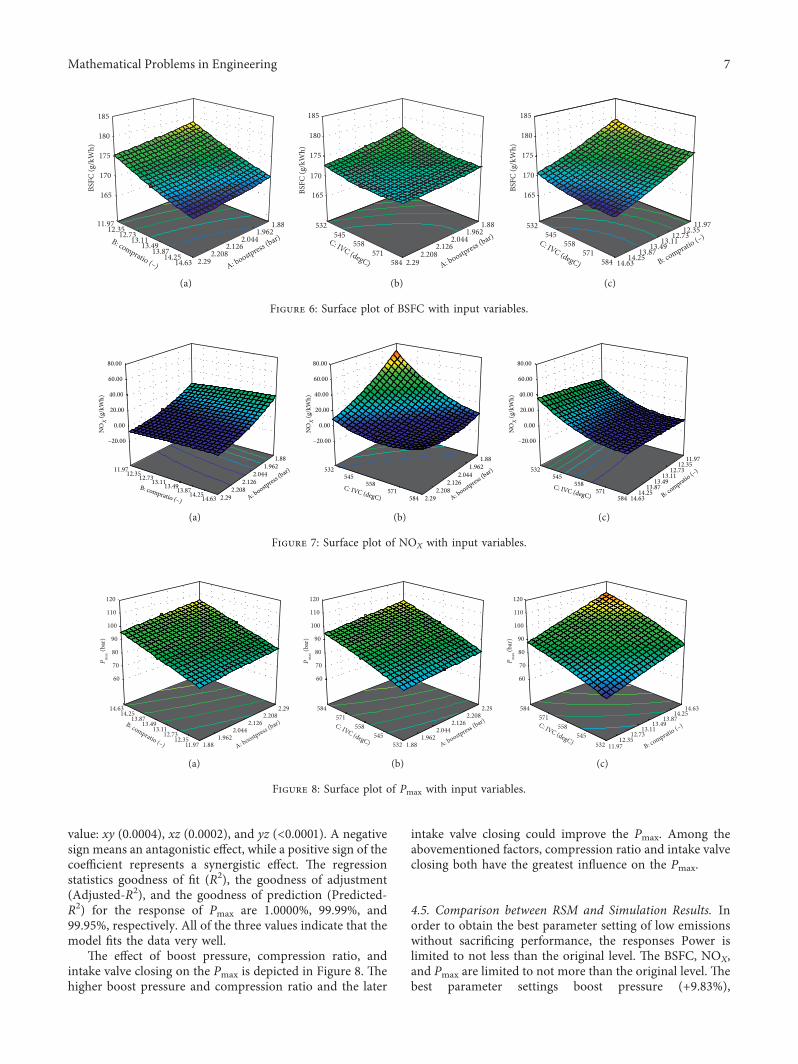
+e effects of linear factors boost pressure and com-pression ratio and intake valve closing are found to be highlysignificant (all p value lt00001) on the Pmax +e z squareterms are also found to be significant with p value z2(00001) which means there is a curved line relationshipbetween the variables and Pmax +e terms xy xz and yz arealso found to have an interaction effect on Pmax with the p
11971235
127313111349
13871425
1463
1881962
20442126
2208229
3700
3800
3900
4000
4100
4200
Pow
er (k
W)
A boostpress (bar)B compratio (ndash)
(a)Po
wer
(kW
)
532545
558571
584
1881962
20442126
2208229
3700
3800
3900
4000
4100
4200
A boostpress (bar)
C IVC (degC)
(b)
Pow
er (k
W)
532545
558571
584
11971235
12731311
13491387
14251463
3700
3800
3900
4000
4100
4200
B compratio (ndash)C IVC (degC)
(c)
Figure 5 Surface plot of power with input variables
6 Mathematical Problems in Engineering
value xy (00004) xz (00002) and yz (lt00001) A negativesign means an antagonistic effect while a positive sign of thecoefficient represents a synergistic effect +e regressionstatistics goodness of fit (R2) the goodness of adjustment(Adjusted-R2) and the goodness of prediction (Predicted-R2) for the response of Pmax are 10000 9999 and9995 respectively All of the three values indicate that themodel fits the data very well
+e effect of boost pressure compression ratio andintake valve closing on the Pmax is depicted in Figure 8 +ehigher boost pressure and compression ratio and the later
intake valve closing could improve the Pmax Among theabovementioned factors compression ratio and intake valveclosing both have the greatest influence on the Pmax
45 Comparison between RSM and Simulation Results Inorder to obtain the best parameter setting of low emissionswithout sacrificing performance the responses Power islimited to not less than the original level +e BSFC NOXand Pmax are limited to not more than the original level +ebest parameter settings boost pressure (+983)
11971235
12731311
13491387
14251463
1881962
20442126
2208229
165
170
175
180
185
BSFC
(gk
Wh)
A boostpress (bar)B compratio (ndash)
(a)
BSFC
(gk
Wh)
532545
558571
584
1881962
20442126
2208229
165
170
175
180
185
A boostpress (bar)C IVC (degC)
(b)
BSFC
(gk
Wh)
532545
558571
584
11971235
12731311
13491387
14251463
165
170
175
180
185
B compratio (ndash)C IVC (degC)
(c)
Figure 6 Surface plot of BSFC with input variables
11971235127313111349138714251463
1881962
20442126
2208229
ndash2000
000
2000
4000
6000
8000
NOX (g
kW
h)
A boostpress (
bar)
B compratio (ndash)
(a)
NOX (g
kW
h)
A boostpress (
bar)532545
558571
584
1881962
20442126
2208229
ndash2000
000
2000
4000
6000
8000
C IVC (degC)
(b)N
OX (g
kW
h)
532545
558571
584
11971235
12731311
13491387
14251463
ndash2000
000
2000
4000
6000
8000
B compratio (ndash)
C IVC (degC)
(c)
Figure 7 Surface plot of NOX with input variables
11971235
12731311
13491387
14251463
1881962
20442126
2208229
60
70
80
90
100
110
120
P max
(bar
)
A boostpress (bar)B compratio (ndash)
(a)
P max
(bar
)
532545
558571
584
1881962
20442126
2208229
60
70
80
90
100
110
120
A boostpress (bar)C IVC (degC)
(b)
P max
(bar
)
B compratio (ndash)C IVC (degC) 532545
558571
584
11971235
12731311
13491387
14251463
60
70
80
90
100
110
120
(c)
Figure 8 Surface plot of Pmax with input variables
Mathematical Problems in Engineering 7
compression ratio (+242) and intake valve closing(minus 604) leading to the Power BSFC NOX and Pmaxchange separately 054minus 059 minus 1718 and minus 155 withthe RSM method Due to the early timing of intake valveclosing and the charge of cylinder expansion and cooling thein-cylinder temperature is lower than the original cycle +eearly intake valve closing timing needs the higher boostpressure so that there is enough air for combustion +ehigher boost pressure causes more air to enter the cylinderwhich makes the fuel burn more thoroughly +e highercompression ratio causes higher in-cylinder temperatureduring the compression phase which makes the combustiontemperature high It has an opposite effect when the intakevalve closing advanced so the optimized result shows thatthe compression ratio increases less Table 4 displays thesame parameter settings on the simulation results +ePower BSFC and Pmax simulated values are in goodagreement with the predicted values Because the two-zonemodel cannot well calculate the temperature distribution inthe cylinder the calculated RSM value is different from thesimulated value when calculating NOX emissions [30] Al-though the model has deviations it does not affect the trendjudgment of the influence of different parameters on NOXRSM optimization results are still convincing which canoptimize different parameters at the same time +e RSMmethod transforms time-consuming model calculation intomathematical calculation which has certain advantages inspeed and accuracy +e model based on the RSM methodcan predict with adequate accuracy the engine performanceand emissions for the gas mode operation which can be usedin the engine design process for optimizing the enginesettings
5 Conclusion
+is study investigated the effects of boost pressure com-pression ratio and intake valve closing on the performanceand emissions characteristics of the marine dual-fuel engine+e research is conducted by using a full-factorial experi-mental design matrix +e response surface method is usedto model predict and optimize the measured responsevariables +e conclusions of the analysis are as follows
(1) +e results of ANOVA indicated that all the modelsfor Power BSFC NOX and Pmax are found to besignificant under 99 confidence level For thepower and BSFC the compression ratio is the majorinfluence (about 5858 and 5861) For the NOXthe boost pressure and intake valve closing are themajor influence (about 4356 and 4972) For thePmax the compression ratio and intake valve closingare the major influence (about 4123 and 4336)
+e results of ANOVA are consistent with the singlechange parameter analysis result
(2) From the response surface plots it can be concludedthat the effects of all factors on the responses are verystraightforward and it is easy to find a single re-sponse optimal value and limit the range of differentresponses and perform multiobjective optimization
(3) +e optimization results are very close to simulationresults which indicate the accuracy of the RSMmodel from another perspective +e Power BSFCNOX and Pmax change by 055 minus 060 minus 1321and minus 15 separately when the parametric settingswith boost pressure compression ratio and intakevalve closing change by +983 +242 andminus 604 separately
Data Availability
+e data used to support the findings of this study areavailable from the corresponding author upon request
Conflicts of Interest
+e authors declare that there are no conflicts of interestregarding the publication of this paper
Acknowledgments
+e research work has been financially supported by thePeoplersquos Republic of China Project ldquoIntelligent Ship Com-prehensive Testing and Verification Researchrdquo ((2018) no473) and ldquothe Fundamental Research Funds for the CentralUniversitiesrdquo (no 3132019315)
[2] B Rajesh kumar and S Saravanan ldquoEffect of exhaust gasrecirculation (EGR) on performance and emissions of aconstant speed DI diesel engine fueled with pentanoldieselblendsrdquo Fuel vol 160 pp 217ndash226 2015
[3] A P Carlucci D Laforgia R Saracino and G TotoldquoCombustion and emissions control in dieselndashmethane dual-fuel engines the effects of methane supply method combinedwith variable in-cylinder charge bulk motionrdquo Energy Con-version and Management vol 52 no 8-9 pp 3004ndash30172011
[4] C D Rakopoulos K A Antonopoulos D C Rakopoulosand D T Hountalas ldquoMulti-zone modeling of combustionand emissions formation in DI diesel engine operating onethanol-diesel fuel blendsrdquo Energy Conversion and Manage-ment vol 49 no 4 pp 625ndash643 2008
[5] G Gonca ldquoInvestigation of the effects of steam injection onperformance and NO emissions of a diesel engine runningwith ethanol-diesel blendrdquo Energy Conversion and Manage-ment vol 77 pp 450ndash457 2014
[6] X Ma F Zhang K Han Z Zhu and Y Liu ldquoEffects of intakemanifold water injection on combustion and emissions of
Table 4 Comparison between RSM and simulation results
Terms power (kW) BSFC(gkWh)NOX(gkWh) Pmax (bar)
RSM +054 minus 059 minus 1718 minus 155Simulation +055 minus 060 minus 1321 minus 151
8 Mathematical Problems in Engineering
diesel enginerdquo Energy Procedia vol 61 no 1 pp 777ndash7812014
[7] G Gonca and B Sahin ldquoEffect of turbo charging and steaminjection methods on the performance of a Miller cycle dieselengine (MCDE)rdquoApplied6ermal Engineering vol 118 no 1pp 138ndash146 2017
[8] Z Chen L Wang Q Zhang X Zhang B Yang and K ZengldquoEffects of spark timing and methanol addition on com-bustion characteristics and emissions of dual-fuel enginefuelled with natural gas and methanol under lean-burnconditionrdquo Energy Conversion and Management vol 181pp 519ndash527 2019
[9] A Hegab A La Rocca and P Shayler ldquoTowards keepingdiesel fuel supply and demand in balance dual-fuelling ofdiesel engines with natural gasrdquo Renewable and SustainableEnergy Reviews vol 70 no 1 pp 666ndash697 2017
[10] M C Cameretti R Tuccillo L D Simio S Iannaccone andU Ciaravola ldquoA numerical and experimental study of dual-fuel diesel engine for different injection timingsrdquo Applied6ermal Engineering vol 101 pp 630ndash638 2016
[11] G Gonca B Sahin A Parlak et al ldquo+e effects of steam in-jection on the performance and emission parameters of aMillercycle diesel enginerdquo Energy vol 78 no 1 pp 266ndash275 2014
[12] A-H Kakaee A Nasiri-Toosi B Partovi and A PaykanildquoEffects of piston bowl geometry on combustion and emis-sions characteristics of a natural gasdiesel RCCI enginerdquoApplied 6ermal Engineering vol 102 pp 1462ndash1472 2016
[13] S Zhou R Gao Y Feng and Y Zhu ldquoEvaluation of Millercycle and fuel injection direction strategies for low NOxemission in marine two-stroke enginerdquo International Journalof Hydrogen Energy vol 42 no 31 pp 20351ndash20360 2017
[14] X Sun X Liang G Shu J Lin Y Wang and Y WangldquoNumerical investigation of two-stroke marine diesel engineemissions using exhaust gas recirculation at different injectiontimerdquo Ocean Engineering vol 144 pp 90ndash97 2017
[15] C Mavrelos and G +eotokatos ldquoNumerical investigation ofa premixed combustion large marine two-stroke dual-fuelengine for optimising engine settings via parametric runsrdquoEnergy Conversion and Management vol 160 pp 48ndash592018
[16] S Stoumpos G +eotokatos E Boulougouris D VassalosI Lazakis and G Livanos ldquoMarine dual-fuel engine mod-elling and parametric investigation of engine settings effect onperformance-emissions trade-offsrdquo Ocean Engineeringvol 157 pp 376ndash386 2018
[17] S Saravanan B Rajesh Kumar A Varadharajan D RanaB Sethuramasamyraja and G Lakshmi Narayana rao ldquoOp-timization of DI diesel engine parameters fueled with iso-butanoldiesel blendsmdashresponse surface methodology ap-proachrdquo Fuel vol 203 pp 658ndash670 2017
[18] S Kumar and P Dinesha ldquoOptimization of engine parametersin a bio diesel engine run with honge methyl ester usingresponse surface methodologyrdquo Measurement vol 125pp 224ndash231 2018
[19] G Khoobbakht G Najafi M Karimi and A Akram ldquoOp-timization of operating factors and blended levels of dieselbiodiesel and ethanol fuels to minimize exhaust emissions ofdiesel engine using response surface methodologyrdquo Applied6ermal Engineering vol 99 pp 1006ndash1017 2016
[20] M D Turbo 5160DF Project GuidemdashMarine Four-StrokeDual-Fuel Engines Compliant with IMO Tier IIIMO Tier IIIMAN Diesel amp Turbo Augsburg Germany 2015
[21] A List AVL BOOST Usersrsquo Guides AVL List GmbH GrazAustria 2016
[22] G Woschni ldquoA universally applicable equation for the in-stantaneous heat transfer coefficient in the internal com-bustion enginerdquo SAE Transactions vol 76 pp 3065ndash30831968
[23] S D Hires R J Tabaczynski and J M Novak ldquo+e pre-diction of ignition delay and combustion intervals for ahomogeneous charge spark ignition enginerdquo SAE Transac-tions vol 87 pp 1053ndash1067 1978
[24] G P Merker B Hohlbaum and M Rauscher ldquoTwo-zonemodel for calculation of nitrogen-oxide formation in direct-injection diesel enginesrdquo SAE Transactions vol 102 no 1pp 2043ndash2050 1993
[25] A I Khuri and S Mukhopadhyay ldquoResponse surfacemethodologyrdquo Wiley Interdisciplinary Reviews Computa-tional Statistics vol 2 no 2 pp 128ndash149 2010
[26] B Rajesh Kumar S Saravanan D Rana and A NagendranldquoCombined effect of injection timing and exhaust gas recir-culation (EGR) on performance and emissions of a DI dieselengine fuelled with next-generation advanced biofuelmdashdieselblends using response surface methodologyrdquo Energy Con-version and Management vol 123 pp 470ndash486 2016
[27] R Kamaraj J Gowthami +ankachi RaghuvaranA Panimayam and H Allasi ldquoPerformance and exhaustemission optimization of a dual-fuel engine by responsesurface methodologyrdquo Energies vol 11 no 12 p 3508 2018
[28] S K Addepalli and J M Mallikarjuna ldquoParametric analysis ofa 4-stroke GDI engine using CFDrdquo Alexandria EngineeringJournal vol 57 no 1 pp 23ndash34 2018
[29] S A Provataris N S Savva T D Chountalas andD T Hountalas ldquoPrediction of NOx emissions for high speedDI Diesel engines using a semi-empirical two-zone modelrdquoEnergy Conversion and Management vol 153 pp 659ndash6702017
[30] C D Rakopoulos D C Rakopoulos G C Mavropoulos andG M Kosmadakis ldquoInvestigating the EGR rate and tem-perature impact on diesel engine combustion and emissionsunder various injection timings and loads by comprehensivetwo-zone modelingrdquo Energy vol 157 pp 990ndash1014 2018
Mathematical Problems in Engineering 9
cycle [13] and EGR [14] by CFD (Computational FluidDynamics) tools In the previous research work Mavrelosand +eotokatos [15] built a large marine two-stroke dual-fuel engine model to optimize the engine performance viaparametric runs Stoumpos et al [16] optimized a four-stroke dual fuel engine through a similar method It is not abetter optimization method because it does not have thecombined effect of the parameters +e RSM (ResponseSurface Methodology) method is a collection of mathe-matical and statistical methods which can be used to modeland analyze problems to optimize the response affected bymultiple factors [17ndash19] In this paper the model of a marinedual-fuel engine is built to calculate and predict the per-formance and emissions +e model combines the two-zonemodel and predict model and has the ability to calculate andpredict emissions According to references [13ndash16] the ef-fects of three parameters of boost pressure compressionratio and intake valve closing on performance and emis-sions are considered +e RSM method is used to optimizethe influence factors to the emissions and performance
2 Dual-Fuel Engine Modelling and Calibration
21 Dual-Fuel Engine In this paper the type of theresearched engine is MAN 5160 DF dual-fuel engine +estructure and principle of dual-fuel engine are similar to thediesel engines while fuel type is the variable and the controlsystem is complicated In the gas mode diesel is used as thepilot fuel to ignite the natural gas and the gas mode can besmoothly switched to the diesel mode When running in thegas mode the engine can fulfil the strict IMO Tier III NOXlimitations prescribed for Emissions Control Zones [20]+emain parameters of the engine are reported in Table 1
22 Modelling and Calibration In this paper the AVL-BOOST software [21] is used to build the model and in-vestigate the performance and emissions of the dual-fuelengine All measurements of this engine are from the officialworkshop test report certified by CCS (China ClassificationSociety) and LR (Lloydrsquos Register of Shipping) +e per-formance and emissions experimental data and the MAP ofthe turbocharger required for building and calibrating areacquired from the test report and the project guide [20] +esteps to build the model are as follows Initially the modulesare selected from the model tree and arranged in a regularlocation +en the pipe is used to connect the modulesNext the required data are needed to input into the modelsFor example the general engine structural data the intakeand exhaust valve lift curve the parameter of the heattransfer model and the heat release model are required inthe cylinder module In order to simplify the modellingprocess in the first calibration only the intake manifold andthe exhaust manifold are required to the bounder conditionIn addition a turbocharger and an intercooler are added forthe second calibration Finally the parameters of the modelare fine-tuned to obtain higher accuracy Figure 1 displaysthe engine model in AVL-BOOST environment
For the cylinder part the Vibe heat release model is usedto calculate the heat release rate +e Vibe heat release law issimple and practical and has a wide range of applications[21] +e model is described as follows
dx
dα
a
Δαc
middot (m + 1) middot ym
middot eminus amiddoty(m+1)
y α minus α0Δαc
⎧⎪⎪⎪⎪⎪⎨
⎪⎪⎪⎪⎪⎩
(1)
+eWoschni heat transfer model is used to calculate theheat loss from the cylinder wall +e model convertscomplex heat transfer processes into heat transfer coeffi-cients which makes calculations simply and accurate [22]+e model is described as follows
αw C0Dminus 02
p08
Tminus 053
times C1 middot Cm + C2 middotVDT1
P1V1p minus pmot( 11138571113890 1113891
08
(2)
+e calibration results show that the shape parameters ofcombustion heat release are the same in the gas mode thecombustion duration and ignition delay also change and inthe fuel mode and the shape parameters of heat releasechange Due to the small proportion of pilot diesel in the gasmode (only 1 to 3) the Hires et al model is used topredict the heat release [23] +e model is described asfollows
Δαc Δαcref middotn
nref
middotfref
f1113888 1113889
13
middotsref
s1113874 1113875
23
id idref middotn
nref1113888 1113889
13
middotf
frefmiddotsref
s1113888 1113889
23
(3)
+e two-zone combustion model is used to calculate theburned zone (b) and unburned zone (u) temperature [24](see equation (4)) +e data of burned zone temperature isused to calculate the NOX emissions +e extended Zeldo-vich mechanism is used to calculate NOX emissions whichare calibrated for the 100 75 50 and 25 Load +etemperature distribution in the cylinder cannot be calculatedby the two-zone model and the NOX emissions only rep-resent the trends for different simulation [16] However inthis study the parameter adjustments are limited in the sameload so the two-zone model can fulfil the research
Table 1 Specification of dual-fuel engine (100 load)
Engine parameters SpecificationsCylinder number (-) 8Cylinder diameter (mm) 510Stroke (mm) 600Compression ratio (-) 133Power (kW) 8000Speed (rmiddotminminus 1) 514Fire order (-) 1-4-7-6-8-5-2-3
2 Mathematical Problems in Engineering
dmbub
dφ minus p
dVb
dφ+dQF
dφminus 1113944
dQWb
dφ+ hu
dmu
dφ
dmuuu
dφ minus p
dVu
dφminus 1113944
dQWu
dφ+ hu
dmB
dφ
⎧⎪⎪⎪⎪⎪⎪⎨
⎪⎪⎪⎪⎪⎪⎩
(4)
Table 2 shows the errors between calculated and mea-sured under different loads with all of the errors less than 3Figure 2 displays the simulated and measured cylinderpressure According to the results of the errors the accuracyof the simulation model can be demonstrated which canmeet the next research requirements
3 RSM for Optimization
31 Analysis of Influencing Factors of Engine Performance andEmissions +is section focuses on the effects of engineparameters on the performance and emissions As shown inTable 2 NOX emissions of 50 load is higher than otherloads As a generator power engine it is hard to work under25 loads so the 50 load is chosen for optimization +eengine parameters including boost pressure compressionratio and intake valve closing timing changed from minus 10 to+10 of base parameters In order to get the objective re-sults the same intake air temperature is maintained in allsimulations Figure 3 displays the performance and emis-sions based on the originated operation As it shows thePower and BSFC are more affected by compression ratio theNOX emissions is more influenced by the boost pressure andintake valve closing and the peak combustion pressure(Pmax) is more affected by compression ratio and intake valveclosing
32 RSM Model RSM is a collection of mathematical andstatistical methods which is used to modelling predictionand optimization +e general expression of the mathe-matical model is as follows [25]
y β0 + 1113944k
i1βixi + 1113944 1113944
iltjβijxixj + 1113944
k
i1βiix
2i + ε (5)
where y is the response xi are numeric values of the factorsterms β0 βi βii and βij are regression coefficients and the εis error [26] +e quadratic model is used to approximatemost engine systems [18] +e difference between the pre-dicted and actual values is called residuals Figure 4 showsthe predicted and actual values plot for Power BSFC NOXand Pmax +e predicted and the actual data are approxi-mately acceptable and there is no large deviation betweenthem
+e significant test is used to ensure the adaptability andaccuracy of the model +e evaluation parameters are shownas follows
R2
1 minusSSresidual
SSresidual + SSmodel1113890 1113891 (6)
R2 a fully fitted measure that reflects how well the re-sponse surface meets the given data which is required greaterthan 09
Adjusted-R2 representing the degree of correlationbetween all independent variables and dependent variablesthe regression effect is better when close to 1
SB1
SB2
PL1
PL2
TC1
J1 J2
1
2 3
R145
6
7
8 9 10 11 12 13 14 15
J4
J12
J8
J16
J5
J13 J17
J9J7
J15
J3
J11
J10
J18J14
J616 17 18 19 20 21 22 23
C1 C4C2 C6 C7C5 C8C3
24 25 26 27 28 29 30 31 32 33 34 35 36 37 38 39
40 41 42 43 44 45 46 47 48 49 50 51 52 53 54 55
E1
56 57 58 59 60 61 62 63
6465
MP6
MP1
MP4
MP3
MP5
MP8MP14
MP22
MP30
MP16
MP24
MP32
MP23
MP31
MP15
MP20
MP28
MP12
MP18
MP26
MP10
MP27
MP19
MP11
MP33
MP25
MP17
MP29
MP21
MP13
MP2
MP9
CO1
I5I2 I4I3 I6 I7 I8I1
MP7
Figure 1 8L5160DF engine model in the AVL-BOOST environment
Mathematical Problems in Engineering 3
R2Pred 1 minus
PRESSSSresidual + SSmodel
1113890 1113891 (8)
Predicted-R2 a measurement of the amount of variationin new data explained by the model which is usually requiredgreater than 08 and the difference value with Adjusted R2
should be within 020 In the abovementioned equations theSS PRESS and df represent the sum of squares sum of
squares of prediction errors and degree of freedom re-spectively +e ANOVA data of the Power BSFC NOX andPmax are listed in Table 3 It is shown that the R2 Adjusted-R2 and Predicted-R2 of all responses are greater than 085and the difference value of Adjusted-R2 and Predicted -R2
are less than 02 It indicates the response surface modelshave good consistency and predictability for the test results+e p value of the quadratic model is less than 005 which
Range ndash10 +10 Range ndash10 +10 Range ndash10 +10 Range ndash10 +10097
Figure 3 Effects of the boost pressure compression ratio and intake valve closing on power BSFC NOX emissions and peak combustionpressure
Table 2 Calculation error of the gas mode
Engine load () 100 75 50 25Mode Gas mode error ()Power (kW) 012 014 minus 009 038BSFC (gmiddotkminus 1Wminus 1hminus 1) minus 009 minus 011 013 minus 034Peak comb press (bar) minus 181 minus 172 044 051Intake manifold temp (K) minus 099 minus 064 034 minus 200Intake manifold press (bar) minus 004 minus 024 minus 012 minus 011Intake manifold mass flow (kgmiddotsminus 1) minus 012 minus 022 016 067Exhaust manifold temp (K) minus 198 027 010 279Exhaust manifold press (bar) 128 259 223 minus 062Exhaust manifold mass flow (kg sminus 1) minus 016 014 minus 009 038NOX emissions (gmiddotkminus 1Wminus 1hminus 1) 159 minus 243 minus 196 198
300 330 360 390 420 4500
20
40
60
80
100
120
140
160
180
Load 100Load 75
Load 50Load 25
Crank angle degree (deg)
Sim
ulat
ion
pres
sure
(bar
)
0
20
40
60
80
100
120
140
160
180
Expe
rimen
t pre
ssur
e (ba
r)
Figure 2 Comparison of simulation and experiment pressure
4 Mathematical Problems in Engineering
indicates that the model terms are significant +e weightvalue of boost pressure (x) compression ratio (y) and intakevalve closing (z) of all response models correspond to theanalysis results of Figure 3
4 Results and Discussion
41 Evaluation of Power +e developed quadratic model ofPower as fitted based on RSM in terms of the simulatedfactors corresponded to
Power 401194
+ 3047 times x + 9374 times y + 3582 times z
minus 210xy minus 1415 times xz minus 01312 times yz
minus 818x2
minus 1001 times y2
minus 2190 times z2
(9)
where Power is the engine output power (kW) x is the boostpressure (bar) y is the compression ratio (-) and the z is theintake valve closing (degC) +e predicted values of Powercalculated by equation (9) are satisfactorily close to thesimulation values
+e effects of linear factors boost pressure compressionratio and intake valve closing are found to be highly sig-nificant (all p value lt00001) on the Power All of the square
terms are also found to be significant with p value x2 (00071)y2 (00034) and z2 (00002) whichmeans there is a curved linerelationship between the variables and Power x and z are alsofound to have an interaction effect on Power with the p valuexz (lt00001) A negative sign means an antagonistic effectwhile a positive sign of the coefficient represents a synergisticeffect +e regression statistics goodness of fit (R2) thegoodness of adjustment (Adjusted-R2) and the goodness ofprediction (Predicted-R2) for the response of Power are9998 9993 and 9978 respectively All of the threevalues indicate that the model fits the data very well
+e effect of boost pressure compression ratio andintake valve closing on the Power is depicted in Figure 5+ehigher boost pressure and compression ratio and the laterintake valve closing could improve the Power [16] Amongthe abovementioned factors compression ratio has thegreatest influence on the Power +is is because highercompression ratios make the higher temperatures andpressures in the cylinder at the end of compression andincrease the charge energy in the cylinder [27]
42 Evaluation of BSFC +e developed quadratic model ofBSFC as fitted based on RSM in terms of the simulatedfactors corresponded to
3700
3800
3900
4000
4100
4200
3700 3800 3900 4000 4100 4200
Pred
icte
dPower (kW)
Actual
(a)
165
170
175
180
185
165 170 175 180 185
Pred
icte
dActual
BSFC (gkWmiddoth)
(b)
ndash20
0
20
40
60
80
ndash20 0 20 40 60 80
Pred
icte
d
Actual
NOX emissions (gkWmiddoth)
(c)
60
70
80
90
100
110
120
60 70 80 90 100 110 120
Pred
icte
d
Actual
Peak comb press (bar)
(d)
Figure 4 Comparison of predicted and actual parameters
Table 3 ANOVA table for power BSFC NOX and Pmax
Source Power (kW) BSFC (gkWh) NOX (gkWh) Pmax (bar)
TypeQuadratic Quadratic Quadratic Quadratic
p value p value p value p value Model lt00001 lt00001 00018 lt00001x lt00001 1904 lt00001 1943 00006 4356 lt00001 1541y lt00001 5858 lt00001 5861 01995 672 lt00001 4123z lt00001 2239 lt00001 2196 00003 4972 lt00001 4336xy 00779 00211 06097 00004xz lt00001 00001 00012 00002yz 08902 01534 03448 lt00001x2 00071 00099 01262 0217y2 00034 0002 0826 09557z2 00002 00002 00261 00001R2 09998 09997 09877 10000Adj-R2 09993 09992 09599 09999Pred-R2 09978 09972 08755 09995
Mathematical Problems in Engineering 5
BSFC 17216
minus 137 times x minus 413 times y minus 155 times z
+ 01548xy + 06334 times xz + 00739 times yz
+ 03494x2
+ 05402 times y2
+ 09777 times z2
(10)
where BSFC is the brake-specific fuel consumption (gkWh)x is the boost pressure (bar) y is the compression ratio (-)and z is the intake valve closing (degC)+e predicted valuesof BSFC calculated by (10) are satisfactorily close to thesimulation values
+e effects of linear factors boost pressure compressionratio and intake valve closing are found to be highly sig-nificant (all p value lt00001) on the BSFC All of the squareterms are also found to be significant with p value x2(00099) y2 (00020) and z2 (00002) which means there is acurved-line relationship between the variables and BSFC+e xy and xz are also found to have an interaction effect onBSFC with the p value xy (00211) and xz (00001) Anegative sign means an antagonistic effect while a positivesign of the coefficient represents a synergistic effect +eregression statistics goodness of fit (R2) the goodness ofadjustment (Adjusted-R2) and the goodness of prediction(Predicted-R2) for the response of BSFC are 9997 9992and 9972 respectively All of the three values indicate thatthe model fits the data very well +e effect of boost pressurecompression ratio and intake valve closing on the BSFC isdepicted in Figure 6 Similar to the Power the compressionratio has the greatest influence on BSFC [28]
43 Evaluation of NOX +e developed quadratic model ofNOX emissions as fitted based on RSM in terms of thesimulated factors corresponded to
NOX 523
+ 523 times x minus 1559 times y + 241 times z
minus 1780xy minus 09689 times xz + 1429 times yz
minus 187x2
minus 07412 times y2
+ 1089 times z2
(11)
where NOX is the engine NOX emissions (gkWh) x is theboost pressure (bar) y is the compression ratio (-) and the z
is the intake valve closing (degC) +e predicted values ofNOX calculated by (11) are satisfactorily close to the sim-ulation values +e effects of linear factors boost pressureand intake valve closing are found to be highly significant (pvalue 00006 and 00003) on the NOX +e z square termsare also found to be significant with p value z2 (00261)which means there is a curved line relationship between thevariables and NOX x and z are also found to have an in-teraction effect on NOX with the p value xz (00012) Anegative sign means an antagonistic effect while a positivesign of the coefficient represents a synergistic effect +eregression statistics goodness of fit (R2) the goodness ofadjustment (Adjusted-R2) and the goodness of prediction(Predicted-R2) for the response of NOX are 9877 9599and 8755 respectively Compared with other responsethe regression effect of NOX is not good which is also relatedto the limitation of the two-zone model [29] +e effect ofboost pressure compression ratio and intake valve closingon the NOX are depicted in Figure 7
44 Evaluation of Pmax +e developed quadratic model ofPmax as fitted based on RSM in terms of the simulatedfactors corresponded to
Pmax 9101
+ 374 times x + 1000 times y + 1052 times z
+ 06096xy + 07907 times xz + 132 times yz
minus 01503x2
minus 00061 times y2
minus 154 times z2
(12)
where Pmax is the engine peak combustion pressure (bar) xis the boost pressure (bar) y is the compression ratio (-) andthe z is the intake valve closing (degC) +e predicted valuesof Power calculated by (12) are satisfactorily close to thesimulation values
+e effects of linear factors boost pressure and com-pression ratio and intake valve closing are found to be highlysignificant (all p value lt00001) on the Pmax +e z squareterms are also found to be significant with p value z2(00001) which means there is a curved line relationshipbetween the variables and Pmax +e terms xy xz and yz arealso found to have an interaction effect on Pmax with the p
11971235
127313111349
13871425
1463
1881962
20442126
2208229
3700
3800
3900
4000
4100
4200
Pow
er (k
W)
A boostpress (bar)B compratio (ndash)
(a)Po
wer
(kW
)
532545
558571
584
1881962
20442126
2208229
3700
3800
3900
4000
4100
4200
A boostpress (bar)
C IVC (degC)
(b)
Pow
er (k
W)
532545
558571
584
11971235
12731311
13491387
14251463
3700
3800
3900
4000
4100
4200
B compratio (ndash)C IVC (degC)
(c)
Figure 5 Surface plot of power with input variables
6 Mathematical Problems in Engineering
value xy (00004) xz (00002) and yz (lt00001) A negativesign means an antagonistic effect while a positive sign of thecoefficient represents a synergistic effect +e regressionstatistics goodness of fit (R2) the goodness of adjustment(Adjusted-R2) and the goodness of prediction (Predicted-R2) for the response of Pmax are 10000 9999 and9995 respectively All of the three values indicate that themodel fits the data very well
+e effect of boost pressure compression ratio andintake valve closing on the Pmax is depicted in Figure 8 +ehigher boost pressure and compression ratio and the later
intake valve closing could improve the Pmax Among theabovementioned factors compression ratio and intake valveclosing both have the greatest influence on the Pmax
45 Comparison between RSM and Simulation Results Inorder to obtain the best parameter setting of low emissionswithout sacrificing performance the responses Power islimited to not less than the original level +e BSFC NOXand Pmax are limited to not more than the original level +ebest parameter settings boost pressure (+983)
11971235
12731311
13491387
14251463
1881962
20442126
2208229
165
170
175
180
185
BSFC
(gk
Wh)
A boostpress (bar)B compratio (ndash)
(a)
BSFC
(gk
Wh)
532545
558571
584
1881962
20442126
2208229
165
170
175
180
185
A boostpress (bar)C IVC (degC)
(b)
BSFC
(gk
Wh)
532545
558571
584
11971235
12731311
13491387
14251463
165
170
175
180
185
B compratio (ndash)C IVC (degC)
(c)
Figure 6 Surface plot of BSFC with input variables
11971235127313111349138714251463
1881962
20442126
2208229
ndash2000
000
2000
4000
6000
8000
NOX (g
kW
h)
A boostpress (
bar)
B compratio (ndash)
(a)
NOX (g
kW
h)
A boostpress (
bar)532545
558571
584
1881962
20442126
2208229
ndash2000
000
2000
4000
6000
8000
C IVC (degC)
(b)N
OX (g
kW
h)
532545
558571
584
11971235
12731311
13491387
14251463
ndash2000
000
2000
4000
6000
8000
B compratio (ndash)
C IVC (degC)
(c)
Figure 7 Surface plot of NOX with input variables
11971235
12731311
13491387
14251463
1881962
20442126
2208229
60
70
80
90
100
110
120
P max
(bar
)
A boostpress (bar)B compratio (ndash)
(a)
P max
(bar
)
532545
558571
584
1881962
20442126
2208229
60
70
80
90
100
110
120
A boostpress (bar)C IVC (degC)
(b)
P max
(bar
)
B compratio (ndash)C IVC (degC) 532545
558571
584
11971235
12731311
13491387
14251463
60
70
80
90
100
110
120
(c)
Figure 8 Surface plot of Pmax with input variables
Mathematical Problems in Engineering 7
compression ratio (+242) and intake valve closing(minus 604) leading to the Power BSFC NOX and Pmaxchange separately 054minus 059 minus 1718 and minus 155 withthe RSM method Due to the early timing of intake valveclosing and the charge of cylinder expansion and cooling thein-cylinder temperature is lower than the original cycle +eearly intake valve closing timing needs the higher boostpressure so that there is enough air for combustion +ehigher boost pressure causes more air to enter the cylinderwhich makes the fuel burn more thoroughly +e highercompression ratio causes higher in-cylinder temperatureduring the compression phase which makes the combustiontemperature high It has an opposite effect when the intakevalve closing advanced so the optimized result shows thatthe compression ratio increases less Table 4 displays thesame parameter settings on the simulation results +ePower BSFC and Pmax simulated values are in goodagreement with the predicted values Because the two-zonemodel cannot well calculate the temperature distribution inthe cylinder the calculated RSM value is different from thesimulated value when calculating NOX emissions [30] Al-though the model has deviations it does not affect the trendjudgment of the influence of different parameters on NOXRSM optimization results are still convincing which canoptimize different parameters at the same time +e RSMmethod transforms time-consuming model calculation intomathematical calculation which has certain advantages inspeed and accuracy +e model based on the RSM methodcan predict with adequate accuracy the engine performanceand emissions for the gas mode operation which can be usedin the engine design process for optimizing the enginesettings
5 Conclusion
+is study investigated the effects of boost pressure com-pression ratio and intake valve closing on the performanceand emissions characteristics of the marine dual-fuel engine+e research is conducted by using a full-factorial experi-mental design matrix +e response surface method is usedto model predict and optimize the measured responsevariables +e conclusions of the analysis are as follows
(1) +e results of ANOVA indicated that all the modelsfor Power BSFC NOX and Pmax are found to besignificant under 99 confidence level For thepower and BSFC the compression ratio is the majorinfluence (about 5858 and 5861) For the NOXthe boost pressure and intake valve closing are themajor influence (about 4356 and 4972) For thePmax the compression ratio and intake valve closingare the major influence (about 4123 and 4336)
+e results of ANOVA are consistent with the singlechange parameter analysis result
(2) From the response surface plots it can be concludedthat the effects of all factors on the responses are verystraightforward and it is easy to find a single re-sponse optimal value and limit the range of differentresponses and perform multiobjective optimization
(3) +e optimization results are very close to simulationresults which indicate the accuracy of the RSMmodel from another perspective +e Power BSFCNOX and Pmax change by 055 minus 060 minus 1321and minus 15 separately when the parametric settingswith boost pressure compression ratio and intakevalve closing change by +983 +242 andminus 604 separately
Data Availability
+e data used to support the findings of this study areavailable from the corresponding author upon request
Conflicts of Interest
+e authors declare that there are no conflicts of interestregarding the publication of this paper
Acknowledgments
+e research work has been financially supported by thePeoplersquos Republic of China Project ldquoIntelligent Ship Com-prehensive Testing and Verification Researchrdquo ((2018) no473) and ldquothe Fundamental Research Funds for the CentralUniversitiesrdquo (no 3132019315)
[2] B Rajesh kumar and S Saravanan ldquoEffect of exhaust gasrecirculation (EGR) on performance and emissions of aconstant speed DI diesel engine fueled with pentanoldieselblendsrdquo Fuel vol 160 pp 217ndash226 2015
[3] A P Carlucci D Laforgia R Saracino and G TotoldquoCombustion and emissions control in dieselndashmethane dual-fuel engines the effects of methane supply method combinedwith variable in-cylinder charge bulk motionrdquo Energy Con-version and Management vol 52 no 8-9 pp 3004ndash30172011
[4] C D Rakopoulos K A Antonopoulos D C Rakopoulosand D T Hountalas ldquoMulti-zone modeling of combustionand emissions formation in DI diesel engine operating onethanol-diesel fuel blendsrdquo Energy Conversion and Manage-ment vol 49 no 4 pp 625ndash643 2008
[5] G Gonca ldquoInvestigation of the effects of steam injection onperformance and NO emissions of a diesel engine runningwith ethanol-diesel blendrdquo Energy Conversion and Manage-ment vol 77 pp 450ndash457 2014
[6] X Ma F Zhang K Han Z Zhu and Y Liu ldquoEffects of intakemanifold water injection on combustion and emissions of
Table 4 Comparison between RSM and simulation results
Terms power (kW) BSFC(gkWh)NOX(gkWh) Pmax (bar)
RSM +054 minus 059 minus 1718 minus 155Simulation +055 minus 060 minus 1321 minus 151
8 Mathematical Problems in Engineering
diesel enginerdquo Energy Procedia vol 61 no 1 pp 777ndash7812014
[7] G Gonca and B Sahin ldquoEffect of turbo charging and steaminjection methods on the performance of a Miller cycle dieselengine (MCDE)rdquoApplied6ermal Engineering vol 118 no 1pp 138ndash146 2017
[8] Z Chen L Wang Q Zhang X Zhang B Yang and K ZengldquoEffects of spark timing and methanol addition on com-bustion characteristics and emissions of dual-fuel enginefuelled with natural gas and methanol under lean-burnconditionrdquo Energy Conversion and Management vol 181pp 519ndash527 2019
[9] A Hegab A La Rocca and P Shayler ldquoTowards keepingdiesel fuel supply and demand in balance dual-fuelling ofdiesel engines with natural gasrdquo Renewable and SustainableEnergy Reviews vol 70 no 1 pp 666ndash697 2017
[10] M C Cameretti R Tuccillo L D Simio S Iannaccone andU Ciaravola ldquoA numerical and experimental study of dual-fuel diesel engine for different injection timingsrdquo Applied6ermal Engineering vol 101 pp 630ndash638 2016
[11] G Gonca B Sahin A Parlak et al ldquo+e effects of steam in-jection on the performance and emission parameters of aMillercycle diesel enginerdquo Energy vol 78 no 1 pp 266ndash275 2014
[12] A-H Kakaee A Nasiri-Toosi B Partovi and A PaykanildquoEffects of piston bowl geometry on combustion and emis-sions characteristics of a natural gasdiesel RCCI enginerdquoApplied 6ermal Engineering vol 102 pp 1462ndash1472 2016
[13] S Zhou R Gao Y Feng and Y Zhu ldquoEvaluation of Millercycle and fuel injection direction strategies for low NOxemission in marine two-stroke enginerdquo International Journalof Hydrogen Energy vol 42 no 31 pp 20351ndash20360 2017
[14] X Sun X Liang G Shu J Lin Y Wang and Y WangldquoNumerical investigation of two-stroke marine diesel engineemissions using exhaust gas recirculation at different injectiontimerdquo Ocean Engineering vol 144 pp 90ndash97 2017
[15] C Mavrelos and G +eotokatos ldquoNumerical investigation ofa premixed combustion large marine two-stroke dual-fuelengine for optimising engine settings via parametric runsrdquoEnergy Conversion and Management vol 160 pp 48ndash592018
[16] S Stoumpos G +eotokatos E Boulougouris D VassalosI Lazakis and G Livanos ldquoMarine dual-fuel engine mod-elling and parametric investigation of engine settings effect onperformance-emissions trade-offsrdquo Ocean Engineeringvol 157 pp 376ndash386 2018
[17] S Saravanan B Rajesh Kumar A Varadharajan D RanaB Sethuramasamyraja and G Lakshmi Narayana rao ldquoOp-timization of DI diesel engine parameters fueled with iso-butanoldiesel blendsmdashresponse surface methodology ap-proachrdquo Fuel vol 203 pp 658ndash670 2017
[18] S Kumar and P Dinesha ldquoOptimization of engine parametersin a bio diesel engine run with honge methyl ester usingresponse surface methodologyrdquo Measurement vol 125pp 224ndash231 2018
[19] G Khoobbakht G Najafi M Karimi and A Akram ldquoOp-timization of operating factors and blended levels of dieselbiodiesel and ethanol fuels to minimize exhaust emissions ofdiesel engine using response surface methodologyrdquo Applied6ermal Engineering vol 99 pp 1006ndash1017 2016
[20] M D Turbo 5160DF Project GuidemdashMarine Four-StrokeDual-Fuel Engines Compliant with IMO Tier IIIMO Tier IIIMAN Diesel amp Turbo Augsburg Germany 2015
[21] A List AVL BOOST Usersrsquo Guides AVL List GmbH GrazAustria 2016
[22] G Woschni ldquoA universally applicable equation for the in-stantaneous heat transfer coefficient in the internal com-bustion enginerdquo SAE Transactions vol 76 pp 3065ndash30831968
[23] S D Hires R J Tabaczynski and J M Novak ldquo+e pre-diction of ignition delay and combustion intervals for ahomogeneous charge spark ignition enginerdquo SAE Transac-tions vol 87 pp 1053ndash1067 1978
[24] G P Merker B Hohlbaum and M Rauscher ldquoTwo-zonemodel for calculation of nitrogen-oxide formation in direct-injection diesel enginesrdquo SAE Transactions vol 102 no 1pp 2043ndash2050 1993
[25] A I Khuri and S Mukhopadhyay ldquoResponse surfacemethodologyrdquo Wiley Interdisciplinary Reviews Computa-tional Statistics vol 2 no 2 pp 128ndash149 2010
[26] B Rajesh Kumar S Saravanan D Rana and A NagendranldquoCombined effect of injection timing and exhaust gas recir-culation (EGR) on performance and emissions of a DI dieselengine fuelled with next-generation advanced biofuelmdashdieselblends using response surface methodologyrdquo Energy Con-version and Management vol 123 pp 470ndash486 2016
[27] R Kamaraj J Gowthami +ankachi RaghuvaranA Panimayam and H Allasi ldquoPerformance and exhaustemission optimization of a dual-fuel engine by responsesurface methodologyrdquo Energies vol 11 no 12 p 3508 2018
[28] S K Addepalli and J M Mallikarjuna ldquoParametric analysis ofa 4-stroke GDI engine using CFDrdquo Alexandria EngineeringJournal vol 57 no 1 pp 23ndash34 2018
[29] S A Provataris N S Savva T D Chountalas andD T Hountalas ldquoPrediction of NOx emissions for high speedDI Diesel engines using a semi-empirical two-zone modelrdquoEnergy Conversion and Management vol 153 pp 659ndash6702017
[30] C D Rakopoulos D C Rakopoulos G C Mavropoulos andG M Kosmadakis ldquoInvestigating the EGR rate and tem-perature impact on diesel engine combustion and emissionsunder various injection timings and loads by comprehensivetwo-zone modelingrdquo Energy vol 157 pp 990ndash1014 2018
Mathematical Problems in Engineering 9
diesel enginerdquo Energy Procedia vol 61 no 1 pp 777ndash7812014
[7] G Gonca and B Sahin ldquoEffect of turbo charging and steaminjection methods on the performance of a Miller cycle dieselengine (MCDE)rdquoApplied6ermal Engineering vol 118 no 1pp 138ndash146 2017
[8] Z Chen L Wang Q Zhang X Zhang B Yang and K ZengldquoEffects of spark timing and methanol addition on com-bustion characteristics and emissions of dual-fuel enginefuelled with natural gas and methanol under lean-burnconditionrdquo Energy Conversion and Management vol 181pp 519ndash527 2019
[9] A Hegab A La Rocca and P Shayler ldquoTowards keepingdiesel fuel supply and demand in balance dual-fuelling ofdiesel engines with natural gasrdquo Renewable and SustainableEnergy Reviews vol 70 no 1 pp 666ndash697 2017
[10] M C Cameretti R Tuccillo L D Simio S Iannaccone andU Ciaravola ldquoA numerical and experimental study of dual-fuel diesel engine for different injection timingsrdquo Applied6ermal Engineering vol 101 pp 630ndash638 2016
[11] G Gonca B Sahin A Parlak et al ldquo+e effects of steam in-jection on the performance and emission parameters of aMillercycle diesel enginerdquo Energy vol 78 no 1 pp 266ndash275 2014
[12] A-H Kakaee A Nasiri-Toosi B Partovi and A PaykanildquoEffects of piston bowl geometry on combustion and emis-sions characteristics of a natural gasdiesel RCCI enginerdquoApplied 6ermal Engineering vol 102 pp 1462ndash1472 2016
[13] S Zhou R Gao Y Feng and Y Zhu ldquoEvaluation of Millercycle and fuel injection direction strategies for low NOxemission in marine two-stroke enginerdquo International Journalof Hydrogen Energy vol 42 no 31 pp 20351ndash20360 2017
[14] X Sun X Liang G Shu J Lin Y Wang and Y WangldquoNumerical investigation of two-stroke marine diesel engineemissions using exhaust gas recirculation at different injectiontimerdquo Ocean Engineering vol 144 pp 90ndash97 2017
[15] C Mavrelos and G +eotokatos ldquoNumerical investigation ofa premixed combustion large marine two-stroke dual-fuelengine for optimising engine settings via parametric runsrdquoEnergy Conversion and Management vol 160 pp 48ndash592018
[16] S Stoumpos G +eotokatos E Boulougouris D VassalosI Lazakis and G Livanos ldquoMarine dual-fuel engine mod-elling and parametric investigation of engine settings effect onperformance-emissions trade-offsrdquo Ocean Engineeringvol 157 pp 376ndash386 2018
[17] S Saravanan B Rajesh Kumar A Varadharajan D RanaB Sethuramasamyraja and G Lakshmi Narayana rao ldquoOp-timization of DI diesel engine parameters fueled with iso-butanoldiesel blendsmdashresponse surface methodology ap-proachrdquo Fuel vol 203 pp 658ndash670 2017
[18] S Kumar and P Dinesha ldquoOptimization of engine parametersin a bio diesel engine run with honge methyl ester usingresponse surface methodologyrdquo Measurement vol 125pp 224ndash231 2018
[19] G Khoobbakht G Najafi M Karimi and A Akram ldquoOp-timization of operating factors and blended levels of dieselbiodiesel and ethanol fuels to minimize exhaust emissions ofdiesel engine using response surface methodologyrdquo Applied6ermal Engineering vol 99 pp 1006ndash1017 2016
[20] M D Turbo 5160DF Project GuidemdashMarine Four-StrokeDual-Fuel Engines Compliant with IMO Tier IIIMO Tier IIIMAN Diesel amp Turbo Augsburg Germany 2015
[21] A List AVL BOOST Usersrsquo Guides AVL List GmbH GrazAustria 2016
[22] G Woschni ldquoA universally applicable equation for the in-stantaneous heat transfer coefficient in the internal com-bustion enginerdquo SAE Transactions vol 76 pp 3065ndash30831968
[23] S D Hires R J Tabaczynski and J M Novak ldquo+e pre-diction of ignition delay and combustion intervals for ahomogeneous charge spark ignition enginerdquo SAE Transac-tions vol 87 pp 1053ndash1067 1978
[24] G P Merker B Hohlbaum and M Rauscher ldquoTwo-zonemodel for calculation of nitrogen-oxide formation in direct-injection diesel enginesrdquo SAE Transactions vol 102 no 1pp 2043ndash2050 1993
[25] A I Khuri and S Mukhopadhyay ldquoResponse surfacemethodologyrdquo Wiley Interdisciplinary Reviews Computa-tional Statistics vol 2 no 2 pp 128ndash149 2010
[26] B Rajesh Kumar S Saravanan D Rana and A NagendranldquoCombined effect of injection timing and exhaust gas recir-culation (EGR) on performance and emissions of a DI dieselengine fuelled with next-generation advanced biofuelmdashdieselblends using response surface methodologyrdquo Energy Con-version and Management vol 123 pp 470ndash486 2016
[27] R Kamaraj J Gowthami +ankachi RaghuvaranA Panimayam and H Allasi ldquoPerformance and exhaustemission optimization of a dual-fuel engine by responsesurface methodologyrdquo Energies vol 11 no 12 p 3508 2018
[28] S K Addepalli and J M Mallikarjuna ldquoParametric analysis ofa 4-stroke GDI engine using CFDrdquo Alexandria EngineeringJournal vol 57 no 1 pp 23ndash34 2018
[29] S A Provataris N S Savva T D Chountalas andD T Hountalas ldquoPrediction of NOx emissions for high speedDI Diesel engines using a semi-empirical two-zone modelrdquoEnergy Conversion and Management vol 153 pp 659ndash6702017
[30] C D Rakopoulos D C Rakopoulos G C Mavropoulos andG M Kosmadakis ldquoInvestigating the EGR rate and tem-perature impact on diesel engine combustion and emissionsunder various injection timings and loads by comprehensivetwo-zone modelingrdquo Energy vol 157 pp 990ndash1014 2018