20
Emissions Inventory Case Study Kris Ray, Confederated Tribes of the Colville Reservation
| Date post: | 02-Jan-2016 |
| Category: |
Documents |
| Upload: | sandra-powers |
| View: | 218 times |
| Download: | 0 times |

Emissions Inventory Case Study
Kris Ray, Confederated Tribes of the Colville Reservation

Location
2

Colville Reservation Map
3
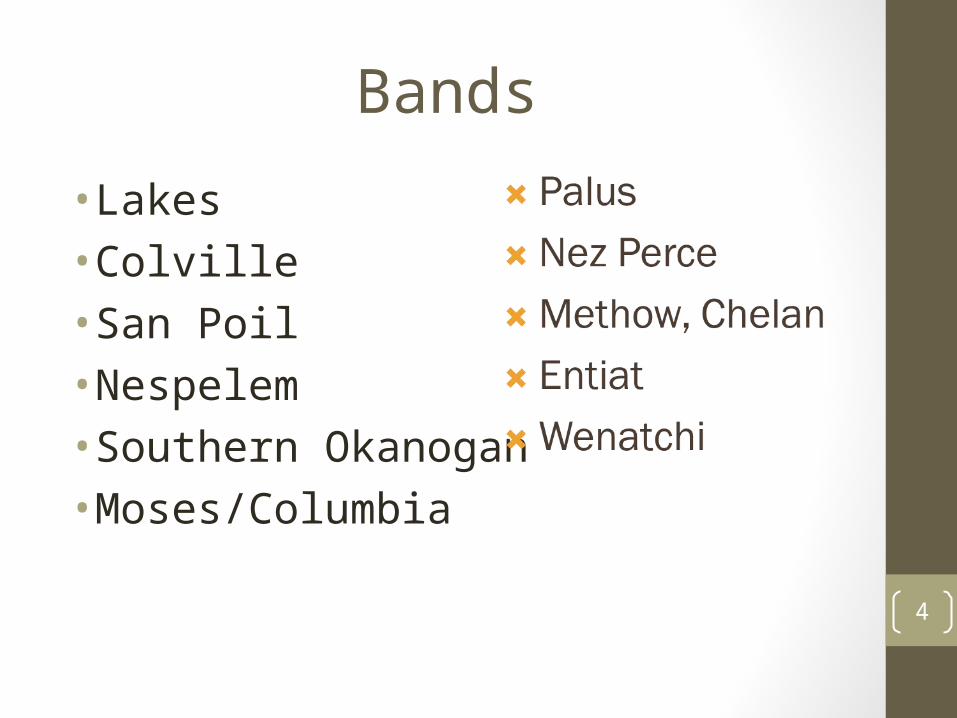
Bands
• Lakes• Colville• San Poil•Nespelem• Southern Okanogan•Moses/Columbia
4
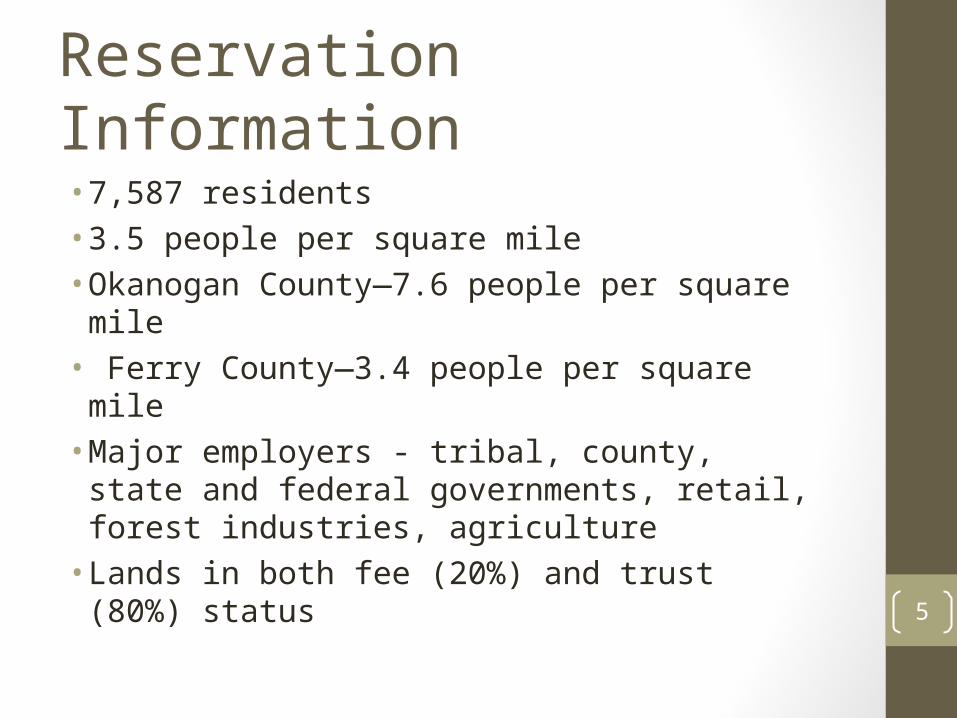
Reservation Information
• 7,587 residents• 3.5 people per square mile• Okanogan County—7.6 people per
square mile• Ferry County—3.4 people per square
mile • Major employers - tribal, county, state
and federal governments, retail, forest industries, agriculture • Lands in both fee (20%) and trust (80%)
status 5

History of EI Efforts
Colville Confederated Tribes Emissions Inventory Process Report, August 2001
Plan for the Development of an Annual Emissions Inventory System, November 2003
Point Source Emissions Inventory for the Confederated Tribes of the Colville Reservation—prepared for Western Governors' Association and The Western Regional Air Partnership (WRAP), 2006
6

Emission Inventory Efforts
• Emissions Inventory Preparation Plan, 2008• Air Emissions Inventory Criteria
Pollutants, Base Year 2008• Updated Inventory Preparation Plan,
2011• Air Emissions Inventory Criteria
Pollutants, Base Year 2011
7

Uses of EI Data
• Monitor sources for changes• Follow trends over time• Effects result from new sources or
facility shutdowns• Provides information for potential
inspections• Development of a TIP• Region 10 goals• NEI submission 8

Phased Approach• Phase I – Base line using existing data• FARR registration• 2 years to get all sources registered
• Phase II – Other sources added• Roads – nonpoint• Wildfires – event• Prescribed burning – event
• Phase III – Off-reservation sources• Parts of five counties• Identify sources that may affect reservation
9

Quality Assurance / Quality Control
• System of review • Audit procedures •QC – Reality check consisting of completeness and reasonableness reviews•QA – Peer review
10
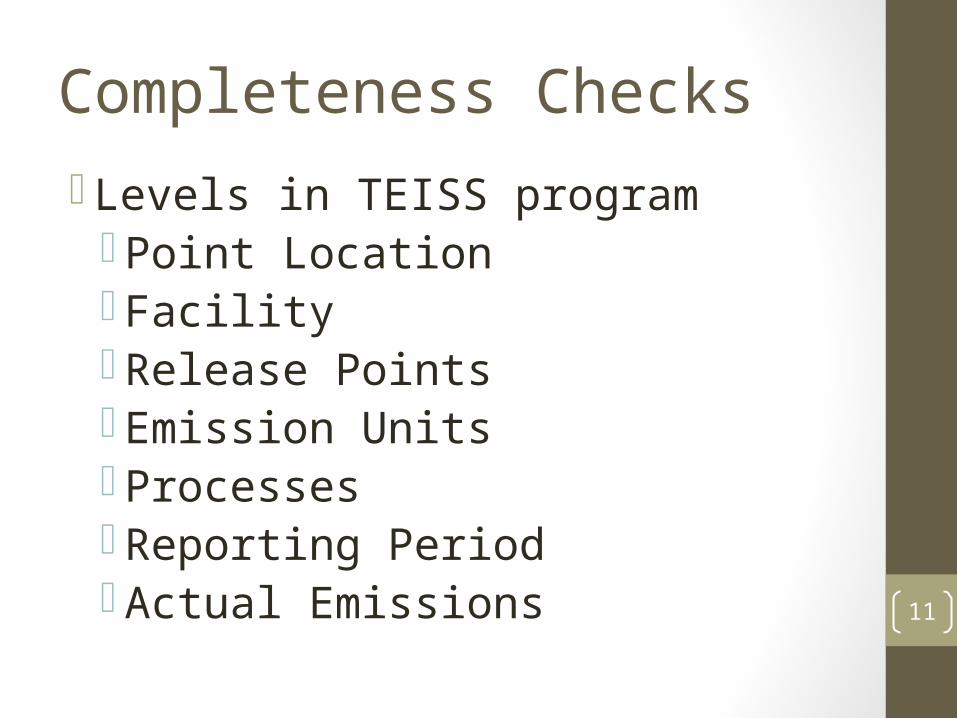
Completeness Checks
Levels in TEISS program Point Location Facility Release Points Emission Units Processes Reporting Period Actual Emissions 11

Completeness Checks
Input tree and printed reports used to verify that all data points needed are satisfied
Assured that units, equipment types, IDs, and other parameters are consistent
If data points are not fully defined, effort was made to provide necessary information by using source documents
Review of transcription of data to TEISS program used to check for accuracy
12

Reasonableness checks
Determine if data, emission factors, emissions estimates are within range of normal
Compared similar facilities Compared with surrounding county and state
EI information
13

Data Collection
• Title V permits and reporting documents• Title V fee calculation worksheets and
facility applications• Non Title V permits• FARR registration• Full Compliance Evaluation Technical
Report
14

DATA Management
• TEISS data entry• Files stored at multiple locations• Two servers• Two computers• CD• EPA• ITEP
• NEI submittal by ITEP (2008) 15
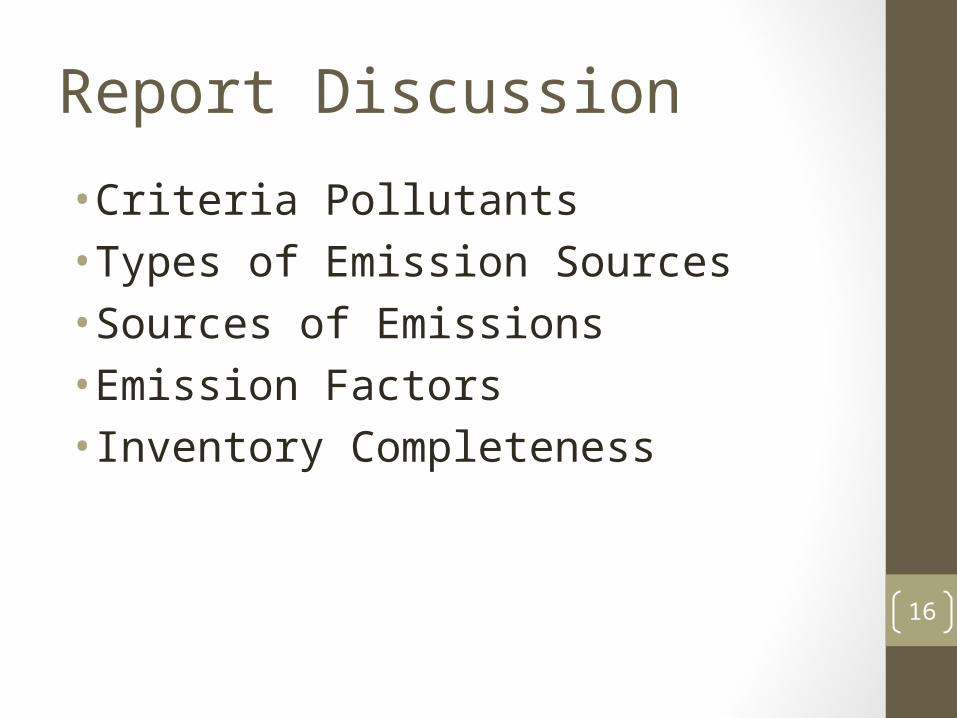
Report Discussion
• Criteria Pollutants• Types of Emission Sources• Sources of Emissions• Emission Factors• Inventory Completeness
16

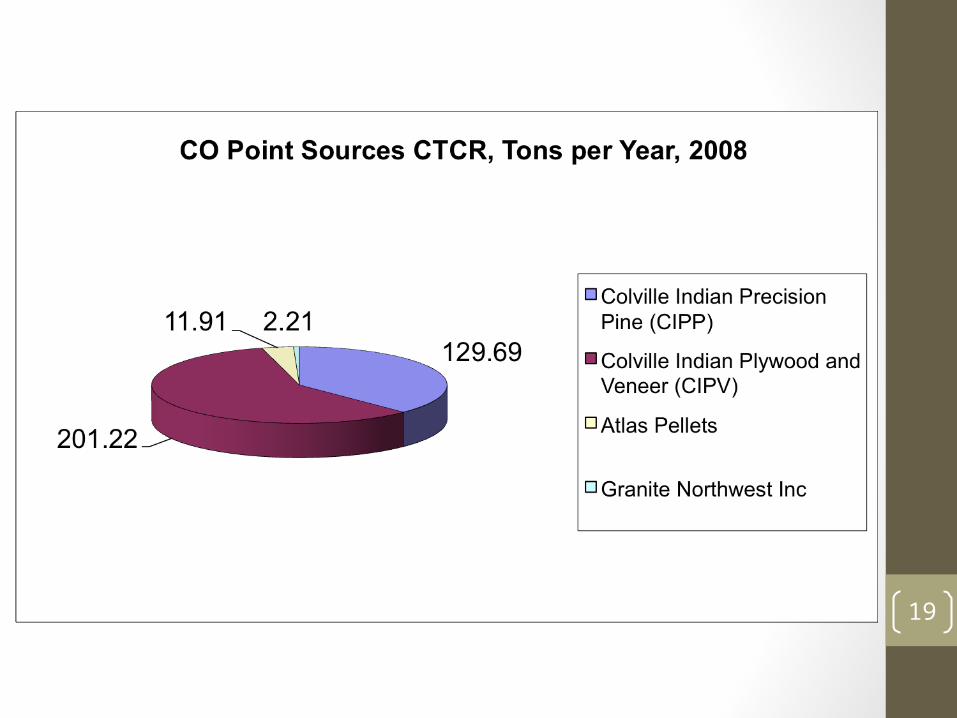
EI Results
Point Sources Criteria Pollutants Tons per Year
Facility CO NOX PM-PRI PM10-PriPM2.5-
Pri SO2 VOC Total
Colville Indian Precision Pine (CIPP) 129.69 60.34 246.32 96.31 38.39 3.09 36.24 610.38
Colville Indian Plywood and Veneer (CIPV) 201.22 73.73 208.84 122.75 52.41 8.42 36.31 703.68
Atlas Pellets 11.91 10.16 80.59 7.01 0.44 15.77 125.88
Granite Northwest Inc 2.21 0.94 0.56 0.46 0.05 0.99 0.54 5.75
Coulee Dam Concrete 1.47 0.17 1.64
Total 345.03 145.17 537.78 226.7 90.85 12.94 88.86 1447.33 17

18
19

Conclusion
•QAPP or IPP important•State the EI strategy •Present results simply•Write for your audience•Look forward to the next EI
20


