29
First published in June 1999 National Pollutant Inventory Emission Estimation Technique Manual for Synthetic Ammonia Manufacturing
| Date post: | 03-Jun-2018 |
| Category: |
Documents |
| Upload: | george-van-bommel |
| View: | 221 times |
| Download: | 0 times |
8/12/2019 Emissions NH3 Plant Calculations
http://slidepdf.com/reader/full/emissions-nh3-plant-calculations 1/29
First published in June 1999
National Pollutant Inventory
Emission EstimationTechnique Manual
for
Synthetic AmmoniaManufacturing
8/12/2019 Emissions NH3 Plant Calculations
http://slidepdf.com/reader/full/emissions-nh3-plant-calculations 2/29
Synthetic Ammonia Manufacturing i
EMISSION ESTIMATION TECHNIQUES
FOR
SYNTHETIC AMMONIA MANUFACTURING
TABLE OF CONTENTS
1.0 INTRODUCTION ...................................................................................................... 1
2.0 PROCESSES AND EMISSIONS ............................................................................. 2
2.1 Process Description ....................................................................................... 22.1.1 Natural Gas Desulfurisation ................................................................. 42.1.2 Catalytic Steam Reforming.................................................................... 42.1.3 Carbon Monoxide Shift .......................................................................... 42.1.4 Carbon Dioxide Removal....................................................................... 52.1.5 Methanation............................................................................................. 52.1.6 Ammonia Synthesis................................................................................ 5
2.2 Emissions to Air............................................................................................. 62.3 Emissions to Water ........................................................................................ 72.4 Emissions to Land.......................................................................................... 7
3.0 EMISSION ESTIMATION TECHNIQUES........................................................... 8
3.1 Using Sampling or Direct Measurement .................................................. 103.1.1 For Emissions to Atmosphere ............................................................... 103.1.2 For Emissions to Water .......................................................................... 14
3.2 Using Mass Balance....................................................................................... 15
3.3 Using Emission Factors................................................................................. 173.4 Using Engineering and Site-Specific Equations...................................... 19
3.4.1 Fugitive Emissions.................................................................................. 19
4.0 EMISSION ESTIMATION TECHNIQUES: ACCEPTABLE RELIABILITY ANDUNCERTAINTY.......................................................................................................... 24
4.1 Direct Measurement...................................................................................... 244.2 Mass Balance .................................................................................................. 244.3 Engineering Calculations............................................................................. 254.4 Emission Factors ............................................................................................ 25
5.0 REFERENCES.............................................................................................................. 26
8/12/2019 Emissions NH3 Plant Calculations
http://slidepdf.com/reader/full/emissions-nh3-plant-calculations 3/29
Synthetic Ammonia Manufacturing ii
SYNTHETIC AMMONIA MANUFACTURING
LIST OF FIGURES AND TABLES
Figure 1 - General Flow Diagram of a Typical Ammonia Plant.............................. 3
Table 1 - Common Emissions of NPI-Listed Substances from Synthetic AmmoniaManufacturing Processes ................................................................................... 6
2 - List of Variables and Symbols..................................................................... 9
3 - Stack Sample Test Results............................................................................ 11
4 - Emission Factors for Volatile Organic Compounds (VOCs) fromSynthetic Ammonia Manufacturing................................................................ 18
5 - Emission Factors for Non-Organics from Synthetic AmmoniaManufacturing...................................................................................................... 18
6 - Uncontrolled Carbon Monoxide (CO), Total Volatile OrganicCompounds (VOCs), Sulfur Dioxide (SO2) and Ammonia (NH3)Emission Factors for a Typical Ammonia Plant............................................. 18
7 - Correlation Equations, Default Zero Emission Rates, and PeggedEmission Rates for Estimating Fugitive Emissions....................................... 21
8 - Emission Factors for Equipment Leaks...................................................... 23
8/12/2019 Emissions NH3 Plant Calculations
http://slidepdf.com/reader/full/emissions-nh3-plant-calculations 4/29
Synthetic Ammonia Manufacturing 1
1.0 Introduction
The purpose of all Emission Estimation Technique (EET) Manuals in this series is to assistAustralian manufacturing, industrial and service facilities to report emissions of listedsubstances to the National Pollutant Inventory (NPI). This Manual describes theprocedures and recommended approaches for estimating emissions from facilitiesengaged in synthetic ammonia manufacturing.
EET MANUAL: Synthetic Ammonia Manufacturing
HANDBOOK: Fertiliser Manufacturing
ANZSIC CODES : 2531
This Manual was drafted by the NPI Unit of the Queensland Department of Environment
and Heritage on behalf of the Commonwealth Government. It has been developedthrough a process of national consultation involving State and Territory environmentalauthorities and key industry stakeholders.
8/12/2019 Emissions NH3 Plant Calculations
http://slidepdf.com/reader/full/emissions-nh3-plant-calculations 5/29
Synthetic Ammonia Manufacturing 2
2.0 Processes and Emissions
The following section presents a brief description of the synthetic ammonia manufacturingindustry and identifies likely sources of emissions of NPI-listed substances.
2.1 Process Description
Synthetic ammonia (NH3) refers to ammonia that has been synthesised from natural gas.Natural gas molecules are reduced to carbon and hydrogen. The hydrogen is thenpurified and reacted with nitrogen to produce ammonia. The great majority of theammonia produced in Australia is used as agricultural fertiliser, either directly asammonia or indirectly after synthesis as urea, ammonium nitrate, and mono-ammoniumor di-ammonium phosphates. The remainder is used as raw material in the manufactureof polymeric resins, explosives, nitric acid, and other products.
Synthetic ammonia plants are located in Brisbane, Newcastle, Geelong, and Kwinana withplans for a further plant at Yarwun near Gladstone. Total production in Australia isapproaching 750 000 tonnes per annum.
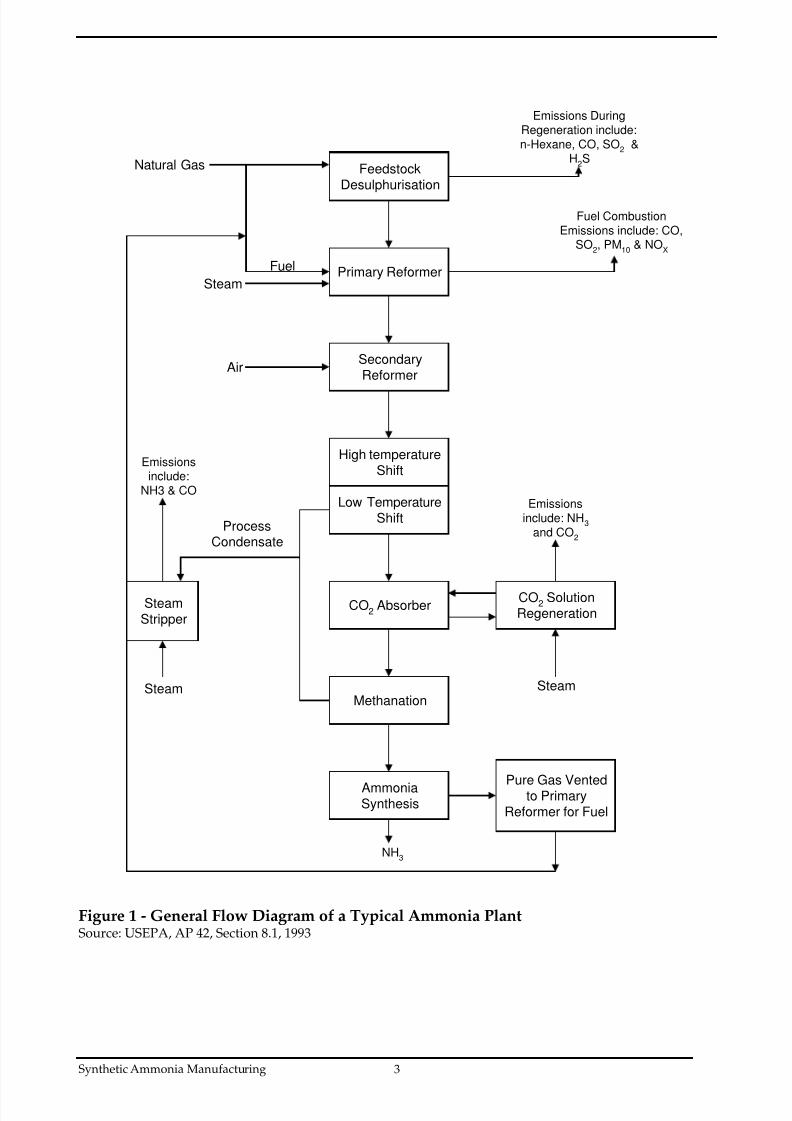
Anhydrous ammonia is synthesised by reacting hydrogen with nitrogen at a molar ratioapproximately of 3 to 1, then compressing the gas and cooling it to -33oC. Nitrogen isobtained from the air, while hydrogen is obtained from either the catalytic steamreforming of natural gas (methane [CH4] or naphtha), or the electrolysis of brine atchlorine plants. Almost all synthetic ammonia manufacturing uses the catalytic steam
method. Figure 1 shows a general process flow diagram of a typical ammonia plant. Aseach synthetic ammonia facility in Australia is different from any other facility, you areurged to develop a flow diagram for your particular operations that details the input of materials and listed substances and the waste sources and emissions resulting from theoperation of each process.
There are six process steps that are required to produce synthetic ammonia using thecatalytic steam reforming method:
(1) natural gas desulfurisation;
(2) catalytic steam reforming;(3) carbon monoxide (CO) shift;
(4) carbon dioxide (CO2) removal;(5) methanation; and(6) ammonia synthesis.
The first, third, fourth, and fifth steps, remove impurities such as sulfur, CO, CO2 andwater (H2O) from the feedstock, hydrogen, and from the synthesis gas streams. In thesecond step, hydrogen (H2) is manufactured and nitrogen (air) is introduced. The sixthstep produces anhydrous ammonia from the synthetic gas. While most ammonia plantsuse this basic process detail such as operating pressures, temperature, and quantities of feedstock vary from plant to plant, some plants add nitrogen (N2) in the final stages and H2
in the initial stages.
8/12/2019 Emissions NH3 Plant Calculations
http://slidepdf.com/reader/full/emissions-nh3-plant-calculations 6/29
Synthetic Ammonia Manufacturing 3
FeedstockDesulphurisation
Primary Reformer
SecondaryReformer
High temperatureShift
Low TemperatureShift
CO2 Absorber
Methanation
AmmoniaSynthesis
CO2 Solution
RegenerationSteam
Stripper
Pure Gas Ventedto PrimaryReformer for Fuel
Emissions DuringRegeneration include:n-Hexane, CO, SO
2 &
H2S
Fuel CombustionEmissions include: CO,
SO2, PM
10 & NO
X
Emissionsinclude: NH
3
and CO2
SteamSteam
ProcessCondensate
Emissionsinclude:
NH3 & CO
Air
Steam
Fuel
Natural Gas
NH3
Figure 1 - General Flow Diagram of a Typical Ammonia PlantSource: USEPA, AP 42, Section 8.1, 1993
8/12/2019 Emissions NH3 Plant Calculations
http://slidepdf.com/reader/full/emissions-nh3-plant-calculations 7/29
Synthetic Ammonia Manufacturing 4
2.1.1 Natural Gas Desulfurisation
In this step, the sulfur content (as hydrogen sulfide [H2S]) in natural gas is reduced to
below 280 micrograms per cubic metre (µg/m3) to prevent poisoning of the nickel catalystin the primary reformer. Desulfurisation can be accomplished by using either activatedcarbon or zinc oxide. Heavy hydrocarbons can decrease the effectiveness of an activatedcarbon bed. This carbon bed also has another disadvantage in that it cannot removecarbonyl sulfide. Regeneration of carbon is accomplished by passing superheated steamthrough the carbon bed.
A zinc oxide bed offers several advantages over the activated carbon bed. Steamregeneration to use as energy is not required when using a zinc oxide bed. No airemissions are created by the zinc oxide bed, and the higher molecular weighthydrocarbons are not removed. Therefore, the heating value of the natural gas is notreduced.
2.1.2 Catalytic Steam Reforming
Natural gas leaving the desulfurisation tank is mixed with process steam and preheated toapproximately 540 oC. The mixture of steam and gas enters the primary reformer (naturalgas fired or oil fired) tubes, which are filled with a nickel-based reforming catalyst.Approximately 70 percent of the CH4 is converted to hydrogen and CO2. An additionalamount of CH4 is converted to CO. This process gas is then sent to the secondary reformer,where it is mixed with compressed air that has been preheated to about 540 oC. Sufficientair is added to produce a final synthesis gas having a hydrogen-to-nitrogen mole ratio of
approximately 3 to 1. The gas leaving the secondary reformer is then cooled to 360o
C in awaste heat boiler.
2.1.3 Carbon Monoxide Shift
After cooling, the secondary reformer effluent gas enters a high temperature CO shiftconverter that is filled with chromium oxide initiator and iron oxide catalyst. Thefollowing reaction takes place in the carbon monoxide converter:
CO + H2O → CO2 + H2
The exit gas is then cooled in a heat exchanger. In some plants, the gas is passed through a bed of zinc oxide to remove any residual sulfur contaminants that would poison the lowertemperature shift catalyst. In other plants, excess low-temperature shift catalyst is addedto ensure that the unit will operate as expected. The low-temperature shift converter isfilled with a copper oxide/zinc oxide catalyst. Final shift gas from this converter is cooledfrom approximately 210 to 110oC and enters the bottom of the carbon dioxide absorptionsystem. Unreacted steam is condensed and separated from the gas in a knockout drum.This condensed steam (process condensate) contains ammonium carbonate([NH4)2CO3.H2O]) from the high temperature shift converter, methanol (CH3OH) from the
low-temperature shift converter, and small amounts of sodium, iron, copper, zinc,aluminium, and calcium.
8/12/2019 Emissions NH3 Plant Calculations
http://slidepdf.com/reader/full/emissions-nh3-plant-calculations 8/29
Synthetic Ammonia Manufacturing 5
Process condensate is sent to the stripper to remove volatile gases such as ammonia,methanol, and carbon dioxide. Trace metals remaining in the process condensate can beremoved by the ion exchange unit.
2.1.4 Carbon Dioxide Removal
In this step, CO2 in the final shift gas is removed. CO2 removal can be done by using twomethods: amine scrubbing and hot potassium scrubbing. Most ammonia plants use amineto aid in removing CO2. The CO2 gas is passed upward through an adsorption towercountercurrent to a 15 to 30 percent solution of amine in water fortified with effectivecorrosion inhibitors. After absorbing the CO2, the amine solution is preheated andregenerated (carbon dioxide regenerator) in a reactivating tower. This reactivating towerremoves CO2 by steam stripping and then by heating. The CO2 is either vented to theatmosphere or used for chemical feedstock in other parts of the complex. The regeneratedamine is pumped back to the absorber tower after being cooled in a heat exchanger andsolution cooler.
2.1.5 Methanation
Residual CO and CO2 in the synthesis gas is removed by catalytic methanation, which isconducted over a nickel catalyst at temperatures of 400 to 600 oC and pressures up to 3 000kilopascals (kPa) according to the following reactions:
CO + 3H2 → CH4 + H2O
CO2 + H2 → CO + H2O
CO2 + 4H2 → CH4 + 2H2O
Exit gas from the methanator, which has approximately a 3:1 mole ratio of hydrogen andnitrogen, is then cooled to 38 oC or lower.
2.1.6 Ammonia Synthesis
In the synthesis step, the synthesis gas from the methanator is compressed at pressuresranging from 13 800 to 34 500 kPa, mixed with recycled synthesis gas, and cooled to 0 oC,
or lower. Condensed ammonia is separated from the unconverted synthesis gas in aliquid-vapour separator and sent to a letdown separator. The unconverted synthesis iscompressed and preheated to 180 oC before entering the synthesis converter that containsiron oxide catalyst. Ammonia from the exit gas is condensed and separated, then sentdown to the letdown separator. A small portion of the overhead gas is purged to preventthe buildup of inert gases, such as argon, in the circulating gas system.
Ammonia in the letdown separator is flashed to 100 kPa at -33 oC to remove impuritiesfrom the liquid. The flash vapour is condensed in the letdown chiller where anhydrousammonia is drawn off and stored at low temperature.
8/12/2019 Emissions NH3 Plant Calculations
http://slidepdf.com/reader/full/emissions-nh3-plant-calculations 9/29
Synthetic Ammonia Manufacturing 6
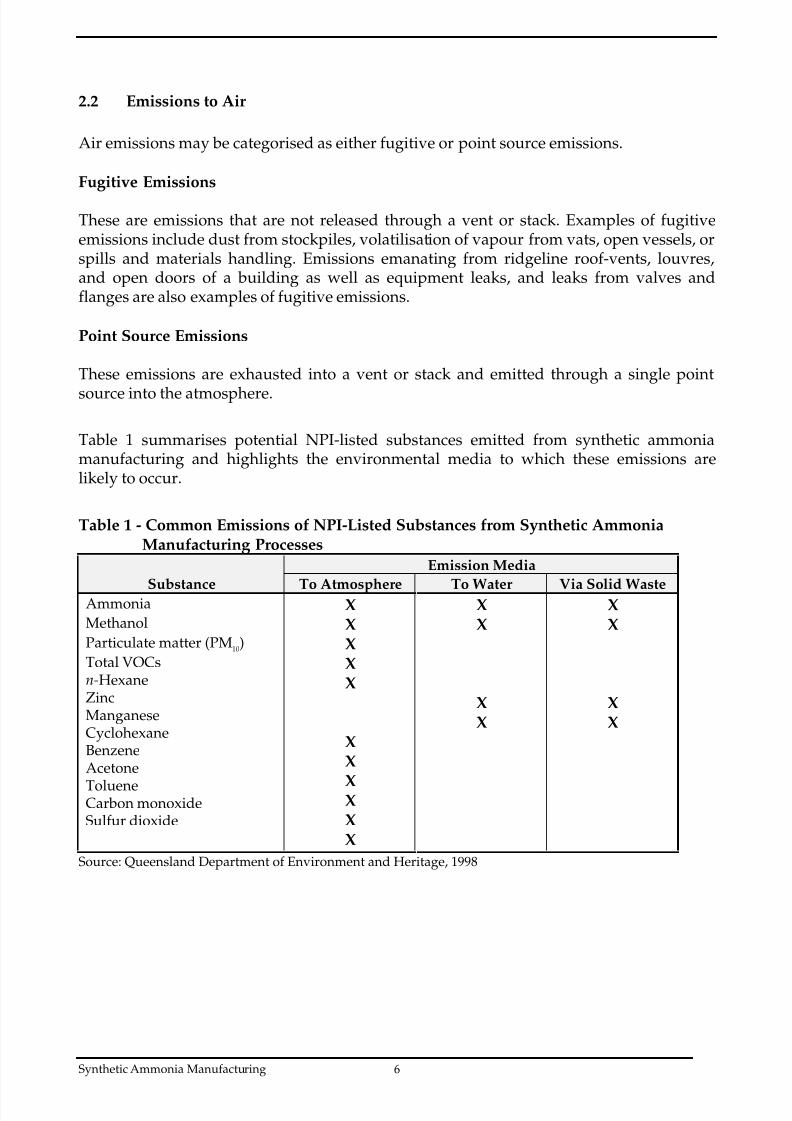
2.2 Emissions to Air
Air emissions may be categorised as either fugitive or point source emissions.
Fugitive Emissions
These are emissions that are not released through a vent or stack. Examples of fugitiveemissions include dust from stockpiles, volatilisation of vapour from vats, open vessels, orspills and materials handling. Emissions emanating from ridgeline roof-vents, louvres,and open doors of a building as well as equipment leaks, and leaks from valves andflanges are also examples of fugitive emissions.
Point Source Emissions
These emissions are exhausted into a vent or stack and emitted through a single point
source into the atmosphere.
Table 1 summarises potential NPI-listed substances emitted from synthetic ammoniamanufacturing and highlights the environmental media to which these emissions arelikely to occur.
Table 1 - Common Emissions of NPI-Listed Substances from Synthetic Ammonia Manufacturing Processes
Emission Media
Substance To Atmosphere To Water Via Solid WasteAmmonia X X XMethanol X X XParticulate matter (PM
10) X
Total VOCsn-HexaneZincManganeseCyclohexaneBenzeneAcetone
TolueneCarbon monoxideSulfur dioxide
XX
XX
XXXX
XX
XX
Source: Queensland Department of Environment and Heritage, 1998
8/12/2019 Emissions NH3 Plant Calculations
http://slidepdf.com/reader/full/emissions-nh3-plant-calculations 10/29
Synthetic Ammonia Manufacturing 7
2.3 Emissions to Water
Emissions of substances to water can be categorised as discharges to:
• Surface waters (eg. lakes, rivers, dams, and estuaries);
• Coastal or marine waters; and
• Stormwater. Because of the significant environmental hazards posed by emitting toxic substances towater, most facilities emitting NPI-listed substances to waterways are required by theirrelevant State or Territory environment agency to closely monitor and measure theseemissions. This existing sampling data can be used to calculate annual emissions. If no wastewater monitoring data exists, emissions to process water can be calculated
based on a mass balance calculation or by using emission factors. The discharge of listed
substances to a sewer or tailings dam does not require reporting to the NPI. However,leakage and other emissions (including dust) from a tailings storage facility are reportable.(See also Section Three of The NPI Guide.) Table 1 outlines listed substances that may beemitted to water from ammonia production. 2.4 Emissions to Land
Emissions of substances to land on-site include solid wastes, slurries, and sediments.Emissions arising from spills, leaks, and storage and distribution of materials containing
listed substances may also occur to land. These emission sources can be broadlycategorised as: • surface impoundments of liquids and slurries; and
• unintentional leaks and spills.
8/12/2019 Emissions NH3 Plant Calculations
http://slidepdf.com/reader/full/emissions-nh3-plant-calculations 11/29
Synthetic Ammonia Manufacturing 8
3.0 Emission Estimation Techniques
This section presents equations and examples of calculations for estimating emissions of particulate matter (PM10), speciated organics (formaldehyde and methanol), and inorganicsubstances (ammonia, total nitrogen) from synthetic ammonia manufacturing processes. Estimates of emissions of NPI listed substances to air, water and land should be reportedfor each substance that triggers a threshold. The reporting list and detailed information onthresholds are contained in The NPI Guide at the front of this Handbook. In general, there are four types of emission estimation techniques (EETs) that may be usedto estimate emissions from your facility. The four types described in the NPI Guide are: • sampling or direct measurement;
• mass balance;
• fuel analysis or other engineering calculations; and
• emission factors.
Select the EET (or mix of EETs) that is most appropriate for your purposes. For example,you might choose to use a mass balance to best estimate fugitive losses from pumps andvents, direct measurement for stack and pipe emissions, and emission factors whenestimating losses from storage tanks and stockpiles.
If you estimate your emission by using any of these EETs, your data will be displayed onthe NPI database as being of ‘acceptable reliability’. Similarly, if your relevant
environmental authority has approved the use of emission estimation techniques that arenot outlined in this Handbook, your data will also be displayed as being of ‘acceptablereliability’.
This Manual seeks to provide the most effective emission estimation techniques for theNPI substances relevant to this industry. However, the absence of an EET for a substancein this Manual does not necessarily imply that an emission should not reported to the NPI.The obligation to report on all relevant emissions remains if reporting thresholds have
been exceeded.
You are able to use emission estimation techniques that are not outlined in thisdocument. You must, however, seek the consent of your relevant environmentalauthority. For example, if your company has developed site specific emission factors,you may use these if approved by your relevant environmental authority.
In general, direct measurement is the most accurate method for characterising emissionsand, where available, such data should be used in preference to other EETs presented inthis Manual. However, additional direct measurement is not required under the NPIMeasure. Direct monitoring may be undertaken as an element of other EETs.
You should note that the EETs presented in this Manual relate principally to averageprocess emissions. Emissions resulting from non-routine events are rarely discussed inthe literature, and there is a general lack of EETs for such events. However, it is important
8/12/2019 Emissions NH3 Plant Calculations
http://slidepdf.com/reader/full/emissions-nh3-plant-calculations 12/29
Synthetic Ammonia Manufacturing 9
to recognise that emissions resulting from significant operating excursions and/oraccidental situations (eg. spills) will also need to be estimated. Emissions to land, air andwater from spills must be estimated and added to process emissions when calculatingtotal emissions for reporting purposes. The emission resulting from a spill is the netemission, ie. the quantity of the NPI reportable substance spilled, less the quantityrecovered or consumed during clean up operations
The usage of each of the substances listed as Category 1 and 1a under the NPI must beestimated to determine whether the 10 tonnes (or 25 tonnes for VOCs) reporting thresholdis exceeded. If the threshold is exceeded, emissions of these Category 1 and 1a substancesmust be reported for all operations/processes relating to the facility, even if the actualemissions of the substances are very low or zero.
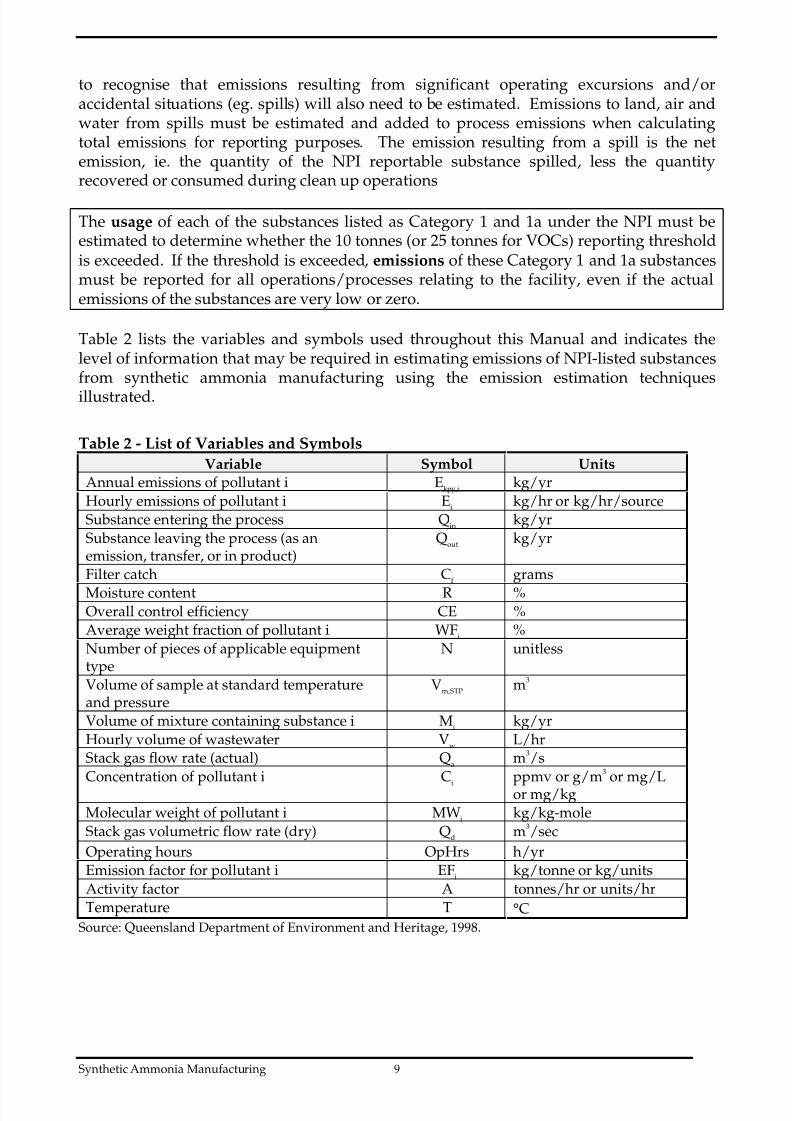
Table 2 lists the variables and symbols used throughout this Manual and indicates thelevel of information that may be required in estimating emissions of NPI-listed substancesfrom synthetic ammonia manufacturing using the emission estimation techniques
illustrated.
Table 2 - List of Variables and Symbols
Variable Symbol Units
Annual emissions of pollutant i Ekpy,i
kg/yr
Hourly emissions of pollutant i Ei
kg/hr or kg/hr/sourceSubstance entering the process Q
inkg/yr
Substance leaving the process (as anemission, transfer, or in product)
Qout
kg/yr
Filter catch Cf
grams
Moisture content R %Overall control efficiency CE %Average weight fraction of pollutant i WF
i%
Number of pieces of applicable equipmenttype
N unitless
Volume of sample at standard temperatureand pressure
Vm,STP
m3
Volume of mixture containing substance i Mi
kg/yr
Hourly volume of wastewater Vw
L/hrStack gas flow rate (actual) Q
am3/s
Concentration of pollutant i Ci
ppmv or g/m3 or mg/Lor mg/kg
Molecular weight of pollutant i MWi
kg/kg-mole
Stack gas volumetric flow rate (dry) Qd
m3/sec
Operating hours OpHrs h/yrEmission factor for pollutant i EF
ikg/tonne or kg/units
Activity factor A tonnes/hr or units/hrTemperature T °C
Source: Queensland Department of Environment and Heritage, 1998.
8/12/2019 Emissions NH3 Plant Calculations
http://slidepdf.com/reader/full/emissions-nh3-plant-calculations 13/29
Synthetic Ammonia Manufacturing 10
3.1 Using Sampling or Direct Measurement
3.1.1 For Emissions to Atmosphere
Parti culat e M att er (PM 10 ) Emissions
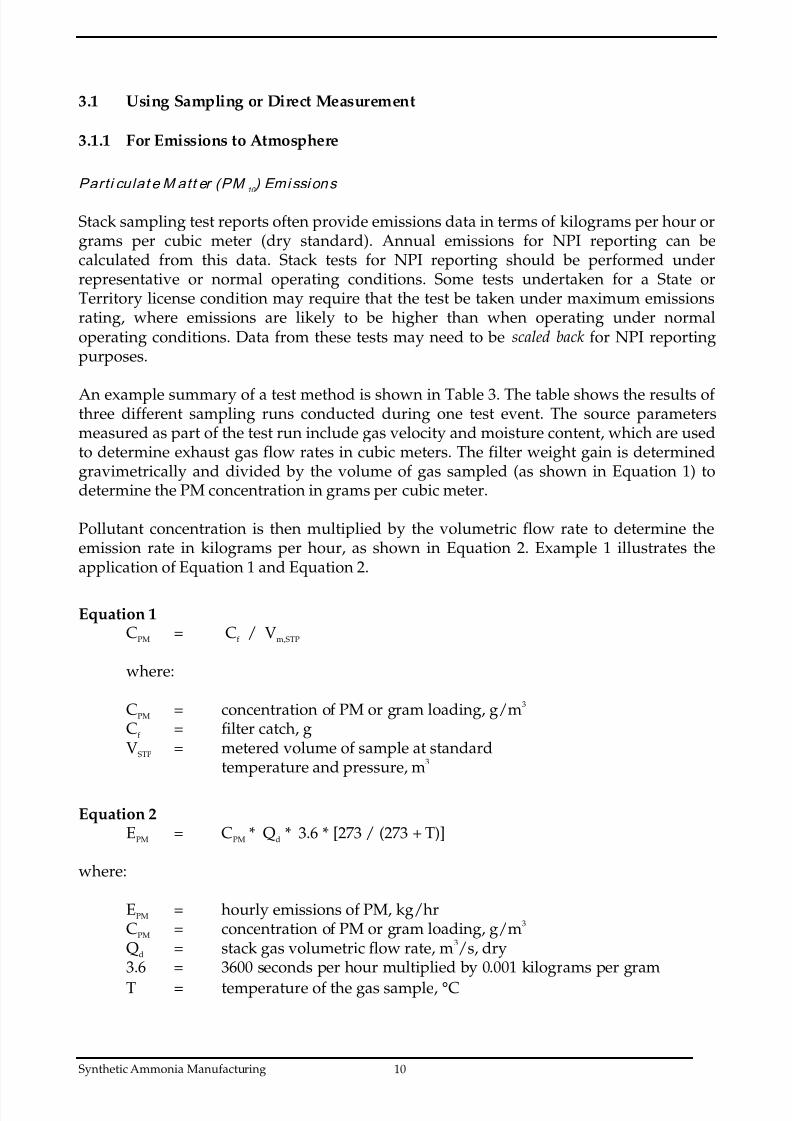
Stack sampling test reports often provide emissions data in terms of kilograms per hour orgrams per cubic meter (dry standard). Annual emissions for NPI reporting can becalculated from this data. Stack tests for NPI reporting should be performed underrepresentative or normal operating conditions. Some tests undertaken for a State orTerritory license condition may require that the test be taken under maximum emissionsrating, where emissions are likely to be higher than when operating under normaloperating conditions. Data from these tests may need to be scaled back for NPI reportingpurposes.
An example summary of a test method is shown in Table 3. The table shows the results of three different sampling runs conducted during one test event. The source parametersmeasured as part of the test run include gas velocity and moisture content, which are usedto determine exhaust gas flow rates in cubic meters. The filter weight gain is determinedgravimetrically and divided by the volume of gas sampled (as shown in Equation 1) todetermine the PM concentration in grams per cubic meter.
Pollutant concentration is then multiplied by the volumetric flow rate to determine theemission rate in kilograms per hour, as shown in Equation 2. Example 1 illustrates theapplication of Equation 1 and Equation 2.
Equation 1CPM = Cf / Vm,STP
where:
CPM = concentration of PM or gram loading, g/m3
Cf = filter catch, gVSTP = metered volume of sample at standard
temperature and pressure, m3
Equation 2EPM = CPM * Qd * 3.6 * [273 / (273 + T)]
where:
EPM = hourly emissions of PM, kg/hrCPM = concentration of PM or gram loading, g/m3
Qd = stack gas volumetric flow rate, m3/s, dry3.6 = 3600 seconds per hour multiplied by 0.001 kilograms per gram
T = temperature of the gas sample, °C
8/12/2019 Emissions NH3 Plant Calculations
http://slidepdf.com/reader/full/emissions-nh3-plant-calculations 14/29
Synthetic Ammonia Manufacturing 11
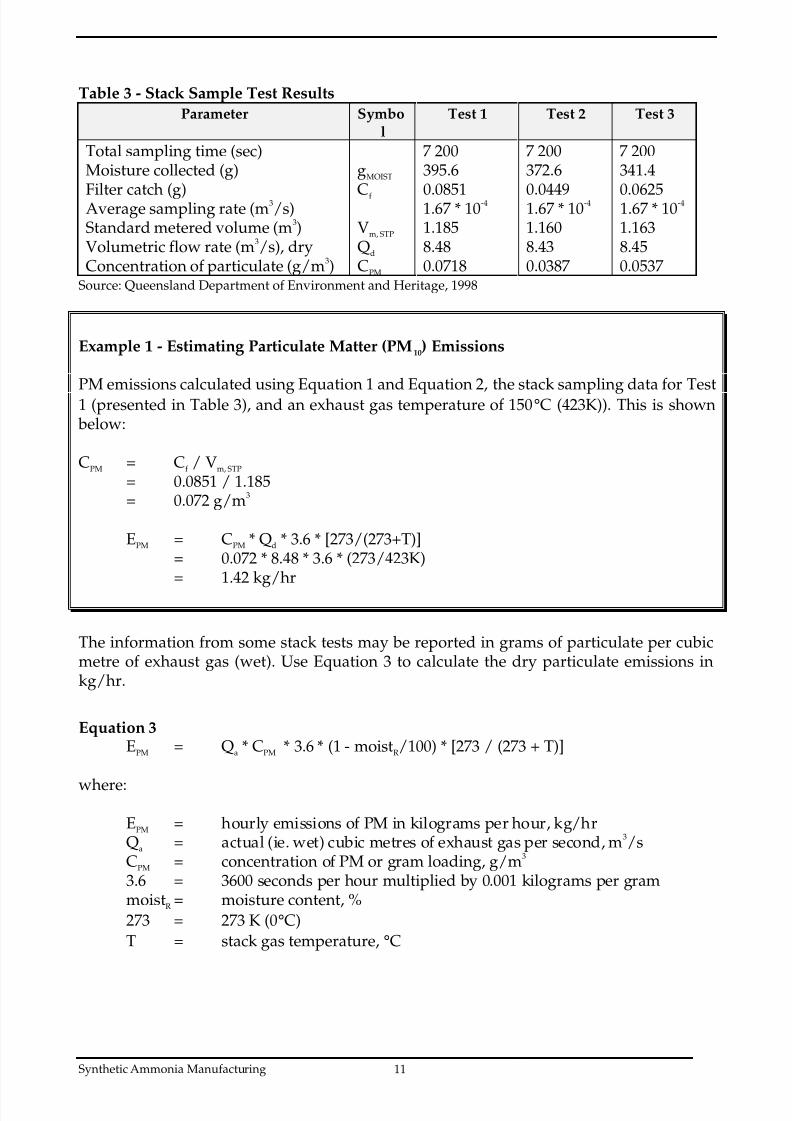
Table 3 - Stack Sample Test Results
Parameter Symbol
Test 1 Test 2 Test 3
Total sampling time (sec) 7 200 7 200 7 200Moisture collected (g) gMOIST 395.6 372.6 341.4
Filter catch (g) Cf 0.0851 0.0449 0.0625Average sampling rate (m3/s) 1.67 * 10-4 1.67 * 10-4 1.67 * 10-4
Standard metered volume (m3) Vm, STP 1.185 1.160 1.163Volumetric flow rate (m3/s), dry Qd 8.48 8.43 8.45Concentration of particulate (g/m3) CPM 0.0718 0.0387 0.0537
Source: Queensland Department of Environment and Heritage, 1998
Example 1 - Estimating Particulate Matter (PM10) Emissions
PM emissions calculated using Equation 1 and Equation 2, the stack sampling data for Test1 (presented in Table 3), and an exhaust gas temperature of 150°C (423K)). This is shown below:
CPM = Cf / Vm, STP
= 0.0851 / 1.185= 0.072 g/m3
EPM = CPM * Qd * 3.6 * [273/(273+T)]= 0.072 * 8.48 * 3.6 * (273/423K)= 1.42 kg/hr
The information from some stack tests may be reported in grams of particulate per cubicmetre of exhaust gas (wet). Use Equation 3 to calculate the dry particulate emissions inkg/hr.
Equation 3EPM = Qa * CPM * 3.6 * (1 - moistR/100) * [273 / (273 + T)]
where:
EPM = hourly emissions of PM in kilograms per hour, kg/hrQa = actual (ie. wet) cubic metres of exhaust gas per second, m3/sCPM = concentration of PM or gram loading, g/m3
3.6 = 3600 seconds per hour multiplied by 0.001 kilograms per grammoistR = moisture content, %
273 = 273 K (0°C)
T = stack gas temperature, °C
8/12/2019 Emissions NH3 Plant Calculations
http://slidepdf.com/reader/full/emissions-nh3-plant-calculations 15/29
Synthetic Ammonia Manufacturing 12
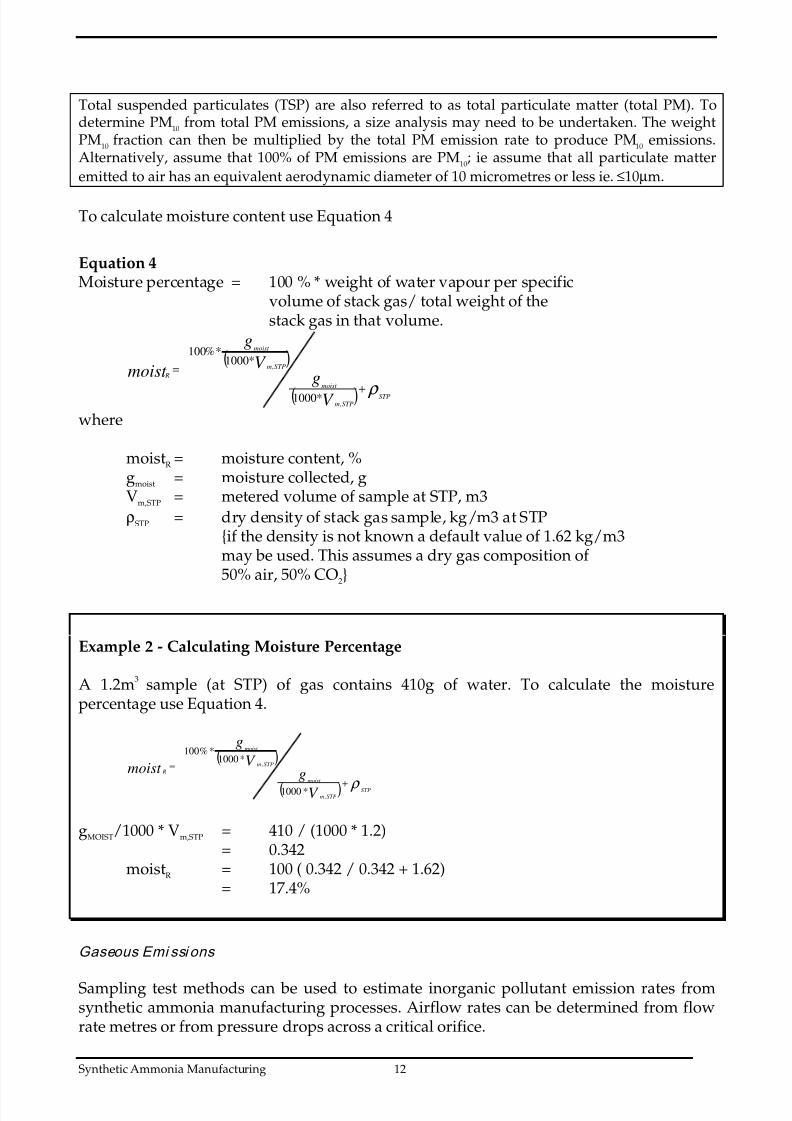
Total suspended particulates (TSP) are also referred to as total particulate matter (total PM). Todetermine PM
10 from total PM emissions, a size analysis may need to be undertaken. The weight
PM10
fraction can then be multiplied by the total PM emission rate to produce PM10
emissions.Alternatively, assume that 100% of PM emissions are PM
10; ie assume that all particulate matter
emitted to air has an equivalent aerodynamic diameter of 10 micrometres or less ie. ≤10µm.
To calculate moisture content use Equation 4
Equation 4Moisture percentage = 100 % * weight of water vapour per specific
volume of stack gas/ total weight of thestack gas in that volume.
( )
( ) ρ STPSTPm
moist
STPm
moist
R
V
gV
g
moist
+
=
,
,
*1000
*1000*%100
where
moistR = moisture content, %gmoist = moisture collected, gVm,STP = metered volume of sample at STP, m3
ρSTP = dry density of stack gas sample, kg/m3 at STP{if the density is not known a default value of 1.62 kg/m3may be used. This assumes a dry gas composition of 50% air, 50% CO2}
Example 2 - Calculating Moisture Percentage
A 1.2m3 sample (at STP) of gas contains 410g of water. To calculate the moisturepercentage use Equation 4.
( )
( ) ρ STPSTPm
moist
STPm
moist
R
V
gV
g
moist
+
=
,
,
*1000
*1000*%100
gMOIST/1000 * Vm,STP = 410 / (1000 * 1.2)= 0.342
moistR = 100 ( 0.342 / 0.342 + 1.62)= 17.4%
Gaseous Emi ssi ons
Sampling test methods can be used to estimate inorganic pollutant emission rates fromsynthetic ammonia manufacturing processes. Airflow rates can be determined from flowrate metres or from pressure drops across a critical orifice.
8/12/2019 Emissions NH3 Plant Calculations
http://slidepdf.com/reader/full/emissions-nh3-plant-calculations 16/29
Synthetic Ammonia Manufacturing 13
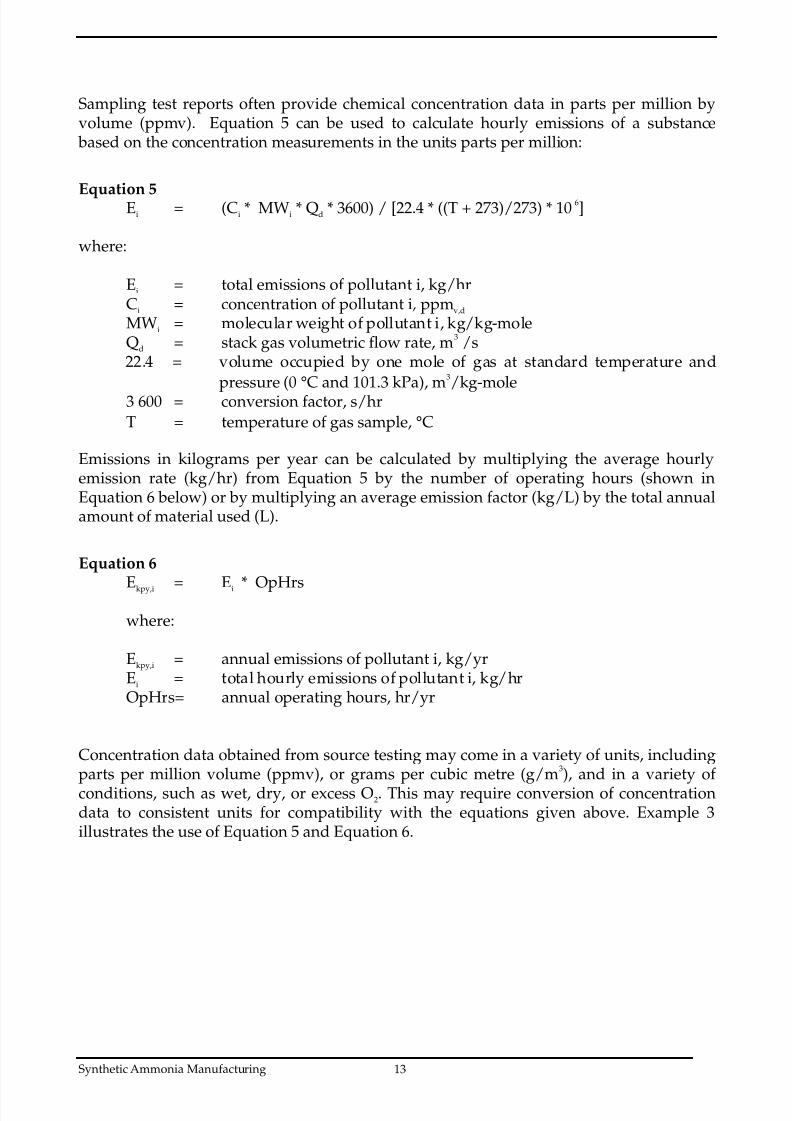
Sampling test reports often provide chemical concentration data in parts per million byvolume (ppmv). Equation 5 can be used to calculate hourly emissions of a substance
based on the concentration measurements in the units parts per million:
Equation 5Ei = (Ci * MWi * Qd * 3600) / [22.4 * ((T + 273)/273) * 10 6]
where:
Ei = total emissions of pollutant i, kg/hrCi = concentration of pollutant i, ppmv,d
MWi = molecular weight of pollutant i, kg/kg-moleQd = stack gas volumetric flow rate, m3 /s22.4 = volume occupied by one mole of gas at standard temperature and
pressure (0 °C and 101.3 kPa), m3/kg-mole3 600 = conversion factor, s/hr
T = temperature of gas sample, °C
Emissions in kilograms per year can be calculated by multiplying the average hourlyemission rate (kg/hr) from Equation 5 by the number of operating hours (shown inEquation 6 below) or by multiplying an average emission factor (kg/L) by the total annualamount of material used (L).
Equation 6
Ekpy,i = Ei * OpHrs
where:
Ekpy,i = annual emissions of pollutant i, kg/yrEi = total hourly emissions of pollutant i, kg/hrOpHrs= annual operating hours, hr/yr
Concentration data obtained from source testing may come in a variety of units, includingparts per million volume (ppmv), or grams per cubic metre (g/m3), and in a variety of conditions, such as wet, dry, or excess O2. This may require conversion of concentrationdata to consistent units for compatibility with the equations given above. Example 3illustrates the use of Equation 5 and Equation 6.
8/12/2019 Emissions NH3 Plant Calculations
http://slidepdf.com/reader/full/emissions-nh3-plant-calculations 17/29
Synthetic Ammonia Manufacturing 14
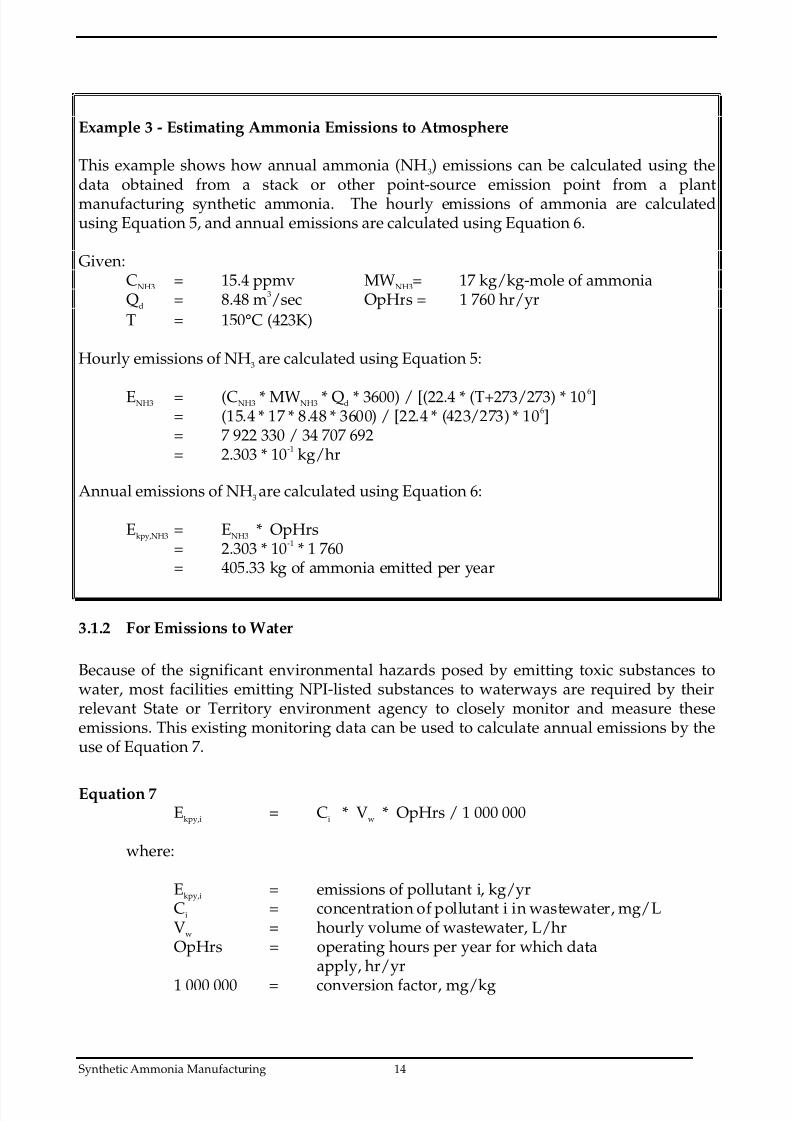
Example 3 - Estimating Ammonia Emissions to Atmosphere
This example shows how annual ammonia (NH3) emissions can be calculated using thedata obtained from a stack or other point-source emission point from a plantmanufacturing synthetic ammonia. The hourly emissions of ammonia are calculatedusing Equation 5, and annual emissions are calculated using Equation 6.
Given:CNH3 = 15.4 ppmv MWNH3= 17 kg/kg-mole of ammoniaQd = 8.48 m3/sec OpHrs = 1 760 hr/yr
T = 150°C (423K)
Hourly emissions of NH3 are calculated using Equation 5:
ENH3 = (CNH3 * MWNH3 * Qd * 3600) / [(22.4 * (T+273/273) * 106]= (15.4 * 17 * 8.48 * 3600) / [22.4 * (423/273) * 106]= 7 922 330 / 34 707 692= 2.303 * 10-1 kg/hr
Annual emissions of NH3 are calculated using Equation 6:
Ekpy,NH3 = ENH3 * OpHrs= 2.303 * 10-1 * 1 760= 405.33 kg of ammonia emitted per year
3.1.2 For Emissions to Water
Because of the significant environmental hazards posed by emitting toxic substances towater, most facilities emitting NPI-listed substances to waterways are required by theirrelevant State or Territory environment agency to closely monitor and measure theseemissions. This existing monitoring data can be used to calculate annual emissions by theuse of Equation 7.
Equation 7Ekpy,i = Ci * Vw * OpHrs / 1 000 000
where:
Ekpy,i = emissions of pollutant i, kg/yrCi = concentration of pollutant i in wastewater, mg/LVw = hourly volume of wastewater, L/hrOpHrs = operating hours per year for which data
apply, hr/yr
1 000 000 = conversion factor, mg/kg
8/12/2019 Emissions NH3 Plant Calculations
http://slidepdf.com/reader/full/emissions-nh3-plant-calculations 18/29
Synthetic Ammonia Manufacturing 15
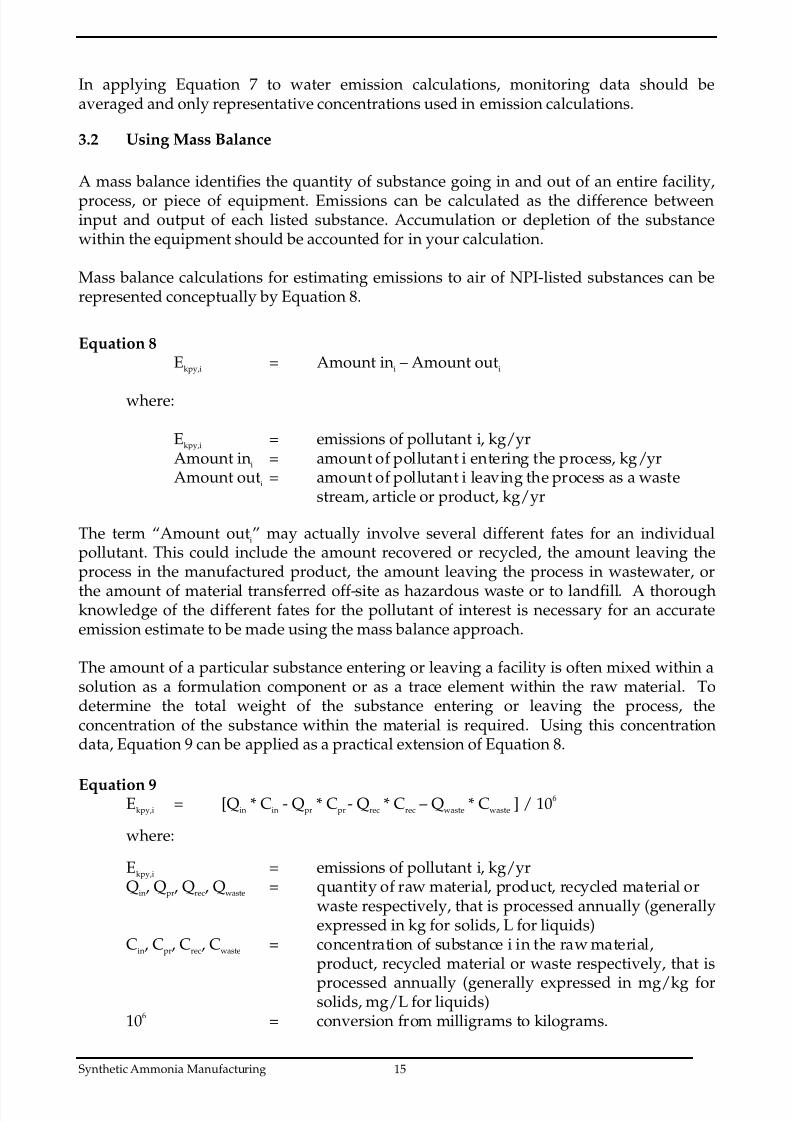
In applying Equation 7 to water emission calculations, monitoring data should beaveraged and only representative concentrations used in emission calculations.
3.2 Using Mass Balance
A mass balance identifies the quantity of substance going in and out of an entire facility,
process, or piece of equipment. Emissions can be calculated as the difference betweeninput and output of each listed substance. Accumulation or depletion of the substancewithin the equipment should be accounted for in your calculation.
Mass balance calculations for estimating emissions to air of NPI-listed substances can berepresented conceptually by Equation 8.
Equation 8Ekpy,i = Amount ini – Amount outi
where:
Ekpy,i = emissions of pollutant i, kg/yrAmount ini = amount of pollutant i entering the process, kg/yrAmount outi = amount of pollutant i leaving the process as a waste
stream, article or product, kg/yr
The term “Amount outi” may actually involve several different fates for an individualpollutant. This could include the amount recovered or recycled, the amount leaving theprocess in the manufactured product, the amount leaving the process in wastewater, or
the amount of material transferred off-site as hazardous waste or to landfill. A thoroughknowledge of the different fates for the pollutant of interest is necessary for an accurateemission estimate to be made using the mass balance approach.
The amount of a particular substance entering or leaving a facility is often mixed within asolution as a formulation component or as a trace element within the raw material. Todetermine the total weight of the substance entering or leaving the process, theconcentration of the substance within the material is required. Using this concentrationdata, Equation 9 can be applied as a practical extension of Equation 8.
Equation 9Ekpy,i = [Qin * Cin - Qpr * Cpr - Qrec * Crec – Qwaste * Cwaste ] / 106
where:
Ekpy,i = emissions of pollutant i, kg/yrQin, Qpr, Qrec, Qwaste = quantity of raw material, product, recycled material or
waste respectively, that is processed annually (generallyexpressed in kg for solids, L for liquids)
Cin, Cpr, Crec, Cwaste = concentration of substance i in the raw material,product, recycled material or waste respectively, that is
processed annually (generally expressed in mg/kg forsolids, mg/L for liquids)
106 = conversion from milligrams to kilograms.
8/12/2019 Emissions NH3 Plant Calculations
http://slidepdf.com/reader/full/emissions-nh3-plant-calculations 19/29
Synthetic Ammonia Manufacturing 16
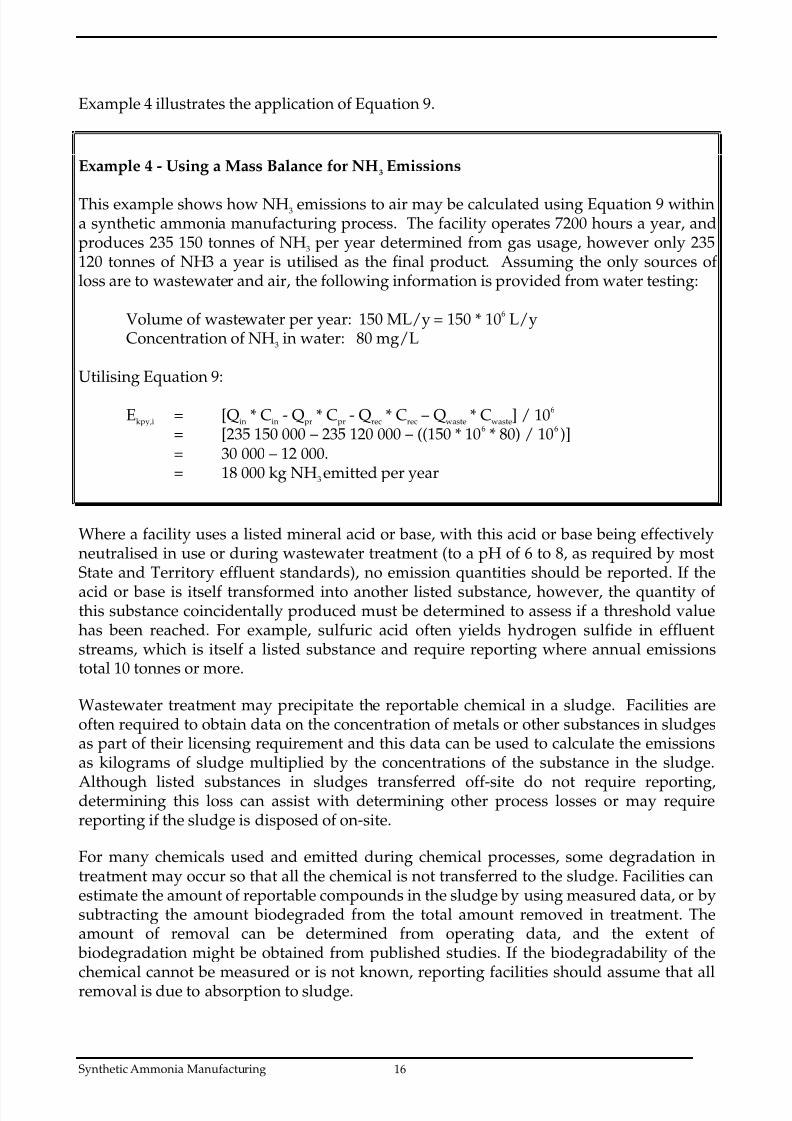
Example 4 illustrates the application of Equation 9.
Example 4 - Using a Mass Balance for NH3 Emissions
This example shows how NH3 emissions to air may be calculated using Equation 9 withina synthetic ammonia manufacturing process. The facility operates 7200 hours a year, andproduces 235 150 tonnes of NH3 per year determined from gas usage, however only 235120 tonnes of NH3 a year is utilised as the final product. Assuming the only sources of loss are to wastewater and air, the following information is provided from water testing:
Volume of wastewater per year: 150 ML/y = 150 * 106 L/yConcentration of NH3 in water: 80 mg/L
Utilising Equation 9:
Ekpy,i = [Qin * Cin - Qpr * Cpr - Qrec * Crec – Qwaste * Cwaste] / 106
= [235 150 000 – 235 120 000 – ((150 * 106 * 80) / 106 )]= 30 000 – 12 000.= 18 000 kg NH3 emitted per year
Where a facility uses a listed mineral acid or base, with this acid or base being effectivelyneutralised in use or during wastewater treatment (to a pH of 6 to 8, as required by mostState and Territory effluent standards), no emission quantities should be reported. If the
acid or base is itself transformed into another listed substance, however, the quantity of this substance coincidentally produced must be determined to assess if a threshold valuehas been reached. For example, sulfuric acid often yields hydrogen sulfide in effluentstreams, which is itself a listed substance and require reporting where annual emissionstotal 10 tonnes or more.
Wastewater treatment may precipitate the reportable chemical in a sludge. Facilities areoften required to obtain data on the concentration of metals or other substances in sludgesas part of their licensing requirement and this data can be used to calculate the emissionsas kilograms of sludge multiplied by the concentrations of the substance in the sludge.
Although listed substances in sludges transferred off-site do not require reporting,determining this loss can assist with determining other process losses or may requirereporting if the sludge is disposed of on-site.
For many chemicals used and emitted during chemical processes, some degradation intreatment may occur so that all the chemical is not transferred to the sludge. Facilities canestimate the amount of reportable compounds in the sludge by using measured data, or bysubtracting the amount biodegraded from the total amount removed in treatment. Theamount of removal can be determined from operating data, and the extent of
biodegradation might be obtained from published studies. If the biodegradability of thechemical cannot be measured or is not known, reporting facilities should assume that allremoval is due to absorption to sludge.
8/12/2019 Emissions NH3 Plant Calculations
http://slidepdf.com/reader/full/emissions-nh3-plant-calculations 20/29
Synthetic Ammonia Manufacturing 17
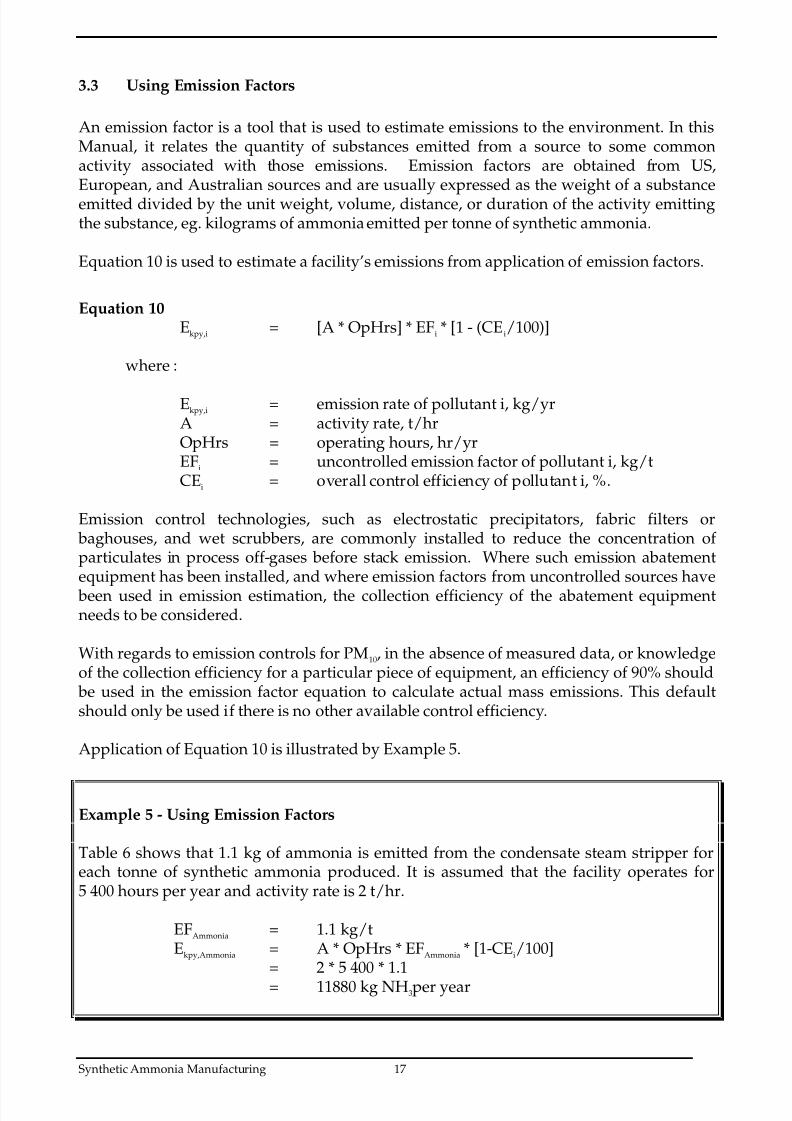
3.3 Using Emission Factors
An emission factor is a tool that is used to estimate emissions to the environment. In thisManual, it relates the quantity of substances emitted from a source to some commonactivity associated with those emissions. Emission factors are obtained from US,European, and Australian sources and are usually expressed as the weight of a substanceemitted divided by the unit weight, volume, distance, or duration of the activity emittingthe substance, eg. kilograms of ammonia emitted per tonne of synthetic ammonia.
Equation 10 is used to estimate a facility’s emissions from application of emission factors.
Equation 10 Ekpy,i = [A * OpHrs] * EFi * [1 - (CEi/100)]
where :
Ekpy,i = emission rate of pollutant i, kg/yr A = activity rate, t/hr OpHrs = operating hours, hr/yr EFi = uncontrolled emission factor of pollutant i, kg/t CEi = overall control efficiency of pollutant i, %.
Emission control technologies, such as electrostatic precipitators, fabric filters or baghouses, and wet scrubbers, are commonly installed to reduce the concentration of particulates in process off-gases before stack emission. Where such emission abatementequipment has been installed, and where emission factors from uncontrolled sources have
been used in emission estimation, the collection efficiency of the abatement equipmentneeds to be considered.
With regards to emission controls for PM10, in the absence of measured data, or knowledgeof the collection efficiency for a particular piece of equipment, an efficiency of 90% should
be used in the emission factor equation to calculate actual mass emissions. This defaultshould only be used if there is no other available control efficiency.
Application of Equation 10 is illustrated by Example 5.
Example 5 - Using Emission Factors
Table 6 shows that 1.1 kg of ammonia is emitted from the condensate steam stripper foreach tonne of synthetic ammonia produced. It is assumed that the facility operates for5 400 hours per year and activity rate is 2 t/hr.
EFAmmonia = 1.1 kg/tEkpy,Ammonia = A * OpHrs * EFAmmonia * [1-CEi/100]
= 2 * 5 400 * 1.1
= 11880 kg NH3per year
8/12/2019 Emissions NH3 Plant Calculations
http://slidepdf.com/reader/full/emissions-nh3-plant-calculations 21/29
Synthetic Ammonia Manufacturing 18
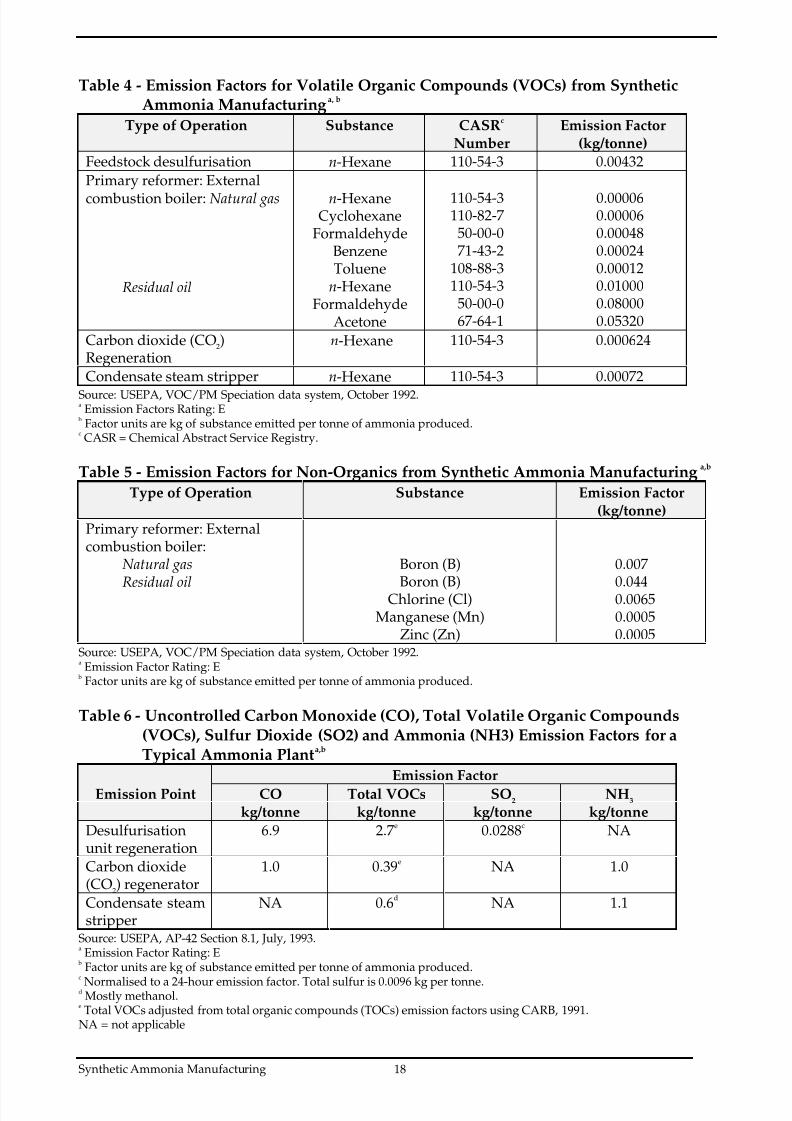
Table 4 - Emission Factors for Volatile Organic Compounds (VOCs) from Synthetic Ammonia Manufacturinga, b
Type of Operation Substance CASRc
NumberEmission Factor
(kg/tonne)
Feedstock desulfurisation n-Hexane 110-54-3 0.00432
Primary reformer: External
combustion boiler: Natural gas
Residual oil
n-HexaneCyclohexane
FormaldehydeBenzeneToluene
n-HexaneFormaldehyde
Acetone
110-54-3110-82-750-00-071-43-2
108-88-3110-54-350-00-067-64-1
0.000060.000060.000480.000240.000120.010000.080000.05320
Carbon dioxide (CO2)
Regeneration n-Hexane 110-54-3 0.000624
Condensate steam stripper n-Hexane 110-54-3 0.00072
Source: USEPA, VOC/PM Speciation data system, October 1992.a Emission Factors Rating: E
b Factor units are kg of substance emitted per tonne of ammonia produced.
c CASR = Chemical Abstract Service Registry.
Table 5 - Emission Factors for Non-Organics from Synthetic Ammonia Manufacturinga,b
Type of Operation Substance Emission Factor(kg/tonne)
Primary reformer: Externalcombustion boiler: Natural gas
Residual oil
Boron (B)
Boron (B)Chlorine (Cl)Manganese (Mn)
Zinc (Zn)
0.007
0.0440.00650.00050.0005
Source: USEPA, VOC/PM Speciation data system, October 1992.a Emission Factor Rating: E
b Factor units are kg of substance emitted per tonne of ammonia produced.
Table 6 - Uncontrolled Carbon Monoxide (CO), Total Volatile Organic Compounds (VOCs), Sulfur Dioxide (SO2) and Ammonia (NH3) Emission Factors for a Typical Ammonia Planta,b
Emission Factor
Emission Point CO Total VOCs SO2
NH3
kg/tonne kg/tonne kg/tonne kg/tonne
Desulfurisationunit regeneration
6.9 2.7e 0.0288c NA
Carbon dioxide(CO
2) regenerator
1.0 0.39e NA 1.0
Condensate steamstripper
NA 0.6d NA 1.1
Source: USEPA, AP-42 Section 8.1, July, 1993.a Emission Factor Rating: E
b Factor units are kg of substance emitted per tonne of ammonia produced.
c
Normalised to a 24-hour emission factor. Total sulfur is 0.0096 kg per tonne.d Mostly methanol.
e Total VOCs adjusted from total organic compounds (TOCs) emission factors using CARB, 1991.NA = not applicable
8/12/2019 Emissions NH3 Plant Calculations
http://slidepdf.com/reader/full/emissions-nh3-plant-calculations 22/29
Synthetic Ammonia Manufacturing 19
Emission factors developed from measurements for a specific process can sometimes beused to estimate emissions at other sites. Should a company have several processes of similar operation and size, and emissions are measured from one process source, anemission factor can be developed and applied to similar sources. You are required to havethe emission factor reviewed and approved by State or Territory environment agencies
prior to its use for NPI estimations.
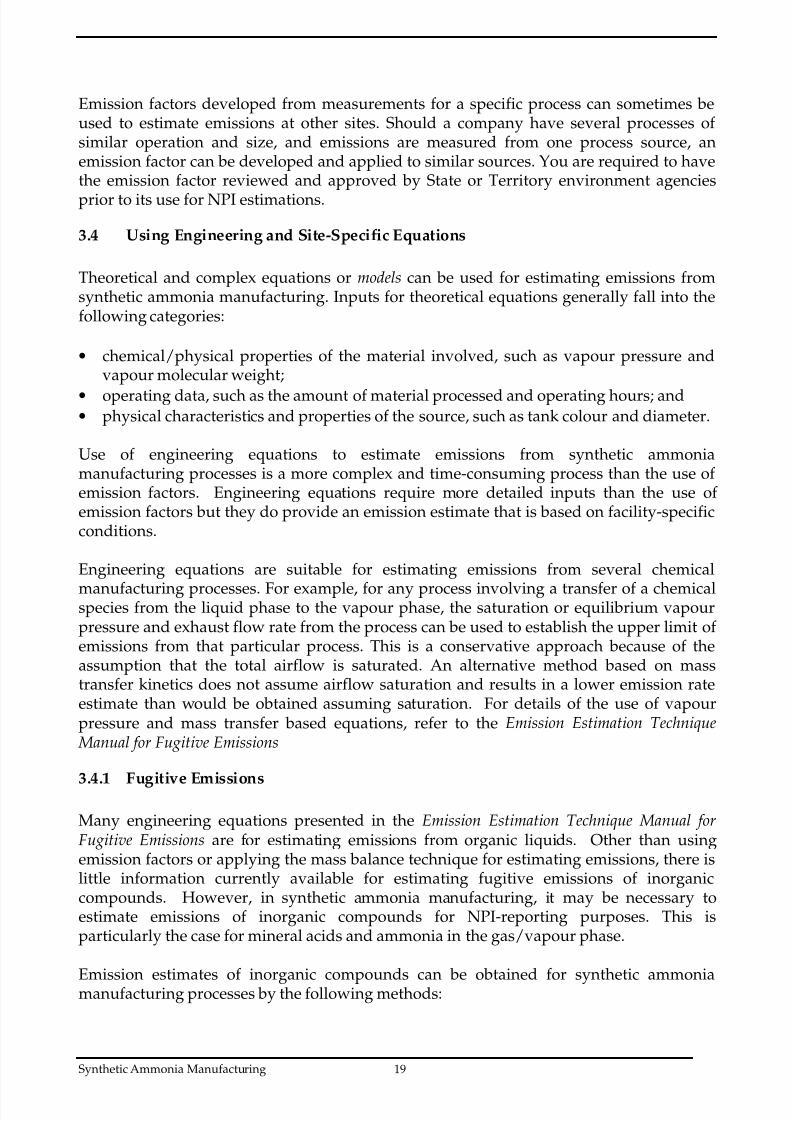
3.4 Using Engineering and Site-Specific Equations
Theoretical and complex equations or models can be used for estimating emissions fromsynthetic ammonia manufacturing. Inputs for theoretical equations generally fall into thefollowing categories:
• chemical/physical properties of the material involved, such as vapour pressure andvapour molecular weight;
• operating data, such as the amount of material processed and operating hours; and• physical characteristics and properties of the source, such as tank colour and diameter.
Use of engineering equations to estimate emissions from synthetic ammoniamanufacturing processes is a more complex and time-consuming process than the use of emission factors. Engineering equations require more detailed inputs than the use of emission factors but they do provide an emission estimate that is based on facility-specificconditions.
Engineering equations are suitable for estimating emissions from several chemical
manufacturing processes. For example, for any process involving a transfer of a chemicalspecies from the liquid phase to the vapour phase, the saturation or equilibrium vapourpressure and exhaust flow rate from the process can be used to establish the upper limit of emissions from that particular process. This is a conservative approach because of theassumption that the total airflow is saturated. An alternative method based on masstransfer kinetics does not assume airflow saturation and results in a lower emission rateestimate than would be obtained assuming saturation. For details of the use of vapourpressure and mass transfer based equations, refer to the Emission Estimation Technique
Manual for Fugitive Emissions
3.4.1 Fugitive Emissions Many engineering equations presented in the Emission Estimation Technique Manual forFugitive Emissions are for estimating emissions from organic liquids. Other than usingemission factors or applying the mass balance technique for estimating emissions, there islittle information currently available for estimating fugitive emissions of inorganiccompounds. However, in synthetic ammonia manufacturing, it may be necessary toestimate emissions of inorganic compounds for NPI-reporting purposes. This isparticularly the case for mineral acids and ammonia in the gas/vapour phase. Emission estimates of inorganic compounds can be obtained for synthetic ammoniamanufacturing processes by the following methods:
8/12/2019 Emissions NH3 Plant Calculations
http://slidepdf.com/reader/full/emissions-nh3-plant-calculations 23/29
Synthetic Ammonia Manufacturing 20
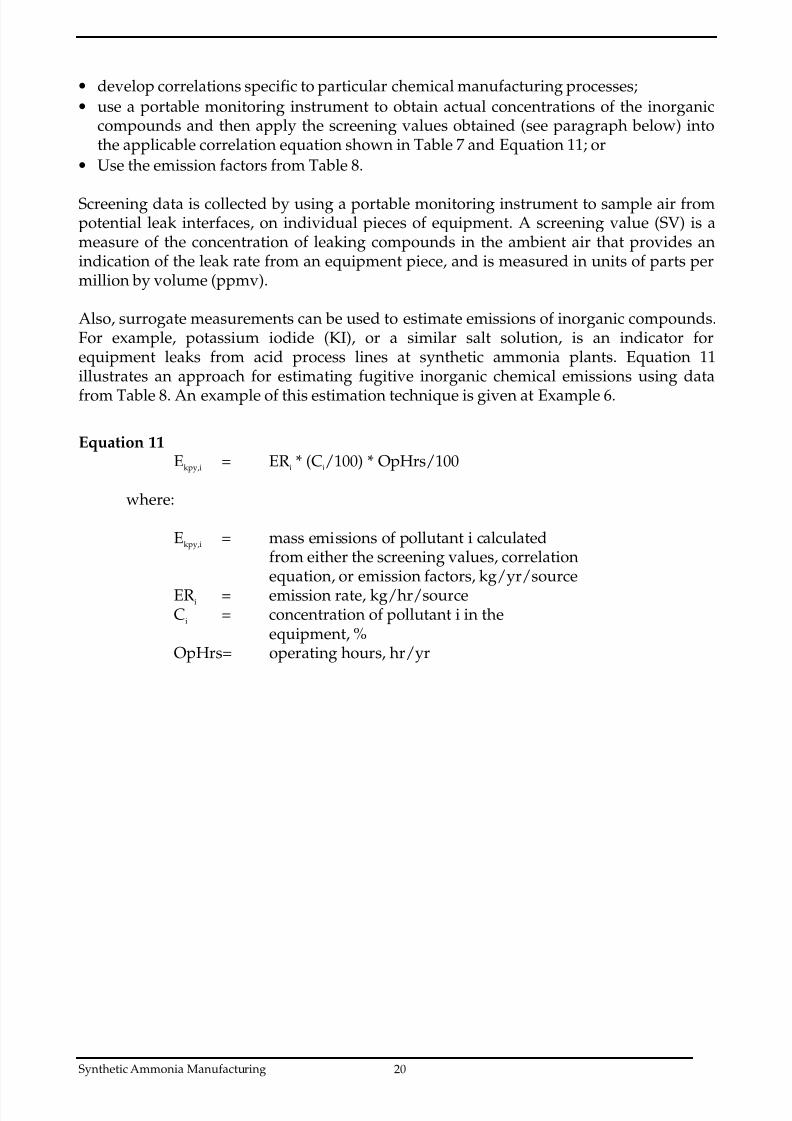
• develop correlations specific to particular chemical manufacturing processes;
• use a portable monitoring instrument to obtain actual concentrations of the inorganiccompounds and then apply the screening values obtained (see paragraph below) intothe applicable correlation equation shown in Table 7 and Equation 11; or
• Use the emission factors from Table 8.
Screening data is collected by using a portable monitoring instrument to sample air frompotential leak interfaces, on individual pieces of equipment. A screening value (SV) is ameasure of the concentration of leaking compounds in the ambient air that provides anindication of the leak rate from an equipment piece, and is measured in units of parts permillion by volume (ppmv).
Also, surrogate measurements can be used to estimate emissions of inorganic compounds.For example, potassium iodide (KI), or a similar salt solution, is an indicator forequipment leaks from acid process lines at synthetic ammonia plants. Equation 11illustrates an approach for estimating fugitive inorganic chemical emissions using data
from Table 8. An example of this estimation technique is given at Example 6.
Equation 11Ekpy,i = ERi * (Ci/100) * OpHrs/100
where:
Ekpy,i = mass emissions of pollutant i calculatedfrom either the screening values, correlationequation, or emission factors, kg/yr/source
ERi = emission rate, kg/hr/sourceCi = concentration of pollutant i in the
equipment, %OpHrs= operating hours, hr/yr
8/12/2019 Emissions NH3 Plant Calculations
http://slidepdf.com/reader/full/emissions-nh3-plant-calculations 24/29
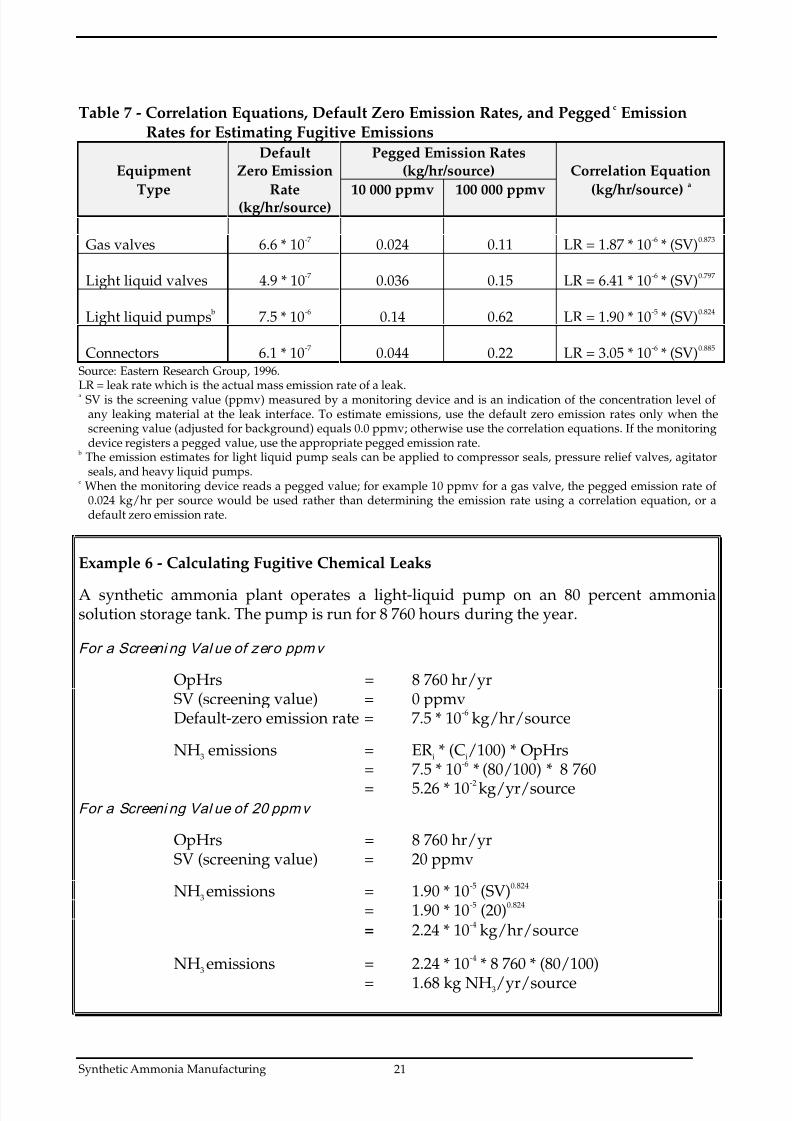
Synthetic Ammonia Manufacturing 21
Table 7 - Correlation Equations, Default Zero Emission Rates, and Peggedc Emission Rates for Estimating Fugitive Emissions
EquipmentDefault
Zero EmissionPegged Emission Rates
(kg/hr/source) Correlation Equation
Type Rate(kg/hr/source) 10 000 ppmv 100 000 ppmv (kg/hr/source)
a
Gas valves 6.6 * 10-7 0.024 0.11 LR = 1.87 * 10-6 * (SV)0.873
Light liquid valves 4.9 * 10-7 0.036 0.15 LR = 6.41 * 10-6 * (SV)0.797
Light liquid pumps b 7.5 * 10-6 0.14 0.62 LR = 1.90 * 10-5 * (SV)0.824
Connectors 6.1 * 10-7 0.044 0.22 LR = 3.05 * 10-6 * (SV)0.885
Source: Eastern Research Group, 1996.LR = leak rate which is the actual mass emission rate of a leak.a SV is the screening value (ppmv) measured by a monitoring device and is an indication of the concentration level of
any leaking material at the leak interface. To estimate emissions, use the default zero emission rates only when thescreening value (adjusted for background) equals 0.0 ppmv; otherwise use the correlation equations. If the monitoringdevice registers a pegged value, use the appropriate pegged emission rate.
b The emission estimates for light liquid pump seals can be applied to compressor seals, pressure relief valves, agitatorseals, and heavy liquid pumps.
c When the monitoring device reads a pegged value; for example 10 ppmv for a gas valve, the pegged emission rate of
0.024 kg/hr per source would be used rather than determining the emission rate using a correlation equation, or adefault zero emission rate.
Example 6 - Calculating Fugitive Chemical Leaks
A synthetic ammonia plant operates a light-liquid pump on an 80 percent ammoniasolution storage tank. The pump is run for 8 760 hours during the year.
For a Screeni ng Val ue of zero ppmv
OpHrs = 8 760 hr/yrSV (screening value) = 0 ppmvDefault-zero emission rate = 7.5 * 10-6 kg/hr/source
NH3 emissions = ERi * (Ci/100) * OpHrs= 7.5 * 10-6 * (80/100) * 8 760
= 5.26 * 10-2 kg/yr/sourceFor a Screeni ng Val ue of 20 ppmv
OpHrs = 8 760 hr/yrSV (screening value) = 20 ppmv
NH3 emissions = 1.90 * 10-5 (SV)0.824
= 1.90 * 10-5 (20)0.824
= 2.24 * 10-4 kg/hr/source
NH3 emissions = 2.24 * 10-4 * 8 760 * (80/100)
= 1.68 kg NH3/yr/source
8/12/2019 Emissions NH3 Plant Calculations
http://slidepdf.com/reader/full/emissions-nh3-plant-calculations 25/29
Synthetic Ammonia Manufacturing 22
The average emission factor approach is commonly used to calculate emissions when site-specific screening data is unavailable. To estimate emissions using the emission factors inTable 8, the concentration in weight percent of the pollutant of interest within theequipment is needed. This is important because equipment with higher pollutantconcentrations tend to have higher emission leak rates. The equipment should be groupedinto streams, such that all equipment within a stream has approximately the same pollutant
weight percent.
This approach for estimating emissions allows use of average emission factors incombination with unit-specific data that is relatively simple to obtain. This data includes:
• the number of each type of component in a unit (valve, connector, etc.);
• the service each component is in (gas, light liquid, or heavy liquid);
• the pollutant concentration of the stream; and
• the time period each component was in that service during the NPI reporting year.
Equation 12 can be used to estimate emissions from all of the equipment of a givenequipment type in a stream using the emission factors from Table 8.
Equation 12Ekpy,i = EF * WFi * OpHrs * N
where:
Ekpy,i = emission rate of pollutant x from all equipment inthe stream of a given equipment type, kg/yr
EF = applicable average emission factor for theequipment type, kg/hr/source
WFi = average weight fraction of pollutant i in thestream,
OpHrs= annual operation hours of equipment in the stream,hr/yr
N = number of pieces of the applicable equipment typein the stream
Example 7 illustrates the emission factor approach for Streams A and B. Note that Stream
A contains water, which is not an NPI-listed substance, and that this is accounted for whentotal emissions are estimated from Stream A.
8/12/2019 Emissions NH3 Plant Calculations
http://slidepdf.com/reader/full/emissions-nh3-plant-calculations 26/29
Synthetic Ammonia Manufacturing 23
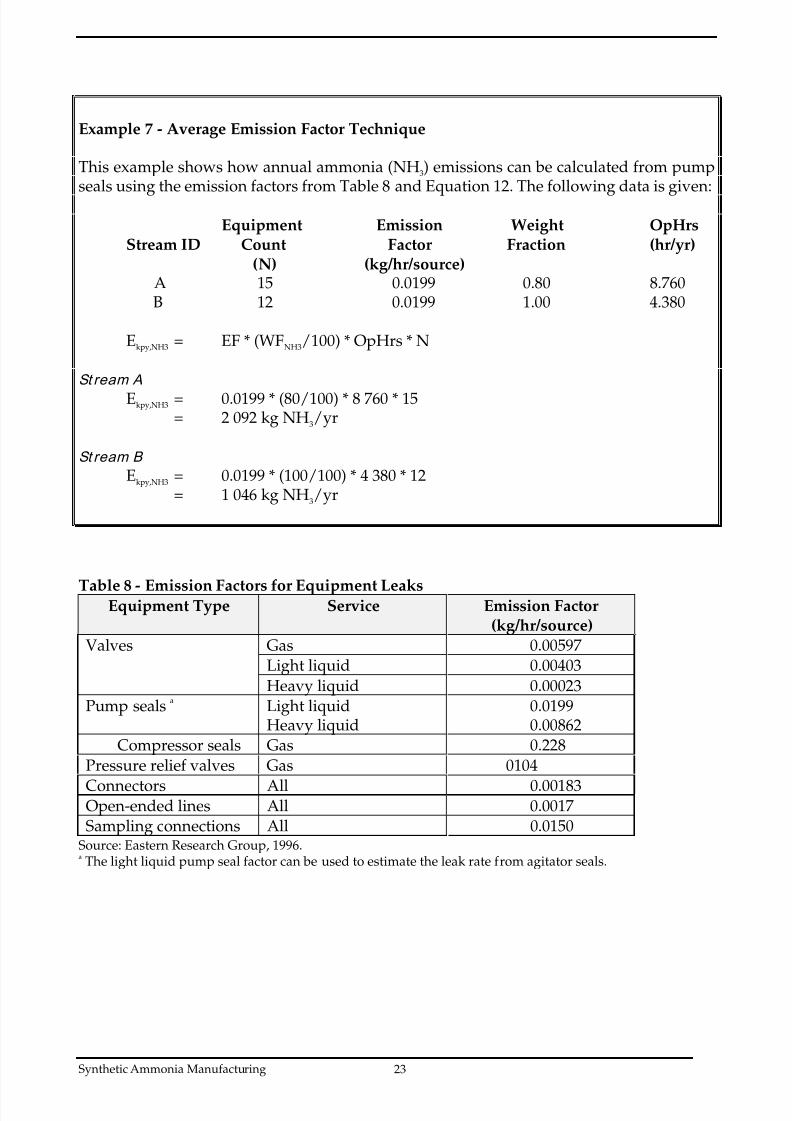
Example 7 - Average Emission Factor Technique
This example shows how annual ammonia (NH3) emissions can be calculated from pumpseals using the emission factors from Table 8 and Equation 12. The following data is given:
Equipment Emission Weight OpHrsStream ID Count Factor Fraction (hr/yr)
(N) (kg/hr/source) A 15 0.0199 0.80 8.760 B 12 0.0199 1.00 4.380
Ekpy,NH3 = EF * (WFNH3/100) * OpHrs * N
St ream A
Ekpy,NH3 = 0.0199 * (80/100) * 8 760 * 15= 2 092 kg NH3/yr
St ream B
Ekpy,NH3 = 0.0199 * (100/100) * 4 380 * 12= 1 046 kg NH3/yr
Table 8 - Emission Factors for Equipment LeaksEquipment Type Service Emission Factor
(kg/hr/source)
Valves Gas 0.00597Light liquid 0.00403
Heavy liquid 0.00023Pump seals a Light liquid 0.0199
Heavy liquid 0.00862 Compressor seals Gas 0.228Pressure relief valves Gas 0104
Connectors All 0.00183Open-ended lines All 0.0017Sampling connections All 0.0150
Source: Eastern Research Group, 1996.a The light liquid pump seal factor can be used to estimate the leak rate from agitator seals.
8/12/2019 Emissions NH3 Plant Calculations
http://slidepdf.com/reader/full/emissions-nh3-plant-calculations 27/29
Synthetic Ammonia Manufacturing 24
4.0 Emission Estimation Techniques: Acceptable Reliability andUncertainty
This section is intended to give a general overview of some of the inaccuracies associated
with each of the techniques. Although the National Pollutant Inventory does not favourone emission estimation technique over another, this section does attempt to evaluate theavailable emission estimation techniques with regards to accuracy.
Several techniques are available for calculating emissions from synthetic ammoniamanufacturing facilities. The technique chosen is dependent on available data, availableresources, and the degree of accuracy sought by the facility in undertaking the estimate. Ingeneral, site-specific data that is representative of normal operations is more accurate thanindustry-averaged data, such as the emission factors presented in Section 3.0 of thisManual.
4.1 Direct Measurement
Use of stack and/or workplace health and safety sampling data is likely to be a relativelyaccurate method of estimating air emissions from synthetic ammonia manufacturingfacilities. However, collection and analysis of samples from facilities can be very expensiveand especially complicated where a variety of NPI-listed substances are emitted andwhere most of these emissions are fugitive in nature. Sampling data from one specificprocess may not be representative of the entire manufacturing operation and may provideonly one example of the facility’s emissions.
To be representative, sampling data used for NPI reporting purposes needs to be collectedover a period of time, and to cover all aspects of production of synthetic ammonia.
In the case of CEMS, instrument calibration drift can be problematic and uncaptured datacan create long-term incomplete data sets. However, it may be misleading to assert that asnapshot (stack sampling) can better predict long-term emission characteristics. It is theresponsibility of the facility operator to properly calibrate and maintain monitoringequipment and the corresponding emissions data.
4.2 Mass Balance
Calculating emissions from a synthetic ammonia manufacturing facility using mass balance appears to be a straightforward approach to emission estimations. However, it islikely that few Australian industries consistently track material usage and wastegeneration with the overall accuracy needed for application of this method. Inaccuraciesassociated with individual material tracking or other activities inherent in each materialhandling stage can often result in large deviations of total facility emissions. Becauseemissions from specific materials are typically below 2 percent of gross consumption, an
error of only ± 5 percent in any one step of the operation can significantly skew emissionestimations.
8/12/2019 Emissions NH3 Plant Calculations
http://slidepdf.com/reader/full/emissions-nh3-plant-calculations 28/29
Synthetic Ammonia Manufacturing 25
4.3 Engineering Calculations
Theoretical and complex equations or models can be used for estimating emissions fromsynthetic ammonia manufacturing processes.
Use of emission equations to estimate emissions from synthetic ammonia manufacturingfacilities is a more complex and time-consuming process than the use of emission factors.Emission equations require more detailed inputs than the use of emission factors but theydo provide an emission estimate that is based on facility-specific conditions.
4.4 Emission Factors
Every emission factor has an associated emission factor rating (EFR) code. This ratingsystem is common to EETs for all industries and sectors and therefore, to all IndustryHandbooks. They are based on rating systems developed by the United States
Environmental Protection Agency (USEPA), and by the European Environment Agency(EEA). Consequently, the ratings may not be directly relevant to Australian industry.Sources for all emission factors cited can be found in Section 5.0 of this Manual. Theemission factor ratings will not form part of the public NPI database.
When using emission factors, you should be aware of the associated EFR code and whatthat rating implies. An A or B rating indicates a greater degree of certainty than a D or Erating. The less certainty, the more likely that a given emission factor for a specific sourceor category is not representative of the source type. These ratings notwithstanding, themain criterion affecting the uncertainty of an emission factor remains the degree of
similarity between the equipment/process selected in applying the factor, and the targetequipment/process from which the factor was derived.
The EFR system is as follows:
A - ExcellentB - Above AverageC - AverageD - Below AverageE - PoorU - Unrated
8/12/2019 Emissions NH3 Plant Calculations
http://slidepdf.com/reader/full/emissions-nh3-plant-calculations 29/29
5.0 References
ACTED Consultants, 1997, Ammonia and Ammonium Chemicals, URL:http://jimi.vianet.net.au/~acted/ammonia.html.
California Air Resources Board, 1991, “Identification of Volatile Organic CompoundSpecies Profiles”, ARB Speciation Manual, Second Ed., Vol 1, California, USA.
Eastern Research Group. November 1996. Final Report: Preferred and Alternative Methods forEstimating Fugitive Emissions from Equipment Leaks. Morrisville, NC, USA.
National Pollutant Inventory Homepagehttp://www.environment.gov.au/epg/npi/home.html
USEPA, March 1990, AIRS Facility Subsystem Source Classification Codes And Emission Factor
Listing For Criteria Pollutants, EPA-450/4-90-003, United States Environmental ProtectionAgency, Research Triangle Park, NC, USA.
USEPA, October 1992, VOC / PM Speciation Data System - Version 1.50, United StatesEnvironmental Protection Agency, Office of Air Quality, Planning and Standards,Research Triangle Park, NC, USA.
USEPA, July 1993, Compilation of Air Pollutant Emission Factors, Volume 1: Stationary Pointand Area Sources, fifth edition, AP-42, Section 8.1 Synthetic Ammonia, United StatesEnvironmental Protection Agency, Office of Air Quality Planning and Standards, Research
Triangle Park, NC, USA.http://www.epa.gov/ttn/chief/ap42.html
The following Emission Estimation Technique Manuals are available at the NPIHomepage and from your local environmental protection agency (see the front of the NPIGuide for details):
• Emission Estimation Technique Manual for Phosphate Manufacturing;
• Emission Estimation Technique Manual for Urea Manufacturing;
• Emission Estimation Technique Manual for Ammonium Sulfate Manufacturing; and
• Emission Estimation Technique Manual for Sewage and Wastewater Treatment.


