50
Emissions Reduction Opportunities and Policies Transport Sector Technical Report
Emissions Reduction Opportunities and Policies
Transport Sector
Technical Report
Acknowledgements. The National Council on Climate Change would like to thank representatives from Government agencies, in
particular the Ministry of Finance, representatives from private sector, academia and NGOs who contributed their time and expertise
to this eff ort. The GOI would also like to thank the World Bank, AUSAID and the Netherlands Embassy for the support for this study.
In addition to the members of the Working Group on Fiscal Policy for Climate Change and members of the National Council on
Climate Change provided advice, guidance and technical inputs on the approach and the report. Dollaris Riauaty Suhadi, Ahmad
Safrudin, Khoirunnurofi k, Tory Damantoro, Muhamad Agung, and Marc-Antoine Dunais contributed to this report as consultants to
Swisscontact and Gary Kleiman and Timothy Brown contributed to this report as consultants to the World Bank.
Disclaimer. This document summarizes technical analyses conducted by consultants and academics in consultation with the
World Bank and the sponsoring GOI agencies. The views and suggestions expressed here are those of the participants. These
statements do not necessarily refl ect the offi cial positions of the Government of Indonesia. The Ministry of Finance makes no claims
about the accuracy of data or estimates presented here to stimulate discussion of appropriate options for pursuing lower carbon
development paths in Indonesia.

Emissions Reduction Opportunities and Policies
Transport Sector
Technical Report
2 Emission Reduction Opportunities and PoliciesTransport Sector
Foreword
In December 2007, Indonesia hosted the United Nations Framework Convention on Climate Change
(UNFCCC) Conference of Parties 13 in Bali, and with it a High Level Event on Climate Change for Ministers
of Finance. During these events, the President of Indonesia launched the National Action Plan for Climate
Change. Ministers of Finance also agreed that it is in the global interest to improve international fi nancing
mechanisms and develop innovative approaches for climate fi nancing. As a result, it is now widely
understood that climate change is a development issue.
In 2008, Indonesia published its blueprint for integrating climate change mitigation and adaptation into
the national planning and budgeting process. The President also formed the National Council on Climate
Change as the focal point on climate change and a focus for intra-governmental coordination, and other
areas of technical assistance, outreach and capacity building. The National Council has engaged with
external partners and key stakeholders, including the Ministry of Finance, on climate change adaptation
and mitigation issues, including low carbon development.
Mitigating and adapting to climate change requires macro-economic management, fi scal policy plans,
revenue raising alternatives, insurance markets, and long-term investment options. The Ministry of
Finance recognizes the need to manage these challenges by adopting budget priorities, pricing policies,
and fi nancial market rules. To do this, the Fiscal Policy Offi ce appointed a working group to study and map
out fi scal issues for climate change.
The GOI is collaborating with the World Bank and other donors to conduct the technical studies needed
to inform the low carbon development strategy. The Governments of Netherlands and Australia have
also contributed resources and expertise to this eff ort. The low carbon work begins with the premise
that sound environmental management, reduction of emissions, economic effi ciency and growth are
compatible goals, important to the sustainability of Indonesia’s development path.
These results can serve as an input to the Government’s discussions of appropriate fi scal policy instruments
to promote low carbon development, carbon markets, and climate fi nance opportunities.
Head of Secretariat
National Council on Climate Change
Jakarta, April 2010

Emission Reduction Opportunities and PoliciesTransport Sector 3
Abbreviations and Acronyms
AISI Association of Indonesian Motorcycle
Manufacturers
ktCO2e Thousand Tons of Carbon Dioxide
equivalent
ASEAN Association of South East Asian
Nations
MBCD Million barrel crude per day
BAPPENAS National Development Planning
Board
MDB Multilateral Development Bank
CAI-Asia Clean Air Initiatives for Asian cities MDG Millennium Development Goals
CDM Clean Development Mechanism MEMR Ministry of Energy and Mineral
Resources
CER Certifi ed Emission Reductions MoC Ministry of Communication
CF Carbon Finance MoE Ministry of Environment
CH4
Methane MoF Ministry of Finance
CIF Climate Investment Funds MOFr Ministry of Forestry
CNG Compressed Natural Gas MoI Ministry of Industry
CO Carbon monoxide MPV Multi-Purpose Vehicle
CO2 Carbon dioxide mtCO
2e Million Tons of Carbon Dioxide
equivalent
CO2e Carbon dioxide equivalent NGO Non-governmental Organizations
COP Conference of the Parties NOx nitrogen oxide
CPF Carbon Partnership Facility NSW New South Wales
DNA Designated National Authority for
CDM
PM10
Particulate matter smaller than 10
microns
ECE Economic Commission for Europe ppm parts per million
EE Energy Effi ciency PSO Public Service Obligation
EPA Environment Protection Agency RE Renewable Energy
EU European Union REDD Reduced Emissions from Forests
Deforestation and Degradation
Gaikindo Association of Indonesian Automotive
Industries
RVP Reid vapor pressure
GDP Gross Domestic Product SDR Social discount rate
GHG Greenhouse gas SO2 Sulfur dioxide
IEA International Energy Agency tCO2e Tons of Carbon Dioxide equivalent
IPCC Intergovernmental Panel on Climate
Change
UNFCCC United Nations Framework
Convention on Climate Change
kPa kilo Pascal WRI World Resources Institute
4 Emission Reduction Opportunities and PoliciesTransport Sector
Contents
Foreword 2
Abbreviations and Acronyms 3
Contents 4
Executive Summary 7
Section 1 Introduction and Background 9
Section 2 Indonesian Context 11
2.1 The Indonesian Transportation Sector 11
2.2 Indonesian Transportation Policy Framework 13
Section 3 Greenhouse Gas Emissions and Transportation: Global Best Practice 25
3.1 Improving Fuel Effi ciency (Vehicle Technology, Loads, and Drive Train) 26
3.2 Alternative Fuels 27
3.3 Mode Shifts and Transport Demand Management 28
3.4 Rail, Air, and Marine Transport 29
Section 4 Low Carbon Options in the Indonesian Context 31
Section 5 Conclusions and Next Steps 37
References 41
Annexes 44
Annex A Costs And Benefi ts Of Options For Reducing Air Pollution And Ghg Emissions 44
A.1 Improve fuel quality to meet Euro fuel standards. 45
A.2 Revitalize the use of CNG and improve fuel quality. 45
A.3 Provision of tax incentives. 45

Emission Reduction Opportunities and PoliciesTransport Sector 5
Figures
Figure 1 Share of primary energy use within the Indonesian transportation sector (2005). 12
Figures 2a and b Projected Indonesian vehicle numbers and CO2 emissions. 12
Figure 3 Factors Aff ecting Transport Sector Emissions 14
Figure 4 Status of Implementation of Emissions Standards for New Vehicles 17
Tables
Table 1 Summary of Strategies and Evaluation Criteria for Transportation Improvement Options 15
Table 2 European standards for gasoline and diesel fuels, which correspond to
gasoline and diesel-fueled vehicle emission standard. 18
Table 3 Application of Euro emissions standards for new vehicles in Asian countries 18
Table 4 Properties of Pertamina fuels compared to Euro 2 reference fuel 20
Table 5 Comparison of vehicle tax structure between Indonesia and Thailand,
and calculation for on-the- road imported car price 33
Table A-1 Scenarios for three policy options 44
Table A-2 Additional cost if clean diesel is refi ned vs imported 45
Table A-3 Summary of policy impact of 3 options (2005-2030) 46
Table A-4 Budget impact for shifts between Euro fuel standards 47


Emission Reduction Opportunities and PoliciesTransport Sector 7
Executive Summary
The Indonesian transportation sector is currently the nation’s largest consumer of petroleum products
and a large source of greenhouse gas (GHG) emissions overall. Without signifi cant actions to reduce the
carbon intensity of the transportation sector, GHG emissions are projected to double in less than 10 years.
With the growing global focus on climate change issues, as well as increasing urbanization and growth
in fuel use in Indonesia, there is now a good opportunity to address transportation sector emissions in a
comprehensive manner.
The Government of Indonesia (GOI), in particular the Ministry of Finance has commissioned a Low Carbon
Development Options study to evaluate and develop strategic options to reduce emissions intensity
without compromising development objectives. The Ministries of Industry and Environment have
already identifi ed important sectoral opportunities and the Agency for the Assessment and Application
of Technology (BPPT) has prepared a technology needs assessment for climate change mitigation. This
paper provides additional support and analysis toward development of a practical and coordinated
approach to managing transportation sector emissions. The report focuses on a few key policy options
(both within the Ministry of Finance and other Ministries) that could start the GOI on a path to reduced
carbon intensity for the transportation sector. This report adds an economic and policy dimension that
may usefully complement prior work and engage the Ministry of Finance more actively in the quest for
cost-eff ective emissions reductions.
This report describes the factors aff ecting transport sector emissions in a simple overview framework.
To begin reducing emissions within the Indonesian context (both greenhouse gases and conventional
pollutants), simple policies in the transportation sector that promote economic effi ciency and incentives
could help. In particular, GHG reduction policies that increase fuel savings from cars and trucks would give
multiple benefi ts. Based on international experience, the simplest way to reduce fuel use (and associated
GHG emissions and air pollution) is through vehicle emission and fuel quality standards. Specifi cally,
by progressing from Euro 2 to Euro 4 standards for vehicle emissions and fuel specifi cations, GOI can
signifi cantly bring down the rapid projected growth of on-road vehicle emissions. However, the fuel-
saving and air quality-improving technologies built into Euro 4 vehicles depend on uniform fuel quality,
which requires regulation and enforcement of fuel quality standards. In parallel, compressed natural gas

8 Emission Reduction Opportunities and PoliciesTransport Sector
Executive Summary
(CNG) use for high-use public transport vehicles should be revitalized to decrease reliance on higher
emitting diesel fuel and gasoline.
Several complementary actions can ease the implementation burden of these measures. Restructuring
the vehicle taxation system to include incentives that are based on emissions or fuel consumption
levels will allow consumers to contribute to reducing vehicle emissions. The introduction of mandatory
labeling of CO2 emissions from motor vehicles sold on the Indonesian market will help consumers to
make informed purchasing decisions. Finally, ensuring adequate uniformly clean fuel supply through
expansion of domestic refi nery capacity will be needed to enable the Euro 4 transition.
These are all reasonable “no regrets” policies that can be recommended from the point of view of health,
pollution, social costs, energy effi ciency and security – not just climate or low carbon rationales. In fact,
these policy options appear to be extremely cost-eff ective providing high net benefi ts as shown by cost-
benefi t analysis. These recommendations should be considered—and applied—as a whole, rather than
as individual actions to be taken in isolation from each other. An integrated strategy that includes tighter
vehicle and emissions standards, fi scal corrections and technological improvements is the best path to
eff ectively increase energy security and improve the well-being of Indonesians.
Recommendations are also provided for a follow-up economic analysis to examine mechanisms for
implementing these potential policy options and the macroeconomic implications of both the “no
regrets” policy options that make sense from the perspective of public health and economic effi ciency
alone, as well as complementary fi scal policies designed to ease implementation burdens.
In addition to economic analysis, there is a need to coordinate recommendations across ministries
responsible for transportation planning and other transportation system stakeholders (clearly a fi scal
policy component of planning lies with the Ministry of Finance). The “focus group discussions” or FGD
process that has been implemented for other sectors in the low carbon development study can serve as
a model for transportation sector planning that would examine both the institutional context for short-
term actions and give more thought to options beyond fuel quality and fuel effi ciency. These include
transport demand management, bus rapid transit (i.e., TransJakarta Busway), expanded rail service, non-
motorized transport, alternative fuels, and smart growth strategies. This coordination should serve as a
foundation for integrated transportation planning that encompasses climate policy and reduced carbon
intensity as a central component of urban planning for sustainable economic development.

Emission Reduction Opportunities and PoliciesTransport Sector 9
Section 1
Introduction and Background
Climate change is a strategic and development challenge facing Indonesia. The Government of Indonesia
(GOI) recognizes climate change as a key economic development and planning issue. The GOI also
acknowledges that early action to address mitigation and adaptation concerns will be strategically and
economically benefi cial for Indonesia. As one important step on mitigation, the GOI has embarked on a
Low Carbon Development Options Study as an opportunity to evaluate and develop strategic options to
reduce emissions intensity without compromising development objectives.
The fi rst phase of low carbon work showed that Indonesia is a relatively large greenhouse gas (GHG)
emitter, especially from forests and land use, but also from fast growing fossil fuel use. Among fossil fuels,
oil is currently the main contributor of emissions. However, emissions from use of coal have been the
fastest growing for the last decade, attributed to its increasing use in electric power generation. Among
economic sectors, transportation is the largest consumer of oil and is experiencing rapid increased
demand. Road transport is the largest fuel consumer, nearly the only one of consequence. Emissions are
roughly split between use of Motor Gasoline and Gas/Diesel. The future projections for transportation
demand are an area of great concern if current technology and effi ciency trends hold. Electric power
generation is the fastest increasing source of emissions, which also has implications for manufacturing
which relies on power for many processes. The industrial sector is the largest single source of greenhouse
gas emissions from fossil fuel use.
The second phase of the study (ongoing) will help to inform the GOI about the main emissions reduction
potentials by source and category of use, to estimate the potential costs and benefi ts associated
with movements toward alternative development paths, and to build consensus toward appropriate
approaches for lowering emissions. Other ongoing analyses include a macro policy options element and
four sector analyses covering transportation (this study), forestry and land use, power generation, and
manufacturing. This study about emissions reductions opportunities in the transportation sector is an
important component of the Low Carbon Development Options Study.
Mobility is key to economic development. Economic specialization and trade require the ability to move
goods and labor as well as both service providers and consumers. Globally, transport technologies rely
primarily on liquid petroleum fuels (95 percent). In 2004 at the global level, the transportation sector was

10 Emission Reduction Opportunities and PoliciesTransport Sector
Section 1Introduction and Background
responsible for 6.3 Gtons of CO2 emissions (about 12% of the total). Road transport is responsible for 74
percent of these emissions.
In 2004 in Indonesia, the transportation sector emissions are much lower at 78 Mtons of CO2 emissions
(representing about 23% of the total). However, road transport makes up an even larger share of the
sector emissions, 88 percent. This highlights Indonesia’s higher carbon intensity with a much lower
fraction of the population served. Future emissions will be even larger because demand for transportation
is growing globally at 2 percent per year. In Indonesia, transport emissions are projected to double
within 10 years. Freight transport has been growing even faster than passenger traffi c and is expected to
continue, particularly in developing economies like Indonesia (Kahn Ribeiro et al., 2007).
Within Indonesia, transport is the largest user of liquid fuel, due to growth in vehicle fl eet and the low
price of liquid fuel products for transportation. Low fuel prices (held down by government subsidies)
mask improvements in vehicle effi ciency that may be taking place over time. Aside from emissions,
road transport is also associated with traffi c fatalities and injuries, air pollution, traffi c congestion, and oil
dependence.
With the growing focus on climate change issues and the potential for carbon market fi nance and other
forms of assistance, there is now a good opportunity to pursue several key initial steps that will lay the
groundwork for a comprehensive plan to address transportation sector emissions. Because vehicle
emissions from road transport is the largest source of emissions, this initial report focuses mainly on vehicle
standards and fuel quality options that can improve emissions, with substantial co-benefi ts in terms of
health eff ects and costs. However, it is also prudent and timely for Indonesia to begin consideration
of broader transport strategies that begin to deal with the numbers of vehicles on the road and the
transport options off ered to a growing urban population. Shifts in the mode of transport (mass transit
options, buses, trains) will ultimately be more eff ective in providing cleaner transport options. This is an
introductory study that will be followed by a more comprehensive eff ort to evaluate broader transport
options and their costs and benefi ts for Indonesia.
The Government of Indonesia, in particular the Ministries of Transport and Environment and the
Agency for the Assessment and Application of Technology (BPPT), has already prepared a technology
needs assessment for climate change mitigation and identifi ed important transport sector issues and
opportunities (BPPT and KLH, 2009). A detailed description of the current transportation situation, both
globally and in Indonesia, is presented elsewhere (Kahn Ribeiro et al., 2007; BPPT and KLH, 2009). This
analysis is focused on identifying and prioritizing key fi scal policies and programs that will complement
and support other GOI actions in the transport sector. This paper adds an economic and policy dimension
that may usefully engage the Ministry of Finance more actively in the quest for cost eff ective emissions
reductions.
The structure of this report is as follows. Section 2 provides important Indonesian context on the current
transportation system and the current state of policy development. Section 3 provides a review of global
low-carbon transportation options and a sample of best practices that may be applicable in Indonesia
now and in the future as part of a more comprehensive low carbon program for transportation planning.
In Section 4, this report identifi es the set of key mitigation options that make sense for the GOI to pursue
in the near-term given the specifi c issues and options that have been described in the prior sections.
Finally in Section 5, we summarize and prioritize those fi scal policies that are most important for the GOI
to address now and link MoF options with potential policy goals of other Ministries to lay out a strategic
and coordinated low carbon transportation development plan.
Emission Reduction Opportunities and PoliciesTransport Sector 11
Section 2
Indonesian Context
The transportation sector is the largest consumer of primary energy in Indonesia responsible for nearly
half (48 percent) of the country’s primary energy use in 2005. While there are a variety of modes and fuels
that contribute to this energy use, this section demonstrates that cars and trucks running on petroleum-
based fossil fuels dominate GHG emission sources. It is recognized that a number of policy approaches,
regulations, and laws have been formulated to deal with the complex set of social, environmental, and
development issues that arise through modern transportation systems. This section, however, will
focus on issues of fuel pricing and quality, which are fundamental bases on which to build improved
performance and future, bolder steps. More appropriate fuel pricing will help to send a signal and create
an incentive for greater fuel effi ciency and stimulate a search for cheaper transport options. Fuel quality
improvements will support the introduction of modern fuel-effi cient technologies and vehicles, in line
with what Indonesia’s Asian neighbors have already achieved. These actions will help to move toward
emissions reductions with substantial domestic co-benefi ts. Fiscal policies that support these regulatory
eff orts can be developed to ease the regulatory hurdle and lay the foundation for broader transportation
plans that are integrated with economic development and sustainability issues including climate change,
air quality, and public health.
This section provides an overview of the transportation sector, the Indonesian policy framework,
regional examples of successful transportation interventions, and reviews opportunities and barriers to
improvements in fuel quality and emissions.
2.1 The Indonesian Transportation SectorThis section addresses sources of emissions broken down by the types of fuel, the modes of transport, the
types and numbers of vehicles, as well as the emissions from diff erent vehicle types. GHG emissions from
fossil fuel combustion in Indonesia are growing very rapidly (six percent per year), faster than GDP (MoF
& WB, 2008). Although emissions from the use of coal have been the fastest growing compared to other
fossil fuels during the last decade, oil is currently the main contributor to total emissions.
12 Emission Reduction Opportunities and PoliciesTransport Sector
Section 2Indonesian Context
Transport Fuels. Almost all the energy consumed in the transportation sector (99.7 percent) comes from
three liquid fuels: gasoline (bensin), diesel (solar), and jet fuel (avtur). Combustion of these fuels leads
to about 75 Million tons of CO2 (KLH, 2008). Gasoline and diesel contribute over 91 percent of this total,
dominating the transportation fuel market. This section focuses on these fuels as the primary current
source of mobility and emissions. It is recognized, however, that in the future a variety of alternative fuels
and technologies – including biodiesel, CNG, electric or hybrid-electric automobiles and even fuel cells –
may become more prominent depending on the country’s transportation plans and policies.
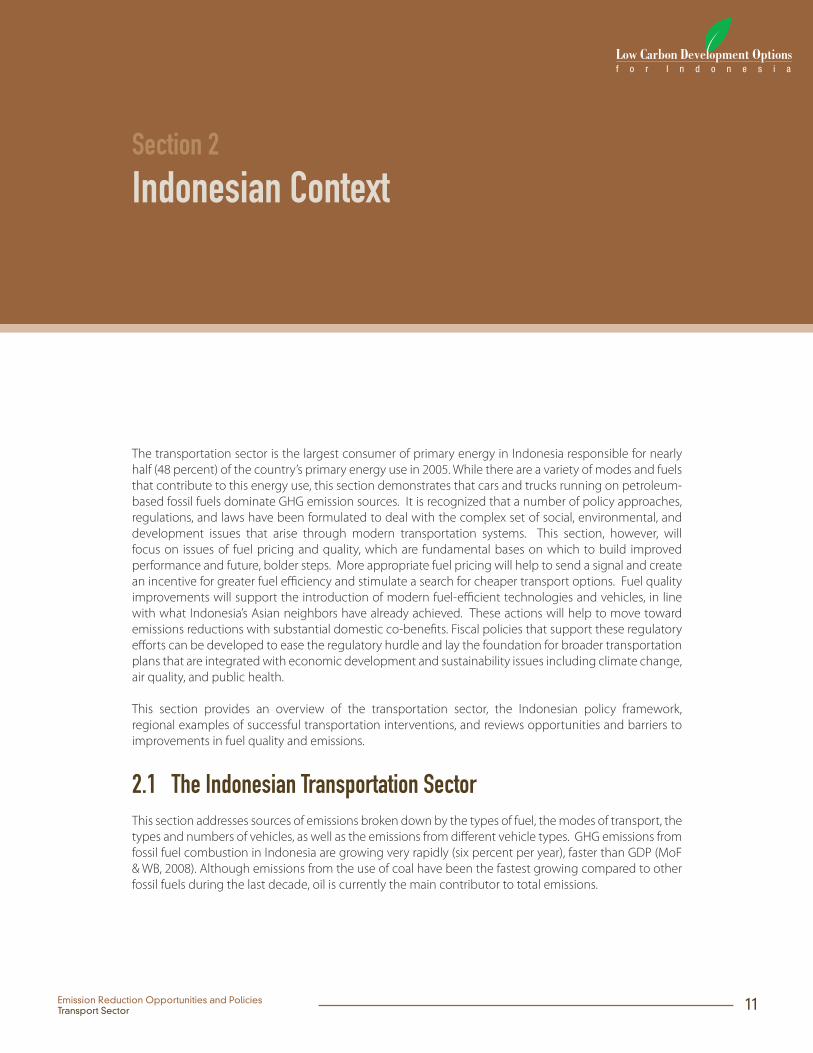
Figure 1 Share of primary energy use within the Indonesian
transportation sector (2005).
Road Transportation88%
Air Transportation4%
Sea Transportation7%
Railroad and Ferry1%
Source: Indonesia Technology Needs Assessment (BPPT and KLH, 2009)
Transport Modes. Relatively few
modes of transport utilize the vast
majority of these fuels. Primary
energy consumption by
transportation mode can be seen
in Figure 1. Road transportation
consumes 88 percent of primary
energy consumption in the sector.
Sea, air, railroad and ferry
transportation consume only
moderate amounts: 7 percent, 4
percent, and 1 percent of primary
energy consumption respectively
(BPPT and KLH, 2009).
Vehicles. Road transportation
means vehicles: cars, trucks, and
motorcycles. Looking at numbers,
2-wheel vehicles (motorcycles and
scooters) dominate with over 34
million in 2007, and projections to
grow to 60 million by 2025. In comparison, there were almost 6 million cars and 3 million trucks in 2007.
BPPT and KLH (2009) project that 4-wheel vehicle numbers could grow to 30 million cars and 10 million
trucks by 2025.
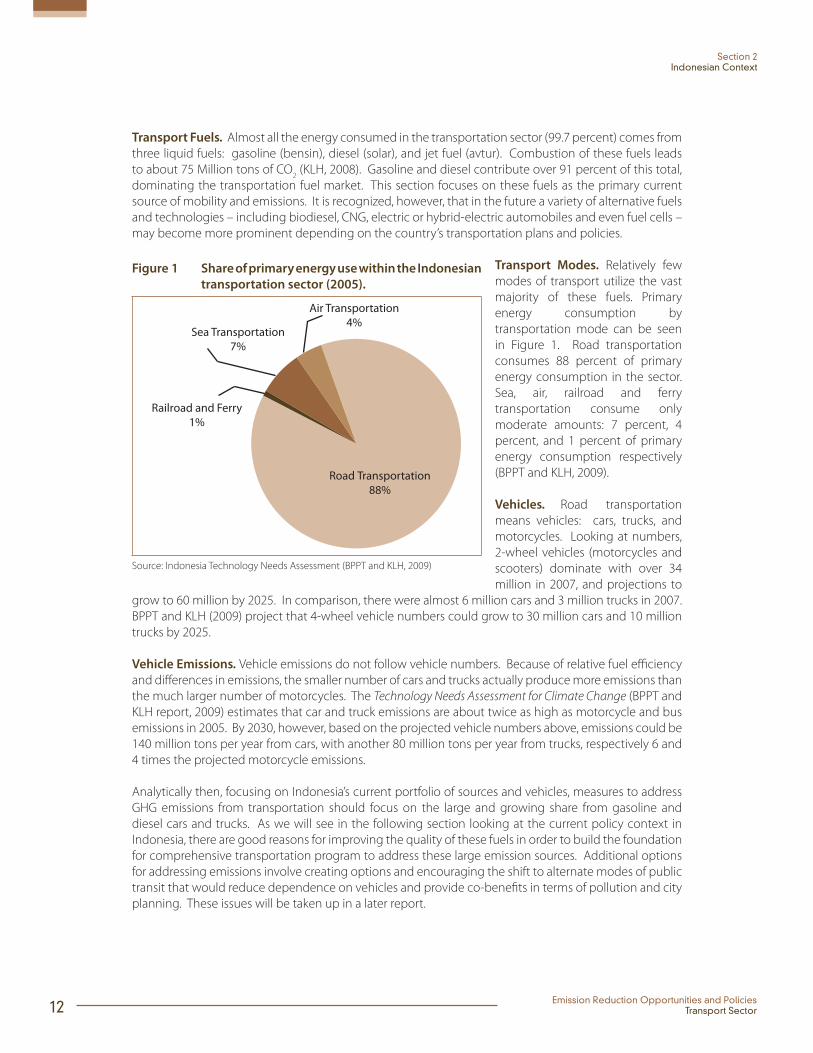
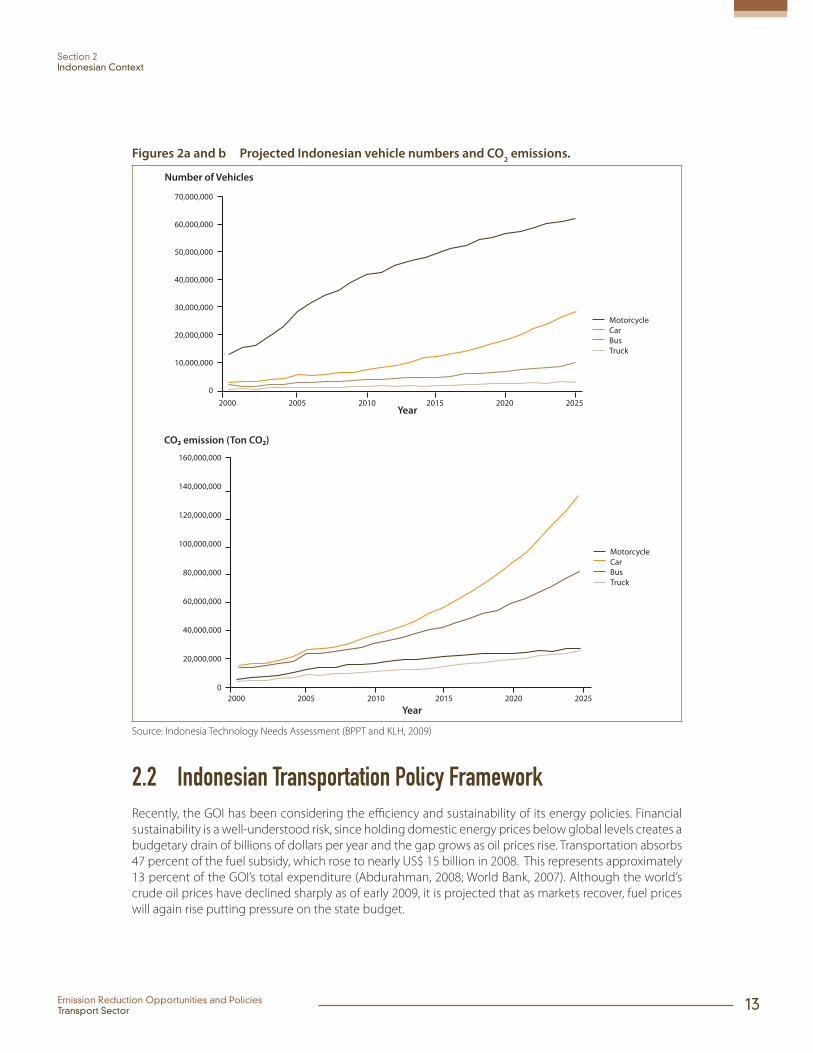
Vehicle Emissions. Vehicle emissions do not follow vehicle numbers. Because of relative fuel effi ciency
and diff erences in emissions, the smaller number of cars and trucks actually produce more emissions than
the much larger number of motorcycles. The Technology Needs Assessment for Climate Change (BPPT and
KLH report, 2009) estimates that car and truck emissions are about twice as high as motorcycle and bus
emissions in 2005. By 2030, however, based on the projected vehicle numbers above, emissions could be
140 million tons per year from cars, with another 80 million tons per year from trucks, respectively 6 and
4 times the projected motorcycle emissions.
Analytically then, focusing on Indonesia’s current portfolio of sources and vehicles, measures to address
GHG emissions from transportation should focus on the large and growing share from gasoline and
diesel cars and trucks. As we will see in the following section looking at the current policy context in
Indonesia, there are good reasons for improving the quality of these fuels in order to build the foundation
for comprehensive transportation program to address these large emission sources. Additional options
for addressing emissions involve creating options and encouraging the shift to alternate modes of public
transit that would reduce dependence on vehicles and provide co-benefi ts in terms of pollution and city
planning. These issues will be taken up in a later report.
Emission Reduction Opportunities and PoliciesTransport Sector 13
Section 2Indonesian Context
Figures 2a and b Projected Indonesian vehicle numbers and CO2 emissions.
Number of Vehicles
Year
MotorcycleCarBusTruck
70,000,000
60,000,000
50,000,000
40,000,000
30,000,000
20,000,000
10,000,000
02000 2005 2010 2015 2020 2025
Year
160,000,000
140,000,000
120,000,000
100,000,000
80,000,000
60,000,000
40,000,000
20,000,000
0
MotorcycleCarBusTruck
2000 2005 2010 2015 2020 2025
Source: Indonesia Technology Needs Assessment (BPPT and KLH, 2009)
2.2 Indonesian Transportation Policy Framework Recently, the GOI has been considering the effi ciency and sustainability of its energy policies. Financial
sustainability is a well-understood risk, since holding domestic energy prices below global levels creates a
budgetary drain of billions of dollars per year and the gap grows as oil prices rise. Transportation absorbs
47 percent of the fuel subsidy, which rose to nearly US$ 15 billion in 2008. This represents approximately
13 percent of the GOI’s total expenditure (Abdurahman, 2008; World Bank, 2007). Although the world’s
crude oil prices have declined sharply as of early 2009, it is projected that as markets recover, fuel prices
will again rise putting pressure on the state budget.
14 Emission Reduction Opportunities and PoliciesTransport Sector
Section 2Indonesian Context
Sustainability also refers to environmental and social appropriateness. Bappenas (2007a) describes
the importance of fossil fuels and minerals in Indonesia’s development, while also noting risks to the
sustainability of the country’s growth. Relatively low energy consumption per capita and high energy-
intensity indicates both Indonesia’s relatively low welfare and ineffi cient use of energy. Over-reliance on
natural resources including fossil fuel energy resources negatively impacts the environment and disrupts
quality of life and livelihoods of both poor and affl uent Indonesians (Bappenas, 2007a).
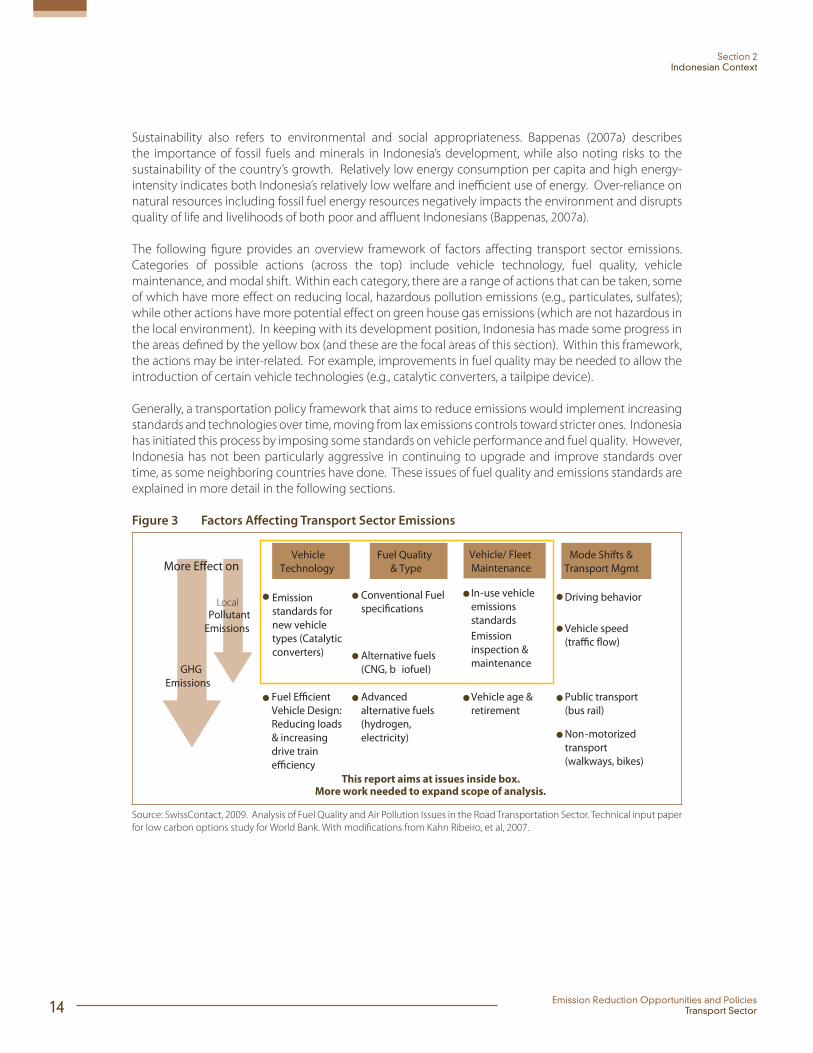
The following fi gure provides an overview framework of factors aff ecting transport sector emissions.
Categories of possible actions (across the top) include vehicle technology, fuel quality, vehicle
maintenance, and modal shift. Within each category, there are a range of actions that can be taken, some
of which have more eff ect on reducing local, hazardous pollution emissions (e.g., particulates, sulfates);
while other actions have more potential eff ect on green house gas emissions (which are not hazardous in
the local environment). In keeping with its development position, Indonesia has made some progress in
the areas defi ned by the yellow box (and these are the focal areas of this section). Within this framework,
the actions may be inter-related. For example, improvements in fuel quality may be needed to allow the
introduction of certain vehicle technologies (e.g., catalytic converters, a tailpipe device).
Generally, a transportation policy framework that aims to reduce emissions would implement increasing
standards and technologies over time, moving from lax emissions controls toward stricter ones. Indonesia
has initiated this process by imposing some standards on vehicle performance and fuel quality. However,
Indonesia has not been particularly aggressive in continuing to upgrade and improve standards over
time, as some neighboring countries have done. These issues of fuel quality and emissions standards are
explained in more detail in the following sections.
Figure 3 Factors Aff ecting Transport Sector Emissions
Vehicle Technology
Fuel Quality & Type
Mode Shifts & Transport Mgmt
Vehicle/ Fleet Maintenance
Conventional Fuel
Alternative fuels (CNG, b iofuel)
Advanced alternative fuels (hydrogen, electricity)
Emission standards for new vehicle types (Catalytic converters)
Vehicle Design: Reducing loads & increasing drive train
In-use vehicle emissions standardsEmission inspection & maintenance
Vehicle age & retirement
Driving behavior
Vehicle speed
Public transport (bus rail)
Non-motorized transport (walkways, bikes)
GHG Emissions
This report aims at issues inside box. More work needed to expand scope of analysis.
EmissionsPollutant
Local
Source: SwissContact, 2009. Analysis of Fuel Quality and Air Pollution Issues in the Road Transportation Sector. Technical input paper
for low carbon options study for World Bank. With modifi cations from Kahn Ribeiro, et al, 2007.

Emission Reduction Opportunities and PoliciesTransport Sector 15
Section 2Indonesian Context
It is with this perspective that the GOI, faced with a variety of options to mitigate GHG from the
transportation sector (See Section 3 for a more complete review), has thus far focused – with modest
success on fuel effi ciency and quality. More eff ort could be placed on improved vehicle technologies by
introducing tighter standards on both vehicles and fuels. The following sections review opportunities
and barriers to further progress along the range of options identifi ed in Figure 3 above: introducing new
vehicle technologies, fuel quality, and technologies or fl eet compositions changes for existing vehicles.
The table on the following page provides an overview of the key elements of this framework, measures
for applying them in Indonesia, and a brief assessment of the opportunities, barriers, and stakeholders
involved in undertaking these improvements. The table provides a guide to the following sections, which
provide more detail on each of the major approaches for reducing emissions of both conventional and
greenhouse gas emissions.
16 Emission Reduction Opportunities and PoliciesTransport Sector
Section 2Indonesian Context
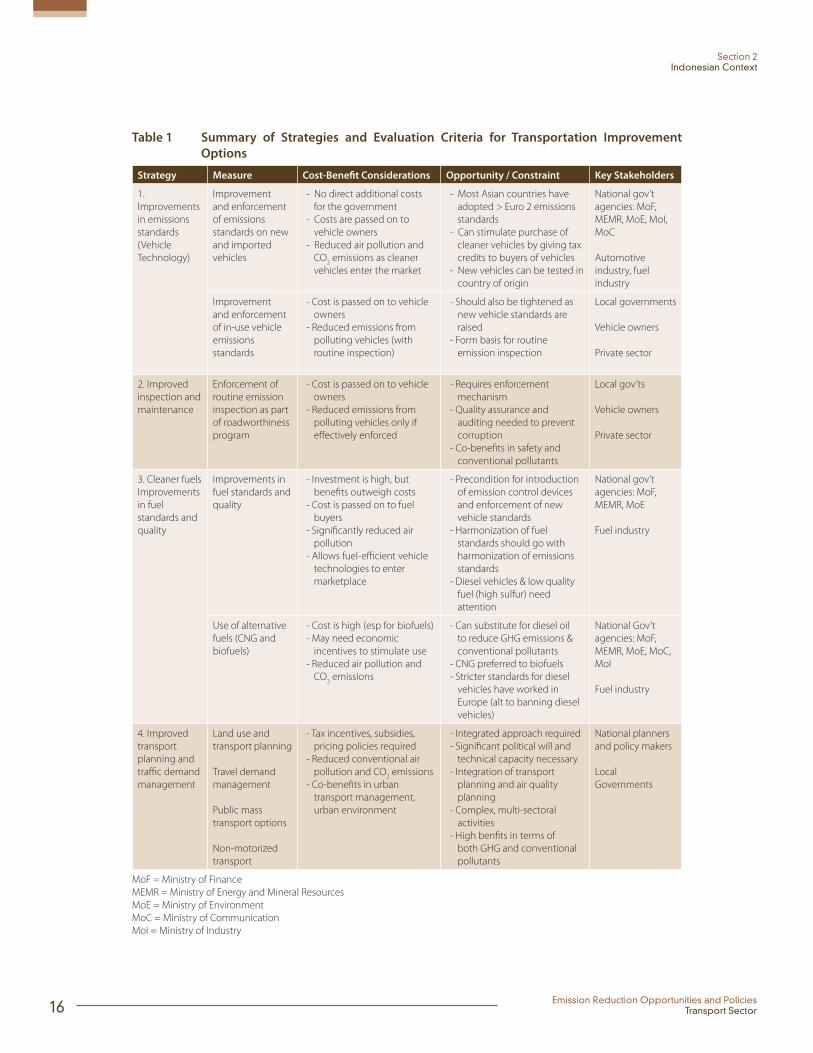
Table 1 Summary of Strategies and Evaluation Criteria for Transportation Improvement
Options
Strategy Measure Cost-Benefi t Considerations Opportunity / Constraint Key Stakeholders
1.
Improvements
in emissions
standards
(Vehicle
Technology)
Improvement
and enforcement
of emissions
standards on new
and imported
vehicles
- No direct additional costs
for the government
- Costs are passed on to
vehicle owners
- Reduced air pollution and
CO2 emissions as cleaner
vehicles enter the market
- Most Asian countries have
adopted > Euro 2 emissions
standards
- Can stimulate purchase of
cleaner vehicles by giving tax
credits to buyers of vehicles
- New vehicles can be tested in
country of origin
National gov’t
agencies: MoF,
MEMR, MoE, MoI,
MoC
Automotive
industry, fuel
industry
Improvement
and enforcement
of in-use vehicle
emissions
standards
- Cost is passed on to vehicle
owners
- Reduced emissions from
polluting vehicles (with
routine inspection)
- Should also be tightened as
new vehicle standards are
raised
- Form basis for routine
emission inspection
Local governments
Vehicle owners
Private sector
2. Improved
inspection and
maintenance
Enforcement of
routine emission
inspection as part
of roadworthiness
program
- Cost is passed on to vehicle
owners
- Reduced emissions from
polluting vehicles only if
eff ectively enforced
- Requires enforcement
mechanism
- Quality assurance and
auditing needed to prevent
corruption
- Co-benefi ts in safety and
conventional pollutants
Local gov’ts
Vehicle owners
Private sector
3. Cleaner fuels
Improvements
in fuel
standards and
quality
Improvements in
fuel standards and
quality
- Investment is high, but
benefi ts outweigh costs
- Cost is passed on to fuel
buyers
- Signifi cantly reduced air
pollution
- Allows fuel-effi cient vehicle
technologies to enter
marketplace
- Precondition for introduction
of emission control devices
and enforcement of new
vehicle standards
- Harmonization of fuel
standards should go with
harmonization of emissions
standards
- Diesel vehicles & low quality
fuel (high sulfur) need
attention
National gov’t
agencies: MoF,
MEMR, MoE
Fuel industry
Use of alternative
fuels (CNG and
biofuels)
- Cost is high (esp for biofuels)
- May need economic
incentives to stimulate use
- Reduced air pollution and
CO2 emissions
- Can substitute for diesel oil
to reduce GHG emissions &
conventional pollutants
- CNG preferred to biofuels
- Stricter standards for diesel
vehicles have worked in
Europe (alt to banning diesel
vehicles)
National Gov’t
agencies: MoF,
MEMR, MoE, MoC,
MoI
Fuel industry
4. Improved
transport
planning and
traffi c demand
management
Land use and
transport planning
Travel demand
management
Public mass
transport options
Non-motorized
transport
- Tax incentives, subsidies,
pricing policies required
- Reduced conventional air
pollution and CO2 emissions
- Co-benefi ts in urban
transport management,
urban environment
- Integrated approach required
- Signifi cant political will and
technical capacity necessary
- Integration of transport
planning and air quality
planning
- Complex, multi-sectoral
activities
- High benfi ts in terms of
both GHG and conventional
pollutants
National planners
and policy makers
Local
Governments
MoF = Ministry of Finance
MEMR = Ministry of Energy and Mineral Resources
MoE = Ministry of Environment
MoC = Ministry of Communication
MoI = Ministry of Industry
Emission Reduction Opportunities and PoliciesTransport Sector 17
Section 2Indonesian Context
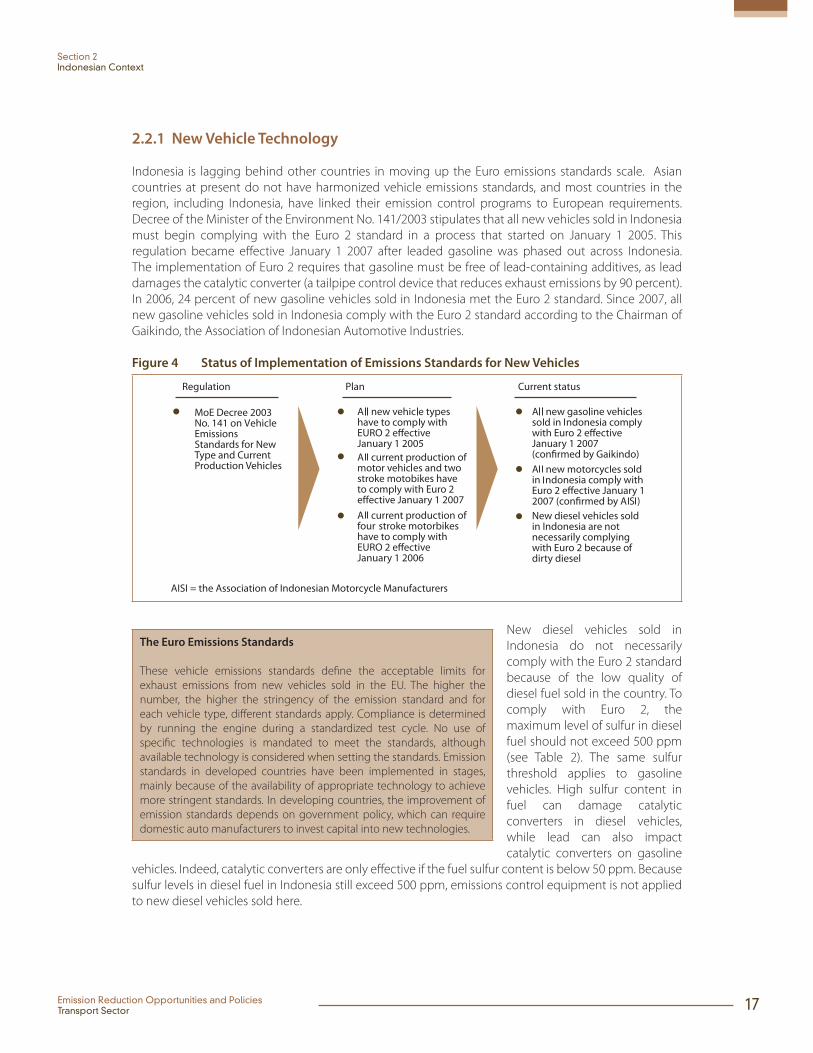
2.2.1 New Vehicle Technology
Indonesia is lagging behind other countries in moving up the Euro emissions standards scale. Asian
countries at present do not have harmonized vehicle emissions standards, and most countries in the
region, including Indonesia, have linked their emission control programs to European requirements.
Decree of the Minister of the Environment No. 141/2003 stipulates that all new vehicles sold in Indonesia
must begin complying with the Euro 2 standard in a process that started on January 1 2005. This
regulation became eff ective January 1 2007 after leaded gasoline was phased out across Indonesia.
The implementation of Euro 2 requires that gasoline must be free of lead-containing additives, as lead
damages the catalytic converter (a tailpipe control device that reduces exhaust emissions by 90 percent).
In 2006, 24 percent of new gasoline vehicles sold in Indonesia met the Euro 2 standard. Since 2007, all
new gasoline vehicles sold in Indonesia comply with the Euro 2 standard according to the Chairman of
Gaikindo, the Association of Indonesian Automotive Industries.
Figure 4 Status of Implementation of Emissions Standards for New Vehicles
The Euro Emissions Standards
These vehicle emissions standards defi ne the acceptable limits for
exhaust emissions from new vehicles sold in the EU. The higher the
number, the higher the stringency of the emission standard and for
each vehicle type, diff erent standards apply. Compliance is determined
by running the engine during a standardized test cycle. No use of
specifi c technologies is mandated to meet the standards, although
available technology is considered when setting the standards. Emission
standards in developed countries have been implemented in stages,
mainly because of the availability of appropriate technology to achieve
more stringent standards. In developing countries, the improvement of
emission standards depends on government policy, which can require
domestic auto manufacturers to invest capital into new technologies.
New diesel vehicles sold in
Indonesia do not necessarily
comply with the Euro 2 standard
because of the low quality of
diesel fuel sold in the country. To
comply with Euro 2, the
maximum level of sulfur in diesel
fuel should not exceed 500 ppm
(see Table 2). The same sulfur
threshold applies to gasoline
vehicles. High sulfur content in
fuel can damage catalytic
converters in diesel vehicles,
while lead can also impact
catalytic converters on gasoline
vehicles. Indeed, catalytic converters are only eff ective if the fuel sulfur content is below 50 ppm. Because
sulfur levels in diesel fuel in Indonesia still exceed 500 ppm, emissions control equipment is not applied
to new diesel vehicles sold here.
18 Emission Reduction Opportunities and PoliciesTransport Sector
Section 2Indonesian Context
New motorbikes already comply with Euro 2 standards since January 1, 2007, and are equipped with
catalytic converters when they are sold new. The issue with motorbikes is that owners regularly tamper
with tailpipes to increase power and noise. Some 20 percent of new motorbikes sold in Indonesia during
2007 have had their tailpipes modifi ed by owners, with the catalytic converter being removed in the
process (Bayu Arya, Autocar Magazine, Personal communication, October 5, 2008). Currently, no regulation
prohibits the removal of catalytic converters. While mandatory testing of new types of motorbikes is
not an issue, enforcing routine inspections of motorbikes that are already in use to ensure that catalytic
converters are functioning properly will be a daunting challenge.
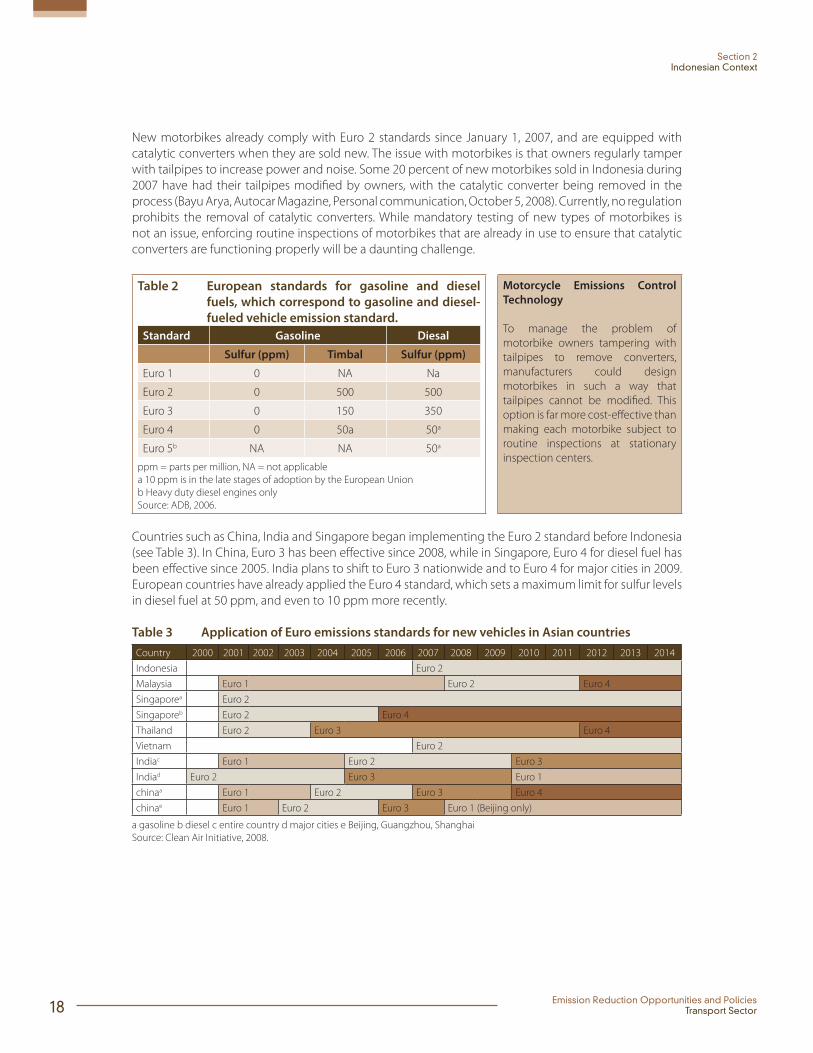
Table 2 European standards for gasoline and diesel
fuels, which correspond to gasoline and diesel-
fueled vehicle emission standard.
Standard Gasoline Diesal
Sulfur (ppm) Timbal Sulfur (ppm)
Euro 1 0 NA Na
Euro 2 0 500 500
Euro 3 0 150 350
Euro 4 0 50a 50a
Euro 5b NA NA 50a
ppm = parts per million, NA = not applicable
a 10 ppm is in the late stages of adoption by the European Union
b Heavy duty diesel engines only
Source: ADB, 2006.
Motorcycle Emissions Control
Technology
To manage the problem of
motorbike owners tampering with
tailpipes to remove converters,
manufacturers could design
motorbikes in such a way that
tailpipes cannot be modifi ed. This
option is far more cost-eff ective than
making each motorbike subject to
routine inspections at stationary
inspection centers.
Countries such as China, India and Singapore began implementing the Euro 2 standard before Indonesia
(see Table 3). In China, Euro 3 has been eff ective since 2008, while in Singapore, Euro 4 for diesel fuel has
been eff ective since 2005. India plans to shift to Euro 3 nationwide and to Euro 4 for major cities in 2009.
European countries have already applied the Euro 4 standard, which sets a maximum limit for sulfur levels
in diesel fuel at 50 ppm, and even to 10 ppm more recently.
Table 3 Application of Euro emissions standards for new vehicles in Asian countries
Country 2000 2001 2002 2003 2004 2005 2006 2007 2008 2009 2010 2011 2012 2013 2014
Indonesia Euro 2
Malaysia Euro 1 Euro 2 Euro 4
Singaporea Euro 2
Singaporeb Euro 2 Euro 4
Thailand Euro 2 Euro 3 Euro 4
Vietnam Euro 2
Indiac Euro 1 Euro 2 Euro 3
Indiad Euro 2 Euro 3 Euro 1
chinaa Euro 1 Euro 2 Euro 3 Euro 4
chinae Euro 1 Euro 2 Euro 3 Euro 1 (Beijing only)
a gasoline b diesel c entire country d major cities e Beijing, Guangzhou, Shanghai
Source: Clean Air Initiative, 2008.

Emission Reduction Opportunities and PoliciesTransport Sector 19
Section 2Indonesian Context
Diesel Fuel Quality and Local Air Pollutants
New vehicle emissions standards and diesel fuel quality specifi cations
need to be suffi ciently stringent to take advantage of technologies to
reduce nitrogen oxide (NOx) and particulate pollution. In the absence
of such standards, a shift to diesel should be discouraged by fi scal or
regulatory measures to avoid worsening air quality problem.
Emissions standards are an
example of the friction between
the public good and private
interest. Lower quality cars can
be produced at lower prices,
therefore producing greater sales
for manufacturers. Standards
impose greater costs on
manufacturers (and consumers) to change practices to improve air quality, a public good. Most major
developing countries in Asia have made improving air quality a goal of public policy and they are willing
to set increasingly stringent standards to achieve this. In particular, in China, India, Singapore, Malaysia,
and Thailand, the key factors that have helped these countries to enforce increasingly stringent Euro
standards are:
1) Comprehensive policy dialogue followed by agreement between the government, the auto industry,
and the fuel industry to adhere to a schedule for implementing the Euro standards, allowing the
automotive and fuel industries to make technical and fi nancial changes
2) Public pressure from within and outside the country
3) demonstration of fi scal and economic benefi ts of the measure and awareness of its benefi ts by key
decision-makers, including the national oil company, and
4) Strong political will that led to policy reform in the automotive and fuel sector.
Emissions Standards and Regional Competitiveness
By aligning its emission standards with other Asian countries, Indonesia
can keep a competitive edge in the automotive industry. This can be
achieved by sending the national auto industry a clear signal to invest
in clean and fuel- effi cient vehicles. Such a policy should be integrated
with a policy on fuel quality, so that the automotive industry and fuel
producers can begin planning ahead of time.
Fuels and vehicles are parts of an
integrated system and must be
addressed together. Indonesian
exports of Multi Purpose Vehicles
(MPV) to ASEAN countries and to
Japan reached a total export
value of US$ 2 billion in 2007. This
fi gure highlights that the
Indonesian automotive industry
is capable of producing motor vehicles that meet the higher vehicle standards applicable in countries of
export. Hence, the harmonization of vehicle standards is critical. The Indonesian automotive industry
intends to leapfrog from the Euro 2 to Euro 4 emissions standard for cars and light-duty vehicles in 2012,
and at the same time a majority of Asian countries will be upgrading to the Euro 4 standard. However,
there is a risk that this eff ort will not be successful if fuel specifi cations and quality in Indonesia do not
already meet the Euro 4 standard.1
Over the past decade, diesel technology has made tremendous advances. The higher effi ciency of
diesel engines compared to spark-ignite engines has the potential to reduce worldwide global warming
and oil consumption.2 Diesel vehicles consume 20 percent less fuel than comparable gasoline engines
(Bandivandekar and Blumberg, 2008). On the other hand, modern diesels produce signifi cantly more
NOx and particulate pollution than their gasoline counterparts. However, cost- eff ective technologies
exist that can reduce NOx and particulate emissions from new diesel vehicles, such as the use of catalytic
converter.
1 A recent study in China demonstrated that after operating for 20,000 km, a Euro 4 vehicle which uses lower fuel quality than
intended for this type of technology will deteriorate signifi cantly (Sheng, 2008).
2 Some countries may be interested in increasing the deployment of more effi cient diesel vehicles to decrease oil imports as part
of an energy security strategy.
20 Emission Reduction Opportunities and PoliciesTransport Sector
Section 2Indonesian Context
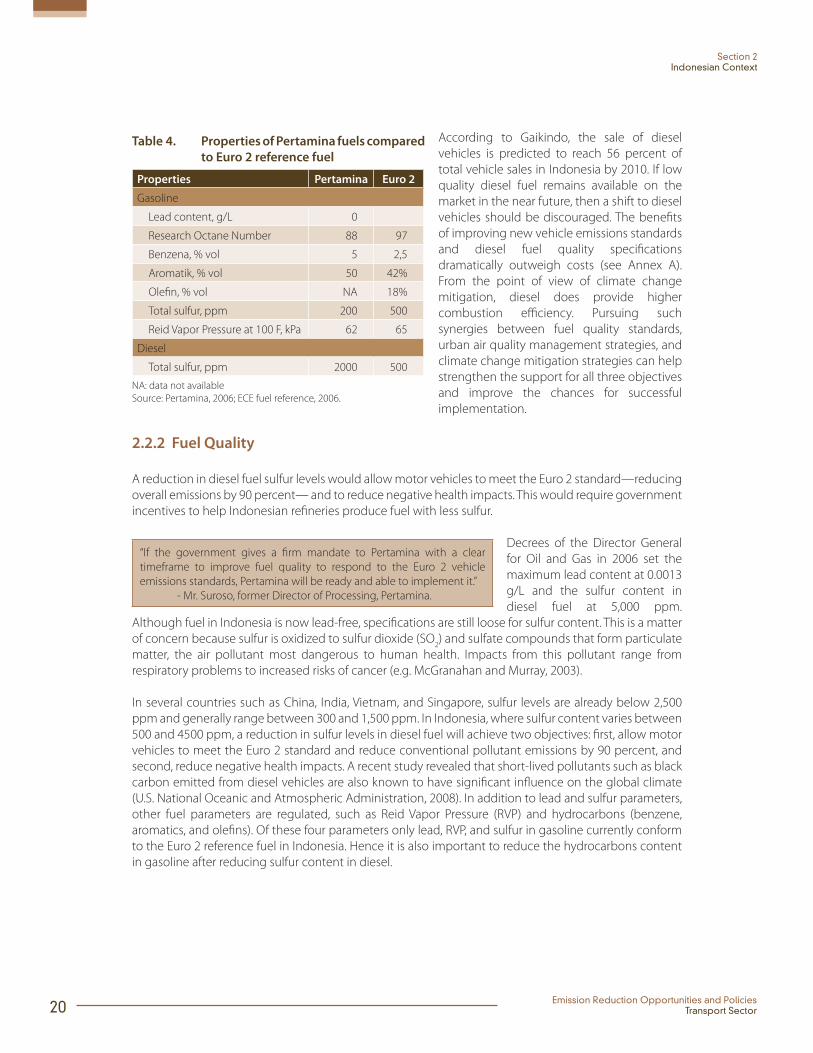
Table 4. Properties of Pertamina fuels compared
to Euro 2 reference fuel
Properties Pertamina Euro 2
Gasoline
Lead content, g/L 0
Research Octane Number 88 97
Benzena, % vol 5 2,5
Aromatik, % vol 50 42%
Olefi n, % vol NA 18%
Total sulfur, ppm 200 500
Reid Vapor Pressure at 100 F, kPa 62 65
Diesel
Total sulfur, ppm 2000 500
NA: data not available
Source: Pertamina, 2006; ECE fuel reference, 2006.
According to Gaikindo, the sale of diesel
vehicles is predicted to reach 56 percent of
total vehicle sales in Indonesia by 2010. If low
quality diesel fuel remains available on the
market in the near future, then a shift to diesel
vehicles should be discouraged. The benefi ts
of improving new vehicle emissions standards
and diesel fuel quality specifi cations
dramatically outweigh costs (see Annex A).
From the point of view of climate change
mitigation, diesel does provide higher
combustion effi ciency. Pursuing such
synergies between fuel quality standards,
urban air quality management strategies, and
climate change mitigation strategies can help
strengthen the support for all three objectives
and improve the chances for successful
implementation.
2.2.2 Fuel Quality
A reduction in diesel fuel sulfur levels would allow motor vehicles to meet the Euro 2 standard—reducing
overall emissions by 90 percent— and to reduce negative health impacts. This would require government
incentives to help Indonesian refi neries produce fuel with less sulfur.
“If the government gives a fi rm mandate to Pertamina with a clear
timeframe to improve fuel quality to respond to the Euro 2 vehicle
emissions standards, Pertamina will be ready and able to implement it.”
- Mr. Suroso, former Director of Processing, Pertamina.
Decrees of the Director General
for Oil and Gas in 2006 set the
maximum lead content at 0.0013
g/L and the sulfur content in
diesel fuel at 5,000 ppm.
Although fuel in Indonesia is now lead-free, specifi cations are still loose for sulfur content. This is a matter
of concern because sulfur is oxidized to sulfur dioxide (SO2) and sulfate compounds that form particulate
matter, the air pollutant most dangerous to human health. Impacts from this pollutant range from
respiratory problems to increased risks of cancer (e.g. McGranahan and Murray, 2003).
In several countries such as China, India, Vietnam, and Singapore, sulfur levels are already below 2,500
ppm and generally range between 300 and 1,500 ppm. In Indonesia, where sulfur content varies between
500 and 4500 ppm, a reduction in sulfur levels in diesel fuel will achieve two objectives: fi rst, allow motor
vehicles to meet the Euro 2 standard and reduce conventional pollutant emissions by 90 percent, and
second, reduce negative health impacts. A recent study revealed that short-lived pollutants such as black
carbon emitted from diesel vehicles are also known to have signifi cant infl uence on the global climate
(U.S. National Oceanic and Atmospheric Administration, 2008). In addition to lead and sulfur parameters,
other fuel parameters are regulated, such as Reid Vapor Pressure (RVP) and hydrocarbons (benzene,
aromatics, and olefi ns). Of these four parameters only lead, RVP, and sulfur in gasoline currently conform
to the Euro 2 reference fuel in Indonesia. Hence it is also important to reduce the hydrocarbons content
in gasoline after reducing sulfur content in diesel.

Emission Reduction Opportunities and PoliciesTransport Sector 21
Section 2Indonesian Context
Indonesian refi neries do not have the capacity yet to produce fuel with less sulfur, and government
incentives are necessary to make this happen. Monitoring of fuel pumps in Indonesia shows that average
sulfur levels in several cities in 2007 was 2,000 ppm (see Appendix). However, Pertamina’s refi neries
have already successfully produced diesel fuel with sulfur levels that are below the threshold set by the
Directorate General for Oil and Gas (but not the threshold required for Euro 2 emissions standard).
Progressive Improvements in Fuel Quality
There is a need to revise fuel specifi cations so that they initially
conform to the Euro 2 standard and progressively evolve to Euro
3 and/or Euro 4 fuel standards. As fuel consumption continues
to increase in the future, this will eventually create opportunities
for Indonesia to either a) add to its refi ning capacity by
upgrading existing refi neries or constructing new ones capable
of producing cleaner fuels, or b) to import cleaner fuels.
According to Pertamina, the capacity of
refi neries can be improved to produce
fuel with slightly lower levels of sulfur
compared to current fuel production. For
example, fuel sulfur levels at the Cilacap
refi nery can be reduced from 3,500 to
2,500 ppm. However, because Pertamina
also imports diesel fuel of inferior quality
(with sulfur content of 5,000 ppm
following the specifi cations set by
Director General of Oil and Gas), the overall sulfur level in fuel remains high in Indonesia. While such an
adjustment does not require additional investment, it will lead to reduced fuel volume/quantity.
According to Pertamina, as long as the fuel quality meets current standards set by the government
(Directorate General for Oil and Gas), the fi rm has no incentive to provide cleaner diesel that is more
expensive to produce.3 With 70 million barrels of diesel fuel being imported per year, switching to cleaner
diesel would require an additional US$ 140-210 million per year. This is a relatively small amount relative
to the amount currently allocated to fuel subsidies, about US$ 15 billion for 2008.
Planning Future Refi nery Technology
Planning for the introduction of cleaner fuels needs to account
for the specifi cations of such new refi neries as well as for the
specifi cations of existing refi neries that will continue to produce
transportation fuels in years to come.
Pertamina already has a fuel improvement
plan to conform its products to Euro 2
(and higher) emissions standards.
According to this plan, to meet the Euro 2
fuel standard (especially sulfur levels that
do not exceed 500 ppm) there will be a
need for new refi neries with a capacity of
300 thousand barrel crude oil per day
(MCBD) to produce an additional 4.7 million kL of gasoline and 2.3 million kL of diesel annually between
2008 and 2010. This will require an estimated US$ 500 million. Pertamina’s implementation of this plan
hinges on the government’s commitment. Should the government provide Pertamina with the mandate
to conform to the Euro 2 standard according to a specifi c timeframe, Pertamina will comply. However,
increased refi nery capacity and the importation of clean diesel will eventually increase fuel price and
subsidies. The incremental costs of meeting the recommended level of fuel sulfur in Asia averages US$
0.2-0.8 cents per liter for gasoline and US$ 0.5-0.8 US cents per liter for diesel (ADB, 2008).
2.2.3 Vehicle / Fleet Maintenance (Existing Vehicles)
As a growing number of new, cleaner vehicles become available on the Indonesian market through the
implementation of the Euro 2 emissions standard for gasoline vehicles, the share of polluting emissions
from the large number of older, uncontrolled vehicles will increase. Vehicle replacement policies have
focused on replacing high-use, older vehicles (e.g. taxi and vans), while retrofi t policies have favored
heavy-duty vehicles (e.g. trucks and buses) because of their long lifespan and the relative ease for
replacing their engines. Retrofi t programs around the world such as in China, Germany, and Sweden have
showed signifi cant effi ciency in reducing emissions.
3 The diff erence in price between imported diesel fuel with sulfur levels of 500 ppm and 5,000 ppm is US$ 2-3 per barrel.

22 Emission Reduction Opportunities and PoliciesTransport Sector
Section 2Indonesian Context
Improving diesel quality will have a multiplier eff ect not only
on the use of diesel fuel in road transportation, but also for
electricity generation, sea transportation, and agriculture.
However, increased refi nery capacity and
the Hybrid vehicles use two types of
power sources, fuel and electric. The
engine effi ciency is achieved by making
the best use of those two power sources. Electric power is used at low speeds and for abrupt movements
that require high fl exibility of power supply for the engine, while fuel power is used for high speeds.
Hybrid cars are designed to automatically shift power from fuel to electricity depending on vehicle speed
and road condition. This results in a one fourth reduction in fuel consumption compared to conventional
vehicles. Less fuel means fewer emissions.
However, with the current diesel fuel quality in Indonesia, the retrofi t of diesel vehicles may not be
cost-eff ective. Besides, retrofi t programs should also be complemented by robust inspection and
maintenance systems to ensure that the catalytic converter devices continue to operate properly. In
Indonesia, enforcement and awareness is very weak, making it even more challenging to implement
a retrofi t program successfully. As for gasoline vehicles, from a technical point of view retrofi tting is not
recommended because it can aff ect the overall engine performance. Moreover, the cost of catalytic
converters used for retrofi ts is increasingly expensive because of the high price of the materials to
manufacture the catalytic converters. Finally, global demand for retrofi tting is also declining as older and
dirtier vehicle fl eets are gradually phased out. Therefore, a retrofi t program may not be a cost-eff ective
solution in the long run, even if coupled with tax incentives.
2.2.4. Beyond Carbon Benefi ts: Local Pollution Reduction
There will be signifi cant co-benefi ts of fuel quality and fuel effi ciency improvements. In addition to
GHG emissions, transport is also the primary source of air pollution in cities in developing countries
(Colville et al., 2001). In four Indonesian cities (Jakarta, Surabaya, Bandung, and Semarang), transportation
contributes 45-65 percent of the total emissions of PM10 (particulate matter smaller than 10 microns), an
air pollutant that is harmful to health (Bappenas, 2006). Current levels of air pollution in Indonesia exceed
the World Health Organization’s air quality standard. The impact of air pollution on human health and
the environment is an issue of growing concern as it infl icts substantial costs to the government and to
society. The health costs due to air pollution are estimated at US$ 500 million per year in Jakarta alone and
US$ 100 million per year in Surabaya (Bappenas, 2006).
Emission Reduction Opportunities and PoliciesTransport Sector 23
Section 2Indonesian Context
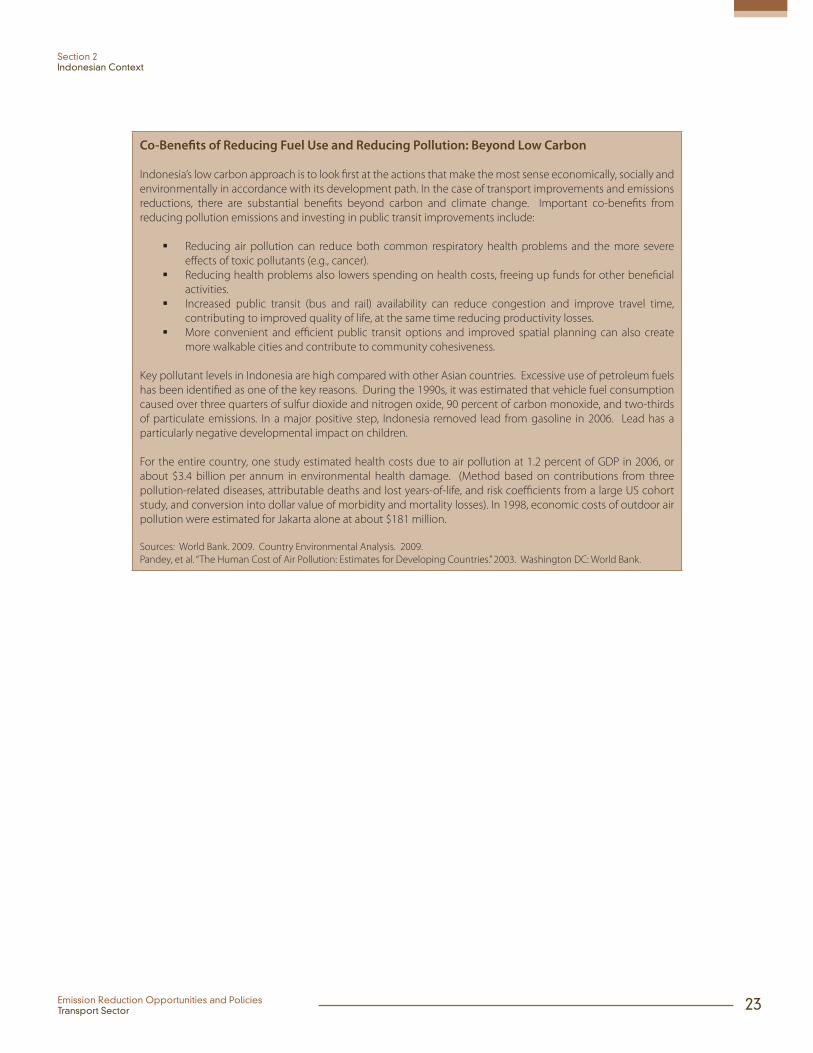
Co-Benefi ts of Reducing Fuel Use and Reducing Pollution: Beyond Low Carbon
Indonesia’s low carbon approach is to look fi rst at the actions that make the most sense economically, socially and
environmentally in accordance with its development path. In the case of transport improvements and emissions
reductions, there are substantial benefi ts beyond carbon and climate change. Important co-benefi ts from
reducing pollution emissions and investing in public transit improvements include:
Reducing air pollution can reduce both common respiratory health problems and the more severe
eff ects of toxic pollutants (e.g., cancer).
Reducing health problems also lowers spending on health costs, freeing up funds for other benefi cial
activities.
Increased public transit (bus and rail) availability can reduce congestion and improve travel time,
contributing to improved quality of life, at the same time reducing productivity losses.
More convenient and effi cient public transit options and improved spatial planning can also create
more walkable cities and contribute to community cohesiveness.
Key pollutant levels in Indonesia are high compared with other Asian countries. Excessive use of petroleum fuels
has been identifi ed as one of the key reasons. During the 1990s, it was estimated that vehicle fuel consumption
caused over three quarters of sulfur dioxide and nitrogen oxide, 90 percent of carbon monoxide, and two-thirds
of particulate emissions. In a major positive step, Indonesia removed lead from gasoline in 2006. Lead has a
particularly negative developmental impact on children.
For the entire country, one study estimated health costs due to air pollution at 1.2 percent of GDP in 2006, or
about $3.4 billion per annum in environmental health damage. (Method based on contributions from three
pollution-related diseases, attributable deaths and lost years-of-life, and risk coeffi cients from a large US cohort
study, and conversion into dollar value of morbidity and mortality losses). In 1998, economic costs of outdoor air
pollution were estimated for Jakarta alone at about $181 million.
Sources: World Bank. 2009. Country Environmental Analysis. 2009.
Pandey, et al. “The Human Cost of Air Pollution: Estimates for Developing Countries.” 2003. Washington DC: World Bank.

Emission Reduction Opportunities and PoliciesTransport Sector 25
Section 3
Greenhouse Gas Emissions and Transportation: Global Best Practice
Section 2 reviewed the largest sources of greenhouse gas emissions from the transportation sector and
examined the current eff orts to address fuel quality, air quality, and vehicle effi ciency. In this Section, a
comprehensive review of low carbon transportation options is presented based on international practices
with Indonesia-specifi c context provided where appropriate. The objective is to identify additional
measures and options that may complement fuel quality and vehicle effi ciency in a comprehensive,
long-term transportation development plan. This will enable GOI decision-makers to consider near-term
fi scal policy options in the context of broader program options that may be implemented in the coming
years.
As noted in the prior section, mitigation options in the transportation sector have generally been
categorized by mode (i.e., road travel, rail, aviation, and shipping). In Indonesia, road travel is responsible
for 88 percent transport sector greenhouse gas emissions and is the only sector of consequence with
respect to short-term measures that will have a signifi cant impact on reducing carbon intensity. Within
road travel, several categories of mitigation potential exist. These include (Kahn Ribeiro et al., 2007; also
summarized in Figure 3 above)4:
1. Reducing vehicle loads (i.e.,making cars and trucks lighter and more aerodynamic)
2. Increasing drive train effi ciency (i.e.,increasing fuel economy for a given weight)
3. Alternative fuels (e.g. CNG, biofuels, hydrogen, electricity)
4. Mode shifts and Transport Demand Management (TDM)
For the fi rst three options, it is critically important that full lifecycle analysis of various options take into
account GHG emissions associated with upstream activities required to produce alternative fuels or
technologies. Section 3.1 deals with both reducing vehicle load and increasing drive train effi ciency as
4 Driving practices are also mentioned as a potential area for mitigation. Studies have shown that a change in driving habits
(e.g. smoother acceleration, keeping engine revolutions and speeds low, etc.) can lead to 5 to 20 percent improvement in fuel
economy; however, it is challenging to motivate participation in a program of improvement and to maintain practices long
after training takes place. Providing personal fi scal incentives to participate in such programs may be considered in later stages
of a comprehensive transportation program that fi rst introduces clean fuels and more effi cient technologies. However, this
option is not seen as a strong candidate for immediate action in Indonesia and is not discussed further.
26 Emission Reduction Opportunities and PoliciesTransport Sector
Section 3Greenhouse Gas Emissions and Transportation: Global Best Practice
two diff erent aspects of overall vehicle effi ciency. Section 3.2 tackles the alternative fuel question and
Section 3.3 deals with mode shifts and TDM eff orts. Finally, section 3.4 returns to other, non-road modes
of transportation that will be a consideration for Indonesia in the future.
3.1 Improving Fuel Effi ciency (Vehicle Technology, Loads, and Drive Train)
Reducing vehicle loads and increasing drive train effi ciency both deal with the entrance of new, more
effi cient technologies to the market. From a manufacturers’ perspective, there is a great distinction
between these two options (and the alternative fuel option of hybrid-electric and electric vehicles). From
a regulatory and fi scal policy standpoint, governments tend to avoid selecting technological “winners
and losers.” These two options should not be viewed independently since manufacturers are in the best
position to decide how to satisfy consumer demand and to meet effi ciency standards within a given
regulatory framework. Historically, manufacturers have been able to “engineer to the standard” in such
a way as to guarantee that effi ciency and emission requirements are just met, but not exceeded. This
highlights the great need for strong and improving national standards to ensure that progress is realized.
The key issues are how much effi ciency is feasible over what timeframe and at what cost.
At present, Japan and Europe continue to lead the world with the most stringent passenger vehicle
greenhouse gas and fuel effi ciency standards. Japan’s recent strengthening of their regulations will
increase the stringency of that program while the European Union, which had initiated a voluntary
program, has not reached the desired targets. In 2007 the EU formally approved the shift to mandatory
standards (with some complementary measures) that are expected to achieve the desired level of
effi ciency (ICCT, 2007).
Meanwhile California’s greenhouse gas emission standard for passenger cars is expected to achieve the
greatest absolute reductions from any policy in the world. The rest of the United States continues to
lag behind other industrialized nations with respect to passenger vehicle standards, although options
being considered now could move the U.S. ahead of Canada, Australia, South Korea, and California by
2020 (ICCT, 2007). Two actions being taken by Canada and China bear special mention since they are
related specifi cally to fi scal policies. Canada has established the world’s only active “feebate” program
that provides incentives for highly fuel-effi cient vehicles and assesses a levy or fee to vehicles that do
not meet fuel effi ciency criteria. Similarly, the Chinese Government has signifi cantly reformed the
passenger vehicle excise tax to encourage production and purchase of small-engine automobiles and
eliminates the preferential tax rate for SUVs (ICCT, 2007). These sorts of fi scal policies would greatly ease
and complement implementation of emissions standards as discussed in Section 4.
A review of specifi c effi ciency options is provided in the Indonesian Technology Needs Assessment (BPPT
and KLH, 2009) and is outside the scope of this study. As Section 2 indicates, a necessary fi rst step toward
achieving increased fuel effi ciency is the introduction of cleaner fuels that enable advanced technologies.
This may entail additional refi nery capacity for low sulfur and other clean fuels. Fiscal policies such as tax
structures that encourage high effi ciency vehicles or fi scal incentives for expansion of clean fuel refi nery
capacity are explored in the next section.

Emission Reduction Opportunities and PoliciesTransport Sector 27
Section 3Greenhouse Gas Emissions and Transportation: Global Best Practice
3.2 Alternative FuelsAlternative fuels must be considered separately from other transportation technology options to reduce
greenhouse gas emissions and in a much broader policy context due to their signifi cant external linkages
on agriculture, forestry, national security, and the broader economy through fueling infrastructure.
Transportation is responsible for over 60 percent of national petroleum consumption, which is now an
expensive import commodity due to recent demand growth. In addition, over half of the government fuel
subsidy (as part of the public service obligation) goes to transportation fuels. Consideration of alternative
fuels and fi scal incentives to encourage their use is an integral step toward reducing the carbon intensity
of the transport sector.
Biofuels. “Biofuels” refers to a class of alternative fuels that include a variety of fuels derived by extracting
vegetable oils or fermenting sugars. Ethanol and biodiesel are the only two products that are currently
in wide-spread use (ethanol for blending with gasoline and biodiesel for blending with petroleum diesel
fuel), but research on other potential fuels is ongoing. Ethanol is primarily produced and used in Brazil
using sugarcane as a crop feedstock and in the U.S. where corn is used. Biodiesel is produced from
vegetable or animal oil and is of more interest in Asia where palm oil and jatropha are being grown. Palm
oil is the cheapest available feedstock for biodiesel production and it can be used relatively directly. A
blended fuel containing up to 20 percent biodiesel can be used in unmodifi ed engines, but production
costs are roughly twice the cost of petroleum-based diesel fuel.
Biofuels have generated considerable interest as a “renewable” source of fuel. More recent studies,
however have identifi ed important downside risks – life cycle emissions costs and competition with food
crops – that need full investigation. The net GHG benefi t of biofuel use is an area of considerable debate
due to the complexity of conducting a full lifecycle analysis for production of these fuels. The manner
of growing oil palm trees is one area of concern. If oil palm plantations are replacing natural forest or
disturbing peat swamp areas (important land uses that can store or emit carbon depending on how they
are managed), then the GHG benefi ts of this “renewable” resource can be lost (Kahn Ribeiro et al., 2007).
Palm oil is an important staple food in Asia. As with corn, use of food crops as a feedstock for diesel or
ethanol production puts fuel in direct competition with food production. Biofuels remain expensive,
especially when environmental costs are factored in. Only at sustained high oil prices are biofuels likely to
be produced commercially, otherwise they require tax subsidies.
Production of biofuels in Indonesia has been primarily motivated by energy policies with the aim to
substitute imported and/or subsidized oil with biofuels. More recently, support for biofuels has become
part of national policies for reducing CO2 emissions from the transportation sector. However, as mentioned
above, all biofuels are not equally eff ective in substituting for oil or in cutting GHG emissions. Local
biofuels produced from sugar cane and cassava (for ethanol), and palm oil and jatropha (for biodiesel)
have GHG abatement effi ciencies that can vary between 30 and 50 percent (Zah et al., 2007) and is
strongly dependent on lifecycle carbon balance of the land used for growing biofuel feedstock. Biofuels,
and the palm oil industry specifi cally, will be explored more fully in a forthcoming companion low carbon
development options report.
Compressed Natural Gas or CNG is another alternative to liquid fuels and has some historical precedent
for use in Indonesia. However, wider application of CNG is constrained by supply issues. Currently, there
are insuffi cient fi lling stations and poor service. In part, this is due to controlled prices that producers and
distributors consider too low to make a profi t. As a consequence, the low price of CNG is increasingly
off set by the time taken to travel to the decreasing number of fi lling stations, the time taken to refuel, and
additional maintenance as a consequence of oil and water in the CNG cylinder. Other forms of natural
28 Emission Reduction Opportunities and PoliciesTransport Sector
Section 3Greenhouse Gas Emissions and Transportation: Global Best Practice
gas (liquefi ed natural gas or LNG and liquefi ed petroleum gas or LPG) are also alternatives, however a
signifi cant energy penalty is incurred during the gas-to-liquids conversion and thus GHG benefi ts are
more modest. CNG has been popular in polluted cities because of its good emission characteristics.
However, in modern vehicles with exhaust gas after-treatment devices, the non-CO2 emissions from
gasoline engines are similar to CNG, and consequently CNG loses its emission advantages in term of local
pollutants; however it produces somewhat less CO2 (Kahn Ribeiro et al., 2007).
Hybrid and Electric Vehicles. While electric vehicles and hybrid-electric vehicles are technically using
alternative fuels (electricity), the models that are readily available now are hybrid-electric vehicles that
simply improve the effi ciency of traditional gasoline powered vehicles (see section 2.1 above). Hybrid
vehicles use two types of power sources, fuel and electric. The engine effi ciency is achieved by making
the best use of those two power sources. Electric power is used at low speeds and for abrupt movements
that require high fl exibility of power supply for the engine, while fuel power is used for high speeds.
Hybrid cars are designed to automatically shift power from fuel to electricity depending on vehicle speed
and road condition. This results in a one fourth reduction in fuel consumption compared to conventional
vehicles. Less fuel means fewer emissions. Given the higher costs and technical requirements, it is not
clear that use of these vehicles will become widespread in Indonesia any time soon.
Hydrogen as Fuel. The use of liquid hydrogen to power fuel cells is also an area of active research, but
given the cost, the long time frame for deployment, and the complications associated with new fueling
infrastructure, this is not likely to be viable for Indonesia soon.
3.3 Mode Shifts and Transport Demand ManagementGrowth in GHG emissions can be reduced by restraining the growth in personal vehicle ownership. Such
a strategy can, however, only be successful if high levels of mobility and accessibility can be provided by
alternative means (Kahn Ribeiro et al., 2007). Rail is attractive and eff ective at generating high ridership
in cities with high population density. Light-rail transit systems are more eff ective where land-use
planning is integrated with transportation planning. Bus Rapid Transit, or BRT, is ‘a mass transit system
using exclusive right of way lanes that mimic the rapidity and performance of metro systems, but utilizes
bus technology rather than rail vehicle technology’ (Wright, 2004). Upgrade of rail transport for urban
mass transit can be cost eff ective in an area with substantial existing lines and rights of way (for example,
Jakarta). Development of new rail systems can be very capital intensive. Bus Rapid Transit, in contrast,
can be developed for about 1/10th the cost (Kahn Ribeiro et al., 2007).
Non-motorized transport can also be eff ective in reducing transport demand (along with public
transportation alternatives) when land-use and urban development planning is integrated with
transportation planning to ensure that residential development is created within walking and bicycling
distance of commercial activities. Intelligent transportation systems (ITS) could potentially add information
and communication technologies to the existing transport infrastructure and vehicles in an eff ort to
manage factors that typically vie with each other (e.g. vehicles, loads, and routes) to improve safety and
reduce vehicle wear, transportation times, and fuel consumption (BPPT and KLH, 2009).

Emission Reduction Opportunities and PoliciesTransport Sector 29
Section 3Greenhouse Gas Emissions and Transportation: Global Best Practice
TransJakarta Busway: Indonesia’s Flagship Public Transport Initiative
Jakarta is growing fast and so are the challenges of traffi c congestion and harmful pollution that result from the
increasing use of cars and motorcycles. The TransJakarta Bus Rapid Transit system (opened in December 2004)
represents an urban transport breakthrough as the region’s fi rst full BRT system with physically separated bus-
only lanes, at-level boarding platforms, pre-paid ticketing, clean, Compressed Natural Gas (CNG) fuels, and other
features. (BRT systems are more common in Latin America.) By April 2009, the system had expanded to eight
corridors and served about 250,000 passengers a day. Travel time across the entire corridor has dropped by one
hour during the peak period. Over 20% of TransJakarta passengers have switched from using private cars for
some trips, and carbon dioxide emissions are being reduced at the rate of 20,000 metric tons a year. Motorized
vehicle ownership is growing at 9 percent every year, with more than 1,500 new registrations being fi led a day
for motorcycles and 500 a day for cars. In contrast, one bus carries about 100 passengers, resulting in faster
movement with lower emission per capita compared to private cars.
The Jakarta city administration is working with ITDP, Instran, Pelangi and UNEP on a GEF fi nanced project to
strengthen the system with enhancements to design, operation, fares, and routing, as well as non motorized
transit options. The Jakarta administration strives to improve the busway’s level of service to produce greater
effi ciency, cleaner air and more reliable and comfortable transportation. The Busway has had some important
successes, say project proponents, but the city also needs to integrate diff erent public transportation modes to
facilitate greater use and convenience. Busway user groups have been involved in a public education campaign
to promote a more user-friendly and livable city.
In a later stage, the Low Carbon Transport Sector analysis will further investigate the benefi ts and barriers to
expanding modal shift opportunities, such as BRT, to other urban centers in Indonesia.
Source: http://www.itdp-indonesia.org/index.php
3.4 Rail, Air, and Marine TransportWhile these transport categories currently represent only 12 percent of Indonesia’s total transportation
emissions, they may be important planning considerations for the GOI over the long term. These options
are included here to raise awareness that additional steps may be needed to maintain a decreasing
trend in carbon intensity. Rail transport options include reducing aerodynamic resistance, reducing train
weight, use of regenerative braking, and increasing effi ciency of the propulsion system. Aviation options
include engine effi ciency, airframe advances, aviation potential practices (e.g., taxi-time, altitude changes,
minimize distance between departure and destination, and reduce holding/stacking at airports), air traffi c
management, and reduced fl ight speeds. For shipping, near term options involve operational emission
abatement measures on existing ships given the relatively long in-use lifetime of maritime equipment.
Such measures include speed reduction, load optimization, maintenance, and fl eet planning. (Kahn
Ribeiro et al., 2007).
Fiscal policy options that could be considered to complement and advance such measures include
accelerated depreciation for railcars that are replaced with state-of-the-art aerodynamic, hybrid-diesel
engines with optimal air pollution control devices. Aviation policy is typically not within the purview of
an individual nation like Indonesia, but Indonesia can lobby for more progressive effi ciency standards
with the UN’s International Civil Aviation Organization (ICAO). Similarly, effi ciency standards and standard
operating procedures for marine vessels and ports are typically under the jurisdiction of the International
Maritime Organization (IMO).
30 Emission Reduction Opportunities and PoliciesTransport Sector
Section 3Greenhouse Gas Emissions and Transportation: Global Best Practice
World Bank’s Regional Energy Flagship Study
The Regional Energy Flagship Study has analyzed the security and sustainability of energy supply in the East Asia
Pacifi c Region. The objective was to identify potential changes in government strategies, roles and policies to
achieve a secure supply of clean energy resources and energy services at reasonable prices to sustain economic
growth and mitigate adverse local and global environmental eff ects. One aspect of the study focused on fuel
consumption and emissions from on-road transport in selected cities.
On-road transport is a signifi cant consumer of energy in the urban environment and the sector most closely
linked to petroleum products. Energy consumption for road transport is expected to grow signifi cantly in coming
years, especially in countries where increasing household income and urbanization contribute to private vehicle
ownership and use. The study examined alternative policy and technology scenarios and evaluated their impact
on energy consumption and pollution levels, including both local pollutants and greenhouse gases.
Indonesia’s Low Carbon analysis in the transport sector has benefi tted by learning from and building on the
results of the energy fl agship study.
Source: siteresources.worldbank.org/INTEAPINFRASTRUCT/Resources/EAP_Strategy.ppt

Emission Reduction Opportunities and PoliciesTransport Sector 31
Section 4
Low Carbon Options in the Indonesian Context
Sections 2 and 3 reviewed both the current transportation situation in Indonesia and globally, from both
an emissions and policy perspective. This section turns to the question of what the GOI could do to reduce
the carbon intensity of the transportation sector in the near-term while laying the groundwork for a more
comprehensive transportation plan moving forward. As with other low carbon development reports,
options are presented through the lens of fi scal policy as a point of entry for the Ministry of Finance to
engage with the many other planning agencies and ministries that deal with the transportation sector.
There is a direct causative link between improved fuel quality, fuel effi ciency and GHG emissions, and air
quality and public-health benefi ts. There are three reasons for focusing solutions on policy measures that
are related to vehicle emissions standards and cleaner fuels. First, improving vehicle emissions standards,
fuel standards, and fuel economy can be addressed relatively easily to reduce both vehicle emissions and
fuel consumption, while achieving substantial development benefi ts in terms of health and economic
effi ciency. Appropriate policies can provide strong incentives for improvement. By comparison, improved
public transport and compact land use planning are clear priorities, especially in Indonesia’s rapidly
growing cities, but implementation cannot be eff ected in the immediate short term or through policy
change alone. Second, emissions and fuel standards are considered a higher priority than inspection
and maintenance of in-use vehicles. Inspection and maintenance system can be rendered ineff ective
through lack of compliance or lack of capacity of local governments responsible for implementing these
measures. Third, new emissions and fuel standards will help to catalyze the implementation of other
measures and benefi ts, including the introduction of further improvements in vehicle technology.
The link between GHG emissions and fuel effi ciency is obvious. However, the link between improving fuel
effi ciency and reducing GHG emissions is less so. Experience in some countries reveals that improvements
in fuel effi ciency have actually resulted in increased transport mileage and higher emissions (Ewing et
al., 2008). If increased fuel effi ciency lowers fuel cost overall or per trip, people may feel able to take
longer trips or use the vehicle more (the rebound or conservation eff ect). Still, there are substantial co-
benefi ts of fuel and vehicle standards that also reduce sulfur, particulate matter and other conventional
pollutants (though fuel economy and lower pollutant emissions do not necessarily go together). For
example, authorities and producers in Europe and Japan have made a voluntary agreement to improve

32 Emission Reduction Opportunities and PoliciesTransport Sector
Section 4Low Carbon Options in the Indonesian Context
their fuel economies. The agreement seeks to achieve average CO2 emissions of 140 g/km by 2008 for
new passenger vehicles. In Europe, which has adopted ultra low sulfur diesel, the fuel economy target is
being pursued through a shift from gasoline engines to diesel. Currently more than 50 percent of vehicles
in Europe are diesel-fuelled. In Japan, the target is being approached through the introduction of smaller,
more effi cient cars. With heavy technology investments, Japan is currently the top runner in reaching a
target of 125 g/km of CO2 for passenger cars by 2015. In Europe, progress remains relatively slow.
Thus, lessons learned in Europe show that fuel economy standards are just one of the tools that can
be relied upon to meet oil reduction goals. Other approaches include reforming the rail system, land
use change, and promoting other transportation modes as reviewed in Section 3. Consumers have the
fl exibility to respond to high oil prices through short-term incentives, such as reducing commutes, and
improving vehicle maintenance, and medium-term incentives such as purchasing fuel-effi cient vehicles.
The full burden of fuel savings should not be necessarily placed on vehicle technology. While fuel
economy standards provide the greatest certainty in achieving fuel savings goals, purchase incentives
and fuel taxes provide incentives for continuous improvement of the fuel economy. The caveat is that in
Europe, as vehicles have become more effi cient, people drive larger distances, and opt for bigger, more
powerful cars, which translates into higher fuel consumption.
Leverage Japan’s Investment in Fuel Effi cient Cars
If mandatory fuel economy standards are introduced, Indonesia should take advantage of Japan’s role as the
leading manufacturer of vehicles in the country by encouraging the introduction of fuel-effi cient cars for the
Indonesian market as well as Europe or Japan. A clear policy to achieve these goals, involving air quality and fuel
savings, will compel the automotive industry to invest in the production of fuel-effi cient technologies.
Besides Japan, other countries in Asia that have introduced fuel economy standards are China, Korea, and
Taiwan. International experience suggests that there is good reason to combine fuel economy standards,
labeling (consumer information), and fi scal measures to prevent increase in size and weight of vehicles
and combine these measures to prevent trade-off s between effi ciency and harmful emissions (e.g.
diesel).
Consumer demand is also an important factor in vehicle sales and it can be infl uenced through fi scal
policy interventions. A study by the University of Indonesia in 2004 identifi ed the following factors that
aff ect consumers’ decision when they buy a car (ranked in order of importance):
1) Price
2) Resale Value
3) Durability
4) Capacity
5) Technology
6) Brand
7) Design
According to the study, the most elastic car demand was for all purpose vehicles or 4x2 Multi Purpose
Vehicles (MPVs), followed by small sedans and medium sedans. The least elastic car demand was for 4x4
MPVs and luxury sedans. Low purchasing power led to consumers’ preference for 4x2 MPVs, with a price
range between US$ 7,500 and US$ 15,000.
In Europe, high income and high vehicle prices suggest that additional vehicle costs of US$ 2,000 to US$
2,500 (10-12 percent of price) can improve the fuel economy by 35 to 40 percent without having major
disruptive eff ects on markets. In a price-sensitive market like Indonesia, however, such additional costs
may have a major eff ect on sales (Duleep, 2008). Price sensitivity may be a substantial barrier to Hybrid-
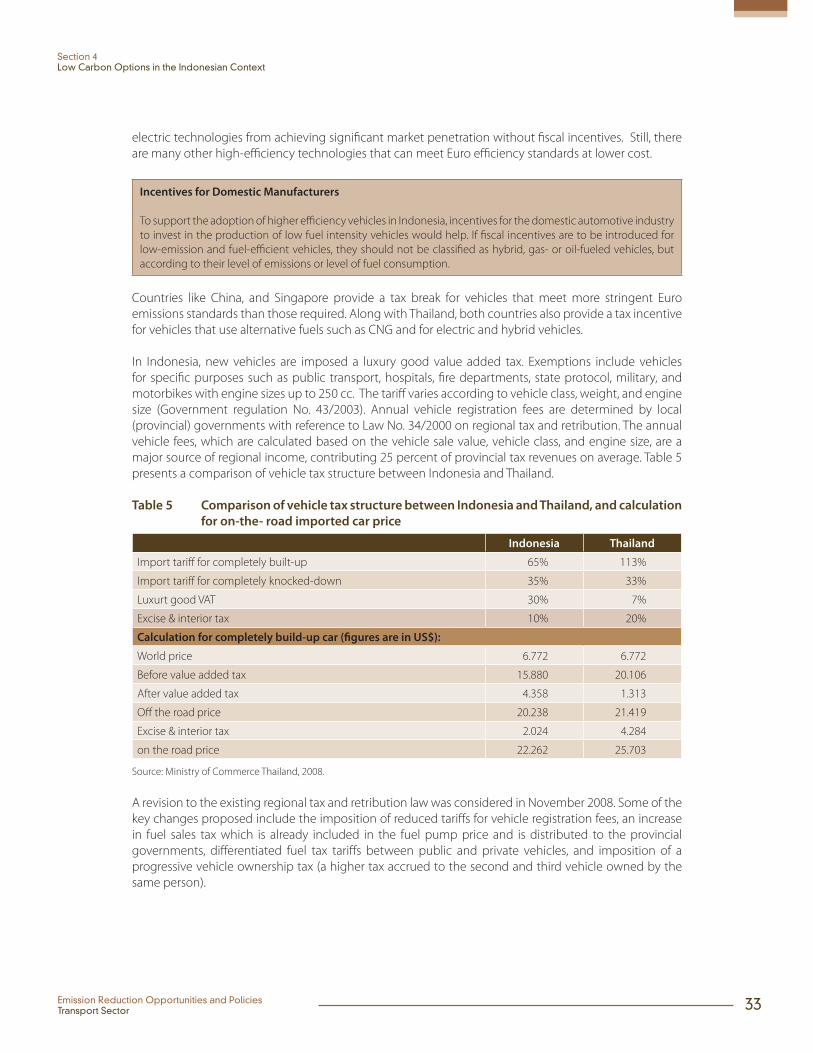
Emission Reduction Opportunities and PoliciesTransport Sector 33
Section 4Low Carbon Options in the Indonesian Context
electric technologies from achieving signifi cant market penetration without fi scal incentives. Still, there
are many other high-effi ciency technologies that can meet Euro effi ciency standards at lower cost.
Incentives for Domestic Manufacturers
To support the adoption of higher effi ciency vehicles in Indonesia, incentives for the domestic automotive industry
to invest in the production of low fuel intensity vehicles would help. If fi scal incentives are to be introduced for
low-emission and fuel-effi cient vehicles, they should not be classifi ed as hybrid, gas- or oil-fueled vehicles, but
according to their level of emissions or level of fuel consumption.
Countries like China, and Singapore provide a tax break for vehicles that meet more stringent Euro
emissions standards than those required. Along with Thailand, both countries also provide a tax incentive
for vehicles that use alternative fuels such as CNG and for electric and hybrid vehicles.
In Indonesia, new vehicles are imposed a luxury good value added tax. Exemptions include vehicles
for specifi c purposes such as public transport, hospitals, fi re departments, state protocol, military, and
motorbikes with engine sizes up to 250 cc. The tariff varies according to vehicle class, weight, and engine
size (Government regulation No. 43/2003). Annual vehicle registration fees are determined by local
(provincial) governments with reference to Law No. 34/2000 on regional tax and retribution. The annual
vehicle fees, which are calculated based on the vehicle sale value, vehicle class, and engine size, are a
major source of regional income, contributing 25 percent of provincial tax revenues on average. Table 5
presents a comparison of vehicle tax structure between Indonesia and Thailand.
Table 5 Comparison of vehicle tax structure between Indonesia and Thailand, and calculation
for on-the- road imported car price
Indonesia Thailand
Import tariff for completely built-up 65% 113%
Import tariff for completely knocked-down 35% 33%
Luxurt good VAT 30% 7%
Excise & interior tax 10% 20%
Calculation for completely build-up car (fi gures are in US$):
World price 6.772 6.772
Before value added tax 15.880 20.106
After value added tax 4.358 1.313
Off the road price 20.238 21.419
Excise & interior tax 2.024 4.284
on the road price 22.262 25.703
Source: Ministry of Commerce Thailand, 2008.
A revision to the existing regional tax and retribution law was considered in November 2008. Some of the
key changes proposed include the imposition of reduced tariff s for vehicle registration fees, an increase
in fuel sales tax which is already included in the fuel pump price and is distributed to the provincial
governments, diff erentiated fuel tax tariff s between public and private vehicles, and imposition of a
progressive vehicle ownership tax (a higher tax accrued to the second and third vehicle owned by the
same person).
34 Emission Reduction Opportunities and PoliciesTransport Sector
Section 4Low Carbon Options in the Indonesian Context
However, overall the proposed tax regime does not address sustainable transportation issues. Tariff s are
not based on certifi cation of emissions or the level of fuel consumption of new vehicles when they are
manufactured. While a progressive ownership tax is a step in the right direction, the vehicle use tax is
equally important as the more kilometers are driven, the more emissions are generated and the more
fuel is used.
China, Singapore, and Thailand have adopted an incentive-based approach in enforcing Euro emissions
standards and fuel standards by providing tax-neutral incentives for low-emission vehicles and low fuel
intensity vehicles. For example, Singapore imposes diff erent registration fees for liquid-fuelled/CNG-
fuelled vehicles and electric/hybrid vehicles, which are 110 percent and 70 percent of the open market
value respectively. The registration fees are even lower for Euro 4 taxis and CNG-fuelled taxis (30 percent),
Euro 2 diesel heavy-duty vehicles (5 percent), and Euro 4 diesel buses and goods vehicles (0 percent).
China and India responded to the issue of limited supplies of cleaner fuel by prioritizing distribution in
large cities where most motor vehicles are found.
Looking at mode shift and alternative fuel options, the Agency for the Assessment and Application of
Technology (BPPT has investigated a number of transport and emissions issues in its recent Technology
Needs assessment (2009). BPPT focused on CNG and mode shift as two important opportunities for
Indonesia in the transport sector. The Technology Needs Assessment shows that specifi c eff orts to
reduce travel time on long journeys would be environmentally benefi cial (the calculations are based on
data from the Ministry of Transport’s regular studies of transport habits, coupled to modeling simulations
of travel time). BPPT proposes the following strategies:
Improvement of conditions for long journeys, i.e., trains and regional bus routes, especially in
combination with increased speed. Improvements would be viable if the increased frequency is
off set by introduction of shorter trains.
Signifi cant improvement for long journeys could be achieved through better coordination
between bus and train schedules.
Eff orts should be made to improve the frequency of urban buses, specifi cally aimed at achieving
better coordination with regional traffi c.
The introduction of smaller buses would be environmentally benefi cial in cases where service is
currently poor, for example in rural areas.
Introduction of “upon-request” services would allow greater adaptation to customer demand
and time savings, with less eff ort.
Use of “intelligent transport systems” (ITS) to help coordinate public transport.
There are also many opportunities for fi scal policy implementation to create incentives for choices that
move toward a low carbon path. As discussed in Section 3, Canada has introduced a “feebate” program
that includes both an increase in taxes or fees for low effi ciency vehicles as well as a rebate from the
government to consumers that invest in high effi ciency vehicles. The program has not been running
long enough to defi nitively state its success, but it may – over time – represent a model for a revised tax
regime in Indonesia. More study of fi scal policy options would be benefi cial.
Emission Reduction Opportunities and PoliciesTransport Sector 35
Section 4Low Carbon Options in the Indonesian Context
Canadian Auto Feebate Program
Canada’s feebate program combines two fi scal instruments. The fee part levies a tax on fuel-ineffi cient vehicles.
The rebate part off ers a substantial refund on the purchase price of a fuel-effi cient vehicle. Feebate programs
are designed to shift buying habits toward more favored transportation options. Other familiar fi scal policy
interventions in the transport sector (which may aim to reduce travel, emissions, and congestion) include: fuel
taxes, vehicle registration fees, congestion charging, and road pricing. The feebate program builds an incentive
into the price of a more effi cient automobile. Some argue that higher fuel charges would provide greater
incentives for drivers to reduce travel and switch to more fuel-effi cient cars.
Many support the feebate concept in Canada, but note that it could be more effi cient or acceptable if it were
phased in over time and allowed for greater coverage of more auto models in the fl eet. Currently, limited
applicability reduces the eff ectiveness and reach of the policy, and limits the incentive for manufacturers to make
continuous improvements. Greater dialogue with manufacturers and a pre-announced schedule for expanding
the program and tightening the requirements would allow more time for manufacturers to adjust auto models in
the most cost eff ective manner. Feebates are a type of fi scal policy that can be integrated into a comprehensive
strategy for the transport sector. More investigation is needed in next phase of work.
Sources: www.greencarcongress.com/2007/11/study-canadian.html
www.oilendgame.com/pdfs/Implementation/WtOEg_FeebatesUpdate.pdf


Emission Reduction Opportunities and PoliciesTransport Sector 37
Section 5
Conclusions and Next Steps
This report has attempted to synthesize information on Indonesia’s transportation sector and policy
options that can help planning agencies reduce the carbon intensity of transport over time. The
study fi nds that several key initial steps will lay the foundation for a more comprehensive low carbon
development plan to be analyzed and implemented over time. These fi rst key steps are summarized
here with a rationale for why they apply to Indonesia, specifi cally. The section then concludes with
thoughts on a continued program of evaluation, coordination, and policy development that will usefully
complement these fi rst steps and serve to inform the National Council on Climate Change, Ministry of
Finance and other GOI ministries and stakeholders.
Key First StepsGiven Indonesia’s low incomes, capital scarcity, weak enforcement of emission control regulations,
high on-road GHG emissions, urban air pollution, and continuing fuel subsidies, simple policies in the
transportation sector that do not require controlling emissions of in-use vehicles, but rather promote
economic effi ciency and incentives are called for. In particular, Indonesia’s current status as a net oil
importer suggests that an increasing global price of crude oil will lead to greater fuel subsidies and
reduced fi scal sustainability. These facts points to the need for GHG reduction policies that increase fuel
savings from cars and trucks.
Based on international experience, the simplest way to reduce fuel use (and associated GHG emissions
and air pollution) is through vehicle emission and fuel specifi cation standards. By progressing from
Euro 2 to Euro 4 standards for vehicle emissions and fuel quality, GOI can signifi cantly bring down the
rapid projected growth of on-road vehicle emissions without the need for complicated enforcement
programs (i.e. inspection and maintainence for individual vehicles). However, it must be stressed that
a necessary precondition for this policy to be eff ective is to ensure and enforce (at the refi nery level)
the fuel quality provisions of this program. The fuel-saving and air quality-improving technologies built
into Euro 4 vehicles depend on consistent fuel quality. In parallel, CNG use for high-use public transport
38 Emission Reduction Opportunities and PoliciesTransport Sector
Section 5Conclusions and Next Steps
vehicles should be revitalized through removal of barriers (e.g. gas supply and pricing issues, gas quota
and distribution, infrastructure, safety regulation enforcement) to decrease reliance on higher emitting
diesel fuel and gasoline.
Key Short-term Actions:
Improve fuel quality, especially through a reduction in sulfur levels in diesel, in a strategic and consistent way.
Leapfrog from Euro 2 to Euro 4 standards for vehicle emissions and fuel specifi cations.
Revitalize CNG use for high-use public transport vehicles by removing barriers (supply, pricing issues, gas
quota and distribution, infrastructure, safety regulation enforcement)
Restructure the vehicle taxation system to include incentives that are based on emissions or fuel
consumption levels.
Introduce mandatory labeling of CO2 emissions from motor vehicles sold on the Indonesian market, so
that consumers can make informed purchasing decisions.
Invest in expanded and improved refi nery capacity to ensure that plenty of clean fuel supply exists to meet
new demand for low-sulfur petroleum products as tighter vehicle standards are introduced. This brief study
does not address the fi nancing requirements.
Several complementary actions can ease the implementation burden of these measures. Restructuring
the vehicle taxation system to include incentives that are based on emissions or fuel consumption
levels will allow consumers to contribute to reducing vehicle emissions. The introduction of mandatory
labeling of CO2 emissions from motor vehicles sold on the Indonesian market will help consumers to
make informed purchasing decisions. Finally, ensuring adequate uniformly clean fuel supply through
expansion of domestic refi nery capacity is needed to enable the Euro 4 transition.
These are all reasonable “no regrets” policies that can be recommended from the point of view of health,
pollution, social costs, energy effi ciency and security – not just climate or low carbon rationales. In
fact, three policy options appear to be extremely cost-eff ective providing the highest net benefi ts as
evidenced by the cost-benefi t analysis provided in Appendix A. These measures include: (1) improvement
of fuel quality to meet stricter Euro fuel standards, (2) introduction of fuel economy standards, and (3)
revitalization of CNG use (See Appendix A). Leapfrogging from Euro 2 to Euro 4 emissions standards
demonstrates no signifi cant diff erence of expenditure, while increasing the capacity of the national oil
refi nery to produce clean diesel is more benefi cial than merely importing clean diesel. Economically,
vehicle taxation is considered as the most powerful tool to infl uence consumer purchasing. By introducing
such a diff erentiated tax system, the policy would encourage the market introduction, purchase and use
of fuel-effi cient and low-emission vehicles.
These recommendations should be considered—and applied—as a whole, rather than as individual
actions to be taken in isolation from each other. An integrated strategy that includes tighter vehicle and
emissions standards, fi scal corrections and technological improvements is the best path to eff ectively
increase energy security and improve the well-being of Indonesians.

Emission Reduction Opportunities and PoliciesTransport Sector 39
Section 5Conclusions and Next Steps
Building Toward a Low Carbon ProgramKey Next Steps:
Carry out further cost and policy impact analysis and prepare action plans followed by investment plans
for the key options identifi ed: improvement of fuel quality, revitalization of CNG use, and introduction of fuel
economy standards. Examine complementary policies that will ease implementation of these measures, such as
consumer education and labeling programs, refi nery investments, and effi ciency-based tax incentives.
Coordinate across Government to ensure that a comprehensive, long-term transportation plan that explores
public transit options, mode shifting, and transportation demand management elements is integrated into a
broader sustainable economic development plan, supported by all agencies and stakeholders.
Looking ahead to the next phase of analysis of low carbon development options, it is clear that a more
detailed economic analysis is needed to examine potential fi scal policy mechanisms and macroeconomic
implications of proposed options in the context of the Indonesian economy. The essential study design
should include an analysis of “no regrets” Indonesian transportation policies that make sense from the
perspective of public health and economic effi ciency alone. This could serve as a policy baseline and
might include improvements to fuel quality or investment in CNG infrastructure and fl eets. A low carbon
scenario could then build on this analysis to explore the incremental costs and benefi ts of adopting Euro
4 standards, implementing tax incentives, or providing refi nery investment. This analysis should explore
the timing of various path dependent options (e.g. widespread deployment of diesel versus gasoline
technologies) to avoid issues of “lock-in” that might result in signifi cantly diff erent GHG or public health
outcomes. The follow on study should also examine the distinction between broader socio-economic
benefi ts of the policy options and their monetary or fi scal benefi ts.
In addition to economic analysis, there is a need to coordinate recommendations across ministries
responsible for transportation planning and other transportation system stakeholders (clearly the fi scal
policy component lies with the Ministry of Finance). This coordination should serve as a foundation for
integrated transportation planning that encompasses climate policy and reduced carbon intensity as a
central component of overall sustainable economic development. Fiscal policy has been identifi ed as
a key incentive for shifting consumer preferences and serves as an important factor in determining the
economic viability of several program options. Thus inclusion of the MoF in transportation planning
should be mainstream practice. During the coming year, key stakeholder agencies and industry groups
should be brought together to explore fi scal and low carbon aspects of transportation planning similar
to the “focus group discussions” or FGD process that was implemented for other sectors in the low carbon
development study.
This process would have a two-fold purpose to examine the institutional context for the short-term action
steps identifi ed above and to give more thought and attention to options beyond fuel quality and fuel
effi ciency. With respect to the institutional context of short term measures, the Ministry of Finance’s role
is primarily limited to complementary actions that would support fuel and effi ciency requirements. It
is essential that the level and timing of complementary tax or fi nancing measures are coordinated with
regulatory changes implemented by other Ministries and with the buy-in of other transportation sector
stakeholders (refi ners, automobile manufacturers, distributors, etc.).
The coordination process can also provide an entry point to discussion of Transport Demand
Management, bus rapid transit (e.g., TransJakarta Busway), expanded rail service, and non-motorized
transport. Alternative fuel strategies include biofuels from palm oil, CNG for public transit and – in the

40 Emission Reduction Opportunities and PoliciesTransport Sector
Section 5Conclusions and Next Steps
future – hybrid-electric automobiles and fl eet trucks powered by a clean electric grid. Smart growth
strategies can complement Transport Demand Management and eff orts to reduce vehicle trip length.
Finally, fi scal policy options – examples include feebate, subsidy reduction, and other diff erential taxation
policies – are another important part of an integrated approach. The harmonization of views among
diff erent agencies and levels of government (local vs. regional or national) on the major options available
for consideration and the criteria for choosing among them (not just carbon, but also market trends,
economic development, etc.) will be an ongoing need.
Initial steps in this direction could include a study to map out how to go from centralized versus
decentralized transportation planning (by individual agencies with competing priorities) to a system
that recognizes inter-regional needs and interdependencies among local and national systems (bus to
rail, for example). It will be useful to examine the characteristics (and international examples) of future
transportation planning approaches that have coordinated goals and objectives, complemented by
central government plans and fi scal policies that create an enabling environment for improved local and
individual decisions about transportation.
Emission Reduction Opportunities and PoliciesTransport Sector 41
References
Abdurahman. (2008). Government policy related to subsidy and fuel prices. Presented at seminar Fuel
Effi ciency to Address Raising Fuel Prices, Jakarta, Indonesia.
AISI. (2008, February). Motorcycle and exhaust emissions in Indonesia. Proceedings JARI- Indonesia
Roundtable. Jakarta
Asian Development Bank (ADB). (2002). Integrated vehicle emission: Reduction strategy for Greater Jakarta
(RETA 5937). Manila, Philippines: ADB.
Asian Development Bank (ADB). (2003). Policy guidelines for reducing vehicle emissions in Asia: Reducing
vehicle emissions in Asia. Manila, Philippines: ADB.
Asian Development Bank (ADB). (2008). A road map for cleaner fuels and vehicles in Asia (TA 6144 REG:
Better Air Quality Management in Asia). Manila, Philippines: ADB.
Badan Pusat Statistik. (2007). Statistik Perhubungan [in Indonesian]. Jakarta, Indonesia: BPS.
Bandivandekar, A. & Blumberg, K. (2008, November). Diesel passenger cars: Safeguarding air quality and
global climate in a shifting market. Presented at Better Air Quality Conference, Bangkok, Thailand.
Bappenas. (2006). National strategy and action plan for urban air quality improvement. Jakarta, Indonesia:
Bappenas.
Bappenas (2007a). Indonesia country natural resource environment analysis. Jakarta, Indonesia: Bappenas.
Bappenas (2007b). National development planning response. Jakarta, Indonesia: Bappenas.
Bear, T (2002). Valuation of pollutants emitted by road transport into the Australian atmosphere. Proceedings
of the 16th International Clean Air & Environment Conference, Christchurch, New Zealand.
Blumberg, K., Kebin, H., Yu, Z., Huan, L. &Yamaguchi, N. (2006). Costs and benefi ts of reduced sulfur fuels in
China. The International Council on Clean Transportation.
Boardman, A.E., Greenberg, D.H., Vining, a.R., & Weimer, D.L. (1996). Cost benefi t analysis: Concepts and
practice. New Jersey, USA: Prentice-Hall, Inc.
BPPT and KLH, 2009. Technology Needs Assessment for Climate Change. The Agency for the Assessment
and Application of Technology (BPPT) and Ministry of Environment. March 2009.
Clean Air Initiative for Asian Cities (CAI-Asia) (2006, October). Urban air quality and its management in Asia
Status Report 2006. Presented at the Regional Dialogue of Air Quality management Initiatives and Programs
in Asia, Bangkok.
42 Emission Reduction Opportunities and PoliciesTransport Sector
References
Colville, R.N., Hutchinson, E.J., Mindell, J.S., & Warren, R.F. (2001). The transport sector as a source of air
pollution. Atmospheric Environment, 35, 1537-1565.
Cruz, R.V., Harasawa, M., Lal, S., Wu, Y., Anokhin, B., Punsalmaa, Y., Honda, M., Jafari, C., Li and N., Huu Ninh
(2007). Asia: Climate Change 2007: Impacts, Adaptation and Vulnerability. Contribution of Working Group II to
the Fourth Assessment Report of the Intergovernmental Panel on Climate Change, M.L. Parry, O.F. Canziani, J.P.
Palutikof, P.K. van der Linden and C.E. Hanson, Eds., Cambridge University Press, Cambridge, UK.
Dixson-Declève, S. (2005). Fuel quality best practice overview: Application to Vietnam’s fuel quality strategy.
USAID Asia.
Duleep, K.G. (2008, November). Technology for fuel effi ciency: A global outlook. Presented at Better Air
Quality Conference, Bangkok, Thailand.
Ewing, R., Bartholomew, K., Winkelman, S., Walters, J., and Chen, D. (2008). Growing cooler: The evidence on
urban development and climate change. Executive Summary. Urban Land Institute.
Gaikindo (2008, February). Vehicle demand and environment issues. Proceedings JARI-Indonesia Roundtable.
Jakarta.
Geosciences (2003). Fuel quality and vehicle emissions standards cost benefi t analysis prepared for Motor
Vehicle Environment Council (MVEC) review of vehicle emissions and fuel standards post 2006.
German, J. (2007, October). Advanced Technologies: Diesels and hybrids. Presented at Workshop on Fuel
Economy: Technology Trends and Policy Options. Washington DC: the International Council on Clean
Transportation.
Gordon, D. (2005). Fiscal policies for sustainable transportation: International best practices. The Energy
Foundation and the Hewlett Foundation.
Ho, M.S. & Jorgenson, D.W. (2008). Greening China: Market-based policies for air-pollution control. Harvard
Magazine September October 2008.
Hwang, R.J. (2004, April). The US experience with CAFÉ fuel savings and lessons learned. Presented at
Workshop on Fuel Effi ciency Opportunities in Mexico. Mexico City: the International Council on Clean
Transportation.
International Transport Forum (2007). Biofuels: Linking support to performance. Joint Transport Research
Center-Roundtable. Paris, France: OECD.
ICCT, 2007, Passenger Vehicle Greenhouse Gas and Fuel Economy Standards: A Global Update, International
Council on Clean Transportation, Washington, DC, July 2007.
Kahn Ribeiro, S., S. Kobayashi, M. Beuthe, J. Gasca, D. Greene, D. S. Lee, Y. Muromachi, P. J. Newton, S. Plotkin,
D. Sperling, R. Wit, P. J. Zhou, 2007: Transport and its infrastructure. In Climate Change 2007: Mitigation.
Contribution of Working Group III to the Fourth Assessment Report of the Intergovernmental Panel on
Climate Change [B. Metz, O.R. Davidson, P.R. Bosch, R. Dave, L.A. Meyer (eds)], Cambridge University Press,
Cambridge, United Kingdom and New York, NY, USA.

Emission Reduction Opportunities and PoliciesTransport Sector 43
References
KNLH, 2008. Emisi Gas Rumah Kaca Dalam Angka, Kementerian Negara Lingkungan Hidup, Jakarta,
Indonesia.
LEMIGAS (2004). Clean vehicle fuels for blue skies. Auckland, New Zealand: Maunsell Limited. source of air
pollution. Atmospheric Environment, 35, 1537-1565.
McGranahan, G., & Murray, F. (2003). Air pollution and health in rapidly developing countries. United Kingdom:
Earthscan.
Ministry of Environment (2008). Air quality monitoring data 2001-2007. Jakarta, Indonesia: KLH.
Ministry of Finance and the World Bank. (2008). Indonesia low-carbon development options: Country case
strategy. Jakarta, Indonesia: WB
NSW EPA. (2003). Clean cars for NSW. Sydney, NSW.
Pertamina. (2008). Fuel consumption in Indonesia. Jakarta, Indonesia: Pertamina.
Roychowdury, A. (2008, November). Global approaches to fuel economy regulations: Lessons for Asia.
Presented at Better Air Quality Conference, Bangkok, Thailand.
Schipper, L. (2004, April). Improving fuel economy and saving fuel in Mexico: Experience in Europe.
Presented at Workshop on Fuel Effi ciency Opportunities in Mexico. Mexico City: the International Council on
Clean Transportation.
Sheng, H. (2008, November). Fuel economy standards: China perspective. Presented at Presented at Better
Air Quality Conference, Bangkok, Thailand.
U.S. EPA. (2003a). Draft 2003 report to Congress on the costs and benefi ts of Federal Regulations. Federal
Register 68:22.
U.S. EPA (2003b). Clean Fuels and Vehicles Partnership – Sulfur Working Group – Q&A on sulfur in gasoline and
diesel fuel.
Walsh, M.P. (1999). Pollution from diesel vehicles worldwide survey on retrofi t catalyst technology. The Hong
Kong Environmental protection Department.
World Resources Institute (WRI). (2008). Climate and atmosphere, CO2 emissions: Indonesia.
Wright, L., 2004. Bus Rapid Transit Planning Guide. GTZ, Eschborn,
Germany, 225 pp.
Zah, R., Böni, H., Gauch, M., Hischier, R., Lehmann, M., & Wäger, P. (2007). Life-cycle assessment of energy
products: Environmental assessments of biofuels. Gallen, Switzerland: Empa Technology and Society
Laboratory.
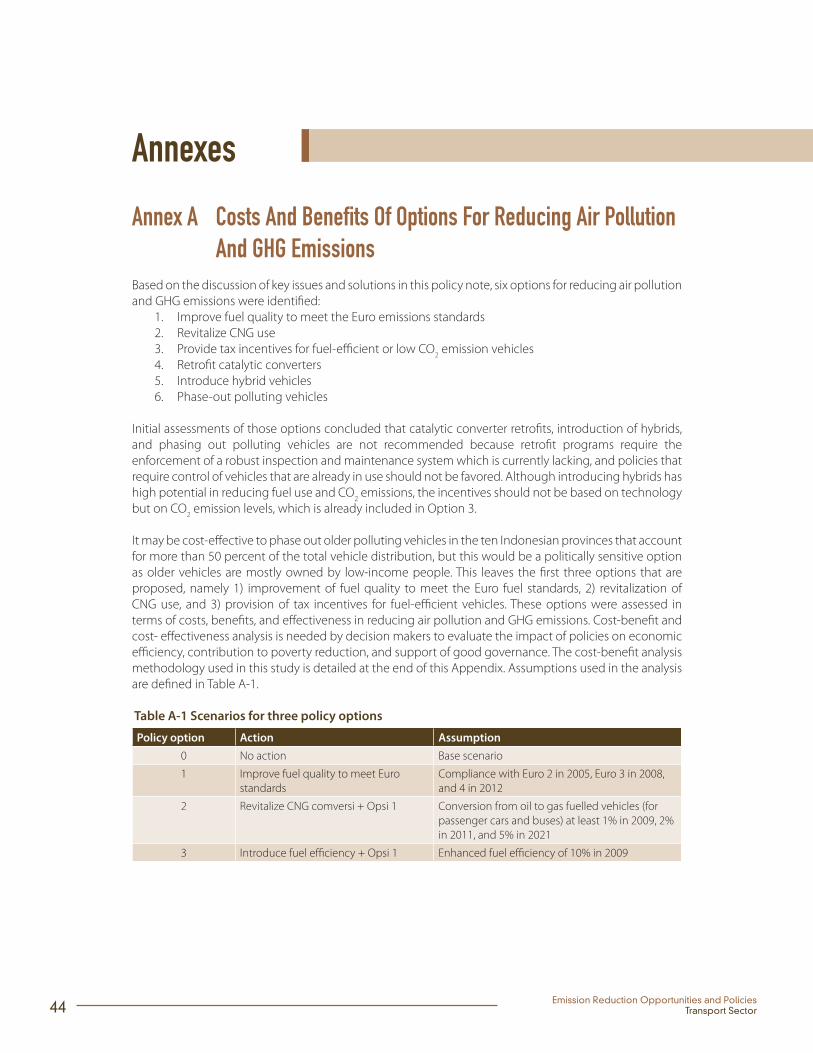
44 Emission Reduction Opportunities and PoliciesTransport Sector
Annexes
Annex A Costs And Benefi ts Of Options For Reducing Air Pollution And GHG Emissions
Based on the discussion of key issues and solutions in this policy note, six options for reducing air pollution
and GHG emissions were identifi ed:
1. Improve fuel quality to meet the Euro emissions standards
2. Revitalize CNG use
3. Provide tax incentives for fuel-effi cient or low CO2 emission vehicles
4. Retrofi t catalytic converters
5. Introduce hybrid vehicles
6. Phase-out polluting vehicles
Initial assessments of those options concluded that catalytic converter retrofi ts, introduction of hybrids,
and phasing out polluting vehicles are not recommended because retrofi t programs require the
enforcement of a robust inspection and maintenance system which is currently lacking, and policies that
require control of vehicles that are already in use should not be favored. Although introducing hybrids has
high potential in reducing fuel use and CO2 emissions, the incentives should not be based on technology
but on CO2 emission levels, which is already included in Option 3.
It may be cost-eff ective to phase out older polluting vehicles in the ten Indonesian provinces that account
for more than 50 percent of the total vehicle distribution, but this would be a politically sensitive option
as older vehicles are mostly owned by low-income people. This leaves the fi rst three options that are
proposed, namely 1) improvement of fuel quality to meet the Euro fuel standards, 2) revitalization of
CNG use, and 3) provision of tax incentives for fuel-effi cient vehicles. These options were assessed in
terms of costs, benefi ts, and eff ectiveness in reducing air pollution and GHG emissions. Cost-benefi t and
cost- eff ectiveness analysis is needed by decision makers to evaluate the impact of policies on economic
effi ciency, contribution to poverty reduction, and support of good governance. The cost-benefi t analysis
methodology used in this study is detailed at the end of this Appendix. Assumptions used in the analysis
are defi ned in Table A-1.
Table A-1 Scenarios for three policy options
Policy option Action Assumption
0 No action Base scenario
1 Improve fuel quality to meet Euro
standards
Compliance with Euro 2 in 2005, Euro 3 in 2008,
and 4 in 2012
2 Revitalize CNG comversi + Opsi 1 Conversion from oil to gas fuelled vehicles (for
passenger cars and buses) at least 1% in 2009, 2%
in 2011, and 5% in 2021
3 Introduce fuel effi ciency + Opsi 1 Enhanced fuel effi ciency of 10% in 2009

Emission Reduction Opportunities and PoliciesTransport Sector 45
References
A.1 Improve fuel quality to meet Euro fuel standards. This option takes into account the adoption of more stringent Euro emissions standards (from the current
Euro 2 to Euro 3 and Euro 4), assuming improvement of fuel quality specifi cations takes place. Therefore,
the cost of improved vehicle technology was also incorporated, e.g. a small car would require an additional
cost of US$ 250 to improve from Euro 3 to Euro 4. The incremental cost to meet the Euro 2 fuel standard
was estimated at US$ 9 per liter (Geosciences, 2003).
By improving fuel quality to meet Euro fuel standards, the net benefi ts are estimated at more than US$ 95
billion net present value (NPV) during 2005-2030. This option also provides a NPV in fuel savings of US$
460 million between 2009 and 2030 (see Table A-3). If clean diesel is refi ned domestically to meet the Euro
2 fuel standard, it will be more costly compared to imported diesel. However, in the long term—provided
other factors remain unchanged—the cost of importing clean diesel will be double the cost of refi ning
it locally (see Table A-2).
Table A-2 Additional cost if clean diesel is refi ned vs imported
Year StandardAdditional cost from current (US$ million/year)
Refi ned Imported
2008-2010 Euro 2 454 246
2011-2015 Euro 3 182 131
2016-2020 Euro 3 188 400
2021-2025 Euro 4 442 808
A.2 Revitalize the use of CNG and improve fuel quality. By deregulating CNG use in the transportation sector, the NPV of net benefi ts from reduced health costs
is estimated at more than US$ 108 billion over the next 25 years. Additionally, the NPV of net benefi ts
from fuel subsidy savings is estimated at more than US$ 10 billion over 21 years, equaling US$ 1.5 billion
per year.
A.3 Provision of tax incentives. By providing tax incentives for new fuel-effi cient or low CO2- emission vehicles, the NPV of net benefi ts
from reduced health costs would be about US$ 100 billion during 2005-2030. Meanwhile fuel subsidy
savings resulting from the tax incentives would exceed US$ 2.5 billion over 21 years (US$ 360 million per
year).
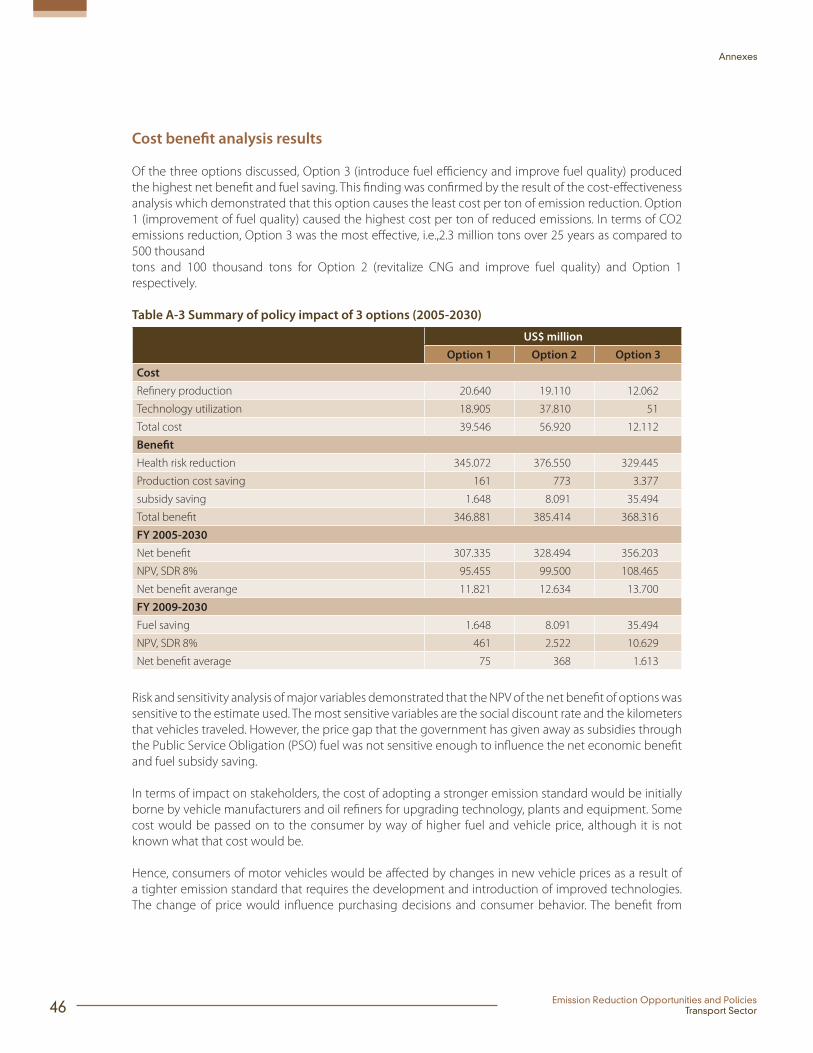
46 Emission Reduction Opportunities and PoliciesTransport Sector
Annexes
Cost benefi t analysis results
Of the three options discussed, Option 3 (introduce fuel effi ciency and improve fuel quality) produced
the highest net benefi t and fuel saving. This fi nding was confi rmed by the result of the cost-eff ectiveness
analysis which demonstrated that this option causes the least cost per ton of emission reduction. Option
1 (improvement of fuel quality) caused the highest cost per ton of reduced emissions. In terms of CO2
emissions reduction, Option 3 was the most eff ective, i.e.,2.3 million tons over 25 years as compared to
500 thousand
tons and 100 thousand tons for Option 2 (revitalize CNG and improve fuel quality) and Option 1
respectively.
Table A-3 Summary of policy impact of 3 options (2005-2030)
US$ million
Option 1 Option 2 Option 3
Cost
Refi nery production 20.640 19.110 12.062
Technology utilization 18.905 37.810 51
Total cost 39.546 56.920 12.112
Benefi t
Health risk reduction 345.072 376.550 329.445
Production cost saving 161 773 3.377
subsidy saving 1.648 8.091 35.494
Total benefi t 346.881 385.414 368.316
FY 2005-2030
Net benefi t 307.335 328.494 356.203
NPV, SDR 8% 95.455 99.500 108.465
Net benefi t averange 11.821 12.634 13.700
FY 2009-2030
Fuel saving 1.648 8.091 35.494
NPV, SDR 8% 461 2.522 10.629
Net benefi t average 75 368 1.613
Risk and sensitivity analysis of major variables demonstrated that the NPV of the net benefi t of options was
sensitive to the estimate used. The most sensitive variables are the social discount rate and the kilometers
that vehicles traveled. However, the price gap that the government has given away as subsidies through
the Public Service Obligation (PSO) fuel was not sensitive enough to infl uence the net economic benefi t
and fuel subsidy saving.
In terms of impact on stakeholders, the cost of adopting a stronger emission standard would be initially
borne by vehicle manufacturers and oil refi ners for upgrading technology, plants and equipment. Some
cost would be passed on to the consumer by way of higher fuel and vehicle price, although it is not
known what that cost would be.
Hence, consumers of motor vehicles would be aff ected by changes in new vehicle prices as a result of
a tighter emission standard that requires the development and introduction of improved technologies.
The change of price would infl uence purchasing decisions and consumer behavior. The benefi t from
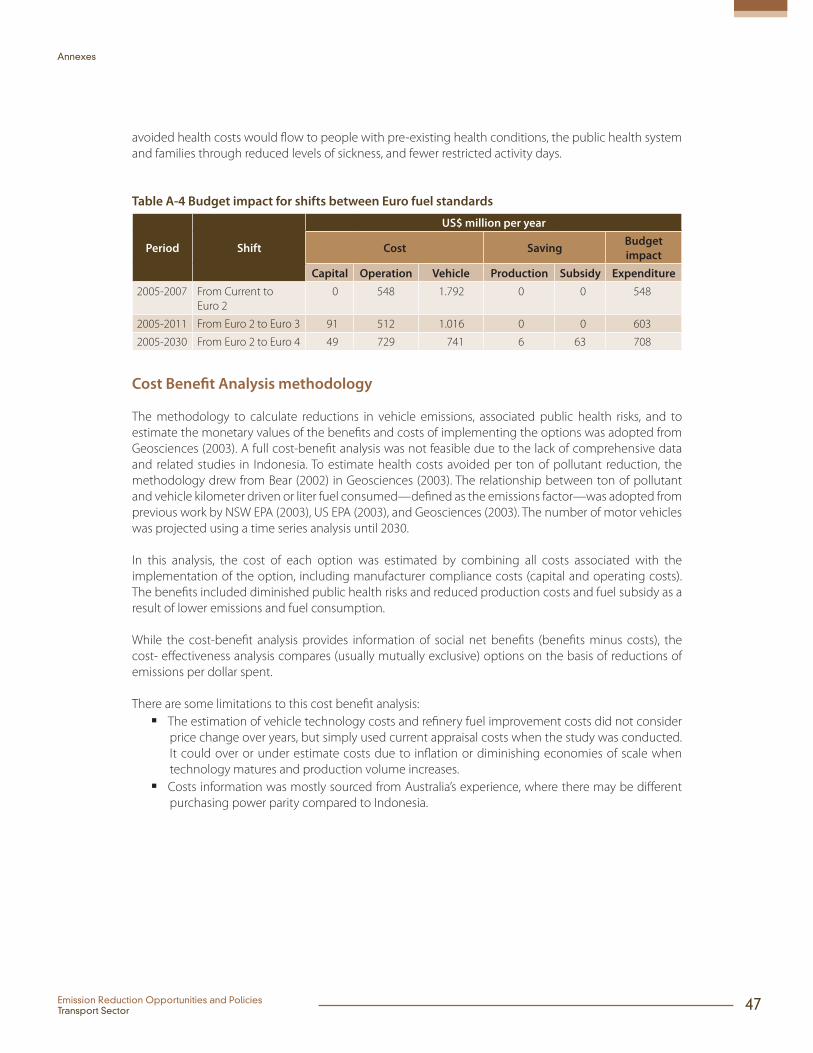
Emission Reduction Opportunities and PoliciesTransport Sector 47
Annexes
avoided health costs would fl ow to people with pre-existing health conditions, the public health system
and families through reduced levels of sickness, and fewer restricted activity days.
Table A-4 Budget impact for shifts between Euro fuel standards
Period Shift
US$ million per year
Cost SavingBudget
impact
Capital Operation Vehicle Production Subsidy Expenditure
2005-2007 From Current to
Euro 2
0 548 1.792 0 0 548
2005-2011 From Euro 2 to Euro 3 91 512 1.016 0 0 603
2005-2030 From Euro 2 to Euro 4 49 729 741 6 63 708
Cost Benefi t Analysis methodology
The methodology to calculate reductions in vehicle emissions, associated public health risks, and to
estimate the monetary values of the benefi ts and costs of implementing the options was adopted from
Geosciences (2003). A full cost-benefi t analysis was not feasible due to the lack of comprehensive data
and related studies in Indonesia. To estimate health costs avoided per ton of pollutant reduction, the
methodology drew from Bear (2002) in Geosciences (2003). The relationship between ton of pollutant
and vehicle kilometer driven or liter fuel consumed—defi ned as the emissions factor—was adopted from
previous work by NSW EPA (2003), US EPA (2003), and Geosciences (2003). The number of motor vehicles
was projected using a time series analysis until 2030.
In this analysis, the cost of each option was estimated by combining all costs associated with the
implementation of the option, including manufacturer compliance costs (capital and operating costs).
The benefi ts included diminished public health risks and reduced production costs and fuel subsidy as a
result of lower emissions and fuel consumption.
While the cost-benefi t analysis provides information of social net benefi ts (benefi ts minus costs), the
cost- eff ectiveness analysis compares (usually mutually exclusive) options on the basis of reductions of
emissions per dollar spent.
There are some limitations to this cost benefi t analysis:
The estimation of vehicle technology costs and refi nery fuel improvement costs did not consider
price change over years, but simply used current appraisal costs when the study was conducted.
It could over or under estimate costs due to infl ation or diminishing economies of scale when
technology matures and production volume increases.
Costs information was mostly sourced from Australia’s experience, where there may be diff erent
purchasing power parity compared to Indonesia.
This report was prepared as part of the Low Carbon Development Options for Indonesia
National Council on Climate Change
Gedung Kementerian BUMN, 18th Floor
Jalan Medan Merdeka Selatan No. 13
Jakarta 10110
Tel: +62-21-3511400
Fax: +62-21-3511403
Supported by the World Bank,
using funding from several
sources
The World Bank
Indonesia Stock Exchange Bldg
Tower II, 12-13th Floor
Jalan Jendral Sudirman Kav. 52-53
Jakarta 12910
Tel: +62-21-52993000; Fax: +62-21-52993111
www.worldbank.org/id


