Analysis of main pollution source of NO x , SO x , VOC/odour and waste water in the BSR Miroslaw Dors Institute of Fluid-Flow Machinery, Gdansk, Poland 1. Introduction This report is a compilation of data taken from the European Environment Agency concerning emissions of NO x , SO 2 and volatile organic compounds (VOC) in 2009 in Baltic Sea Region countries united in the EU. These are most recent data available, which means that those from 2010 are still not published. It must be noted that for the VOC there are no data on methane emission, so this group is called in European reports as NMVOC, i.e non- methane volatile organic compounds. As for the waste water there are data on nutrients emitted to water, however, this type of pollution is not a subject of plasma-based cleaning technologies. In this report only data on oil discharging accidents in the Baltic Sea ports are presented. The report is organized so that to have a look on the emission sources in each of the BSR EU country. 2. National total emissions in 2009 and ceilings for 2010 Figures 1 to 3 presents national total emission of pollutants for the entire territory comprising the aggregated NFR09 1 sectors (excluding memo items) reported by countries corresponding to anthropogenic (man-made) emissions. Natural emission sources and re-suspension are not included in the reported national totals. “National emission ceiling” means the maximum amount of a substance expressed in kilotonnes, which may be emitted from a EU Member State in a calendar year. Ceilings were published in the Directive 2001/81/EC of the European Parliament. 1 The Nomenclature for Reporting (NFR09) reporting format are developed by EMEP/TFEIP and documented in the 2009 UNECE/EMEP Emission Reporting Guidelines (http://www.ceip.at/fileadmin/inhalte/emep/reporting_2009/Rep_Guidelines_ECE_EB_AIR_97_e.pdf ). EU Member States report emissions data using the NFR classification system. The NFR format uses around 100 categories to describe emission sources.
Transcript
Analysis of main pollution source of NOx, SOx, VOC/odour and waste water in the BSR
Miroslaw Dors Institute of Fluid-Flow Machinery, Gdansk, Poland
1. Introduction This report is a compilation of data taken from the European Environment Agency concerning emissions of NOx, SO2 and volatile organic compounds (VOC) in 2009 in Baltic Sea Region countries united in the EU. These are most recent data available, which means that those from 2010 are still not published. It must be noted that for the VOC there are no data on methane emission, so this group is called in European reports as NMVOC, i.e non-methane volatile organic compounds. As for the waste water there are data on nutrients emitted to water, however, this type of pollution is not a subject of plasma-based cleaning technologies. In this report only data on oil discharging accidents in the Baltic Sea ports are presented. The report is organized so that to have a look on the emission sources in each of the BSR EU country.
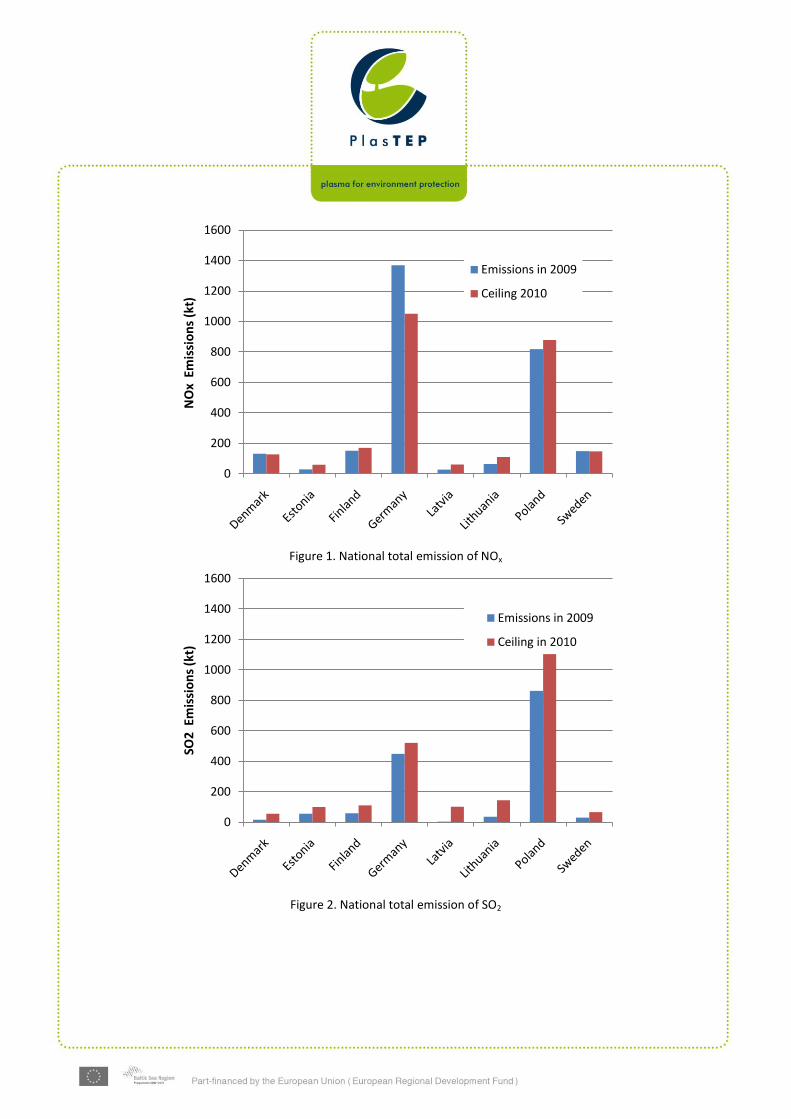
2. National total emissions in 2009 and ceilings for 2010 Figures 1 to 3 presents national total emission of pollutants for the entire territory comprising the aggregated NFR09
1 sectors (excluding memo items) reported by countries corresponding to anthropogenic (man-made)
emissions. Natural emission sources and re-suspension are not included in the reported national totals. “National emission ceiling” means the maximum amount of a substance expressed in kilotonnes, which may be emitted from a EU Member State in a calendar year. Ceilings were published in the Directive 2001/81/EC of the European Parliament.
1 The Nomenclature for Reporting (NFR09) reporting format are developed by EMEP/TFEIP and documented in
the 2009 UNECE/EMEP Emission Reporting Guidelines (http://www.ceip.at/fileadmin/inhalte/emep/reporting_2009/Rep_Guidelines_ECE_EB_AIR_97_e.pdf). EU Member States report emissions data using the NFR classification system. The NFR format uses around 100 categories to describe emission sources.
As it is seen, all countries already in 2009 gained the SO2 emission ceilings, which means that they introduced successfully economical and technological tools limiting SO2 emission. In the case of VOC only Germany and Denmark could not meet the ceiling yet. Since data for emissions in 2010 are still not available we do not know whether recently these countries made the emission of SO2 and VOC lower or not.
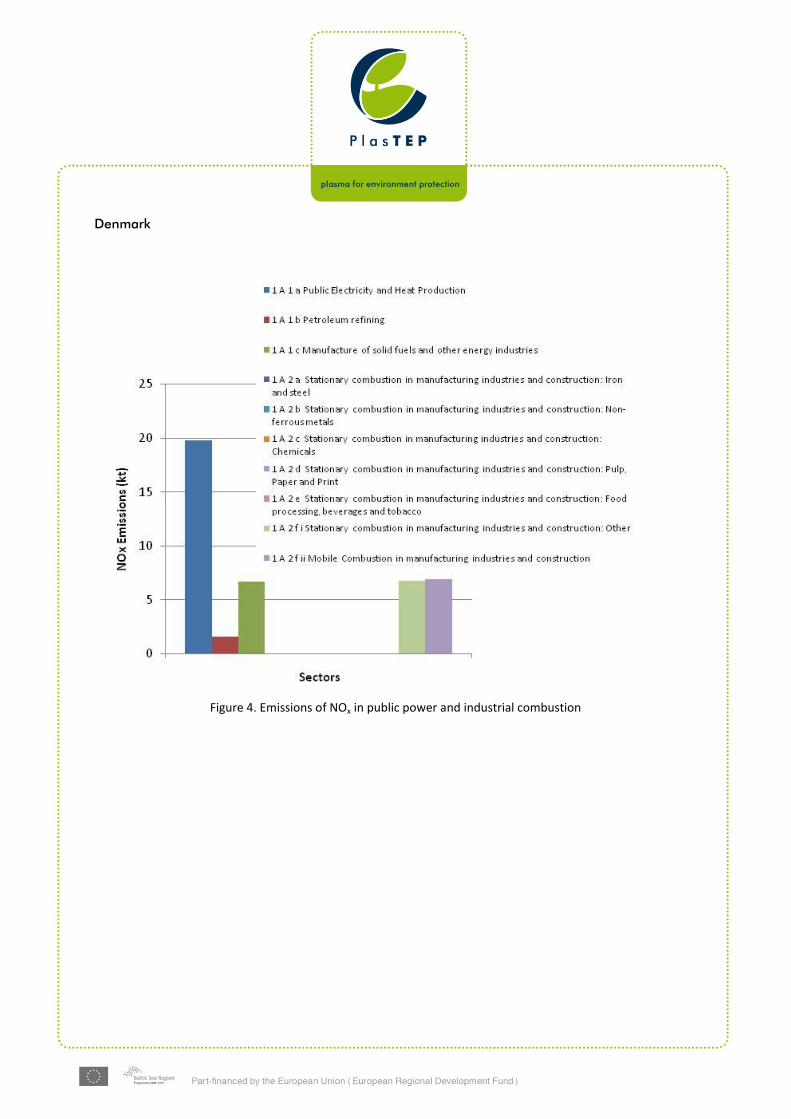
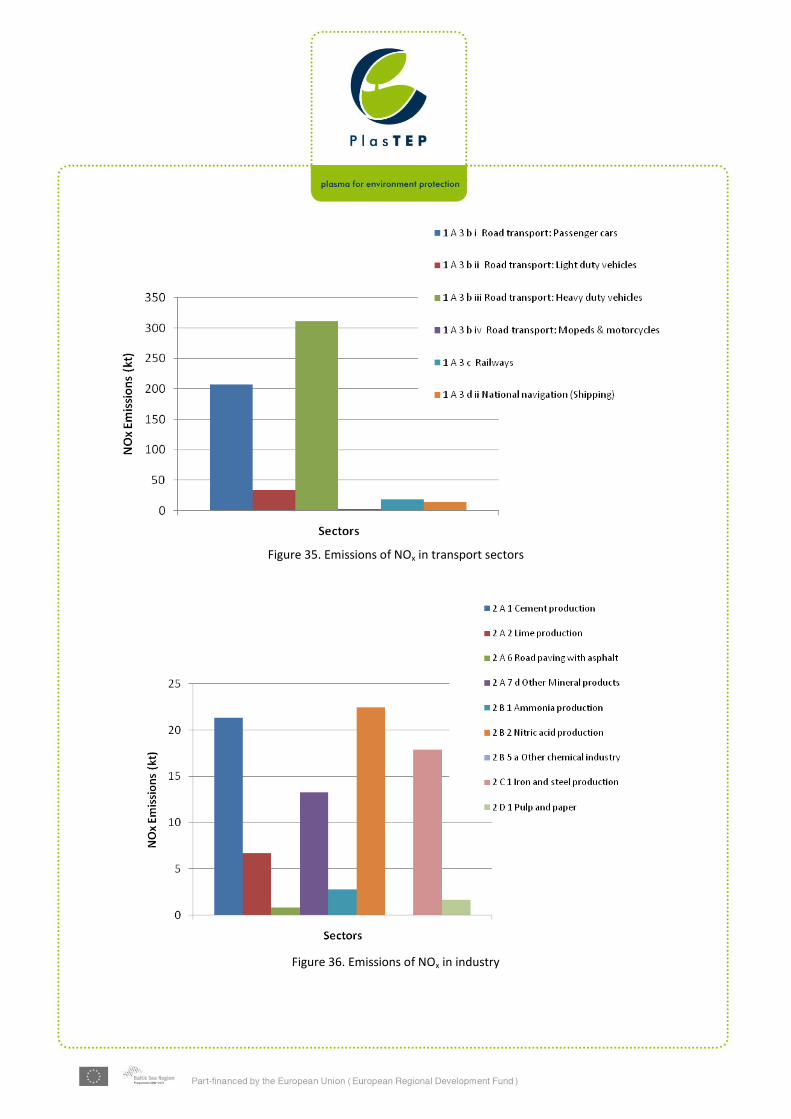
3. National emissions by sources Below are presented emissions of NOx, SO2 and VOC in each BSR EU country by 49 of NFR09 sectors. Data in figures are combined in the following groups:
Group 1a1 and 1a2: public power and industrial combustion,
Group 1a3: transport (roads, railways and shipping).
Group 2: industrial process,
Group 3: solvents.
0
200
400
600
800
1000
1200
1400
VO
C E
mis
sio
ns
(kt)
Emissions in 2009
Ceiling in 2010
Denmark
Figure 4. Emissions of NOx in public power and industrial combustion
Figure 5. Emissions of NOx in transport sectors
Figure 6. Emissions of NOx in industry
Figure 7. Emissions of SO2 in public power and industrial combustion
Figure 8. Emissions of SO2 in transport sectors
Figure 9. Emissions of SO2 in industry
Figure 10. Emissions of VOC in public power and industrial combustion
Figure 11. Emissions of VOC in transport sectors
Figure 12. Emissions of VOC in industry
Figure 13. Emissions of VOC in processes using solvents
Estonia
Figure 14. Emissions of NOx in public power and industrial combustion
Figure 15. Emissions of NOx in transport sectors
Figure 16. Emissions of NOx in industry
Figure 17. Emissions of SO2 in public power and industrial combustion
Figure 18. Emissions of SO2 in transport sectors
Figure 19. Emissions of SO2 in industry
Figure 20. Emissions of VOC in public power and industrial combustion
Figure 21. Emissions of VOC in transport sectors
Figure 22. Emissions of VOC in industry
Figure 23. Emissions of VOC in processes using solvents
Finland
Figure 24. Emissions of NOx in public power and industrial combustion
Figure 25. Emissions of NOx in transport sectors
Figure 26. Emissions of NOx in industry
Figure 27. Emissions of SO2 in public power and industrial combustion
Figure 28. Emissions of SO2 in transport sectors
Figure 29. Emissions of SO2 in industry
Figure 30. Emissions of VOC in public power and industrial combustion
Figure 31. Emissions of VOC in transport sectors
Figure 32. Emissions of VOC in industry
Figure 33. Emissions of VOC in processes using solvents
Germany
Figure 34. Emissions of NOx in public power and industrial combustion
Figure 35. Emissions of NOx in transport sectors
Figure 36. Emissions of NOx in industry
Figure 37. Emissions of SO2 in public power and industrial combustion
Figure 38. Emissions of SO2 in transport sectors
Figure 39. Emissions of SO2 in industry
Figure 40. Emissions of VOC in public power and industrial combustion
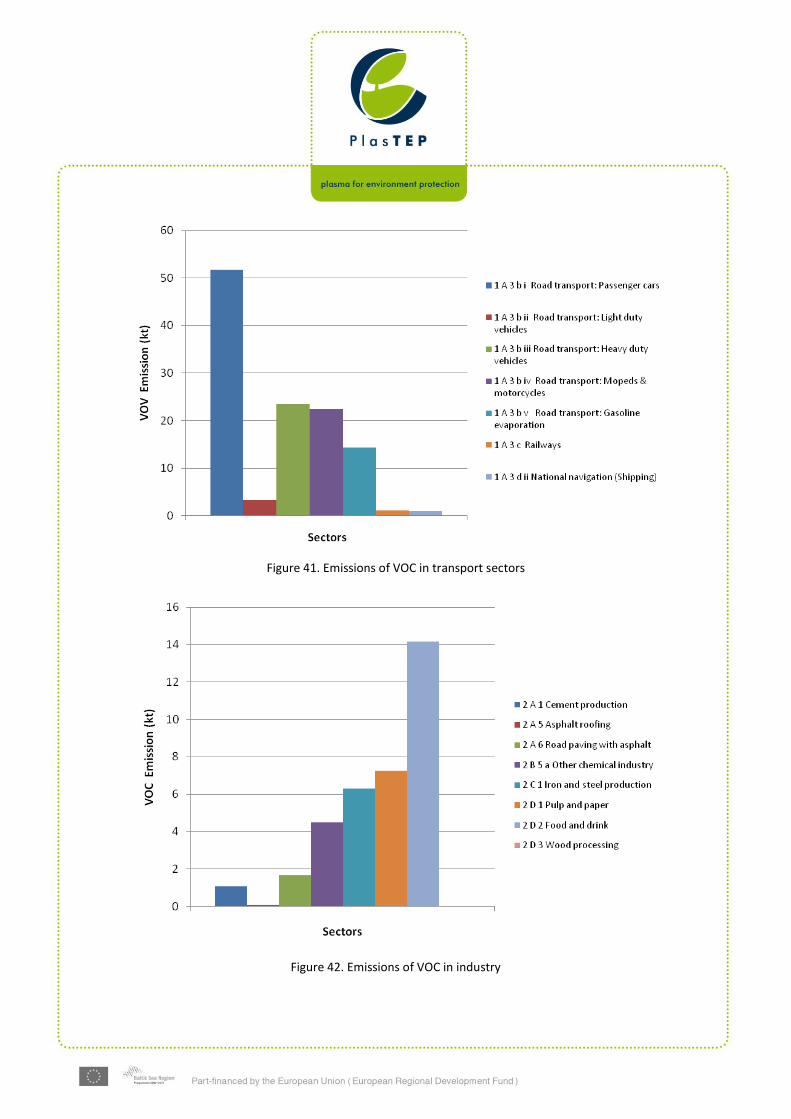
Figure 41. Emissions of VOC in transport sectors
Figure 42. Emissions of VOC in industry
Figure 43. Emissions of VOC in processes using solvents
Latvia
Figure 44. Emissions of NOx in public power and industrial combustion
Figure 45. Emissions of NOx in transport sectors
Figure 46. Emissions of NOx in industry
Figure 47. Emissions of SO2 in public power and industrial combustion
Figure 48. Emissions of SO2 in transport sectors
Figure 49. Emissions of SO2 in industry
Figure 50. Emissions of VOC in public power and industrial combustion
Figure 51. Emissions of VOC in transport sectors
Figure 52. Emissions of VOC in industry
Figure 53. Emissions of VOC in processes using solvents
Lithuania
Figure 54. Emissions of NOx in public power and industrial combustion
Figure 55. Emissions of NOx in transport sectors
Figure 56. Emissions of NOx in industry
Figure 57. Emissions of SO2 in public power and industrial combustion
Figure 58. Emissions of SO2 in transport sectors
Figure 59. Emissions of SO2 in industry
Figure 60. Emissions of VOC in public power and industrial combustion
Figure 61. Emissions of VOC in transport sectors
Figure 62. Emissions of VOC in industry
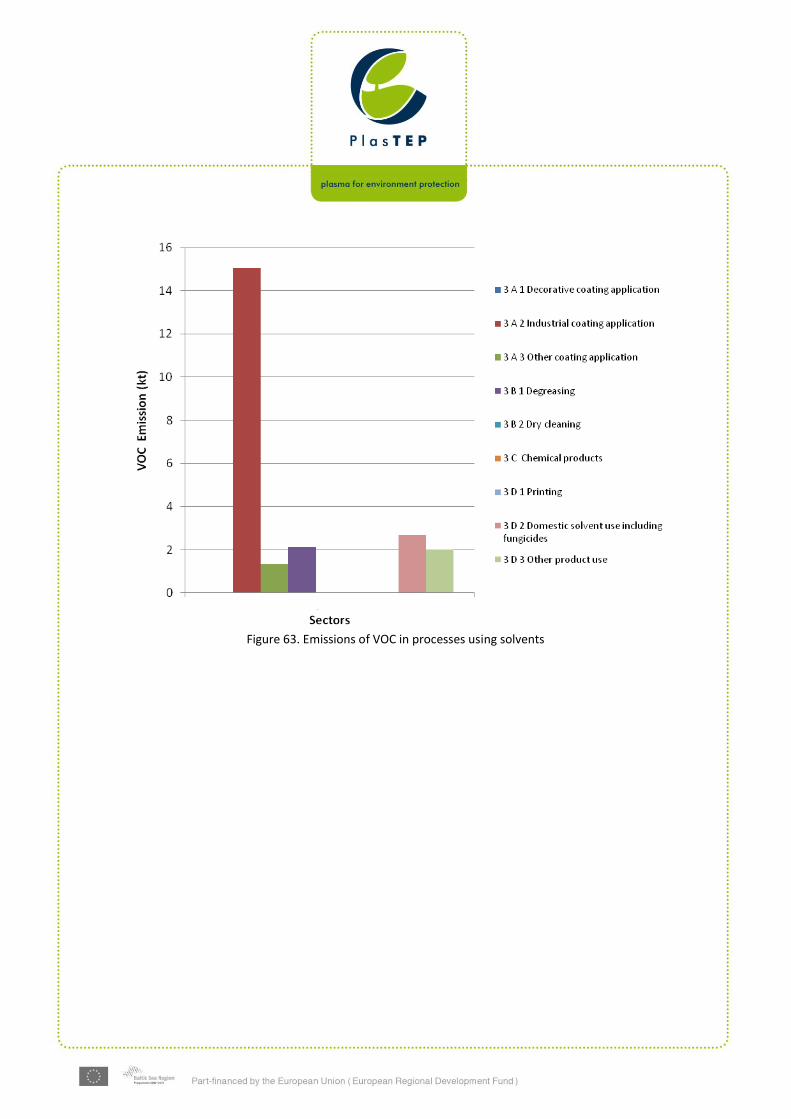
Figure 63. Emissions of VOC in processes using solvents
Poland
Figure 64. Emissions of NOx in public power and industrial combustion
Figure 65. Emissions of NOx in transport sectors
Figure 66. Emissions of NOx in industry
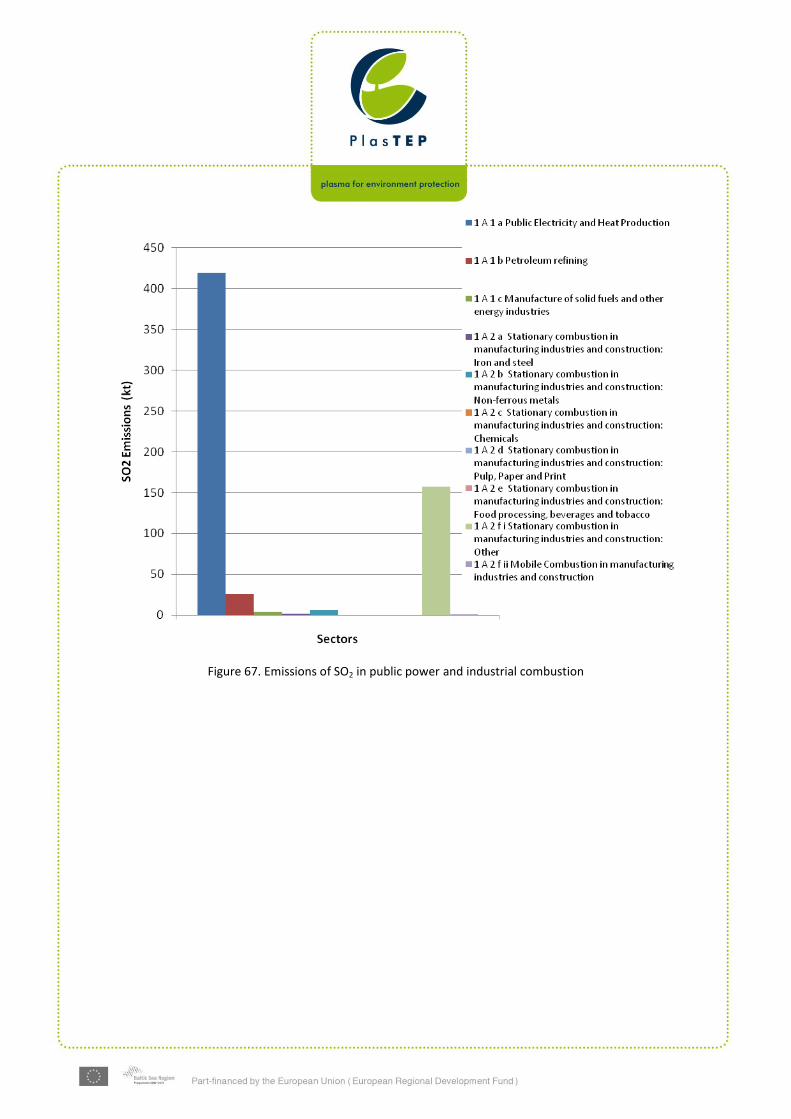
Figure 67. Emissions of SO2 in public power and industrial combustion
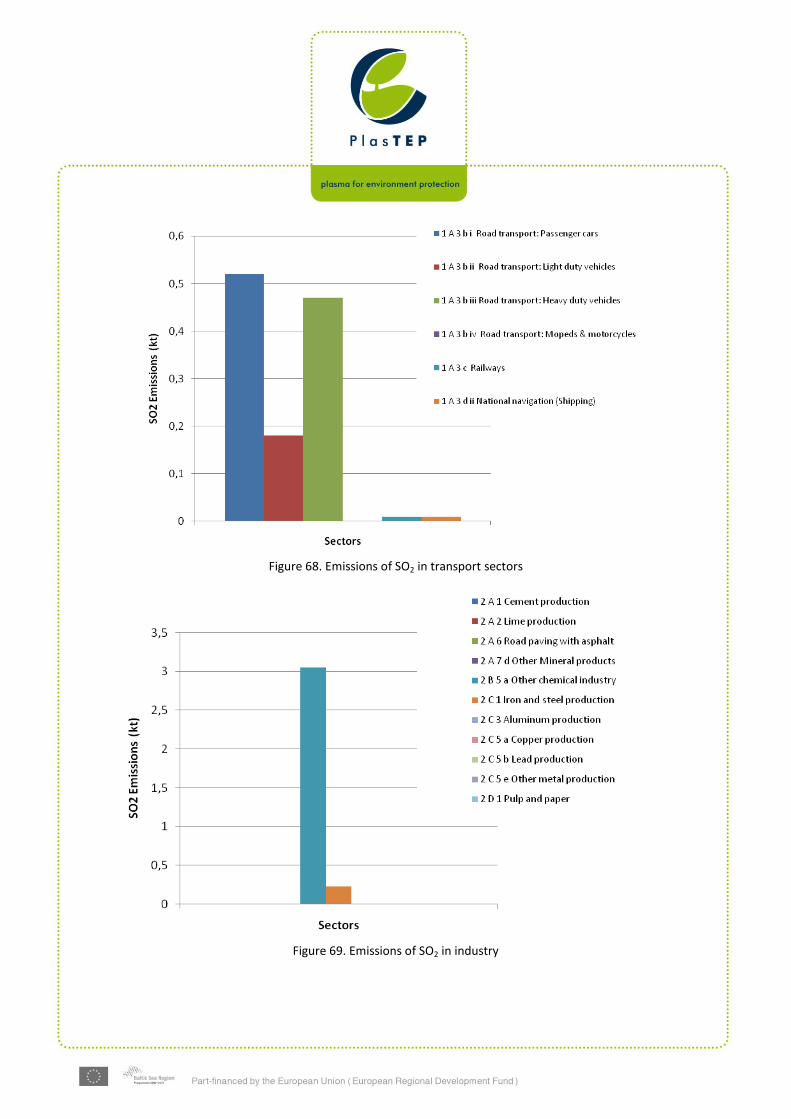
Figure 68. Emissions of SO2 in transport sectors
Figure 69. Emissions of SO2 in industry
Figure 70. Emissions of VOC in public power and industrial combustion
Figure 71. Emissions of VOC in transport sectors
Figure 72. Emissions of VOC in industry
Figure 73. Emissions of VOC in processes using solvents
Sweden
Figure 74. Emissions of NOx in public power and industrial combustion
Figure 75. Emissions of NOx in transport sectors
Figure 76. Emissions of NOx in industry
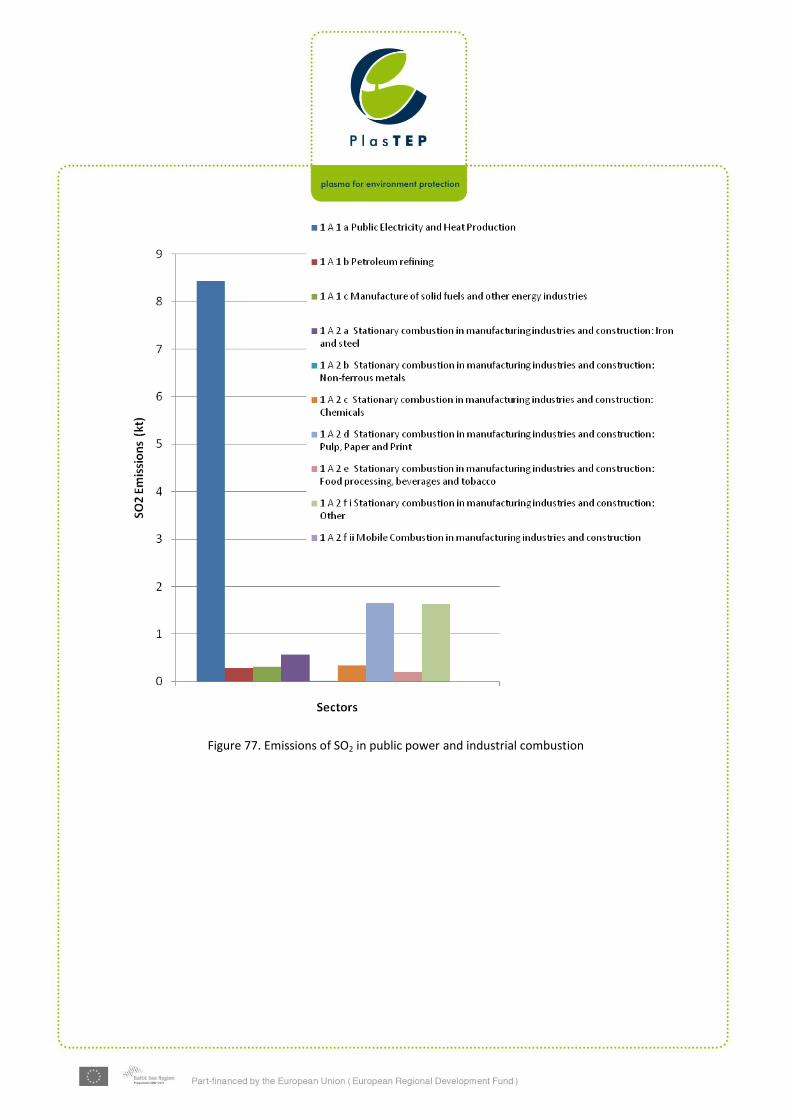
Figure 77. Emissions of SO2 in public power and industrial combustion
Figure 78. Emissions of SO2 in transport sectors
Figure 79. Emissions of SO2 in industry
Figure 80. Emissions of VOC in public power and industrial combustion
Figure 81. Emissions of VOC in transport sectors
Figure 82. Emissions of VOC in industry
Figure 83. Emissions of VOC in processes using solvents
4. Analysis of emissions and their sources in the BSR Great number of data presented above can be analyzed in different ways. Since the aim of this report is to show the main sources of emissions in the BSR, we limited the analysis to present main sectors responsible for the largest emission in 2009. They are collected in 3 tables, separately for each pollutant: NOx, SO2 and VOC. As it is seen, the highest contribution to the NOx and SO2 emission come from power plants and road transport in Germany and Poland. Main sources of VOC are also located in Germany. However, it must be pointed out that data presented concern countries as a whole, whereas society of Baltic regions suffer mostly from pollutants emitted in their regions. Unfortunately, data from regions are not available, not mentioning specific objects, like names of power plants and factories. Table 1. Main sources of NOx emission in the BSR countries in 2009
Sector Country Emissions - 2009
kt %
Road transport: Heavy duty vehicles Germany 310.65 14.23
Public Electricity and Heat Production Germany 271.27 12.43
Public Electricity and Heat Production Poland 260.68 11.94