102
Emotional, Psychological and Mental Health (EPMH) disability Dorothy Watson and Bertrand Maître 2014

Emotional, Psychological
and Mental Health (EPMH) disability
Dorothy Watson and Bertrand Maître
2014

i
Table of contents
Table of contents ................................................................................................. i
List of tables ........................................................................................................ iv
Acknowledgements .......................................................................................... vii
Executive Summary......................................................................................... viii
Introduction ........................................................................................................... viii
Key findings ........................................................................................................... viii
Overlap with other disabilities ...................................................................................... viii
Stigma .................................................................................................................................... ix
Level of difficulty ..................................................................................................... ix
Social participation .................................................................................................. x
Labour market participation ................................................................................... xi
Strengths and limitations of the study ................................................................. xii
Policy implications ................................................................................................. xii
Chapter 1: Introduction ..................................................................................... 1
1.1 Background ........................................................................................................ 1
1.2 Conceptual Background .................................................................................... 2
1.2.1 The decline of the ‘medical model’ of disability .................................................. 2
1.2.2 Early criticism of the medical model applied to mental illness ........................ 3
1.1.4 The social environment and stigma ....................................................................... 4
1.1.5 EPMH disability, the labour market and marriage .............................................. 5
1.4 Policy context ..................................................................................................... 7
1.5 Outline of report ................................................................................................. 9
1.6 Methodology ....................................................................................................... 9
1.6.1 The National Disability Survey (NDS) .................................................................. 9
1.6.2 Measuring EPMH disability .................................................................................... 11
1.6.3 Unit of analysis and population ............................................................................ 12
1.6.4 Information linked from census ........................................................................... 12
1.6.5 Comparison group: people with mobility & dexterity disability ................... 12
Chapter 2: Overview of EPMH disability ....................................................... 14

ii
2.1 Prevalence of EPMH disability ........................................................................ 14
2.2 Age and disability ............................................................................................. 15
2.3 Age of onset of disability ................................................................................. 16
2.4 Type of EPMH disability ................................................................................... 17
2.5 Overlap between EPMH disability and other disabilities .............................. 19
2.5.1 Extent of overlap between EPMH and each other disability ......................... 19
2.5.2 Age of onset of EPMH disability and other disability ....................................... 21
2.5.3 Whether EPMH disability is the main disability ................................................ 23
2.6 Living arrangements and marital status ........................................................ 24
2.7 Attitudes of other people ................................................................................. 27
2.8 Health and stamina .......................................................................................... 30
2.9 Summary ........................................................................................................... 31
Chapter 3: Level of Difficulty Associated with EPMH disability ................. 33
3.1 Introduction ...................................................................................................... 33
3.2 Level of difficulty by age and gender ............................................................. 33
3.3 Level of difficulty by presence of other disabilities ...................................... 36
3.4 Level of difficulty by age of onset and type of EPMH disability ................... 38
3.5 Factors affecting level of difficulty ................................................................. 39
3.6 Summary ........................................................................................................... 41
Chapter 4: Social Participation ....................................................................... 43
4.1 Introduction ...................................................................................................... 43
4.2 Type of social participation in last four weeks .............................................. 43
4.3 Difficulties in social participation ................................................................... 45
4.4 Impact of environment and personal characteristics on social participation
................................................................................................................................. 48
4.5 Summary ........................................................................................................... 51
Chapter 5: Labour Market Outcomes for People with EPMH disability ... 53
5.1 Educational experience and attainment ......................................................... 53
5.3 Main economic status ...................................................................................... 55
5.4 In employment or interested in employment ................................................. 57
5.5 Jobless households ......................................................................................... 62
5.6 Factors influencing employment and interest in employment ..................... 63
5.7 Summary ........................................................................................................... 65

iii
Chapter 6: Conclusions .................................................................................... 68
6.1 Introduction ...................................................................................................... 68
6.2 Variations in the level of difficulty associated with EPMH disability ........... 70
6.3 Participation in social activities ...................................................................... 71
6.4 Labour market outcomes ................................................................................ 73
6.4 Limitations ........................................................................................................ 74
6.5 Policy ................................................................................................................. 75
6.5.1 Integrated approach to meeting service needs ................................................. 75
6.5.1 Disability and the labour market .......................................................................... 75
6.5.3 Stigma ......................................................................................................................... 76
6.5.4 Further research ...................................................................................................... 77
Appendix Tables ............................................................................................... 78
References .............................................................................................................. 84

iv
List of tables
Table 2.1: Frequency of EPMH disability and other types of disability by gender ........ 14
Table 2.2: Percentage of people with a disability in each age group who have each type of disability .......................................................................................................................... 16
Table 2.3: Age of onset by type of disability ......................................................................... 17
Table 2.4: Main cause of EPMH disability as identified by respondent by gender ........ 18
Table 2.5: EPMH disability by disease or illness type .......................................................... 19
Table 2.6: Whether EPMH disability is the only disability and average number of different types of disability among people with EPMH disability ...................................... 20
Table 2.7: Percentage of those with EPMH disability who also have each other kind of disability ........................................................................................................................................ 21
Table 2.8: Whether EPMH disability began earlier, later or at the same time as the other disability (people with EPMH disability and each other disability). ...................... 22
Table 2.9: Whether EPMH disability or another disability is considered the main disability (people with EPMH disability and each other disability). .................................. 23
Table 2.10: Marital status and living arrangements of people with EPMH disability and mobility & dexterity disability .................................................................................................. 25
Table 2.11: Percentage who never married by age of onset of disability for people with a disability living in private households age 45 and over .......................................... 26
Table 2.12: Avoiding things because of reactions of others among those with EPMH disability and mobility & dexterity disability - adults in private HH, not proxy interview ...................................................................................................................................... 27
Table 2.13: Whether attitudes of other people are supportive, hindering or have no impact (where relevant) among those with EPMH disability and mobility & dexterity disability ........................................................................................................................................ 28
Table 2.14 Percentage of people with EPMH disability who ever avoid doing things because of the attitudes of other people. ............................................................................. 30
Table 2.15: General health and stamina of those with EPMH disability and mobility & dexterity disability - adults in private HH, not proxy interview ...................................... 31
Table 3.1: Level of difficulty due to EPMH disability by Age group and Gender .......... 34

v
Table 3.2: Level of difficulty associated with EPMH disability and mobility & dexterity disability (where level of difficulty is moderate or greater). ............................................. 34
Table 3.3: Experiencing a lot of difficulty or being unable to perform certain self-care activities by EPMH disability or mobility & dexterity disability ........................................ 36
Table 3.4: Level of difficulty in everyday life associated with EPMH disability by whether EPMH disability is the main/only disability ............................................................ 37
Table 3.5: Level of difficulty with EPMH disability by highest level of difficulty across disability types (where more than one type of disability). ................................................. 38
Table 3.6: Level of difficulty with everyday activities associated with EPMH disability by age of onset ............................................................................................................................ 38
Table 3.7: Level of difficulty by type of EPMH ..................................................................... 39
Table 3.8: Odds of experiencing a lot of difficulty due to EPMH disability – significant odds ratios. .................................................................................................................................. 41
Table 4.1: Social participation in the last four weeks among people with EPMH disability and mobility & dexterity disability ......................................................................... 44
Table 4.2: With whom does the person socialise by type of disability........................... 45
Table 4.3: Level of difficulty with different forms of social participation for adults with EPMH disability living in private households ......................................................................... 45
Table 4.4: Having a lot of difficulty or being unable to participate in certain social and civic activities by type of disability .......................................................................................... 47
Table 4.5: Reason for difficulty with social participation by type of disability ............... 48
Table 4.6: Factors associated with not participating in any social activities in last month among people with EPMH disability (significant odds ratios) .............................. 49
Table 5.1: Education of people with EPMH disability disability ........................................ 54
Table 5.2: Education of people with EPMH disability compared to people with mobility & dexterity disability (aged 18 to 44). .................................................................... 54
Table 5.3: Reason for stopping education sooner than desired among people with EPMH disability or mobility & dexterity disability aged 18 to 44. .................................... 55
Table 5.4: Main Economic Status by Type of Disability and Gender ............................... 56

vi
Table 5.5: Whether interested in employment or not interested in employment by type of disability (working age adults in private households interviewed directly but not in employment). .................................................................................................................. 58
Table 5.6: What is (or would be) needed to enable person with a disability to take up employment for people with EPMH disability or mobility & dexterity disability ......... 59
Table 5.7: What is (or would be) needed to enable person with EPMH disability to take up employment by whether EPMH disability is the main/only disability ............... 60
Table 5.8: Whether adults with EPMH disability were ever in employment and whether left employment because of disability .................................................................... 61
Table 5.9: Percentage of adults with EPMH disability or mobility & dexterity disability living in jobless households. ..................................................................................................... 62
Table 5.10: Factors influencing adults with EPMH disability to be interested in employment or not interested in employment (in contrast to those in employment; odds ratios from multinomial logit model) ........................................................................... 64
Table A2.1: Percentage of people with EPMH disability in communal establishments by gender and broad age group .............................................................................................. 78
Table A3.1: Having a lot of difficulty with everyday activities or routine tasks – people with EPMH disability who do not also have mobility & dexterity disability .................. 78
Table A3.2: Odds of experiencing a lot of difficulty due to EPMH disability (Odds ratios from series of logistic regression models) ................................................................ 79
Table A4.1: Odds of not participating in social activity (Odds ratios from series of logistic regression models) ....................................................................................................... 80
Table A5.1: Odds of being out of employment but interested in employment or out of employment and not interested in employment vs. being in employment. .............. 82

vii
Acknowledgements
The authors are grateful to Gráinne Collins, Eithne Fitzgerald and other participants in a consultative workshop at the National Disability Authority in June 2013 for comments on an earlier draft of this paper. The report also benefitted from the comments of three anonymous reviewers and from our ESRI colleagues. We owe a debt of gratitude to the CSO (Central Statistics Office), for facilitating access to the research microdata file, and particularly to Gerry Walker, who has always been extremely helpful in responding to our questions. We thank the CSO interviewers for their professionalism and the respondents to the National Disability Survey for giving so generously of their time to make this research possible. Any remaining errors and omissions are the sole responsibility of the authors.

viii
Executive Summary
Introduction
Despite the growing international recognition that mental health accounts for about one third of all disabilities, this is an area which is under-researched in Ireland. This report draws on the National Disability Survey (NDS) conducted by the Central Statistics Office in 2006 to examine the circumstances of people with emotional, psychological and mental health (EPMH) disability in Ireland.
The NDS has a large sample of over 4,000 people with EPMH disability, of whom over 3,000 are adults, living in private households who were interviewed directly. We drew on the NDS data to provide an overview of the situation of people with EPMH disability in Ireland and to address three research questions:
• What accounts for differences in the extent to which EPMH disabilities lead to difficulties in everyday activities?
• What factors are important in enabling people with EPMH disability to participate in social activities?
• Is support from other people (marital status, household composition, attitudes of other people) associated with improved labour market outcomes controlling for type and severity of mental health disability?
Key findings
Overlap with other disabilities One theme which emerged strongly in the report is the extent to which those with EPMH disability also experience other types of disability. Nearly nine out of ten people with EPMH disability in the survey also have at least one other type of disability. The overlap is partly due to the impact of physical health problems on mental health and partly due to the higher risk of developing physical health problems among those with mental health issues.
The main areas of overlap from the perspective of people with EPMH disability were mobility & dexterity, remembering & concentrating and pain. About half of those with EPMH disability also have either mobility & dexterity disability and a similar proportion also have a disability with remembering and concentrating, while slightly less than one half also have pain disability.
Where the person with EPMH disability has more than one type of disability, the other disability is more likely to be regarded as the ‘main’ one.
We caution that the percentage of people with EPMH disability only (i.e. not having another type of disability) may be a lower bound estimate because the stigma associated with mental health issues may lead people with this disability to be
ix
reluctant to disclose their disability in a survey, particularly if this is their only type of disability. Nevertheless, the overlap with other types of disability is substantial and indicates that there is no basis in people’s life experience for a rigid separation between physical and emotional/mental health disabilities. The distinction between physical disability and EPMH disability is relevant from the medical perspective – where the focus is on particular conditions, their aetiology and treatment. However, there is not a one-to-one mapping of conditions onto persons. Real people have needs and challenges that relate to both physical and mental health.
Stigma The second theme which emerged was the vulnerability of people with EPMH disability to stigma. Although most people with EPMH disability find high levels of support from family, friends and health care providers (all over 80 per cent supportive), the proportions who find other service providers, employers and strangers supportive is lower.
We compare the level of social support available to those with EPMH disability and those with mobility & dexterity disability.1 People with EPMH disability are more likely than those with mobility & dexterity disability to have problems with the supportiveness of others or with the attitudes of others. On a social support scale that takes account of different groups in the person’s life (e.g. family, friends, neighbours, work colleagues, health service providers, other public service providers, private service providers, employers and strangers), the average score was 0.69 out of 1.0 for a person with EPMH disability compared to 0.76 for a person with mobility & dexterity disability. People with EPMH disability are also more likely to avoid doing things because of the attitudes of other people (39 per cent and 22 per cent, respectively) with an even higher figure (51 per cent) for young adults with an EPMH disability.
Level of difficulty
The NDS included people with EPMH disability who reported experiencing differing levels of difficulty with everyday activities because of their disability. Just under a quarter of those with EPMH disability experienced ‘just a little’ difficulty; just over two-fifths experienced a ‘moderate amount’ of difficulty; nearly one-third experienced ‘a lot’ of difficulty and fewer than one in twenty had some everyday activities they could not do at all. We found little difference by age and gender in the proportion of people with EPMH disability who had high levels of difficulty (‘a lot’ or ‘cannot do’).
1 Note that about half of those with EPMH disability also have mobility & dexterity disability and about 31 per cent of those with mobility & dexterity disability also have EPMH disability. We could have compared those with EPMH disability to the subset of those with mobility & dexterity disability who do not also have EPMH disability. However, on balance, we felt that the comparison with the entire group with mobility & dexterity disability would be clearer and less likely to risk bias by, for example, excluding those more severely limited in their everyday lives.

x
For adults with EPMH disability living in private households, we conducted a statistical analysis to identify the factors which were most important in differentiating those with a high level of difficulty from those with ‘just a little’ or a ‘moderate’ level of difficulty. The results pointed to the importance of aspects of the person’s condition, the age of onset of the disability, and also social support and stigma. In terms of the person’s condition, the risk of experiencing a high level of difficulty was greater if the person had bipolar disorder (compared to depression), where the person had bad health and when other disabilities were present (especially remembering & concentrating, which may be a consequence of the condition linked to the EPMH disability or a side effect of treatment). Onset of EPMH disability in later years (after age 65) was associated with a lower level of difficulty. Social support and an absence of stigma were also important: having high levels of social support was associated with a lower level of difficulty and those who often avoid doing things because of the attitudes of others were more likely to have a lot of difficulty.
When the person’s condition, age of onset of the disability, social support and stigma were controlled, there were no differences by gender, age group, marital status, household type or level of stamina.
Social participation
The second research question concerned the factors that are important in enabling people with EPMH disability to participate in social activities. Such participation is important at all stages of life as a means of building social connections and promoting resilience. We examined participation in face-to-face social activities in the previous four weeks, including going to a social venue with family/friends, visiting family/friends in their homes and being visited at home by family/friends. Most people with EPMH disability had participated in at least one of these activities, but about one in eight had not.
We conducted a statistical analysis to identify the factors that were associated with social participation. The analysis focused on adults living in private households who were interviewed directly, as this is the group for whom all relevant factors (including social support) were measured. Again, the results showed that aspects of the individual’s condition were important as well as age of onset, household type and social support. Among those with EPMH disability, the factor which reduced participation the most was poor health: the odds of non-participation were nearly 2.9 times higher for those with bad health. Other aspects of the person’s condition which were associated with not participating in social activities were the presence of an anxiety disorder and later age of onset (EPMH disability that first emerges after age 65). Those who acquire a disability later in life may have more difficulty in building up a social network and pattern of social activities that meets their needs than those who acquire a disability earlier when social networks and patterns of participation are still being formed. Those who live in ‘other’ household types (people living with relatives other than a partner or children) also have higher odds of non-participation.

xi
Social support had a strong link to social participation. Those with high levels of social support are very unlikely to have missed out on social participation in the last four weeks. This relationship may be operating in both directions. On one hand, the presence of a supportive network may facilitate social participation and, on the other hand, social participation may contribute to the development of a network of support.
There were some other findings from the survey pointing to the particular significance of the attitudes of other people to those with EPMH disability. These include the fact that feeling ‘self-conscious’ of the disability was more often given as a reason for not participating in general social and civic activities by people with EPMH disability than by people with mobility & dexterity disability (44 per cent vs. 25 per cent). The finding that people with EPMH disability experience more problems related to the attitudes of others suggests that mental health conditions are subject to more stigmatising attitudes than other types of disability (see review by Hannon, 2011).
Labour market participation
People with EPMH disability have lower levels of educational qualifications than the general population: just over one third have no educational qualifications. Nevertheless, most of them had been in employment at some point. About one fifth of those with EPMH disability were in employment at the time of the interview and about two thirds had been in employment in the past. Of those who were in employment in the past, just over three quarters left a job for reasons related to their disability – most often poor health (69 per cent).
In terms of interest in employment, over two in five working-age people with EPMH disability were not currently in employment but would be interested in a job if the circumstances were right. This is a higher level of interest in employment than among people with mobility & dexterity disability. Like people with a disability in general, the most important factor in enabling people with EPMH disability to take up employment is (or would be) flexible working arrangements such as shorter hours or flexible working times (52 per cent).
We conducted an analysis based on a statistical model to examine what distinguished two groups of people with EPMH disability who are not in employment: those interested in employment and those not interested in employment. We focused on people with EPMH disability of working age (18-64) living in private households who were interviewed directly (i.e. not by proxy), as this was the group for which all the relevant data were measured.
The factors that reduced the chances that the person would be interested in employment were the presence of certain other disabilities (speech, remembering & concentrating); schizophrenia; being female; being older (45 to 64) living in a multi-family or non-family household, and poor stamina.

xii
Bad health and the presence of a mobility & dexterity disability reduce the likelihood that someone with EPMH disability will be in employment but are not major factors in distinguishing between those who would be interested and those who would not be interested in employment.
The impact of social support and stigma were not large when other characteristics were controlled but people who sometimes avoided things because of the attitudes of other people had a greater likelihood of being interested in employment but not actually in employment.
Strengths and limitations of the study
The major strengths of this study include the availability of a large nationally representative sample of people with EPMH disability and a wealth of detail on their condition, their circumstances and their participation in education, labour market and social activities. In addition, information on household type and region was available from the 2006 Census. This linkage was possible because the NDS was designed as a follow-up study to the Census. The coverage of nine different types of disability has also made it possible to ask what is specific and unique about EPMH disability in terms of characteristics such as age of onset and level of difficulty with everyday activities. This is the first time this kind of data has been available for Ireland.
One of the limitations of the study, as noted above, is the fact that the stigma associated with mental health problems may lead to under-reporting of EPMH disability, perhaps more so among those who do not also have another type of disability. For this reason, the estimate of the proportion of people who have EPMH disability only (i.e. who do not also some other disability) should be considered a lower bound estimate.
Another limitation is that while we can identify significant associations in the statistical models discussed in this report, it is not always possible to say whether one factor causes another. For instance, when looking at perceived social support and levels of social participation, both pieces of information are collected at the same point in time so there is not necessarily a clear direction of causation between the two. It is likely that the relationship between the two is reciprocal: social support enhances participation and participation builds support networks.
Policy implications
There were three broad implications for policy which we draw from these findings.
The extent of the overlap between EPMH disability and other types of disability points to the need for an integrated approach to service delivery. The fact that one third of people with a disability have EPMH disability means that the delivery of services to people with a disability in general will need to address their mental and emotional health needs.

xiii
Since many people with EPMH disability (about two fifths) first experience the disability during their working years, the issue of retention in employment is particularly important to enhancing the labour market participation of this group. About two thirds of people with EPMH disability were in employment in the past and of these just over three quarters left a job for reasons related to their disability. This means that both the employer and the person with a disability need to be involved in the recovery plan. The analysis also suggested that the availability of flexible working times would be particularly important in enabling people with an EPMH disability to take up employment.
The issue of stigma remains a significant barrier for people with EPMH disability to a greater extent than for mobility & dexterity disability. This has the effect of limiting the social participation of people with EPMH disability and also increases their difficulties in performing everyday activities. Perceived stigma can result in social isolation which, in turn, worsens EPMH disability issues and hinders recovery. Addressing stigma on the part of the general population – including employers and those providing public and private services – needs to remain on the agenda of mental health and disability policy. To the extent that stigma results in discrimination, equality legislation to protect people with a disability in the context of access to employment and to services may be particularly important to those with EPMH disability.

1
Chapter 1: Introduction
1.1 Background
Globally, mental health disabilities account for almost one third of years lost through disability (WHO, 2008, p. 36)2. This estimate by the World Health Organisation is based on a calculation of the relative burden of different conditions in terms of their contribution to disability at a global level. It involves taking account of the duration of the condition and the severity of its impact. Conditions such as depression, bipolar disorder, substance abuse and schizophrenia account for about one third of the total burden. There has been a growth in international recognition of the need to address mental health issues as a component of population health promotion (WHO 2002; WHO 2005b; European Commission 2005). Despite this, mental health and well-being is not routinely been measured in population health surveys, so that information on mental health problems and the conditions under which they result in disability is limited (Barry et al., 2009; Van Lente et al, 2012).
In Ireland, the 2006 National Disability Survey (NDS) provides a unique opportunity to study the characteristics and experiences of those experiencing some level of disability as a result of emotional, psychological and mental health (EPMH disability) issues. This was the first major survey of people with disabilities in Ireland. It provided a basis for the estimation of the prevalence of disability in the population and for the examination of the living circumstances and needs of people with disabilities. The first report from the NDS (CSO, 2008) produced tables showing the nature, severity and cause of the disability. It also showed the age of onset by gender, age group and region. The second report (CSO, 2010) focused on a broad range of characteristics of people with a disability, including education, employment and important aspects of the social and physical environment.
The focus of this report is on emotional, psychological and mental health disability. It is important to be clear about what we mean by this concept. Everyone experiences emotional and psychological challenges in the course of their lives, sometimes of a very transitory nature. We are interested in the subset of people for whom these emotional, psychological or mental health difficulties have lasted, or are expected to last, at least six months or that re-occur regularly and that cause them difficulty in terms of everyday activities. This
2 ‘Years lost through disability’ (YLD) measures the equivalent years of healthy life lost through time spent in states of less than full health.

2
means that if the person has an emotional or psychological condition that is of short duration or that does not cause them any difficulty in their everyday life, it is not considered a ‘disability’.
We draw on the National Disability Survey to address the following research questions:
• What accounts for differences in the extent to which EPMH disabilities lead to difficulties in everyday activities? For instance, how important are the type or cause of the mental health difficulty, the age of onset of the disability, gender, age group, availability of social support (including marital status and household composition) and the attitudes of other people?
• What factors are important in enabling people with EPMH disability to participate in social activities? In this regard, how important are living arrangements and the availability of social support? Does the age of onset of the disability make a difference?
• Is support from other people (marital status, household composition, attitudes of other people) associated with improved labour market outcomes, controlling for the type and severity of mental health disability?
1.2 Conceptual Background
1.2.1 The decline of the ‘medical model’ of disability There has been a major shift in assumptions about the nature of disability in the last two decades. This has involved a move away from the ‘medical’ model of disability which had previously been dominant. In a medical model, the focus is on a person’s impairments and how these impairments affect functioning. Disability is seen primarily as a personal or medical issue. This approach has been criticised for paying insufficient attention to the environment in which the person lives. The alternative ‘social model’ shifts the focus from the individual’s impairments to the environment: the physical environment, the organisation of society and the social and attitudinal barriers that restrict the full participation of people with a disability. The social model is underpinned by a human rights perspective and is concerned with equality of access to resources and opportunities. The social model, in turn, has been criticised for paying insufficient attention to the individual, to the diversity of impairments and how they are experienced, and to the benefits to the individual of treatment of their health problems. The World Health Organisation (WHO) advocates a ‘biopsychosocial model’ of disability, which combines elements of both the medical and social models. This model underlies the International Classification of Functioning, Disability and Health (WHO, 2001a) which underpins the Irish National Disability Survey. In this model, disability is understood in terms of how the individual interacts with the

3
physical and social environment (NESC, 2009). In other words, in order to understand what people are able to do, we need to take account of the resources available to them and the barriers placed before them in their environment as well as their own physical, mental and emotional resources.
The ‘biopsychosocial model’ (WHO, 2001a) is the concept of disability underlying the National Disability Survey. Accordingly, information is gathered both on the person’s condition, on the environment in which they live and the implications of both for their capacity to participate in education, employment, family, social and political life.
1.2.2 Early criticism of the medical model applied to mental illness As far back as the early 1950s, Thomas Szasz was critical of the application of the medical model to mental illness (Szasz, 1960, 1961). He provocatively denied that mental illness was ‘real’ in the same way that cancer was real, on the grounds that it was not possible to point to a definite, objective sign by which it could be diagnosed (Szasz, 1960). Instead, he viewed ‘mental illness’ as an umbrella term for ‘problems in living’ that, generally, do not have an organic or physical cause (Szasz, 1960). However, Szasz’s tendency to equate ‘illness’ with conditions for which current medical techniques have a definitive physical test has itself been criticised: it ignores the many physical conditions (such as migraine) that are diagnosed in terms of a constellation of symptoms, or syndrome, rather than via a definitive biological test (Kendell, 2005).
Szasz’s main criticism was of the use of ‘mental illness’ to coerce and control those experiencing emotional and psychological ‘problems of living’ (Szasz, 2003). He did not deny that people experienced distress as a result of these problems (Szasz, 1960, p. 117) but pointed to environmental factors that contributed to people’s difficulties, such as the complexity of the modern world.
There are also criticisms of the concept of mental illness that point to the proliferation of classifications and diagnoses in the DSM classification system (e.g. Mayes and Horwitz, 2005; Horwitz and Wakefield, 2007). These criticisms centre on the conflation of ‘distress’ and ‘disorder’ and the tendency to ‘medicalise’ what is a typical and appropriate response to stressful life situations.
In the present context, our concern is not with diagnosis and classification, nor with the labelling of the person’s condition as ‘disordered’. Instead, our focus is on the extent to which emotional, psychological and mental health conditions lead to difficulties in carrying out the person’s everyday activities that have persisted (or are likely to persist) for at least six months. Consistent with the definition of disability that underlies the ‘biopsychosocial’ model, we make no assumption that the difficulties arise solely from a condition inherent in the

4
person. Instead, we are also sensitive to the environmental context that plays a role in enabling or limiting what the person can do.
1.1.4 The social environment and stigma In the context of research on disability, an analysis of the environment in which people live is important to understanding variations in the limitation associated with a condition. One component of the environment is the social context and attitudes of other people. People with EPMH disability may be more affected by social stigma than those with other types of disability and this may impede the capacity of people with EPMH disability to obtain social support. The WHO highlights that the single most important barrier to overcome in the community is the stigma associated with mental health problems and discrimination against who experience these problems (WHO, 2001b).
Many types of EPMH disability are ‘invisible’ so that those with this kind of disability have a choice about whether to disclose it. This can create a dilemma in that disclosure may be necessary to receive the support the person needs but, because of stigmatising attitudes, there is strong social pressure to maintain silence (Lingsoma, 2008).
Irish research on attitudes towards people with a disability finds more negative attitudes towards people with mental health problems than with physical disability (Hannon, 2007, p. 13). The Irish SLAN 2007 survey included an item to capture the perceived stigma surrounding mental health issues: ‘If I was experiencing mental health problems, I wouldn’t want people knowing about it’. Just over half the national sample of adults reported that they ‘agree’ or ‘strongly agree’ with this statement. The figures were even higher for men, those in higher social class, education and income groups, those married or cohabiting and in paid employment (Barry et al., 2009). The authors suggest that mental health problems may be perceived as impacting negatively on people’s social and economic position, especially by those who feel they have most to lose in this respect. These perceptions may lead to under-reporting in self-reported levels of mental health problems as well as negatively affecting people’s willingness to disclose and seek help for mental health difficulties.
There is some evidence that the recession has led to an increase in the number of people exposed to mental health problems. Based on a survey of a representative national sample of 1,038 adults in 2012, over half of Irish adults have experience of a mental health problem either in themselves or in others, up from 39 per cent in 2010 (See Change 2012). This increase may partly result from a greater prevalence of mental health problems because of the stress associated with the recession and partly from an increased willingness to disclose
5
mental health difficulties. At any rate, it suggests that there is a greater level of awareness of mental health disability in recent years.
International research points to the importance of public attitudes in enabling people with mental illness to seek the help they need and participate in society. Evans-Lacko et al. (2012), in a study of 14 European countries, found that people with mental illness living in countries with less stigmatizing attitudes had lower rates of ‘self-stigma’ and perceived discrimination. There was also a link between feeling empowered and living in a country where people felt more comfortable in talking about mental illness.
The concept of ‘self-stigma’ refers to the prejudice which people with mental illness turn against themselves (e.g. Corrigan and Watson, 2002, p. 16). Stigma involves labelling, stereotyping (applying socially agreed understandings of a group), prejudice (believing the negative features of a stereotype combined with an unfavourable emotional response such as fear or hatred), separating (dividing groups into ‘them’ and ‘us’) and discrimination (an unfavourable behavioural response), resulting in the loss of status and power. Self-stigma and fear of rejection may lead people to avoid pursuing opportunities (Corrigan and Watson, 2002, p. 16). However, internalising stigma inferred from social cues is not inevitable: people may reject the stigmatising attitudes and react against them in anger (Corrigan and Watson, 2002, p. 18).
There is a danger, however, that a focus on self-stigma might ignore the relatively powerless position of people with EPMH disability. An important point noted by Link et al is the idea that stigma depends on power. “Groups with less power (e.g., psychiatric patients) may label, stereotype, and cognitively separate themselves from groups with more power (e.g., psychiatrists). But in these cases ... the potentially stigmatizing groups do not have the social, cultural, economic, and political power to imbue their cognitions with serious discriminatory consequences” (Link et al., 2004, p. 514). This understanding of stigma would place the focus on the negative attitudes of those in power rather than on the self-perceptions of people with EPMH disability, and would view the latter as emerging as a result of the former.
1.1.5 EPMH disability, the labour market and marriage Longitudinal studies, or studies which carefully record the timing of certain life events, are particularly informative in disentangling the relationship between EPMH disability and labour market outcomes and between EPMH disability and marriage. This research generally finds a reciprocal relationship, with early-onset EPMH disability having long-term consequences (reduced probability of employment and of marriage) and with the beneficial effects of marriage and

6
becoming employed most noticeable in the period immediately after the transition.
Goodman, Joyce and Smith (2011) draw on the British National Child Development Study (a panel study of a cohort of 17,634 children born in Great Britain during a single week in March 1958) to examine the consequences in adulthood of physical and mental health problems in childhood. The authors found that the effects of psychological problems in childhood were far more important over the lifetime than the effects of most physical health problems in childhood. Those who had experienced psychological problems by age 16 had lower net family income (28 per cent lower at age 50), a reduced likelihood of being married and a reduced likelihood of being in employment.
Smith and Smith (2010) analyse the US Panel Study of Income Dynamics to examine the impact of childhood psychological conditions (including depression, substance abuse and other psychological problems before age 17) on life chances in adulthood. The measures of childhood psychological problems were drawn from a 2007 retrospective child health history module. The authors found substantial disadvantages in terms of educational achievement (lower by six tenths of a year of schooling), reduced family incomes (20 per cent lower), and reduced employment history (seven fewer weeks per year) and a lower probability of being married (by 11 per cent). Controlling for physical childhood diseases shows that these effects are not due to the co-existence of psychological and physical diseases, and estimates controlling for within-sibling differences demonstrate that these effects are not due to unobserved common family differences. The authors find that the main way in which childhood psychological problems affects adult outcomes is through psychological problems in adulthood.
Employment transitions, such as from paid employment to non-employment have been found to be associated with psychological distress in longitudinal research (Thomas, Benzeval and Stansfeld, 2005). The exception was transitions into retirement which showed no significant effect on psychological distress. Transitions in the opposite direction, from non-employment to employment were associated with improvements in mental wellbeing. The strongest effects seem to have been felt within six months of the transition.
People with mental illness are less likely to marry but the relationship is likely to be reciprocal, with marriage bringing mental health benefits. Horwitz, White and Howell-White (1996) draw on longitudinal data on young adults (aged 25 to 31 at the end of the period) in New Jersey over a seven year period to investigate whether there are mental health benefits to marriage (rather than people with better mental health entering marriage or remaining married). They find that, controlling for premarital mental health, young adults who get and stay married
7
have lower levels of depression and alcohol problems than those who remain single. The benefits in terms of depression are greater for men than for women, while marriage is associated with fewer alcohol problems for women, but not for men. The authors also find selection effects into marriage for women. More depressed women are less likely to become married over the seven year period. The authors found no selection effects for men into marriage for either depression or alcohol problems. Women experiencing depression are also more likely to experience marital breakdown in the period.
In another longitudinal study, Teitler and Reichman (2008) find that non-married mothers with mental illness are only about two thirds as likely as mothers without mental illness to marry over a five year period from the birth of the child, even after controlling for demographic characteristics, human capital, relationship quality and substance abuse.
Musick and Bumpass (2012) find that the benefits of marriage and cohabitation in terms of mental wellbeing are most pronounced right after the transition. Drawing on the US 1987–1992 longitudinal National Survey of Families and Households and using fixed effects models to control for pre-existing individual differences, the authors found that moving into any union (marriage or cohabiting) increased overall happiness and reduced depressive symptoms relative to remaining single (p. 9). However, recently formed unions (within 3 years) provided a greater boost than those 4-6 years old (p. 10).
Breslau et al., (2011) draw on epidemiological survey data from 19 countries to examine the association between mental health problems and marriage and (for 12 of the countries, divorce). The presence of mental health problems is assessed by means of retrospective recall, focusing on those with an age of onset prior to the outcome of interest (marriage or divorce). Most of the mental health problems were associated with a lower likelihood of ever marrying and with a greater likelihood of divorce. Three mental health problems (specific phobia, major depression and alcohol abuse) accounted for the largest population risk for both non-marriage and divorce.
1.4 Policy context
As noted above, there is an increasing awareness of the need to take the issue of mental health seriously. The World Health Organisation, in its Mental Health Declaration for Europe argues that mental health is a core requirement of social cohesion: “Mental health and well-being are fundamental to quality of life, enabling people to experience life as meaningful and to be creative and active citizens. Mental health is an essential component of social cohesion, productivity and peace and stability in the living environment, contributing to social capital and economic development in societies” (WHO, 2005a, p.1). The WHO definition of

8
mental health as a ‘state of well-being in which the individual realises his or her own abilities, copes with the normal stresses of life, works productively and fruitfully, and makes a contribution to his or her community’ (WHO, 2001b p.1) emphasises the importance of involvement and participation. The WHO ‘biopsychosocial’ concept of disability (WHO, 2001a) acknowledges the strong role that the environment plays in enabling people with disability to participate fully in society.
The EU Commission has also called for a renewed focus on mental health. In November 2005, the Commission published a Green paper to begin a discussion on mental health strategy as a first response to the WHO Mental Health Declaration for Europe (EU Commission, 2005; WHO, 2005a). Following the WHO, the Green Paper acknowledged the importance of mental health to quality of life. The 2008 European Pact for Mental Health and Wellbeing was issued by participants in the EU high-level conference "Together for Mental Health and Well-being", held in Brussels in June of that year.3 This group emphasised the importance of mental health as a resource for the EU and, given an increase in the level of mental health difficulties, argued for a greater emphasis on this issue. In particular, they identified five areas for priority action by member states: prevention of depression and suicide, mental health in youth and education, in the workplace, in older people and combating stigma and social exclusion.
In terms of mental health policy in Ireland, a key document has been A Vision for Change (2006). This document has a strong emphasis on social inclusion and participation for people with mental health problems. The authors recommended equality of access to employment, housing and education for people with mental health problems (p. 35). The group notes that stigma is one of the greatest barriers to social inclusion and recommends the adoption of evidence-based programmes to challenge stigma (p. 36).
A Vision for Change describes a model of mental health service provision that emphasises a holistic view of mental illness and recommends an integrated multidisciplinary approach to addressing the full range of factors relevant to mental health problems. Among its main concepts is that of person-centred treatment, development of an integrated care plan, and the involvement of service users and their families or carers. The primary care sector is likely to be particularly important in the integration of care across sectors, since 90 per cent of mental health presentations for health services occur in the primary care context (HSE Working Sub Group on Mental Health in Primary Care, 2012).
3 Document available at http://ec.europa.eu/health/ph_determinants/life_style/mental/docs/pact_en.pdf.

9
The Vision for Change document also emphasises a recovery-centred approach to interventions where people with mental health difficulties become partners in their own care and the goal of care is to build up the resources available to the person, with a view to reintegration and inclusion so that they can lead productive and meaningful lives despite any vulnerabilities that may persist (p. 5). Although the strategy has been in existence for seven years at the time of writing, implementation has been uneven, particularly in terms of moving beyond the medical model of disease management (Mental Health Commission, 2013).
In the context of mental health policy, there is a new emphasis on ‘positive mental health’, including concepts such as resilience, recovery and well-being rather than on the concepts of mental illness and disability (e.g. A Vision for Change, 2006; Friedli, 2009; Mental Health Strategic Partnership, 2013; Barry et al., 2009). This emphasis is welcome and is important to health promotion in the long term and the prevention of problems before they occur. It can lead to a stronger focus on the social and environmental underpinnings of the continuum from flourishing to disability. Nevertheless, those experiencing difficulty as a result of mental and psychological health issues cannot be ignored. This is the group most in need of services and support in the short term and the group for whom improvements to services and changes in public attitudes to EPMH disability can bring the most immediate and tangible benefits.
1.5 Outline of report In the remainder of this chapter, we describe the NDS data and the measures used in this report. In Chapter 2, we provide an overview of the situation of people with EPMH disability, focusing in particular on their characteristics in terms of gender and age, the presence of other disabilities, age of onset and nature of the disability. In Chapter 3 we examine the factors which account for differences in the degree to which EPMH disability is associated with difficulties in everyday life. In Chapter 4, we turn to an examination of the significance of living arrangements for the degree of social support available to people with EPMH disability. In Chapter 5 we ask whether the degree of social support is important in accounting for different outcomes in terms of the employment status of the individual with EPMH disability. Finally, in Chapter 6, we draw together the results with a view of highlighting the areas of policy relevance.
1.6 Methodology
1.6.1 The National Disability Survey (NDS) The data for this report come from the 2006 National Disability Survey (NDS), with key variables matched onto the file from Census 2006. The 2006 National Disability Survey (NDS), which builds on the information relating to disability obtained in the Census of Population of April 2006, was a landmark in terms of in-depth information about people with disabilities in Ireland. It provided a basis

10
for the estimation of the prevalence of disability in the population and for the examination of the living circumstances and needs of people with disabilities.
In 2006, the Census had two questions on disability. The first asked whether the person had any of a set of long-lasting conditions, including ‘a psychological or emotional condition’. The second question asked whether the person had any difficulty in carrying out a set of everyday activities, such as self-care, working at a job or business or participating in leisure activities (CSO, 2008, p.11).
The Census was followed by the National Disability Survey (NDS) in autumn 2006. The NDS was designed as a follow-up to the Census. Interviewing people identified by the Census questions as having a disability was the most efficient means of obtaining a representative sample of people with a disability. The sample for the NDS was selected from those identified as having a disability in the census. 4 The sample was a stratified random sample. For people with a disability in private households, the stratification was by urban/rural location and age group. For people with a disability in communal establishments (such as nursing homes), the stratification was by type of communal establishment (CSO 2008, pp. 180-182).
The NDS questionnaires covered nine different categories of disability: seeing, hearing, speech, mobility & dexterity, remembering & concentrating, intellectual or learning, EPMH, pain and breathing. For most types of disability covered in the NDA, people were regarded as ‘having a disability’ if they experienced a moderate or greater level of difficulty. However, in the case of an intellectual or learning disability and emotional, psychological or mental health disability ‘just a little difficulty’ was adopted as the threshold. The NDS also had a time threshold. The respondent was asked to think about difficulties that have lasted, or are expected to last, six months or more, or difficulties that recur regularly.
In this report we draw on the data from the 12,661 people who had a disability according to the Census and the NDS. We focus, in particular, on the 4,300 individuals who experience an EPMH disability, amounting to 34 per cent of the disability sample.
4 The NDS, as a check, also followed 1,500 people who, according to the Census questions, did not have a disability. A small number of these (11 per cent) met the criteria for ‘disability’ in the NDS, but they are not included in the present analysis. In general, the people with a disability identified from this group tended to experience less difficulty in everyday activities than those who had a disability according to both the census and the NDS, or had a type of disability not specifically mentioned in the Census item – such as pain or breathing disability (CSO 2008, pp. 12-13).

11
The NDS has two major advantages from the perspective of understanding EPMH disability. The first is the relatively large sample size of 4,300 individuals who experience an EPMH disability. This is a very substantial sample and allows us to examine in a great deal of depth the characteristics of people with mental and emotional health difficulties and to investigate differences within this broad group. The second advantage is that in the case of EPMH disability, the NDS dataset includes people whose daily activities are limited ‘just a little’ because of their disability as well as those who are more seriously impacted. This means that the sample is less ‘truncated’ – it includes a broader range of levels of difficulty – than is the case with most of the other types of disability. The inclusion of a range of difficulty levels allows us to examine the conditions that enable people with EPMH issues to be less seriously limited in their daily lives.
1.6.2 Measuring EPMH disability Emotional, psychological and mental health (EPMH) disability, which is the focus of this report, is measured as follows in the NDS:
I am now going to ask about emotional, psychological or mental health difficulties. Please tell me only about those difficulties that have lasted or are expected to last six months or more or that regularly re-occur.
Because of any emotional, psychological or mental health difficulties, do you have difficulty in the amount or kind of everyday activities you can do? (Note: These conditions include depressive illnesses, anxiety or panic disorders, schizophrenia, alcohol or drug addictions, eating disorders such as anorexia, bulimia.) (CSO, 2008).
Answers may range from ‘just a little’ to ‘a lot/cannot do’. Someone having any level of difficulty with everyday activities because of an EPMH disability difficulty is regarded as having an EPMH disability. According to the NDS, there were in the region of 111,000 adults in Ireland with EPMH disabilities.
One point worth noting here is that the mention of specific DSM categories of illness (‘depressive illnesses, anxiety or panic disorders, schizophrenia, alcohol or drug addictions, eating disorders such as anorexia, bulimia’) may have discouraged those with emotional or psychological problems who have not been diagnosed as having an illness from responding in the affirmative. However, the broad range of conditions cited should go some way towards ensuring that the item captures a wide range of EPMH disability conditions.
The measurement of disability in the NDS used a time threshold. The respondent was asked to think about difficulties that have lasted, or are expected to last, six months or more, or difficulties that recur regularly. Many mental health conditions, such as depression, are characterised by remission and relapse for

12
many of those affected. Therefore, the inclusion of conditions that have a recurring pattern is important.
1.6.3 Unit of analysis and population The population for the analysis is the group of people with a disability according to both the NDS and the Census and living in private households. While the focus of this report is on those with emotional, psychological and mental health disability, we compare this group to people with a mobility & dexterity disability – the most frequently occurring type of disability. This comparison allows us to gain perspective on the distinguishing features of EPMH disability.
1.6.4 Information linked from census In addition to data from the National Disability Survey, the CSO provided us (for the purpose of this analysis) with data linked to the NDS from Census 2006. This included:
• Socio-demographic characteristics such as marital status, highest level of education completed, principal economic status, employment status and occupation.
• Household characteristics such as household type, number of adults and children in the household; presence of other people with a disability or carers; the place of respondent in household
• Number of working-age adults age 18-59 in household and number of these in employment
• Social class of household
• Region
1.6.5 Comparison group: people with mobility & dexterity disability One of the best ways to provide a perspective on the results of a piece of analysis is to compare two groups. In this report, since we do not have data on the general population in the National Disability Survey, we compare people with EPMH disability to those with the largest category of physical disability, people with mobility & dexterity disability. This is measured in the NDS as follows:
The next few questions are about your ability to move about or to use your hands. Remember, I am asking only about difficulties that have lasted or are expected to last six months or more or that regularly re-occur.
Do you have difficulty ...
Moving about inside your home?

13
Going outside of your home?
Walking for a longer distance, e.g. walking for about 15 minutes?
Using your hands and fingers, e.g. picking up small objects or opening and closing containers. (CSO, 2008, p.7).
Answers may range from ‘just a little’ to ‘a lot/cannot do’. Someone having a ‘moderate level’ or greater difficulty with any of these activities is regarded as having a mobility & dexterity disability. According to the NDS, there were in the region of 184,000 adults in Ireland with mobility & dexterity disability.
Note that there are many people who have both EPMH disability and mobility & dexterity disability. Just over half of people with EPMH disability also have mobility & dexterity disability but, because those with mobility & dexterity disability are a larger group, only 31 per cent of those with mobility & dexterity disability also have EPMH disability. We could have chosen to compare people with EPMH disability to the subset of those with mobility & dexterity disability who do not also have EPMH disability. However, on balance, we felt that the comparison with the entire group of people with mobility & dexterity disability would be clearer than the comparison with a subset of this group. In particular, the subset of those with mobility & dexterity disability who do not have EPMH disability may differ in experiencing less difficulty as a result of their disability.

14
Chapter 2: Overview of EPMH disability
The present chapter provides an overview of the situation of people with emotional, psychological and mental health (EPMH) disability and sets the context for the analyses in this report. We discuss the prevalence of EPMH disability; the age of onset and main cause; its overlap with other types of disability; the pattern by gender, age, marital and family status; the health and stamina of people with EPMH disability and the extent to which they are affected by stigma or helped by social support.
2.1 Prevalence of EPMH disability
Figure 2.1 shows the prevalence of the nine different kinds of disability identified in the 2006 National Disability Survey. EPMH disability affected about 111,000 people in 2006. It was the fourth most common type of disability, after mobility & dexterity (184,000), pain (153,000) and not far behind remembering & concentrating (113,000).
Table 2.1: Frequency of EPMH disability and other types of disability by gender
Male
Estimate
d number
(000s)
Female
Estimate
d number
(000s)
Total
Estimate
d number
(000s)
Male As a
percentag
e of those
with a
disability
Female As
a
percentag
e of those
with a
disability
Total
As a
percentag
e of those
with a
disability
D Mobility & dexterity 78 106 184 50% 63% 56%
H Pain 65 87 153 42% 52% 47%
E Remembering & concentrating 55 58 113 35% 34% 35%
G Emotional, psychological & mental health 52 59 111 33% 35% 34%
F Intellectual or learning 43 28 72 28% 17% 22%
I Breathing 35 36 71 22% 21% 22%
B Hearing 29 29 58 18% 17% 18%
A Seeing 21 29 51 14% 17% 16%
C Speech 19 16 35 12% 10% 11%
Any Disability 157 169 326 100% 100% 100%
15
Base: People (all ages) with a disability. Source: National Disability Survey 2006, analysis by authors.
People may have more than one type of disability - the average person with a disability has 2.6 different types of disability (CSO, 2008). Just over one third of those with a disability experience EPMH disability, with similar proportions of males and females affected.
Note that when we speak of ‘types’ of disability we are concerned with the nature of the limitation the person experiences. Having more than one type of disability in this sense may not indicate the presence of separate medical conditions. For instance, both EPMH disability & difficulties with remembering or concentrating may be linked to the same underlying condition (such as depressive illness). Alternatively, medication to treat an EPMH condition may contribute to problems with remembering and concentrating. In the ‘biopsychosocial’ model of disability, when we speak of types of disability we are concerned with the kinds of things the person is able to do and or is limited from doing rather than focusing on the particular medical diagnoses.
2.2 Age and disability
Table 2.2 shows the percentage of those with a disability in each age group who have each type of disability. Broadly speaking, we can divide the types of disability into groups based on their association with age. There are two types of disability where the prevalence increases sharply with age: mobility & dexterity and pain. Both increase sharply up to age 64. After this, mobility & dexterity continues to rise but the relative importance of pain drops back somewhat.
There are three types of disability where the relative prevalence among those with a disability increases with age, though less sharply: seeing, hearing and breathing. These types of disability are less common than mobility & dexterity and pain disabilities.
There are two types of disability where the relative prevalence tends to decline with age: intellectual or learning and speech disabilities. Intellectual or learning disabilities are distinctive in that the prevalence does not increase with age in the same way as with other types of disability. This is a broad category, and combines two very different groups – those with an intellectual disability (usually diagnosed at birth or during early childhood) and those with learning difficulties such as dyslexia and Attention Deficit Hyperactivity Disorder (ADHD), which tend to be noted during the school years. Earlier generations would not have had conditions such as dyslexia and ADHD diagnosed. This would account for the peak for the combined category (intellectual or learning disability) at about age 12, where it affects about 4 per cent of children. Thereafter it declines until the age of 23. It remains at about 1 per cent of the population until the age of 70, when it begins

16
to rise slightly. The decline in the prevalence of intellectual or learning disability from the early twenties onwards may be due to the fact that this is more likely to be diagnosed now than in the past.5
Table 2.2: Percentage of people with a disability in each age group who have each type of disability
Age 0-17
Age 18-29
Age 30-44
Age 45-64
Age 65+
D Mobility & dexterity 23% 28% 41% 59% 77% H Pain 10% 27% 47% 61% 55% E Remembering & concentrating 50% 34% 32% 29% 31% G Emotional, psychological & mental health 28% 39% 49% 40% 20% F Intellectual or learning 75% 49% 22% 11% 5% I Breathing 15% 15% 15% 26% 27% B Hearing 9% 8% 11% 16% 28% A Seeing 7% 8% 9% 15% 23% C Speech 28% 13% 9% 5% 5%
Estimated number with any disability (‘000s) 36 26 48 92 104
Base: People (all ages) with a disability. Source: National Disability Survey 2006, analysis by authors. People can have more than one disability type’.
Finally, there are two types of disability that have a curvilinear relationship with age. Remembering & concentrating is highest in children, for whom it is often associated with intellectual or learning disabilities. The prevalence falls until age 65 then begins to rise again. In later years, problems in remembering and concentrating are more likely to be linked to dementia and conditions such as Alzheimer’s disease. EPMH disability is curvilinear in the opposite direction: it increases in the middle years and drops back again in later years.
2.3 Age of onset of disability
Table 2.3 shows the age of onset of disability by disability type. Compared to mobility & dexterity disability, EPMH disability is more likely to be present from birth (12 per cent vs. 8 per cent) or from childhood (19 per cent vs. 6 per cent).
5 Another consideration is that people with severe intellectual disability often have associated conditions which result in a reduced life expectancy, particularly in earlier generations when fewer treatment options were available (Patja et al., 2001).
17
Table 2.3: Age of onset by type of disability
Age of onset
See-ing
Hear-ing Speech
Mobility &
dexterity
Remember-ing & con-centrating
Intellect-ual or
learning EPMH
disability Pain Breath-
ing
From birth 13% 12% 47% 8% 17% 44% 12% 3% 10% Age 0-17 14% 13% 23% 6% 18% 43% 19% 7% 13% Age 18-29 6% 6% 2% 8% 7% 3% 18% 12% 6% Age 30-49 18% 16% 5% 23% 16% 3% 26% 32% 21% Age 50-69 27% 28% 11% 30% 22% 3% 17% 32% 32% Age 70+ 22% 25% 12% 25% 20% 3% 8% 15% 18% Total 100% 100% 100% 100% 100% 100% 100% 100% 100%
Base: People (all ages) with a disability. Source: National Disability Survey 2006, analysis by authors.
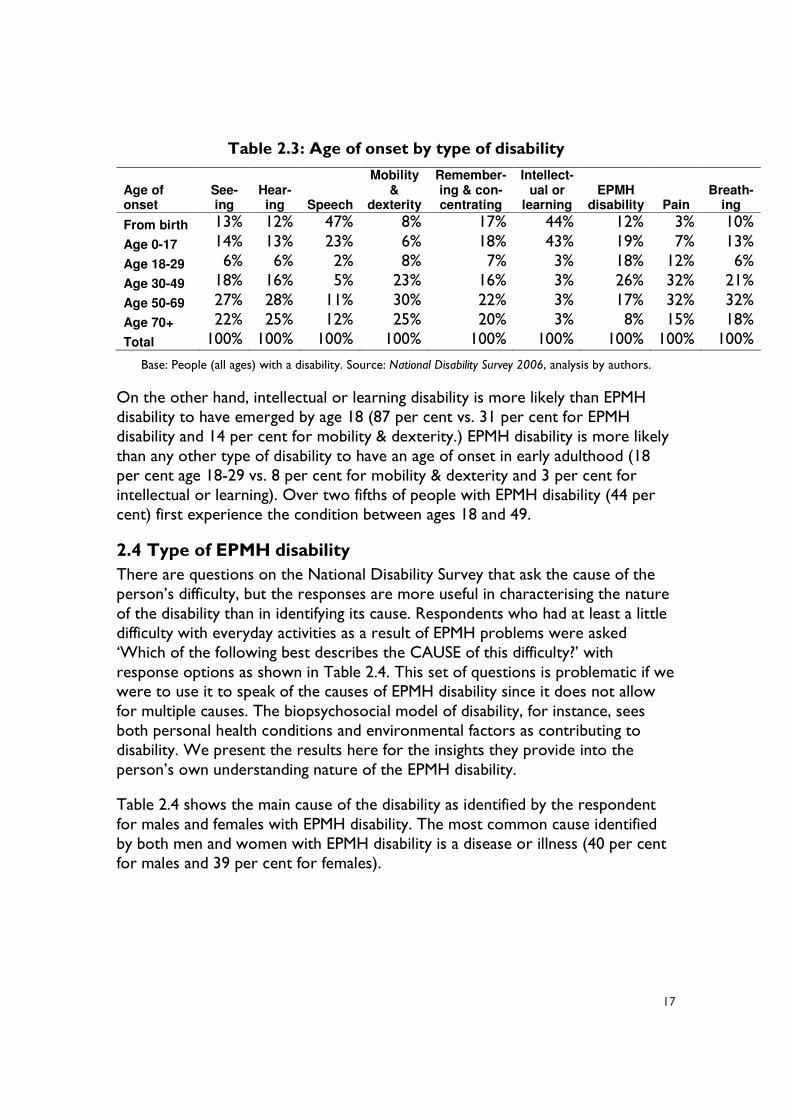
On the other hand, intellectual or learning disability is more likely than EPMH disability to have emerged by age 18 (87 per cent vs. 31 per cent for EPMH disability and 14 per cent for mobility & dexterity.) EPMH disability is more likely than any other type of disability to have an age of onset in early adulthood (18 per cent age 18-29 vs. 8 per cent for mobility & dexterity and 3 per cent for intellectual or learning). Over two fifths of people with EPMH disability (44 per cent) first experience the condition between ages 18 and 49.
2.4 Type of EPMH disability
There are questions on the National Disability Survey that ask the cause of the person’s difficulty, but the responses are more useful in characterising the nature of the disability than in identifying its cause. Respondents who had at least a little difficulty with everyday activities as a result of EPMH problems were asked ‘Which of the following best describes the CAUSE of this difficulty?’ with response options as shown in Table 2.4. This set of questions is problematic if we were to use it to speak of the causes of EPMH disability since it does not allow for multiple causes. The biopsychosocial model of disability, for instance, sees both personal health conditions and environmental factors as contributing to disability. We present the results here for the insights they provide into the person’s own understanding nature of the EPMH disability.
Table 2.4 shows the main cause of the disability as identified by the respondent for males and females with EPMH disability. The most common cause identified by both men and women with EPMH disability is a disease or illness (40 per cent for males and 39 per cent for females).

18
Table 2.4: Main cause of EPMH disability as identified by respondent by gender
Male Female Total
Hereditary/genetic 10.1 9.7 9.9
An accident, injury or fall 9.0 4.4 6.5
A disease or illness 39.8 38.7 39.2
Work conditions 2.2 1.2 1.7
Stress 13.7 20.6 17.4
Other cause 11.9 13.0 12.5
No specific cause 4.2 4.8 4.5
Don’t know 9.1 7.7 8.3
Total 100.0 100.0 100.0
Base: People (all ages) with emotional, psychological or mental health disability. Source: National Disability Survey 2006, analysis by authors.
This is followed at some distance by stress, which is more often identified by women than men (21 per cent and 14 per cent respectively). Hereditary or genetic causes are identified by about 10 per cent of respondents while ‘other’ causes are identified by 12 per cent of men and 13 per cent of women.
Those who identified the cause as ‘disease or illness’ were further asked the nature of the disease or illness, with response categories as shown in Table 2.5. Note that the nature of the disability is only ascertained if the person lists the cause as a ‘disease or illness’. We do not know, for instance, whether someone who attributes their difficulties to stress is experiencing depression, anxiety or some other type of EPMH difficulty. Despite the limited nature of the information available, the analysis in subsequent chapters will document the link between the respondent’s understanding of the nature of the condition and outcomes such as the level of difficulty experienced, social participation and employment.
Table 2.5 shows the main disease or illness identified by the 39 per cent of people with EPMH disability for whom the main cause of the problems is a disease or illness. The figures are shown separately for males and females with EPMH disability. The most common disease or illness is depression, particularly for females. In 46 per cent of cases where female EPMH disability is caused by a disease or illness, the respondent identifies the disease or illness as depression. The figure is 37 per cent for males.

19
Table 2.5: EPMH disability by disease or illness type
Male Female Total Anxiety disorder 14% 17% 16% Depression 37% 46% 42% Bi-polar disorder 4% 4% 4% Addiction to alcohol or drugs 6% 2% 4% Schizophrenia 12% 6% 9% Other 24% 22% 23% Don't know / not stated 3% 3% 3%
Base: People (all ages) with emotional, psychological or mental health disability where the main cause is a disease or illness (39 per cent of people with EPMH disability). Source: National Disability Survey 2006,
analysis by authors.
The next most common specific disease or illness is anxiety disorder (17 per cent of females and 14 per cent of males). Schizophrenia is identified as the main disease or illness by 12 per cent of men and 6 per cent of women.6 ‘Other’ disease or illness is identified by nearly one quarter of men and over one fifth of women.
2.5 Overlap between EPMH disability and other disabilities
One of the most striking findings from the National Disability Survey was that the average person with a disability had 2.6 of the nine different types of disability covered by the survey so that having multiple disabilities – rather than having a single type of disability – was the norm. In this section we examine the extent of overlap between EPMH disability and other types of disability. We then go on to look at some patterns which might give an indication of whether the other disability contributed to the emergence of EPMH disability or vice versa. We do this by comparing the ages of onset in cases where the person has more than one type of disability and by asking whether EPMH or the other disability is considered by the person to be the main one.
2.5.1 Extent of overlap between EPMH and each other disability Most of those with EPMH disability also have another kind of disability (Table 2.6). In only 13 per cent of cases is EPMH disability the only kind of disability the person faces. In a further 28 per cent of cases, the person has more than one disability but considers EPMH disability as their main disability. The biggest group, 59 per cent of those with EPMH disability, have more than one disability and the other disability is considered to be their main disability. Those with multiple
6 Schizophrenia is thought to be equally common in men and women, measured in terms of cumulative lifetime risk, but may affect more men than women at a given point in time because of differences in age of onset (see discussion in Canuso and Pandina, p. 179).
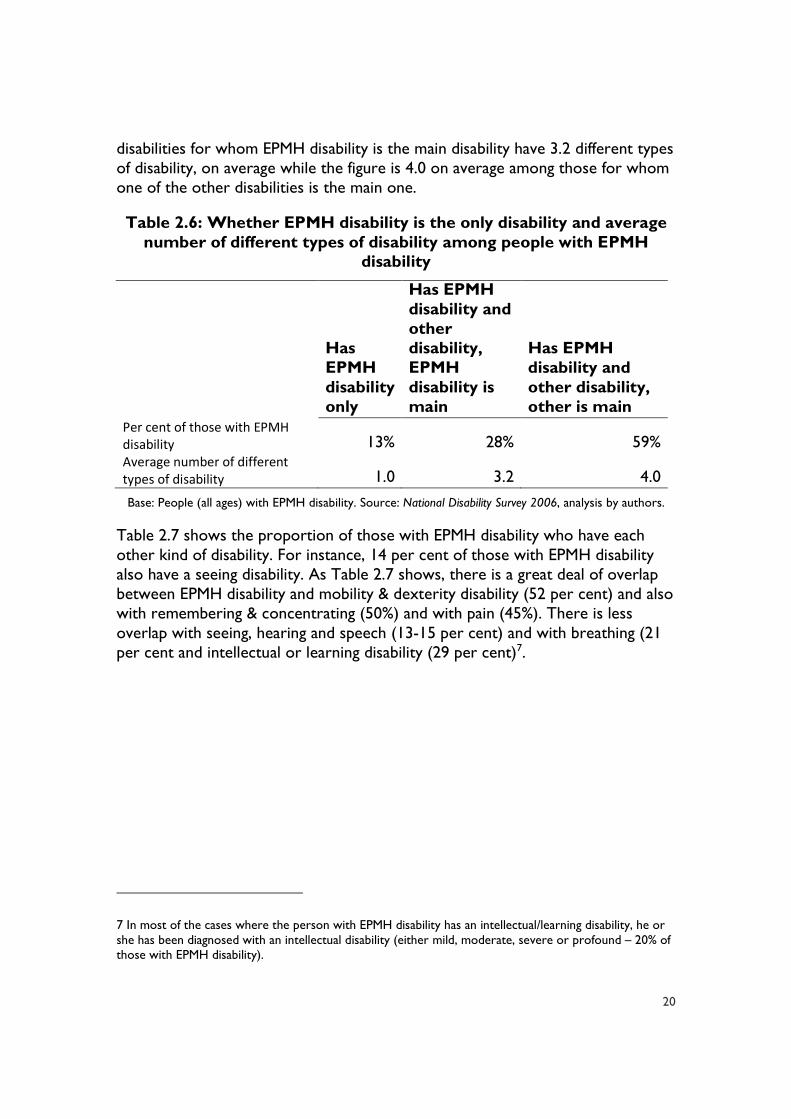
20
disabilities for whom EPMH disability is the main disability have 3.2 different types of disability, on average while the figure is 4.0 on average among those for whom one of the other disabilities is the main one.
Table 2.6: Whether EPMH disability is the only disability and average number of different types of disability among people with EPMH
disability
Has EPMH disability only
Has EPMH disability and other disability, EPMH disability is main
Has EPMH disability and other disability, other is main
Per cent of those with EPMH
disability 13% 28% 59% Average number of different
types of disability 1.0 3.2 4.0
Base: People (all ages) with EPMH disability. Source: National Disability Survey 2006, analysis by authors.
Table 2.7 shows the proportion of those with EPMH disability who have each other kind of disability. For instance, 14 per cent of those with EPMH disability also have a seeing disability. As Table 2.7 shows, there is a great deal of overlap between EPMH disability and mobility & dexterity disability (52 per cent) and also with remembering & concentrating (50%) and with pain (45%). There is less overlap with seeing, hearing and speech (13-15 per cent) and with breathing (21 per cent and intellectual or learning disability (29 per cent)7.
7 In most of the cases where the person with EPMH disability has an intellectual/learning disability, he or she has been diagnosed with an intellectual disability (either mild, moderate, severe or profound – 20% of those with EPMH disability).

21
Table 2.7: Percentage of those with EPMH disability who also have each other kind of disability
% of those with EPMH disability who also have
...
Seeing disability 14% Hearing disability 13% Speech disability 15%
Mobility & dexterity disability 52% Remembering & concentrating
disability 50% Intellectual or learning disability 29%
Pain disability 45% Breathing disability 21%
No other type of disability 13%
Base: People (all ages) with EPMH disability. Source: National Disability Survey 2006, analysis by authors.
The overlap between EPMH disability and other types of disability is partly due to the impact on mental health of physical health problems and disability and partly due to the impact on physical health of mental health conditions. On the one hand, people with many long-term health conditions also experience mental health challenges and that mental health problems need to be addressed in order to promote recovery from the physical health condition (Naylor et al., 2012). On the other hand, people who have mental health problems are more likely to go on to develop physical health problems such as coronary heart disease (Gale et al, 2014).
Recent discussion has been critical of the emphasis on a single ‘main’ diagnostic category for those with mental health problems that may obscure the fact that several different mental health problems might be present at the same time (Hyman, 2010). What is very clear from the results of the NDS however, is that there can be a very substantial degree of co-occurrence across the entire spectrum of types of disability. As such, it does not make sense to divide people with a disability into distinct groups with distinct types of disability. To do this would obscure the complexity of the challenges they face and the full range of resources required to facilitate full social participation.
2.5.2 Age of onset of EPMH disability and other disability Table 2.8 focuses on those who have EPMH disability and one of the other types of disability. The figures compare the age of onset of the EPMH disability and the other disability. It shows whether the EPMH disability had an earlier, later or similar age of onset to the other disability. This information may be helpful in identifying which type of disability came first. For instance, the top row of the

22
table shows that among people with both EPMH disability and seeing disability, 29 per cent had an earlier age of onset for their seeing disability; 28 per cent had both types of disability begin at the same age and 42 per cent had a later age of onset for their EPMH disability.
Table 2.8: Whether EPMH disability began earlier, later or at the same time as the other disability.
EPMH disability
earlier Same age EPMH disability later
Seeing 29% 28% 42% Hearing 29% 30% 41% Speech 13% 73% 13%
Mobility & dexterity 25% 52% 23% Remembering & concentrating 25% 64% 11% Intellectual or
learning 4% 73% 23% Pain 30% 47% 23%
Breathing 37% 36% 27%
Base: People (all ages) with EPMH disability and another disability. Source: National Disability Survey 2006.
There is quite a degree of variability depending on the type of disability. For instance, speech disability and intellectual or learning disabilities tend to have a similar age of onset to EPMH disability in nearly three quarters of the cases. In these cases, it is not really possible to say whether one type of disability is causally prior based on when it first occurred. Those with remembering & concentrating and mobility & dexterity disabilities as well as EPMH disability are also highly likely to report a similar age of onset for both (64 per cent and 52 per cent, respectively). Breathing, hearing and seeing disability are less likely to have the same age of onset as EPMH disability (36 per cent, 30 per cent and 28 per cent, respectively).
In general, based on comparing the age of onset of the EPMH disability and the other disability type, it is not possible to say whether in most cases the EPMH disability or the other disability was experienced earlier.8
8 In some additional analysis we checked whether this was still the case if we limited the comparison to (a) cases where the other disability caused ‘a lot’ of difficulty or (b) cases where EPMH disability caused ‘a lot’ of difficulty. In either case, there was very little difference in the results compared to Table 2.6, above.

23
2.5.3 Whether EPMH disability is the main disability Another way to obtain some insight into whether EPMH disability is mainly a corollary of other types of disability is based on the respondent’s perceptions of which disability is the main one. In the course of the National Disability Survey, respondents with more than one disability were asked which they considered their main disability. The results are displayed in Table 2.9 for people with EPMH disability and each of the other types of disability. For instance, of those with both EPMH disability and a seeing disability, in 22 per cent of cases EPMH disability is the main disability; in 15 per cent of cases, a seeing disability is the main one and in 63 per cent of cases, some other disability is the main one. In a high proportion of cases, some other disability (that is, other than the two being directly compared) is identified as the main one.
Taking EPMH disability and each other disability one at a time, EPMH disability is most likely to be considered the main disability by those who have both EPMH disability and remembering & concentrating disability (33 per cent of cases), followed by those who have both EPMH disability and intellectual or learning disability (31 per cent of cases). On the other hand, those who have EPMH disability as well as speech disability, mobility & dexterity disability or seeing disability are much less likely to identify EPMH disability as their main disability (21-22 per cent of cases).
Table 2.9: Whether EPMH disability or another disability is considered the main disability.
A EPMH disability is main disability
B This is main disability
C Another type is the main disability
(ratio A/B)*
Seeing 22% 15% 63% 1.52 Hearing 26% 18% 55% 1.43 Speech 21% 11% 68% 1.98 Mobility & dexterity 21% 34% 46% 0.61 Remembering & concentrating 33% 11% 55% 2.95 Intellectual or learning 31% 38% 32% 0.82 Pain 25% 34% 41% 0.75 Breathing 26% 20% 54% 1.35
Base: People (all ages) with EPMH disability and another disability. Source: National Disability Survey 2006. * The ratio is calculated on the figures before rounding to the nearest whole number.
Of course, these comparisons are affected by the presence of a third disability in many cases. For instance, although the proportion of people identifying EPMH disability as the main one is low among those with both EPMH disability and

24
speech disability (21 per cent), the proportion is of this group who identify speech disability as the main disability is even lower (11 per cent). A useful way to compare EPMH disability with each other disability is in terms of a ‘relative priority ratio’: the ratio of the proportion identifying EPMH disability as the main disability to the proportion identifying seeing disability (and each other specific type) as the main disability. The ratio is shown in the last column of Table 2.9. The higher the ratio, the greater the likelihood the person with both kinds of disability will identify EPMH disability as the main one.
We can see that when people have EPMH disability combined with seeing, hearing, speech, remembering & concentrating and breathing disability, the EPMH disability is more likely than this specific other disability to be considered the main disability, leading to a ratio greater than 1.0. The ratio is highest in the case of remembering & concentrating: those with both EPMH disability and remembering & concentrating disability who identify one of these as their main disability are 2.95 times as likely to identify EPMH disability as their main disability (33 per cent vs. 11 per cent). On the other hand, among those with EPMH disability combined with mobility & dexterity, intellectual or learning or pain disability, this other disability is more likely to be identified as the main one. The gap is largest in this direction in the case of mobility & dexterity disability: those with both EPMH disability and mobility & dexterity disability who identify one of these as their main disability, are only 0.61 times as likely to identify EPMH disability as the main disability (21 per cent vs. 34 per cent for mobility & dexterity disability).
2.6 Living arrangements and marital status
Living arrangements and marital status are likely to be important in terms of access to social support. The support of a partner and other household members may be important in encouraging wider participation in social activities and in employment. Table 2.10 compares the marital status and living arrangements of people with EPMH disability to those with mobility & dexterity disability. The first two columns of numbers show the situation for people with these disabilities in all age groups and whether they live in communal establishments or private households. The second two columns show the situation of adults with these disabilities who are living in private households. Some of the later analyses will focus on adults in private households because certain indicators, such as social support, are only available for this group.
Compared to people with mobility & dexterity disability, people with EPMH disability are less likely to be married (34 per cent vs. 44 per cent) and more likely to be single (46 per cent vs. 27 per cent) and somewhat more likely to be divorced/separated (10 per cent vs. 7 per cent). Because people with mobility & dexterity disability tend to be older, they are more likely to be widowed (22 per

25
cent) than are people with EPMH disability (10 per cent). These differences between the two groups persist if we limit the attention to adults living in private households: people with EPMH disability are less likely to be married and widowed and are more likely to be single or divorced/separated.
Table 2.10: Marital status and living arrangements of people with EPMH disability and mobility & dexterity disability
EPMH disability All
ages, incl. communal
establishments
Mobility & dexterity All
ages, incl. communal
establishments
EPMH disability
Adults living in private
households
Mobility & dexterity
Adults living in private
households
Marital status Married 34% 44% 38% 46% Single 46% 27% 40% 23% Divorced/separated 10% 7% 11% 8% Widowed 10% 22% 12% 24% Household type Communal 11% 11% 0% 0% Live alone 17% 22% 22% 26% Couple 13% 21% 16% 25% Couple and children 34% 27% 35% 28% Lone parent 16% 12% 17% 13% Other household type 9% 7% 11% 8%
Base: People (all ages) with EPMH disability or mobility & dexterity disability. Source: National Disability Survey 2006.
Just over one in ten people with EPMH disability lives in a communal establishment, such as a nursing home or residential care and this proportion is similar to that for people with mobility & dexterity disability. There is little difference by gender in the proportion of people with EPMH disability who live in communal establishments, but the proportion is higher among those in the 18-64 age range than among children or older adults with EPMH disability, and is also higher if the person has another disability in addition to EPMH disability (See Appendix Table A2.1).

26
People with EPMH disability are slightly less likely to live alone (17 per cent vs. 22 per cent of people with mobility & dexterity disability). Reflecting the fact that more of them are single, people with EPMH disability are less likely to live in a couple household (13 per cent vs. 21 per cent). Nevertheless, they are more likely to live in a household consisting of a couple and children (34 per cent vs. 27 per cent). Note, however, that the person with a disability may be one of the children (of any age) or another person living with the couple and children, rather than one of the partners in the couple.9 Nine per cent of people with EPMH disability live in other household types (including multi-family households or living with non-relatives) compared to 7 per cent of people with mobility & dexterity disability. These general patterns are similar for adults with a disability living in private households: compared to those with mobility & dexterity disability, people with EPMH disability are less likely to live alone and less likely to live with a partner and are somewhat more likely to live in a household comprising a couple and children, a lone parent and children or other household types.
Remaining single is strongly associated with the age of onset of the disability. This can be seen in Table 2.11 which shows the percentage who never married for people with a disability living in private households age 45 and over. We exclude those under age 45 in order to control for the differences in average age between people with EPMH disability and those with mobility & dexterity disability.
Table 2.11: Percentage who never married by age of onset of disability for people with a disability living in private households age 45 and over
Age of onset: EPMH disability Mobility & dexterity disability
Before age 18 60% ---
Onset age 18-29 37% 28%
Onset age 30-44 22% 19%
Onset age 45-64 14% 13%
Onset age 65+ 10% 9%
Base: People over age 45 with EPMH disability or mobility & dexterity disability, living in private households. ‘---‘ indicates there are too few cases to report figures. Source: National Disability Survey 2006.
9 In fact, adults with EPMH disability living in private households comprising a couple with children are less likely than those with mobility & dexterity disability to be married (65 per cent of people with EPMH disability in this household type are married vs. 75 per cent of those with mobility & dexterity disability).
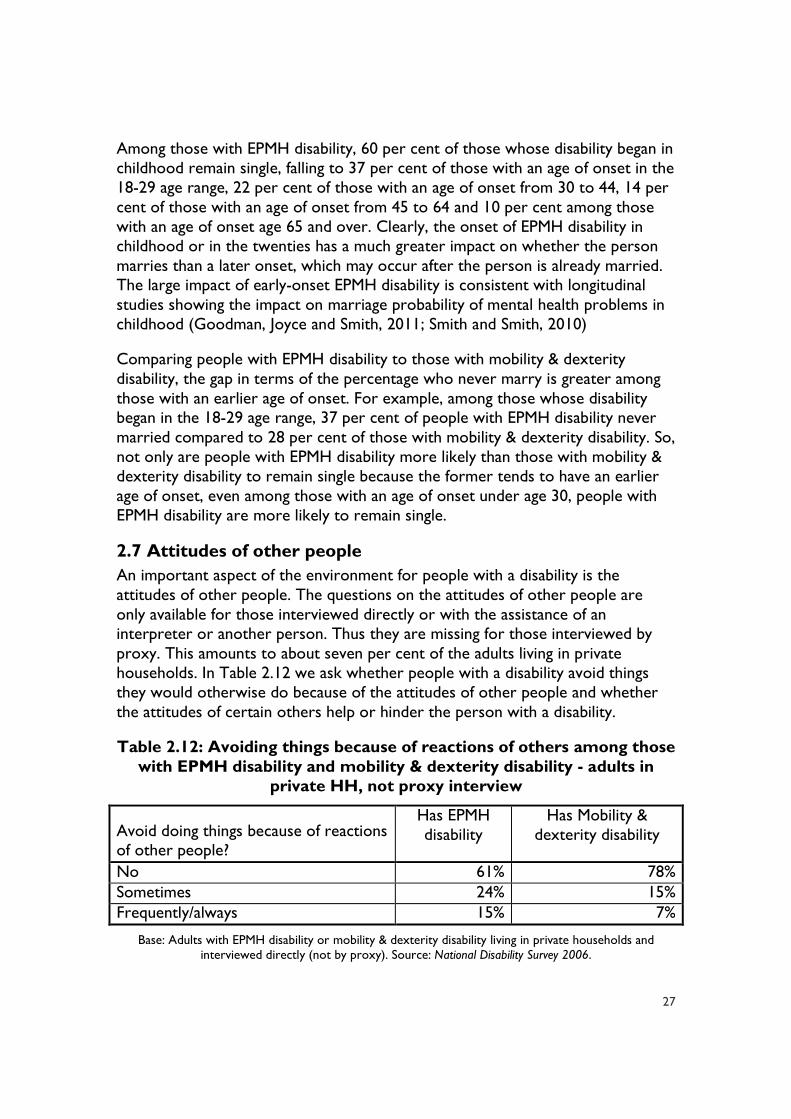
27
Among those with EPMH disability, 60 per cent of those whose disability began in childhood remain single, falling to 37 per cent of those with an age of onset in the 18-29 age range, 22 per cent of those with an age of onset from 30 to 44, 14 per cent of those with an age of onset from 45 to 64 and 10 per cent among those with an age of onset age 65 and over. Clearly, the onset of EPMH disability in childhood or in the twenties has a much greater impact on whether the person marries than a later onset, which may occur after the person is already married. The large impact of early-onset EPMH disability is consistent with longitudinal studies showing the impact on marriage probability of mental health problems in childhood (Goodman, Joyce and Smith, 2011; Smith and Smith, 2010)
Comparing people with EPMH disability to those with mobility & dexterity disability, the gap in terms of the percentage who never marry is greater among those with an earlier age of onset. For example, among those whose disability began in the 18-29 age range, 37 per cent of people with EPMH disability never married compared to 28 per cent of those with mobility & dexterity disability. So, not only are people with EPMH disability more likely than those with mobility & dexterity disability to remain single because the former tends to have an earlier age of onset, even among those with an age of onset under age 30, people with EPMH disability are more likely to remain single.
2.7 Attitudes of other people
An important aspect of the environment for people with a disability is the attitudes of other people. The questions on the attitudes of other people are only available for those interviewed directly or with the assistance of an interpreter or another person. Thus they are missing for those interviewed by proxy. This amounts to about seven per cent of the adults living in private households. In Table 2.12 we ask whether people with a disability avoid things they would otherwise do because of the attitudes of other people and whether the attitudes of certain others help or hinder the person with a disability.
Table 2.12: Avoiding things because of reactions of others among those with EPMH disability and mobility & dexterity disability - adults in
private HH, not proxy interview
Avoid doing things because of reactions of other people?
Has EPMH disability
Has Mobility & dexterity disability
No 61% 78% Sometimes 24% 15% Frequently/always 15% 7%
Base: Adults with EPMH disability or mobility & dexterity disability living in private households and interviewed directly (not by proxy). Source: National Disability Survey 2006.

28
Most people with EPMH disability (61 per cent) do not avoid doing things because of the reactions of other people, but the percentage who avoid doing things sometimes (24 per cent) or frequently/often (15 per cent) is higher than it is for people with mobility & dexterity disability (15 per cent and 7 per cent, respectively).
Table 2.13 shows the responses to the question on whether the person with a disability finds the attitudes of certain other people to be supportive, hindering or to have no impact. Where a specific group of people is not relevant (e.g. because the person has no living family or no employer), the case is excluded from the analysis of that item. People with EPMH disability are most likely to experience supportive attitudes from family (90 per cent) and providers of health and care services (91 per cent).
Table 2.13: Whether attitudes of other people are supportive, hindering or have no impact (where relevant) among those with EPMH
disability and mobility & dexterity disability
Supportive EPMH
No impact EPMH
Hin-der EPMH
Total EPMH
Supportive Mobility & Dexterity
No impact Mobility & Dexterity
Hinder Mobility & Dexterity
Family 90% 6% 4% 100% 96% 3% 1% Friends 81% 16% 3% 100% 87% 12% 1% Acquaintances 58% 35% 7% 100% 71% 27% 2% Employer 56% 25% 19% 100% 66% 23% 11% Private service providers 45% 49% 6% 100% 55% 41% 5% Public service providers 47% 43% 10% 100% 52% 42% 6% Health & care providers 91% 6% 4% 100% 93% 5% 2% Strangers, others 28% 65% 7% 100% 38% 58% 4%
Base: Adults with EPMH disability or mobility & dexterity disability living in private households and interviewed directly (not by proxy). Source: National Disability Survey 2006.
29
Most people with EPMH disability also find friends supportive (81 per cent). In only 3-4 per cent of cases does the person with EPMH disability find the attitudes of these groups to be hindering. However, even for these supportive groups, the percentage of people with mobility & dexterity disability who find them supportive is even higher (96 per cent, 87 per cent and 93 per cent, respectively) while only 1-2 per cent of people with mobility & dexterity disability find their attitudes to be hindering.
For the other categories of people, the percentage of people with EPMH disability who find their attitudes supportive is lower. Fifty eight per cent of people with a disability find acquaintances supportive, and the figures are 56 per cent in the case of employers, 45 per cent for private service providers, 47 per cent for public service providers, and 28 per cent in the case of other people and strangers. Note, however, that the attitudes of most of those who are not seen as supportive are seen as having ‘no impact’ rather than as ‘hindering’. The highest percentage where the attitudes are found to be hindering is reported in the case of employers (19 per cent of cases where the attitudes of employers are relevant to the person), followed by other providers of public services such as those in the area of social welfare, local authority (but not health and care services).
There is an even wider gap between people with mobility & dexterity disability and people with EPMH disability for these groups (acquaintances, employers, public and private service providers and strangers), with the former more likely to find their attitudes supportive and less likely to find their attitudes hindering.
Excluding employers we found that the items formed a reliable scale.10 The scale is constructed as the proportion of groups whose attitudes are found to be supportive. The scale ranges from 0 (none of the relevant groups found to be supportive) to 1 (all of the relevant groups found to be supportive). The average value on the scale represents the proportion of groups found to be supportive. It is 0.69 for people with EPMH disability and 0.76 for people with mobility & dexterity disability. The lower supportiveness score for people with EPMH disability is consistent with the view that people with EPMH disability may experience greater problems with stigma than people with mobility & dexterity disability. This should not be overstated, however, since the large majority of people with EPMH disability find family, friends and providers of health and care services supportive and the highest figure for the proportion reporting the attitudes of other people as hindering is only 20 per cent.
10 The Cronbach’s alpha measure of reliability was .855 if responses that are not applicable are excluded or 0.737 if ‘not applicable’ is treated as ‘not supportive’.

30
Table 2.14 shows the percentage of people with EPMH disability who ever avoid doing things because of the attitudes of other people by age and gender. Among those with EPMH disability, there is no gender difference in being negatively affected by the attitudes of other people, but there are significant differences by age. Just over half of young adults aged 18-34 avoid doing things because of the attitudes of other people, and this declines gradually with age, reaching just over one-third of those aged 55 to 64 and about one quarter of those aged 75 and over. We also checked whether there were differences by the main cause of the EPMH disability or the type of disease or illness (as shown in Tables 2.4 and 2.5), but none of the groups differed significantly from people whose EPMH disability was caused by depression.
Table 2.14 Percentage of people with EPMH disability who ever avoid doing things because of the attitudes of other people.
Ever avoid doing things % Gender Male 39%
Female 39%
Age Group 18-34 51%
35-44 47%
45-54 41%*
55-64 35%*
65-74 21%*
75 and over 24%*
Base: Adults with EPMH disability living in private households and interviewed directly (not by proxy). ‘*’ indicates statistically significant difference between this age group and adults aged 18-34. Source: National
Disability Survey 2006.
2.8 Health and stamina
The health and stamina of people with a disability can have an important bearing on their participation in employment, family and social activities. Respondents were asked whether they would describe their general health and their stamina as very good, good, fair, bad or very bad. Table 2.15 shows that only 35 per cent of people with EPMH disability regard their general health as good or very good and 20 per cent regard it as bad or very bad. Only 29 per cent rate their stamina as very good or good and 28 per cent rate it as bad or very bad. The distribution is very similar to that for people with mobility & dexterity disability. This may seem surprising since the latter tend to be older, as we saw above in Table 2.2 showing the higher prevalence of mobility & dexterity disability among older adults.

31
Table 2.15: General health and stamina of those with EPMH disability and mobility & dexterity disability - adults in private HH, not proxy
interview
EPMH disability
Mobility & dexterity
disability
Health Good or very good 35% 35% Fair 46% 47% Bad or very Bad 20% 18% Stamina Good or very good 29% 28% Fair 43% 44% Bad or very Bad 28% 28%
Base: Adults with EPMH disability or mobility & dexterity disability living in private households and interviewed directly (not by proxy). Source: National Disability Survey 2006.
2.9 Summary
In this chapter we provided an overview of some key characteristics of the population with EPMH disability, based on the 2006 National Fisability Survey. We saw that EPMH disability affected about 111,000 people in 2006, or about one third of the population with a disability, and affects slightly more females than males (59,000 vs. 52,000). While the prevalence of the most common types of disability increases with age, the prevalence of EPMH disability is higher in the middle years than in childhood or old age. In 26 per cent of cases, the age of onset for EPMH disability is between age 30 and 49 and in 44 per cent of cases it is between the ages of 18 and 59. The most common cause of EPMH disability as identified by the respondent a disease or illness (39-40 per cent) and among those identifying a disease or illness, depression (37 per cent males and 46 per cent females) is most often mentioned.
Despite being younger, on average, than people with a mobility & dexterity disability, people with EPMH disability are about as likely to report bad health and problems with stamina. About one fifth of people with EPMH disability report their health as bad or very bad and 28 per cent report their stamina as bad or very bad.
Most of those with EPMH disability have another type of disability as well (87 per cent) and in almost 60 per cent of cases another type of disability is considered to be the main one. The largest overlaps are with mobility & dexterity, remembering & concentrating and pain disability where between 45 and 52 per cent of people with EPMH disability also have these types of disability. Where the person has another disability as well as EPMH disability, the age of onset for both kinds tends to be about the same rather than EPMH disability preceding the
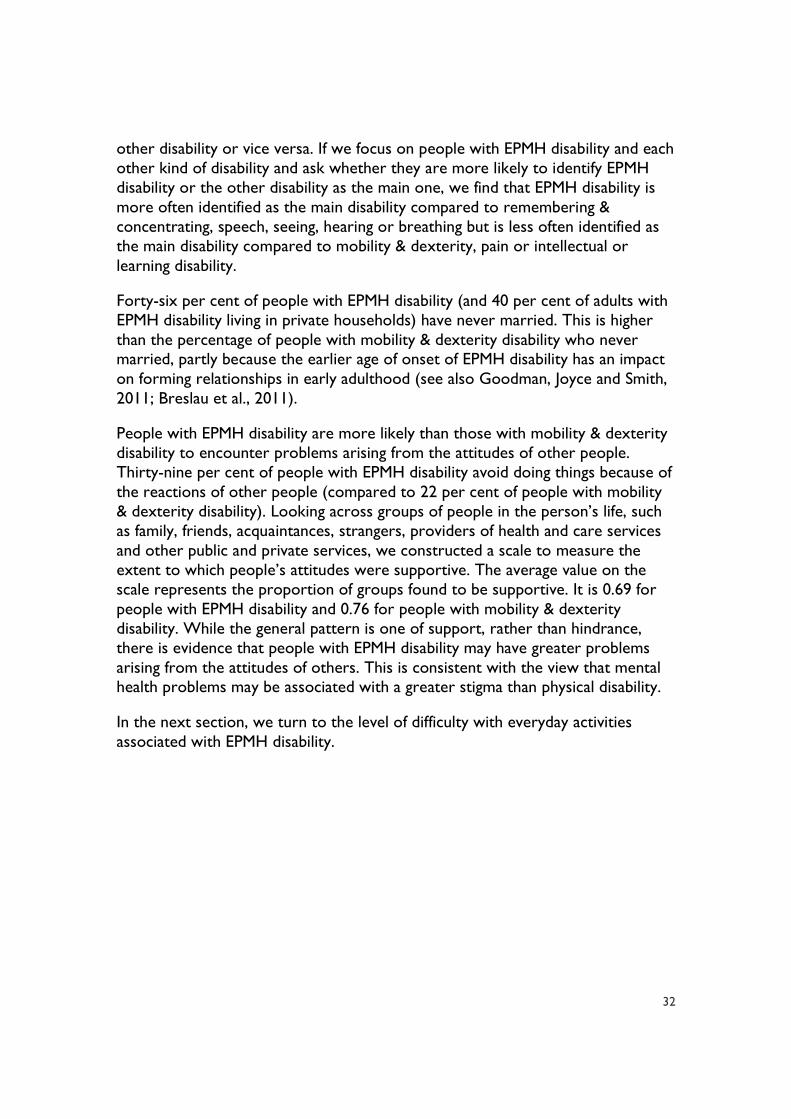
32
other disability or vice versa. If we focus on people with EPMH disability and each other kind of disability and ask whether they are more likely to identify EPMH disability or the other disability as the main one, we find that EPMH disability is more often identified as the main disability compared to remembering & concentrating, speech, seeing, hearing or breathing but is less often identified as the main disability compared to mobility & dexterity, pain or intellectual or learning disability.
Forty-six per cent of people with EPMH disability (and 40 per cent of adults with EPMH disability living in private households) have never married. This is higher than the percentage of people with mobility & dexterity disability who never married, partly because the earlier age of onset of EPMH disability has an impact on forming relationships in early adulthood (see also Goodman, Joyce and Smith, 2011; Breslau et al., 2011).
People with EPMH disability are more likely than those with mobility & dexterity disability to encounter problems arising from the attitudes of other people. Thirty-nine per cent of people with EPMH disability avoid doing things because of the reactions of other people (compared to 22 per cent of people with mobility & dexterity disability). Looking across groups of people in the person’s life, such as family, friends, acquaintances, strangers, providers of health and care services and other public and private services, we constructed a scale to measure the extent to which people’s attitudes were supportive. The average value on the scale represents the proportion of groups found to be supportive. It is 0.69 for people with EPMH disability and 0.76 for people with mobility & dexterity disability. While the general pattern is one of support, rather than hindrance, there is evidence that people with EPMH disability may have greater problems arising from the attitudes of others. This is consistent with the view that mental health problems may be associated with a greater stigma than physical disability.
In the next section, we turn to the level of difficulty with everyday activities associated with EPMH disability.

33
Chapter 3: Level of Difficulty Associated with EPMH disability
3.1 Introduction
In this chapter we examine the extent to which EPMH disabilities lead to difficulties in everyday activities and ask what factors influence the level of difficulty experienced. How important are the type or cause of the mental health difficulty, the age of onset of the disability, characteristics of the person such as gender, age group, availability of social support (marital status, household composition) and attitudes of other people? We begin the chapter by providing an overview of the variation in the level of difficulty associated with EPMH disability before presenting the results of a multivariate model which looks at the impact of a number of factors on the level of difficulty experienced, while holding other factors constant.
3.2 Level of difficulty by age and gender
The level of difficulty reported by individuals with EPMH is based on a question to respondents: “Because of any emotional, psychological or mental health difficulties, do you have difficulty in the amount or kind of everyday activities you can do?” The response categories ranged from ‘just a little’ to ‘cannot do at all’ where there are some everyday activities the person is unable to do because of their disability. As noted in Chapter 1, those reporting even ‘just a little’ difficulty were considered to have an EPMH disability. Table 3.1 shows the level of difficulty as reported by respondents by gender and age. The last column shows the combined categories ‘a lot’ or ‘cannot do at all’.
The table shows that there is a tendency for the level of difficulty to be lower for the youngest and oldest respondents with EPMH disability. Children with EPMH disability are more likely to report ‘just a little’ difficulty (30 per cent) than adults in the 18 to 64 age range (20-21 per cent) but older adults are also quite likely to report ‘just a little’ difficulty (27 per cent).
There is very little difference in the level of difficulty reported by males and females with EPMH disability. About 35-36 per cent of both males and females report that there are some everyday activities with which they have ‘a lot of difficulty’ or which they ‘cannot do at all’ and 22-23 per cent report that they have ‘just a little’ difficulty with everyday activities.
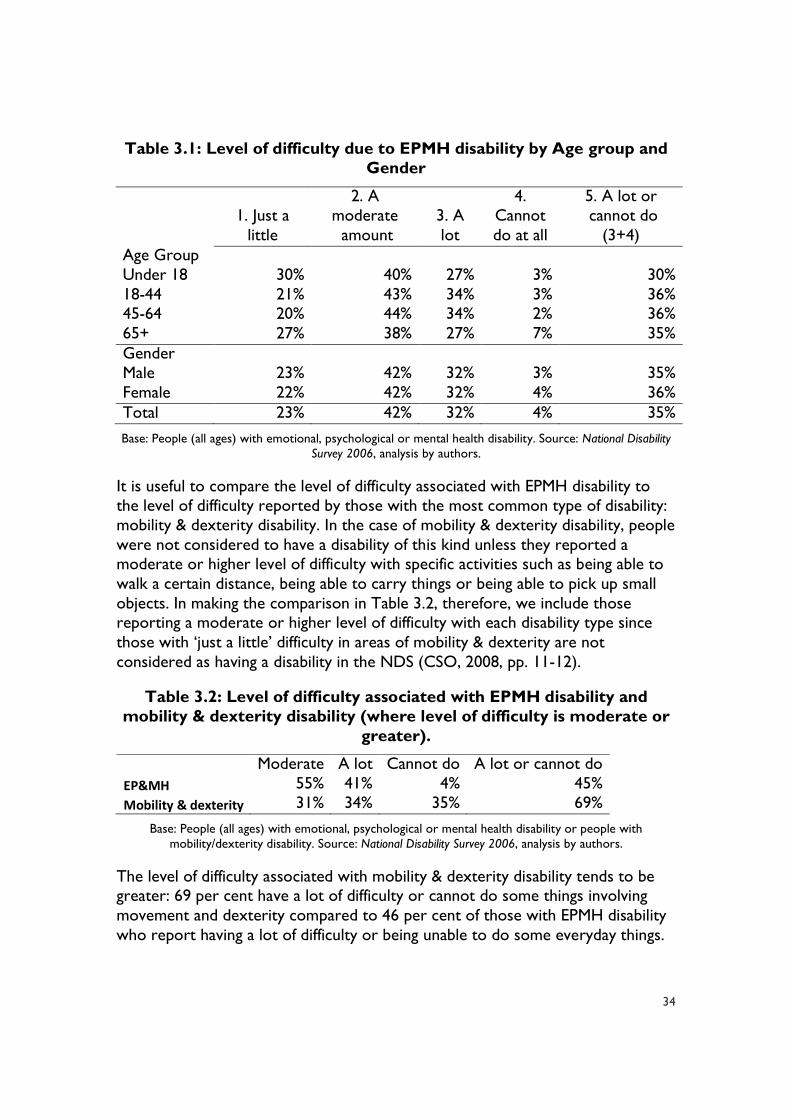
34
Table 3.1: Level of difficulty due to EPMH disability by Age group and Gender
1. Just a little
2. A moderate amount
3. A lot
4. Cannot do at all
5. A lot or cannot do
(3+4) Age Group Under 18 30% 40% 27% 3% 30% 18-44 21% 43% 34% 3% 36% 45-64 20% 44% 34% 2% 36% 65+ 27% 38% 27% 7% 35% Gender Male 23% 42% 32% 3% 35% Female 22% 42% 32% 4% 36% Total 23% 42% 32% 4% 35%
Base: People (all ages) with emotional, psychological or mental health disability. Source: National Disability Survey 2006, analysis by authors.
It is useful to compare the level of difficulty associated with EPMH disability to the level of difficulty reported by those with the most common type of disability: mobility & dexterity disability. In the case of mobility & dexterity disability, people were not considered to have a disability of this kind unless they reported a moderate or higher level of difficulty with specific activities such as being able to walk a certain distance, being able to carry things or being able to pick up small objects. In making the comparison in Table 3.2, therefore, we include those reporting a moderate or higher level of difficulty with each disability type since those with ‘just a little’ difficulty in areas of mobility & dexterity are not considered as having a disability in the NDS (CSO, 2008, pp. 11-12).
Table 3.2: Level of difficulty associated with EPMH disability and mobility & dexterity disability (where level of difficulty is moderate or
greater).
Moderate A lot Cannot do A lot or cannot do EP&MH 55% 41% 4% 45% Mobility & dexterity 31% 34% 35% 69%
Base: People (all ages) with emotional, psychological or mental health disability or people with mobility/dexterity disability. Source: National Disability Survey 2006, analysis by authors.
The level of difficulty associated with mobility & dexterity disability tends to be greater: 69 per cent have a lot of difficulty or cannot do some things involving movement and dexterity compared to 46 per cent of those with EPMH disability who report having a lot of difficulty or being unable to do some everyday things.

35
Table 3.3 examines the level of difficulty in performing self-care activities or performing routine tasks in the home. Here the question wording was the same for all of those with a disability. Regarding the self-care activities, respondents were asked ‘Do you have difficulty ...’ with each of the self-care activities as shown in Table 3.3. The response categories were ‘no difficulty’, ‘some difficulty’, ‘a lot of difficulty’ and ‘cannot do at all’. The item on routine tasks in the home is based on the question ‘Because of your disability, do you have difficulty doing routine tasks inside your home?’ with response categories ‘no difficulty’, ‘some difficulty’ and ‘a lot/cannot do’. Note that having difficulty with ‘self care’ or ‘routine activities’ is different from the level of difficulty with ‘everyday activities’ associated with the EPMH disability. The level of difficulty with ‘everyday activities’ due to the EPMH disability is part of the screening question for this type of disability (see Section 1.6.2). In order to compare people with the two types of disability, we include those reporting a moderate or higher level of difficulty with each disability type as we did in the previous table.
In general, those with mobility & dexterity disability are more likely to have a lot of difficulty with these activities. This is not surprising since most of the activities are of the type where a physical limitation would lead to difficulties. The only exception is staying by oneself, where 31 per cent of people with EPMH disability experience a lot of difficulty or are unable to do it compared to 27 per cent among those with mobility & dexterity disability. The gap between people with the two types of disability is largest for the item ‘taking a bath or shower by himself or herself’ (34 per cent among people with mobility & dexterity disability compared to 24 per cent among people with EPMH disability).

36
Table 3.3: Experiencing a lot of difficulty or being unable to perform certain self-care activities by EPMH disability or mobility & dexterity
disability
Staying by his/ herself
Taking a bath or
shower by his/ herself
Dressing his/her self
Feeding his/ her self
Getting in and out of bed by his/her self
Going to the toilet by
his/her self
Routine Tasks
EPMH disability
No difficulty 52% 61% 70% 83% 77% 81% 46% Some difficulty 17% 15% 15% 9% 11% 8% 31% A lot/cannot do 31% 24% 15% 8% 12% 11% 23%
Total 100% 100% 100% 100% 100% 100% 100% Mobility & dexterity disability
No difficulty 59% 48% 61% 83% 68% 76% 28% Some difficulty 14% 18% 20% 8% 17% 10% 43% A lot/cannot do 27% 34% 19% 9% 15% 14% 29%
Total 100% 100% 100% 100% 100% 100% 100%
Base: People (all ages) with emotional, psychological or mental health disability or people with mobility & dexterity disability, where the disability causes at least a moderate level of difficulty with everyday
activities. Source: National Disability Survey 2006, analysis by authors.
With the exception of staying by oneself, much of the difficulty encountered by people with EPMH disability in these self-care and routine activities appears to be specific to those who also have mobility & dexterity disability. If we focus on people with EPMH disability who do not also have mobility & dexterity disability, we see that 21 per cent have a lot of difficulty staying by themselves, but the percentage with a lot of difficulty with each of the other activities is below 10 per cent, ranging from less than 1 per cent for getting in/out of bed to 7 per cent for taking a bath or shower (Appendix Table A3.1). This suggests that the link to difficulty in staying by oneself is more specific to EPMH disability.
3.3 Level of difficulty by presence of other disabilities
We saw in Chapter 2 that only a minority of those with EPMH disability have this as the only type of disability they experience (13 per cent). Most also have at least one other type of disability and the other type is more likely to be identified as the main disability (59 per cent of cases). Table 3.4 examines how the level of difficulty with everyday activities associated with EPMH disability varies by whether EPMH disability is the only disability, whether EPMH disability is the main disability or whether another disability is the main disability.

37
As we might have expected, since we are focusing on difficulties due to the EPMH disability, the level of difficulty is greatest among those with more than one type of disability who identify EPMH disability as the main type. Among this group, 52 per cent experience a lot of difficulty due to their EPMH disability, compared to 24 per cent for people with EPMH disability only and 30 per cent for those who identify another disability as the main one.
Table 3.4: Level of difficulty in everyday life associated with EPMH disability by whether EPMH disability is the main/only disability
Level of difficulty in everyday life ...
Has EPMH disability only
Has EPMH disability &
other disability; EPMH disability
is main
Has EPMH disability &
other disability; other disability
is main Cannot do/a lot of difficulty 24% 52% 30%
% of all persons with EPMH disability 13% 28% 59%
Base: People (all ages) with EPMH disability. Source: National Disability Survey 2006, analysis by authors.
Table 3.5 focuses on those with EPMH disability and at least one other type of disability. It shows the level of difficulty associated with the EPMH disability by the level of difficulty associated with the other disability. If the person has more than one other type of disability, in addition to EPMH disability, we take the highest level of difficulty across these other types of disability.
Of those with ‘just a little’ difficulty arising from emotional, psychological and mental health issues, over half (57 per cent) have a lot of difficulty or cannot do some things at all due to another disability and over one quarter have a moderate level of difficulty (26 per cent). In fact, only 4 per cent of those with an EPMH disability who also have another disability do not have at least a moderate level of difficulty arising from another disability. Since a ‘moderate’ level of difficulty is the threshold for being considered as having a disability for most types of disability, this indicates that taking a lower threshold (‘just a little difficulty’) in the case of EPMH disability had very little impact on the number of cases included in the National Disability Survey as having a disability.

38
Table 3.5: Level of difficulty with EPMH disability by highest level of difficulty across disability types (where more than one type of
disability).
Overall Difficulty
EPMH disability Difficulty Just a
little
EPMH disability Difficulty Moderate
EPMH disability Difficulty A lot/can’t do All
Just a little 16% - - 4% Moderate 26% 42% - 24% Lot/cannot do 57% 58% 100% 73%
Base: People (all ages) with EPMH disability and at least one other disability. Source: National Disability Survey 2006, analysis by authors.
3.4 Level of difficulty by age of onset and type of EPMH disability
Table 3.6 shows the level of difficulty associated with EPMH disability by the age of onset of the EPMH disability. The differences by age of onset are modest in size. There is a tendency for the level of difficulty to be somewhat greater among those whose EPMH disability began in early adulthood. Among those whose disability began between the ages of 18 and 44, 38 per cent experience a lot of difficulty or cannot do certain everyday activities, compared to 34 per cent among those whose EPMH disability was present from childhood and 31-32 per cent among those whose disability began in later adulthood. This might be because certain mental health difficulties are more likely to be first experienced in early adulthood. This is an issue to which we shall return later in the chapter when we examine the results of a multivariate model for level of difficulty which includes available information on the nature of the EPMH disability.
Table 3.6: Level of difficulty with everyday activities associated with EPMH disability by age of onset
Level of difficulty Under 18 18-44 45-64 65+
Just a little 21% 18% 25% 29% Moderate amount 44% 44% 44% 38% A lot/cannot do 34% 38% 31% 32% Total 100% 100% 100% 100%
Base: People (all ages) with EPMH disability. Source: National Disability Survey 2006, analysis by authors.
We saw in Chapter 2 that 40 per cent of men and 39 per cent of women with EPMH disability report the main cause of the disability as a disease or illness. These respondents were asked to identify the disease or illness causing their disability. Table 3.7 shows the percentage of people who have a lot of difficulty or cannot do certain things as a result of their EPMH disability by the disease or

39
illness identified. Note that this is limited to those who identified a disease or illness as the main cause.
From Table 3.7 we can see that the level of difficulty tends to be greater among those who attribute the EPMH disability to schizophrenia (57 per cent a lot/cannot do) or bi-polar disorder (54 per cent a lot/cannot do) than those attributing the EPMH disability to depression (33 per cent a lot/cannot do), anxiety disorder (36 per cent a lot/cannot do) or other disease or illness (38 per cent a lot/cannot do).
Table 3.7: Level of difficulty by type of EPMH
% A lot / cannot do Anxiety disorder, incl. phobia, neurosis 36% Depression 33% Bi-polar disorder 54% Schizophrenia 57% Other 38%
Base: People (all ages) with emotional, psychological or mental health disability caused by a disease/illness. Source: National Disability Survey 2006, analysis by authors. Note: too few cases reporting ‘addiction to
alcohol or drugs’ to show separately.
3.5 Factors affecting level of difficulty
So far in this chapter we have looked at how the level of difficulty experienced by people with EPMH disability varies by the characteristics of the respondent, taken one at a time. We have not controlled for other characteristics or for aspects of the environment, however. For instance, we have not controlled for differences in the extent to which they also had other disabilities.
To examine this issue, we analysed the level of difficulty experienced by people with EPMH disability using a statistical model that controls for several characteristics simultaneously. This allows us to ask whether, for instance, those whose EPMH disability takes the form of schizophrenia or bi-polar disorder still tend to experience a higher level of difficulty than those with depression when we control for gender, age of onset, presence of other disabilities, availability of social support and so on. Since we are interested in including the measures of social support – which are only available for adults living in private households who were interviewed in person – the analysis is limited to this group. Thus, the analysis excludes children, people with a disability living in communal establishments and those interviewed by proxy.

40
The model examines the odds of experiencing a lot of difficulty or being unable to perform some everyday activities.11 The results are summarised in Table 3.8 and the full model is shown in Appendix Table A3.2. Table 3.8 shows only the factors which had a statistically significant impact on level of difficulty, with other characteristics controlled. The model controls for gender, age group, age of onset, presence of other disabilities, cause of disability/nature of underlying illness, marital status, household type, social support, avoiding things because of the attitudes of other people, general health and stamina.
The odds ratios shown in Table 3.8 show how much more (or less) likely the named group is to have a lot of difficulty due to EPMH disability than the reference group. An odds ratio greater than one indicates that a group has higher odds than the reference group of having a lot of difficulty. An odds ratio less than one indicates that a group has lower odds than the reference group of having a lot of difficulty. For instance, the odds ratio of 1.91 for those whose EPMH disability began when they were age 18-29 indicates that this group is more likely than those whose disability began when they were over age 65 (the reference group) to experience a lot of difficulty rising from the disability.
The results indicate that those with an age of onset in early adulthood (before age 44) are more likely to experience a lot of difficulty than those with an age of onset after age 65. The level of difficulty associated with EPMH disability tends to be greater among those who also have other kinds of disability and among those whose general health is bad rather than good. The level of difficulty is greater among those who identify the cause of their disability as bi-polar disorder than those identifying the cause as depression.
11 The level of difficulty is based on a question to respondents: “Because of any emotional, psychological or mental health difficulties, do you have difficulty in the amount or kind of everyday activities you can do?”
41
Table 3.8: Odds of experiencing a lot of difficulty due to EPMH disability – significant odds ratios.
Lot of Difficulty Age of onset 18-29 vs. 65+ 1.91 Age of onset 30-44 vs. 65+ 1.85 Other disabilities Seeing 1.33 Other disabilities Speech 1.62 Other disabilities Remembering & concentrating 2.18 Other disabilities Intellectual or learning 1.61 Cause No specific cause vs. illness 0.47 Cause Bipolar vs. depression 2.26 Cause Other vs. depression 0.57 Avoid things Frequently vs. no 1.89 Supportiveness scale (0-1) 0.60 Health Bad vs. Good 2.12
Source: National Disability Survey, 2006, analysis by authors. Base: adults with EPMH disability living in private households and interviewed in person (N=3,204).
The results point to the importance of the attitudes of other people. Those who report that they frequently avoid doing things because of the attitudes of other people are more likely to report experiencing a lot of difficulty, with odds that are nearly 90 per cent higher. The level of difficulty experienced falls as the level of social support increases: those with the maximum score on the social support scale have odds of having a lot of difficulty that are only 60 per cent as high as those with the lowest possible score on the social support scale.
It is worth noting that with the above characteristics taken into account, there are no remaining differences in the odds of experiencing a lot of difficulty by gender, age group, marital status, household type or level of stamina.
3.6 Summary
This chapter focused on the level of difficulty with everyday activities as a result of EPMH disability. The NDS has a major advantage for this purpose in that people with EPMH disability complete the full questionnaire even if they have ‘just a little’ difficulty associated with their condition. This contrasts with most of the other types of disability where the person had to experience at least a moderate level of difficulty before completing the full set of items. This means that the survey covers a broader range of difficulties in the case of EPMH disability, so that we can fruitfully examine the factors associated with differences in the level of difficulty people experience.

42
Overall, 23 per cent of those with EPMH disability experienced ‘just a little’ difficulty with respect to the amount or kind of everyday activities they could do; 42 per cent experienced a moderate amount of difficulty; 32 per cent experienced a lot of difficulty and 4 per cent had some everyday activities they could not do at all.
We found little variation in the percentages experiencing a lot of difficulty by gender and age.
We reported the results of an analysis that used a statistical model to isolate the factors associated with having a high level of difficulty with everyday activities associated with EPMH disability. The analysis was conducted for adults with EPMH disability living in private households and interviewed directly, since this was the group for whom all of the factors of interest were measured. The findings showed that a high level of difficulty was associated with bipolar disorder than depression; with bad health; with the presence of other disabilities (especially remembering & concentrating) and with an age of onset in early adulthood rather than after age 65. Social support and an absence of stigma were also very important. The odds of having a lot of difficulty (relative to none) due to EPMH disability were only 60 per cent as high for those with a high level of social support. On the other hand, the odds of having a lot of difficulty were nearly 90 per cent higher for those who frequently avoided doing things they were able to do because of the attitudes of other people.
43
Chapter 4: Social Participation
4.1 Introduction
In this chapter we examine the social participation of people with an emotional, psychological or mental health disability. Our focus is on adults with EPMH disability living in private households who were interviewed in person (i.e. not by proxy), since this is the group for which we have the most complete data. We examine whether they took part in social activities in the past four weeks; with whom they typically socialise and difficulties experienced in social participation. We present the results of a statistical model that examines the risk of not having participated in any social activities at all in the past four weeks. We are particularly interested in the importance of social support in this context: we would expect that social support would be a crucial factor in enabling people with EPMH disability to participate in social activities.
4.2 Type of social participation in the last four weeks
Table 4.1 examines the types of social activity in which people with EPMH disability participated during the previous four weeks. For comparison, we also show the figures for people with mobility & dexterity disability. Recall that people are considered to have an EPMH disability if they experience at least ‘just a little’ difficulty in everyday activities due the their disability, while those reporting mobility & dexterity problems experience at least a moderate level of difficulty. To make the comparison according to type of disability clearer, we also show the pattern for people with EPMH disability who have at least a moderate level of difficulty with everyday activities (that is, excluding those with ‘just a little’ difficulty). In fact, as we can see by comparing the first and second columns of figures, the differences in social participation are small between all of those with EPMH disability and the subgroup experiencing a moderate or greater level of difficulty with everyday activities.
Among those with EPMH disability, just over half went to a social venue in the previous four weeks; nearly two thirds visited family or friends at their homes; almost three quarters had a visit from family or friends at home and more than eight in ten contacted family or friends by phone, text or email. If we consider the face-to-face forms of social participation (going to a social venue, visiting), 12 per cent of those with EPMH disability did not participate in these face-to-face forms of social participation in the previous four weeks.
The figures show that the differences between those with EPMH disability and those with mobility & dexterity disability are small for most of the items, but that those with mobility & dexterity disability are more likely to be visited at home by family or friends (81 per cent vs. 73 per cent). As a result, the percentage of

44
people with EPMH disability who did not participate in any face-to-face social activity in the previous four weeks is a little higher (12 per cent) than the figure for people with mobility & dexterity disability (9 per cent).
Table 4.1: Social participation in the last four weeks among people with EPMH disability and mobility & dexterity disability
Type of participation
EPMH disability (any level
of difficulty)
EPMH disability, at
least moderate level of difficulty
Mobility &
dexterity Went to social venue with family/friends 51% 50% 49% Visited family/friends at their homes 66% 64% 65% Family/friends visited you at home 73% 71% 81% Phoned, texted or emailed family/friends 82% 82% 83%
No face-to-face social participation 12% 13% 9%
Source: NDS, 2006, analysis by authors. Base: adults with EPMH disability or mobility & dexterity disability living in private households and interviewed in person (N=3,236 people with EPMH disability, 2,520 people with EPMH
disability of moderate or higher level of difficulty, and 5,326 with mobility & dexterity disability).
Table 4.2 shows whether people with EPMH disability do most of their socialising with family, work colleagues, friends with a disability, other friends or carer/disability service provider. The items are not mutually exclusive – that is, someone might choose more than one category of ‘other person – so the total sums to more than 100 per cent. Most people with EPMH disability socialise with family (82 per cent), friends without a disability (62 per cent) and smaller numbers socialise with friends with a disability (15 per cent), carers/service providers (10 per cent) or work colleagues (8 per cent). The pattern is quite similar to that for people with mobility & dexterity disability, except that the latter group is somewhat less likely to socialise with friends with a disability (10 per cent vs. 15 per cent).

45
Table 4.2: With whom does the person socialise by type of disability
With whom the person mainly socialises EPMH disability Mobility & dexterity
Family 82% 88% Work colleagues 8% 7% Friends with a disability 15% 10% Other friends 62% 66% Carers or disability service providers. 10% 9%
Source: NDS, 2006, analysis by authors. Base: adults with EPMH disability or mobility & dexterity disability living in private households and interviewed in person (N=3,236 people with EPMH disability and 5,326 with mobility &
dexterity disability).
4.3 Difficulties in social participation
When we think of difficulties related to social participation, often what comes to mind are the physical barriers that make it difficult to get around or gain access to venues (including homes) where people socialise. Since, as we saw in Chapter 2, about half of those with EPMH disability also experience mobility & dexterity disability, these factors are likely to be relevant to them. There may also be other factors that act as barriers to social participation specifically for people with EPMH disability. We begin by examining the level of difficulty experienced by people with EPMH disability with different forms of social participation, as shown in Table 4.3.
Table 4.3: Level of difficulty with different forms of social participation for adults with EPMH disability living in private households
No
difficulty Some
difficulty A lot/
cannot do Going away for a holiday/break 38% 31% 31% Having friends/family for a visit 67% 24% 8% Visiting friends/relatives 59% 29% 12% Socialising in a public venue 43% 29% 28% Attending religious ceremonies 61% 23% 16% Voting 70% 19% 11% Taking part in community life 38% 24% 38%
Source: National Disability Survey, 2006, analysis by authors. Base: adults with EPMH disability living in private households and interviewed in person (N=3,236).
The activities in which people with EPMH disability are least likely to experience difficulty are voting (70 per cent ‘no difficulty’), having visitors at home (67 per cent), attending religious ceremonies (61 per cent) and visiting friends or relatives (59 per cent). The activities in which people with EPMH disability are most likely to experience ‘a lot’ of difficulty or which they are unable to do include taking
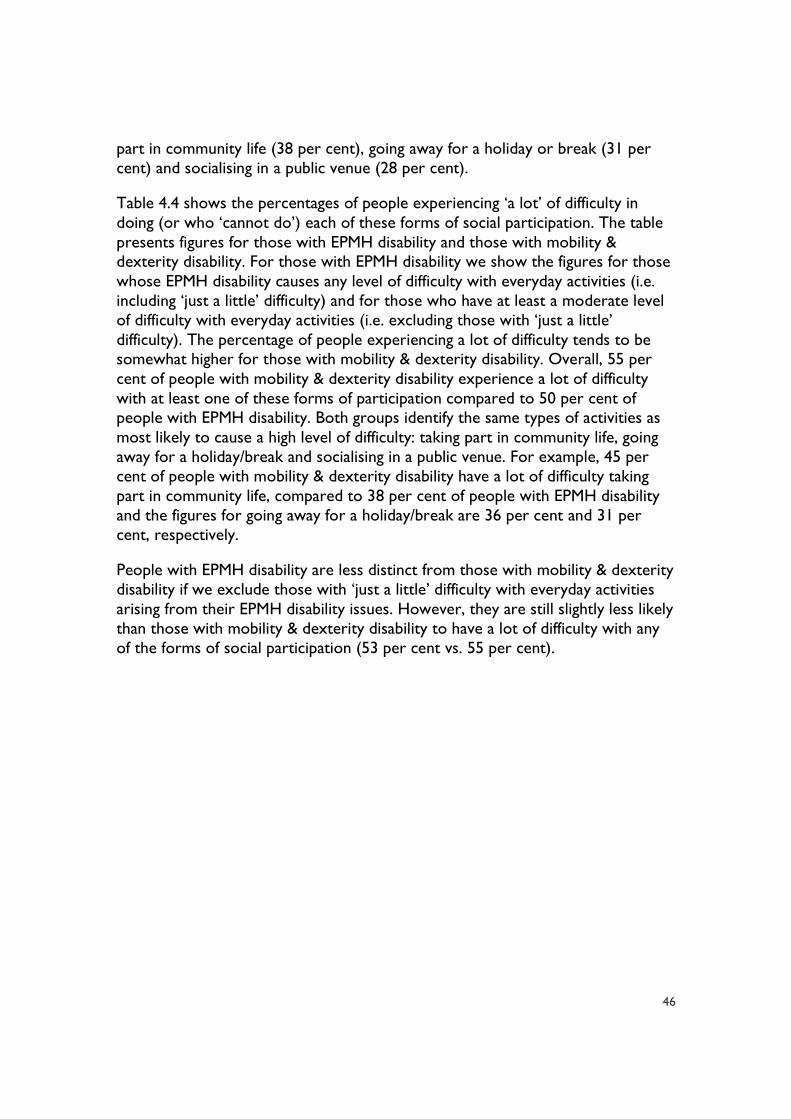
46
part in community life (38 per cent), going away for a holiday or break (31 per cent) and socialising in a public venue (28 per cent).
Table 4.4 shows the percentages of people experiencing ‘a lot’ of difficulty in doing (or who ‘cannot do’) each of these forms of social participation. The table presents figures for those with EPMH disability and those with mobility & dexterity disability. For those with EPMH disability we show the figures for those whose EPMH disability causes any level of difficulty with everyday activities (i.e. including ‘just a little’ difficulty) and for those who have at least a moderate level of difficulty with everyday activities (i.e. excluding those with ‘just a little’ difficulty). The percentage of people experiencing a lot of difficulty tends to be somewhat higher for those with mobility & dexterity disability. Overall, 55 per cent of people with mobility & dexterity disability experience a lot of difficulty with at least one of these forms of participation compared to 50 per cent of people with EPMH disability. Both groups identify the same types of activities as most likely to cause a high level of difficulty: taking part in community life, going away for a holiday/break and socialising in a public venue. For example, 45 per cent of people with mobility & dexterity disability have a lot of difficulty taking part in community life, compared to 38 per cent of people with EPMH disability and the figures for going away for a holiday/break are 36 per cent and 31 per cent, respectively.
People with EPMH disability are less distinct from those with mobility & dexterity disability if we exclude those with ‘just a little’ difficulty with everyday activities arising from their EPMH disability issues. However, they are still slightly less likely than those with mobility & dexterity disability to have a lot of difficulty with any of the forms of social participation (53 per cent vs. 55 per cent).
47
Table 4.4: Having a lot of difficulty or being unable to participate in certain social and civic activities by type of disability
Type of Participation
EPMH disability (any
level of difficulty with everyday activities)
EPMH disability, at least
moderate level of difficulty with
everyday activities
Mobility & dexterity
Going away for a holiday/break 31% 33% 36% Having friends/family for a visit 8% 10% 7% Visiting friends/relatives 12% 14% 14% Socialising in a public venue 28% 30% 31% Attending religious ceremonies 16% 17% 18% Voting 11% 13% 14% Taking part in community life 38% 40% 45% Any of the above 50% 53% 55%
Source: National Disability Survey, 2006, analysis by authors. Base: adults with EPMH disability or mobility & dexterity disability living in private households and interviewed in person (N=3,236 people with EPMH
disability and 5,326 with mobility & dexterity disability).
We might expect the reasons for the difficulty to be different between those with EPMH disability and those with mobility & dexterity disability. Table 4.5 shows the reasons given, by those experiencing at least some level of difficulty in participating in the activities listed in Table 4.4.12 Health considerations or physical inability is cited by the largest group (85 per cent of those with EPMH disability), followed at some distance by those reporting that they need assistance (45 per cent) or that they are self-conscious of their disability (44 per cent).
Compared to people with mobility & dexterity disability, those with EPMH disability are somewhat less likely to cite health considerations/physical limitations (85 per cent vs. 94 per cent) or needing assistance (45 per cent vs. 57 per cent). People with EMPH are a good deal more likely to cite self-consciousness about their disability as a barrier (44 per cent vs. 25 per cent) and unfriendly/negative attitudes (16 per cent vs. 6 per cent). This is consistent with the finding that there is still a degree of stigma associated with mental illness (Barry et al., 2009).
12 Of those with EPMH disability, 77% experience at least some level of difficulty while the figure for those with mobility & dexterity disability is 82%.

48
Table 4.5: Reason for difficulty with social participation by type of disability
EPMH disability Mobil. & dexterity
Health consideration/physical inability 85% 94% Self-conscious of disability 44% 25% Need specialised equipment 9% 13% Need assistance 45% 57% Facilities not accessible 10% 13% Transport services inadequate 16% 20% Lack of suitable activities 20% 19% Unfriendly/negative attitudes 16% 6% Expense 29% 22% Other reasons 13% 8% No reason given 4% 3%
Source: National Disability Survey, 2006, analysis by authors. Base: adults with EPMH disability or mobility & dexterity disability living in private households, interviewed in person who have some difficulty with
social participation (N= 2,471 people with EPMH disability and 4,341with mobility & dexterity disability).
4.4 Impact of environment and personal characteristics on social participation
So far in this chapter we have looked at the social participation of people with EPMH disability in general terms. We have not controlled for other characteristics or for aspects of the environment, however. For instance, in examining the participation of people with EPMH disability in social activities, we have not controlled for the presence of other disabilities or for their general health status.
To examine this issue, we analysed the risk of not participating in any face-to-face social activities at all in the previous month using a statistical model that controls for several characteristics simultaneously. As with the statistical model in the previous chapter, we are interested in including the measures of social support. Since the social support indicators are only available for adults living in private households who were interviewed in person, the analysis is limited to this group. Thus, the analysis excludes children, people with a disability living in communal establishments and those interviewed by proxy.
The model examines the odds of not having participated in any social activities at all in the previous four weeks. We saw in Table 4.2 above that this is true of 11 per cent of people with EPMH disability. The results of the model are summarised in Table 4.6 and the full model is shown in Appendix Table A4.1. Table 4.6 shows only the factors which had a statistically significant impact on non-participation, with other characteristics controlled. The model controls for

49
gender, age group, age of onset, presence of other disabilities, cause of disability/nature of underlying illness, marital status, household type, social support, avoiding things because of the attitudes of other people, general health and stamina. The odds ratios shown in Table 4.6 show how much more (or less) likely the named group is to have not participated in any social activity. A ratio greater than one indicates that a group has higher odds of non-participation than the reference group. A ratio less than one indicates that a group has lower odds of non-participation than the reference group. For instance, the odds ratio of 0.48 for those whose EPMH disability began when they were age 18-29 indicates that this group is less likely than those whose disability began when they were over age 65 (the reference group) to not have participated in any social activity.
Table 4.6: Factors associated with not participating in any social activities in last month among people with EPMH disability (significant
odds ratios)
Odds
Age of onset 18-29 vs. 65+ 0.48 Age of onset 45-64 vs. 65+ 0.50 Other disabilities Hearing 0.52 Other disabilities Pain 0.59 Type disease Anxiety disorder vs. depression 1.70 Other household type 2.05 Support. attitudes Scale (0-1) 0.38 General Health Bad vs. Good 2.86
Source: National Disability Survey, 2006, analysis by authors. Base: adults with EPMH disability living in private households and interviewed in person (N=3,204).
We see from Table 4.6 that age of onset, presence of other disabilities, anxiety disorder, household type, social support and general health are all associated with non-participation in social activities. Those with an age of onset in early- to mid-adulthood (age 18-64) are only about half as likely as those with an onset in old age to not participate in social activities. Since current age is controlled in the model – and is not statistically significant when age of onset is included – the important issue has to do with age of onset rather than age per se. We can only speculate here as to what the reason might be. One possibility is that those who acquire a disability later in life may have more difficulty in building up a social network and pattern of social activities that meets their needs compared to those who acquire a disability earlier when social networks and patterns of participation are still being formed.
The presence of certain other disabilities in addition to EPMH disability means that the person is less likely to be a non-participant in social activities. These are hearing disability and pain disability. The reason for these patterns is not entirely

50
clear. We might expect that a hearing disability would make social participation with hearing family and friends more challenging. However, the proportion of people with EPMH disability who also have a hearing disability is small (only 13 per cent of those with EPMH disability) and this group may not be representative of all adults with a hearing disability. The overlap with pain disability is more substantial: 45 per cent of those with EPMH disability also have a pain disability. The association between non-participation and pain becomes statistically significant only when we control for health and level of stamina. This suggests that the group who have EPMH disability and a pain disability that is unrelated to poor health is in a better position with regard to social participation. Some additional analysis (not shown in table) suggested that this group is more likely to have pain that is occasionally present rather than pain that is constant, and pain of this nature has a weaker association with non-participation in social activities.13
In terms of the form of the EPMH disability, as reported by the respondent, only those reporting that the disability takes the form of an anxiety disorder differ significantly from those reporting that their EPMH disability is takes the form of depression. The odds of non-participation are 70 per cent higher for people linking their EPMH disability to an anxiety disorder.
There was surprisingly little association between non-participation and the characteristics of the respondent (gender, age, and marital status) or their household. We might have expected, for instance, that those who had lost a partner through widowhood or separation might have reduced social participation, but this was not borne out by the data, when we control for social support. Neither is it the case that people who live alone have reduced social participation. Those who live in ‘other’ household types have higher odds of non-participation than those living in a household consisting of a couple and children. This household type includes people living with relatives other than a partner or children: they may be living with grandparents, brother or sister and so on. About eleven per cent of people with EPMH disability live in this household type. This group is twice as likely to not have participated in any social activities in the past four weeks. Since it is very unlikely that the household type would have a direct impact on social participation, it is most likely influenced by some unmeasured aspect of the person’s EPMH disability or aspect of their social environment associated with living with relatives in a non-family household.
13 Among those with EPMH disability and pain disability, those reporting their health as good are more likely than those reporting their health as fair/bad to have pain that is occasionally present (21 per cent vs.13 per cent).

51
4.5 Summary
This chapter focused on social participation of adults with EPMH disability. Most (88 per cent) of this group participated in some social activity in the previous four weeks, including going with family or friends to a social venue (51 per cent), visiting the homes of family or friends (66 per cent), being visited at home (73 per cent) or contacting family or friends by telephone, text or email (82 per cent). Most socialising was done with family members (82 per cent), followed by friends who do not have a disability (62 per cent). In these respects, the patterns for people with EPMH are quite similar to those for people with mobility & dexterity disability, except that the latter are more likely to be visited at home.
For many types of social participation, most people with EPMH disability experience no difficulty in participating – including having friends or family for a visit (67 per cent), visiting friends or relatives (59 per cent), attending religious ceremonies (61 per cent) or voting (70 per cent). A greater level of difficulty is experienced with respect to going away for a holiday or break (31 per cent experience a lot of difficulty or cannot do this), socialising in a public venue (28 per cent ‘a lot’/’cannot do’) and taking part in community life (38 per cent ‘a lot’/’cannot do’). The activities which are difficult are the same as those identified by people with a mobility & dexterity disability, but the latter group is slightly more likely to experience ‘a lot’ of difficulty or to be unable to participate in certain activities. The differences are not as large as we might have expected, however, given the familiar problems with access faced by many people with mobilit y & dexterity disability. For instance, there is only a small difference between those with mobility & dexterity and those with EPMH disability in percentage of people experiencing a lot of difficulty in going away for a holiday/break (36 per cent and to 31 per cent, respectively).
Given that people with EPMH disability may also have a mobility & dexterity disability, perhaps this is not surprising. Indeed, when we look at the reasons for the difficulty, most people with EPMH disability cite health considerations / physical inability (85 per cent). There are some reasons which are more common among people with EPMH disability, however, reflecting the stigma that is still associated with this type of disability. These include being self-conscious of the disability (44 per cent vs. 25 per cent for people with mobility & dexterity disability) and unfriendly/negative attitudes (16 per cent compared to 6 per cent for people with a mobility & dexterity disability).
A statistical analysis identified the factors most strongly associated with non-participation in social activities among people with EPMH disability. The importance of social support was very evident in the results. The odds of not participating in social activities were only 38 per cent as high for those with high levels of social support as for those without social support. There was no direct

52
effect of negative attitudes of other people on social participation with other characteristics controlled. Other factors that were important to social participation were good health and younger age. The odds of not participating were only about half as high for those under 65 compared to those over age 65, while the odds were well over twice as high for those with bad health. The presence of anxiety disorder was also associated with a reduced likelihood of participating in social activities.
53
Chapter 5: Labour Market Outcomes for People with EPMH disability
In this chapter we consider labour market outcomes for people with EPMH disability. The analysis focuses on working-age adults with EPHM disability who are living in private households and who were interviewed in person. Since educational attainment is so important to labour market opportunities, we begin by considering whether the person was affected by the disability when they were at school and go on to consider their level of educational attainment. We then examine their main economic status at the time of interview and whether they live in a jobless household – a household where none of the adults age 18-59 are in employment (either employee or self-employed). Living in a jobless household is associated with high levels of disadvantage in the working-age population (Watson, Maître and Whelan, 2012). At the end of the chapter, we report the results of a model designed to identify the most important factors influencing the labour market situation of people with EPMH disability.
5.1 Educational experience and attainment
Table 5.1 shows several indicators of the experiences related to education for men and women with EPMH disability. About 29 per cent were affected by their disability while still in education, 19 per cent experienced absences from school or college as a result and 18 per cent stopped sooner than they would have liked. There are no significant gender differences between people with EPMH disability in these respects.
Turning to the highest level of education completed, we see that just over one third of working-age people with EPMH disability have no educational qualifications, about 30 per cent have completed lower second level or vocational education and ten per cent have degree or higher level qualifications. Women (29 per cent) are slightly more likely than men (24 per cent) with EPMH disability to have attained the level of education that includes higher second level (e.g. Leaving Certificate) to lower third level (e.g. Diploma). Otherwise, the differences in educational attainment between men and women with EPMH disability are not statistically significant.

54
Table 5.1: Education of people with EPMH disability disability
Males Females Effect of EPMH Affected while in education 30% 28% Effect of EPMH Education absences 20% 18% Effect of EPMH Stopped sooner than desired 19% 17% Highest education level No qualifications 35% 33% Highest education level Lower 2nd/vocational 31% 28% Highest education level Higher 2nd to diploma* 24% 29% Highest education level Degree or higher 10% 10%
BASE: people with EPMH disability in private households interviewed directly, age 18-64. Note ‘*’ indicates the gender difference is statistically significant.
Table 5.2 compares the educational experiences and attainment of people with EPMH disability to those with mobility & dexterity disability. We limit the focus to people age 18 to 44 to control for the tendency of people with mobility & dexterity disability to be older, since older people tend to have completed lower levels of education than younger adults.
Table 5.2: Education of people with EPMH disability compared to people with mobility & dexterity disability (aged 18 to 44).
EPMH disability Mobility & dexterity
Affected by disability while in education 41% 30% Highest level completed
No qualifications 22% 17% Lower 2nd level or Technical/vocational 32% 38% Higher 2nd level to non-Degree 35% 33% 3rd Level 11% 12%
BASE: people with EPMH disability or mobility & dexterity disability in private households interviewed directly, aged 18-44.
As we might expect, given the later age of onset of mobility & dexterity disability, people with EPMH disability were more likely to have been affected by the disability when still in education (41 per cent vs. 30 per cent). The differences in educational attainment are small, but a higher proportion of adults aged 18 to 44 with EPMH disability have no qualifications (22 per cent vs. 17 per cent). When

55
we focus on the percentage who have completed second level or higher, the figure is very close for both groups (45-46 per cent).14
Table 5.3 shows the main reason for stopping education among those adults with EPMH disability who stopped sooner than they would have liked. Of those with EPMH disability who were affected by it while at school, 62 per cent stopped sooner than they would have liked. Of this group, the most often cited reasons are poor health (62 per cent) or finding learning difficult /having difficulty keeping up (61 per cent).
Table 5.3: Reason for stopping education sooner than desired among people with EPMH disability or mobility & dexterity disability aged 18
to 44.
EPMH disability Stopped education sooner than desired 62% Reason for stopping
Inadequate transport. < 5% Building or classroom equipment not suited or adapted 6% Did not have the personal or learning support you needed 42% Felt isolated socially 45% Found learning difficult, found it hard to keep up 61% Not interested in school or course 23% Poor health 62% Became eligible for social welfare allowance < 5%
Base: People with EPMH disability, aged 18-64, living in private households, interviewed in person who were affected before leaving school (N=834) and (for reasons) those who stopped sooner than desired
(N=512).
Other reasons included that they did not have the support they needed (42 per cent), that they felt isolated socially (45 per cent) and lack of interest (23 per cent). The fact that social isolation and lack of support are both cited by more than two in five highlights the importance of social support to enabling people with EPMH disability to achieve to their potential.
5.3 Main economic status
Table 5.4 shows the main economic status of working age men and women with EPMH disability and mobility & dexterity disability. The indicator of main economic status is taken from the National Disability Survey in most cases. Where the information was not available on the NDS questionnaire for an
14 Additional checks showed that the level of education completed is slightly higher among those who have EPMH disability only, but the difference is small (41% vs. 36% of all those with EPMH disability).

56
individual, it was taken from the 2006 Census in order that we could retain the case in the analysis.
Considering people with EPMH disability, we see that 18 per cent are in employment and 7 per cent unemployed. The percentage in employment is higher for males than females (20 per cent vs. 16 per cent), and the percentage unemployed is also higher. Among those not in employment or unemployed, the biggest group for both males and females is those ‘unable to work because of illness or disability’ (62 per cent and 56 per cent, respectively).
Table 5.4: Main Economic Status by Type of Disability and Gender
EPMH disability Male
EPMH disability Female
EPMH disability Total
Mobility & dexterity Male
Mobility & dexterity Female
Mobility & dexterity Total
In employment 20% 16% 18% 19% 15% 17% Unemployed 8% 5% 7% 4% 4% 4% Home duties 1% 15% 8% 1% 15% 8% ‘Unable to work’ 62% 56% 59% 63% 58% 61% Student 2% 2% 2% 1% 1% 1% Other inactive 8% 5% 6% 11% 7% 9%
Base: people with EPMH disability or mobility & dexterity disability aged 18-64, living in private households, interviewed directly. Main economic status measure was taken from the National Disability
Survey, where available, and from the 2006 Census otherwise.
The percentages in employment and ‘unable to work’ because of illness or disability are very similar for those with EPMH disability and those with mobility & dexterity disability. The percentage unemployed is higher for those with EPMH disability however. The unemployment rate is usually reported as the percentage of those in the labour market (i.e. either in employment or unemployed) who are unemployed. The unemployment rate would have been 28 per cent for people with EPMH disability compared to 19 per cent for people with mobilit y & dexterity disability.
These unemployment figures for people with a disability are a good deal higher than those reported by Watson, Kingston and McGinnity (2013) based on an analysis of the QNHS Equality Modules from 2004 and 2010 (CSO 2005; 2010). Watson Kingston and McGinnity (2013) find an overall unemployment rate of 8 per cent among people with a disability in 2004 and 22 per cent in 2010, with no significant difference by type of disability. The difference between these estimates and those from the NDS arise because the QNHS modules use a different

57
measure of disability15 and it is likely that the level of difficulty experienced by those included in the QNHS, which is a general population survey rather than one focused on disability, may be lower. Watson, Kingston and McGinnity find that the odds of being outside the labour market are significantly higher for those with emotional or psychological disability than for people with sensory, intellectual/learning and ‘other’ types of disability but that they did not differ significantly from those with physical disability (Watson, Kingston and McGinnity, 2013, Figure 3.2, p. 19).
5.4 In employment or interested in employment
In the context of labour market activation, there is a growing interest in moving towards a more inclusive approach to meeting the needs of all working-age adults rather than grouping them into categories (such as ‘unemployed’, ‘lone parents’, ‘person with a disability’). Segregating the working age population in this way leads to some groups being offered employment-related services and training while others are excluded (Gregg, 2008; Department of Social Protection, 2010; Watson, Maître and Whelan, 2012). In this context, an important concept is that of distance from the labour market. This has at least two dimensions. One is the person’s capacity to take up employment in terms of health, stamina and other commitments (such as caring for children or for adults with an illness or disability) and the other is their readiness for employment in terms of qualifications and skills. The NDS allows us to assess the capacity for employment for people with a disability: whether they would be interested in employment if the circumstances were right. Working-age people with a disability who were not in employment were asked this question. We saw in Table 5.4 that 18 per cent of people with EPMH disability are in employment. Of the remainder, a larger group would be interested in employment (44 per cent) than those not interested in employment (38 per cent). Table 5.5 shows how those not in employment are broken down into these two groups by gender and type of disability. The percentages are shown for those aged 18-64, not in employment and interviewed directly.
Among those with EPMH disability who are not in employment, slightly more than half of the men and women would be interested in employment (52 per cent of women and 53 per cent of men). This is a higher figure than for those with mobility & dexterity disability (44 per cent and 47 per cent, respectively).
15 The wording in the QNHS Equality modules asks if the person had any of a list of conditions (‘or difficulties’ was added in 2010). The list included sensory, physical, intellectual, learning and psychological/emotional disability.

58
Compared to those with mobility & dexterity disability, people with EPMH disability are more likely to be in employment or interested in employment. As a result, the proportion of those with EPMH disability not interested in employment is lower than the figure for people with mobility & dexterity disability.
Table 5.5: Whether interested in employment or not interested in employment by type of disability (working age adults in private
households interviewed directly but not in employment).
EPMH disability Male
EPMH disability Female
Mobility & dexterity Male
Mobility & dexterity Female
Not in employment, would be interested 53% 52% 47% 44% Not in employment, not interested 47% 48% 53% 56%
Base: people with EPMH disability or mobility & dexterity disability aged 18-65, excluding students, living in private households, interviewed directly. Main economic status measure was taken from the National
Disability Survey, where available, and from the 2006 Census otherwise.
An important piece of information in enhancing the capacity of people with EPMH disability to participate in employment is an understanding of what is (or would be) needed to enable them to do so. People with EPMH disability who were in employment or who said they would be interested in employment if the circumstances were right were asked what they needed or would need in order to be able to participate in employment. Table 5.6 shows the responses for people with EPMH disability and for those with mobility & dexterity disability. The most frequently cited requirement is identical for both groups of people with a disability: flexible work arrangements. This might include reduced hours or flexible work hours. This work arrangement is, or would be, needed by just over half of those with EPMH disability and mobility & dexterity disability. It is interesting to note that this aspect of job design is also important to another group at risk of exclusion from the labour market: mothers of young children (Russell, Watson and Banks, 2011).
Modified job tasks are also important to both groups, being cited by 30 per cent of people with EPMH disability and 36 per cent of those with mobility & dexterity disability. A wage subsidy is mentioned by 29 per cent of both groups. It is also worth noting that nearly two in five people with EPMH disability (38 per cent) require no particular modification or arrangement in order to be able to take up

59
employment – a percentage that is higher than the figure for those with mobility & dexterity disability (32 per cent).
Table 5.6: What is (or would be) needed to enable person with a disability to take up employment for people with EPMH disability or
mobility & dexterity disability
EPMH disability Mobility & dexterity Flexible work arrangements 52% 53% Modified job tasks 30% 36% Wage subsidy 29% 29% Accessible transport/parking 22% 36% Accessible building, toilets etc. 23% 40% Human support 6% 5% Communication aids 3% 5% Technical aids 2% 4% None of the above 38% 32% Missing on what needed 1% 1% 100% 100%
Base: people with EPMH disability or mobility & dexterity disability in employment or who would be interested in employment if the circumstances were right; aged 18-65 living in private households,
interviewed directly.
There are differences in the other changes that would be needed for people with mobility & dexterity disability compared to those with EPMH disability. People with mobility & dexterity disability, understandably, more often mention issues to do with accessibility such as accessible transport or parking (36 per cent compared to 22 per cent of people with EPMH disability) and accessible buildings (40 per cent vs. 23 per cent).
Given the overlap between EPMH disability and mobility & dexterity disability, it is worth asking whether those for whom EPMH disability is the main or only disability differ in terms of what they require or would require in order to be able to take up employment. Table 5.7 looks at the requirements for this group compared to those with EPMH disability but for whom this is not their main disability.

60
Table 5.7: What is (or would be) needed to enable person with EPMH disability to take up employment by whether EPMH disability is the
main/only disability
EPMH disability only
EPMH disability main
EPMH disability not main
Flexible work arrangements 39% 53% 57% Modified job tasks 12% 26% 39% Wage subsidy 20% 28% 32% Accessible transport/parking 6% 16% 32% Accessible building, toilets etc. <5% 12% 38% Human support <5% 7% 7% Communication aids <5% <5% 5% Technical aids <5% <5% <5% None of the above 56% 40% 31%
Base: People with EPMH disability age 18-64 living in private households who are either in employment, seeking employment or would be interested in employment if the circumstances were right.
Those with EPMH disability only are less likely than the other groups to require any of the modifications: 56 per cent require none of them compared to 40 per cent of those for whom EPMH disability is the main disability and 31 per cent of those for whom another type of disability is their main one. The fact that those with EPMH disability only do not have any requirements should not be surprising as the needs of this group are likely to be less complex since they do not also have another type of disability. The requirement cited most frequently by those for whom EPMH disability is the only disability is flexible work arrangements (39 per cent) followed by a wage subsidy (20 per cent). Among those with more than one type of disability but for whom EPMH disability is the main disability, flexible work arrangements are also the most frequently cited requirement but are needed by a larger proportion (53 per cent). Modified job tasks and a wage subsidy are the next most common requirements for this group (26 and 28 per cent respectively). Those with EPMH disability and another disability for whom the other disability is the main one are more likely to require accessibility features such as accessible transport and parking (32 per cent) or accessible building features (38 per cent). In contrast, where EPMH disability is the only disability, fewer than one in ten require any of these accessibility modifications.
We know that most disability is acquired during the person’s life rather than being present from birth or childhood. This means that many of those who are already in the workforce will develop a disability at some time in their lives. Since the average age of onset of EPMH disability is somewhat younger than for other types such as mobility & dexterity or sensory disability, many of those with the disability will have first experienced it while they are of working age. We saw in

61
Chapter 2 that 44 per cent of people with EPMH disability first experience the condition between ages 18 and 49. An important element in the labour force participation of those with this disability, then, is the extent to which those in employment at the time the disability emerges can be retained in employment. In the context of other disabilities, such as pain disability, the probability of remaining in employment is improved with early intervention (Breen, Langworthy and Barurst, 2005). Since employment in itself is associated with improved life satisfaction, even apart from its impact on income and living standards (Watson, Pichler and Wallace 2010), continued participation in employment is likely to be of particular benefit to people with EPMH disability.
Some further evidence of the importance of retention in employment is shown in Table 5.8. The figures indicate that about two thirds of those with EPMH disability were in employment in the past and just over three quarters of those who were in employment in the past left a job for reasons related to their disability. The main reason cited was ‘poor health’ (69 per cent).
The percentage who were in employment in the past and the percentage leaving a job for reasons related to the disability are quite similar for people with EPMH disability and mobility & dexterity disability. However, those with EPMH disability are somewhat less likely to cite ‘poor health’ as the reason (69 per cent vs. 79 per cent). People with EPMH disability are slightly more likely to cite isolation or bullying as a reason for leaving, but the overall percentage for both groups giving this reason is a very small (5 per cent vs. 2 per cent of those with mobility & dexterity disability).
Table 5.8: Whether adults with EPMH disability were ever in employment and whether left employment because of disability
EPMH disability Mobility & dexterity
Currently in employment 18% 17% Was in employment in the past 69% 74% Never in employment 13% 9% Whether left job for reasons related to disability Yes 77% 74% Whether left job for reasons related to disability No 23% 26% (If yes) Main reason left previous job
Job not accommodate disability 4% 5% Isolation, bullying 5% 2% Found job difficult 16% 9% Poor health 69% 79% Other 5% 5%

62
Base: People with EPMH disability or mobility & dexterity disability age 18-64 living in private households and interviewed directly.
We would expect to find differences in retention between the public and private sectors, since the public sector has a commitment to increase the number of people with a disability in its employment. Since the 1970s, there has been a target for 3 per cent of the staff of public bodies to be people with disabilities and this target was put on a statutory footing in the 2005 Disability Act (NDA, 2010). WRC Social and Economic Consultants (2008), drawing on a survey of Injury Benefit recipients, found that the former job was more likely to be still available to those who were in employment in the public sector (53 per cent) than the private sector (39 per cent, p. 69).
5.5 Jobless households
As noted above, joblessness at the household level is associated with high levels of disadvantage including income poverty, deprivation in terms of access to basic goods and services (Watson, Maître and Whelan, 2012). Whether someone with a disability lives in a jobless household will depend in part on their own employment status; in part on their living arrangements (if they live alone it depends entirely on their own employment status) and on the employment situation of other adults in the household. Table 5.9 shows the percentage of people with EPMH disability and the percentage of people with mobility & dexterity disability living in jobless households.
Among those with EPMH disability, 40 per cent of females and 47 per cent of males live in jobless households: households where none of the working age adults is in employment. The figure is higher for men with EPMH disability than for women with EPMH disability because of the traditional gender roles with respect to labour market participation. A man with EPMH disability is less likely to live with a wife who is in employment than a woman with EPMH disability is to live with a husband who is in employment.
Table 5.9: Percentage of adults with EPMH disability or mobility & dexterity disability living in jobless households.
EPMH disability Male
EPMH disability Female
Mobility & dexterity Male
Mobility & dexterity Female
Very low work
intensity 47% 40% 43% 32% Base: adults in private households with 1+ adult age 18-59 (interviewed in person).
Compared to those with mobility & dexterity disability, the percentage living in jobless households is higher for adults with EPMH disability, especially for women for whom there is an eight percentage point gap: 40 per cent of women with

63
EPMH disability live in jobless households compared to 32 per cent of women in mobility & dexterity disability. The gap is smaller for men, but the percentage living in jobless households remains higher for those with EPMH disability (47 per cent) than for those with mobility & dexterity disability (43 per cent).
As noted above, if the person with a disability is living alone, then whether the household is jobless or not depends entirely on their own employment situation. We conducted some additional analysis (not shown here) to examine whether the difference in risk of joblessness between those with EPMH disability and mobility & dexterity disability is due to differences in the proportion of adults with these disabilities living alone. As expected, households with several adults are less likely than one-adult households to be jobless, but joblessness remains higher for adults with EPMH disability than for adults with a mobility & dexterity disability. Therefore, the difference is not due to any association between disability type and living alone.
5.6 Factors influencing employment and interest in employment
So far in this chapter, we have seen that a number of different factors are important to whether people with a disability will be in employment or interested in employment, including gender, health status and the presence of other disabilities. In this section we report the results of a statistical model designed to identify which of these factors was most important. We report the significant results of a multinomial regression model designed to examine the contrast between people with EPMH disability (a) in employment (the reference category) and (b) those not in employment but interested in employment and (c) those not in employment and not interested in employment.
Table 5.10 shows the results of this model that were statistically significant. The full model is shown in Appendix Table A5.1. Table 5.10 shows the odds ratio in contrast to being in employment. An odds ratio greater than 1 indicates a greater likelihood than the reference category while an odds ratio less than one indicates a lower likelihood. For instance, those with an age of onset of EPMH disability in childhood are less likely than those aged 45 to 64 (the reference category) to be uninterested in employment (their odds of being uninterested are only 0.5, or half as high).
The main patterns in the table are the link between having another disability and being outside of employment; the importance of general health and stamina to both interest in employment and being in employment; the differences by gender, age and household type.
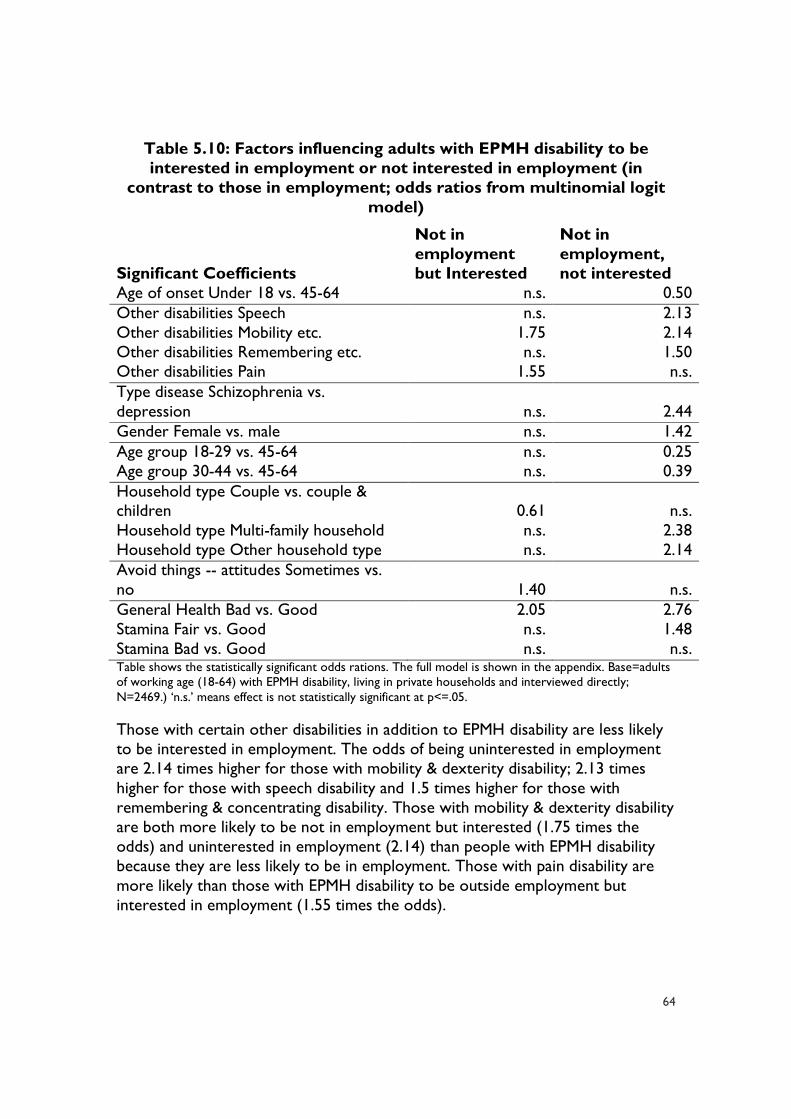
64
Table 5.10: Factors influencing adults with EPMH disability to be interested in employment or not interested in employment (in
contrast to those in employment; odds ratios from multinomial logit model)
Significant Coefficients
Not in employment but Interested
Not in employment, not interested
Age of onset Under 18 vs. 45-64 n.s. 0.50 Other disabilities Speech n.s. 2.13 Other disabilities Mobility etc. 1.75 2.14 Other disabilities Remembering etc. n.s. 1.50 Other disabilities Pain 1.55 n.s. Type disease Schizophrenia vs. depression n.s. 2.44 Gender Female vs. male n.s. 1.42 Age group 18-29 vs. 45-64 n.s. 0.25 Age group 30-44 vs. 45-64 n.s. 0.39 Household type Couple vs. couple & children 0.61 n.s. Household type Multi-family household n.s. 2.38 Household type Other household type n.s. 2.14 Avoid things -- attitudes Sometimes vs. no 1.40 n.s. General Health Bad vs. Good 2.05 2.76 Stamina Fair vs. Good n.s. 1.48 Stamina Bad vs. Good n.s. n.s. Table shows the statistically significant odds rations. The full model is shown in the appendix. Base=adults of working age (18-64) with EPMH disability, living in private households and interviewed directly; N=2469.) ‘n.s.’ means effect is not statistically significant at p<=.05.
Those with certain other disabilities in addition to EPMH disability are less likely to be interested in employment. The odds of being uninterested in employment are 2.14 times higher for those with mobility & dexterity disability; 2.13 times higher for those with speech disability and 1.5 times higher for those with remembering & concentrating disability. Those with mobility & dexterity disability are both more likely to be not in employment but interested (1.75 times the odds) and uninterested in employment (2.14) than people with EPMH disability because they are less likely to be in employment. Those with pain disability are more likely than those with EPMH disability to be outside employment but interested in employment (1.55 times the odds).

65
Among people with EPMH disability, those whose disability is linked to schizophrenia have odds of being uninterested in employment that are 2.44 times higher than those whose EPMH disability is linked to depression.
Women with EPMH disability are more likely than men with EPMH disability to be uninterested in employment (odds ratio of 1.42). Younger adults are less likely than those in the 45 to 64 age group to be uninterested in employment (odds ratios of .25 for those age 18 to 29 and 0.39 for those age 30 to 44).
Those living in a couple household are less likely than those living in a couple and children household to be not in employment but interested in employment. This may be because of the additional constraints on participation in employment faced by those with children, particularly when there is an adult with a disability in the household. Those in multi-family households and in ‘other’ household types have more than twice the odds of being uninterested in employment compared to those in couple and children households. These patterns may to some extent reflect the selection of people with EPMH disability problems of a more complex nature into household types where they can avail of the support of others. In other words, people with more severe or complex EPMH disability may be less likely to move out to live independently.
We can see the importance of the attitudes of other people in that those with EPMH disability who sometimes avoid things because of the attitudes of other people are more likely to be interested in employment but not actually in employment (odds ratio of 1.4).
Finally, health and stamina are important: those with bad health have more than twice the odds of being interested in employment (but not actually in employment) and nearly three times the odds of being uninterested in employment. Those whose stamina is ‘fair’ also have higher odds of being uninterested in employment.
5.7 Summary
In this chapter we examined the education and labour market participation of working age people with EPMH disability. We found that 29 per cent of those with EPMH disability were affected by the disability while still in education and that 18 per cent stopped their schooling sooner than they would have liked, often due to health problems or because they found school difficult. Just over one third of those with EPMH disability have no qualifications.
Nearly one in five people with EPMH disability was in employment in 2006 before the recession and this group had an unemployment rate of 28 per cent. Over one third were not in employment but would be interested in employment if the

66
circumstances were right. The most important factor reported as enabling people with EPMH disability to take up employment is (or would be) flexible working arrangements such as shorter hours or flexible working times (52 per cent). However, a substantial proportion of people with EPMH disability who were in employment or who would be interested in employment required no particular modifications in order to be able to take up employment (28 per cent).
About two thirds of people with EPMH disability were in employment in the past and of these just over three quarters left a job for reasons related to their disability – most often poor health (69 per cent), but also because they found the job difficult (16 per cent).
People with EPMH disability have a high risk of living in a jobless household – a household where none of the working age adults is in employment: 40 per cent for women with EPMH disability and 47 per cent for men with EPMH disability. This higher risk of being in a jobless household among people with a disability was also found by Watson, Maitre and Whelan, 2012, who report a figure for the general population of 15 per cent for 2007 (Figure 2.1, p. 18 ).
A statistical model of the labour market situation of people with EPHM (in employment, not in employment but interested in employment or not in employment and not interested in employment) highlighted a number of important factors. These included the importance of the presence of another disability in reducing the odds of the person being in employment; the nature of the disease causing the EPMH disability (with schizophrenia showing a stronger link to lack of interest in employment); poor health in lowering the odds of the person being in employment; ‘fair’ stamina in reducing interest in employment; as well as gender (women are more likely to be not interested in employment), household type (those living in a couple & children household are more likely to be in employment or interested in employment) and the attitudes of other people (important in the distinction between those actually in employment and those interested but not in employment).
The findings in this chapter once again pointed to the importance of social support in enabling the participation of people with EPMH disability and to the harmful effects of stigma in hindering them. We saw that about 18 per cent of people with EPMH disability left school or college sooner than they would have liked because of reasons related to their disability and that a substantial minority of this group gave as reasons a lack of support (42 per cent) or feeling socially isolated (45 per cent).
We also saw that concerns about stigma were important to making the transition from interest in employment to actually being in employment. The statistical model showed that those who sometimes avoid things because of the attitudes of

67
others were 40 per cent more likely to be interested in employment than to be actually in employment, with other characteristics controlled.

68
Chapter 6: Conclusions
6.1 Introduction
This report has focused on the relatively neglected area of emotional, psychological and mental health (EPMH) disability in order to understand the circumstances and needs of those affected. Drawing on the 2006 National Disability Survey we explored in depth the situation of people with EPMH disability in Ireland.
There were two broad themes that emerged repeatedly in the course of the analysis and discussion. The first concerned the striking extent of overlap between EPMH disability and other types of disability. This was discussed in Chapter 2 and was evident from earlier CSO reports from the survey (CSO, 2008; 2010). EPMH disability, as captured by the National Disability Survey, rarely occurs in isolation. Only about one in eight of those with an EPMH disability does not have at least one other type of disability. About half of those with EPMH disability also have mobility & dexterity disability; about half have a remembering & concentrating disability and slightly less than one half also have pain disability. It was not possible to use the age of onset of the different disability types to get a sense of whether, for instance, mobility & dexterity disability might be contributing to the development of EPMH disability or vice versa. This is because for the types of disability with the strongest overlap with EPMH disability, (mobility & dexterity, remembering & concentrating, pain) more people reported a similar age of onset for both types than reported an earlier age of onset for either EPMH disability or the other type of disability. However, when asked which type of disability they considered the main one, people who had both EPMH disability and another type of disability were more likely to consider another type to be their main disability. Considering EPMH disability and each other disability one at a time, EPMH disability is most likely to be considered the main disability by those who have both EPMH disability and remembering & concentrating disability (33 per cent of cases), followed by those who have both EPMH disability and intellectual or learning disability (31 per cent of cases). This close connection between EPMH disability and other types of disability clearly has implications for policy and this is something to which we shall return at the end of the chapter.
A second theme to emerge from the analysis was the difficulties many people with EPMH disability experience around the attitudes of others and in terms of securing the social support they need. As noted in Chapter 1, there are strong reasons to suspect that people with EPMH disability face a greater level of stigma than people with many other types of disability (WHO, 2001b; Lingsoma, 2008; Hannon, 2007; Barry et al, 2009). These stigmatising attitudes, in turn, may hinder

69
the person from getting the help and support they need in order to maximise their participation in society. The findings in the report suggest that many, but not most, people with EPMH disability experience difficulties related to stigma and lack of support. We found that most people with EPMH disability (61 per cent) do not avoid doing things because of the reactions of other people, but the percentage who avoid doing things sometimes (24 per cent) or frequently/often (15 per cent) is higher than it is for people with mobility & dexterity disability (15 per cent and 7 per cent, respectively). Avoiding things because of the attitudes of other people was more of an issue for young people with EPMH disability than for their older counterparts, with over half of those in the 18 to 34 age group affected. We constructed a social support scale measuring the proportion of groups in the person’s life whose attitudes were supportive. The groups included family, friends, neighbours, work colleagues, health service providers, other public service providers, private service providers, employers and strangers. On the scale which ranges from 0 (low support) to 1 (high support), the average score was 0.69 for people with EPMH disability compared to 0.76 among those with mobility & dexterity disability.
Related to the issue of social support is the fact that the earlier onset of EPMH disability than many other types of disability may cause problems in social relationships at a time when family formation is usually taking place. Compared to people with mobility & dexterity disability, people with EPMH disability are less likely to be married (34 per cent vs. 44 per cent) and more likely to be single (46 per cent vs. 27 per cent) and somewhat more likely to be divorced/separated (10 per cent vs. 7 per cent). Remaining single is strongly associated with the age of onset of the disability. Among people with EPMH disability aged 45 and over, 60 per cent of those whose disability began in childhood remain single, falling to 37 per cent of those with an age of onset in the 18-29 age range, 22 per cent of those with an age of onset from 30 to 44, 14 per cent of those with an age of onset from 45 to 64 and 10 per cent among those with an age of onset age 65 and over. Clearly, the onset of EPMH disability in childhood or in the twenties has a much greater impact on whether the person marries than a later onset, which may occur after the person is already married. As well as affecting the possibility of marriage, it is likely that EPMH disability with an early age of onset may hinder the formation of friendship networks, leaving people with EPMH disability vulnerable to a lack of support from non-family networks as well.
Before considering the policy implications of the findings, we return to the research questions with which we began and bring the results of analyses in earlier chapters to bear on them. In summary the questions were:
• What accounts for differences in the extent to which EPMH disabilities lead to difficulties in everyday activities?
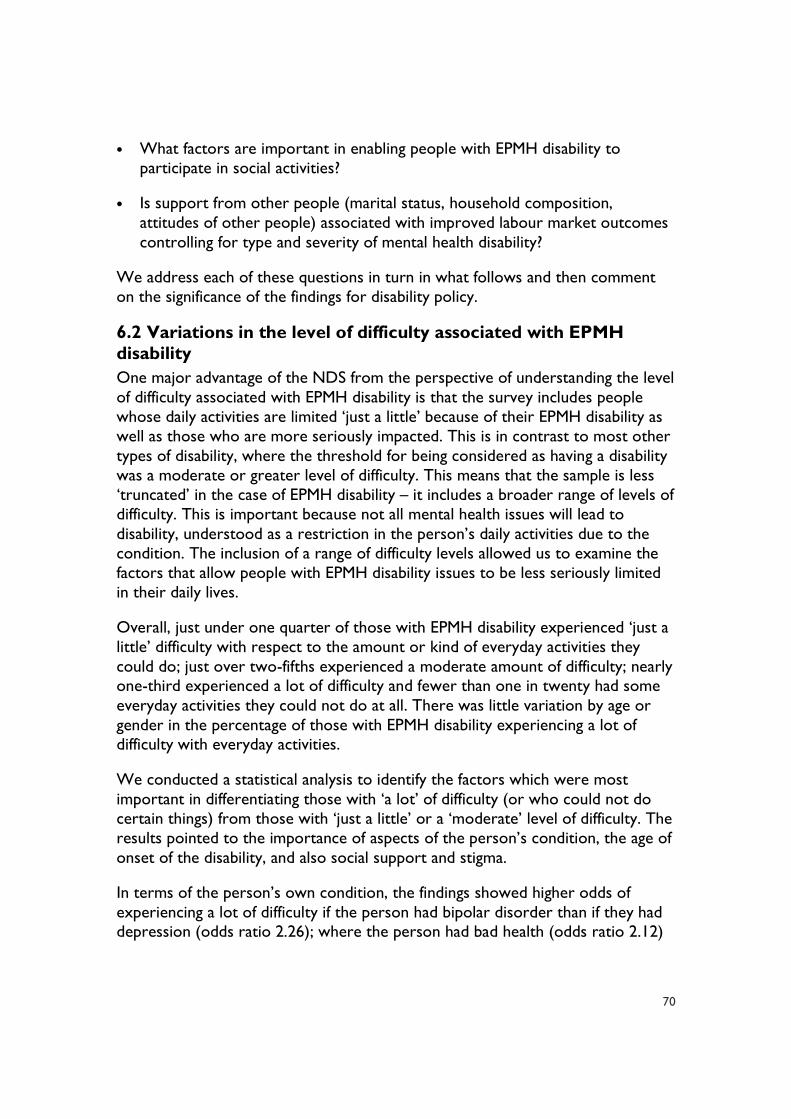
70
• What factors are important in enabling people with EPMH disability to participate in social activities?
• Is support from other people (marital status, household composition, attitudes of other people) associated with improved labour market outcomes controlling for type and severity of mental health disability?
We address each of these questions in turn in what follows and then comment on the significance of the findings for disability policy.
6.2 Variations in the level of difficulty associated with EPMH disability
One major advantage of the NDS from the perspective of understanding the level of difficulty associated with EPMH disability is that the survey includes people whose daily activities are limited ‘just a little’ because of their EPMH disability as well as those who are more seriously impacted. This is in contrast to most other types of disability, where the threshold for being considered as having a disability was a moderate or greater level of difficulty. This means that the sample is less ‘truncated’ in the case of EPMH disability – it includes a broader range of levels of difficulty. This is important because not all mental health issues will lead to disability, understood as a restriction in the person’s daily activities due to the condition. The inclusion of a range of difficulty levels allowed us to examine the factors that allow people with EPMH disability issues to be less seriously limited in their daily lives.
Overall, just under one quarter of those with EPMH disability experienced ‘just a little’ difficulty with respect to the amount or kind of everyday activities they could do; just over two-fifths experienced a moderate amount of difficulty; nearly one-third experienced a lot of difficulty and fewer than one in twenty had some everyday activities they could not do at all. There was little variation by age or gender in the percentage of those with EPMH disability experiencing a lot of difficulty with everyday activities.
We conducted a statistical analysis to identify the factors which were most important in differentiating those with ‘a lot’ of difficulty (or who could not do certain things) from those with ‘just a little’ or a ‘moderate’ level of difficulty. The results pointed to the importance of aspects of the person’s condition, the age of onset of the disability, and also social support and stigma.
In terms of the person’s own condition, the findings showed higher odds of experiencing a lot of difficulty if the person had bipolar disorder than if they had depression (odds ratio 2.26); where the person had bad health (odds ratio 2.12)
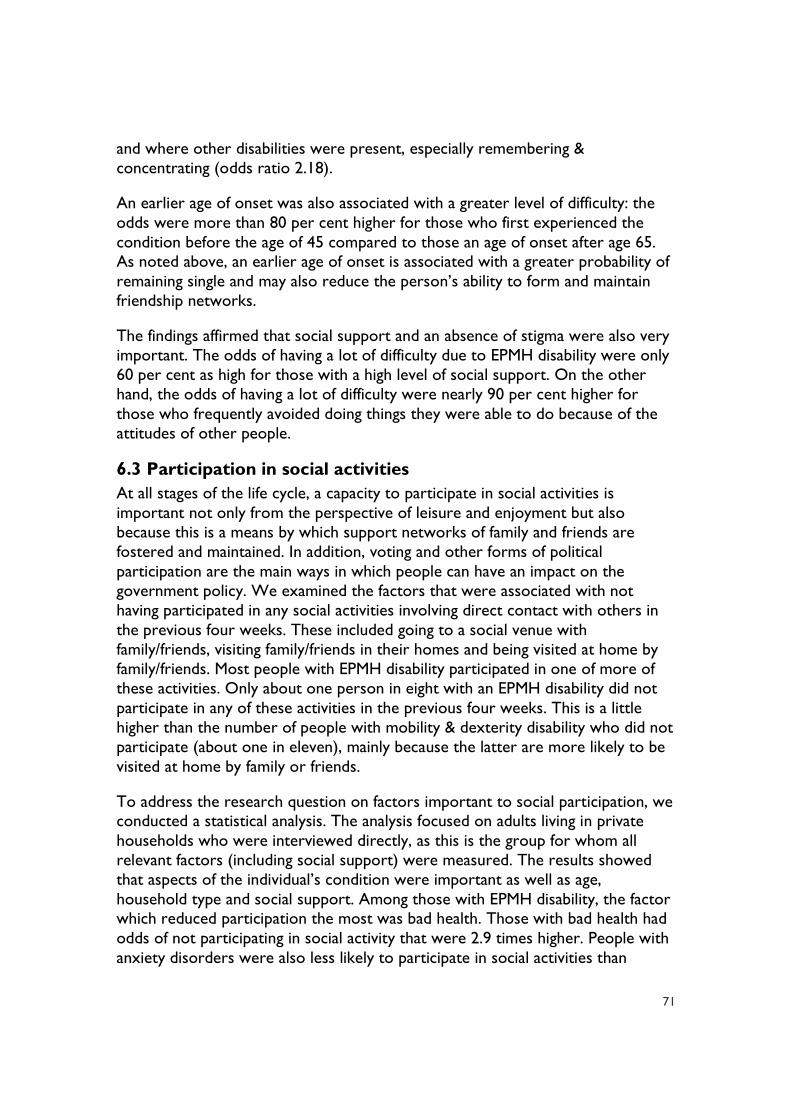
71
and where other disabilities were present, especially remembering & concentrating (odds ratio 2.18).
An earlier age of onset was also associated with a greater level of difficulty: the odds were more than 80 per cent higher for those who first experienced the condition before the age of 45 compared to those an age of onset after age 65. As noted above, an earlier age of onset is associated with a greater probability of remaining single and may also reduce the person’s ability to form and maintain friendship networks.
The findings affirmed that social support and an absence of stigma were also very important. The odds of having a lot of difficulty due to EPMH disability were only 60 per cent as high for those with a high level of social support. On the other hand, the odds of having a lot of difficulty were nearly 90 per cent higher for those who frequently avoided doing things they were able to do because of the attitudes of other people.
6.3 Participation in social activities
At all stages of the life cycle, a capacity to participate in social activities is important not only from the perspective of leisure and enjoyment but also because this is a means by which support networks of family and friends are fostered and maintained. In addition, voting and other forms of political participation are the main ways in which people can have an impact on the government policy. We examined the factors that were associated with not having participated in any social activities involving direct contact with others in the previous four weeks. These included going to a social venue with family/friends, visiting family/friends in their homes and being visited at home by family/friends. Most people with EPMH disability participated in one of more of these activities. Only about one person in eight with an EPMH disability did not participate in any of these activities in the previous four weeks. This is a little higher than the number of people with mobility & dexterity disability who did not participate (about one in eleven), mainly because the latter are more likely to be visited at home by family or friends.
To address the research question on factors important to social participation, we conducted a statistical analysis. The analysis focused on adults living in private households who were interviewed directly, as this is the group for whom all relevant factors (including social support) were measured. The results showed that aspects of the individual’s condition were important as well as age, household type and social support. Among those with EPMH disability, the factor which reduced participation the most was bad health. Those with bad health had odds of not participating in social activity that were 2.9 times higher. People with anxiety disorders were also less likely to participate in social activities than

72
people with depression (odds of non-participation were 1.7 times higher for those with anxiety disorder). Adults whose EPMH disability emerged in their twenties and in the 45-64 age group were more likely to participate in social activities than those whose EPMH disability emerged after age 65. We can speculate about the likely cause of this pattern, but we have no firm evidence in the data. Young adulthood is an important time for forming social networks and the presence of EPMH disability at this stage may allow the person to form social networks which meet their needs. EPMH disability developing later in life may be linked to a disruption in social networks (such as due to illness, marital breakdown, loss of a spouse) or it may be more difficult for those who develop EPMH disability later in life to forge new social networks that support them and meet their needs. Understanding these processes would require further research.
Social support had a strong association with social participation. Those with high levels of social support are very unlikely to have missed out on social participation in the last four weeks: the odds of non-participation were only 38 per cent as high for those with high levels of social support as for those with low levels of social support. Social support and social participation are likely to be mutually reinforcing rather than social support being completely independent of social participation.
There were some other findings from the statistical model that were a little more difficult to explain, such as the lower odds of non-participation of people with EPMH disability who also have hearing or pain disability and the higher odds of non-participation among those living with relatives who are not immediate family. Since it is very unlikely that the household type would have a direct impact on social participation, it is most likely due to some unmeasured aspect of the person’s EPMH disability or aspect of their social environment associated with living with relatives in a non-family household.
There were also some other findings from the survey pointing to the particular importance of social support and stigma for people with EPMH disability. Survey respondents were asked whether they had difficulties in participation more generally – including attending religious services and voting as well as visiting or socialising in a public venue. About half of those with EPMH disability and 55 per cent of those with mobility & dexterity disability experienced a lot of difficulty with at least one of these activities. Those who had a difficulty were asked the reason for these difficulties. Among those with EPMH disability, health considerations or physical inability were cited by the largest group (85 per cent). However, the significance of stigma, or perceived stigma, was also evident here for people with EPMH disability who cited being ‘self-conscious’ of the disability (44 per cent) more often than people with mobility & dexterity disability (25 per

73
cent). ‘Unfriendly/negative attitudes’ were also more frequently cited (16 per cent vs. 6 per cent, respectively).
6.4 Labour market outcomes
Given the benefits of labour market participation for the financial, social and mental well-being of individuals and households, and the move in Irish labour market policy towards a more integrated approach to activation, it is important to assess the distance from the labour market of groups not currently in employment (Government of Ireland, 2012). Key aspects of this distance are the person’s health and stamina, their interest in employment and their levels of qualifications and skills.
We noted that people with EPMH disability have lower levels of educational qualifications than the general population: just over one third have no educational qualifications and the figure is 22 per cent for those aged under 45. Nevertheless, most of them had been in employment at some point. About one fifth of those with EPMH disability were in employment at the time of the survey and about two thirds had been in employment in the past. Of those who were in employment in the past, just over three quarters left a job for reasons related to their disability – most often poor health (69 per cent), but also because they found the job difficult (16 per cent).
In terms of interest in employment, over two in five working-age people with EPMH disability were not currently in employment but would be interested in a job if the circumstances were right and just under two in five were not in employment and would not be interested in employment. This is a higher level of interest in employment than among people with mobility & dexterity disability. Like people with a disability in general, the most important factor in enabling people with EPMH disability to take up employment is (or would be) flexible working arrangements such as shorter hours or flexible working times (52 per cent).
What factors account for differences in distance from the labour market among people with EPMH disability? We conducted an analysis based on a statistical model to address this question, with a particular focus on what distinguished those interested in employment from those not interested in employment. We focused on people with EPMH disability of working age (18-64) living in private households who were interviewed directly (i.e. not by proxy), as this was the group for which all the relevant variables were measured. The main differences between the two groups were the presence of other disabilities, the type of disease, gender, age, household type and stamina.

74
Bad health and presence of a mobility & dexterity disability reduces the likelihood that someone with EPMH disability will be in employment, but are not major factors in distinguishing between those who would be interested and those not interested in employment.
Being uninterested in employment was associated with the presence of certain other disabilities (speech, remembering & concentrating); schizophrenia; being female; being older (45 to 64) living in a multi-family or non-family household, and poor stamina.
The impact of social support and stigma were not large when other characteristics were controlled, but people who sometimes avoided things because of the attitudes of other people had a greater likelihood of being interested in employment but not actually in employment.
6.4 Limitations
Throughout the report we saw evidence that people with EPMH disability were affected by the attitudes of others, perhaps to a greater extent than those with mobility & dexterity disability. Given this fact, and given what we know about the stigma associated with mental health problems, it is likely that the level of EPMH disability captured in the NDS is understated. Barry et al. (2009) note that self-reported levels of mental health difficulty may be underreported, particularly among those who have relatively more to lose should their EPMH disability become known (Barry et al, 2009). If those with more to lose are less likely to disclose mental health disability, it is quite probable that those with EPMH disability only (i.e. the do not also have another type of disability) are underrepresented. If this is the case, then the analysis in the present report may overstate the extent of overlap between EPMH disability and other disabilities. The proportion of people who have EPMH disability only, then, should be considered a lower bound estimate.
Another limitation is that while we can identify significant associations in the statistical models discussed in this report, it is not possible to attribute the patterns to causation. For example, concerns about the attitudes of other may limit the social participation of people with a disability but, as always with these relationships, we do not know whether this is because negative attitudes have led to negative treatment and experiences or a heightened expectation of negative treatment may be part of the person’s condition (e.g. depression). We know from general population surveys that negative attitudes and stigma still surrounds mental health disability, however so there is independence evidence for the existence of this stigma (e.g. Barry et. al., 2009; Hannon, 2011).

75
6.5 Policy
6.5.1 Integrated approach to meeting service needs One third of people with a disability have an EPMH disability. The implication is that a substantial improvement to the lives of people with a disability could be achieved by addressing their mental health needs.
The extent of overlap between the different types of disability could easily be missed if there is an emphasis on classifying people according to a single disability type. While this may be a useful classification for some purposes, it is likely to be misleading and misapplied if used in designing care programmes and service delivery for people with a disability. In particular, it may lead to the neglect of the psychological and emotional challenges experienced by people with physical or sensory disability.
As noted by Barry et al., (2009) there is a clear relationship between mental health, social well-being, quality of life, self-rated health and health behaviours. This indicates that “mental health needs to be integrated into all elements of health and social policy, health system planning and healthcare delivery” (p. 84).
This call for an integrated approach echoes A Vision for Change (2006), which emphasises a holistic view of mental illness and recommends an integrated multidisciplinary approach to addressing the range of needs experienced by those with EPMH disability issues. If services are designed to be person-centred, rather than centred on a diagnosis, the complexity of needs and issues will be fully recognised.
As noted in the introduction, the strategy is now in its seventh year but there is concern that implementation of its commitments has been uneven (Mental Health Commission, 2013).
6.5.1 Disability and the labour market Most disability is acquired during the lifetime, and since many people with EPMH disability acquired the disability during their working years, it is important to consider the role of employment retention as well as the role of employment entry in enhancing their labour market participation. Over two fifths of people with EPMH disability first experienced the disability between the ages of 18 and 49. About two thirds of people with EPMH disability were in employment in the past and of these just over three quarters left a job for reasons related to their disability – most often poor health (69 per cent), but also because they found the job difficult (16 per cent).
Maintaining contact with the workplace has been found to be the best strategy in ensuring a smooth transition back to the workplace in the context of other types

76
of disability (see Breen, Langworthy and Bagust, 2005, on musculoskeletal problems). It is entirely plausible that such an approach would also be successful in the context of EPMH disability that begins or recurs during the person’s working life. Reintegration into an existing job and workplace is generally more straightforward than starting anew in another workplace. This would mean involving both the employer and employee as active participants in the recovery plan.
The evidence in this report suggested that there was quite a distance to travel in terms of attitudes before this could become a reality. Although more people with a disability find employers supportive (56 per cent) than hindering (19 per cent) the percentage of people with EPMH disability who find that employers hinder them is higher than the figure for people with mobility & dexterity disability (11 per cent). Employers are also more likely than other groups (such as providers of public and private services, acquaintances and strangers) to be identified as hindering the person.
6.5.3 Stigma The issue of stigma remains a significant barrier for people with EPMH disability and this is true of EPMH disability to a greater extent than for mobility & dexterity disability. Nearly 40 per cent of people with EPMH disability avoid doing things they would otherwise do because of the attitudes of other people compared to only 22 per cent of people with mobility & dexterity disability. This has consequences in terms of the support that is available to them. As noted above, the average score on the supportiveness scale is 0.69 for people with EPMH disability compared to 0.76 for people with mobility & dexterity disability.
We saw evidence of the effects of stigma on the social and civic participation of people with EPMH disability. Although most people with EPMH disability did participate in at least some social activities in the previous four weeks, 12 per cent did not – a higher figure than the 9 per cent for people with mobility & dexterity disability. In addition, slightly less than one third of people with EPMH disability have a lot of difficulty in going away for a break or holiday and nearly two in five have a lot of difficulty in taking part in community life. Although health problems are most often cited as the reason (85 per cent), a substantial minority of people with EPMH disability also give reasons related to the perceived attitudes of others, and expressed these concerns more frequently than did people with mobility & dexterity disability.
The attitudes of other people do matter, then, and can result in people with EPMH disability holding back from seeking the help they need to attain their potential. They may also lead people who have physical disabilities in addition to their EPMH disability to fail to seek help for the physical disabilities. Perceived

77
stigma can result in social isolation which, in turn, worsens EPMH disability issues and hinders recovery. Addressing this stigma on the part of the general population – including those providing public and private services – needs to remain on the agenda of mental health policy. To the extent that stigma results in discrimination, equality legislation to protect people with a disability in the context of access to employment and to services may be particularly important to those with EPMH disability.
6.5.4 Further research An area worthy of further research is the nature of the link between EPMH disability and other types of disability, especially whether there is a causal relationship between them. For instance, some people may develop mobility difficulties which affect their mental health; some people may develop mobility difficulties as a result of mental health problems; or there may be an event such as an accident or stroke which affects both physical and mental health. The analysis in this report of the age of onset of EPMH disability and each other disability – for those experiencing both types – and the analysis of which disability was considered the main one did not suggest a clear causal ordering based on type of disability. A more complete understanding of the nature of the relationship would be needed in order to inform health promotion and disability prevention policy.

78
Appendix Tables
Table A2.1: Percentage of people with EPMH disability in communal establishments by gender and broad age group
% communal 1 Has EPMH disability only 6%
2 Has EPMH disability and other, EPMH disability is main 6%
3 Has EPMH disability and other, other is main 9%
Male 8%
Female 8%
Age under 18 5%
Age 18-64 9%
Age 65+ 5%
Base: People (all ages) with emotional, psychological or mental health disability. Source: National Disability Survey 2006, analysis by authors.
Table A3.1: Having a lot of difficulty with everyday activities or routine tasks – people with EPMH disability who do not also have mobility &
dexterity disability
% with a lot of difficulty or
cannot do Staying by his/herself? 21%
Taking a bath or shower by his/herself? 7%
Dressing his/her self? 3%
Feeding his/her self? 1%
Getting in and out of bed by his/her self? 1%
Going to the toilet by his/her self? 2%
Doing routine tasks inside their home. 6% Base: People (all ages) with emotional, psychological or mental health disability who do not also have mobility & dexterity disability. Source: National Disability Survey 2006, analysis by authors.

79
Table A3.2: Odds of experiencing a lot of difficulty due to EPMH disability (Odds ratios from series of logistic regression models)
Model 1 Model 2 Model 3 Model 4
Constant 0.14 .13 ** .21 ** .17 **
Age of onset Birth vs. 65+ 1.47 1.36 1.13 1.30
Under 18 vs. 65+ 1.80 * 1.67 1.36 1.51
18-29 vs. 65+ 2.27 ** 2.07 * 1.77 * 1.91 *
30-44 vs. 65+ 2.13 ** 1.88 * 1.69 1.85 *
45-64 vs. 65+ 1.37 1.22 1.10 1.18
Unknown vs. 65+ 1.41 1.30 1.15 1.26
Other disabilities Seeing 1.35 * 1.33 * 1.41 * 1.33 *
Hearing 0.98 1.01 1.01 1.01
Speech 1.47 1.50 * 1.56 * 1.62 *
Mobility etc. 1.04 1.04 1.02 0.89
Remembering etc. 2.40 ** 2.43 ** 2.34 ** 2.18 **
Learning etc. 1.59 ** 1.64 ** 1.60 ** 1.61 **
Pain 1.03 0.99 0.98 0.85
Breathing 1.39 ** 1.37 ** 1.28 * 1.09
Main cause (self-report) Hereditary vs. illness 1.28 1.25 1.28 1.37
Accident, injury vs. illness 0.99 1.07 1.08 1.08
Work-related vs. illness 0.82 0.81 0.82 0.79
Stress vs. illness 0.94 0.93 0.95 0.99
Other cause vs. illness 1.01 1.02 0.98 1.03
No specific cause vs. illness .41 ** .42 ** .42 ** .47 **
Cause unknown vs. illness 0.73 0.74 0.78 0.79
Type disease Anxiety disorder vs. depression 1.19 1.20 1.17 1.20
Bipolar vs. depression 2.18 ** 2.17 ** 2.15 ** 2.26 **
Addiction vs. depression 1.17 1.23 1.12 1.08
Schizophrenia vs. depression 1.23 1.25 1.32 1.41
Other vs. depression .55 ** .54 ** .55 ** .57 **
Unknown illness vs. depression 0.94 0.95 1.00 0.89
Gender Female vs. male 1.18 1.16 1.17
Age group 18-29 vs. 65+ 0.93 0.96 0.91
30-44 vs. 65+ 1.12 1.09 1.02
45-64 vs. 65+ 1.07 1.04 0.95
Marital status Single vs. married 1.09 1.10 1.07
Divorced/separated vs. married 1.20 1.21 1.18
Widowed vs. married 0.85 0.87 0.88
Household type Live alone vs. couple & children 1.06 1.04 1.08
Couple vs. vs. couple & children 1.33 1.35 1.36
Lone parent vs. couple & children 0.73 .69 * 0.69
Multi-family household 1.36 1.38 1.46
Non-relatives vs. couple & children 0.80 0.81 0.84
Other household type 1.24 1.29 1.37
Missing household type 0.67 0.69 0.72
Avoid things b/c of Sometimes vs. no 0.89 0.90
attitudes? Frequently vs. no 2.00 ** 1.89 **
Supportive attitudes Scale (0-1) .59 ** .60 **
General Health Fair vs. Good 1.24
Bad vs. Good 2.12 **
Stamina Fair vs. Good 1.05
Bad vs. Good 1.35
Source: NDS 2006, analysis by authors. Base: Adults (age 18+) in private households interviewed in person with EPMH disability. Model run in Stata with robust standard errors to control for weighting. ‘*’ significant at p<=.05; ‘**’ significant at p<=.01. Blank cell indicates variable not included in model.

80
Table A4.1: Odds of not participating in social activity (Odds ratios from series of logistic regression models)
Model 1 Model 2 Model 3 Model 4
Constant .21 ** .15 ** .36 ** .22 **
Age of onset Birth vs. 65+ 0.60 0.80 0.69 0.88
Under 18 vs. 65+ .48 * 0.65 0.52 0.62
18-29 vs. 65+ .40 ** 0.51 .43 * .48 *
30-44 vs. 65+ .48 * 0.56 .48 * 0.55
45-64 vs. 65+ .48 * 0.53 .45 * .50 *
Unknown vs. 65+ 0.61 0.68 0.59 0.66
Other disabilities Seeing 0.82 0.80 0.84 0.77
Hearing .55 ** .54 ** .51 ** .52 **
Speech 1.13 1.17 1.24 1.34
Mobility etc. 1.39 1.38 1.36 1.13
Remembering etc. 1.24 1.21 1.13 1.00
Learning etc. 1.18 1.22 1.20 1.18
Pain 0.72 0.73 0.73 .59 **
Breathing 1.17 1.13 1.12 0.90
Main cause Hereditary vs. illness 0.62 0.61 0.63 0.68
(self-report) Accident, injury vs. illness 1.10 1.15 1.19 1.22
Work-related vs. illness 1.55 1.59 1.65 1.55
Stress vs. illness 0.88 0.86 0.90 0.97
Other cause vs. illness 1.31 1.33 1.34 1.42
No specific cause vs. illness 0.70 0.74 0.80 0.94
Cause unknown vs. illness 1.32 1.36 1.51 1.56
Type disease Anxiety disorder vs. depression 1.62 * 1.66 * 1.66 * 1.70 *
Bipolar vs. depression 0.79 0.78 0.77 0.83
Addiction vs. depression 1.63 1.42 1.45 1.44
Schizophrenia vs. depression 1.59 1.49 1.60 1.79
Other vs. depression .53 * 0.56 0.59 0.60
Unknown illness vs. depression 1.90 2.00 2.09 1.89
Gender Female vs. male 0.87 0.84 0.85
Age group 18-29 vs. 65+ 0.55 0.60 0.55
30-44 vs. 65+ 1.03 1.08 0.95
45-64 vs. 65+ 0.96 0.98 0.84
Marital status Single vs. married 1.06 1.02 0.96
Divorced/separated vs. married 1.63 1.56 1.43
Widowed vs. married 1.45 1.50 1.42
Household type Live alone vs. couple & children 1.33 1.31 1.38
Couple vs. vs. couple & children 1.40 1.45 1.42
Lone parent vs. couple & children 1.05 0.96 1.00
Multi-family household 1.01 0.94 0.99
Non-relatives vs. couple & children 1.42 1.39 1.46
Other household type 1.81 1.90 2.05 *
Avoid things b/c of Sometimes vs. no 0.78 0.80
attitudes? Frequently vs. no 1.24 1.15
Support. attitudes Scale (0-1) .37 ** .38 **
General Health Fair vs. Good 1.49
Bad vs. Good 2.86 **
Stamina Fair vs. Good 1.39

81
Bad vs. Good 1.58
Source NDS 2006, analysis by authors. Base: Adults (age 18+) in private households interviewed in person with EPMH disability. Model run in Stata with robust standard errors to control for weighting. ‘*’ significant at p<=.05; ‘**’ significant at p<=.01. Blank cell indicates variable not included in model.

82
Table A5.1: Odds of being out of employment but interested in employment or out of employment and not interested in employment
vs. being in employment.
Odds ratios vs. in employment Not in employment, would
be interested
Odds ratios vs. in employment Not in employment, not interested
Constant 0.61 0.62
Age of onset Birth vs. 45-64 0.64 0.87
Under 18 vs. 45-64 0.83 0.50 *
18-29 vs. 45-64 0.62 0.68
30-44vs. 45-64 0.99 0.69
Unknown vs. 65+ 0.84 0.76
Other disabilities Seeing 0.83 1.20
Hearing 0.98 0.93
Speech 1.35 2.13 *
Mobility etc. 1.75 ** 2.14 **
Remembering etc. 1.29 1.50 **
Learning etc. 0.69 1.16
Pain 1.55 ** 1.10
Breathing 1.01 1.26
Main cause (self-report) Hereditary vs. illness 0.86 0.75
Accident, injury vs. illness 1.14 0.86
Work-related vs. illness 0.89 0.80
Stress vs. illness 0.94 0.81
Other cause vs. illness 0.99 1.06
No specific cause vs. illness 1.51 1.94
Cause unknown vs. illness 1.21 1.12
Type disease Anxiety disorder vs. depression 1.12 1.46
Bipolar vs. depression 0.65 0.68
Addiction vs. depression 1.49 1.24
Schizophrenia vs. depression 1.60 2.44 **
Other vs. depression 0.78 0.63
Unknown illness vs. depression 0.86 0.58
Gender Female vs. male 1.20 1.42 *
Age group 18-29 vs. 45-64 1.20 .25 **
30-44 vs. 45-64 1.06 .39 **
Marital status Single vs. married 1.03 0.76
Divorced/separated vs. married 0.98 0.68
Widowed vs. married 0.89 1.03
Household type Live alone vs. couple & children 0.97 1.43
Couple vs. vs. couple & children 0.61 * 1.06
Lone parent vs. couple & children 1.41 1.12
Multi-family household 1.21 2.38 *
Non-relatives vs. couple & children 0.61 1.08
Other household type 1.06 2.14 *
Missing household type 1.48 1.72
Avoid things Sometimes vs. no 1.40 * 1.00
because of attitudes? Frequently vs. no 1.23 0.70
Supportive attitudes Scale (0-1) 1.01 1.47
General Health Fair vs. Good 1.35 1.37
Bad vs. Good 2.05 ** 2.76 **
Stamina Fair vs. Good 1.28 1.48 *
Bad vs. Good 1.37 1.59

83
Source: NDS 2006, analysis by authors. Base: Adults (age 18+) in private households interviewed in person with EPMH disability. Multinomial logistic regression model run in Stata with robust standard errors to control for weighting. ‘*’ significant at p<=.05; ‘**’ significant at p<=.01.
84
References
A Vision for Change (2006) Report of the Expert Group on Mental Health Policy. Dublin: Stationery Office.
Barry MM, van Lente E, Molcho M, Morgan K, McGee H, Conroy R, Watson D, Shelley E, Perry I (2009) SLÁN 2007 Mental Health and Social Well-being Report. Dublin: Department of Health and Children.
Breen, A., Langworthy, J. and Bagurst, J. (2005) Improved Early Pain Management for Musculoskeletal Disorders. Research Report 399 of the Institute for Musculoskeletal Research and Clinical Implementation for the Health and Safety Executive. Norwich: Stationery Office.
Breslau, J., Miller, E., Jin, R., Sampson, N. A., Alonso, J., Andrade, L. H., … Kessler, R. C. (2011). A multinational study of mental disorders, marriage, and divorce. Acta psychiatrica Scandinavica, 124(6), 474–86. doi:10.1111/j.1600-0447.2011.01712.x
Canuso CM and Pandina G (2007) “Gender and schizophrenia.” Psychopharmacol Bull. 40(4):178-90
Corrigan, P. W., & Watson, A. C. (2002). Understanding the impact of stigma on people with mental illness. World psychiatryX: official journal of the World Psychiatric Association (WPA), 1(1), 16–20. Retrieved from http://www.pubmedcentral.nih.gov/articlerender.fcgi?artid=1489832&tool=pmcentrez&rendertype=abstract
CSO (Central Statistics Office) (2008), National Disability Survey 2006, First Report, Dublin: Stationery Office.
CSO (Central Statistics Office) (2010), National Disability Survey 2006, Volume 2, Dublin: Stationery Office.
Department of Social Protection (2010) Report on the Desirability and Feasibility of Introducing a Single Social Assistance Payment for People of Working Age, Dublin: Department of Social Protection. Available at:http://www.welfare.ie/EN/Policy/CorporatePublications/Finance/exp_rev/Pages/WorkingAgeReport.aspx
European Commission (2005) Improving the mental health of the population: Towards a strategy on mental health for the European Union. Green Paper. Health and Consumer Protection Directorate, European Commission, Brussels

85
Evans-Lacko, S., Brohan, E., Mojtabai, R., & Thornicroft, G. (2012). “Association between public views of mental illness and self-stigma among individuals with mental illness in 14 European countries.” Psychological Medicine, 42(8), 1741-1752[1]doi: 10.1017/S0033291711002558
Friedli, Lynne (2009) Mental Health, resilience and inequalities. Geneva: World Health Organisation.
Gale, C. R., Batty, G. D., Osborn, D. P. J., Tynelius, P., & Rasmussen, F. (2014). “Mental disorders across the adult life course and future coronary heart disease: evidence for general susceptibility.” Circulation, 129(2), 186–93. doi:10.1161/CIRCULATIONAHA.113.002065
Goodman, A., Joyce, R., & Smith, J. P. (2011). The long shadow cast by childhood physical and mental problems on adult life. Proceedings of the National Academy of Sciences of the United States of America, 108(15), 6032–7. doi:10.1073/pnas.1016970108
Government of Ireland (2012) Pathways To Work: Government Policy Statement on Labour Market Activation, Dublin: Government of Ireland.
Gregg, P. (2008) Realising Potential: A Vision for Personalised Conditionality and Support – an Independent Report for the Department for Work and Pensions UK, London: Department of Work and Pensions.
Hannon, Frances (2007) Literature Review on Attitudes to Disability. Dublin : National Disability Authority.
Hannon, Frances (2011) Literature Review of International Evidence on Attitudes to Disability. Dublin: National Disability Authority
Horwitz, Allan V. and Wakefield, Jerome C. (2007) The Loss of Sadness: How Psychiatry Transformed Normal Sorrow into Depressive Disorder. New York: Oxford University Press, 2007, http://www.questia.com/read/119897893.
Horwitz; Allan V.; White, Helene Raskin; Howell-White, Sandra. (1996). ‘Becoming Married and Mental Health: A Longitudinal Study of a Cohort of Young Adults.’ Journal of Marriage and Family, 58(4), 895–907. Retrieved from http://www.jstor.org/discover/10.2307/353978?uid=1995744&uid=3738232&uid=2129&uid=2134&uid=2&uid=70&uid=3&uid=67&uid=23768&uid=62&sid=21103056664867
HSE Working Sub Group on Mental Health in Primary Care (2012) “Advancing the Shared Care Approach between Primary Care and Secondary Mental Health Services”. Dublin: Health Services Executive. Available at www.hse.ie.

86
Hyman, Steven E. (2010) “The Diagnosis of Mental Disorders: The Problem of Reification.” Annual Review of Clinical Psychology, 6:155–79.
Kendell, R.E., (2005) ‘The Myth of Mental Illness’ pp. 29-48 in Schaler, Jeffret A., (ed.) Szasz Under Fire: The Psychiatric Abolitionist Faces His Critics. (1st ed.). Illinois: Open Court.
Lingsoma, Susan (2008) “Invisible Impairments: Dilemmas of Concealment and Disclosure” Scandinavian Journal of Disability Research, 10 (1):2-16. DOI: 10.1080/15017410701391567
Link, Bruce G.; Yang, Lawrence H.; Phelan, Jo C. and Collins, Pamela Y. (2004). Measuring Mental Illness Stigma. Schizophrenia Buletin, 30 (3): 511-541.
Mayes, Rick and Horwitz, Allan V. (2005) DSM-III and the Revolution in the Classification of Mental Illness, Journal of the History of the Behavioral Sciences, 41(3), 249–267
Mental Health Commission (2013) Mental health Commission Annual Report 2013 Including Report of the Inspectorate of mental Health Services.
Mental Health Strategic Partnership (2013) Building Resilient Communities: Making every contact count for public mental health. Available at: http://www.mentalhealth.org.uk/content/assets/PDF/publications/building-resilient-communities.pdf
Musick, K., & Bumpass, L. (2012). Re-Examining the Case for Marriage: Union Formation and Changes in Well-Being. Journal of marriage and the family, 74(1), 1–18. doi:10.1111/j.1741-3737.2011.00873.x
National Disability Authority (2010) Disclosing Disability in the Workplace a Review of Literature and Practice in the Irish Public Sector. Dublin: National Disability Authority. Available at: http://www.nda.ie/
NESC (National Economic and Social Council) (2009), Well-Being Matters: A Social Report for Ireland (Volume II, no. 119, October 2009), Dublin: The National Economic and Social Council.
Naylor C, Parsonage M, McDaid D, Knapp M, Fossey M, Galea A (2012). Report. Long-term conditions and mental health. The cost of co- morbidities. London: The King's Fund and Centre for Mental Health. Available at http://www.kingsfund.org.uk.

87
Patja, K., Livanainen, M., Vesala, H., Oksanen, H. and Ruoppila, I. (2001), ‘Life expectancy of people with intellectual disability: a 35-year follow-up study’, Journal of Intellectual Disability Research, 44(5):591-599.
Russell, Helen; Watson, Dorothy and Banks, Joanne. (2011) Pregnancy at Work: A National Survey (Dublin: Crisis Pregnancy Programme and the Equality Authority)
See Change (2012) Irish Attitudes Towards Mental health Problems: Research 2012. (Available at www.seechange.ie)
Smith, J. P., & Smith, G. C. (2010). Long-term economic costs of psychological problems during childhood. Social science & medicine (1982), 71(1), 110–5. doi:10.1016/j.socscimed.2010.02.046
Szasz TS. (1960) ‘The Myth of Mental Illness.’ American Psychologist, 15:113-118.
Szasz TS. (1961) ‘The Myth of Mental Illness.’ The Myth of Mental Illness: Foundations of a Theory of Personal Conduct, New York: Hoeber-Harper
Szasz, T. (2003). Psychiatry and the control of dangerousness: on the apotropaic function of the term “mental illness.” Journal of Medical Ethics, 29(4), 227–230. doi:10.1136/jme.29.4.227
Teitler, J. O., & Reichman, N. E. (2008). Mental Illness as a Barrier to Marriage Among Unmarried Mothers. Journal of Marriage and Family, 70(3), 772–782. doi:10.1111/j.1741-3737.2008.00520.x
Thomas, C., Benzeval, M., & Stansfeld, S. A. (2005). Employment transitions and mental health: an analysis from the British household panel survey. Journal of epidemiology and community health, 59(3), 243–9. doi:10.1136/jech.2004.019778
Van Lente E, Barry MM, Molcho M, Morgan K, Watson D, Harrington J, McGee H. (2012) “Measuring population mental health and social well-being.” International Journal of Public Health. 57(2):421-30.
Watson, Dorothy; Kingston, Gillian and McGinnity, Frances. (2013) People with a Disability in the Irish Labour Market, Dublin: ESRI and Equality Authority.
Watson, Dorothy; Maître, Bertrand and Whelan, Christopher T. (2012) Work and Poverty in Ireland. Dublin: ESRI and Department of Social Protection.
Watson, Dorothy; Pichler, Florian and Wallace, Claire (2010) Subjective Wellbeing in Europe: Second European Quality of Life Survey. Dublin: European Foundation for the Improvement of Living and Working Conditions.

88
World Health Organization (2001a), International Classification of Functioning, Disability and Health, Geneva: WHO.
World Health Organization (2001b) Mental Health: New Understanding, New Hope. The World Health Report. Geneva: World Health Organization.
World Health Organization (2002) Prevention and promotion in mental health. Mental Health: Evidence and Research. Department of Mental Health and Substance Dependence. World Health Organization, Geneva
World Health Organization (2005a) Mental Health Declaration for Europe. Facing the Challenges, Building Solutions. Geneva: World Health Organization. Available at: www.euro.who.int/document/mnh/ edoc06.pdf (accessed January 2009)
World Health Organization (2005b) Mental Health Action Plan for Europe. Facing the Challenges, Building Solutions. World Health Organization, Geneva
World Health Organization (2008) Global Burden of Disease 2004, Update 2008. Geneva: World Health Organisation.
WRC Social and Economic Consultants (2008) Research Report on Acquired Disability and Employment (Report prepared for the Department of Enterprise, Trade and Employment). Available at http://www.djei.ie/labour/market/Reseach%20Report%20on%20acquired%20Disability%20and%20Employment.pdf.


