Telfor Journal, Vol. 8, No. 2, 2016. 87 Abstract — The long-term variability of electric field strength, obtained by band selective measurements for GSM 900MHz, DCS 1800MHz and UMTS 2100MHz downlink band in realistic mobile network environment, is considered in this paper. Intensive measurements were carried out for 7 days at each of 7 different locations in an urban area of Belgrade. The measurement results show that each day can be divided into two distinctive periods: one with higher levels of electric field (9h-23h) and one with lower ones (23h-9h). Regarding the days of the week, the results show that the weekend days are slightly different from the working days. Having in mind the need for determination of values averaged over the defined time period, additional uncertainty stemming from telecommunication traffic and transmitter functionalities must be taken into account. Mentioned uncertainty was determined for different time intervals of averaging: 10s, 30s, 1min, 6min, 15min, 30min, 1h, 3h, 5h, 10h, 14h and 24h. Results show that the uncertainty falls within a range of 4.04 – 12.11% (GSM), 2.71 – 7.92% (DCS) and 4.69 – 14.69% (UMTS), for 6 different categories defined with regard to the days of the week and the specific day periods. Keywords — electromagnetic fields, GSM, DCS, UMTS, base station, human exposure, long-term variability, measurement uncertainty. Paper received August 23, 2016; accepted September 23, 2016. Date of publication November 20, 2016. The associate editor coordinating the review of this manuscript and approving it for publication was Prof. Đorđe Paunović. This paper is a revised and expanded version of the paper presented at the 22nd Telecommunications Forum TELFOR 2014 [16]. This paper reports work undertaken in the context of the project LEXNET. LEXNET is a project supported by the European Commission in the 7th Framework Programme (GA n°318273). For further information, please visit www.lexnet-project.eu. Mladen Koprivica (corresponding author) is with the School of Electrical Engineering, University of Belgrade, Bul. kralja Aleksandra 73, 11120 Belgrade, Serbia (e-mail: [email protected]). Majda Petrić is with the School of Electrical Engineering, University of Belgrade (e-mail: [email protected]). Milica Popović is with the Telekom Srbija a.d, Bulevar umetnosti 16a, 11070 Beograd, Serbia (e-mail: [email protected]). Jelena Milinković is with the Telekom Srbija a.d. (e-mail: [email protected]). Aleksandar Nešković is with the School of Electrical Engineering, University of Belgrade (e-mail: [email protected]). I. INTRODUCTION ECENTLY finished EU FP7 project LEXNET (Low- EMF Exposure Future Networks) [1] examines the ways in which the deployment of existing and emerging wireless networks impacts the resulting radio frequency (RF) electromagnetic field (EMF) levels. The question of RF EMF exposure has so far been focused on the individual user, handling the exposure induced by personal devices and that of the network equipment separately. LEXNET project changed this by raising the issue of the exposure from the individual to the network level and by introducing exposure into network optimization. In accordance with that, LEXNET is defining a new exposure metric, called exposure index (EI), to evaluate the exposure induced by a wireless network communication at a whole [2]. Exposure induced by base station antennas, but also exposure induced by wireless devices, are taken into account to evaluate the average global exposure of the population in a specific geographical area. Wearable wideband exposimeter [3] and low- complexity exposimeter [4] are developed for band- selective measurement of electric field strength in frequency range considered within LEXNET project. Measurement results from exposimeter are intended to be used for EI calculation. In order to use these results in a proper way, the variability of electric field strength should be analyzed. Because of their wide distribution, public mobile systems (GSM - Global System for Mobile Communications, DCS - Digital Communication System, UMTS - Universal Mobile Telecommunication System, LTE - Long-Term Evolution) are the most important. In this paper we are focused on EMF of GSM 900MHz, DCS 1800MHz and UMTS 2100MHz downlink (DL) band in realistic network environment. Besides the well-known short-term fading, which generally characterizes propagation of radio waves, several additional effects also have significant influence on the EMF strength in the mobile networks environment. The most important effects are [5]: traffic load, automatic transmitter power control and discontinuous transmission. The total base station (BS) transmit power directly depends on the number and throughputs of the active connections, i.e. its traffic load. In the case of GSM/DCS Empirical Analysis of Electric Field Strength Long-Term Variability for GSM/DCS/UMTS Downlink Band Mladen Koprivica, Senior Member, IEEE, Majda Petrić, Student Member, IEEE, Milica Popović, Member, IEEE, Jelena Milinković, and Aleksandar Nešković, Senior Member, IEEE R
Transcript
Telfor Journal, Vol. 8, No. 2, 2016. 87
Abstract — The long-term variability of electric field
strength, obtained by band selective measurements for GSM 900MHz, DCS 1800MHz and UMTS 2100MHz downlink band in realistic mobile network environment, is considered in this paper. Intensive measurements were carried out for 7 days at each of 7 different locations in an urban area of Belgrade. The measurement results show that each day can be divided into two distinctive periods: one with higher levels of electric field (9h-23h) and one with lower ones (23h-9h). Regarding the days of the week, the results show that the weekend days are slightly different from the working days. Having in mind the need for determination of values averaged over the defined time period, additional uncertainty stemming from telecommunication traffic and transmitter functionalities must be taken into account. Mentioned uncertainty was determined for different time intervals of averaging: 10s, 30s, 1min, 6min, 15min, 30min, 1h, 3h, 5h, 10h, 14h and 24h. Results show that the uncertainty falls within a range of 4.04 – 12.11% (GSM), 2.71 – 7.92% (DCS) and 4.69 – 14.69% (UMTS), for 6 different categories defined with regard to the days of the week and the specific day periods.
Keywords — electromagnetic fields, GSM, DCS, UMTS, base station, human exposure, long-term variability, measurement uncertainty.
Paper received August 23, 2016; accepted September 23, 2016. Date
of publication November 20, 2016. The associate editor coordinating the review of this manuscript and approving it for publication was Prof. Đorđe Paunović.
This paper is a revised and expanded version of the paper presented at
the 22nd Telecommunications Forum TELFOR 2014 [16]. This paper reports work undertaken in the context of the project
LEXNET. LEXNET is a project supported by the European Commission in the 7th Framework Programme (GA n°318273). For further information, please visit www.lexnet-project.eu.
Mladen Koprivica (corresponding author) is with the School of
Electrical Engineering, University of Belgrade, Bul. kralja Aleksandra 73, 11120 Belgrade, Serbia (e-mail: [email protected]).
Majda Petrić is with the School of Electrical Engineering, University of Belgrade (e-mail: [email protected]).
Milica Popović is with the Telekom Srbija a.d, Bulevar umetnosti 16a, 11070 Beograd, Serbia (e-mail: [email protected]).
Jelena Milinković is with the Telekom Srbija a.d. (e-mail: [email protected]).
Aleksandar Nešković is with the School of Electrical Engineering, University of Belgrade (e-mail: [email protected]).
I. INTRODUCTION ECENTLY finished EU FP7 project LEXNET (Low-EMF Exposure Future Networks) [1] examines the
ways in which the deployment of existing and emerging wireless networks impacts the resulting radio frequency (RF) electromagnetic field (EMF) levels. The question of RF EMF exposure has so far been focused on the individual user, handling the exposure induced by personal devices and that of the network equipment separately. LEXNET project changed this by raising the issue of the exposure from the individual to the network level and by introducing exposure into network optimization. In accordance with that, LEXNET is defining a new exposure metric, called exposure index (EI), to evaluate the exposure induced by a wireless network communication at a whole [2]. Exposure induced by base station antennas, but also exposure induced by wireless devices, are taken into account to evaluate the average global exposure of the population in a specific geographical area.
Wearable wideband exposimeter [3] and low-complexity exposimeter [4] are developed for band-selective measurement of electric field strength in frequency range considered within LEXNET project. Measurement results from exposimeter are intended to be used for EI calculation. In order to use these results in a proper way, the variability of electric field strength should be analyzed. Because of their wide distribution, public mobile systems (GSM - Global System for Mobile Communications, DCS - Digital Communication System, UMTS - Universal Mobile Telecommunication System, LTE - Long-Term Evolution) are the most important. In this paper we are focused on EMF of GSM 900MHz, DCS 1800MHz and UMTS 2100MHz downlink (DL) band in realistic network environment.
Besides the well-known short-term fading, which generally characterizes propagation of radio waves, several additional effects also have significant influence on the EMF strength in the mobile networks environment. The most important effects are [5]: traffic load, automatic transmitter power control and discontinuous transmission.
The total base station (BS) transmit power directly depends on the number and throughputs of the active connections, i.e. its traffic load. In the case of GSM/DCS
Empirical Analysis of Electric Field Strength Long-Term Variability for GSM/DCS/UMTS
Member, IEEE, Jelena Milinković, and Aleksandar Nešković, Senior Member, IEEE
R
88 Telfor Journal, Vol. 8, No. 2, 2016.
system, depending on the traffic load, transmitters are turned on or off. On the other side, in the UMTS and LTE system, the increase in the traffic load forces transmitters to operate at higher powers and vice-versa.
BS traffic load varies during the day and depends on: the applied tariff profiles, the time of the day, the day of the week, the location of BS... As a rule, mobile operator configures the BS in such a way that under certain conditions it satisfies the traffic demands in the so-called busy hour (the sliding 60-minute period during which the maximum total traffic load occurs in a given 24-hour period). It should be noted that even if the BS is operating with maximum traffic load, the number of active traffic channels is not constant because of the stochastic nature of call/session initiations and call/session durations.
For each individual connection, the BS transmit power is automatically adjusted depending on the propagation conditions in which the mobile terminal resides. Automatic power control is implemented with a frequency of about 2Hz in GSM/DCS system, with 1500Hz in UMTS and with 1000Hz in LTE system.
During an established voice call, when the user makes a normal pause in speech, the base station temporarily stops transmission (in GSM/DCS system transmitters are turned off, while the traffic channel is not transmitted in the UMTS and LTE systems) [5]. Typically, due to this functionality, for each voice connection, the BS transmitters are inactive approximately 40-50% of time.
All the previously mentioned effects lead to greater instability of the DL EMF strength at the measurement position. For this reason, an additional uncertainty stemming from telecommunication traffic and transmitter functionalities must be taken into account. The value of this type of uncertainty was determined on the basis of daily traffic profiles obtained by measurements.
In previous works, the authors of [6]-[7] analyzed long-term variability of electric field strength obtained by broadband measurements. In these cases, it was not possible to distinguish between public mobile systems, what is necessary for EI calculation.
Long-term variability of electric field strength originating only from a single BS has been analyzed in [8]-[10] for GSM, and in [11] for GSM, DCS and UMTS. The exposimeter is intended to be used for band-selective measurements and it essentially measures a number of electric field components originating from distinct BSs simultaneously. These components vary differently from each other, because the BSs are placed at different geographical locations, and carry different traffic loads. This leads to the necessity to analyse the long-term variability of band selective measurements with regard to real network environment, what was done for GSM in [10].
For this reason intensive measurements of electromagnetic field strength in GSM 900MHz, DCS 1800MHz and UMTS 2100MHz DL band were carried out in an urban area of Belgrade (Serbia). Band selective measurements for GSM, DCS and UMTS for the area of Paris (France) were conducted in [12]. The results of this
paper are used to make a comparison of average exposure in France and Serbia [13].
The paper is organised as follows. At first, the used measurement systems and measurement methodology are introduced. Measurement results are given in the next section. Thereafter, the uncertainty caused by telecommunication traffic and transmitter functionalities was considered. Finally, conclusions are derived in the last section.
II. MEASUREMENT SYSTEM AND METHODOLOGY For the analysis which is the subject of the paper, the
calibrated Rohde&Schwarz (RS) portable EMF measurement system was used. Spectrum analyzer RS FSH6 and measuring antenna RS TS-EMF, in the form of an isotropic probe, are the main measuring components of the system. This system is designed for frequency selective measurement of electric field strength in the frequency range from 30MHz to 3GHz. The system was controlled with the software for long-term measurements White Tigress Baby – Measurements, which is specifically developed in Radio-communications Laboratory, School of Electrical Engineering, University of Belgrade.
Measurements were conducted with the sampling interval of 10 seconds and RMS detector was used. The following parameters were used for the measurements:
• Center frequency - 947.5MHz and Channel bandwidth - 25MHz (GSM band),
• Center frequency - 2140MHz and Channel bandwidth - 60MHz (DCS band), and
• Center frequency - 1830.1MHz and Channel bandwidth - 50.2MHz (UMTS band).
Intensive measurements of electromagnetic field strength were carried out at 7 different locations in an urban area of Belgrade. Five locations were chosen as measurement locations in indoor environments and two in outdoor. Measurements were performed in time intervals of 7 days at each location. During the 7-day measurements the system was stationary with an antenna mounted on a tripod. Therefore, in this manner, measurement results for GSM 900MHz, DCS 1800MHz and UMTS 2100MHz DL bands were obtained.
III. MEASUREMENT RESULTS For the sake of brevity, only figures with measurement
results for one test location are shown in Fig. 1-9. Specifically, Fig. 1-3 represent electric field strength time variability for the whole GSM 900MHz, DCS 1800MHz and UMTS 2100MHz DL bands, respectively. Despite the fact that the measurement results are shown for only one test location, discussions and conclusions are based on the results obtained for all seven locations.
The measurement results of electric field strength for all three systems clearly show that for each day two different periods can be observed - one with the higher levels and one with the lower levels. Electric field strength variations had very similar daily behaviour for all seven locations. At the beginning of the day (midnight), the strength of electric field decreases. After that there is a period,
Koprivica et al.: Empirical Analysis of Electric Field Strength Long-Term Variability 89
approximately from 2:00 to 7:00, in which electric field strength has the lowest level. Beginning with the morning, the electric field strength starts to increase until approximately 9:00 when it reaches the level of the active part of a day. The active part of the day has the highest values of electric field strength and lasts until approximately 23:00. At the very end of the day, electric field strength starts to decrease. In accordance with the observed behaviour of electric field strength the day was divided into two distinctive periods: “active hours” (9h-23h) and “night hours” (23h-9h).
Fig. 1. Time variability of the electric field strength for
GSM 900MHz DL band.
Fig. 2. Time variability of the electric field strength for
DCS 1800MHz DL band.
Fig. 3. Time variability of the electric field strength for
UMTS 2100MHz DL band. As expected, measurement results show that the short-
term variability during the “active hours” is higher than during the “night hours”. However, when local average value of this variability is considered, it is the opposite case. Local average values are fairly stable during the whole periods of “active hours” and have the highest levels. Some exceptions are detected for UMTS, where the distinctive periods with a significant increase of electric
field strength during the “active hours” are observed. As already stated, during the “night hours” the short-
term variability of the electric field strength is lower than during the “active hours”. As opposite to “active hours” the local average values have significant changes for “night hours”. At the beginning of “night hours” a significant decrease of local average values can be detected. Also, at the end of the “night hours” a significant increase of local average values can be obtained. On the other hand, period in the middle of the “night hours” (approximately from 2:00 to 7:00) is the time of inactivity in which the short-term variability, as well as local average values of the electric field strength, have their lowest values.
Regarding the days of the week, it can be concluded that the weekend days are slightly different from the working days. These differences are manifested in the smaller differences between average values of the electric field strength of the “active hours” and “night hours” during the weekend, than for the working days.
For a more detailed analysis two specific categories for a 7-day week were distinguished: “working days” (Monday to Friday) and “all days” (Monday to Sunday). According to this, 6 different categories were analysed:
• “all days – all hours”, • “working days – all hours”, • “all days – active hours”, • “working days – active hours”, • “all days – night hours” and • “working days – night hours”.
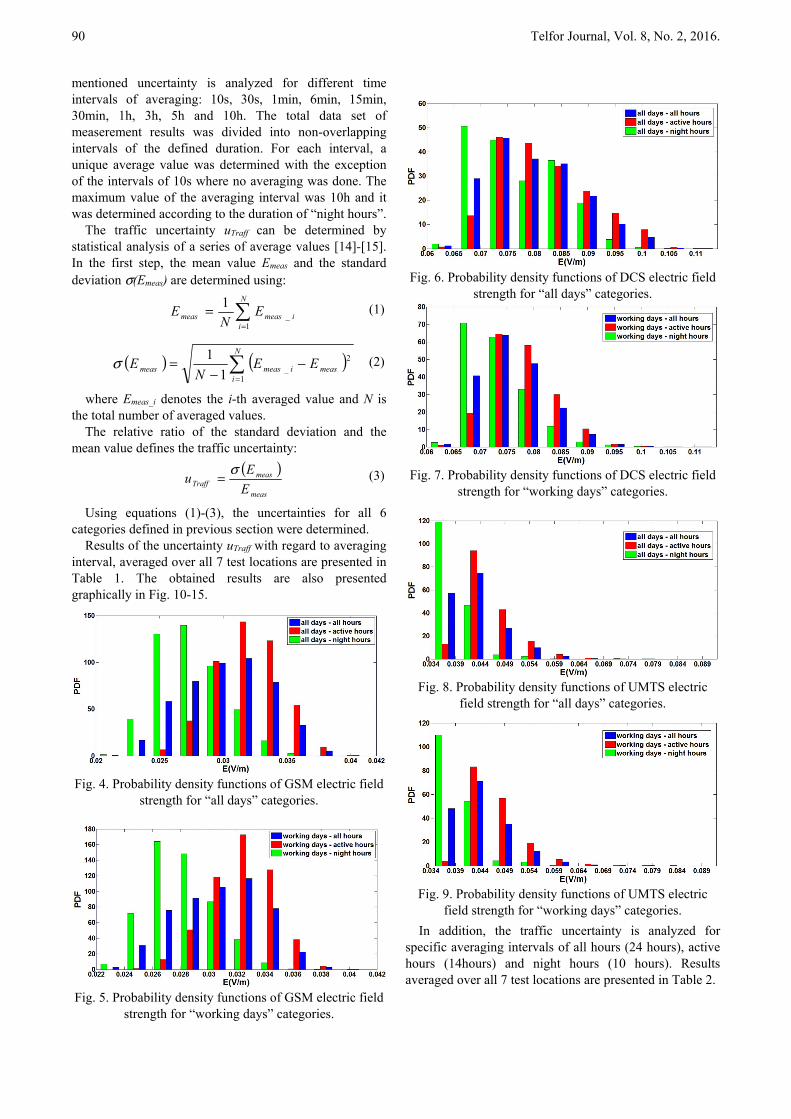
Probability density functions of the measured electric field strength for the previously defined 6 categories are presented in Fig. 4 and 5 for GSM, Fig. 6 and 7 for DCS, and Fig. 8 and 9 for UMTS. In the case of GSM and DCS, probability density functions for “all hours” have behaviour which is similar to a normal distribution (for “all days” category, as well as for “working days” category). On the other hand, for UMTS, probability density function for “all hours” has behaviour similar to a log-normal distribution for “all days” category, as well as for “working days” category. Considering probability density functions for “active hours” and “night hours” separately, it can be concluded that both types of distributions have a behaviour similar to “all hours” distributions, with the only difference in average values. The distributions for GSM and DCS have a behaviour similar to a normal distribution, while the UMTS distribution behaviour is again similar to a log-normal distribution.
IV. UNCERTAINTY CAUSED BY TELECOMMUNICATION TRAFFIC AND TRANSMITTER FUNCTIONALITIES
With regard to the previously analyzed effects, which lead to greater variability of the DL electromagnetic field strength, an additional uncertainty caused by telecommunications traffic and transmitter functionalities (traffic uncertainty - uTraff) must be taken into account for the calculation of EI [2].
For each of the 6 previously defined categories, the
90 Telfor Journal, Vol. 8, No. 2, 2016.
mentioned uncertainty is analyzed for different time intervals of averaging: 10s, 30s, 1min, 6min, 15min, 30min, 1h, 3h, 5h and 10h. The total data set of measerement results was divided into non-overlapping intervals of the defined duration. For each interval, a unique average value was determined with the exception of the intervals of 10s where no averaging was done. The maximum value of the averaging interval was 10h and it was determined according to the duration of “night hours”.
The traffic uncertainty uTraff can be determined by statistical analysis of a series of average values [14]-[15]. In the first step, the mean value Emeas and the standard deviation σ(Emeas) are determined using:
=
=N
iimeasmeas E
NE
1_
1 (1)
( ) ( )=
−−
=N
imeasimeasmeas EE
NE
1
2_1
1σ (2)
where Emeas_i denotes the i-th averaged value and N is the total number of averaged values.
The relative ratio of the standard deviation and the mean value defines the traffic uncertainty:
( )meas
measTraff E
Eu σ= (3)
Using equations (1)-(3), the uncertainties for all 6 categories defined in previous section were determined.
Results of the uncertainty uTraff with regard to averaging interval, averaged over all 7 test locations are presented in Table 1. The obtained results are also presented graphically in Fig. 10-15.
Fig. 4. Probability density functions of GSM electric field
strength for “all days” categories.
Fig. 5. Probability density functions of GSM electric field
strength for “working days” categories.
Fig. 6. Probability density functions of DCS electric field
strength for “all days” categories.
Fig. 7. Probability density functions of DCS electric field
strength for “working days” categories.
Fig. 8. Probability density functions of UMTS electric
field strength for “all days” categories.
Fig. 9. Probability density functions of UMTS electric
field strength for “working days” categories. In addition, the traffic uncertainty is analyzed for
specific averaging intervals of all hours (24 hours), active hours (14hours) and night hours (10 hours). Results averaged over all 7 test locations are presented in Table 2.
Koprivica et al.: Empirical Analysis of Electric Field Strength Long-Term Variability 91
TABLE 1: TRAFFIC UNCERTAINTY uTraff (%) WITH REGARDS TO TIME AVERAGING INTERVALS
V. DISCUSSION AND CONCLUSION The long-term variability of electric field strength
obtained by band selective measurements for GSM 900MHz, DCS 1800MHz and UMTS 2100MHz DL band, with regard to real network environment, is considered in this paper. Measurement results of the electric field strength, with regard to field strength variations, show that a day can be divided into two distinctive periods: “active hours” (9h-23h) with higher values and “night hours” (23h-9h) with lower ones. On the other side, as expected, seven day measurements show that two specific categories for a 7-day week can be distinguished: working days (Monday to Friday) and weekends (Saturday to Sunday).
Fig. 10. Traffic uncertainty uTraff with regard to time
averaging intervals for “all days” - GSM
Fig. 11. Traffic uncertainty uTraff with regard to time averaging intervals for “working days” – GSM.
Fig. 12. Traffic uncertainty uTraff with regard to time
averaging intervals for “all days” - DCS.
Fig. 13. Traffic uncertainty uTraff with regard to time averaging intervals for “working days” – DCS.
92 Telfor Journal, Vol. 8, No. 2, 2016.
Fig. 14. Traffic uncertainty uTraff with regard to time
averaging intervals for “all days” – UMTS.
Fig. 15. Traffic uncertainty uTraff with regard to time averaging intervals for “working days” – UMTS.
In order to use the band selective measurements obtained with exposimeter for EI assessment, the variability of electric field strength is analysed. An additional uncertainty caused by telecommunication traffic and transmitter functionalities is calculated for 6 different categories regarding the days of the week and specific day periods. Having in mind that for the EI determination, the values of electric field strength averaged over the defined time periods are needed, the traffic uncertainty is calculated for different time intervals of averaging: 10s, 30s, 1min, 6min, 15min, 30min, 1h, 3h, 5h and 10h. In this way, it can be determined how this type of variability of electric field strength affects the uncertainty of EI.
The results show that uncertainty decreases with increasing of averaging interval, as expected. For example, in category “all days – all hours” for UMTS, the uncertainty is decreasing from 14.58% calculated for a 10s-interval to 7.7% for a 10h-interval. In category “all days – all hours” for GSM, the uncertainty is decreasing from 11.74% for a 10s-interval to 6% calculated for a 10h- interval. For DCS, in category “all days – all hours”, the uncertainty is decreasing from 7.73% for a 10s-interval to 4.8% calculated for a 10h-interval. For all other categories similar behavior can be observed.
Comparing the uncertainty ranges corresponding to different systems it can be concluded that the highest values are for the UMTS, with the range of uncertainties of 4.69–14.69%. The range of uncertainties for the GSM is 4.04–12.11%. DCS has the lowest values of uncertainties, the range is 2.71–7.92%.
This behaviour was expected. Besides the voice communications, UMTS system is often used for data communications, which causes higher variability of electric field strength and consequently higher uncertainty. On the other hand, GSM system provides service to broader user population, mostly for voice communications
and lower for data communications. Finally, DCS part of the system has the lowest traffic share and mostly provides voice services for users. On the other hand, data communications are a small portion of traffic in DCS.
In addition, the uncertainty caused by telecommunication traffic and transmitter functionalities was analyzed for averaging intervals of all hours (24 hours), active hours (14hours) and night hours (10 hours). These results show that the uncertainty for values averaged over all hours (all day), active hours and night hours are below 5%.
REFERENCES [1] M. Tesanovic, E. Conil, A. De Domenico, R. Agüero, F. Freudenstein,
L.M. Correia, S. Bories, L. Martens, P.M. Wiedemann, J. Wiart, “Wireless networks and EMF-paving the way for low-EMF networks of the future: the LEXNET project”, IEEE Vehicular Technology Magazine, vol. 9, no. 2, pp. 20-28, 2014.
[2] N. Varsier, D. Plets, Y. Corre, G. Vermeeren, W. Joseph, S. Aerts, L. Martens, J. Wiart, “A novel method to assess human population exposure induced by a wireless cellular network”, Bioelectromagnetics, vol. 36, no. 6, pp. 451-463, 2015.
[3] M. S. Anwar, Y. Toutain, S. Bories, D. Dassonville, Y. Fernandez, A. Sanchez, “Wearable wideband exposimeter design for electromagnetic field exposure measurements”, in Proc. 44th European Microwave week (EUMC 2014), Rome, 2014, pp. 703-706.
[4] L. Diez., S. Anwar, L. Rodriguez de Lope, M. Le Hennaff, Y. Toutain, R. Agüero, “Design and integration of a low-complexity dosimeter into the Smart City for EMF assessment”, in Proc. European Conference on Networks and Communications (EUCNC 2014), Bologna, 2014, pp. 1-5.
[5] A.R. Mishra, (ed) “Advanced Cellular Network Planning and Optimisation: 2G/2.5G/3G Evolution to 4G.” John Wiley & Sons 2007.
[6] M.G. Sánchez, I. Cuiñas, A.V. Alejos, “Electromagnetic field level temporal variation in urban areas”, Electronics Letters, vol. 45, no. 1, pp. 233-234, 2005.
[7] J. Vázquez, E. Olías, A. Barrado, J. Pleite, “Analysis of long time series of environmental electromagnetic field”, Electronics Letters, vol. 39, no. 1, pp. 125-127, 2003.
[8] S. Miclaus, P. Bechet, M. Gheorghevici, “Long-term exposure to mobile communication radiation: An analysis of time-variability of electric field level in GSM900 downlink channels”, Radiation Protection Dosimetry, vol. 154, no. 2, pp. 164-173, 2013.
[9] P. Bechet, S. Miclaus, “An improved procedure to accurately assess the variability of the exposure to electromagnetic radiation emitted by GSM base station antennas”, Measurement Science and Technology, vol. 24, no. 1, pp. 1-9, 2013.
[10] S. Miclaus, P. Bechet, C. Iftode, “The application of a channel-individualized method for assessing long-term, realistic exposure to radiofrequency radiation emitted by mobile communication base station antennas”, Measurement, vol. 46, no. 3, pp. 1355-1362, 2013.
[11] W. Joseph, L. Verloock, “Influence of mobile phone traffic on base station exposure of the general public”, Health Physics, vol. 99, no. 5, pp. 631-638, 2010.
[12] Z. Mahfouz, A. Gati, D. Lautru, M-F. Wong, J. Wiart, V.F. Hanna, “Influence of traffic variations on exposure to wireless signals in realistic environments”, Bioelectromagnetics, vol. 33, no. 4, pp. 288-297, 2012.
[13] Y. Huang, N. Varsier, S. Nikšić, E. Kocan, M. Pejanovic-Djurisic, M. Popović, M. Koprivica, A. Nešković, J. Milinković, A. Gati, C. Person, J. Wiart “Comparison of average global exposure of population induced by a macro 3G network in different geographical areas in France and Serbia”, Bioelectromagnetics, vol. 37, no. 6, pp. 382-390, 2016.
[14] Joint Committee for Guides in Metrology (BIPM, IEC, IFCC, ILAC, ISO, IUPAC, IUPAP and OIML), “JCGM 100:2008, Evaluation of measurement data – Guide to the Expression of Uncertainty in Measurement”, 2008.
[15] G. Basso, “Uncertainty in the measurement of electromagnetic field with isotropic broadband sensor and selective E&H field analyzer”, NARDA Safety Solutions, 2009.
[16] M. Koprivica, M. Petrić, M. Popović, J. Milinković, S. Nikšić and A. Nešković, “Long-term variability of electromagnetic field strength for GSM 900MHz downlink band in Belgrade urban area,” Telecommunications Forum Telfor (TELFOR), 2014 22nd, Belgrade, 2014, pp. 9-12.