Robert Chote (IFS)Robert Chote (IFS)Paul Johnson (IFS & Frontier)Gareth Myles (Exeter & IFS)y ( )
The Mirrlees Review• Review of tax design from first principles
– For modern open economies in general and UK in particular – Reflect changes in the world, changes in our understanding
and increased empirical knowledge
• Two volumes:- ‘Dimensions of Tax Design’: a set of 13 chapters on particular g p p
areas co-authored by international experts and IFS researchers, along with expert commentaries (MRI)
- ‘Tax by Design’: an integrated picture of tax design and reform, written by the editors (MRII)h // if k/ i l R i / bli i– http://www.ifs.org.uk/mirrleesReview/publications
• MRI on the web and at OUP.
Dimensions of Tax Design: commissioned chapters and expert commentaries (1)
• The base for direct taxationJames Banks and Peter Diamond; Commentators: Robert Hall; John Kay; Pierre Pestieau
• Means testing and tax rates on earningsMike Brewer, Emmanuel Saez and Andrew Shephard; Commentators: Hilary Hoynes; Guy Laroque; Robert Moffitt
• Value added tax and excisesIan Crawford, Michael Keen and Stephen Smith; Commentators: Richard Bird; Ian Dickson/David White; Jon Gruber
• Environmental taxationDon Fullerton, Andrew Leicester and Stephen Smith; Commentators: Lawrence Goulder; Agnar SandmoLawrence Goulder; Agnar Sandmo
• Taxation of wealth and wealth transfersRobin Boadway, Emma Chamberlain and Carl Emmerson; Commentators: Helmuth Cremer; Thomas Piketty; Martin WealeCommentators: Helmuth Cremer; Thomas Piketty; Martin Weale
Dimensions of Tax Design: commissioned chapters and expert commentaries (2)
• International capital taxationRachel Griffith, James Hines and Peter Birch Sørensen; Commentators: Julian Alworth; Roger Gordon and Jerry Hausman; g y
• Taxing corporate income Alan Auerbach, Mike Devereux and Helen Simpson; Commentators: Harry Huizinga; Jack MintzHarry Huizinga; Jack Mintz
• Taxation of small businessesClaire Crawford and Judith Freedman
• The effect of taxes on consumption and savingOrazio Attanasio and Matthew Wakefield
• Administration and compliance Jonathan Shaw Joel Slemrod and JohnAdministration and compliance, Jonathan Shaw, Joel Slemrod and John Whiting; Commentators: John Hasseldine; Anne Redston; Richard Highfield
• Political economy of tax reform, James Alt, Ian Preston and LukePolitical economy of tax reform, James Alt, Ian Preston and Luke Sibieta; Commentator: Guido Tabellini
labour supply responses for individuals and families
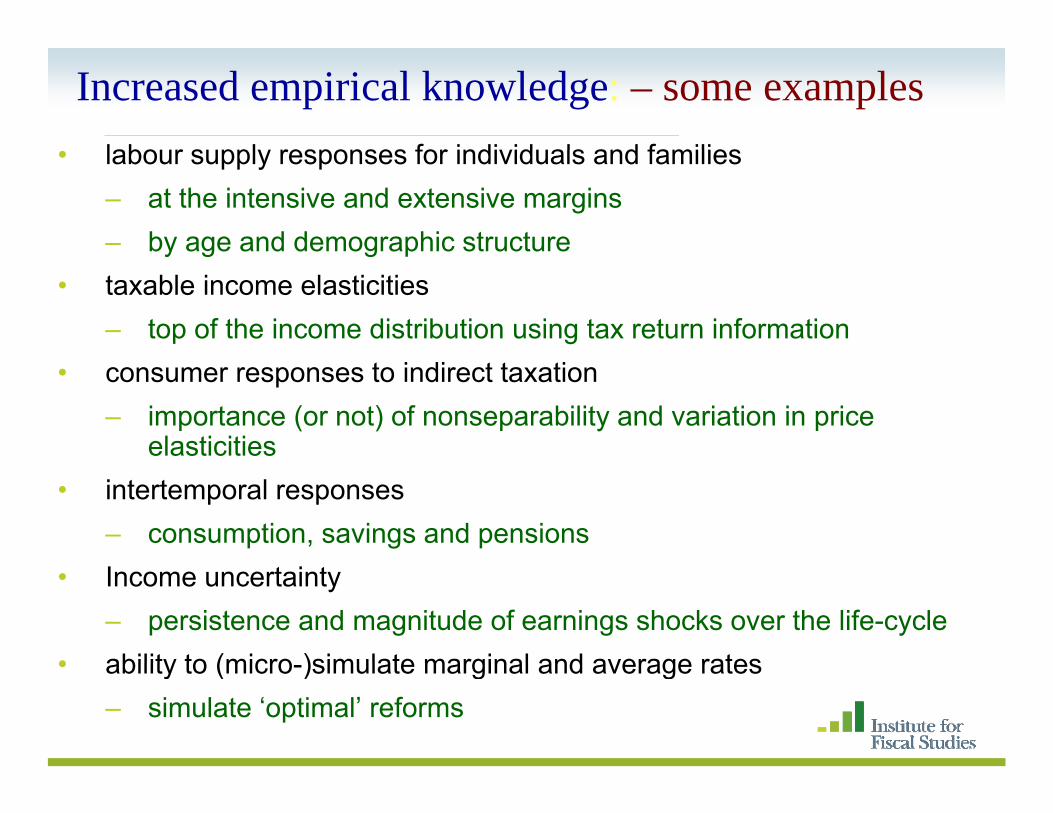
Increased empirical knowledge: – some examples• labour supply responses for individuals and families
– at the intensive and extensive margins– by age and demographic structurey g g p
• taxable income elasticities– top of the income distribution using tax return information
• consumer responses to indirect taxation– importance (or not) of nonseparability and variation in price
elasticities• intertemporal responses
– consumption, savings and pensions• Income uncertainty
– persistence and magnitude of earnings shocks over the life-cycle• ability to (micro )simulate marginal and average rates• ability to (micro-)simulate marginal and average rates
– simulate ‘optimal’ reforms
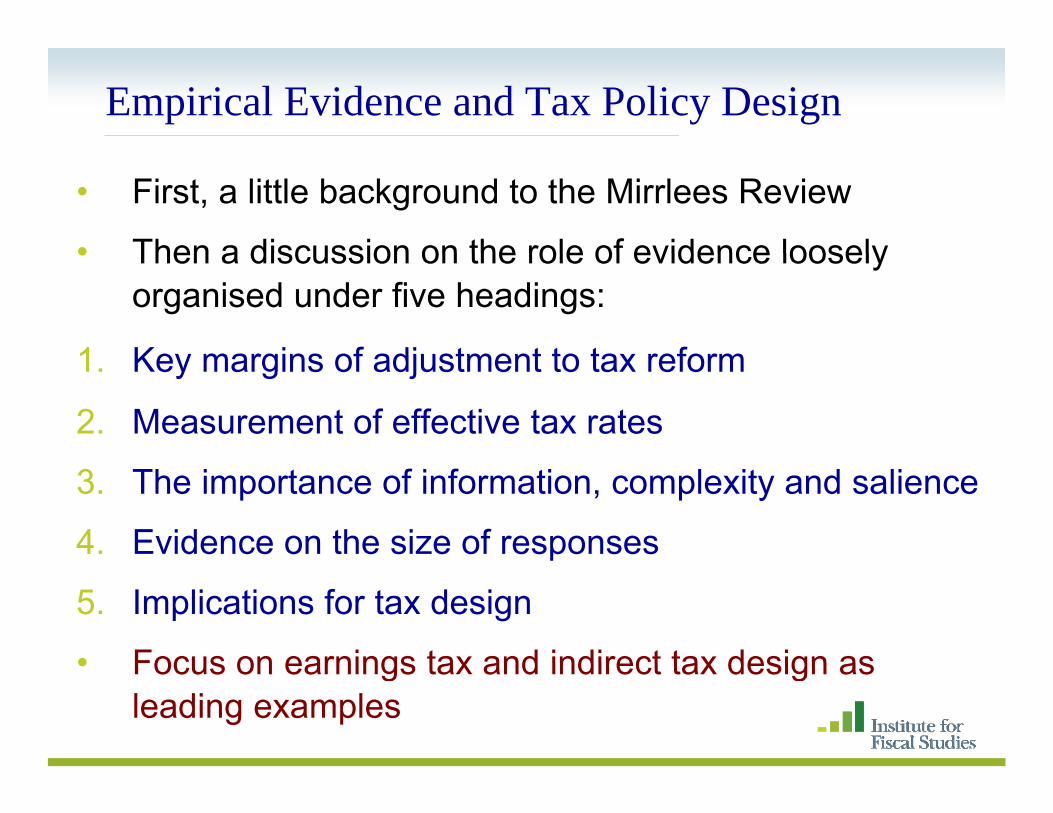
Empirical Evidence and Tax Policy Design• Here I will focus on earnings taxation and indirect
taxation:
• Leading examples of the mix of theory and evidence
K i li ti f t d i• Key implications for tax design
• Earnings taxation, in particular, takes most of the strain in distributional adjustments of other parts of the reform packagep g
E t i d i t i i f l b l
Key Margins of Adjustment
• Extensive and intensive margins of labour supply
• Its not all the extensive margin
– Intensive and extensive margins both matter
– They matter for tax policy evaluation and design
– And they matter in different ways by age and y y y gdemographic groups
The extensive – intensive distinction is important for a number of reasonsfor a number of reasons
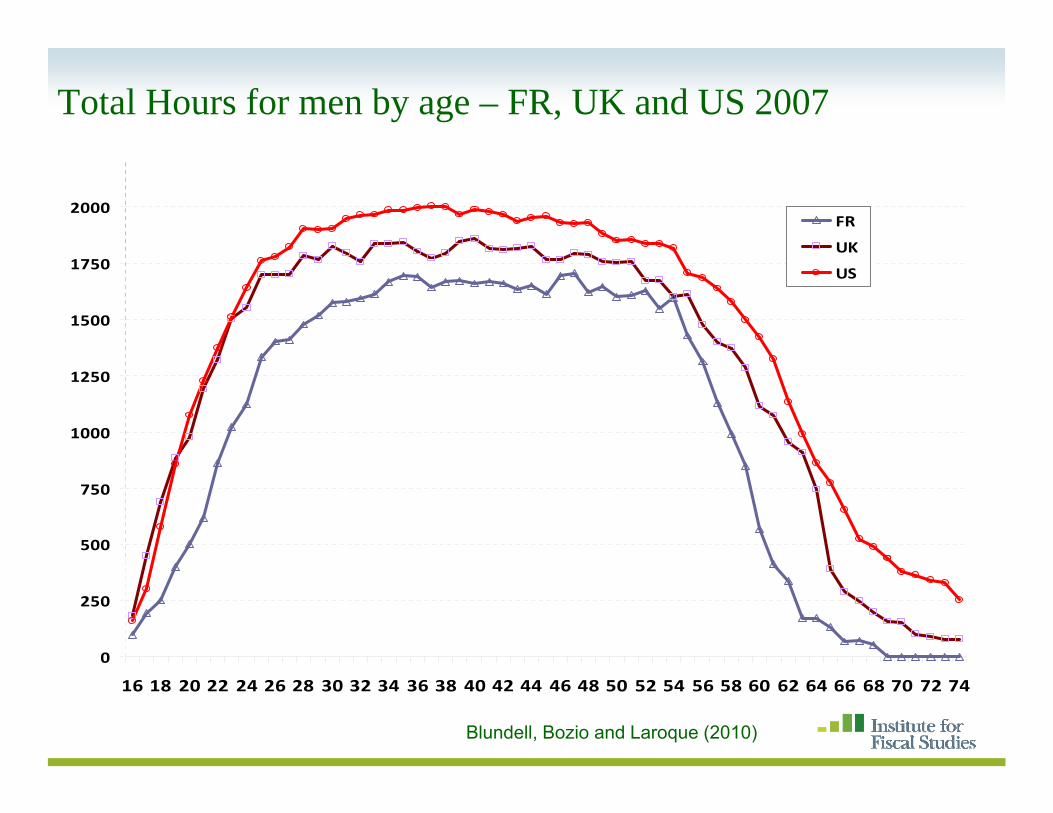
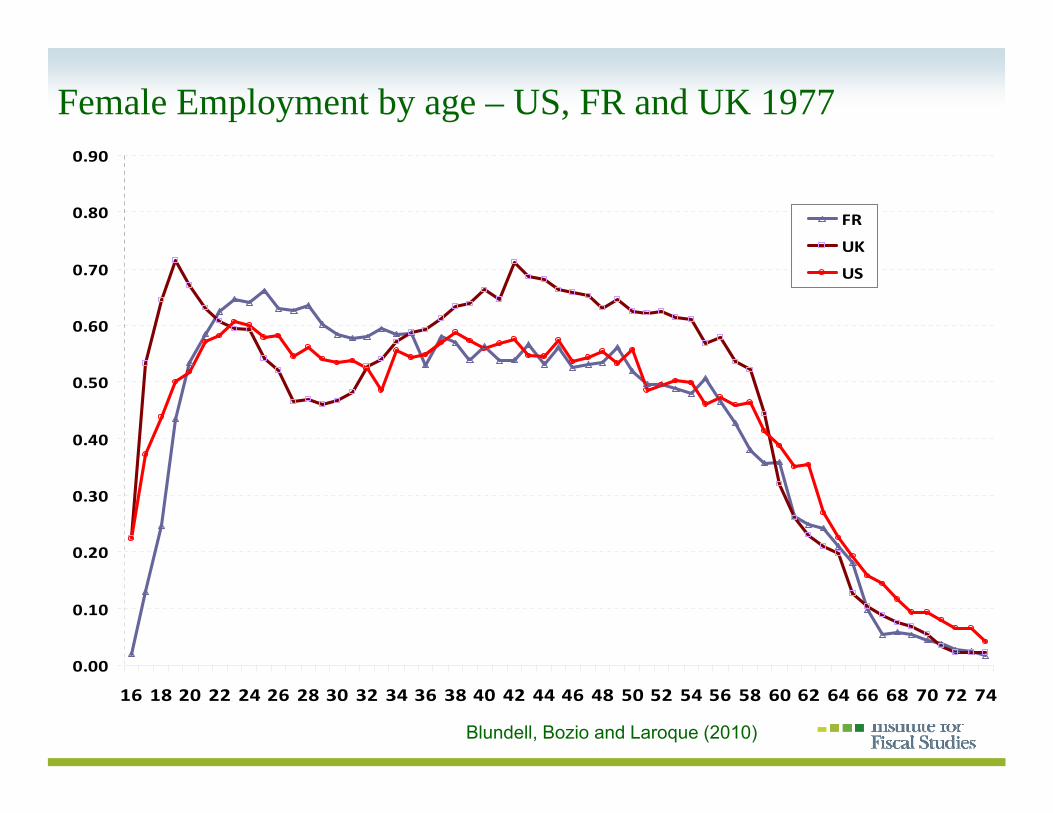
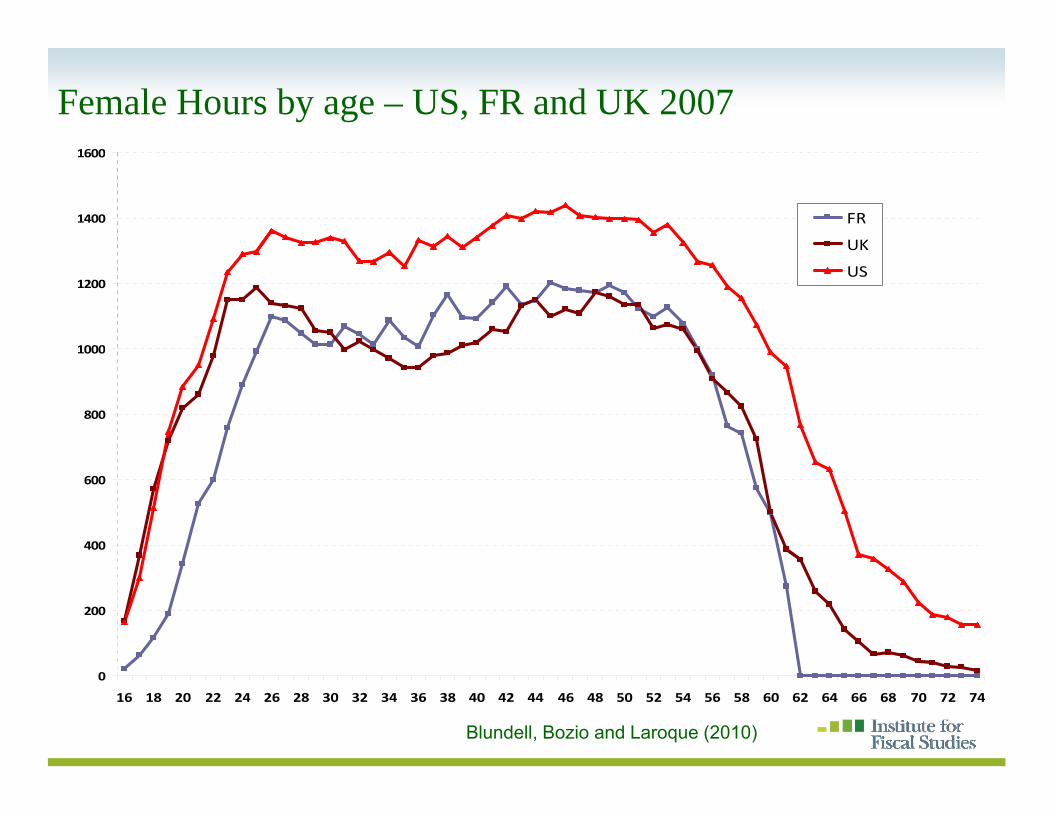
• Understanding responses to tax and welfare reformH k R Wi ll hi hli ht th– Heckman, Rogerson, Wise, .. all highlight the importance of extensive labour supply margin Blundell Bozio and Laroque (2010)– Blundell, Bozio and Laroque (2010)
• The extensive and intensive elasticities are also key parameters in the recent literature on tax design usedparameters in the recent literature on tax design – used heavily in the Mirrlees Review.
• But these elasticities have changed over time and the• But these elasticities have changed over time and the relative importance of the extensive margin is specific to particular groups
• I’ll examine a specific example in more detail in what follows
Why is this distinction important for tax design?Some key lessons from recent tax design theory (Saez• Some key lessons from recent tax design theory (Saez, Laroque, ..)
• A ‘large’ extensive elasticity at low earnings can ‘turn g y garound’ the impact of declining social weights– implying a higher transfer to low earning workers than
those out of workthose out of work– a role for earned income tax credits
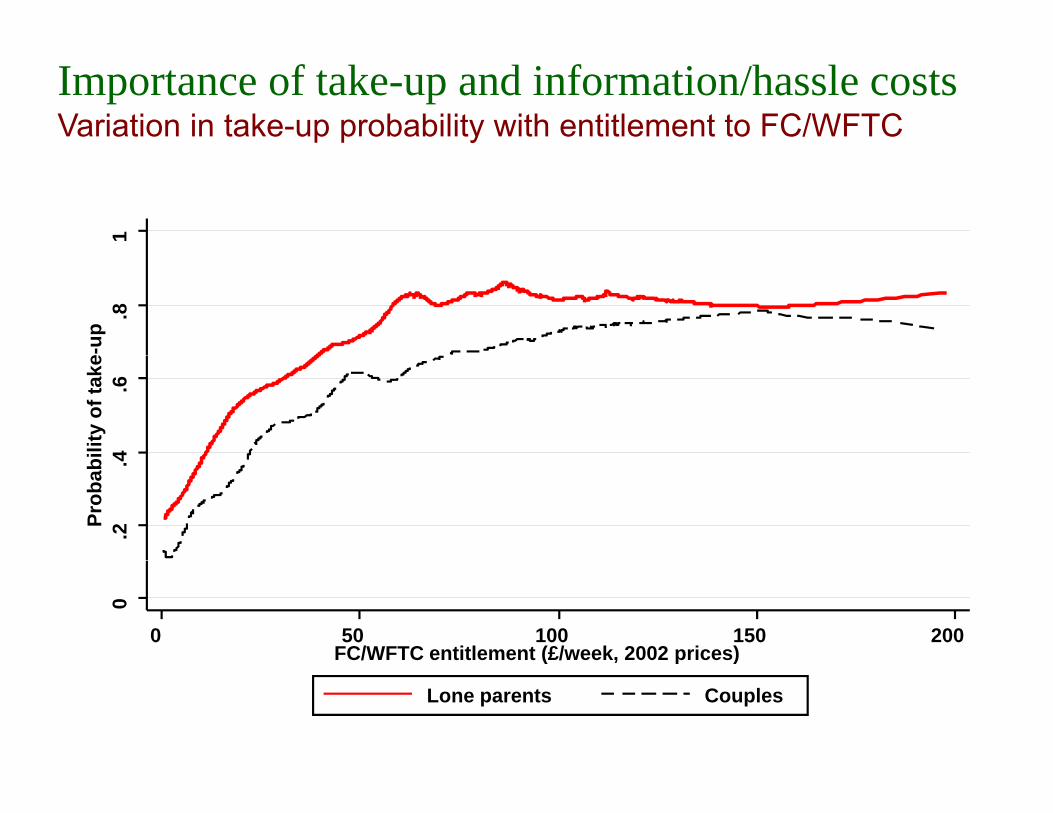
• But how do individuals perceive the tax rates on earnings• But how do individuals perceive the tax rates on earnings implicit in the tax credit and benefit system - salience?– are individuals more likely to ‘take-up’ if generosity
increases?• Importance of margins other than labour supply/hours
U f t bl i l ti iti t id h i f t• Use of taxable income elasticities to guide choice of top tax rates
• The first step (impact) is a positive analysis of household
An Analysis in Two Steps
• The first step (impact) is a positive analysis of household decisions. There are two dominant empirical approaches to the measurement of the impact of tax reform – both prove useful:
• 1. A ‘quasi-experimental’ evaluation of the impact of q p phistoric reforms /and randomised experiments
• 2. A ‘structural’ estimation based on a general discrete choice model with (unobserved) heterogeneity
• The second step (optimality) is the normative analysis or ti l li l ioptimal policy analysis
– Examines how to best design benefits, in-work tax credits and earnings tax rates with (un)observedcredits and earnings tax rates with (un)observed heterogeneity and unobserved earnings ‘capacity’
Alternative approaches to measuring the impact:St t l d l• Structural model– Simulate effect of actual or hypothetical reforms– Useful for optimal design too, but, robust?
• Quasi-experiment/Difference-in-differences– Compares outcomes of eligibles and non-eligibles and
estimates ‘average’ impact of past reform– Only indirectly related to what is needed for optimal
design
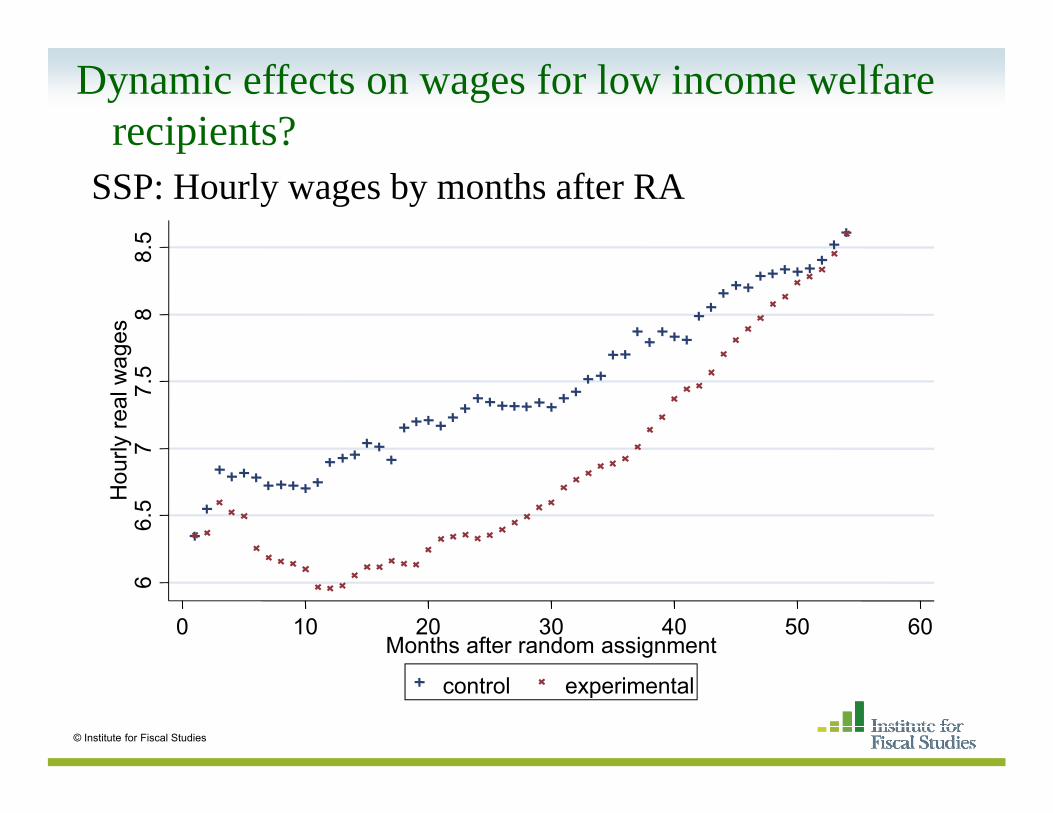
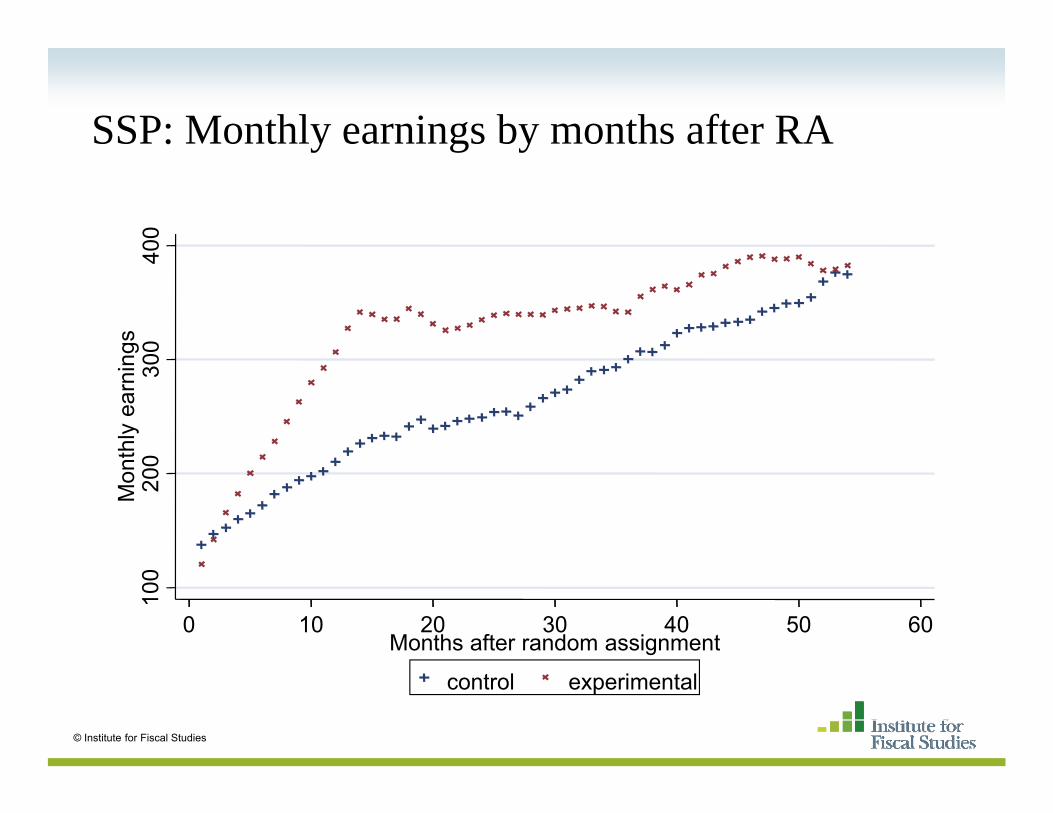
• Randomised experiment? SSP?
Focus here on tax rates on lower incomes
Main defects in current welfare/benefit systems
• Participation tax rates at the bottom remain very high in UK and elsewhere
• Marginal tax rates are well over 80% for some lowMarginal tax rates are well over 80% for some low income working families because of phasing-out of means-tested benefits and tax creditsmeans tested benefits and tax credits
– Working Families Tax Credit + Housing Benefit in UK
– and interactions with the income tax system
– for example, we can examine a typical budget p , yp gconstraint for a single mother…
The interaction of WFTC with other benefits in the UK
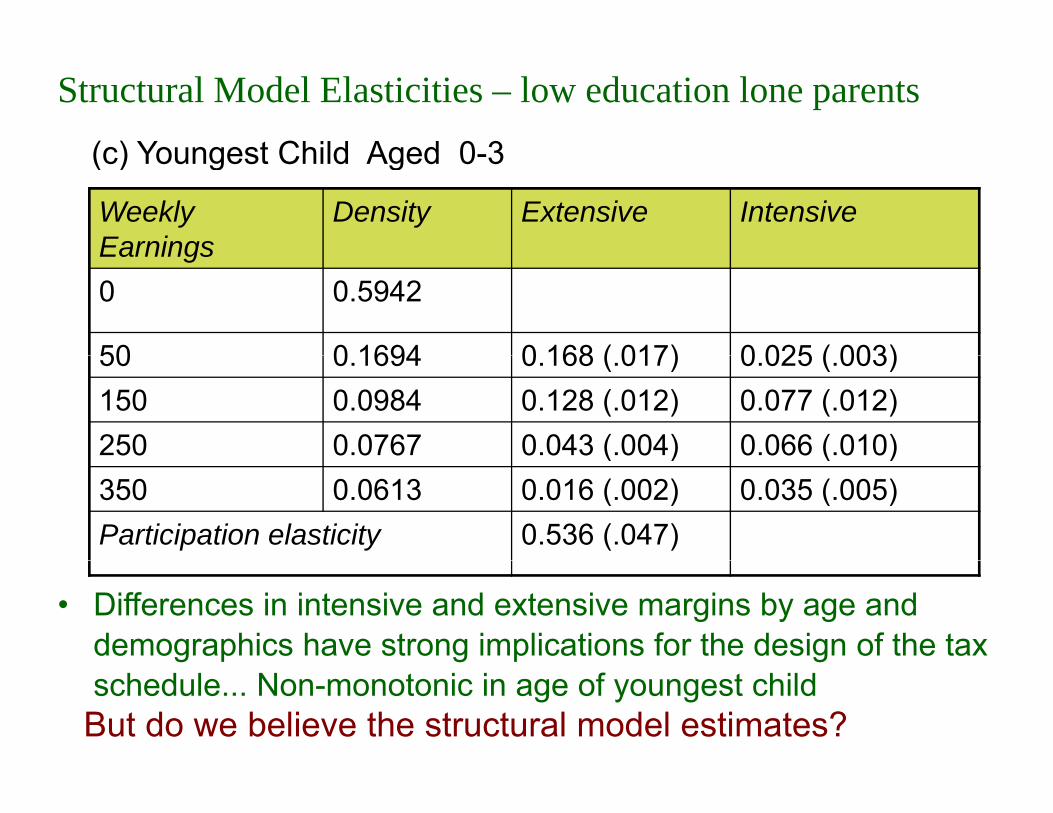
• Differences in intensive and extensive margins by age and demographics have strong implications for the design of the tax schedule... Non-monotonic in age of youngest child
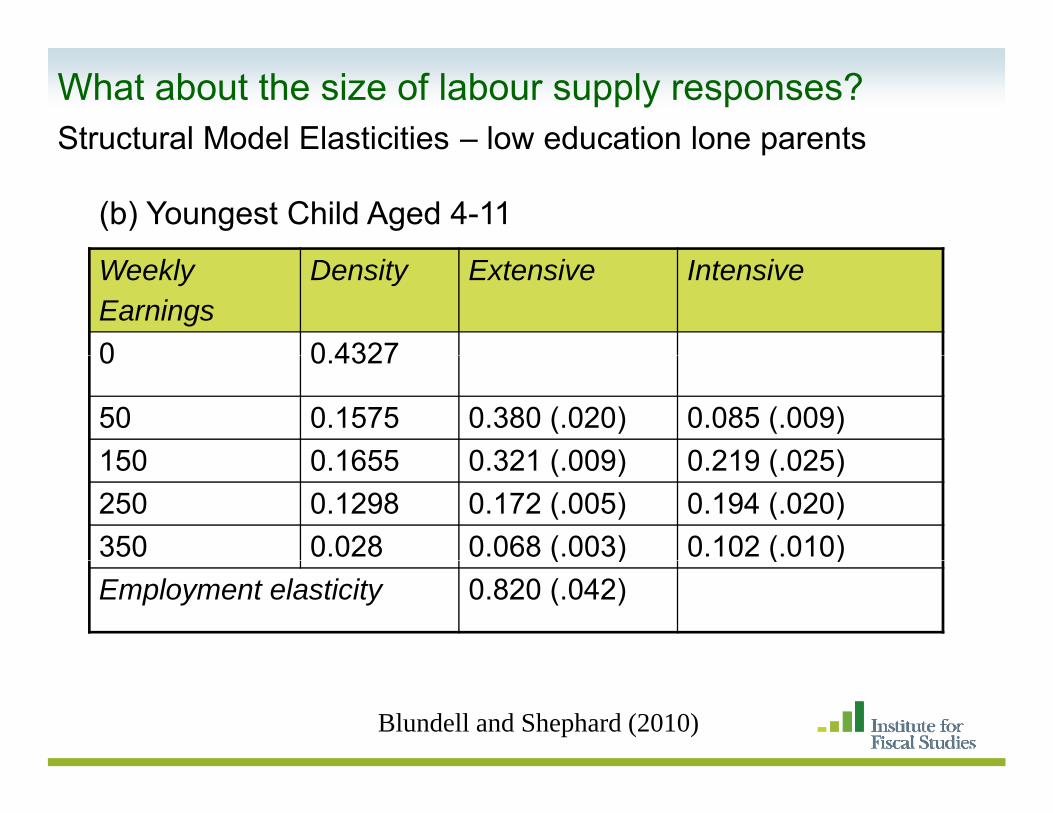
But do we believe the structural model estimates?
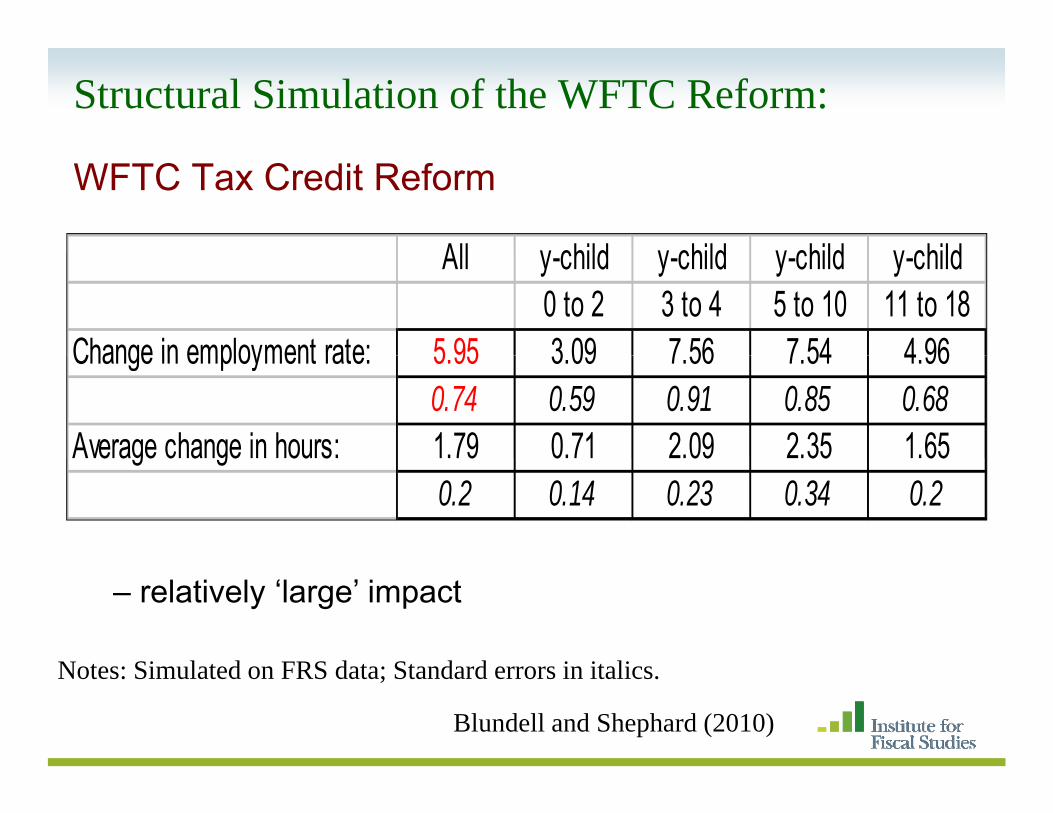
Structural Simulation of the WFTC Reform:
WFTC Tax Credit Reform
All y child y child y child y childAll y-child y-child y-child y-child0 to 2 3 to 4 5 to 10 11 to 18
Average change in hours: 1.79 0.71 2.09 2.35 1.65Average change in hours: 1.79 0.71 2.09 2.35 1.650.2 0.14 0.23 0.34 0.2
N t Si l t d FRS d t St d d i it li
– relatively ‘large’ impact
Notes: Simulated on FRS data; Standard errors in italics.
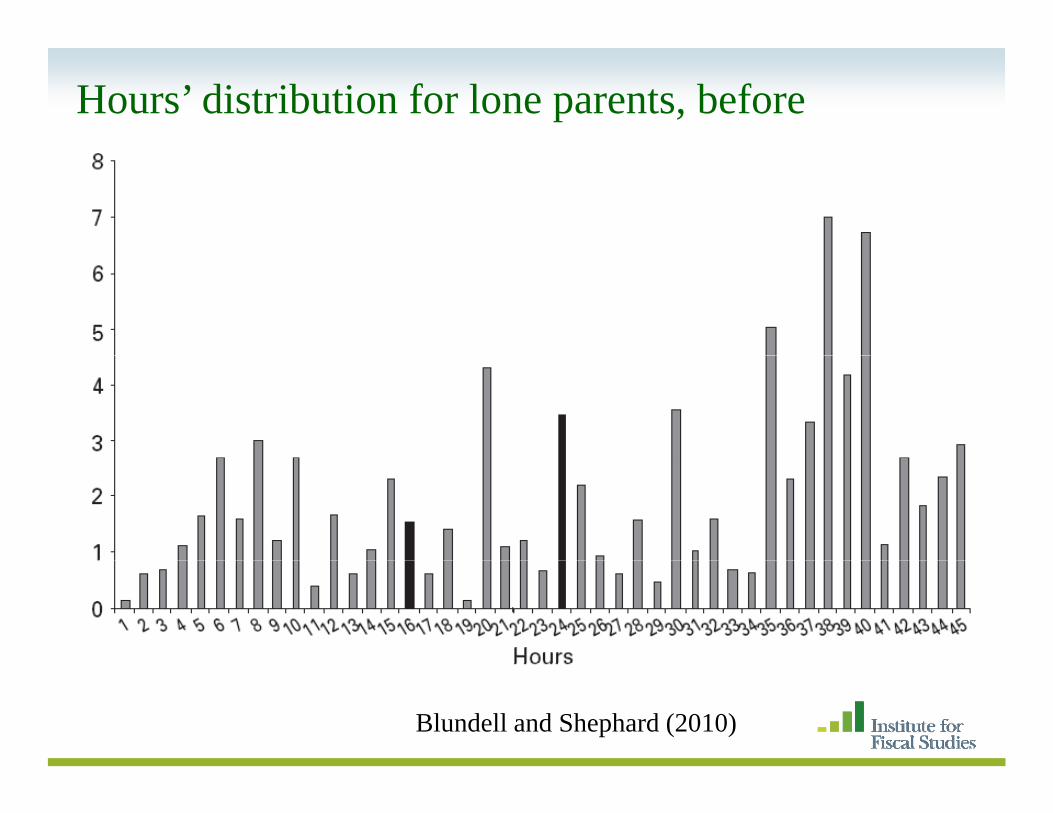
Blundell and Shephard (2010)
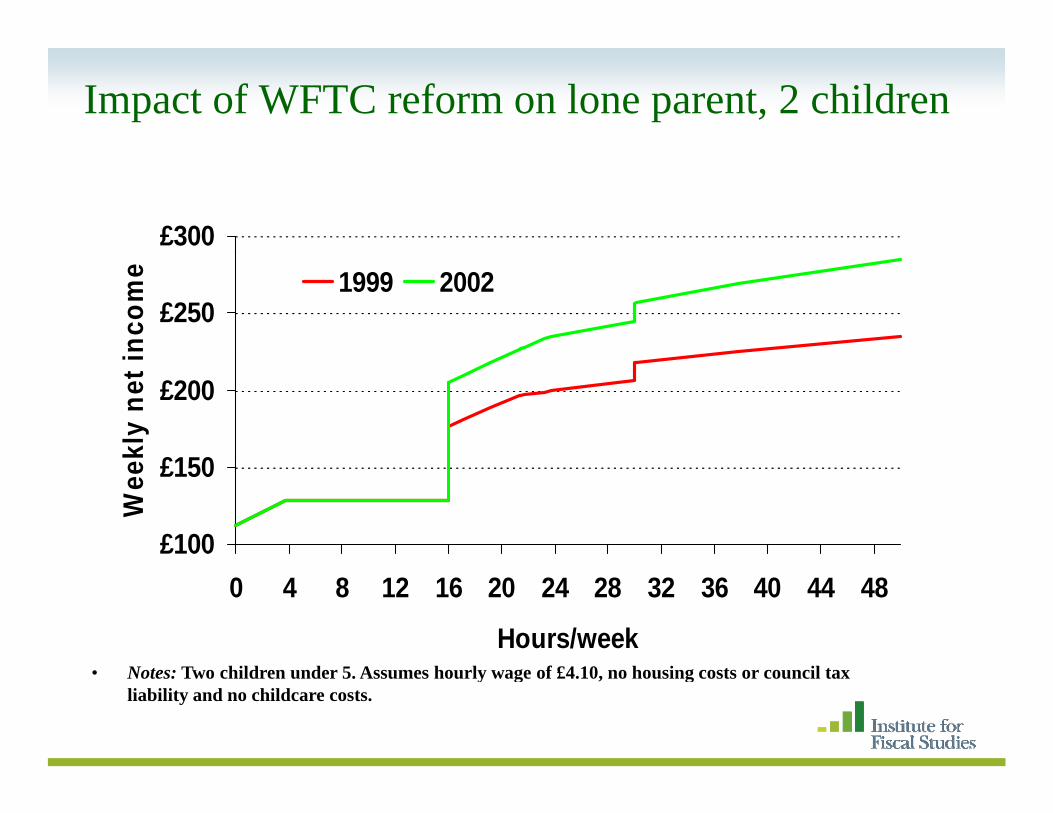
Impact of WFTC reform on lone parent, 2 children
£300
£250
ncom
e 1999 2002
£150
£200
kly
net i
£100
£150
Wee
0 4 8 12 16 20 24 28 32 36 40 44 48
Hours/week• Notes: Two children under 5. Assumes hourly wage of £4.10, no housing costs or council tax
liability and no childcare costs.
Impact of WFTC and IS reforms on lone parent, 2 children
£300
£250
inco
me 1999 2002
£150
£200
ekly
net
i
£100
£150
Wee
0 4 8 12 16 20 24 28 32 36 40 44 48
Hours/week• Notes: Two children under 5 Assumes hourly wage of £4 10 no housing costs or council tax• Notes: Two children under 5. Assumes hourly wage of £4.10, no housing costs or council tax
liability and no childcare costs.
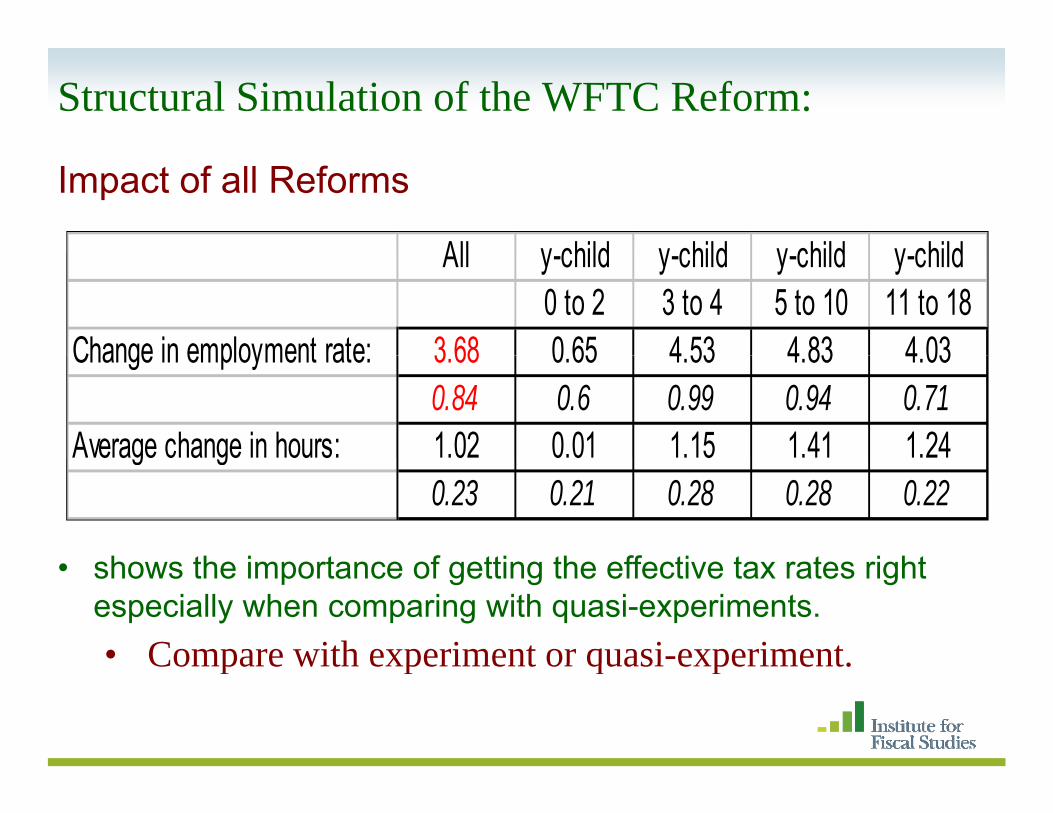
Structural Simulation of the WFTC Reform:
Impact of all Reforms
All y child y child y child y childAll y-child y-child y-child y-child0 to 2 3 to 4 5 to 10 11 to 18
Average change in hours: 1.02 0.01 1.15 1.41 1.24e age c a ge ou s 0 0 0 50.23 0.21 0.28 0.28 0.22
h th i t f tti th ff ti t t i ht• shows the importance of getting the effective tax rates right especially when comparing with quasi-experiments.• Compare with experiment or quasi-experiment.Compare with experiment or quasi experiment.
Evaluation of the ‘ex-ante’ structural model
• The diff-in-diff impact parameter can be identified from the structural evaluation model
• Simulated diff-in-diff parameter• The structural model then defines the average impact of the g p
policy on the treated as:
( ) Pr[ 0 | , 1] Pr[ 0 , 0]SEM X h X D h X Dα = > = − > =
• Compare simulated diff-in-diff moment with diff-in-diff ( ) [ 0 | , ] [ 0 , 0]SEM h hα
1 1 1 0DD T t T t∫ ∫ ∫ ∫ ∫1, 1 1, 0
0 1 0 0
( , , 1) ( , , 0)DD T t T tSEM X X
X X X
T T
f X D dF dF f X D dF dFε εε ε
α ε ε= = = == = − =
⎡ ⎤
∫ ∫ ∫ ∫ ∫
∫ ∫ ∫0, 1 0, 0( , , 0) ( , , 0)T t T tX X
X
f X D dF dF f X D dF dFε εε ε
ε ε= = = =⎡ ⎤− = − =⎢ ⎥⎣ ⎦∫ ∫ ∫
Evaluation of the ex-ante model
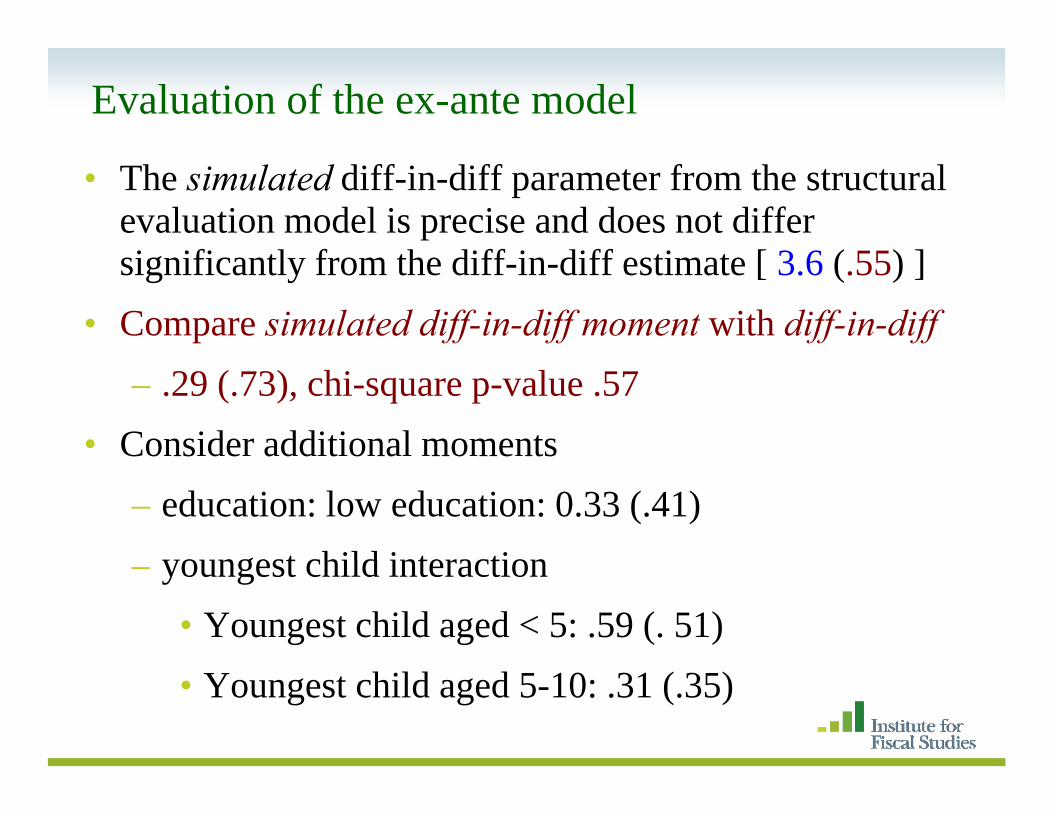
• The simulated diff-in-diff parameter from the structural evaluation model is precise and does not differ i ifi tl f th diff i diff ti t [ 3 6 ( 55) ]significantly from the diff-in-diff estimate [ 3.6 (.55) ]
• Compare simulated diff-in-diff moment with diff-in-diff – .29 (.73), chi-square p-value .57
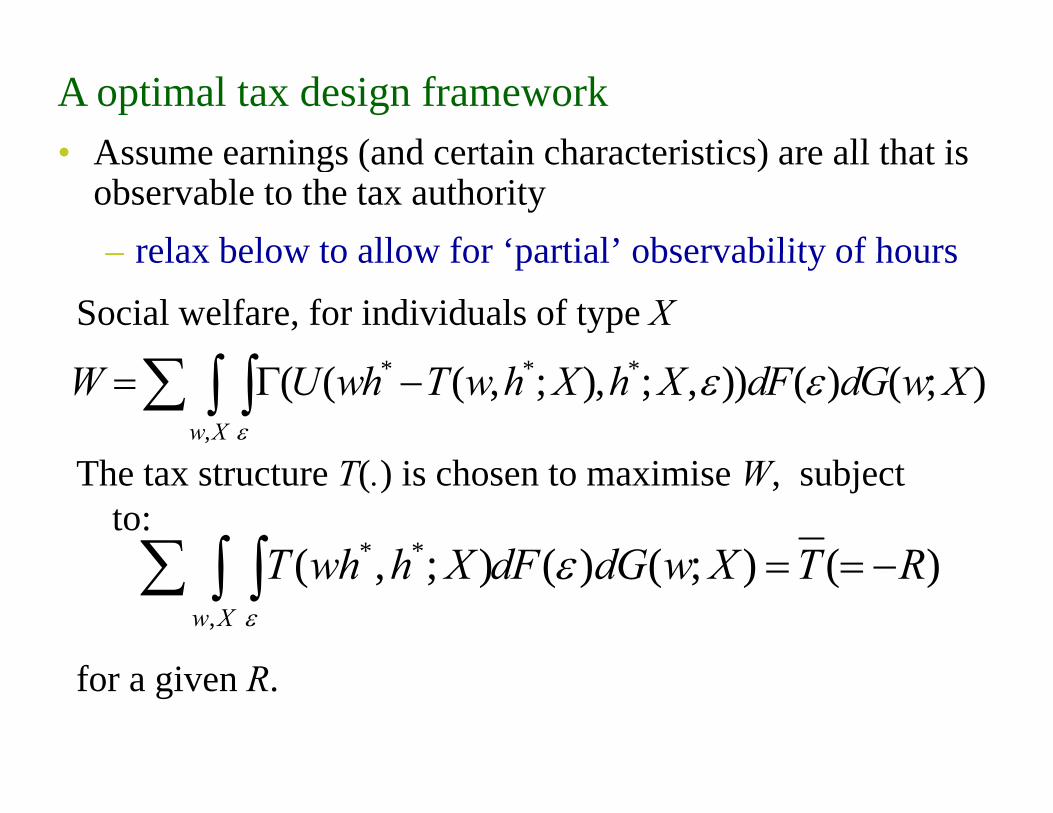
• Assume earnings (and certain characteristics) are all that isA optimal tax design framework• Assume earnings (and certain characteristics) are all that is
observable to the tax authorityrelax below to allow for ‘partial’ observability of hours– relax below to allow for partial observability of hours
∫ ∫Social welfare, for individuals of type X
* * *
,
( ( ( , ; ), ; , )) ( ) ( ; )w X
W U wh T w h X h X dF dG w Xε
ε ε= Γ −∑ ∫ ∫The tax structure T(.) is chosen to maximise W, subject
to:* *( ; ) ( ) ( ; ) ( )T wh h X dF dG w X T Rε∑ ∫ ∫
,
( , ; ) ( ) ( ; ) ( )w X
T wh h X dF dG w X T Rε
ε = = −∑ ∫ ∫for a given R.
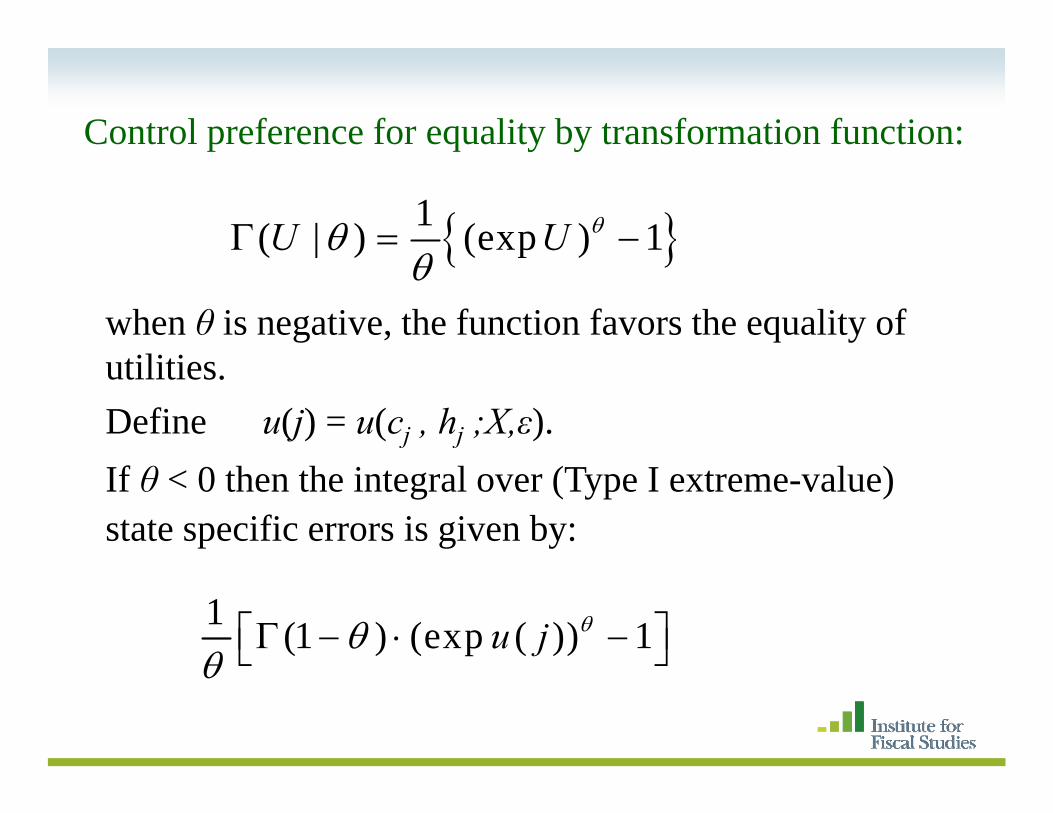
Control preference for equality by transformation function:p q y y
{ }1( | ) (exp ) 1U U θθΓ = −{ }( | ) ( p )θ
when θ is negative, the function favors the equality of ili iutilities.
Define u(j) = u(cj , hj ;X,ε). If θ < 0 then the integral over (Type I extreme-value) state specific errors is given by:
1 (1 ) (exp ( )) 1u j θθθ⎡ ⎤Γ − ⋅ −⎣ ⎦θ ⎣ ⎦
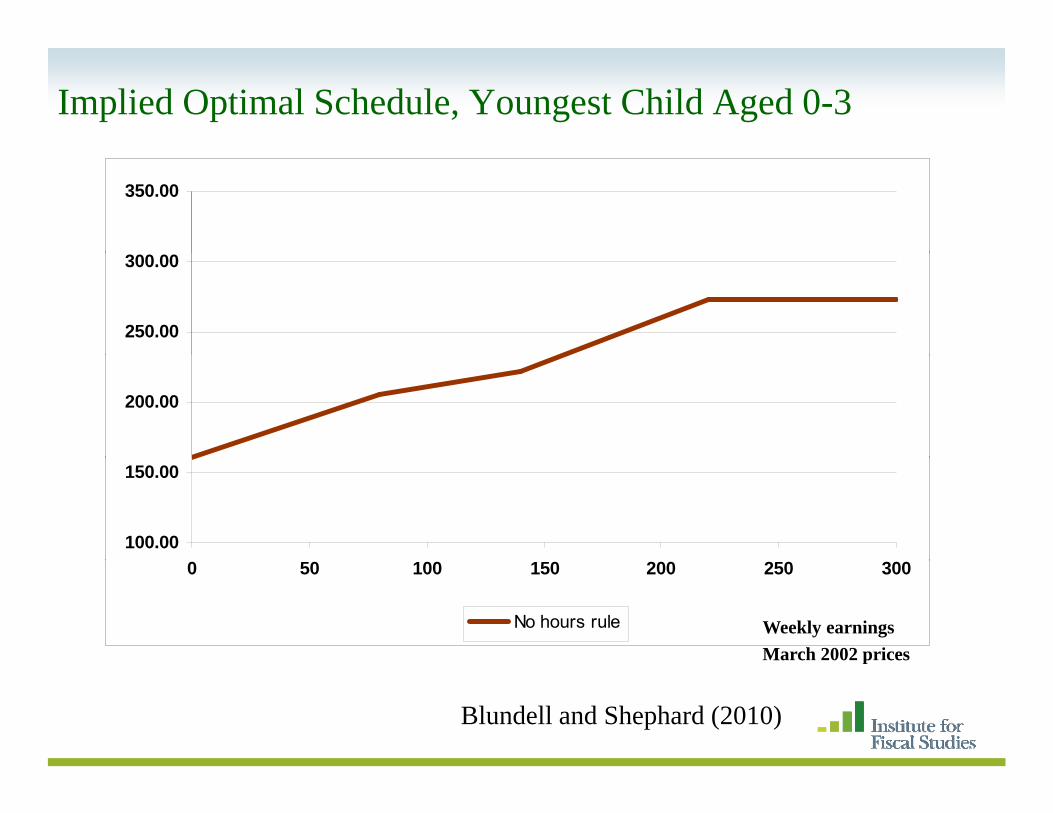
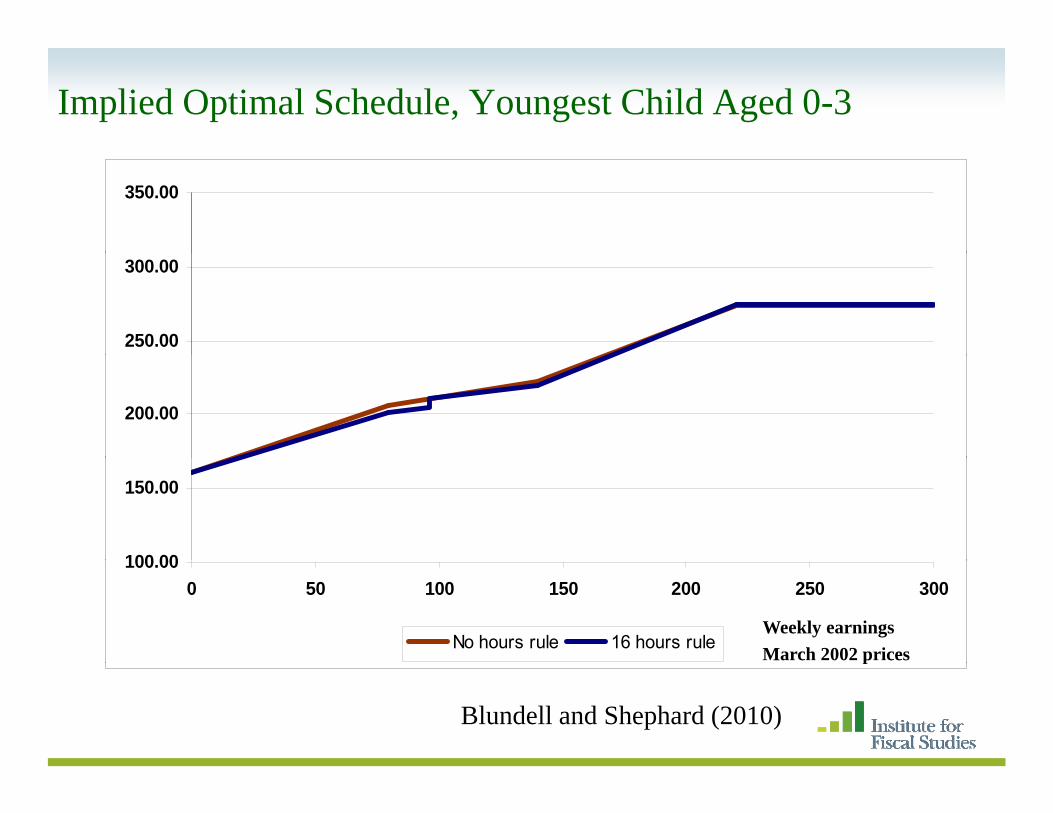
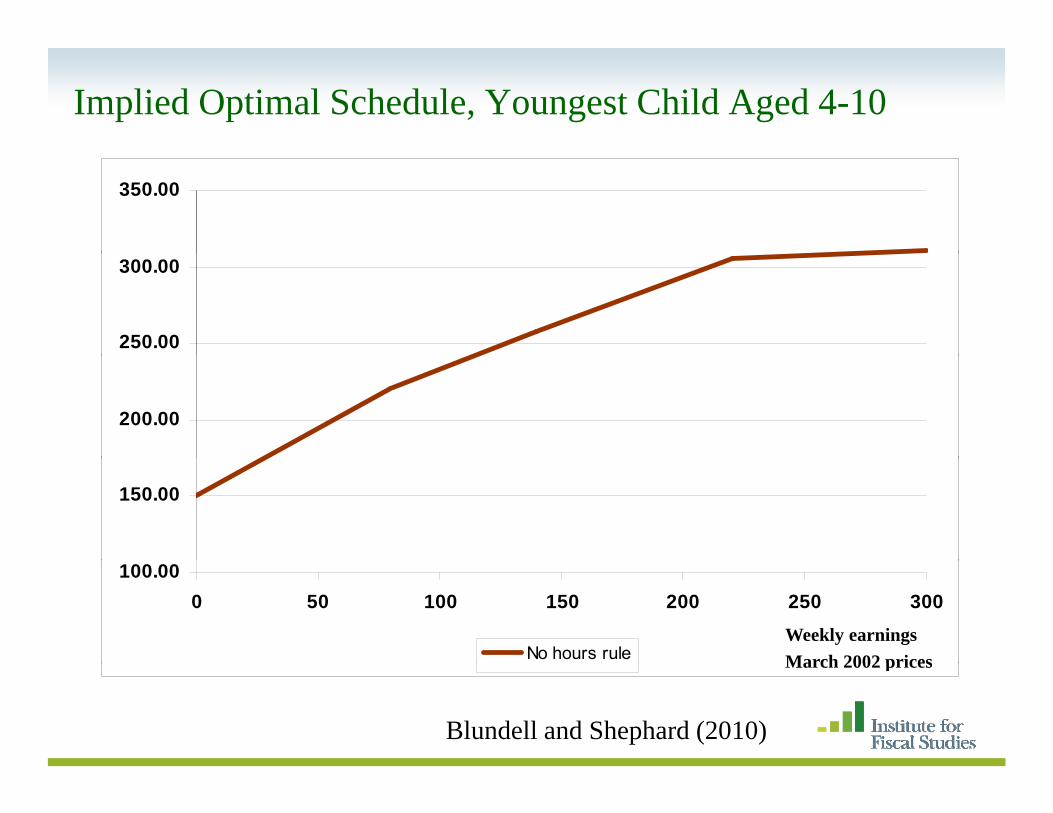
Implied Optimal Schedule, Youngest Child Aged 0-3
350.00
250.00
300.00
200.00
100.00
150.00
0 50 100 150 200 250 300
No hours rule Weekly earningsMarch 2002 pricesp
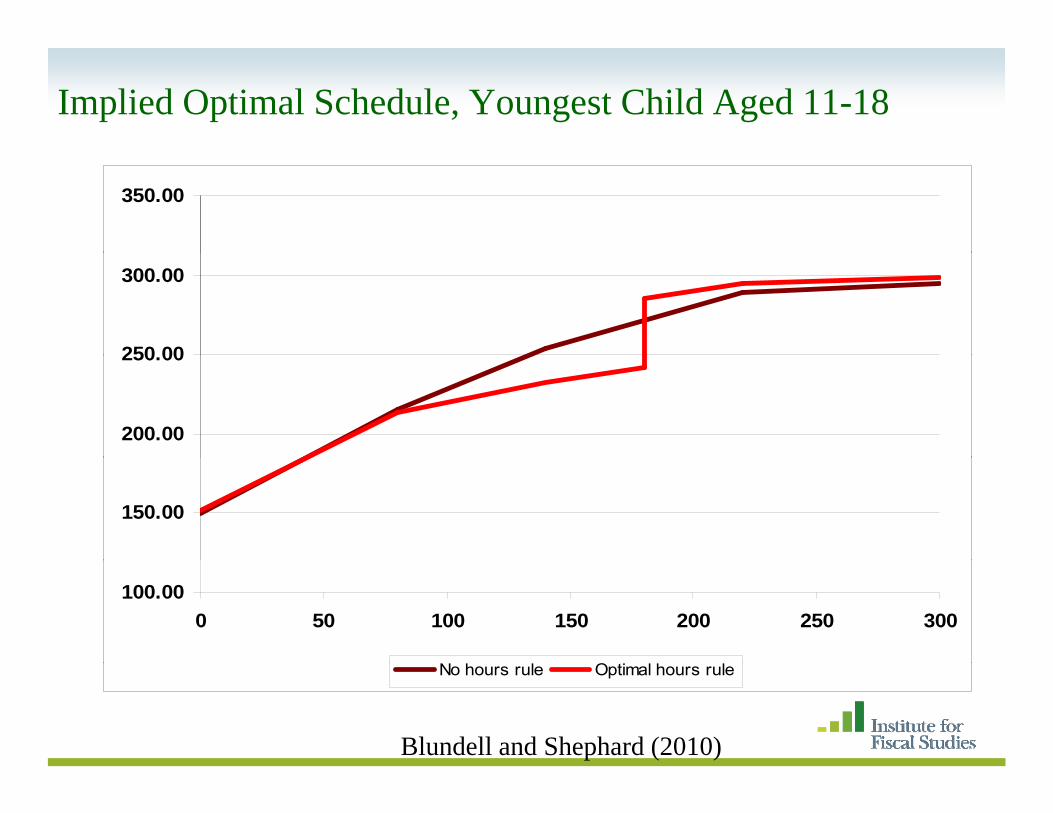
Blundell and Shephard (2010)
Implied Optimal Schedule, Youngest Child Aged 0-3
350.00
250.00
300.00
200.00
100 00
150.00
100.000 50 100 150 200 250 300
No hours rule 16 hours ruleWeekly earningsMarch 2002 pricesp
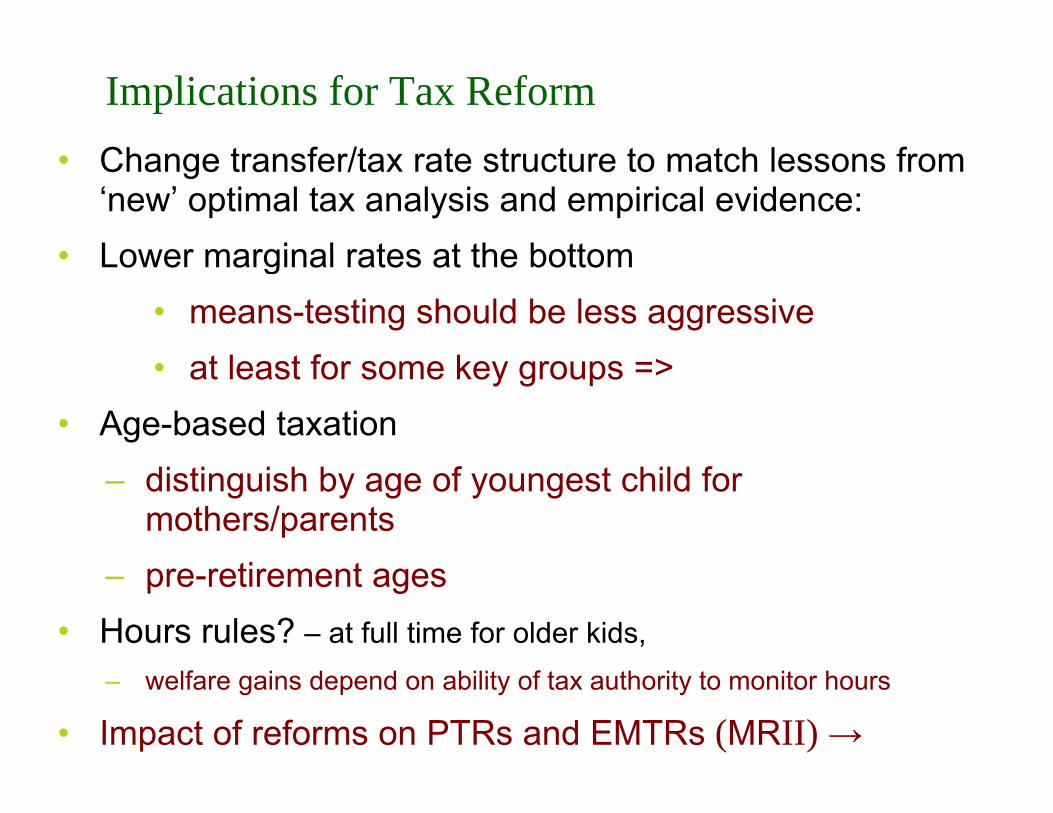
Implications for Tax ReformCh t f /t t t t t t h l f• Change transfer/tax rate structure to match lessons from ‘new’ optimal tax analysis and empirical evidence:
• Lower marginal rates at the bottom• Lower marginal rates at the bottom• means-testing should be less aggressive
t l t f k• at least for some key groups =>• Age-based taxation
– distinguish by age of youngest child for mothers/parents
– pre-retirement ages• Hours rules? – at full time for older kids,
– welfare gains depend on ability of tax authority to monitor hours
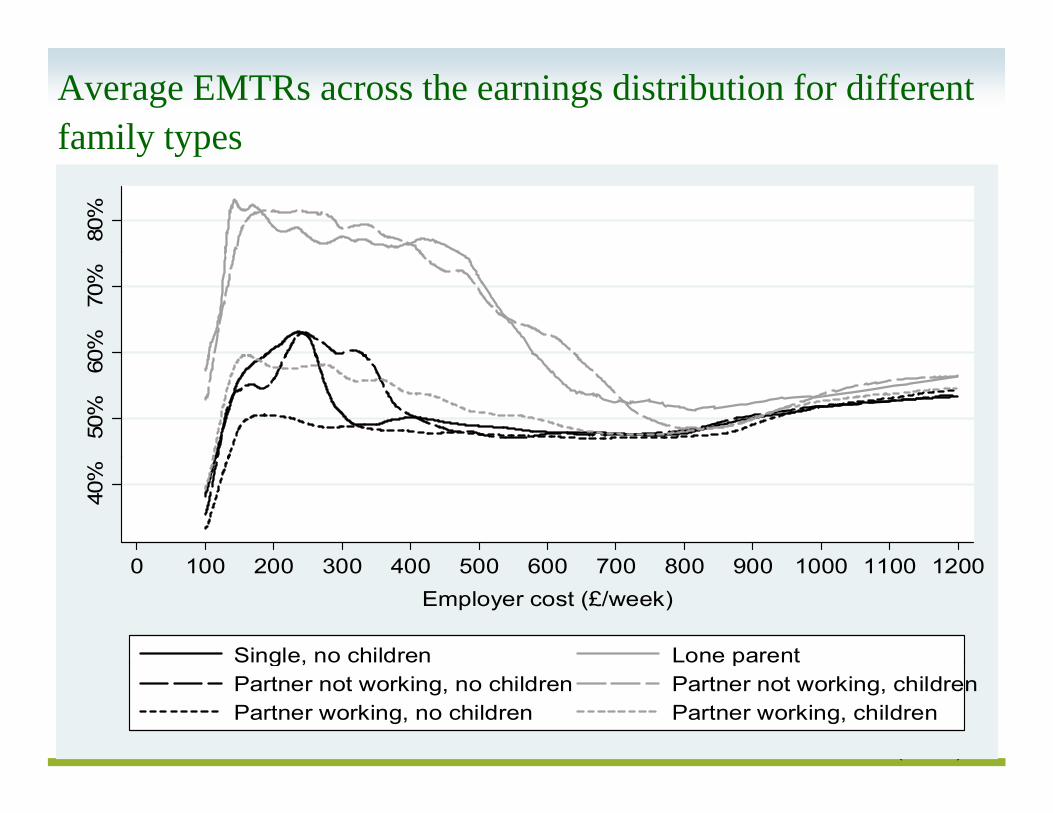
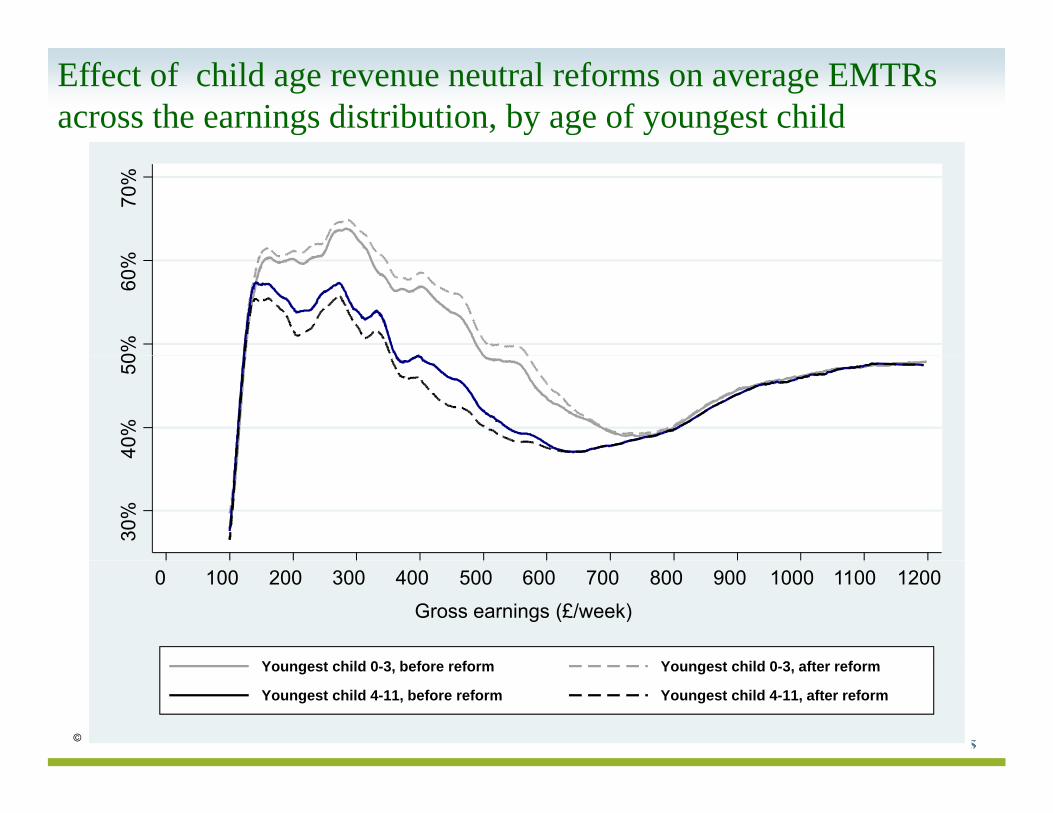
• Impact of reforms on PTRs and EMTRs (MRII) →
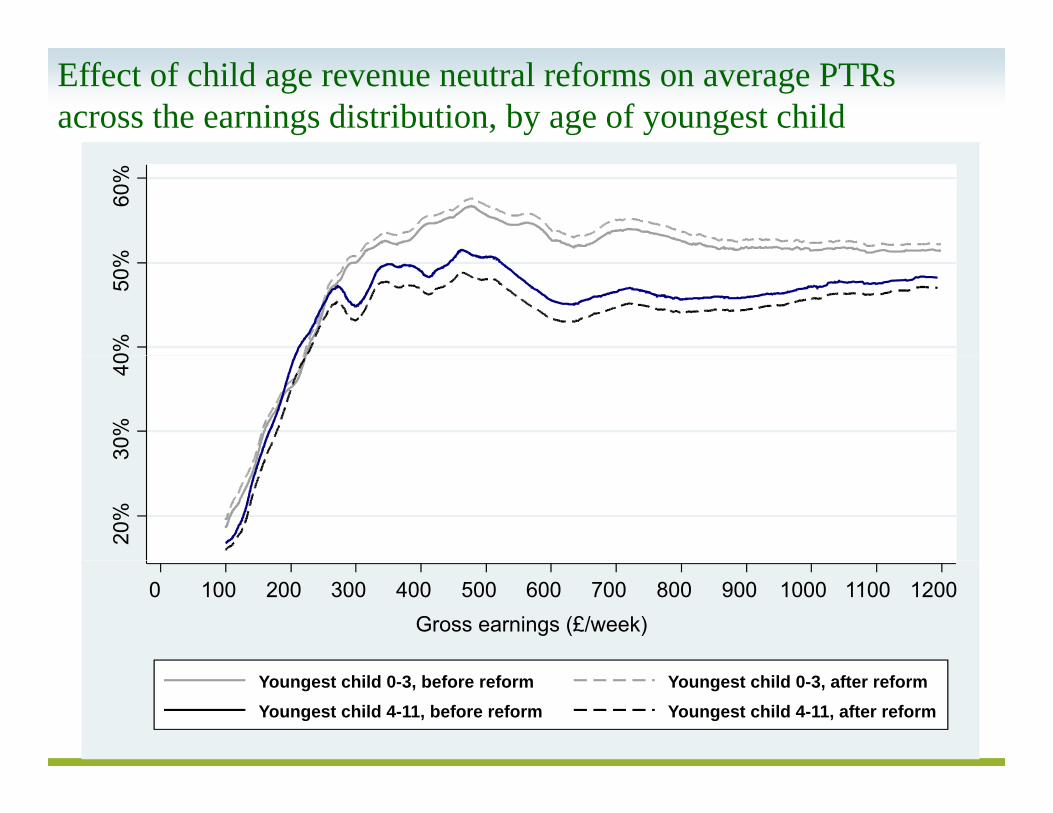
Effect of child age revenue neutral reforms on average PTRs across the earnings distribution, by age of youngest child
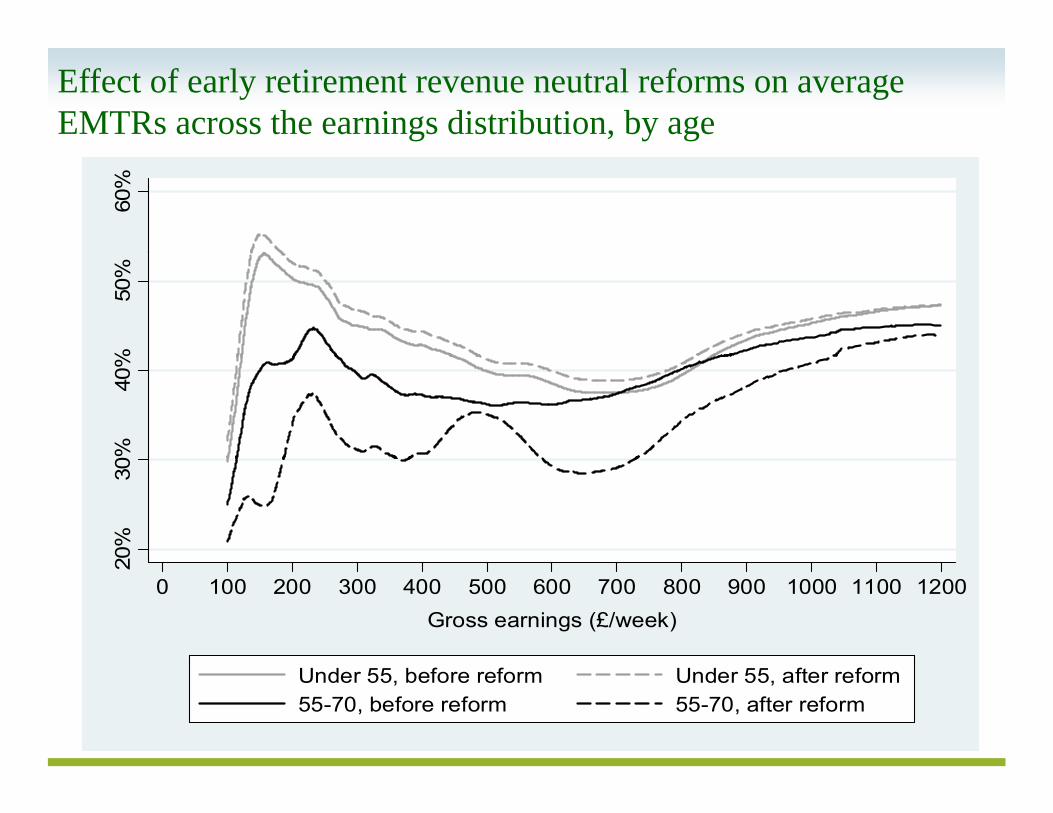
Under 55, before reform Under 55, after reform55-70, before reform 55-70, after reform
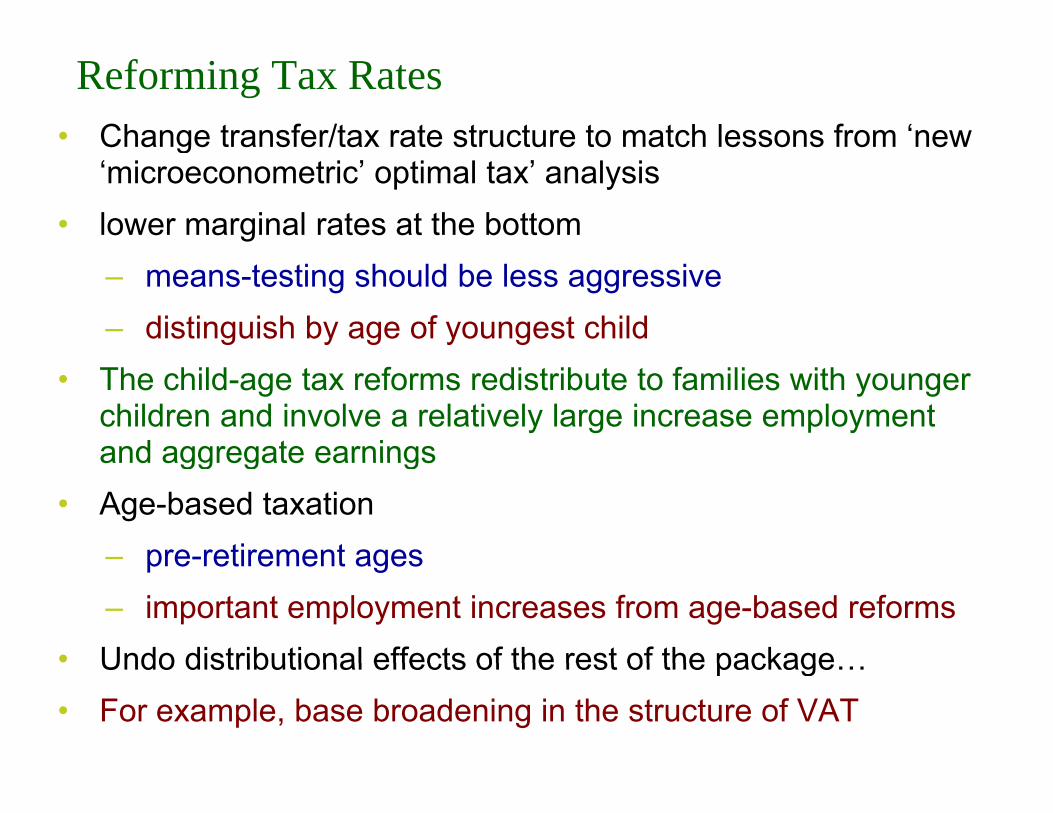
Reforming Tax Rates• Change transfer/tax rate structure to match lessons from ‘new g
‘microeconometric’ optimal tax’ analysis• lower marginal rates at the bottom
– means-testing should be less aggressive– distinguish by age of youngest child
• The child-age tax reforms redistribute to families with younger children and involve a relatively large increase employment and aggregate earningsand aggregate earnings
• Age-based taxation– pre-retirement agespre retirement ages– important employment increases from age-based reforms
• Undo distributional effects of the rest of the packageUndo distributional effects of the rest of the package…• For example, base broadening in the structure of VAT
Broadening the Base: Indirect Taxation• Evidence on consumer behaviour => exceptions to uniformity• Evidence on consumer behaviour => exceptions to uniformity
– Childcare strongly complementary to paid work– Various other work/time related expenditures– Various other work/time related expenditures
• conditional QUAIDS on FES, MRI
– ‘Vices’: alcohol, tobacco, betting; also environmental externalities g(three separate chapters in MRII)
• These do not line up well with existing structure of taxes⇒Broadening the base – many zero rates in UK VAT
• Compensating losers, even on average, is difficult• Especially when we worry about work incentives too• Work with new set of direct tax and benefit instruments as in
earnings tax reformsearnings tax reforms
Zero-rated:F d
Cost (£m)11 300
Indirect Taxation – UK case
FoodConstruction of new dwellingsDomestic passenger transportInternational passenger transport
11,3008,2002,500150International passenger transport
Books, newspapers and magazinesChildren’s clothingDrugs and medicines on prescription
1501,7001,3501,350Drugs and medicines on prescription
Vehicles and other supplies to people with disabilitiesReduced-rated:
Domestic fuel and power
1,350350
2,950pResidential conversions and renovations
VAT-exempt:Rent on domestic dwellings
,150
3,500Rent on commercial propertiesFinance and insurance
Impact on budget share of an additional hour workedConditional on income and prices
Bread and Cereals Negative
Meat and Fish Negative
Dairy products NegativeDairy products Negative
Tea and coffee Negative
Fruit and vegetables Negative
Food eaten out Positive
Beer Positive
Wine and spirits PositiveWine and spirits Positive
Domestic fuels Negative
Household goods and services Positive
Adult clothing Positive
Childrens’ clothing Negative
Petrol and diesel PositivePetrol and diesel Positive
Leisure goods and services Positive
Source: QUAIDS on UK FES, MRI
Compensation and work incentives
• Changes in benefits, tax credits and tax rates and thresholds.
• Relatively easy to compensate for income losses but no so easy to do so in a way that minimises labour supply distortions
• Incorporate child age and age-based reforms
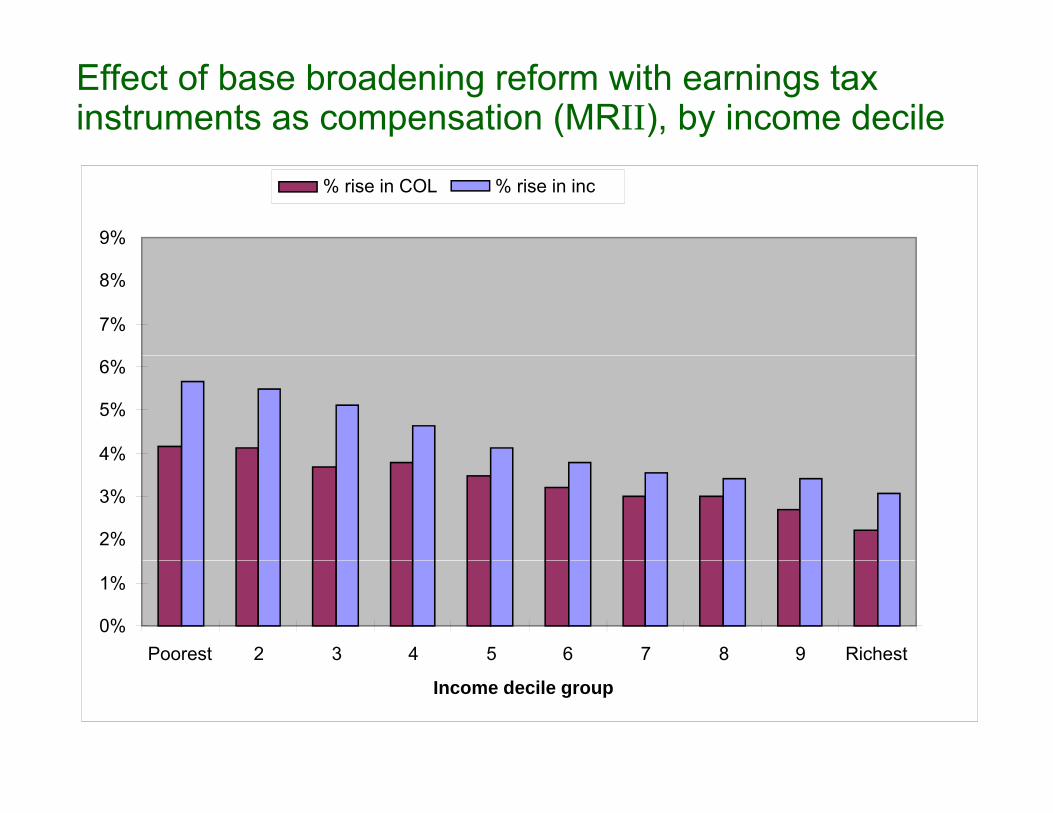
Effect of base broadening reform with earnings tax instruments as compensation (MRII), by income decile
9%
% rise in COL % rise in inc
7%
8%
4%
5%
6%
2%
3%
4%
0%
1%
Poorest 2 3 4 5 6 7 8 9 Richest
Income decile group
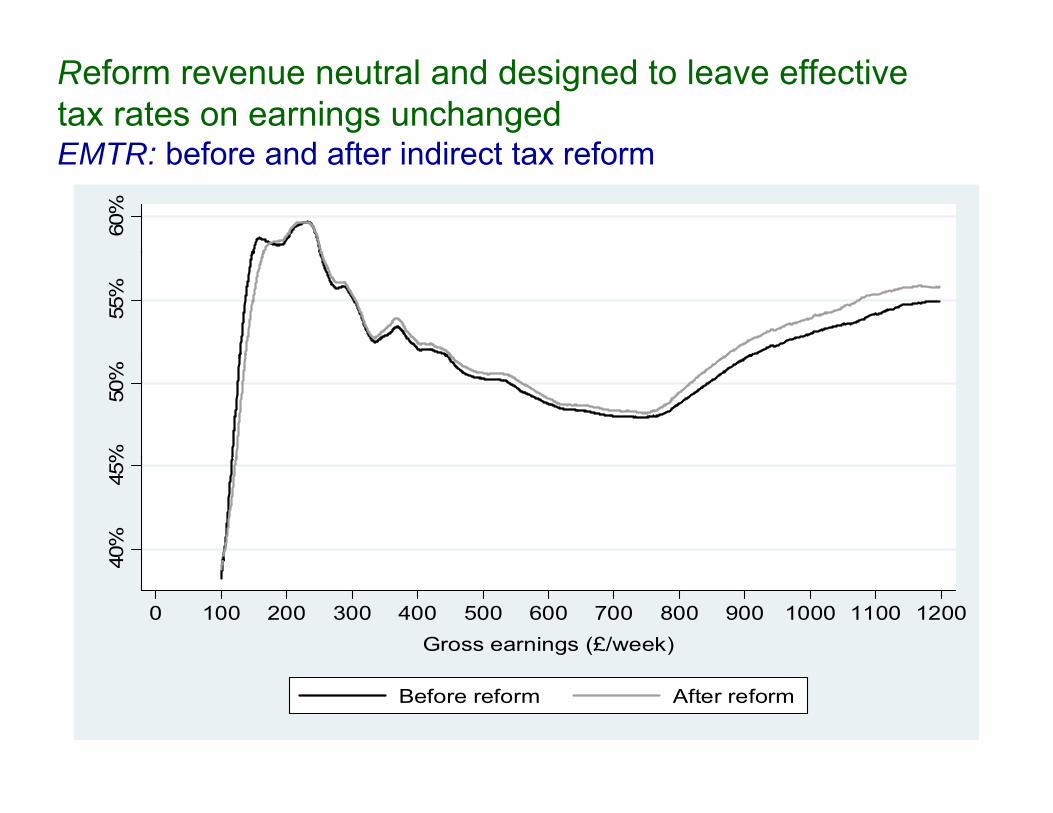
Reform revenue neutral and designed to leave effective tax rates on earnings unchanged EMTR: before and after indirect tax reformEMTR: before and after indirect tax reform
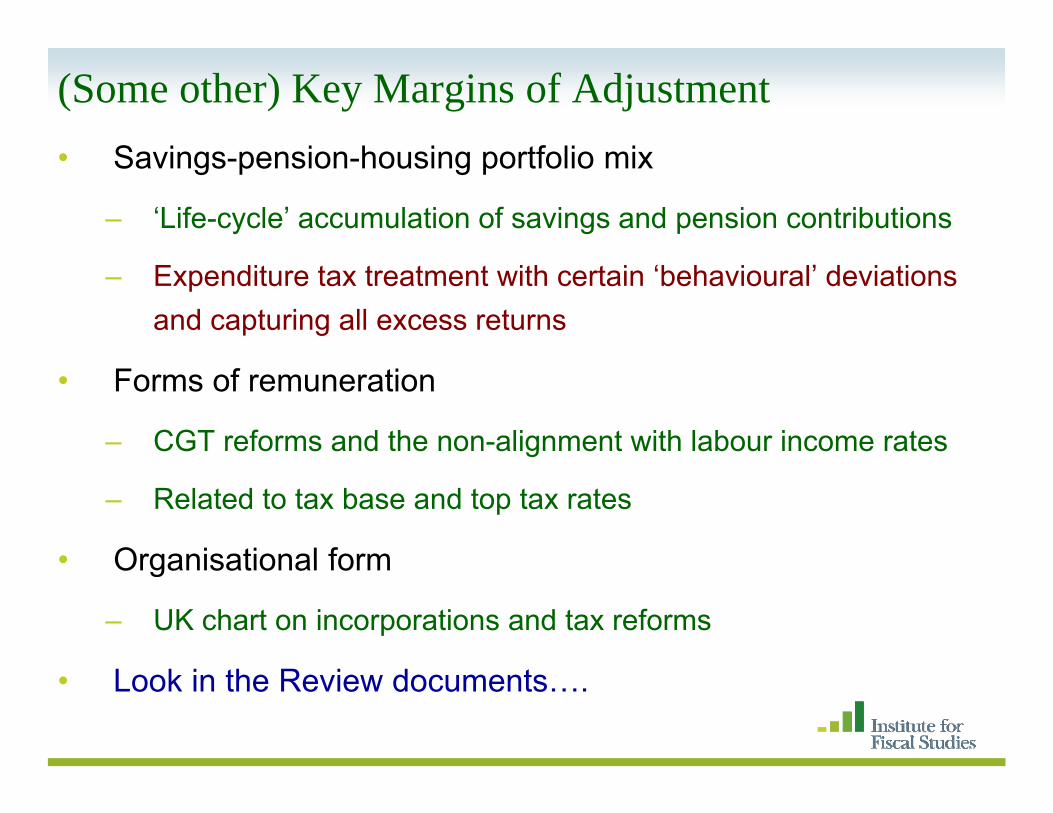
(Some other) Key Margins of Adjustment• Savings-pension-housing portfolio mix
– ‘Life-cycle’ accumulation of savings and pension contributions
– Expenditure tax treatment with certain ‘behavioural’ deviations and capturing all excess returns
• Forms of remuneration
– CGT reforms and the non-alignment with labour income rates
– Related to tax base and top tax rates
• Organisational form• Organisational form
– UK chart on incorporations and tax reforms
• Look in the Review documents….
Top tax rates and taxable income elasticities
An ‘optimal’ top tax rate (Brewer, Saez and Shephard, MRI)
e – taxable income elasticity
1 / (1 ) h i h Pt = 1 / (1 + a·e) where a is the Pareto parameter.
Estimate e from the evolution of top incomes in tax returnEstimate e from the evolution of top incomes in tax return data following large top MTR reductions in the 1980s
Estimate a (≈ 1.8) from the empirical distribution
Top incomes and taxable income elasticities
A . T o p 1% In co m e S h are an d M T R , 1962-2003
80% 16%
60%
70%
te
14%
40%
50%
nal T
ax R
at
1 0%
12%
ome
Shar
eT o p 1% M T RT o p 1% in co m e sh are
20%
30%
Mar
gin
6%
8% Inco
0%
10%
962
966
970
974
978
982
986
990
994
998
002
4%
6%
19 19 19 19 19 19 19 19 19 19 20
Source: MR1, UK SPI (tax return data)
Taxable Income Elasticities at the TopSimple Difference (top 1%) DD using top 5 1%Simple Difference (top 1%) DD using top 5-1%
as control
1978 vs 1981 0.32 0.081986 vs 1989 0.38 0.411978 1962 0 63 0 861978 vs 1962 0.63 0.862003 vs 1978 0.89 0.64
Full time series 0.69 0.46(0.12) (0.13)
With updated data the estimate remains in the .35 - .55 range with a central estimate of .46, but remain quite fragileNote also the key relationship between the size of elasticity and the tax base (Slemrod and Kopczuk, 2002)
Pareto distribution as an approximation to the income distribution
Some Additional References:Banks, J., Blundell, R., and Tanner, S. (1998) “Is there a retirement-savings , , , , , ( ) gpuzzle?”, American Economic Review, 88, 769 – 788.
Besley, T. and S. Coate (1992), “Workfare versus Welfare: Incentive Arguments for Work Requirement in Poverty Alleviation Programs” American Economicfor Work Requirement in Poverty Alleviation Programs , American Economic Review, 82(1), 249-261.
Blundell, R. (2006), “Earned income tax credit policies: Impact and Optimality”, Th 2005 Ad S ith L t L b E i 13 423 443The 2005 Adam Smith Lecture, Labour Economics, 13, 423-443.
Blundell, R.W., Duncan, A. and Meghir, C. (1998), "Estimating Labour Supply Responses using Tax Policy Reforms", Econometrica, 66, 827-861.
Blundell, R, Duncan, A, McCrae, J and Meghir, C. (2000), "The Labour Market Impact of the Working Families' Tax Credit", Fiscal Studies, 21(1).
(200 ) f fBlundell, R. and Hoynes, H. (2004), "In-Work Benefit Reform and the Labour Market", in Richard Blundell, David Card and Richard .B. Freeman (eds) Seeking a Premier League Economy. Chicago: University of Chicago Press.
Blundell, R. and MaCurdy (1999), "Labour Supply: A Review of Alternative Approaches", in Ashenfelter and Card (eds), Handbook of Labour Economics, Elsevier North-Holland.
Blundell, R., Meghir, C., and Smith, S. (2002), ‘Pension incentives and the pattern of early retirement’, Economic Journal, 112, C153–70.
Blundell, R., and A. Shephard (2008), ‘Employment, hours of work and the optimal taxation of low income families’, IFS Working Papers , W08/01
Brewer M A Duncan A Shephard M-J Suárez (2006) “Did the WorkingBrewer, M. A. Duncan, A. Shephard, M-J Suárez, (2006), Did the Working Families Tax Credit Work?”, Labour Economics, 13(6), 699-720.
Card, David and Philip K. Robins (1998), "Do Financial Incentives Encourage W lf R i i t T W k?" R h i L b E i 17 1 56Welfare Recipients To Work?", Research in Labor Economics, 17, pp 1-56.
Chetty, R. (2008), ‘Sufficient statistics for welfare analysis: a bridge between structural and reduced-form methods’, National Bureau of Economic Research (NBER), Working Paper 14399
Diamond, P. (1980): "Income Taxation with Fixed Hours of Work," Journal of Public Economics 13 101-110Public Economics, 13, 101 110.
Eissa, Nada and Jeffrey Liebman (1996), "Labor Supply Response to the Earned Income Tax Credit", Quarterly Journal of Economics, CXI, 605-637.
Immervoll, H. Kleven, H. Kreiner, C, and Saez, E. (2005), `Welfare Reform in European Countries: A Micro-Simulation Analysis’ Economic Journal.
Keane, M.P. and Moffitt, R. (1998), "A Structural Model of Multiple Welfare Program Participation and Labor Supply", International Economic Review, 39(3) 553 58939(3), 553-589.
Kopczuk, W. (2005), ‘Tax bases, tax rates and the elasticity of reported income’, Journal of Public Economics, 89, 2093–119.
Laroque, G. (2005), “Income Maintenance and Labour Force Participation”, Econometrica, 73(2), 341-376.
Mi l J A (1971) “Th Th f O ti l I T ti ” R i fMirrlees, J.A. (1971), “The Theory of Optimal Income Taxation”, Review of Economic Studies, 38, 175-208.
Moffitt, R. (1983), "An Economic Model of Welfare Stigma", American Economic Review, 73(5), 1023-1035.
Phelps, E.S. (1994), “Raising the Employment and Pay for the Working Poor”, American Economic Review 84 (2) 54-58American Economic Review, 84 (2), 54 58.
Saez, E. (2002): "Optimal Income Transfer Programs: Intensive versus Extensive Labor Supply Responses," Quarterly Journal of Economics, 117, 1039 10731039-1073.
Sørensen , P. B. (2009) “Dual income taxes: a Nordic tax system”, Paper prepared for the conference on New Zealand Tax Reform – Where to Next?.