Page 1
ORIGINAL ARTICLE
Empirical validation of structural metrics for predictingunderstandability of conceptual schemas for data warehouse
Manoj Kumar • Anjana Gosain • Yogesh Singh
Received: 28 August 2012 / Revised: 24 March 2013
� The Society for Reliability Engineering, Quality and Operations Management (SREQOM), India and The Division of Operation and
Maintenance, Lulea University of Technology, Sweden 2013
Abstract Data warehouse (DW) quality depends on its
data models (conceptual, logical and physical model).
Multidimensional (MD) modeling has been widely recog-
nized as the backbone of data modeling for DW. Recently,
some of the authors have proposed a set of structural
metrics to assess quality of MD conceptual models. They
have found the significant relationship between metrics and
understandability of DW conceptual schemas using various
correlation analysis techniques such as Spearman’s, Pear-
son etc. However, advanced statistical and machine learn-
ing methods have not been used to predict effect of each
metric on understandability. In this paper, our focus is on
predicting the effect of structural metrics on understand-
ability of conceptual schemas using (i) statistical method
(logistic regression analysis) that include univariate and
multivariate analysis, (ii) machine learning methods
(Decision Trees, Naive Bayesian Classifier) and (iii)
compare the performance of these statistical and machine
learning methods. The results obtained show that some of
the metrics individually have a significant effect on the
understandability of MD conceptual schema. Further, few
of the metrics have a significant combined effect on
understandability of conceptual schema. The results also
show that the performance of Naive Bayesian Classifier
prediction method is better than logistic regression analysis
and Decision Trees methods.
Keywords Data warehouse quality � Multidimensional
conceptual model � Metrics � Logistic regression analysis �Naive Bayes Classifier � Decision Trees
1 Introduction
Data warehouses (DW) are large repositories created to
hold data extracted from various sources and maintained by
different operating units together with historical and sum-
mary transformations. Data warehouses are the core of
most of the current decision support systems and provide
historical information for decision making process. Due to
increased complexity of DW (Inmon 2003), continuous
attention must be paid for evaluation of quality throughout
its design and development (Bouzeghoub and Kedad 2002;
Serrano et al. 2008). A lack of quality in DW may have
disastrous impacts from both technical and organizational
point of view such as loss of clients and financial losses or
discontent among employees (English 1996). Therefore, it
becomes important for an organization to guarantee the
quality of information maintained in its DW.
According to Serrano et al. (2007), information quality
of data warehouse is determined by (i) the quality of the
DW itself and (ii) the quality of data presentation as shown
in Fig. 1. Data warehouse quality can be influenced by data
base management systems quality, data quality and data
model quality. Thus, one of the main issues that influence
M. Kumar (&)
Department of Computer Science & Engineering, Ambedkar
Institute of Advanced Communication Technologies &
Research, Delhi, India
e-mail: [email protected]
A. Gosain
University School of Information Technology, Guru Gobind
Singh Indraprastha University, Delhi, India
e-mail: [email protected]
Y. Singh
The Maharaja Sayajirao University of Baroda,
Vadodara, Gujarat, India
e-mail: [email protected]
123
Int J Syst Assur Eng Manag
DOI 10.1007/s13198-013-0159-4
Page 2
DW quality depends on the data models (conceptual, log-
ical and physical, see Fig. 1). Here, in this paper our focus
will be on assessing the understandability of data ware-
house conceptual model, as we can refer Fig. 2, under-
standability affects quality of DW models.
Multidimensional (MD) modeling has been widely recog-
nized as the backbone of data modeling for DW. Some
approaches (Kimball and Ross 2002; Inmon 2003; Vas-
siliadis 2000) have been lately proposed for logical and
physical modeling of DW. They also proposed various
guidelines for creating good multidimensional models.
However, these guidelines or subjective assessment
criteria were not sufficient to guarantee the quality of DW
data model. Further, various approaches (Abello et al.
2002; Golfarelli et al. 1998; Golfarelli and Rizzi 1998;
Sapia 1999; Tryfona et al. 1999) have also been proposed
for conceptual modeling of data warehouse. Unfortunately,
none of these approaches considers neither subjective nor
objective quality of conceptual schema.
Recently, a set of structural metrics have been defined
for assessing quality of DW conceptual model (Serrano
2004; Serrano et al. 2007). The purpose of these metrics is
to facilitate designers while choosing among alterative
schemas that are semantically equivalent. Obtaining a valid
set of metrics is not only a matter of definition but also two
kinds of metrics validation are required, theoretical and
empirical. Theoretical validation is used to verify analyti-
cally that the metrics are proper numerical characteriza-
tions of the measured attribute (conforming to a set of
formal properties). Such validation has been conducted on
DW metrics (Serrano 2004). They have found the rela-
tionship between metrics and understandability of DW
conceptual schemas using various correlation analysis
techniques such as Spearman’s, Pearson etc. However,
advanced statistical and machine learning methods have
not been used to predict the effect of each metric on
understandability. In contrast, these methods have been
applied to predict software fault proneness using object
oriented metrics (Singh et al. 2010; Malhotra et al. 2010).
In this paper, our focus is on predicting the effect of
structural metrics on understandability of conceptual
schemas using:
(i) Statistical method (logistic regression analysis) that
include univariate and multivariate analysis.
(ii) Machine learning methods (Decision Trees, Naive
Bayesian Classifier).
(iii) Compare the performance of these statistical and
machine learning methods.
Organization of this paper is as follows: in Sect. 2, we
discuss multidimensional modeling and quality metrics for
data warehouse. In Sect. 3, metrics for DW conceptual
Fig. 1 Data warehouse
information quality (Serrano
et al. 2007)
Fig. 2 Relationship between
structural properties, cognitive
complexity, understanding and
external quality attributes
(Serrano et al. 2007)
Int J Syst Assur Eng Manag
123
Page 3
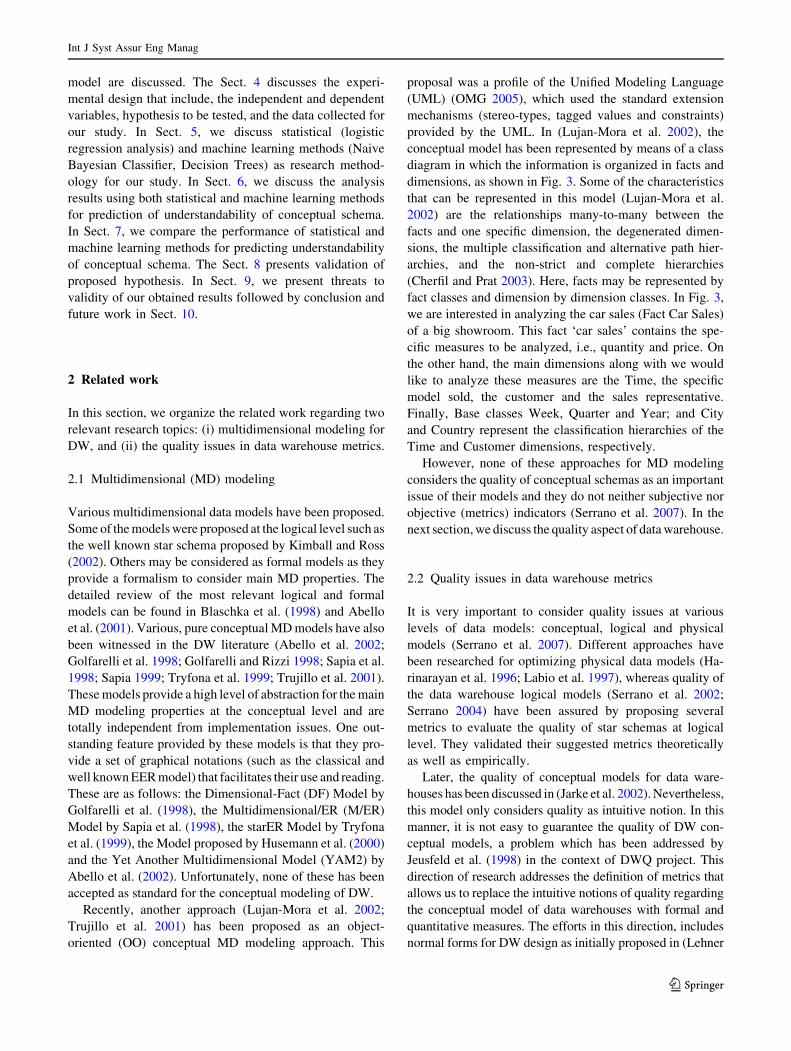
model are discussed. The Sect. 4 discusses the experi-
mental design that include, the independent and dependent
variables, hypothesis to be tested, and the data collected for
our study. In Sect. 5, we discuss statistical (logistic
regression analysis) and machine learning methods (Naive
Bayesian Classifier, Decision Trees) as research method-
ology for our study. In Sect. 6, we discuss the analysis
results using both statistical and machine learning methods
for prediction of understandability of conceptual schema.
In Sect. 7, we compare the performance of statistical and
machine learning methods for predicting understandability
of conceptual schema. The Sect. 8 presents validation of
proposed hypothesis. In Sect. 9, we present threats to
validity of our obtained results followed by conclusion and
future work in Sect. 10.
2 Related work
In this section, we organize the related work regarding two
relevant research topics: (i) multidimensional modeling for
DW, and (ii) the quality issues in data warehouse metrics.
2.1 Multidimensional (MD) modeling
Various multidimensional data models have been proposed.
Some of the models were proposed at the logical level such as
the well known star schema proposed by Kimball and Ross
(2002). Others may be considered as formal models as they
provide a formalism to consider main MD properties. The
detailed review of the most relevant logical and formal
models can be found in Blaschka et al. (1998) and Abello
et al. (2001). Various, pure conceptual MD models have also
been witnessed in the DW literature (Abello et al. 2002;
Golfarelli et al. 1998; Golfarelli and Rizzi 1998; Sapia et al.
1998; Sapia 1999; Tryfona et al. 1999; Trujillo et al. 2001).
These models provide a high level of abstraction for the main
MD modeling properties at the conceptual level and are
totally independent from implementation issues. One out-
standing feature provided by these models is that they pro-
vide a set of graphical notations (such as the classical and
well known EER model) that facilitates their use and reading.
These are as follows: the Dimensional-Fact (DF) Model by
Golfarelli et al. (1998), the Multidimensional/ER (M/ER)
Model by Sapia et al. (1998), the starER Model by Tryfona
et al. (1999), the Model proposed by Husemann et al. (2000)
and the Yet Another Multidimensional Model (YAM2) by
Abello et al. (2002). Unfortunately, none of these has been
accepted as standard for the conceptual modeling of DW.
Recently, another approach (Lujan-Mora et al. 2002;
Trujillo et al. 2001) has been proposed as an object-
oriented (OO) conceptual MD modeling approach. This
proposal was a profile of the Unified Modeling Language
(UML) (OMG 2005), which used the standard extension
mechanisms (stereo-types, tagged values and constraints)
provided by the UML. In (Lujan-Mora et al. 2002), the
conceptual model has been represented by means of a class
diagram in which the information is organized in facts and
dimensions, as shown in Fig. 3. Some of the characteristics
that can be represented in this model (Lujan-Mora et al.
2002) are the relationships many-to-many between the
facts and one specific dimension, the degenerated dimen-
sions, the multiple classification and alternative path hier-
archies, and the non-strict and complete hierarchies
(Cherfil and Prat 2003). Here, facts may be represented by
fact classes and dimension by dimension classes. In Fig. 3,
we are interested in analyzing the car sales (Fact Car Sales)
of a big showroom. This fact ‘car sales’ contains the spe-
cific measures to be analyzed, i.e., quantity and price. On
the other hand, the main dimensions along with we would
like to analyze these measures are the Time, the specific
model sold, the customer and the sales representative.
Finally, Base classes Week, Quarter and Year; and City
and Country represent the classification hierarchies of the
Time and Customer dimensions, respectively.
However, none of these approaches for MD modeling
considers the quality of conceptual schemas as an important
issue of their models and they do not neither subjective nor
objective (metrics) indicators (Serrano et al. 2007). In the
next section, we discuss the quality aspect of data warehouse.
2.2 Quality issues in data warehouse metrics
It is very important to consider quality issues at various
levels of data models: conceptual, logical and physical
models (Serrano et al. 2007). Different approaches have
been researched for optimizing physical data models (Ha-
rinarayan et al. 1996; Labio et al. 1997), whereas quality of
the data warehouse logical models (Serrano et al. 2002;
Serrano 2004) have been assured by proposing several
metrics to evaluate the quality of star schemas at logical
level. They validated their suggested metrics theoretically
as well as empirically.
Later, the quality of conceptual models for data ware-
houses has been discussed in (Jarke et al. 2002). Nevertheless,
this model only considers quality as intuitive notion. In this
manner, it is not easy to guarantee the quality of DW con-
ceptual models, a problem which has been addressed by
Jeusfeld et al. (1998) in the context of DWQ project. This
direction of research addresses the definition of metrics that
allows us to replace the intuitive notions of quality regarding
the conceptual model of data warehouses with formal and
quantitative measures. The efforts in this direction, includes
normal forms for DW design as initially proposed in (Lehner
Int J Syst Assur Eng Manag
123
Page 4
et al. 1998) and generalized in (Lechtenborger and Vossen
2003). These normal forms represented a first step towards
objective quality metrics for conceptual schemata. Further,
Cherfil and Prat (2003) have proposed metrics for measuring
multidimensional schemas analyzability and simplicity.
However, the metrics proposed in these approaches have not
been empirically validated and consequently, have not proven
their practical applications (Fenton and Pfleeger 1997).
Recently, Serrano (2004) and Serrano et al. (2007) proposed a
set of metrics for assessing the understandability of data
warehouse conceptual schemas and also validated the metrics
theoretically and empirically through a family of experi-
ments. However, in their empirical validation, they have not
used advanced statistical and machine learning methods to
predict understandability of DW conceptual schemas using
structural metrics. In this paper, we will use these prediction
Fig. 3 UML based DW
conceptual model depicting
CAR sales
Table 1 Metrics definition
Metrics Definition
NDC(S) Number of dimension classes of the star S (equal to the number of aggregation relationships)
NBC(S) Number of base classes of Star S
NC(S) Total number of classes of the star S NC(S) = NDC(S) ? NBC(S) ? 1
RBC(S) Ratio of base classes. Number of base classes per dimension class of the star S
NAFC(S) Number of FA attributes of the fact class of the star S
NADC(S) Number of D and DA attributes of the dimension classes of the star S
NABC(S) Number of D and DA attributes of the base classes of the star S
NA(S) Total number of FA, D and DA attributes of the star S NA(S) = NAFC(S) ? NADC(S) ? NABC(S)
NH(S) Number of hierarchy relationships of the star S
DHP(S) Maximum depth of the hierarchy relationships of the star S
RSA(S) Ratio of attributes of the star S. Number of attributes FA divided by the number of D and DA attributes
Int J Syst Assur Eng Manag
123
Page 5
methods (Statistical and Machine Learning) to predict
understandability of conceptual schemas using structural
metrics (Serrano 2004; Serrano et al. 2007), which are defined
in the next section.
3 Metrics for data warehouse conceptual model
Following are the metrics definition (Serrano 2004; Serrano
et al. 2007) for measuring the understandability of data
warehouse conceptual models with fact classes, dimen-
sional classes and associated base classes and their attri-
butes (Table 1).
4 Experimental design
In this section, we present the variables in the study along
with hypothesis to be tested and finally the data collected
for this study.
4.1 Variables in the study
4.1.1 Independent variables
The independent variables are the variables for which the
effects should be evaluated for predicting the understand-
ability of DW conceptual schema. In our study,
independent variable corresponds to the structural com-
plexity, which is measured through the metrics being dis-
cussed in Sect. 3. Here, we have considered 20 real world
examples of an object oriented data warehouse conceptual
schemas using UML and calculated the values of the
metrics, as shown in Table 2.
4.1.2 Dependent variables
Understandability is the dependent variable, which we
want to predict using structural metrics (independent
variables). The understandability of the tests was measured
as the time each subject took to perform the tasks of each
experiment test. The experimental tasks consisted of
understanding the schemas and answering the corre-
sponding questions. Here, low value of understanding time
for the schema means, it is understandable, whereas, high
value of understanding time for the schema means, it is
non-understandable.
4.2 Hypothesis formulation
In this section, research hypothesis are presented.
Null hypothesis, H0 There is no significant effect of
individual metric on schema understandability.
Alternate hypothesis, H1 There is a significant effect of
NDC metric on schema understandability.
Table 2 Collected metrics
Metrics schema NDC NBC NC RBC NAFC NADC NABC NA NH DHP RSA
S01 4 4 9 1 2 18 4 24 3 3 0.09
S02 3 7 11 2.34 1 13 7 21 3 3 0.05
S03 4 4 9 1 3 17 4 24 2 3 0.14
S04 4 0 5 0 2 23 0 25 0 0 0.08
S05 4 4 9 1 2 20 4 26 2 3 0.08
S06 3 7 11 2.34 2 13 7 22 3 3 0.1
S07 4 5 10 1.25 2 12 5 19 2 3 0.11
S08 3 7 11 2.34 2 15 7 24 2 4 0.09
S09 5 8 14 1.6 2 22 8 32 3 3 0.06
S10 5 4 10 0.8 2 13 4 19 2 2 0.11
S11 5 4 10 0.8 2 21 4 27 2 3 0.08
S12 5 4 10 0.8 2 22 4 28 2 3 0.07
S13 3 4 8 1.37 2 15 4 21 2 3 0.10
S14 3 4 8 1.37 2 16 4 22 2 2 0.1
S15 4 2 7 0.5 2 14 2 18 1 2 0.12
S16 3 0 4 0 4 15 0 19 0 0 0.26
S17 5 7 12 1.4 2 18 7 27 3 4 0.08
S18 4 2 6 0.5 3 12 2 17 1 2 0.21
S19 4 6 10 1.5 2 15 6 23 3 2 0.09
S20 5 3 8 0.6 2 27 3 32 1 3 0.06
Int J Syst Assur Eng Manag
123
Page 6
Alternate hypothesis, H2 There is a significant effect of
NBC metric on schema understandability.
Alternate hypothesis, H3 There is a significant effect of
NC metric on schema understandability.
Alternate hypothesis, H4 There is a significant effect of
RBCC metric on schema understandability.
Alternate hypothesis, H5 There is a significant effect of
NAFC metric on schema understandability.
Alternate hypothesis, H6 There is a significant effect of
NADC metric on schema understandability.
Alternate hypothesis, H7 There is a significant effect of
NABC metric on schema understandability.
Alternate hypothesis, H8 There is a significant effect of
NA metric on schema understandability.
Alternate hypothesis, H9 There is a significant effect of
NH metric on schema understandability.
Alternate hypothesis, H10 There is a significant effect of
DHP metric on schema understandability.
Alternate hypothesis, H11 There is a significant effect of
RSA metric on schema understandability.
Alternate hypothesis, H12 There is a significant com-
bined effect of some metrics on schema understandability.
4.3 Empirical data collection
There were 18 subjects, who were doing M. Tech. at the
Institute, where one of the author is employed. These 18
subjects have participated in the experiment. We gave a set
of questions for each schema to all the subjects. The sub-
jects had to analyze each schema and answer related
questions of that particular schema. In this experiment we
have taken fix number of questions in each schema, for
instance a set of four questions for schema car sales
(Fig. 3) are given as follows.
(1) Which classes do we need to use for knowing the
model of the car?
(2) Which classes do we need to know that which sales
representative has helped in the maximum sales?
(3) Which classes do we need to answer the total sales
price in a year?
(4) If we want to increase our car sales then in which
class do we add our promotion advertisement?
The starting time and finish time in which the subjects
answers these questions for each schema is noted down in
seconds and we get the understanding time i.e. time taken
to solve the questions. The collected understanding time of
18 subjects for 20 conceptual schemas for DW taken from
various books of Data warehousing are shown in the
Table 3.
5 Research methodology
In this section, we discuss both statistical (logistic regres-
sion analysis) and machine learning methods (Decision
Trees, Naive Bayesian Classifier) for predication of schema
understandability.
5.1 Statistical method
The logistic regression (LR) analysis is used to predict the
dependent variable (understandability) from a set of inde-
pendent variables (structural metrics) in order to determine
the percentage of variance in the dependent variable
explained by the independent variable (Basili et al. 1996;
Hosmer and Lemeshow 1989). It is used when the outcome
variable is binary or dichotomous. We have used both
univariate and multivariate regression. Univariate logistic
regression finds the relationship between the dependent
variable and each independent variable. It finds whether
there is any significant association between them. Multi-
variate logistic regression is done to construct a prediction
model for the understandability of multidimensional con-
ceptual schema. It analyzes which metrics are useful when
they are used in combination. Logistic regression results in
a subset of metrics that have significant parameters. To find
the optimal set of independent variables (metrics), there are
two stepwise selection methods, which are forward selec-
tion and backward elimination (Hosmer and Lemeshow
1989). Forward selection examines the variables that are
selected one at a time for entry at each step. The backward
elimination method includes all the independent variables
in the model and the variables are deleted one at a time
from the model until the stopping criteria is fulfilled. We
have used the forward stepwise selection method. The
general multivariate logistic regression formula (Basili
et al. 1996; Hosmer and Lemeshow 1989; Aggarwal et al.
2009), which we used is as follows:
Prob X1; X2; . . .; Xnð Þ ¼ egðxÞ
1þ egðxÞ
where g(x) = B0 ? B1*X1 ? B2* X2 ? … ? Bn*Xn,
‘prob’ is the probability of a schema being understandable
and Xi, (1 B i B n) are independent variables.
The following statistics are reported for each metric
from the above formula:
• Odds ratio: The odds ratio is calculated using Bi’s. The
formula for the odds ratio (R) = exp (Bi). This is
calculated for each independent variable. The odds
Int J Syst Assur Eng Manag
123
Page 7
Table 3 Collected understanding time of 18 subjects for 20 schemas in seconds
Schemas Understanding time of subjects (s)
Subj1 Subj2 Subj3 Subj4 Subj5 Subj6 Subj7 Subj8 Subj9
S01 60 70 72 58 64 84 74 73 65
S02 45 40 56 49 35 41 51 32 29
S03 52 45 51 47 40 36 54 41 62
S04 35 40 41 36 32 31 28 25 30
S05 50 53 51 46 56 65 74 29 35
S06 48 39 26 28 37 35 40 27 36
S07 32 31 38 26 28 40 34 50 51
S08 63 68 75 74 80 59 65 71 78
S09 81 86 100 89 79 67 71 86 74
S10 56 68 78 45 61 50 53 51 48
S11 46 53 52 48 70 68 61 55 42
S12 45 53 55 61 60 59 57 45 39
S13 40 35 39 25 29 34 31 41 28
S14 22 27 36 31 29 34 32 33 24
S15 32 37 39 41 45 29 24 26 33
S16 38 40 48 36 22 24 29 35 34
S17 86 74 96 102 68 67 88 77 84
S18 50 45 46 38 29 27 36 37 47
S19 56 58 60 84 74 63 41 45 50
S20 68 74 77 84 63 59 69 78 81
Schemas Understanding time of subjects (s)
Subj10 Subj11 Subj12 Subj13 Subj14 Subj15 Subj16 Subj17 Subj18
S01 50 54 70 60 71 54 57 67 55
S02 47 48 44 54 48 38 50 45 51
S03 32 47 40 50 60 38 42 50 43
S04 26 28 32 35 40 33 42 38 31
S05 44 46 34 70 53 50 42 37 54
S06 22 26 32 38 47 30 35 32 28
S07 41 40 28 32 37 52 30 38 50
S08 69 60 55 72 76 63 58 75 56
S09 89 85 65 78 90 96 87 79 92
S10 89 58 66 76 60 52 51 49 47
S11 40 42 46 63 65 71 52 68 45
S12 41 43 52 59 62 47 40 50 55
S13 27 29 30 32 35 40 39 26 32
S14 22 25 30 34 28 26 25 32 35
S15 38 33 36 38 40 27 28 26 40
S16 27 29 32 36 41 24 26 34 45
S17 70 67 79 95 80 77 68 73 83
S18 45 44 48 36 37 30 44 48 43
S19 61 59 49 40 62 72 82 67 51
S20 88 85 83 67 62 66 81 75 72
Int J Syst Assur Eng Manag
123
Page 8
ratio is the probability of the event divided by the
probability of a non-event. The event in our study is the
probability of having a schema understandable and the
non-event is the probability of not having a under-
standable schema.
• Maximum likelihood estimation (MLE) and coefficients
(Bi’s): MLE is the likelihood function that measures the
probability of observing a set of dependent variables.
MLE finds the coefficient in such a way that the log of
the likelihood function is as large as possible. The more
the value of the coefficient the more the impact of the
independent variables on predicted understandability of
the schema is.
• The statistical significance: Statistical significance mea-
sures the significance level of the coefficient. The larger the
value of the statistical significance (Sig.) the lower the
estimated impact of the independent variables (metrics).
• The R2 statistic: It is the proportion of the variance in
the dependent variable (understandability) that is
explained by the variance of independent variables
(metrics). The higher is the value of R2, the higher is
the effect of the independent variables and more is the
accuracy of the model.
5.2 Machine learning methods
The machine learning techniques deal with the issues of
how to build and design computer programs that improve
their performance for some specific task based on past
observations. In this section we discuss, well known
machine learning methods (Decision Trees, Naive Bayes-
ian Classifier) for prediction of understandability of con-
ceptual schema.
5.2.1 Decision Trees method
A decision tree (DT) is a predictive machine learning
model that decides the target value (dependent variable) of
a new sample based on various attribute values of the
available data. The DT includes several algorithms such as
Quinlan’s ID3, C4.5, C5, J48 and CART (Ross 1993;
Kohavi 1995; Witten and Frank 2011; Han and Kamber
2007). We discuss the J48 algorithm, which is a modified
version of an earlier algorithm C4.5 developed by Ross
(1993). J48 algorithm builds Decision Trees from a set of
training data using the concept of information entropy. The
training data is a set S = s1, s2, s3,—of already classified
samples. Each sample si = x1, x2, x3,… is a vector where
x1, x2, x3,… represent attributes or features of the sample.
The training data is augmented with a vector C = c1, c2,
c3,—where c1, c2, c3,—represent the class to which each
sample belongs. At each node of the tree, J48 chooses one
attribute of the data that most effectively splits its set of
samples into subsets enriched in one class or the other. Its
criterion is the normalized information gain that results
from choosing an attribute for splitting the data. The
attribute with the highest information gain is chosen to
make the decision. The J48 recursively classifies the tree
until each leaf is pruned, i.e. the data has been categorized
as close to perfect as possible (Witten and Frank 2011).
Moreover, among all possible values of information gain, if
there is any other value for which there is no ambiguity
then we terminate that branch and assign it to the target
value that we have obtained so far. Alternatively, we look
for another attribute providing highest information gain.
Therefore we continue this process until we either get a
clear decision of what combination of attributes provide us
a particular target value, or we run out of attributes. In such
event when we run out of attributes, or if we cannot get an
unambiguous result from the available training set, then we
assign this branch a target value that the majority of items
under this branch possess. Now by checking all these
respective attributes and their values observed in DT, we
can predict the target value of new instances (Ross 1993).
5.2.2 Naive Bayesian classification method
Naive Bayesian Classifier can predict class membership
probabilities, such as the probability that a given tuple
belongs to a particular class (Kohavi 1995; Han and
Kamber 2007). It assumes that the effect of an attribute
value on a given class is independent of the value of other
attributes. This assumption is called conditional indepen-
dence, which is explained as follows:
P HjXð Þ ¼ P XjHð ÞP Hð Þ=P Xð Þ
P(H|X) reflects the probability that the conceptual
schema X will be understandable given that we know the
value of metrics of schema X.
P(H) is the prior probability of H. For instance, this is
the probability that any given conceptual schema will be
understandable, regardless of its metrics values, or any
other information for that matter.
Similarly, P(X|H) is the posterior probability of X
conditioned on H. That it is the probability that the value of
metrics NDC and NA of conceptual schema X are 4 and 24,
respectively given that the conceptual schema X is
understandable.
P(X) is the prior probability of conceptual schema X. It
is the probability that a particular conceptual schema from
a set of conceptual schemas has value 4 and 24 of its
metrics NDC and NA, respectively.
• Let D be a training set of tuples and their associated
class labels. As usual each tipple is represented by
Int J Syst Assur Eng Manag
123
Page 9
n-dimensional attribute vector, X = (x1, x2,…xn),
depicting n measurements made on the tuple from n
attributes, respectively, A1 A2, A3,…An.
• Suppose that there are m classes c1, c2,…cm Given a
tuple X, the classifier will predict that X belongs to the
class having the highest posterior probability, condi-
tioned on X. That is, the Naı̈ve Bayesian Classifier
predicts that tuple X belongs to the class ci, if and only
if
P cijxð Þ[ P cjjx� �
for i � j � m; j 6¼ i:
Thus we maximize P(ci|x). The class ci for which
P(ci|x) is maximized is called the maximum posterior
hypothesis
P cijxð Þ ¼ P xjcið ÞP cið Þ=P xð Þ
• As P(x) is constant for all classes, only P(x|ci) P(ci)
need to be maximized. If the class prior probabilities
are not known than it is commonly assumed that the
classes are equally likely, that is P(c1) = P(c2) =
P(cm), and we would therefore maximize P(x|ci).
Otherwise, we maximize P(x|ci) P(ci).
The structure of Naive Bayesian Classifier represents
knowledge in the form of a tree which is constructed
recursively. The leaf nodes are Naive Bayes categorizers
for predicting a single class. We employed tenfold cross
validation on our collected data. Naive Bayesian algorithm
tries to approximate whether the generalization accuracy of
Naive Bayes at each leaf is higher than a single Naive
Bayes Classifier at the current node (Kohavi 1995).
6 Analysis results
In this section, we described the analysis performed to find
the effect of each metric on understandability of conceptual
schema. We applied univariate and multivariate logistic
regression analysis as well as two machine learning
methods (Decision Trees, Naive Bayesian Classifier).
Following measures are used to evaluate the performance
of each predicted understandability model:
6.1 Sensitivity
It measures the correctness of the predicted model. It is
defined as the percentage of schemas correctly predicted to
be understandable.
Sensitivity = [(Number of schemas correctly predicted
as understandable)/(total number of actual understandable
schemas)]*100
6.2 Specificity
It also measures the correctness of the predicted model. It
is defined as the percentage of schemas predicted that will
not be understandable.
Specificity = [(Number of schemas correctly predicted
as non-understandable)/(total number of actual non
understandable schemas)]*100
6.3 Accuracy
It is defined as the ratio of number of schemas (including
understandable and non-understandable) that are predicted
correctly to the total number of schemas.
Accuracy = {[(Number of schemas correctly predicted
as understandable) ? (number of schemas correctly pre-
dicted as non-understandable)]/total schemas}*100
6.4 Receiver operating characteristic (ROC) analysis
The performance of the outputs of the predicted models
may be evaluated using ROC analysis. It is an effective
method of evaluating the performance of the model pre-
dicted. The ROC curve is defined as a plot of sensitivity on
the y-coordinate versus its 1-specificity on the x-coordinate
(El Emam et al. 1999). The area under ROC curve (AUC)
is a combined measure for accuracy of prediction model.
The validation method used in our study is k-cross vali-
dation (the value of k is taken as 10) in which the dataset is
divided into approximately equal k partitions (Stone 1974).
One partition at a time is used for testing the model and the
remaining k - 1 partitions are used for training the model.
This is repeated for all the k partitions.
6.5 Descriptive statistics
We have shown the maximum, minimum, standard devia-
tion and average of understandability time taken by the
subjects to answer the given set of questions for each
schema of the experiments, as shown in the Table 4.
Following observation are made from the Table 4:
• For schema (S17), the subject taken highest maximum
(102 s), highest minimum (67 s), highest standard
deviation (11.70 s) and highest average (81.05 s)
understanding time among all schemas.
• For schema (S14), the subject taken lowest maximum
(40 s), lowest minimum (22 s), lowest standard devi-
ation (5.34 s) and lowest average (30.61 s) understand-
ing time among all schemas.
• The average of all the average understanding time of
each schema is 50.56 s. We believe that, if average
understanding time of the schema is less than or equal
Int J Syst Assur Eng Manag
123
Page 10
to 50.56 s, than schema is understandable otherwise
schema is non-understandable. In this way, understand-
ability attribute (dependent variable) will be trans-
formed from continuous to categorical variable.
6.6 Univariate LR analysis results
In univariate LR analysis, effect of each metrics on
the understandability is predicted and shown in the
Table 5:
NDC, NC and NA metrics are found to be significant
since their significance level is less than 0.054. The impact
of the metrics NDC, NC and NA on predicting under-
standability is negative, since value of coefficients (B) are
negative. That means, more value of these metrics for a
conceptual schema may lead to less understandability (i.e.
understanding time would be more). The NDC metric has
the highest R2 value, which shows that it is the best pre-
dictor for understandability of conceptual schema. The NA
metric has the second highest R2 value. The values of R2
statistic are more important as compared to the value of
Sig., as they show the strength of correlation.
6.7 Multivariate LR analysis results
In this section, we summarize the result obtained using LR
analysis method. The multivariate analysis is used to deter-
mine the combined effect of structural metrics on under-
standability of conceptual schema. We used the forward
stepwise selection method. The result is shown in Table 6,
Table 4 Descriptive statistics
of data collected from the
experiment
Schema Understanding time (s) Understandability
Maximum Minimum SD Average
S01 84 48 9.90 64.94 Non-understandable
S02 56 28 8.86 41.44 Understandable
S03 62 30 9.00 45.27 Understandable
S04 42 25 5.46 33.11 Understandable
S05 74 28 14.11 47.94 Understandable
S06 48 22 7.29 33.77 Understandable
S07 51 26 8.30 37.05 Understandable
S08 85 56 7.67 69.16 Non-understandable
S09 105 65 10.55 82.55 Non-understandable
S10 89 44 14.21 59.50 Non-understandable
S11 72 40 10.62 53.33 Non-understandable
S12 62 39 8.34 50.83 Non-understandable
S13 42 25 5.92 33.83 Understandable
S14 40 22 5.34 30.61 Understandable
S15 48 24 7.01 35.83 Understandable
S16 49 22 8.44 35.38 Understandable
S17 102 67 11.70 81.05 Non-understandable
S18 50 27 7.32 40.50 Understandable
S19 84 41 11.73 60.05 Non-understandable
S20 88 59 7.73 75.16 Non-understandable
Table 5 Logistic model correlation coefficients (B), odd ratio and R2
statistics
Metric B SE Sig. Odd ratio R2
NDC -2.448 1.0628 0.0213 0.0865 0.3903
NBC -0.4039 0.2539 0.1117 0.6677 0.1434
NC -0.6981 0.3605 0.0531 0.4975 0.2845
RBC -0.3225 0.67 0.6349 0.7244 0.0113
NAFC 1.0138 1.039 0.3260 2.75 0.0603
NADC -0.2434 0.1375 0.0766 0.784 0.1789
NABC -0.4039 0.25 0.1117 0.6677 0.1441
NA -0.4141 0.1911 0.0302 0.6609 0.3366
NH -0.9847 0.63 0.1181 0.3736 0.1439
DHP -1.154 0.75 0.1200 0.315 0.174
RSA 40.9831 25.91 0.1138 629142582 0.2345
Table 6 The LR analysis method statistics
Metric B SE Sig. Odd ratio R2
NDC -3.4951 2.0424 0.087 0.0303
NC -1.5134 1.1770 0.1985 0.2202
Constant 28.2333 18.3118 0.1231 182619600724.68 0.551
Int J Syst Assur Eng Manag
123
Page 11
which shows that two metrics NDC and NC are included in the
multivariate model. The sensitivity, specificity, precision etc.
for each metrics and model predicted are shown in Table 7.
NDC metric has the highest sensitivity (100 %), speci-
ficity (66.60 %) and accuracy (85 %) for prediction of
understandability of conceptual schema. The NA metric has
the second highest sensitivity (81.8 %), specificity (55.50 %)
and accuracy (70 %) for prediction of understandability of
conceptual schema. However, specificities and accuracy of
other metrics are lesser than NDC and NA metrics. The
sensitivity, specificity and the accuracy of the understand-
ability prediction model are 90.9, 77.7 and 85.7 %, respec-
tively. The value R2 of the predicted model is 0.551
6.8 Decision Trees (DT) analysis results
The NDC metric has highest sensitivity (100 %), speci-
ficity (66.66 %), and highest accuracy (85 %) for
prediction of understandability of DW conceptual schema.
The NA metrics has also the highest sensitivity (100 %),
second-highest specificity (55.55 %), and second highest
accuracy (80 %) for prediction. However, all other metrics
have lesser accuracy than NDC and NA metrics. The pre-
diction model has the highest sensitivity (100 %), speci-
ficity (88.88 %) and accuracy (95 %) (Table 8).
6.9 Naive Bayesian Classifier (BC) analysis results
The NDC metric has highest sensitivity (100 %), second-
highest specificity (66.66 %), and highest accuracy (85 %)
for prediction of understandability of DW conceptual
schema. The RSA metric has second-highest sensitivity
(81.81 %), highest specificity (88.88 %), and highest
accuracy (85 %) for prediction. Both NA and NC metrics
has third-highest sensitivity (72.72 %), second-highest
specificity (77.77 %), and second-highest accuracy (75 %)
for prediction. However, all other metrics have lesser
accuracy than NDC, NC, NA and RSA metrics. The pre-
diction model has the sensitivity of 81.81 %, specificity of
100 %, and accuracy of 90 % (Table 9).
7 Comparison of prediction methods
We have applied statistical method (LR analysis) and
machine learning methods (Decision Trees, Naive Bayes-
ian Classifier) to predict understandability of DW con-
ceptual schema using structural metrics. The method is
called better for prediction, if it reports high sensitivity and
high specificity during prediction of understandability of
DW conceptual schema. We have evaluated the perfor-
mance of each method through tenfolds cross validation.
The performance of LR analysis, Decision Trees and Naive
Table 7 Sensitivity, specificity, accuracy and AUC
Metric Sensitivity Specificity Accuracy AUC
NDC 1 0.666 0.85 0.853
NBC 0.615 0.571 0.6 0.686
NC 0.818 0.333 0.6 0.789
RBC 0.545 0.444 0.5 0.585
NAFC 0.909 0 0.5 0.591
NADC 0.727 0.666 0.7 0.747
NABC 0.727 0.444 0.6 0.686
NA 0.818 0.555 0.7 0.838
NH 0.818 0.444 0.65 0.697
DHP 1 0.222 0.3 0.697
RSA 0.727 0.555 0.65 0.773
Model 0.909 0.777 0.857 0.934
Table 8 DT analysis: sensitivity, specificity, precision, accuracy and
AUC
Metric Sensitivity Specificity Accuracy AUC
NDC 1 0.666667 0.85 0.833
NBC 0.363636364 1 0.65 0.682
NC 0.363636364 1 0.65 0.682
RBC 1 0.444444 0.75 0.823
NAFC 1 0 0.55 0.5
NADC 0.818181818 0.666667 0.75 0.742
NABC 0.363636364 1 0.65 0.682
NA 1 0.555556 0.8 0.778
NH 1 0 0.55 0.5
DHP 1 0.222222 0.65 0.611
RSA 0.727272727 0.888889 0.8 0.808
Model 1 0.888889 0.95 0.985
Table 9 Naive BC analysis: sensitivity, specificity, accuracy and
AUC
Metric Sensitivity Specificity Accuracy AUC
NDC 1 0.666667 0.85 0.854
NBC 0.363636364 0.888889 0.6 0.687
NC 0.727272727 0.777778 0.75 0.788
RBC 0.545454545 0.444444 0.5 0.626
NAFC 0.363636364 1 0.65 0.682
NADC 0.818181818 0.444444 0.65 0.747
NABC 0.363636364 0.888889 0.6 0.687
NA 0.727272727 0.777778 0.75 0.848
NH 0.363636364 0.888889 0.6 0.697
DHP 0.181818182 1 0.55 0.682
RSA 0.818181818 0.888889 0.85 0.848
Model 0.818181818 1 0.9 0.96
Int J Syst Assur Eng Manag
123
Page 12
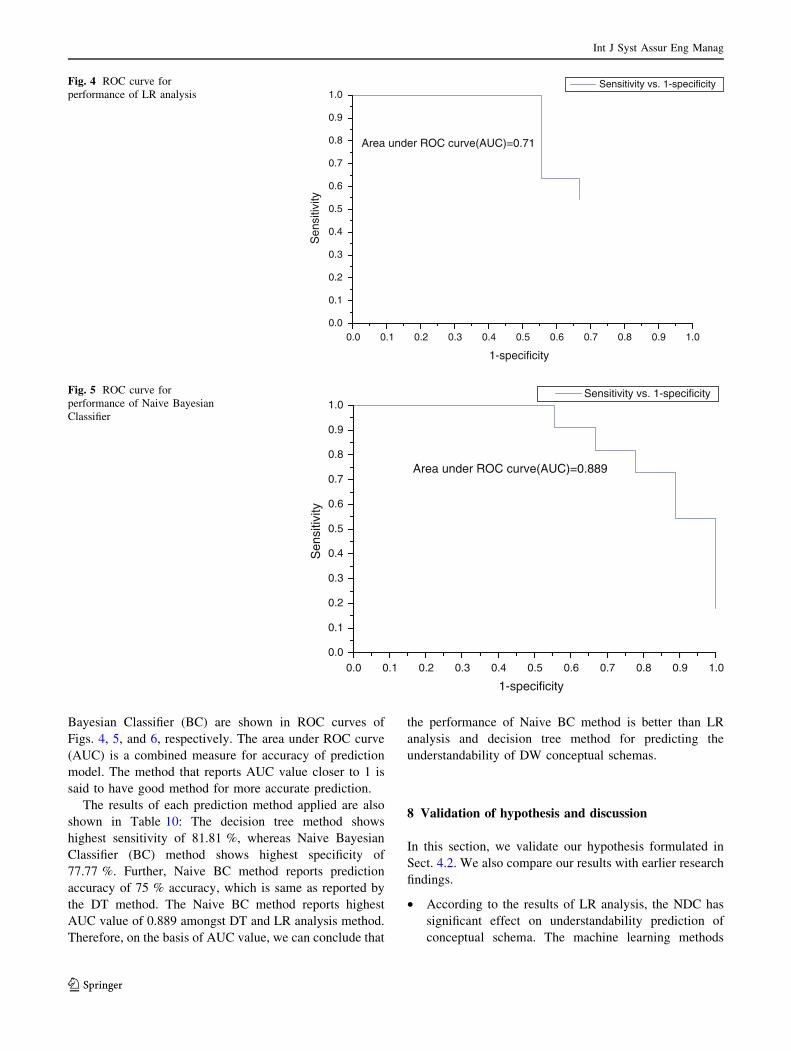
Bayesian Classifier (BC) are shown in ROC curves of
Figs. 4, 5, and 6, respectively. The area under ROC curve
(AUC) is a combined measure for accuracy of prediction
model. The method that reports AUC value closer to 1 is
said to have good method for more accurate prediction.
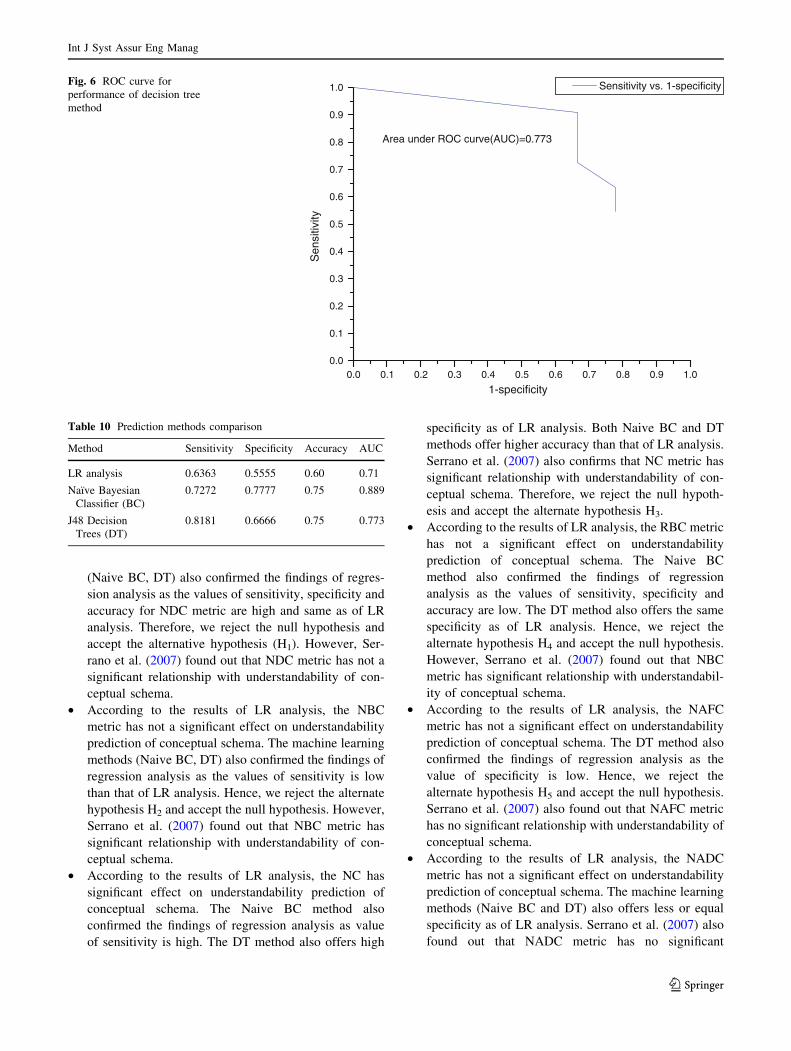
The results of each prediction method applied are also
shown in Table 10: The decision tree method shows
highest sensitivity of 81.81 %, whereas Naive Bayesian
Classifier (BC) method shows highest specificity of
77.77 %. Further, Naive BC method reports prediction
accuracy of 75 % accuracy, which is same as reported by
the DT method. The Naive BC method reports highest
AUC value of 0.889 amongst DT and LR analysis method.
Therefore, on the basis of AUC value, we can conclude that
the performance of Naive BC method is better than LR
analysis and decision tree method for predicting the
understandability of DW conceptual schemas.
8 Validation of hypothesis and discussion
In this section, we validate our hypothesis formulated in
Sect. 4.2. We also compare our results with earlier research
findings.
• According to the results of LR analysis, the NDC has
significant effect on understandability prediction of
conceptual schema. The machine learning methods
0.0 0.1 0.2 0.3 0.4 0.5 0.6 0.7 0.8 0.9 1.00.0
0.1
0.2
0.3
0.4
0.5
0.6
0.7
0.8
0.9
1.0
Area under ROC curve(AUC)=0.71
Sensitivity vs. 1-specificity
Sen
sitiv
ity
1-specificity
Fig. 4 ROC curve for
performance of LR analysis
0.0 0.1 0.2 0.3 0.4 0.5 0.6 0.7 0.8 0.9 1.00.0
0.1
0.2
0.3
0.4
0.5
0.6
0.7
0.8
0.9
1.0
Area under ROC curve(AUC)=0.889
Sensitivity vs. 1-specificity
Sen
sitiv
ity
1-specificity
Fig. 5 ROC curve for
performance of Naive Bayesian
Classifier
Int J Syst Assur Eng Manag
123
Page 13
(Naive BC, DT) also confirmed the findings of regres-
sion analysis as the values of sensitivity, specificity and
accuracy for NDC metric are high and same as of LR
analysis. Therefore, we reject the null hypothesis and
accept the alternative hypothesis (H1). However, Ser-
rano et al. (2007) found out that NDC metric has not a
significant relationship with understandability of con-
ceptual schema.
• According to the results of LR analysis, the NBC
metric has not a significant effect on understandability
prediction of conceptual schema. The machine learning
methods (Naive BC, DT) also confirmed the findings of
regression analysis as the values of sensitivity is low
than that of LR analysis. Hence, we reject the alternate
hypothesis H2 and accept the null hypothesis. However,
Serrano et al. (2007) found out that NBC metric has
significant relationship with understandability of con-
ceptual schema.
• According to the results of LR analysis, the NC has
significant effect on understandability prediction of
conceptual schema. The Naive BC method also
confirmed the findings of regression analysis as value
of sensitivity is high. The DT method also offers high
specificity as of LR analysis. Both Naive BC and DT
methods offer higher accuracy than that of LR analysis.
Serrano et al. (2007) also confirms that NC metric has
significant relationship with understandability of con-
ceptual schema. Therefore, we reject the null hypoth-
esis and accept the alternate hypothesis H3.
• According to the results of LR analysis, the RBC metric
has not a significant effect on understandability
prediction of conceptual schema. The Naive BC
method also confirmed the findings of regression
analysis as the values of sensitivity, specificity and
accuracy are low. The DT method also offers the same
specificity as of LR analysis. Hence, we reject the
alternate hypothesis H4 and accept the null hypothesis.
However, Serrano et al. (2007) found out that NBC
metric has significant relationship with understandabil-
ity of conceptual schema.
• According to the results of LR analysis, the NAFC
metric has not a significant effect on understandability
prediction of conceptual schema. The DT method also
confirmed the findings of regression analysis as the
value of specificity is low. Hence, we reject the
alternate hypothesis H5 and accept the null hypothesis.
Serrano et al. (2007) also found out that NAFC metric
has no significant relationship with understandability of
conceptual schema.
• According to the results of LR analysis, the NADC
metric has not a significant effect on understandability
prediction of conceptual schema. The machine learning
methods (Naive BC and DT) also offers less or equal
specificity as of LR analysis. Serrano et al. (2007) also
found out that NADC metric has no significant
0.0 0.1 0.2 0.3 0.4 0.5 0.6 0.7 0.8 0.9 1.00.0
0.1
0.2
0.3
0.4
0.5
0.6
0.7
0.8
0.9
1.0
Area under ROC curve(AUC)=0.773
Sensitivity vs. 1-specificity
Sen
sitiv
ity
1-specificity
Fig. 6 ROC curve for
performance of decision tree
method
Table 10 Prediction methods comparison
Method Sensitivity Specificity Accuracy AUC
LR analysis 0.6363 0.5555 0.60 0.71
Naı̈ve Bayesian
Classifier (BC)
0.7272 0.7777 0.75 0.889
J48 Decision
Trees (DT)
0.8181 0.6666 0.75 0.773
Int J Syst Assur Eng Manag
123
Page 14
relationship with understandability of conceptual
schema. Hence, we reject the alternate hypothesis H6
and accept the null hypothesis.
• According to the results of LR analysis, the NABC
metric has not a significant effect on understandability
prediction of conceptual schema. The machine learning
methods (Naive BC, DT) also confirmed the findings of
regression analysis as values of sensitivity and accuracy
are low. Serrano et al. (2007) also found out that NABC
metric has no significant relationship with understand-
ability of conceptual schema. Hence, we reject the
alternate hypothesis H7 and accept the null hypothesis.
• According to the results of LR analysis, the NA has
significant effect on understandability prediction of
conceptual schema. The machine learning methods
(Naive BC, DT) also confirmed the findings of regression
analysis as values of sensitivity, specificity and accuracy
are high. Serrano et al. (2007) also confirms that NA
metric has significant relationship with understandability
of conceptual schema. Therefore, we reject the null
hypothesis and accept the alternate hypothesis H8.
• According to the results of LR analysis, the NH metric
has not a significant effect on understandability
prediction of conceptual schema. The DT method also
confirmed the findings of regression analysis as the
values of specificity and accuracy are low. Therefore,
we reject the alternate hypothesis H9 and accept the null
hypothesis. However, Serrano et al. (2007) found that
NH metric has significant relationship with understand-
ability of conceptual schema.
• According to the results of LR analysis, the DHP metric
has not a significant effect on understandability
prediction of conceptual schema. The DT method also
confirmed the findings of regression analysis as the
value of specificity is low. Therefore, we reject the
alternate hypothesis H10 and accept the null hypothesis.
However, Serrano et al. (2007) found that NH metric
has significant relationship with understandability of
conceptual schema.
• According to the results of LR analysis, the RSA metric
has not a significant effect on understandability
prediction of conceptual schema. The DT method also
confirmed the findings of regression analysis as the
value of sensitivity is low. Serrano et al. (2007) also
found that RSA metric has no significant relationship
with understandability of conceptual schema. There-
fore, we reject the alternate hypothesis H11 and accept
the null hypothesis.
• The NDC and NC metrics are included in the multi-
variate analysis method, i.e. NDC and NC metrics in
combination are best predictors for understandability of
conceptual schema. Therefore, we accept the alternate
hypothesis H12 and reject the null hypothesis.
In some cases, we found some contradictions with ear-
lier research findings of other authors. These contradictions
may happen because of the various threats to the validity of
results (for example, threats to construct, internal, external
and conclusion validity), as discussed in the next secton.
9 Threats to validity of results
In this section, we discuss threats to construct, internal,
external and conclusion validity.
• Construct validity The construct validity is the degree
to which the independent and the dependent variables
are accurately measured by the measurement instru-
ments used in the study. We use the dependent variable
as understanding time i.e., the time each subject taken
to perform given tasks, so we consider that variable is
constructively valid. The construct validity of the
measures used for the independent variables (Structural
Metrics) is guaranteed by the Distance framework
(Poels and Dedene 1999) used for their theoretical
validation.
• Internal validity The internal validity is the degree to
which conclusions can be drawn about the causal effect
of independent variables on the dependent variables.
The following issues should be considered:
• Differences among subjects Experiments with in the
subjects reduce variability among subjects.
• Differences among schemas The considered sche-
mas had different domains. This could affect the
results obtained in some way.
• Precision of time recorded The subjects were asked
to record the start and finish times of each given
test. In our view, this method is more effective than
deploying another person to records the time of
each subject. However, we also understand that the
subject could introduce some imprecision while
recording the time.
• Learning effects The tests were ordered and given in
a distinct order for different subjects. So, each
subject answered the tests in the given order. In
doing this, we tried to minimize learning effects.
• Fatigue effects The average time for completing the
experiment was 16.85 min varying from a mini-
mum of approximately 12.30 min and a maximum
of about 22.21 min. With this range of times we
believe that fatigue effects hardly exist at all. Also,
the different order of the tests helped to avoid these
fatigue effects.
• Persistence effects In our case, persistence effects
were not present because the subjects had never
participated in a similar experiment.
Int J Syst Assur Eng Manag
123
Page 15
• Motivation among subjects Subjects were volun-
teers and they were convinced that they were doing
useful exercises. The subjects wanted to participate
in the experiment. Therefore, we believe that
subjects were motivated at doing the experiment.
• Plagiarism and influence among subjects In order to
avoid these effects a supervisor was present during
the experiment. Subjects were informed they should
not talk to each other and they will not share their
answers with other subjects.
• External validity The external validity is the degree to
which the results of the research can be generalized to
the population under study and to other research
settings. The greater the external validity, the more
the results of an empirical study can be generalized to
actual software engineering practice. Two threats to
validity have been identified which limit the ability to
apply any such generalization:
• Materials and tasks used We tried to use schemas
and operations representative of real world cases in
the experiments, although more experiments with
larger and more complex schemas are necessary.
• Subjects Although this experiment was run by M.
Tech. students, we understand that the number of
subjects, in our case 18 subjects could be insuffi-
cient for generalizing the results obtained. More
experiments with practitioners and professionals
must be carried out in order to be able to generalize
the results.
• Conclusion validity The conclusion validity defines the
extent to which conclusions are statistically valid. The
only issue that could affect the statistical validity of this
study is the size of the sample data (20 values), which we
feel is not enough for both parametric and non-paramet-
ric statistic tests (Briand et al. 1995). We will try to obtain
bigger sample data through more experimentation.
10 Conclusions and future work
In this paper, we performed the experiment where 18 M.
Tech. (Engineering Postgraduate) students were given 20
conceptual schemas of DW. They analyzed them and
answer the given questions and recorded the time (under-
standing time) taken for each schema. We applied statis-
tical and machine learning methods on the collected data to
predict the effect of (individual or combined) schema
metrics on its understandability. The analysis results of all
these methods have been presented in Sects. 6 and 7. All
the proposed hypothesis have been successfully validated,
as already presented in the Sect. 8. Following are the points
worth notable based on the results of all the three predic-
tion methods (LR analysis, DT, Naive BC):
• The NDC, NC and NA metrics have significant effect
on understandability of conceptual schema of DW. It
has also been shown that the NDC metric has highest
sensitivity, highest specificity and highest accuracy
amongst all the metrics. Therefore, we accepted the
alternate hypothesis corresponding to these three met-
rics and rejected the null hypothesis.
• The remaining metrics (NBC, RBC, NAFC, NADC,
NABC, NH, DHP, RSA) are not to found to have
significant effect on understandability of conceptual
schema. Therefore, we rejected the alternate hypothesis
for these metrics and accepted the null hypothesis.
• LR analysis results showed that the NDC and NC have
combined effect on understandability of conceptual
schema.
• We have evaluated the performance of each prediction
method on the basis of receiver operating characteris-
tics (ROC) analysis. The performance comparison of
prediction methods (ref. Sect. 7) showed that Naive
Bayes Classifier method has predicted understandabil-
ity more accurately, as the value of the area under ROC
cure (AUC) is highest (0.889).
We only considered 20 conceptual schemas and
involved only 18 subjects (students), with this small data, it
seems difficult to generalize the results obtained in our
study. In near future, we will consider more number of
conceptual schemas and more number of subjects to rep-
licate the experiment. We would also apply more machine
learning methods such as SVM, Random forest etc. to
validate the effect of structural metrics on understand-
ability. This will help to generalize the results obtained.
References
Abello A, Samos J, Saltor F (2001) A framework for the classification
and description of multidimensional data models. In: Proceed-
ings of 12th international conference on database and expert
systems applications (DEXA’2001), Springer-Verlag, Munich
Abello A, Samos J, Saltor F (2002) YAM2 (yet another multidimen-
sional model): an extension of UML. In: Proceedings of
international database engineering and applications symposium
(IDEAS’2002), IEEE Computer Society, Edmonton, pp 172–181
Aggarwal KK, Singh Y, Kaur A, Malhotra R (2009) Empirical
analysis for investigating the effect of object-oriented metrics on
fault proneness: a replicated case study. Softw Process Improv
Pract 16(1):39–62
Basili V, Briand L, Melo W (1996) A validation of object-oriented
design metrics as quality Indicators. IEEE Trans Softw Eng
22(10):751–761
Blaschka M, Sapia C, Hofling G, Dinter B (1998) Finding your way
through multidimensional data models. In: 9th International
conference on database and expert systems applications
(DEXA’98), Springer-Verlag, Vienna, pp 198–203
Int J Syst Assur Eng Manag
123
Page 16
Bouzeghoub M, Kedad Z (2002) Information and database quality,
chapter 8. In: Piattini M, Calero C, Genero M (eds) Quality in
data warehousing. Kluwer Academic Publishers, Boston,
pp 163–198
Briand L, El Emam K, Morasca S (1995) Theoretical and empirical
validation of software product measures. Technical Report
ISERN-95-03, International Software Engineering Research
Network
Cherfil SS, Prat N (2003) Multidimensional schemas quality:
assessing and balancing analyzability and simplicity. In: Pro-
ceedings of ER Workshops, Springer LNCS 2814, pp 140–151
El Emam K, Benlarbi S, Goel N, Rai S (1999) A validation of object-
oriented metrics. NRC Technical report ERB-1063
English L (1996) Information quality improvement: principles,
methods and management. Information Impact International,
Inc., Brentwood
Fenton N, Pfleeger S (1997) Software metrics: a rigorous approach.
Chapman & Hall, London
Golfarelli M, Rizzi S (1998) A methodological framework for data
warehouse design. In: 1st International Workshop on Data
Warehousing and OLAP (DOLAP’98), Bethesda, pp 3–9
Golfarelli M, Maio D, Rizzi S (1998) The dimensional fact model: a
conceptual model for data warehouses. Int J Coop Inf Syst
7:215–247
Han J, Kamber M (2007) Data mining: concepts and techniques.
Morgan Kaufman, San Francisco
Harinarayan V, Rajaraman A, Ullman JD (1996) Implementing data
cubes efficiently. In: Proceedings of ACM SIGMOD interna-
tional conference on management of data, pp 205–216
Hosmer D, Lemeshow S (1989) Applied logistic regression. Wiley,
New York
Husemann B, Lechtenborger J, Vossen G (2000) Conceptual data
warehouse design. In: Proceedings of the international workshop
on design and management of data warehouses (DMDW’2000),
Stockholm, pp 3–9
Inmon WH (2003) Building the data warehouse. Wiley, New York
Jarke M, Lenzerini M, Vassiliou Y, Vassiliadis P (2002) Fundamen-
tals of data warehouses. Springer-Verlag, Berlin
Jeusfeld M, Quix C, Jarke M (1998) Design and analysis of quality
information for data warehouses. In: Proceedings of 17th
International conference on conceptual modeling, Singapore
Kimball R, Ross M (2002) The data warehouse toolkit. Wiley, New
York
Kohavi R (1995) The power of decision tables. In: Proceedings of
eighth European conference on machine learning (ECML’1995),
Heraklion, pp 174–189
Labio W, Quass D, Adelberg B (1997) Physical database design for
data warehouses. In: Proceedings of 13th international confer-
ence on data engineering, IEEE Computer Society, Birmingham,
pp 277–288
Lechtenborger J, Vossen G (2003) Multidimensional normal forms
for data warehouse design. Inform Syst 28:415–434
Lehner W, Albretch J, Weekends H (1998) Normal forms for
multidimensional databases. In: Proceedings of international
conference on scientific and statistical database management,
IEEE Press, pp 63–72
Lujan-Mora S, Trujillo J, Song IY (2002) Extending UML for
multidimensional modeling. In: Proceedings of 5th international
conference on the unified modeling language (UML 2002),
LNCS 2460, Dresden, pp 290–304
Malhotra M, Kaur A, Singh Y (2010) Empirical validation of object-
oriented metrics for predicting fault proneness at different
severity levels using support vector machine. Int J Syst Assur
Eng Manag 1(3):269–281
OMG (2005) OMG unified modeling language specification, version
2.0. Object Management Group, Needham Heights
Poels G, Dedene G (1999) DISTANCE: a framework for software
measure construction. Research Report DTEW9937. Dept.
Applied Economics, Katholieke Universiteit Leuven, Leuven
Ross Q (1993) C4.5: programs for machine learning. Morgan
Kaufman, San Mateo
Sapia C (1999) On modeling and predicting query behaviour in OLAP
systems. In: Proceedings of international workshop on design
and management of data warehouses (DMDW’99), Heidelberg,
pp 1–10
Sapia C, Blaschka M, Hofling G, Dinter B (1998) Extending the E/R
model for the multidimensional paradigm. In: Proceedings of 1st
international workshop on data warehouse and data mining
(DWDM’98), Springer-Verlag, Singapore, pp 105–116
Serrano M (2004) Definition of a set of metrics for assuring data
warehouse quality. University of Castilla, La Mancha
Serrano M, Calero C, Piattini M (2002) Validating metrics for data
warehouses. IEE Softw 149(5):161–166
Serrano M, Trujillo J, Calero C, Piattini M (2007) Metrics for data
warehouse conceptual models understandability. Inf Softw
Technol 49:851–870
Serrano M, Trujillo J, Calero C, Sahraouh HA, Piattini M (2008)
Empirical studies to assess the understandability of data
warehouse schemas using structural metrics. Softw Qual J
16(1):79–106
Singh Y, Kaur A, Malhotra M (2010) Empirical validation of object-
oriented metrics for predicting fault proneness models. Softw
Qual J 18:3–35
Stone M (1974) Cross-validatory choice and assessment of statistical
predictions. J R Stat Soc 36:111–147
Trujillo J, Palomar M, Gomez J, Song IY (2001) Designing data
warehouses with OO conceptual models. IEEE Comput
34:66–75
Tryfona N, Busborg F, Christiansen J (1999) starER: a conceptual
model for data warehouse design. In: Proceedings of the 2nd
ACM international workshop on data warehousing and OLAP
(DOLAP’99), Missouri, pp 3–8
Vassiliadis P (2000) Data warehouse modeling and quality issues.
National Technical University of Athens, Athens
Witten IH, Frank E (2011) Data mining: practical machine learning
tools and techniques with java implementations. Morgan Kauf-
man/Addison-Wesley, San Francisco
Int J Syst Assur Eng Manag
123