Page 1
©© Intangible Capital, 2009 – 5(3): 235-258 – ISSN: 1697-9818
doi: 10.3926/ic.2009.v5n3.p235-258
Empirical testing the relationship between income distribution, perceived value money… 235
Ismail et al.
Empirically testing the relationship between
income distribution, perceived value money and
pay satisfaction
Azman Ismail Universiti Malaysia Sarawak (Malaysia)
[email protected]
Antonia Girardi Murdoch University (Australia)
[email protected]
Mohd Noor Mohd Shariff Universiti Utara Malaysia (Malaysia)
[email protected]
Muhammad Madi Abdullah Universiti Teknologi Malaysia (Malaysia)
[email protected]
Oscar Dousin Universiti Malaysia Sarawak (Malaysia)
[email protected]
Zainal Ariffin Ahmad Universiti Sains Malaysia (Malaysia)
[email protected]
Abdul Halim Majid Universiti Utara Malaysia (Malaysia)
[email protected]
Zalina Ibrahim Universiti Teknologi MARA (Malaysia)
[email protected]
Received April, 2009
Accepted July, 2009
Abstract:
Compensation management literature highlights that income has three major
features: salary, bonus and allowance. If the level and/or amount of income are
distributed to employees based on proper rules this may increase pay satisfaction.
More importantly, a thorough investigation in this area reveals that the effect of
income distribution on pay satisfaction is not consistent if perceived value of
money is present in organizations. The nature of this relationship is less
Page 2
©© Intangible Capital, 2009 – 5(3): 235-258 – ISSN: 1697-9818
doi: 10.3926/ic.2009.v5n3.p235-258
Empirical testing the relationship between income distribution, perceived value money… 236
Ismail et al.
emphasized in pay distribution literature. Therefore, this study was conducted to
measure the effect of the perceived value of money and income distribution on pay
satisfaction using 136 usable questionnaires gathered from employees who have
worked in one city based local authority in Sabah, Malaysia (MSLAUTHORITY).
Outcomes of hierarchical regression analysis showed that the interaction between
perceived value of money and income distribution significantly correlated with pay
satisfaction. This result confirms that perceived value of money does act as a
moderating variable in the income distribution model of the organizational sample.
In addition, discussion and implications of this study are elaborated.
Keywords: income distribution, perceived value of money, pay satisfaction,
Malaysia.
JEL Code: O15
1. Introduction
Income is a crucial element of compensation management system (Drucker and
White, 2000; Henderson, 2006; Mitchell and Mickel, 1999) where it is often viewed
as monetary reward, direct payment, cash payment and/or extrinsic reward
(Bergmann and Scarpello, 2002; Chiu et al., 2001; Milkovich and Newman, 2008).
Specifically, it consists of three major features: salary, bonus and allowance
(Lowery et al., 2002; Tang, 2007; Young, 1999). Salary is often viewed as a base
pay that is given to employees on a weekly, monthly or yearly basis based on job
structure (e.g., basic salary, but not including incentives) (Henderson, 2006;
Young, 1999). Bonus is usually seen as cash payment provided to employees
based on their performance (e.g., monetary incentives for achieving job targets)
(Bloom and Milkovich, 1998; Gupta and Shaw, 1998; Lowery et al., 2002).
Allowance is often related to additional financial rewards legally provided to
employees based on the employment contract or organization related service (e.g.,
entertainment allowance or allowance fixed for particular jobs or service schemes)
(Bergmann & Scarpello, 2002; Milkovich and Newman, 2008). These income
packages are designed to reward employees who perform a specific job or service
(Anthony et al., 2002; Dessler, 2006; Ismail, 2007).
Page 3
©© Intangible Capital, 2009 – 5(3): 235-258 – ISSN: 1697-9818
doi: 10.3926/ic.2009.v5n3.p235-258
Empirical testing the relationship between income distribution, perceived value money… 237
Ismail et al.
Income distribution is a segment of pay design issues where it is often interpreted
based on two major perspectives: quantitative and qualitative. From a quantitative
perspective, it is often viewed as the level and/or amount of income that an
individual receives from his/her employer based on a mathematical formula, such
as statistics, economics, finance and/or accounting (Henderson, 2006; Milkovich
and Newman, 2008). Conversely, from a qualitative perspective, the level and/or
amount of income package is often viewed based on human psychology, that is, an
individual’s perception, feeling or judgement (Greenberg, 2003; Skarlicki and
Folger, 1997). From this perspective, employees often perceive that the level
and/or amount of income package that they receive from their employers as
adequate if such income packages meet their needs and expectations (Adams,
1963, 1965; Allen and White, 2002; Luna-Arocas and Tang, 1998; Tang et al.,
2004b).
Traditionally, most organizations design a standard income package to reward their
employees based on job structure, such as position, seniority and/or length of
service (Bergmann and Scarpello, 2002; Dessler, 2006; Giacobbe-Miller et al.,
1998). These income packages are widely used by organizations that operate in a
stable marketplace environment, but they are not able to attract, retain and
motivate competent employees to sustain and increase organizational
competitiveness in dynamic marketplace (Lawler, 2000; Milkovich and Newman,
2008). In the present era of global competition, many organizations have shifted
their paradigms of compensation program from a traditional job based income to
organizational culture and strategy (Anthony et al., 2002; Gomez-Mejia and Balkin,
1992a, 1992b; Henderson, 2006). In order to realize this objective, an employer
designs income distribution rules that align to dynamic changes that occur outside
and inside organizations. External organizational factors or external
competitiveness variables that the organizations have to deal with include
economic pressures, government policies, law and regulations, ownership, custom
and practices. Inside organizational factors are also said as internal alignment
variables, which refer to corporate strategy, management philosophy, type of job
and productivity level (Anthony et al., 2002; Gomez-Mejia and Balkin, 1992a,
1992b; Milkovich and Newman, 2008).
These variables strongly affect many organizations to design income distribution
rules based on performance (Giacobbe-Miller et al., 1998; Henderson, 2006; Lee et
Page 4
©© Intangible Capital, 2009 – 5(3): 235-258 – ISSN: 1697-9818
doi: 10.3926/ic.2009.v5n3.p235-258
Empirical testing the relationship between income distribution, perceived value money… 238
Ismail et al.
al., 1999). Performance based income is often referred to as provision of additional
monetary rewards, on top of employees’ basic pay, based on contributions made
by the employee (Gomez-Mejia and Balkin, 1992a, 1992b; Lee, et al., 1999;
Milkovich and Newman, 2008). Many scholars think that job based income and
performance based income use different treatments, but properly implemented,
such income systems based on appropriate rules may increase pay satisfaction in
organizations (Heneman et al., 1997; Tang, 1995; Tang and Chiu, 2003; Tang et
al., 2004b). According to several scholars, pay satisfaction may be viewed as an
individual who perceives that his/her employer allocates the level and/or amount of
pay equitable with his/her needs and expectations, this feeling may lead to
increase in the notion of pay satisfaction (Heneman et al., 1997; Lawler, 1971;
Tang et al., 2002, 2004b; Roberts et al., 1999).
Surprisingly, observation of such a relationship revealed that the effect of income
distribution on pay satisfaction is not consistent if perceived value of money is
present in the organizations (Adams, 1963, 1965; Allen and White, 2002; Lawler,
1971; Tang et al., 2004a). Perceived value of money is often interpreted based on
an individual’s frame of reference and/or in the eye of the beholder (Aryee, 1999;
Hoon and Lim, 2001; Tang, 1992, 1993; Tang, 2007). From this perspective, the
value of money may be seen as useful and valuable if it can be used by an
individual to meet basic needs, improve standard of living and increase status in
society (Aryee, 1999; Furnham and Okamura, 1999; Maslow, 1943, 1945; Luna-
Arocas and Tang, 2004; Tang, 2007).
Within a pay design framework, many scholars think that income distribution;
perceived value of money and pay satisfaction are distinct constructs, but highly
interrelated (Aryee, 1999; Luna-Arocas and Tang, 1998, 2004; Tang, 1995; Tang
and Chiu, 2003). For example, the ability of an employer to properly allocate the
level and/or amount of income based on proper rules will increase pay satisfaction
if employees perceive that their incomes can be used to meet their needs and
expectations (Luna-Arocas and Tang, 1998, 2004; Tang et al., 2004a, 2004b).
Although the nature of this relationship has been studied, the moderating effect of
perceived value of money in pay distribution models is less emphasized. Perceived
value of money has been less emphasized because previous studies over
emphasized on a segmented approach in analyzing income distribution rules, and
neglected the importance of human needs in developing income distribution
Page 5
©© Intangible Capital, 2009 – 5(3): 235-258 – ISSN: 1697-9818
doi: 10.3926/ic.2009.v5n3.p235-258
Empirical testing the relationship between income distribution, perceived value money… 239
Ismail et al.
models. This approach may not be able to highlight the moderating role of
perceived value of money in income distribution literature (Heneman et al., 1997;
Tang, 1995; Tang et al., 2004a, 2004b). Hence, it motivates the researchers to
examine the effect of income distribution and perceived value of money on pay
satisfaction that occurs in one city based local authority in Sabah, Malaysia
(MSLAUTHORITY). For confidential reasons, the name of this organization is kept
anonymous.
2. Context of the Study
Many researchers argue that the nature of Malaysian public service sector has
become one of the key factors that strongly affect the design of pay systems in
government agencies (Ismail et al., 2007; Sulaiman and Mamman, 1996). For
example, several reports of the Malaysian Royal Commission on salary (Aziz
Report, 1968; Jabatan Perkhidmatan Awam, 2002; Suffian Report, 1967) reveal
that compensation policies and procedures for public sector employees in Malaysia
are designed, administered and monitored by a central government agency,
namely Public Service Department (PSD). For example, in 1991, the New
Remuneration System (SSB) was implemented in the Malaysian public sector to
strengthen the traditional job based pay by adding merit principles as a criterion to
determine extra rewards for high performing employees (Jabatan Perkhidmatan
Awam, 1991; Mahathir Report, 1991). In order to increase the effectiveness of
public service sector in meeting great challenges in 21st century, pay distribution
rules as practiced in the SSB were replaced by the Malaysian Remuneration System
(MRS) in 2002 (Jabatan Perkhidmatan Awam, 2002; Malaysian Public Service
Department, 2006). This new pay system has strongly influenced pay systems
implemented in one city based local authority in Sabah, Malaysia
(MSLAUTHORITY).
In order to understand the nature of compensation system practiced in the
organization, in-depth interviews were conducted involving one executive officer
and one assistant administrative officer during and before the pilot study. In terms
of income distribution, the HR department is not given sufficient autonomous
power to design the income packages for all job categories, but they are allowed to
use their creativities and innovations to improve the process and systems of
allocating the level and/or amount of monetary rewards within the limits set up by
Page 6
©© Intangible Capital, 2009 – 5(3): 235-258 – ISSN: 1697-9818
doi: 10.3926/ic.2009.v5n3.p235-258
Empirical testing the relationship between income distribution, perceived value money… 240
Ismail et al.
the PSD (Jabatan Perkhidmatan Awam, 2007). In the organization, all employees
are entitled to receive three types of income: salary, bonus and allowance. As a
government entity, this income is determined to all employees based on job
(position, seniority and/or length of service) and/or performance (merit).
Employees who work in different and/or similar job groups have different views
about the implementation of such distribution rules. For example, if employees
perceive that the level and/or amount of income that they receive are allocated
based on proper rules (i.e., job and/or performance), this will lead to higher pay
satisfaction (e.g., no complaints, positive judgments and appreciate the
implementation of pay systems). Further, a thorough investigation of the interview
results reveals that employees who perceive the money that they receive from
their employers as high value (i.e., meet basic necessities and improve standard of
living), this may lead to higher pay satisfaction. The nature of this relationship is
interesting, but the moderating role of perceived value of money in the income
distribution model of the organization is less emphasized because of the paucity of
research literature in this country (Dousin, 2008).
3. Relationship between Income Distribution and Pay Satisfaction
Previous studies using a direct effects model shows that income distribution has a
significant impact on pay satisfaction (Tang, 1995; Tang and Chiu, 2003; Tang et
al., 2002, 2004b). For example, three surveys about income distribution were
conducted using different samples, such as 456 employees from nursing
departments in a large Midwestern hospital in a metropolitan area (Heneman et al.,
1997), 390 R&D personnel in three Indian public sector (Das and Bhadury, 1997),
211 full-time employees in Hong Kong, China (Tang and Chiu, 2003), 458
participants in the Southern US (Tang, 2007), and 332 US and Belgian employees
in US organizations (Harris et al., 2008). These studies found that the ability of
managers to adequately allocated the level and/or amount of income based on
employee contributions (e.g., job and/or performance) had strongly invoked
employees’ satisfaction with pay in the organizations. Thus, we hypothesized that:
H1: There is a significant relationship between income distribution and pay
satisfaction.
Page 7
©© Intangible Capital, 2009 – 5(3): 235-258 – ISSN: 1697-9818
doi: 10.3926/ic.2009.v5n3.p235-258
Empirical testing the relationship between income distribution, perceived value money… 241
Ismail et al.
4. Relationship between Income Distribution, Perceived Value of Money
and Pay Satisfaction
Many recent studies using an indirect effects model have focused on the
relationship between pay distribution, perceived value of pay and pay satisfaction,
but such studies have overlooked to emphasize the moderating variable of
perceived value of money in the relationship between income distribution and pay
satisfaction (Adams, 1963, 1965; Allen & White, 2002; Tang et al., 2004a;
Williams et al., 2006). For example, two studies about pay distribution that were
conducted in different samples, such as 311 university lecturers in US and Spain
(Tang et al. 2004a) and 213 samples from 182 studies gathered in the meta-
analysis of multiple dimensions of compensation satisfaction (Williams et al., 2006)
revealed that employees who perceived the level and/or amount of income that
they received from their employers could be used to fulfill their needs and
expectations (e.g., basic needs, and improve standard of living, quality of life and
statuses) had strongly invoked employees’ perceived value of money.
Consequently, it could lead to higher pay satisfaction in the organizations (Tang et
al., 2004a; Williams et al., 2006).
The compensation research literature is consistent with the notion of organizational
behavior theory. For example, Ajzen and Fishbein’s (1977) ABC model states that
money may be viewed as an affective component (not as a devil), cognitive
component (a sign of success), and behavior component (ability to use money to
meet individuals’ needs and expectations). Relying on these views, individuals who
perceived money as useful, important, valuable and breadwinner are individuals
who have high economic values and feelings of satisfaction with high level and/or
amount of income (Aryee, 1999; Tang, 1995, 2007; Tang et al., 2000, 2002).
Besides that, Adams’ (1963, 1965) equity theory, Allen and White’s (2002) equity
sensitivity theory and Lawler’s (1971) discrepancy theory explicitly posit that as a
result of comparison between rewards (e.g., money) and job ratio will affect
individuals’ cognitives and emotions, this may influence their behaviors (i.e.,
action) in organizations (Adams, 1963, 1965; Allen and White, 2002; Lawler,
1971). These theories have used different treatments in studying compensation
issues, but the notion of expectations and perceptions of one actual received can
be applied in income distribution (Blau and Kahn, 2003; Greenberg, 2003; McFarlin
and Sweeney, 1992; Sweeney and McFarlin, 1993). Application of the theories in
Page 8
©© Intangible Capital, 2009 – 5(3): 235-258 – ISSN: 1697-9818
doi: 10.3926/ic.2009.v5n3.p235-258
Empirical testing the relationship between income distribution, perceived value money… 242
Ismail et al.
pay distribution framework highlights that individuals often compare outputs (e.g.
income) that they receive with inputs that they contribute (e.g. education,
experience, skills and effort) in organizations. If individuals perceive that they
receive an equitable income-contribution ratio, this will increase their perceived
value of money, which in turn, will lead to higher pay satisfaction (Lawler, 1971;
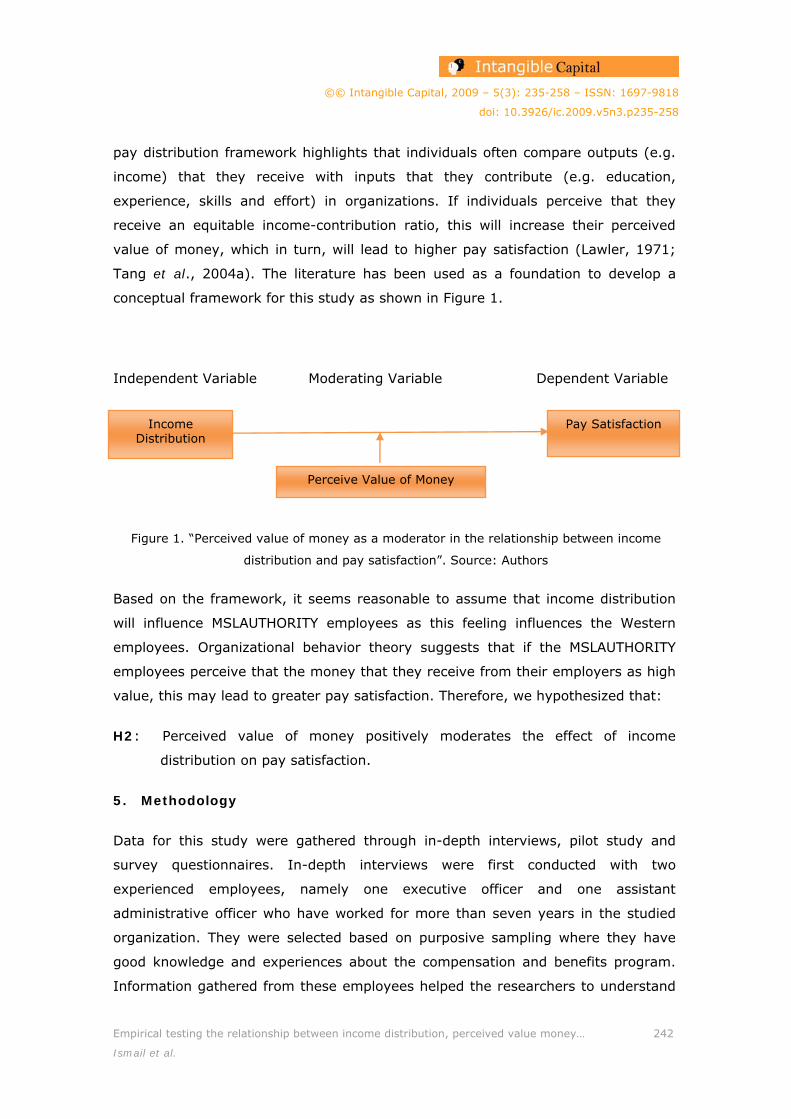
Tang et al., 2004a). The literature has been used as a foundation to develop a
conceptual framework for this study as shown in Figure 1.
Independent Variable Moderating Variable Dependent Variable
Figure 1. “Perceived value of money as a moderator in the relationship between income
distribution and pay satisfaction”. Source: Authors
Based on the framework, it seems reasonable to assume that income distribution
will influence MSLAUTHORITY employees as this feeling influences the Western
employees. Organizational behavior theory suggests that if the MSLAUTHORITY
employees perceive that the money that they receive from their employers as high
value, this may lead to greater pay satisfaction. Therefore, we hypothesized that:
H2: Perceived value of money positively moderates the effect of income
distribution on pay satisfaction.
5. Methodology
Data for this study were gathered through in-depth interviews, pilot study and
survey questionnaires. In-depth interviews were first conducted with two
experienced employees, namely one executive officer and one assistant
administrative officer who have worked for more than seven years in the studied
organization. They were selected based on purposive sampling where they have
good knowledge and experiences about the compensation and benefits program.
Information gathered from these employees helped the researchers to understand
Income Distribution
Pay Satisfaction
Perceive Value of Money
Page 9
©© Intangible Capital, 2009 – 5(3): 235-258 – ISSN: 1697-9818
doi: 10.3926/ic.2009.v5n3.p235-258
Empirical testing the relationship between income distribution, perceived value money… 243
Ismail et al.
the income level policies and the procedures of perceived value of money features
and pay satisfaction characteristics, as well as the relationship between such
variables in the studied organization. After refining, categorizing and comparing the
information with relevant theoretical and empirical evidence, the triangulated
outcomes were used as a guideline to develop the content of a questionnaire for a
pilot study. The pilot study was conducted by discussing the questionnaire with the
interviewees in order to verify the content and format of the questionnaire. Back
translation technique was used to translate the items in the questionnaires into
Malay and English in order to increase the validity and reliability of the instrument
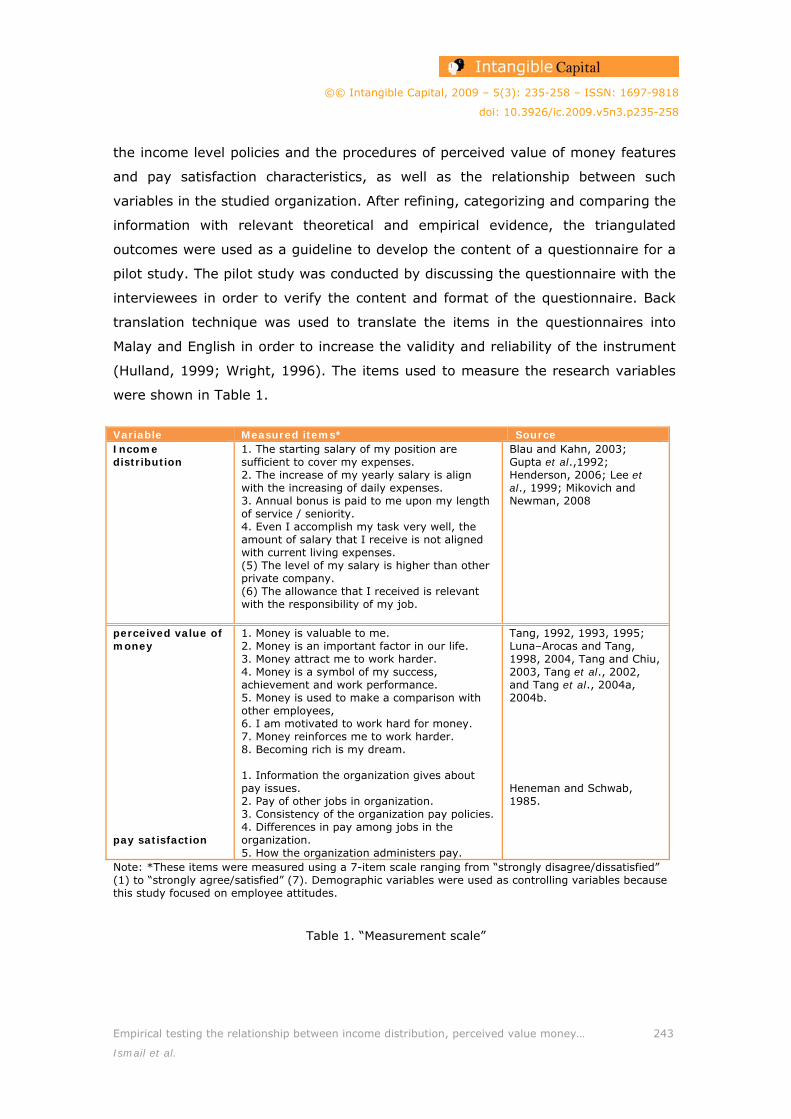
(Hulland, 1999; Wright, 1996). The items used to measure the research variables
were shown in Table 1.
Variable Measured items* Source Income distribution
1. The starting salary of my position are sufficient to cover my expenses. 2. The increase of my yearly salary is align with the increasing of daily expenses. 3. Annual bonus is paid to me upon my length of service / seniority. 4. Even I accomplish my task very well, the amount of salary that I receive is not aligned with current living expenses. (5) The level of my salary is higher than other private company. (6) The allowance that I received is relevant with the responsibility of my job.
Blau and Kahn, 2003; Gupta et al.,1992; Henderson, 2006; Lee et al., 1999; Mikovich and Newman, 2008
perceived value of money pay satisfaction
1. Money is valuable to me. 2. Money is an important factor in our life. 3. Money attract me to work harder. 4. Money is a symbol of my success, achievement and work performance. 5. Money is used to make a comparison with other employees, 6. I am motivated to work hard for money. 7. Money reinforces me to work harder. 8. Becoming rich is my dream. 1. Information the organization gives about pay issues. 2. Pay of other jobs in organization. 3. Consistency of the organization pay policies. 4. Differences in pay among jobs in the organization. 5. How the organization administers pay.
Tang, 1992, 1993, 1995; Luna–Arocas and Tang, 1998, 2004, Tang and Chiu, 2003, Tang et al., 2002, and Tang et al., 2004a, 2004b. Heneman and Schwab, 1985.
Note: *These items were measured using a 7-item scale ranging from “strongly disagree/dissatisfied” (1) to “strongly agree/satisfied” (7). Demographic variables were used as controlling variables because this study focused on employee attitudes.
Table 1. “Measurement scale”
Page 10
©© Intangible Capital, 2009 – 5(3): 235-258 – ISSN: 1697-9818
doi: 10.3926/ic.2009.v5n3.p235-258
Empirical testing the relationship between income distribution, perceived value money… 244
Ismail et al.
The targeted population for this study was 1147 employees who worked in the
studied organization. In the first step of data collection procedure, the researchers
met the division/department heads to understand the rules for distributing the
questionnaires in the organization. Considering the organizational rules, a
convenient sampling technique was used to distribute 250 survey questionnaires to
employees through contact persons (e.g., secretary of department heads, assistant
managers and/or human resource managers) in organization. A total of 150 usable
questionnaires were returned to the researchers, yielding a 60 percent response
rate. The number of this sample exceeded the minimum sample of 30 participants
as required by probability sampling technique to allow for the data to be analyzed
using inferential statistics (Sekaran, 2000). The survey questionnaires were
answered by participants based on their consensus and on a voluntary basis.
The Statistical Package for Social Science (SPSS) version 16.0 was used to analyze
the data. Firstly, exploratory factor analysis (EFA) was used to assess the validity
and reliability of measurement scales (Hair et al., 1998; Nunally & Bernstein,
1994). Relying on the guidelines set up by these statisticians, a factor analysis with
direct oblimin rotation was first done for all items that represented each research
variable, and this was followed by other tests, that is, Kaiser-Mayer-Olkin Test
(KMO), Bartlett’s test of sphericity, eigenvalue, variance explained and Cronbach
alpha. The value of factor analysis for all items that represent each research
variable was 0.5 and more, indicating the items met the acceptable standard of
validity analysis. All research variables exceeded the acceptable standard of Kaiser-
Meyer-Olkin’s value of 0.6 and were significant in Bartlett’s test of sphericity,
showing the measure of sampling adequacy for each variable was acceptable. All
research variables had eigenvalues larger than 1, signifying the variables met the
acceptable standard of validity analysis (Hair et al., 1998). All research variables
exceeded the acceptable standard of reliability analysis of 0.70, indicating the
variables met the acceptable standard of reliability analysis (Nunally & Bernstein,
1994). Variables that meet the acceptable standard of validity and reliability
analyses will be used in testing hypotheses.
Secondly, analysis of variance, Pearson correlation analysis and descriptive
statistics were conducted to analyze the research variables and the usefullnes of
the data set. Finally, a hierarchical regression analysis, as recommended by Cohen
and Cohen (1983), was used to measure the moderating effect of perceived value
Page 11
©© Intangible Capital, 2009 – 5(3): 235-258 – ISSN: 1697-9818
doi: 10.3926/ic.2009.v5n3.p235-258
Empirical testing the relationship between income distribution, perceived value money… 245
Ismail et al.
of money in the hypothesized model. This procedure stresses the development of a
multiplicative term, which is used to encompass the interaction effect, and to
calculate two R²s, one for the equation, which includes only main effects (main-
effect model) and the other for a three-term equation (product-term model), which
includes both the main and interaction effects. This technique may separate the
component parts of the product term from the term itself to account for the
complex combination of variance due to main and interaction effects. Standardized
coefficients (standardized beta) were used for all analysis. Results of an interaction
are evident when the relationship between interacting terms and the dependent
variable is significant. The fact that the significant main effects of predictor
variables and moderator variables simultaneously exist in analysis does not affect
the moderator hypothesis and is significant to interpret the interaction term (Baron
and Kenny, 1986).
6. Results
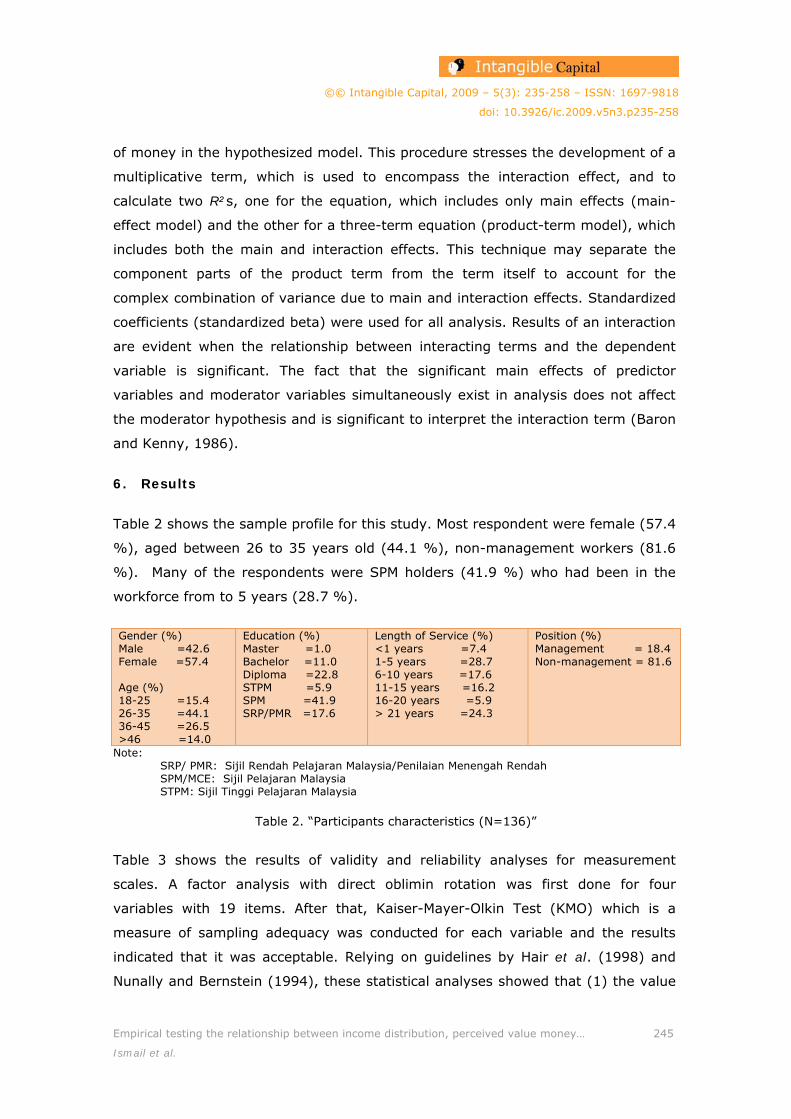
Table 2 shows the sample profile for this study. Most respondent were female (57.4
%), aged between 26 to 35 years old (44.1 %), non-management workers (81.6
%). Many of the respondents were SPM holders (41.9 %) who had been in the
workforce from to 5 years (28.7 %).
Gender (%) Male =42.6 Female =57.4 Age (%) 18-25 =15.4 26-35 =44.1 36-45 =26.5 >46 =14.0
Education (%) Master =1.0 Bachelor =11.0 Diploma =22.8 STPM =5.9 SPM =41.9 SRP/PMR =17.6
Length of Service (%) <1 years =7.4 1-5 years =28.7 6-10 years =17.6 11-15 years =16.2 16-20 years =5.9 > 21 years =24.3
Position (%) Management = 18.4 Non-management = 81.6
Note: SRP/ PMR: Sijil Rendah Pelajaran Malaysia/Penilaian Menengah Rendah SPM/MCE: Sijil Pelajaran Malaysia STPM: Sijil Tinggi Pelajaran Malaysia
Table 2. “Participants characteristics (N=136)”
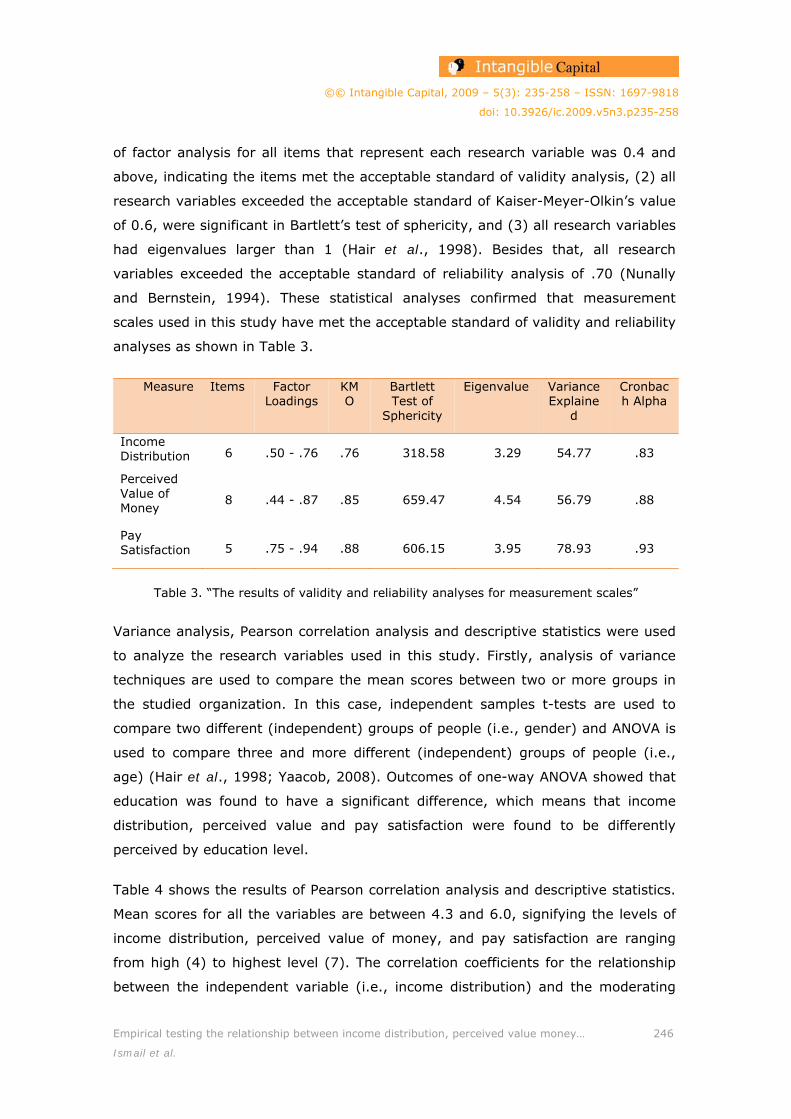
Table 3 shows the results of validity and reliability analyses for measurement
scales. A factor analysis with direct oblimin rotation was first done for four
variables with 19 items. After that, Kaiser-Mayer-Olkin Test (KMO) which is a
measure of sampling adequacy was conducted for each variable and the results
indicated that it was acceptable. Relying on guidelines by Hair et al. (1998) and
Nunally and Bernstein (1994), these statistical analyses showed that (1) the value
Page 12
©© Intangible Capital, 2009 – 5(3): 235-258 – ISSN: 1697-9818
doi: 10.3926/ic.2009.v5n3.p235-258
Empirical testing the relationship between income distribution, perceived value money… 246
Ismail et al.
of factor analysis for all items that represent each research variable was 0.4 and
above, indicating the items met the acceptable standard of validity analysis, (2) all
research variables exceeded the acceptable standard of Kaiser-Meyer-Olkin’s value
of 0.6, were significant in Bartlett’s test of sphericity, and (3) all research variables
had eigenvalues larger than 1 (Hair et al., 1998). Besides that, all research
variables exceeded the acceptable standard of reliability analysis of .70 (Nunally
and Bernstein, 1994). These statistical analyses confirmed that measurement
scales used in this study have met the acceptable standard of validity and reliability
analyses as shown in Table 3.
Measure Items Factor Loadings
KMO
Bartlett Test of
Sphericity
Eigenvalue Variance Explaine
d
Cronbach Alpha
Income Distribution 6 .50 - .76 .76 318.58 3.29 54.77 .83
Perceived Value of Money
8 .44 - .87 .85 659.47 4.54 56.79 .88
Pay Satisfaction 5 .75 - .94 .88 606.15 3.95 78.93 .93
Table 3. “The results of validity and reliability analyses for measurement scales”
Variance analysis, Pearson correlation analysis and descriptive statistics were used
to analyze the research variables used in this study. Firstly, analysis of variance
techniques are used to compare the mean scores between two or more groups in
the studied organization. In this case, independent samples t-tests are used to
compare two different (independent) groups of people (i.e., gender) and ANOVA is
used to compare three and more different (independent) groups of people (i.e.,
age) (Hair et al., 1998; Yaacob, 2008). Outcomes of one-way ANOVA showed that
education was found to have a significant difference, which means that income
distribution, perceived value and pay satisfaction were found to be differently
perceived by education level.
Table 4 shows the results of Pearson correlation analysis and descriptive statistics.
Mean scores for all the variables are between 4.3 and 6.0, signifying the levels of
income distribution, perceived value of money, and pay satisfaction are ranging
from high (4) to highest level (7). The correlation coefficients for the relationship
between the independent variable (i.e., income distribution) and the moderating
Page 13
©© Intangible Capital, 2009 – 5(3): 235-258 – ISSN: 1697-9818
doi: 10.3926/ic.2009.v5n3.p235-258
Empirical testing the relationship between income distribution, perceived value money… 247
Ismail et al.
variable (i.e., perceived value of money), and the relationship between the
dependent variable (i.e., pay satisfaction) were less than 0.90, indicating that data
were not affected by serious collinearity problem (Hair et al., 1998). In addition,
the outcome of testing a direct effects model showed that income distribution
positively and significantly correlated with pay satisfaction (r=0.55, p<0.01),
therefore H1 was supported. This result demonstrates that income distribution is
an important antecedent of pay satisfaction in the organizational sample.
Variable Mean Standard Deviation
Pearson Correlation (r) 1 2 3
1. Income Distribution 4.3 1.2 1
2. Perceived Value of Money 5.5 1.1 .30** 1
3. Pay Satisfaction 6.0 1.2 .55** .41** 1
Note: Significant at **p<0.01 Reliability estimation are shown in a diagonal (value 1)
Table 4. “Descriptive statistics and Pearson correlation analysis”
Variable Dependent Variable (Pay Satisfaction) Model 1 Model 2 Model 3 Control Variables Gender
.04
.04 .03
Age .36** .21 .19 Position .12 .16 .15 Education -.19 -.27** -.24* Length of Services -.02 .04 .04 Independent Variable Income Distribution
.47***
-.39
Perceived Value of Money .24*** -.30 Moderating Variable Income Distribution x Perceived Value of Money
1.16**
R2 .10 .42 .45 Adjusted R2 .06 .39 .42 R2 Change .10 .33 .03 F 2.74* 13.38*** 12.91*** F Change 2.74* 36.23*** 5.95*
Note: Significant at ***p<0.05; ***p<0.001
Table 5. “Results for hierarchical regression analysis”
Table 5 shows the outcomes of testing research hypothesis in Model 3. The
interacting variables (income distribution x perceived value of money) significantly
correlated with pay satisfaction (=1.16, p<.01), therefore H2 was supported. This
result demonstrates that before the inclusion of perceived value of money in Step
2, income distribution significantly correlated with pay satisfaction (=0.47,
Page 14
©© Intangible Capital, 2009 – 5(3): 235-258 – ISSN: 1697-9818
doi: 10.3926/ic.2009.v5n3.p235-258
Empirical testing the relationship between income distribution, perceived value money… 248
Ismail et al.
p<.0001), accounting for 42 percent of the variance in dependent variable. After
the inclusion the perceived value of money in Step 3, the previous significant
relationship between income distribution and pay satisfaction become non
significant (β=-.39, p>.05). In terms of explanatory power, the inclusion of
perceived value of money in the Model 3 had explained 45 percent of the variance
in dependent variable. This result meets the requirements of Baron and Kenny’s
(1986) moderating model testing, which sends a message that the perceived value
of money acts as a moderating variable in the relationship between income
distribution and pay satisfaction in the organizational sample.
7. Discussion and Implications
The findings of this study confirm that perceived value of money acts as a
moderating variable in the relationship between income distribution and pay
satisfaction in the studied organization. In the studied organization, the HR
department uses the policy and procedures formulated by the stakeholder to
determine standard income packages for all employees. The majority of employees
perceived that employers have provided the level and/or amount of income to
employees based on proper rules. Employees perceived that the level and/or
amount of income that they receive have increased their perceived value of money.
As a result, it may lead to an increased pay satisfaction in the organizational
sample.
The implications of this study can be divided into three major areas: theoretical
contribution, robustness of research methodology, and practical contribution. In
terms of theoretical contribution, the findings of this study has presented
substantial evidence in understanding the notion of the perceived value of money
(i.e., the utility of money to meet basic needs and improve standard of living) and
its interaction with income distribution (i.e., allocation of monetary rewards
according to proper rules) as a major predictor of pay satisfaction. This finding has
supported and extended previous research conducted in most Western countries
(see Adams, 1963, 1965; Allen and White, 2002; Lawler, 1971; Tang et al., 2004a,
2004b). In sum, this study confirms that the effect of income distribution on pay
satisfaction is not direct, but its effect is indirectly affected by perceived value of
money. The ability of managers to adequately distributed incomes based on
employee contribution (job and/or merit criteria) will motivate employees to
Page 15
©© Intangible Capital, 2009 – 5(3): 235-258 – ISSN: 1697-9818
doi: 10.3926/ic.2009.v5n3.p235-258
Empirical testing the relationship between income distribution, perceived value money… 249
Ismail et al.
perceive that the income that they receive will fulfill their basic necessities, and
improve standards of living and statuses in society. Consequently, it may lead to
higher pay satisfaction.
Regarding the robustness of research methodology, the data gathered from
compensation management literature, the in-depth interviews and the survey
questionnaire have satisfactorily met the requirements of validity and reliability
analysis; this may lead to the production of accurate and reliable findings.
With respect to practical contributions, the findings of this study may be used as
guidelines by HR practitioners to improve the design and administration of
compensation system in organizations. Firstly, the level of monetary rewards need
to be designed based on multiple criteria (such as job, performance, needs and/or
competitor’s pay) in order to appreciate high performer contributions. Secondly,
adequacy of monetary rewards need be designed not only based on mathematical
formula, but also need to consider individual employee differences, such as marital
status, number of children and geographical area. This allocation rule can help
employees to meet their basic needs, and improve their standards of living and
status in society. Thirdly, the contents and methods of compensation training
program need to be renewed according to external and internal organizational
changes, such as business strategy, technology advancement and job complexity.
If training programs consider such changes this may increase the capabilities of HR
managers and/or managers to properly design and administer pay policies, and
practice good interaction styles in handling employees’ complaints and demands.
Finally, human resource policies need to focus on hiring knowledgeable and
experienced employees than fresh graduates to fulfill important positions (e.g.,
supervisory and managerial positions). For example, knowledgeable and
experienced employees may use their technical skills to design creative income
packages that appreciate employee contributions, human skills to tackle
employees’ complaints, and conceptual skills to assist top management in
formulating pay policies that support organizational strategy and goals. If these
suggestions are considered and applied, this may motivate high performing
employees to support the implementation of compensation management system in
their organizations.
Page 16
©© Intangible Capital, 2009 – 5(3): 235-258 – ISSN: 1697-9818
doi: 10.3926/ic.2009.v5n3.p235-258
Empirical testing the relationship between income distribution, perceived value money… 250
Ismail et al.
8. Conclusion
This study formulated the research model based on compensation research
literature mostly published in Western settings. The valid and reliable
measurement scales were used to measure the moderating effect of perceived
value of money in the hypothesized model. Outcomes of testing the moderating
model using a hierarchical regression analysis revealed that perceived value of
money moderated the effect of income distribution on pay satisfaction, therefore
hypothesis 2 (H2) was supported. Statistically, the findings confirm that the level
and/or amount of income that are allocated based on proper rules have increased
employees’ perceived value of money (i.e., meet their demands). As a result, it
may lead to higher positive attitudinal and behavioral outcomes, especially pay
satisfaction. This empirical result also has supported and extended compensation
research literature mostly published in Western settings.
Therefore, current researches and practices within the pay system models need to
consider the perceived value of money as a critical aspect of income distribution.
This study further suggests that the ability of HR managers and/or managers to
properly design and administer pay distribution rules will help employees to receive
income packages that meet their needs and expectations. As a result, it may
increase employees’ appreciation and acceptance about pay systems that
implemented in organizations. Thus, these positive attitudes may lead employees
to maintain and sustain organizational competitiveness in the global economy.
This study acknowledges several limitations. First, a cross-sectional research
design was used to gather data at one point within the period of study. This may
not be able to capture the developmental issues and/or causal connections
between variables of interest. Second, this study did not specify the relationship
between specific indicators for the independent variable, moderating variable and
dependent variable. Third, the outcomes of multiple regression analysis focused on
the level of performance variation explained by the regression equations
(Tabachnick & Fidell, 2001), however, a number of unexplained factors need to be
incorporated to identify the causal relationship among variables and their relative
explanatory power. Fourth, the survey questionnaires relied heavily on the
respondents’ self-responses that were selected based on convenient sampling
Page 17
©© Intangible Capital, 2009 – 5(3): 235-258 – ISSN: 1697-9818
doi: 10.3926/ic.2009.v5n3.p235-258
Empirical testing the relationship between income distribution, perceived value money… 251
Ismail et al.
technique. Finally, the samples were taken from one public organization that
allowed the researchers to gather data via survey questionnaires.
These limitations may decrease the ability of generalizing the results to other
organizational settings. Future studies should be expanded to all public service
agencies in Malaysia. On that same note, the study can also be replicated in the
private sector to see if the findings hold in different contexts.The conceptual and
methodological limitations should be considered when designing future research.
Firstly, several organizational (e.g., type, ownership and size) and personal (e.g.,
age, education and type of pay) characteristics should be further explored, this
may provide meaningful perspectives of how individual similarities and differences
affect pay systems within an organization. Secondly, other research designs (e.g.,
longitudinal studies) should be used to collect data and describe the patterns of
change and the direction and magnitude of causal relationships between variables
of interest. Thirdly, to fully understand the effect of income distribution and
perceive value of money on pay satisfaction, few organizations need to be used as
a pay referent in future studies. Fourthly, other theoretical constructs of perceive
value of money, such as perceive value of salary, perceive value of bonus and
perceive value of financial claims need to be considered because they have widely
been recognized as an important link between income distribution and many
aspects of individual attitudes and behaviors (e.g., satisfaction, commitment,
turnover, performance, and work ethics) (Anthony et al., 2002; Hoon and Lim,
2001; Mitchell and Mickel, 1999). Fifthly, other individual attitudes and behaviors
such as job satisfaction, job performance, organizational commitment, turnover,
and deviant behaviors should be considered because they are given more attention
in compensation research literature (Ismail, 2007; Ismail et al., 2007; Tang and
Chiu, 2003). The importance of these issues needs to be further elaborated in
future study.
References
ADAMS, J.S. (1963). Toward an understanding of inequity. Journal of Abnormal and
Social Psychology, 67:422-436.
ADAMS, J.S. (1965). Inequity in social exchange, in Berkowitz, L. Advances in
Experimental Social Psychology, 2:267-299. Academic Press, New York.
Page 18
©© Intangible Capital, 2009 – 5(3): 235-258 – ISSN: 1697-9818
doi: 10.3926/ic.2009.v5n3.p235-258
Empirical testing the relationship between income distribution, perceived value money… 252
Ismail et al.
AJZEN, I.; FISHBEIN, M. (1977). Attitude-behavior relations: A theoretical analyses
and review of empirical research. Psychology Bulletin, 84:888-917.
ALLEN, N.J.; WHITE, J.P. (2002). The measurement and antecedent of affective,
continuance, and normative commitment to the organization. Journal of
Occupational Psychology, 63:1-18.
ANTHONY, W.P.; PERREWE, P.L.; KACMAR, K.M. (2002). Strategic human resource
management. Harcourt Brace and Company, New York.
ARYEE, S. (1999). An examination of the moderating influence of breadwinner role
salience on the pay-life satisfaction relationship. Human Relations, 52(10):1279-
1290.
AZIZ REPORT. (1968). Report of the Royal Commission on the teaching services.
West Malaysia, Unpublished Report, Public Services Department, Malaysia.
BARON, R.M; KENNY, D.A. (1986). The moderator-mediator variable distinction in
social psychological research: Conceptual, strategic, and statistical considerations.
Journal of Personality and Social Psychology, 51:1173-1182.
BERGMANN, J.J.; SCARPELLO, V.G. (2002). Compensation decision making. South-
Western, Australia.
BLAU, F.D.; KAHN, L.M. (2003). Understanding international differences in the
gender pay group. American Economic Review, 21(1):106-145.
BLOOM, M.; MILKOVICH, G.T. (1998). Relationships among risk, incentive pay, and
commitment. Journal of Vocational Behavior, 14:224-247.
CHIU, R.K.; LUK, V.; TANG, T.L.P. (2001). Hong Kong and China: The cash
mentality revisited. Compensation and Benefits Review, 33(3):66-72.
COHEN, J.; COHEN, P. (1983). Applied multiple regression/correlation analysis for
the behavioral sciences. Erlbaum, Hillsdale, NJ.
DAS, P.; BHADURY, B. (1997). Pay satisfaction of R&D personnel in manufacturing
organizations: The role of career comparison process. The Journal of High
Technology Management Research, 8(2):171-186.
Page 19
©© Intangible Capital, 2009 – 5(3): 235-258 – ISSN: 1697-9818
doi: 10.3926/ic.2009.v5n3.p235-258
Empirical testing the relationship between income distribution, perceived value money… 253
Ismail et al.
DESSLER, G. (2006). Human resource management. Prentice Hall, New Jersey.
DOUSIN, O. (2008). Relationship between income distribution and pay satisfaction:
The moderating role of perceived value of money, Final year project, Universiti
Malaysia Sarawak.
DRUCKER, J.; WHITE, G. (2000). The context of reward management, in White, G.,
& Drucker, J. Reward Management: A Critical Text, Routledge Studies in
Employment Relations, London.
FURNHAM, A.; OKAMURA, R. (1999). Your money or your life: Behavioral and
emotional predictors of money psychology. Human Relations, 52(9):1157-1177.
GIACOBBE-MILLER, J. K; MILLER, D.J.; VICTOROV, V.I. (1998). A comparison of
Russian and U. S pay allocation decisions, distributive justice judgements and
productivity under different payment conditions. Personnel Psychology,
51(1):137- 364.
GOMEZ-MEJIA, L.R.; BALKIN, D.B. (1992a). Compensation, organizational strategy,
and firm performance. Cincinnati, OH: South Western Publishing Co.
GOMEZ-MEJIA, L.R.; BALKIN, D.B. (1992b). The determinants of faculty pay: An
agency theory perspective. Academy of Management Journal, 35(5):921–955.
GREENBERG, J. (2003). Creating unfairness by mandating fair procedures: The
hidden words of a pay-for-performance plan. Human Resource Management
Review, 13(1):41-57.
GUPTA, N.; SHAW, J.D. (1998). Let the evidence speak: Financial incentives are
effective!. Compensation and Benefits Review, 26:28–32.
GUPTA, N.; LEDFORD, G.E.; JENKINS, G.D.; DOTY, D.H. (1992). Survey-based
prescriptions for skill-based pay. ACA Journal, 1(1):50-61.
HAIR, J.F.; ANDERSON, R.E.; TATHAM, R.L.; BLACK, W.C. (1998). Multivariate data
analysis, (5th Ed.). Prentice Hall International, Inc., New Jersey.
HARRIS, M.M.; ANSEEL, F.; LIEVENS, F. (2008). Keeping up with the joneses: A
field study of the relationships among upward, lateral, and downward
Page 20
©© Intangible Capital, 2009 – 5(3): 235-258 – ISSN: 1697-9818
doi: 10.3926/ic.2009.v5n3.p235-258
Empirical testing the relationship between income distribution, perceived value money… 254
Ismail et al.
comparisons and pay level satisfaction. Journal of Applied Psychology, 93(3):665-
673.
HENDERSON, R.I. (2006). Compensation Management in a Knowledge based-
World. Prentice Hall, New Jersey.
HENEMAN, H.G.; SCHWAB, D.P. (1985). Pay satisfaction: Its multidimensional
nature and measurement. International Journal of Psychology, 20(2):129-141.
HENEMAN, R. L.; PORTER, G.; GREENBERGER, D.B.; STRASSER, S. (1997).
Modeling the relationship between pay level and pay satisfaction. Journal of
Business and Psychology, 12(2):147–158.
HOON, L.S.; LIM, V.K. (2001). Attitudes towards money and work: Implications for
Asian management style following the economic crisis. Journal of Managerial
Psychology, 16(2):159-172.
HULLAND, J. (1999). Use of partial least square (PLS) in strategic management
research: A review of four recent studies. Strategic Management Journal,
20(2):195-204.
ISMAIL, A. (2007). Relationship between pay distribution system, distributive
justice and work attitudes and behaviours within Malaysian institution of higher
learning. UNITAR E-Journal, 3(1):1-22.
ISMAIL, A.; ISMAIL, Y.; SULAIMAN, M. (2007). Distributive justice, pay structure,
and attitudes and behavior: A case of Malaysian public institutions of higher
learning. This paper was published in the proceeding of Academy for Global
Business Advancement, 4(1):619-618.
JABATAN PERKHIDMATAN AWAM MALAYSIA. (1991). Pekeliling Perkhidmatan
Bilangan 9 Tahun 1991: Pelaksanaan Sistem Saraan Baru Berdasarkan Laporan
Jawatankuasa Khas Kabinet Mengenai Gaji Sektor Awam 1991.
JABATAN PERKHIDMATAN AWAM MALAYSIA. (2002). Pekeliling Perkhidmatan
Bilangan 4 Tahun 2002.
Page 21
©© Intangible Capital, 2009 – 5(3): 235-258 – ISSN: 1697-9818
doi: 10.3926/ic.2009.v5n3.p235-258
Empirical testing the relationship between income distribution, perceived value money… 255
Ismail et al.
JABATAN PERKHIDMATAN AWAM MALAYSIA. (2007). Pekeliling Perkhidmatan
Bilangan 7 Tahun 2007: Pemberian Kenaikan Gaji Kepada Pegawai Perkhidmatan
Awam Persekutuan Di Bawah Sistem Saraan Malaysia.
LAWLER, E.E. (1971). Pay and organizational effectiveness: A psychology view.
McGraw Hill, New York.
LAWLER, E.D. (2000). Rewarding excellence: Pay strategies for the new economy.
Jossey-Bass, California.
LEE, C.; LAW, K.; BOBKO, P. (1999). The importance of justice perceptions on pay
effectiveness: A two-year study of a skill-based pay plan. Journal of Management,
25(6):851-873.
LOWERY, C.M.; BEADLES, N.A.; PETTY, M.M.; AMSLER, G.M.; THOMPSON, J.W.
(2002). An empirical examination of a merit bonus plan. Journal of Managerial
Issues, 14:100–117.
LUNA-AROCAS, R.; TANG, T.L.P. (1998). The economic psychology of money:
Analysis of the MES and the money attitudes scale (E.A.D-6). Journal of Work and
Organizational Psychology, 14(1):295-313.
LUNA-AROCAS, R.; TANG, T.L.P. (2004). The love of money, satisfaction and the
Protestant work ethic: Money profiles among universities professors in USA and
Spain. Journal of Business Ethics, 50(4):329-354.
MAHATHIR REPORT. (1991). Report of the special committee of the Cabinet on
salaries for the public sector (a translated version), Unpublished report, Public
Services Department, Malaysia.
Maslow, A.H. (1943). A theory of human motivation. Psychological Review, 50:
370-396.
Maslow, A.H. (1945). Motivation and personality. Harper and Row, New York.
MCFARLIN, D.B.; SWEENEY, P.D. (1992). Distributive and procedural justice as
predictors of satisfaction with personal and organizational outcomes. Academy of
Management Journal, 35(3):629-638.
Page 22
©© Intangible Capital, 2009 – 5(3): 235-258 – ISSN: 1697-9818
doi: 10.3926/ic.2009.v5n3.p235-258
Empirical testing the relationship between income distribution, perceived value money… 256
Ismail et al.
MILKOVICH G.T.; NEWMAN, J.M. (2008). Compensation, (9th Ed.). McGraw Hill
International Edition, USA.
MITCHELL, T.R.; MICKEL, A.E. (1999). The meaning of money: An individual
difference perspective. Academy of Management Review, 24(3):568-578.
NUNALLY, J.C.; BERNSTEIN, I.H. (1994). Psychometric theory. McGraw-Hill, New
York.
ROBERTS, J.A.; COULSON, K.R.; CHONKO, L.B. (1999). Salesperson perceptions of
equity and justice and their impact on organizational commitment and intent to
turnover. Journal of Marketing Theory and Practice, 7(1): 1-16.
SEKARAN, U. (2000). Research methods for business: A skill building approach.
John Wiley and Sins, Inc., New York.
SKARLICKI, D.P.; FOLGER, R. (1997). Retaliation in the workplace: The roles of
distributive, procedural, and interactional justice. Journal of Applied Psychology,
82:434-443.
SUFFIAN REPORT. (1967). Report of the Royal Commission on the Review of
Salaries and Conditions of Service in the Public Services, Unpublished Report,
Public Services Department, Malaysia.
SULAIMAN, M.; MAMMAN, A. (1996). Managerial attitudes to pay system in the
Malaysian public sector. Malaysian Management Review, 31(1):29-43.
SWEENEY, P.D.; MCFARLIN, D.B. (1993). Workers’ evaluation of the “ends” and the
“means”: An examination of four models of distributive and procedural justice.
Organizational Behavior and Human Decision Processes, 55(1):23-49.
TABACHNICK, B.G.; FIDELL, L.S. (2001). Using multivariate statistics. Sydney:
Allyn & Bacon.
TANG, T.L.P. (1992). The meaning of money revisited. Journal of Organizational
Behavior, 13:5197-202.
Page 23
©© Intangible Capital, 2009 – 5(3): 235-258 – ISSN: 1697-9818
doi: 10.3926/ic.2009.v5n3.p235-258
Empirical testing the relationship between income distribution, perceived value money… 257
Ismail et al.
TANG, T.L.P. (1993). The meaning of money: Extension and exploration of the
money ethic scale in a simple of university students in Taiwan. Journal of
Organizational Behavior, 14:93-99.
TANG, T.L.P. (1995). The development of short money ethic scale: Attitudes toward
money and pay satisfaction revisited. Personality and Individual Differences, 19:
809-816.
TANG, T. L.P. (2007). Income and quality of life: Does the love of money make a
difference?. Journal of Business Ethics, 72(4):375–393.
TANG, T.L.P.; CHIU, R.K. (2003). Income, money ethic, pay satisfaction,
commitment, and unethical behaviour: Is the love of money the root of evil for
Hong Kong employees?. Journal of Business Ethics, 46(1):13-23.
TANG, T.L.P.; KIM, J.K.; TANG, D.S.H. (2000). Does attitudes toward money
moderate the relationship between intrinsic job satisfaction and voluntary
turnover. Human Relations, 52(2):213-245.
TANG, T.L.P.; KIM, J.K.; TANG, D.S.H. (2002). Endorsement of the money ethic,
income and life satisfaction: A comparison of full-time employees, part-time
employees, and non-employed university student. Journal of Managerial
Psychology, 17:442-467.
TANG, T. L. P.; LUNA–AROCAS, R.; SUTARSO, T.; TANG, D.S.H. (2004a). Does the
love of money moderate and mediate the income–pay satisfaction relationship?.
Journal of Managerial Psychology, 19:111–135.
TANG, T.L.P.; TILLERY, K.R.; LAZAREVSKI. B.; LUNA-AROCAS, R. (2004b). The love
of money and work related attitudes: Money profiles in Macedonia. Journal of
Managerial Psychology, 19:542-548.
WILLIAM, M.L.; McDANIEL, A.M.; FORD, L.R. (2006). Understanding multiple
dimensions of compensation satisfaction. Journal of Business and Psychology,
21(3):429-459.
Page 24
©© Intangible Capital, 2009 – 5(3): 235-258 – ISSN: 1697-9818
doi: 10.3926/ic.2009.v5n3.p235-258
Empirical testing the relationship between income distribution, perceived value money… 258
Ismail et al.
WRIGHT, I.L. (1996). Qualitative International Management Research, in Punnett,
B.J and Shenker, O. Handbook for International Management Research, BlackWell
Publishers Inc., Oxford, UK.
YAACOB, M.R. (2008). SPSS for business and social science students. Pustaka
Aman Press Sdn. Bhd. Malaysia.
YOUNG, I.P. (1999). Salary discrimination: A test of the paradoxical female
hypothesis. Educational Administration Quarterly, 35(3):379-397.
©© Intangible Capital, 2009 (www.intangiblecapital.org)
El artículo está con Reconocimiento-NoComercial 2.5 de Creative Commons. Puede copiarlo, distribuirlo y comunicarlo públicamente siempre que cite a su autor y a Intangible Capital. No lo utilice para fines comerciales. La
licencia completa se puede consultar en http://creativecommons.org/licenses/by-nc/2.5/es/