Highlights Report ATO CONTENT Page Exploring your results 2 Employee Engagement: Say, Stay, Strive 3 Leadership 4 Communication and Change 6 Workplace Conditions 7 Inclusion 10 Enabling Innovation 11 Wellbeing Policies and Support 12 Wellbeing 13 Performance 15 Retention 17 Unacceptable Behaviour 19 Demographics 22 Time to Take Action 24 Guide to this Report 25 RESPONSES: 13,157 of 17,977 RESPONSE RATE: 73%
Transcript
Highlights ReportATO
CONTENTPage
Exploring your results 2
Employee Engagement: Say, Stay, Strive 3
Leadership 4
Communication and Change 6
Workplace Conditions 7
Inclusion 10
Enabling Innovation 11
Wellbeing Policies and Support 12
Wellbeing 13
Performance 15
Retention 17
Unacceptable Behaviour 19
Demographics 22
Time to Take Action 24
Guide to this Report 25
RESPONSES:
13,157 of 17,977RESPONSE RATE:
73%
EXPLORING YOUR RESULTS
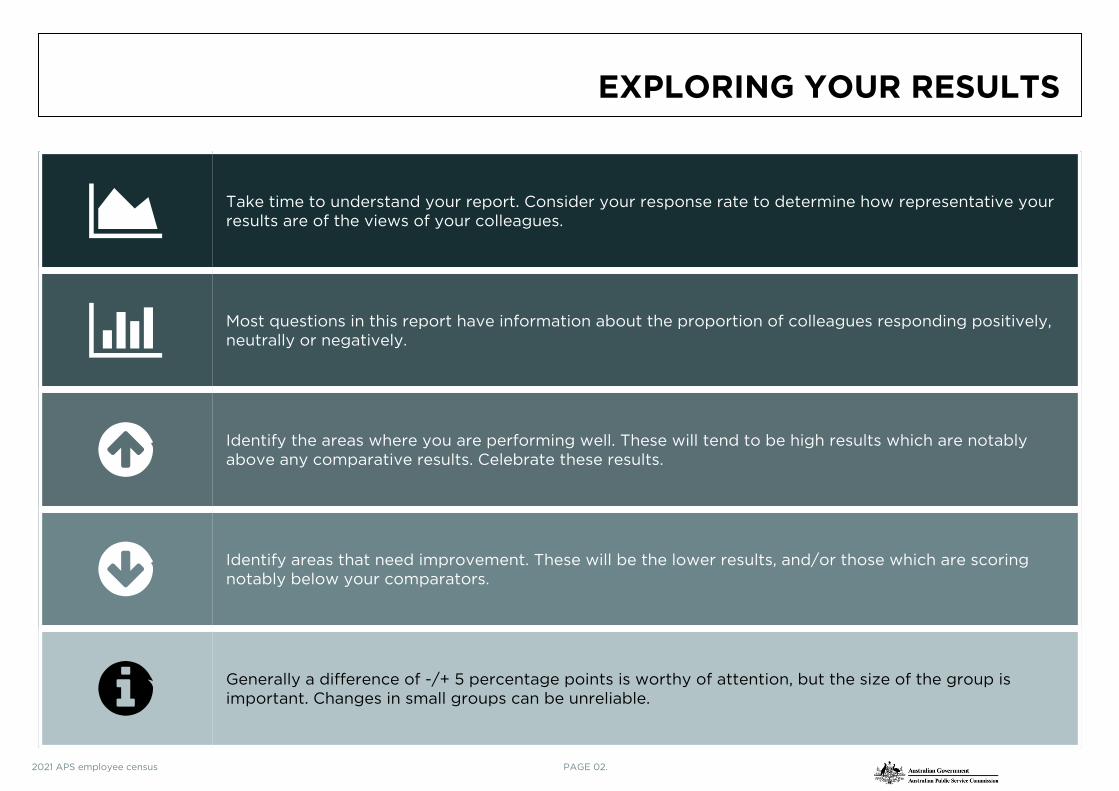
Take time to understand your report. Consider your response rate to determine how representative your results are of the views of your colleagues.
Most questions in this report have information about the proportion of colleagues responding positively, neutrally or negatively.
Identify the areas where you are performing well. These will tend to be high results which are notably above any comparative results. Celebrate these results.
Identify areas that need improvement. These will be the lower results, and/or those which are scoring notably below your comparators.
Generally a difference of -/+ 5 percentage points is worthy of attention, but the size of the group is important. Changes in small groups can be unreliable.
2021 APS employee census PAGE 02.
EMPLOYEE ENGAGEMENT: SAY, STAY, STRIVE
HOW ENGAGED IS YOUR TEAM?
EMPLOYEE ENGAGEMENT SCORES AREN’T JUST ABOUT HOW MUCH PEOPLE LIKE WORKING FOR AN AGENCY. IT IS A MEASURE OF THE EMOTIONAL CONNECTION AND COMMITMENT EMPLOYEES HAVE TO WORKING FOR THE AGENCY.
YOUREMPLOYEEENGAGEMENTSCORE
76%RESPONSE SCALE
%POSITIVE
VARIANCE FROM 2020
0
VARIANCE FROM APS OVERALL
+3
VARIANCE FROM
LARGER OPERATIONAL
AGENCIES
+4
VARIANCE FROM EXTRA LARGE SIZED
AGENCIES
+4SA
Y
Overall, I am satisfied with my job 79% -1 +6 +7 +7
I am proud to work in my agency 83% -1 +7 +8 +9
I would recommend my agency as a good place to work 84% 0 +16 +18 +17
I believe strongly in the purpose and objectives of my agency 88% +1 +6 +6 +7
STA
Y
I feel a strong personal attachment to my agency 72% -1 +8 +8 +9
I feel committed to my agency’s goals 86% -1 +4 +4 +5
STR
IVE
I suggest ideas to improve our way of doing things 83% -1 -2 0 +1
I am happy to go the ‘extra mile’ at work when required 92% 0 +1 +2 +2
I work beyond what is required in my job to help my agency achieve its objectives 84% 0 +2 +3 +3
My agency really inspires me to do my best work every day 65% +1 +9 +9 +9
KEY AT LEAST 5 PERCENTAGE POINTS GREATER THAN COMPARATOR AT LEAST 5 PERCENTAGE POINTS LESS THAN
COMPARATOR
Positive Neutral Negative
2021 APS employee census PAGE 03.
LEADERSHIP
IMMEDIATE SUPERVISOR RESPONSE SCALE %POSITIVE
VARIANCE FROM 2020
VARIANCE FROM APS OVERALL
VARIANCE FROM LARGER OPERATIONAL
AGENCIES
VARIANCE FROM EXTRA LARGE SIZED
AGENCIES
My supervisor engages with staff on how to respond to future challenges 83% -1 +4 +4 +4
My supervisor can deliver difficult advice whilst maintaining relationships 82% +1 +3 +4 +4
My supervisor invites a range of views, including those different to their own 82% - +3 +4 +4
My supervisor encourages my team to regularly review and improve our work 84% +1 +4 +3 +3
My supervisor is invested in my development 77% +2 +4 +4 +4
My immediate supervisor encourages me 79% +1 +3 +4 +4
My supervisor ensures that my workgroup delivers on what we are responsible for 89% +1 +2 +3 +3
My supervisor provides me with helpful feedback to improve my performance 79% - +5 +4 +4
KEY AT LEAST 5 PERCENTAGE POINTS GREATER THAN COMPARATOR AT LEAST 5 PERCENTAGE POINTS LESS THAN
COMPARATOR
Positive Neutral Negative
2021 APS employee census PAGE 04.
LEADERSHIP
IMMEDIATE SES MANAGER RESPONSE SCALE %POSITIVE
VARIANCE FROM 2020
VARIANCE FROM APS OVERALL
VARIANCE FROM LARGER OPERATIONAL
AGENCIES
VARIANCE FROM EXTRA LARGE SIZED
AGENCIES
My SES manager clearly articulates the direction and priorities for our area 72% +3 +5 +6 +7
My SES manager presents convincing arguments and persuades others towards an outcome 63% - +2 +6 +6
My SES manager promotes cooperation within and between agencies 66% +6 0 +3 +3
My SES manager encourages innovation and creativity 67% - +2 +4 +4
My SES manager creates an environment that enables us to deliver our best 66% - +4 +7 +7
My SES manager ensures that work effort contributes to the strategic direction of the agency and the APS 76% +3 +3 +6 +6
ALL SES RESPONSE SCALE %POSITIVE
VARIANCE FROM 2020
VARIANCE FROM APS OVERALL
VARIANCE FROM LARGER OPERATIONAL
AGENCIES
VARIANCE FROM EXTRA LARGE SIZED
AGENCIES
In my agency, the SES work as a team 57% +2 +5 +6 +5
In my agency, the SES clearly articulate the direction and priorities for our agency 68% -1 +8 +8 +8
KEY AT LEAST 5 PERCENTAGE POINTS GREATER THAN COMPARATOR AT LEAST 5 PERCENTAGE POINTS LESS THAN
COMPARATOR
Positive Neutral Negative
2021 APS employee census PAGE 05.
COMMUNICATION AND CHANGE
RESPONSE SCALE %POSITIVE
VARIANCE FROM 2020
VARIANCE FROM APS OVERALL
VARIANCE FROM LARGER OPERATIONAL
AGENCIES
VARIANCE FROM EXTRA LARGE SIZED
AGENCIES
My supervisor communicates effectively 85% +1 +4 +4 +4
My SES manager communicates effectively 73% +2 +4 +6 +6
In my agency, communication between SES and other employees is effective 57% -2 +6 +7 +6
Internal communication within my agency is effective 72% +3 +14 +15 +14
When changes occur, the impacts are communicated well within my workgroup 73% 0 +7 +8 +7
Staff are consulted about change at work 50% -3 +5 +5 +4
Change is managed well in my agency 57% -6 +14 +13 +11
KEY AT LEAST 5 PERCENTAGE POINTS GREATER THAN COMPARATOR AT LEAST 5 PERCENTAGE POINTS LESS THAN
COMPARATOR
Positive Neutral Negative
2021 APS employee census PAGE 06.
WORKPLACE CONDITIONS
RESPONSE SCALE %POSITIVE
VARIANCE FROM 2020
VARIANCE FROM APS OVERALL
VARIANCE FROM LARGER OPERATIONAL
AGENCIES
VARIANCE FROM EXTRA LARGE SIZED
AGENCIES
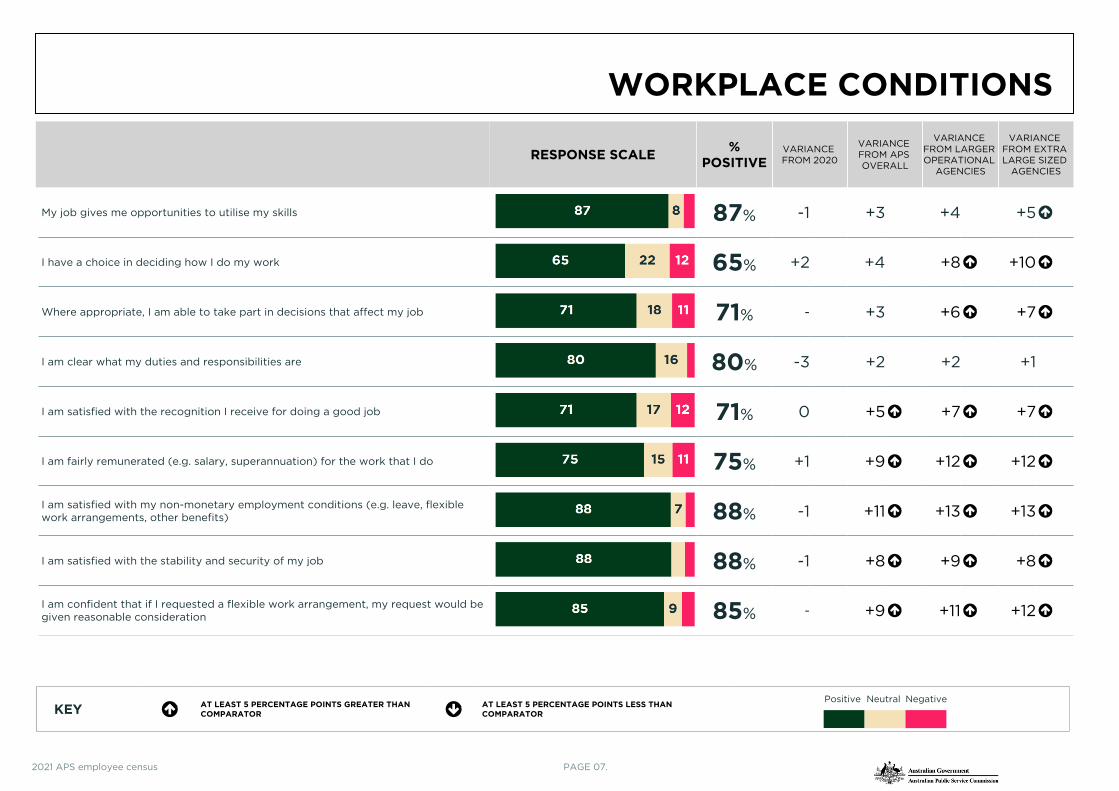
My job gives me opportunities to utilise my skills 87% -1 +3 +4 +5
I have a choice in deciding how I do my work 65% +2 +4 +8 +10
Where appropriate, I am able to take part in decisions that affect my job 71% - +3 +6 +7
I am clear what my duties and responsibilities are 80% -3 +2 +2 +1
I am satisfied with the recognition I receive for doing a good job 71% 0 +5 +7 +7
I am fairly remunerated (e.g. salary, superannuation) for the work that I do 75% +1 +9 +12 +12
I am satisfied with my non-monetary employment conditions (e.g. leave, flexible work arrangements, other benefits) 88% -1 +11 +13 +13
I am satisfied with the stability and security of my job 88% -1 +8 +9 +8
I am confident that if I requested a flexible work arrangement, my request would be given reasonable consideration 85% - +9 +11 +12
KEY AT LEAST 5 PERCENTAGE POINTS GREATER THAN COMPARATOR AT LEAST 5 PERCENTAGE POINTS LESS THAN
COMPARATOR
Positive Neutral Negative
2021 APS employee census PAGE 07.
WORKPLACE CONDITIONS
RESPONSE SCALE %POSITIVE
VARIANCE FROM 2020
VARIANCE FROM APS OVERALL
VARIANCE FROM LARGER OPERATIONAL
AGENCIES
VARIANCE FROM EXTRA LARGE SIZED
AGENCIES
I feel a strong personal attachment to the APS 70% -1 +7 +5 +4
I understand how my role contributes to achieving an outcome for the Australian public 93% -1 +3 +2 +2
I believe strongly in the purpose and objectives of the APS 85% -2 +4 +4 +4
KEY AT LEAST 5 PERCENTAGE POINTS GREATER THAN COMPARATOR AT LEAST 5 PERCENTAGE POINTS LESS THAN
COMPARATOR
Positive Neutral Negative
2021 APS employee census PAGE 08.
WORKPLACE CONDITIONS
RESPONSE SCALE % VARIANCE FROM 2020
VARIANCE FROM APS OVERALL
VARIANCE FROM LARGER OPERATIONAL
AGENCIES
VARIANCE FROM EXTRA LARGE SIZED
AGENCIES
What best describes your current workload?
Well above capacity – too much work 19% +1 -5 -4 -2
Slightly above capacity – lots of work to do 41% -2 +1 +1 0
At capacity – about the right amount of work to do 34% 0 +5 +4 +2
Slightly below capacity – available for more work 5% 0 0 0 0
Well below capacity – not enough work 1% 0 0 0 0
KEY AT LEAST 5 PERCENTAGE POINTS GREATER THAN COMPARATOR AT LEAST 5 PERCENTAGE POINTS LESS THAN
COMPARATOR
2021 APS employee census PAGE 09.
INCLUSION
RESPONSE SCALE %POSITIVE
VARIANCE FROM 2020
VARIANCE FROM APS OVERALL
VARIANCE FROM LARGER OPERATIONAL
AGENCIES
VARIANCE FROM EXTRA LARGE SIZED
AGENCIES
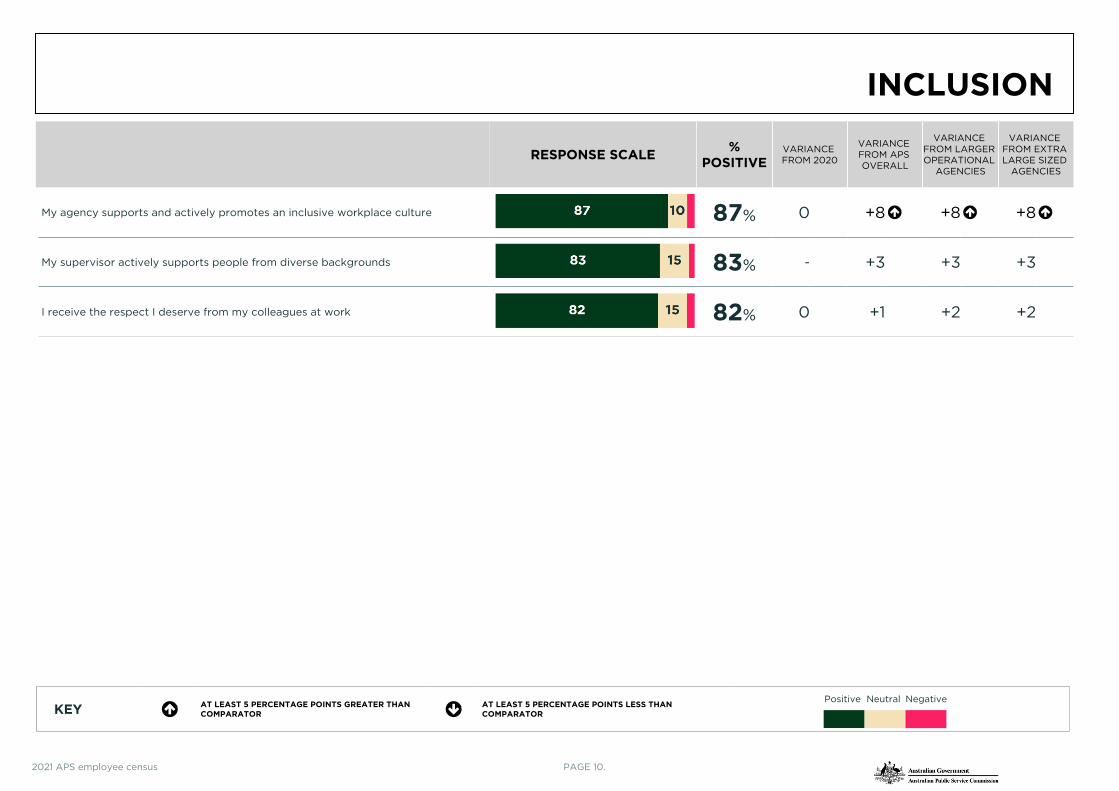
My agency supports and actively promotes an inclusive workplace culture 87% 0 +8 +8 +8
My supervisor actively supports people from diverse backgrounds 83% - +3 +3 +3
I receive the respect I deserve from my colleagues at work 82% 0 +1 +2 +2
KEY AT LEAST 5 PERCENTAGE POINTS GREATER THAN COMPARATOR AT LEAST 5 PERCENTAGE POINTS LESS THAN
COMPARATOR
Positive Neutral Negative
2021 APS employee census PAGE 10.
ENABLING INNOVATION
ENABLING INNOVATION
THE INNOVATION SCORE ASSESSES BOTH WHETHER EMPLOYEES FEEL WILLING AND ABLE TO BE INNOVATIVE, AND WHETHER THEIR AGENCY HAS A CULTURE WHICH ENABLES THEM TO BE SO.
YOURINNOVATIONINDEXSCORE
69%RESPONSE SCALE
%POSITIVE
VARIANCE FROM 2020
-
VARIANCE FROM APS OVERALL
+3
VARIANCE FROM
LARGER OPERATIONAL
AGENCIES
+3
VARIANCE FROM EXTRA LARGE SIZED
AGENCIES
+3E
nab
ling
inno
vati
on
I believe that one of my responsibilities is to continually look for new ways to improve the way we work
88% - +1 +2 +3
My immediate supervisor encourages me to come up with new or better ways of doing things 77% - +2 +3 +3
People are recognised for coming up with new and innovative ways of working 68% - +6 +6 +6
My agency inspires me to come up with new or better ways of doing things 56% -8 +8 +7 +6
My agency recognises and supports the notion that failure is a part of innovation 43% - +7 +5 +4
KEY AT LEAST 5 PERCENTAGE POINTS GREATER THAN COMPARATOR AT LEAST 5 PERCENTAGE POINTS LESS THAN
COMPARATOR
Positive Neutral Negative
2021 APS employee census PAGE 11.
WELLBEING POLICIES AND SUPPORT
WELLBEING
THE WELLBEING SCORE PROVIDES A MEASURE OF THE PRACTICAL AND CULTURAL ELEMENTS THAT ALLOW FOR A SUSTAINABLE AND HEALTHY WORKING ENVIRONMENT.
YOURWELLBEINGINDEXSCORE
74%RESPONSE SCALE
%POSITIVE
VARIANCE FROM 2020
-1
VARIANCE FROM APS OVERALL
+6
VARIANCE FROM
LARGER OPERATIONAL
AGENCIES
+6
VARIANCE FROM EXTRA LARGE SIZED
AGENCIES
+6W
ellb
eing
po
licie
s an
d s
upp
ort
I am satisfied with the policies/practices in place to help me manage my health and wellbeing 79% -2 +11 +12 +11
My agency does a good job of communicating what it can offer me in terms of health and wellbeing 78% -3 +12 +13 +12
My agency does a good job of promoting health and wellbeing 77% -3 +14 +14 +13
I think my agency cares about my health and wellbeing 69% -2 +11 +13 +13
I believe my immediate supervisor cares about my health and wellbeing 86% 0 +2 +3 +3
KEY AT LEAST 5 PERCENTAGE POINTS GREATER THAN COMPARATOR AT LEAST 5 PERCENTAGE POINTS LESS THAN
COMPARATOR
Positive Neutral Negative
2021 APS employee census PAGE 12.
WELLBEING
RESPONSE SCALE % VARIANCE FROM 2020
VARIANCE FROM APS OVERALL
VARIANCE FROM LARGER OPERATIONAL
AGENCIES
VARIANCE FROM EXTRA LARGE SIZED
AGENCIES
How often do you find your work stressful?
Always 4% - -2 -2 -2
Often 25% - -3 -4 -3
Sometimes 52% - +4 +4 +4
Rarely 17% - +1 +1 +1
Never 2% - 0 0 0
To what extent is your work emotionally demanding?
To a very large extent 5% -1 -3 -4 -4
To a large extent 19% -1 -4 -5 -5
Somewhat 43% 0 +3 +3 +3
To a small extent 25% +3 +3 +4 +4
To a very small extent 8% -1 +1 +2 +2
KEY AT LEAST 5 PERCENTAGE POINTS GREATER THAN COMPARATOR AT LEAST 5 PERCENTAGE POINTS LESS THAN
COMPARATOR
2021 APS employee census PAGE 13.
WELLBEING
RESPONSE SCALE % VARIANCE FROM 2020
VARIANCE FROM APS OVERALL
VARIANCE FROM LARGER OPERATIONAL
AGENCIES
VARIANCE FROM EXTRA LARGE SIZED
AGENCIES
I feel burned out by my work
Strongly agree 6% -1 -3 -3 -2
Agree 22% -3 -3 -3 -2
Neither agree nor disagree 35% -4 +4 +3 +3
Disagree 29% +5 +1 +2 +1
Strongly disagree 7% +2 0 0 0
In general, would you say that your health is:
Excellent 11% - -1 -1 -1
Very good 36% - +1 +1 +1
Good 36% - +1 0 0
Fair 14% - 0 -1 0
Poor 3% - 0 0 0
KEY AT LEAST 5 PERCENTAGE POINTS GREATER THAN COMPARATOR AT LEAST 5 PERCENTAGE POINTS LESS THAN
COMPARATOR
2021 APS employee census PAGE 14.
PERFORMANCE
RESPONSE SCALE % VARIANCE FROM 2020
VARIANCE FROM APS OVERALL
VARIANCE FROM LARGER OPERATIONAL
AGENCIES
VARIANCE FROM EXTRA LARGE SIZED
AGENCIES
In the last month, please rate your workgroup’s overall performance:
Excellent 27% - 0 +2 +2
Very good 57% - +2 +1 +1
Average 15% - -1 -2 -2
Below average 1% - -1 -1 -1
Well below average 1% - 0 0 0
In the last month, please rate your agency’s success in meeting its goals and objectives:
Excellent 19% - +3 +5 +4
Very good 62% - +6 +6 +5
Average 18% - -6 -7 -6
Below average 1% - -2 -2 -2
Well below average 1% - -1 -1 -1
KEY AT LEAST 5 PERCENTAGE POINTS GREATER THAN COMPARATOR AT LEAST 5 PERCENTAGE POINTS LESS THAN
COMPARATOR
2021 APS employee census PAGE 15.
PERFORMANCE
RESPONSE SCALE %POSITIVE
VARIANCE FROM 2020
VARIANCE FROM APS OVERALL
VARIANCE FROM LARGER OPERATIONAL
AGENCIES
VARIANCE FROM EXTRA LARGE SIZED
AGENCIES
My workgroup has the appropriate skills, capabilities and knowledge to perform well 82% -1 +1 +3 +3
My workgroup has the tools and resources we need to perform well 72% -1 +9 +9 +7
The people in my workgroup use time and resources efficiently 79% -1 +2 +3 +2
My workgroup can readily adapt to new priorities and tasks 88% -1 +2 +3 +3
The people in my workgroup cooperate to get the job done 88% -1 +1 +2 +2
KEY AT LEAST 5 PERCENTAGE POINTS GREATER THAN COMPARATOR AT LEAST 5 PERCENTAGE POINTS LESS THAN
COMPARATOR
Positive Neutral Negative
2021 APS employee census PAGE 16.
RETENTION
EMPLOYEES WHO INDICATED THAT THEY WANTED TO LEAVE THEIR CURRENT POSITION AS SOON AS POSSIBLE OR WITHIN THE NEXT 12 MONTHS WERE ASKED WHAT THEIR PLANS WERE.
RESPONSE SCALE % VARIANCE FROM 2020
VARIANCE FROM APS OVERALL
VARIANCE FROM LARGER OPERATIONAL
AGENCIES
VARIANCE FROM EXTRA LARGE SIZED
AGENCIES
Which of the following statements best reflects your current thoughts about working in your current position?
I want to leave my position as soon as possible 9% - -1 -1 -1
I want to leave my position within the next 12 months 20% - -2 -1 -1
I want to stay working in my position for the next one to two years 39% - +3 +6 +6
I want to stay working in my position for at least the next three years 33% - +1 -3 -4
What best describes your plans involved with leaving your current position?
I am planning to retire 7% - +2 0 0
I am pursuing another position within my agency 66% - +24 +20 +19
I am pursuing a position in another agency 8% - -17 -13 -13
I am pursuing work outside the APS 6% - -5 -5 -4
It is the end of my non-ongoing, casual or contracted employment 2% - -2 -1 -1
Other 11% - -2 -2 -1
KEY AT LEAST 5 PERCENTAGE POINTS GREATER THAN COMPARATOR AT LEAST 5 PERCENTAGE POINTS LESS THAN
COMPARATOR
2021 APS employee census PAGE 17.
RETENTION
EMPLOYEES WHO WANTED TO LEAVE WERE ASKED FOR THE PRIMARY REASON BEHIND THEIR DESIRE TO LEAVE AND COULD SELECT ONE RESPONSE FROM A LIST OF ITEMS.
ONLY THE THREE REASONS FOR LEAVING WITH THE HIGHEST PROPORTION OF RESPONSES ARE PRESENTED HERE. THESE MAY VARY BETWEEN AGENCIES, WORK UNITS AND WITH RESULTS FOR THE APS OVERALL.
RESPONSE SCALE % VARIANCE FROM 2020
VARIANCE FROM APS OVERALL
VARIANCE FROM LARGER OPERATIONAL
AGENCIES
VARIANCE FROM EXTRA LARGE SIZED
AGENCIES
What is the primary reason behind your desire to leave your current position? (3 highest responses):
I want to try a different type of work or I’m seeking a career change 19% - - - -
I wish to pursue a promotion opportunity 16% - - - -
I am looking to further my skills in another area 15% - - - -
KEY AT LEAST 5 PERCENTAGE POINTS GREATER THAN COMPARATOR AT LEAST 5 PERCENTAGE POINTS LESS THAN
COMPARATOR
2021 APS employee census PAGE 18.
UNACCEPTABLE BEHAVIOUR
EMPLOYEES WHO HAD PERCEIVED DISCRIMINATION IN THE LAST 12 MONTHS IN THE COURSE OF THEIR EMPLOYMENT WERE ASKED WHAT THE BASIS WAS FOR THE DISCRIMINATION. EMPLOYEES COULD SELECT ONE OR MORE RESPONSES FROM A LIST OF ITEMS.
ONLY THE THREE TYPES OF DISCRIMINATION WITH THE HIGHEST PROPORTION OF RESPONSES ARE PRESENTED HERE. THESE MAY VARY BETWEEN AGENCIES, WORK UNITS AND WITH RESULTS FOR THE APS OVERALL.
DISCRIMINATION RESPONSE SCALE % VARIANCE FROM 2020
VARIANCE FROM APS OVERALL
VARIANCE FROM LARGER OPERATIONAL
AGENCIES
VARIANCE FROM EXTRA LARGE SIZED
AGENCIES
During the last 12 months and in the course of your employment, have you experienced discrimination on the basis of your background or a personal characteristic?
Yes 10% 0 -1 -2 -2
No 90% 0 +1 +2 +2
Did this discrimination occur in your current agency?
Yes 95% +1 +1 0 0
No 5% -1 -1 0 0
Basis for the discrimination that you experienced (3 highest responses):
Gender 33% - - - -
Age 33% - - - -
Race 23% - - - -
KEY AT LEAST 5 PERCENTAGE POINTS GREATER THAN COMPARATOR AT LEAST 5 PERCENTAGE POINTS LESS THAN
COMPARATOR
2021 APS employee census PAGE 19.
UNACCEPTABLE BEHAVIOUR
EMPLOYEES WHO PERCEIVED HARASSMENT OR BULLYING IN THE LAST 12 MONTHS WERE ASKED WHAT TYPE OF HARASSMENT OR BULLYING THEY EXPERIENCED. EMPLOYEES COULD SELECT ONE OR MORE RESPONSES FROM A LIST OF ITEMS.
ONLY THE THREE TYPES OF HARASSMENT OR BULLYING WITH THE HIGHEST PROPORTION OF RESPONSES ARE PRESENTED HERE. THESE MAY VARY BETWEEN AGENCIES, WORK UNITS AND WITH RESULTS FOR THE APS OVERALL.
HARASSMENT AND BULLYING
RESPONSE SCALE % VARIANCE FROM 2020
VARIANCE FROM APS OVERALL
VARIANCE FROM LARGER OPERATIONAL
AGENCIES
VARIANCE FROM EXTRA LARGE SIZED
AGENCIES
During the last 12 months, have you been subjected to harassment or bullying in your current workplace?
Yes 9% -1 -3 -4 -4
No 86% +2 +4 +5 +5
Not sure 6% -1 -1 -1 -1
Types of harassment or bullying experienced (3 highest responses):
Interference with work tasks (e.g. withholding needed information, undermining or sabotage) 41% - - - -Inappropriate and unfair application of work policies or rules (e.g. performance management, access to leave, access to learning and development)
35% - - - -
Did you report the harassment or bullying?
I reported the behaviour in accordance with my agency’s policies and procedures 29% - -4 -5 -4
It was reported by someone else 6% - -2 -2 -2
I did not report the behaviour 65% - +6 +7 +6
KEY AT LEAST 5 PERCENTAGE POINTS GREATER THAN COMPARATOR AT LEAST 5 PERCENTAGE POINTS LESS THAN
COMPARATOR
2021 APS employee census PAGE 20.
UNACCEPTABLE BEHAVIOUR
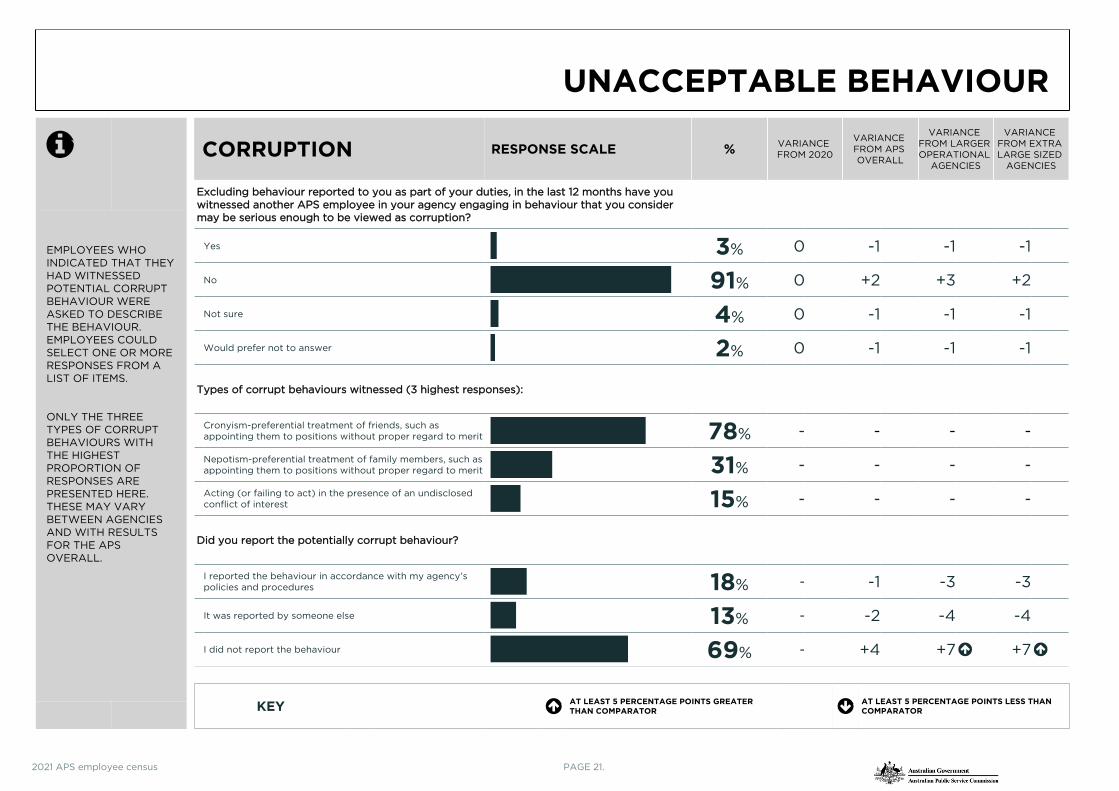
EMPLOYEES WHO INDICATED THAT THEY HAD WITNESSED POTENTIAL CORRUPT BEHAVIOUR WERE ASKED TO DESCRIBE THE BEHAVIOUR. EMPLOYEES COULD SELECT ONE OR MORE RESPONSES FROM A LIST OF ITEMS.
ONLY THE THREE TYPES OF CORRUPT BEHAVIOURS WITH THE HIGHEST PROPORTION OF RESPONSES ARE PRESENTED HERE. THESE MAY VARY BETWEEN AGENCIES AND WITH RESULTS FOR THE APS OVERALL.
CORRUPTION RESPONSE SCALE % VARIANCE FROM 2020
VARIANCE FROM APS OVERALL
VARIANCE FROM LARGER OPERATIONAL
AGENCIES
VARIANCE FROM EXTRA LARGE SIZED
AGENCIES
Excluding behaviour reported to you as part of your duties, in the last 12 months have you witnessed another APS employee in your agency engaging in behaviour that you consider may be serious enough to be viewed as corruption?
Yes 3% 0 -1 -1 -1
No 91% 0 +2 +3 +2
Not sure 4% 0 -1 -1 -1
Would prefer not to answer 2% 0 -1 -1 -1
Types of corrupt behaviours witnessed (3 highest responses):
Cronyism-preferential treatment of friends, such as appointing them to positions without proper regard to merit 78% - - - -
Nepotism-preferential treatment of family members, such as appointing them to positions without proper regard to merit 31% - - - -
Acting (or failing to act) in the presence of an undisclosed conflict of interest 15% - - - -
Did you report the potentially corrupt behaviour?
I reported the behaviour in accordance with my agency’s policies and procedures 18% - -1 -3 -3
It was reported by someone else 13% - -2 -4 -4
I did not report the behaviour 69% - +4 +7 +7
KEY AT LEAST 5 PERCENTAGE POINTS GREATER THAN COMPARATOR AT LEAST 5 PERCENTAGE POINTS LESS THAN
COMPARATOR
2021 APS employee census PAGE 21.
DEMOGRAPHICS
RESPONSE SCALE % VARIANCE FROM 2020
VARIANCE FROM APS OVERALL
VARIANCE FROM LARGER OPERATIONAL
AGENCIES
VARIANCE FROM EXTRA LARGE SIZED
AGENCIES
How do you describe your gender?
Man or male 42% +1 +4 +5 +4
Woman or female 54% -1 -5 -5 -5
Non-binary 0% - 0 0 0
I use a different term 0% - 0 0 0
Prefer not to say 4% 0 0 0 +1
Do you identify as an Australian Aboriginal and/or Torres Strait Islander person?
Yes 3% 0 -1 -1 -1
No 97% 0 +1 +1 +1
Do you have an ongoing disability?
Yes 9% 0 0 -1 -1
No 91% 0 0 +1 +1
KEY AT LEAST 5 PERCENTAGE POINTS GREATER THAN COMPARATOR AT LEAST 5 PERCENTAGE POINTS LESS THAN
COMPARATOR
2021 APS employee census PAGE 22.
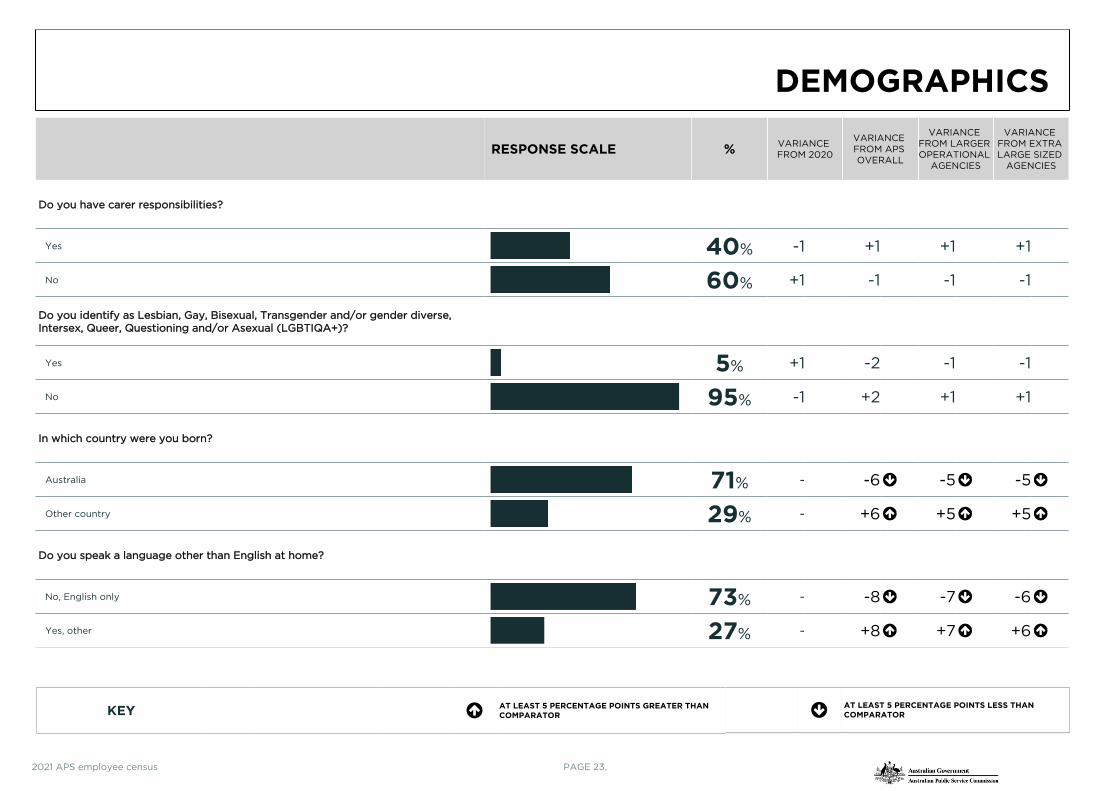
DEMOGRAPHICS
RESPONSE SCALE % VARIANCE FROM 2020
VARIANCE FROM APS OVERALL
VARIANCE FROM LARGER OPERATIONAL
AGENCIES
VARIANCE FROM EXTRA LARGE SIZED
AGENCIES
Do you have carer responsibilities?
Yes 40% -1 +1 +1 +1
No 60% +1 -1 -1 -1
Do you identify as Lesbian, Gay, Bisexual, Transgender and/or gender diverse, Intersex, Queer, Questioning and/or Asexual (LGBTIQA+)?
Yes 5% +1 -2 -1 -1
No 95% -1 +2 +1 +1
In which country were you born?
Australia 71% - -6 -5 -5
Other country 29% - +6 +5 +5
Do you speak a language other than English at home?
No, English only 73% - -8 -7 -6
Yes, other 27% - +8 +7 +6
KEY AT LEAST 5 PERCENTAGE POINTS GREATER THAN COMPARATOR AT LEAST 5 PERCENTAGE POINTS LESS THAN
COMPARATOR
2021 APS employee census PAGE 23.
TIME TO TAKE ACTION
CELEBRATE INVESTIGATE FURTHER
WITH OUR TEAMS OPPORTUNITIES
What things do we do well? Are there any other opportunities coming out of the results that we want to explore further?
Areas we need to focus on and turn into action plans:
THINK ABOUT HOW WE CAN BUILD ON OUR STRENGTHS AND LEARN FROM WHAT WE ARE GOOD AT.
HOW COULD WE INVESTIGATE? THROUGH LOOKING AT THE DATA IN MORE DETAIL OR THROUGH DISCUSSIONS WITH STAFF?
WHAT ARE THE KEY THINGS WE NEED TO IMPROVE TO MAKE WORKING HERE BETTER?
USE THIS PAGE TO START YOUR LOCAL ACTION PLANSIDENTIFY AREAS TO CELEBRATE, OPPORTUNITIES FOR IMPROVEMENT AND AREAS WHICH YOU NEED TO INVESTIGATE FURTHER.
PRIORITISE 3 AREAS TO TAKE FORWARD
PRIORITISE 3 AREASFOR ACTION TIMESCALES OWNER
RESOURCESREQUIRED
TARGET/SUCCESS MEASURE
1
2
3
2021 APS employee census PAGE 24.
GUIDE TO THIS REPORT
% POSITIVE
WHERE RESULTS ARE SHOWN AS POSITIVE PERCENTAGES (% POSITIVE), THESE ARE CALCULATED BY ADDING TOGETHER POSITIVE RESPONSES ("STRONGLY AGREE" + "AGREE") AND DIVIDING BY THE NUMBER OF RESPONDENTS WHO ANSWERED THE QUESTION.
Strongly agree
Strongly disagreeDisagreeNeitherAgree
POSITIVE RESPONSE
Negative response
Neutral response
÷number of respondents who
answered the question
=% POSITIVE
ROUNDING
RESULTS ARE PRESENTED AS WHOLE NUMBERS FOR EASE OF READING, WITH ROUNDING PERFORMED AT THE LAST STAGE OF CALCULATION FOR MAXIMUM ACCURACY. VALUES FROM X.00 TO X.49 ARE ROUNDED DOWN AND VALUES FROM X.50 TO X.99 ARE ROUNDED UP. THEREFORE IN SOME INSTANCES, RESULTS MAY NOT TOTAL 100%.
STRONGLY AGREE AGREE NEITHER DISAGREE STRONGLY
DISAGREE TOTAL
NUMBER OF RESPONSES 151 166 176 96 24 613
PERCENTAGE 24.63% 27.08% 28.71% 15.66% 3.92% 100%
ROUNDED PERCENTAGE 25% 27% 29% 16% 4% 101%
NUMBER OF POSITIVE 151 + 166 = 317
% POSITIVE 317 ÷ 613 = 52%
ANONYMITY
IT IS ENGINE'S PRACTICE NOT TO DISPLAY THE RESULTS OF GROUPS OF RESPONDENTS TO THE EXTENT WHERE THE ANONYMITY OF INDIVIDUALS MAY BE COMPROMISED. RESULTS WILL NOT BE SHOWN WHERE THERE ARE LESS THAN 10 RESPONDENTS IN A GROUP.
COMPARISONS WITH RESULTS FROM PREVIOUS YEARS
THE METHOD OF ANALYSING AND REPORTING SPECIFIC RESULTS MAY BE PERIODICALLY REVIEWED AND REVISED. SUCH IMPROVEMENTS ARE APPLIED TO CURRENT DATA AND THAT OF PREVIOUS YEARS. FOR THIS REASON THE CURRENT REPORT IS ALWAYS THE MOST ACCURATE DATA SOURCE FOR APS EMPLOYEE CENSUS RESULTS, INCLUDING COMPARISONS WITH TIME SERIES DATA.