111
The United Republic of Tanzania EMPLOYMENT AND EARNINGS SURVEY 2012 ANALYTICAL REPORT TANZANIA MAINLAND National Bureau of Statistics, Ministry of Finance, Dar es Salaam, July, 2013

The United Republic of Tanzania
EMPLOYMENT AND EARNINGS SURVEY 2012
ANALYTICAL REPORT
TANZANIA MAINLAND
National Bureau of Statistics,
Ministry of Finance,
Dar es Salaam,
July, 2013

i
FOREWORD
The history of the Employment and Earnings Survey (EES) in Tanzania dates back to 1963 when
the first post-independence survey was launched. Thereafter, data on employment and earnings
continued to be collected annually. However, due to lack of financial resources, this series was
discontinued for sixteen years before it was resumed in 2001, with this report being the fifth
since then.
The main objective of this survey is to provide information relating to status of employment and
earnings. The survey was designed so that, its results could be used for estimating the labour
market indicators for use in policy formulation, planning and estimating the contribution of
various sectors to Gross Domestic Product (GDP).
This report is the only source of information at regional level on the distribution of income,
newly recruited workers, job vacancies and number of employees in the formal sector of
employment. It is expected that this report will provide new insights for planners, policy makers,
researchers and others dealing with employment and related issues in the country.
Special thanks should go to employers and others who supplied the requested information. NBS
looks forward to their continuing cooperation and support in future surveys.
Comments and suggestions for improving the quality of future reports are welcome.
Dr. Albina Chuwa
Director General
National Bureau of Statistics
ii
TABLE OF CONTENTS
FOREWORD.................................................................................................................................. i
LIST OF TABLES ....................................................................................................................... vi
LIST OF FIGURES ................................................................................................................... viii
EXECUTIVE SUMMARY ......................................................................................................... ix
CHAPTER ONE ........................................................................................................................... 1
INTRODUCTION .......................................................................................................................... 1
1.1 Introduction ....................................................................................................................... 1
1.2 Background ........................................................................................................................ 1
1.3 Objectives of the Survey .................................................................................................... 2
1.4. Scope ................................................................................................................................ 2
1.5 Concepts and Definitions................................................................................................... 2
1.5.1 Employee .................................................................................................................... 2
1.5.2 Regular Employee ....................................................................................................... 2
1.5.3 Casual Workers ........................................................................................................... 2
1.5.4 Youth Persons ............................................................................................................. 2
1.5.5 Wage Rate ................................................................................................................... 2
1.5.6 Cash Earnings ............................................................................................................. 3
1.5.7 Annual Wage-Bill ....................................................................................................... 3
1.5.8 Free Housing ............................................................................................................... 3
1.5.9 Paid Leave ................................................................................................................... 3
1.5.10 Maternity Leave ........................................................................................................ 3
1.5.11 Free Ration ................................................................................................................ 3
1.5.12 Social Security Fund ................................................................................................. 4
1.5.13 Public Sector ............................................................................................................. 4
1.5.14 Private Sector ............................................................................................................ 4
1.5.15 Industrial Classification ............................................................................................ 4
1.5.15.1 Agriculture, Forestry and Fishing ...................................................................... 4
1.5.15.2 Mining and Quarrying ........................................................................................ 4
1.5.15.3 Manufacturing .................................................................................................... 5
1.5.15.4 Construction ....................................................................................................... 5

iii
1.5.15.5 Wholesale and Retail Trade; Repair of Motor Vehicles and Motorcycles ........ 5
1.5.15.6 Transportation and Storage ................................................................................ 5
1.5.15.7 Accommodation, Food and Beverage Service Activities................................... 5
1.5.15.8 Information and Communication ....................................................................... 6
1.5.15.9 Financial and Insurance Activities ..................................................................... 6
1.5.15.10 Real Estate Activities ....................................................................................... 6
1.5.15.11 Professional, Scientific and Technical Activities ............................................. 6
1.5.15.12 Administrative and Support Service Activities ................................................ 6
1.5.15.13 Public Administration and Defence; Compulsory Social Security .................. 7
1.5.15.14 Education .......................................................................................................... 7
1.5.15.15 Human Health and Social Work Activities ...................................................... 7
1.5.15.16 Arts, Entertainment and Recreation ................................................................. 7
1.5.15.17 Other Service Activities ................................................................................... 7
1.5.15.18 Activities of Households as Employers; Undifferentiated Goods- and
Services- Producing Activities of Households for Own Use ........................................... 8
1.5.15.19 Activities of Extraterritorial Organizations and Bodies ................................... 8
1.6 Survey Methodology and Estimation Procedure ............................................................... 8
1.6.1 The Sample Design ..................................................................................................... 8
1.6.2 Sources of Data ........................................................................................................... 9
1.6.3 The Response Status ................................................................................................. 10
1.6.4 Weight ....................................................................................................................... 10
CHAPTER TWO ........................................................................................................................ 11
EMPLOYMENT PROFILE.......................................................................................................... 11
2.0 Introduction ..................................................................................................................... 11
2.1. Percentage of Employees by Sector, Terms of Employment and Sex ........................... 11
2.2. Percentage of Employees by Sector, Age and Sex ......................................................... 12
2.3. Percentage of Employees by Selected Industries and Terms of Employment ............... 14
2.4. Percentage of Regular Employees by Citizenship and Sector ........................................ 15
2.5 Percentage of Employees by Industry and Sector ........................................................... 16
2.6 Percentage of Employees by Industry and Age ............................................................... 18

iv
2.7 Percentage of Regular Employees by Industry and Citizenship ...................................... 20
2.8 Percentage of Employees by Region and Sector ............................................................. 22
2.9 Percentage of Employees by Region, Terms of Employment and Sex ........................... 24
2.10 Percentage of Private Sector Employees by Region and Sex ........................................ 26
2.11 Percentage of Public Sector Employees by Region and Sex ......................................... 28
CHAPTER THREE .................................................................................................................... 31
WAGE RATES PROFILE ............................................................................................................ 31
3.0 Introduction ..................................................................................................................... 31
3.1 Percentage of Citizen Employees by Sector and Wage Rate .......................................... 31
3.2 Percentage of Adult and Youth Citizen Employees by Sector and Wage Rate .............. 32
3.3 Percentage of Citizen Employees by Wage Rate and Sex ............................................... 34
3.4 Percentage of Citizen Employees by Wage Rate, Sector and Sex .................................. 35
3.5 Distribution of Citizen Employees by Wage Rate and Selected Industries .................... 36
CHAPTER FOUR ....................................................................................................................... 38
CASH EARNINGS PROFILE ..................................................................................................... 38
4.0 Introduction ..................................................................................................................... 38
4.1 Monthly Average Cash Earnings by Sector and Sex ....................................................... 38
4.2 Monthly Average Cash Earnings by Broad Sector of Employment and Sex .................. 39
4.3 Monthly Average Cash Earnings by Broad Sector and Terms of Employment .............. 40
4.4 Monthly Average Cash Earnings of Employees by Industry and Sex ............................ 41
4.5 Annual Cash Earnings of Employees by Industry ........................................................... 42
4.6 Percentage of Cash Earnings of Employees by Industry and Terms of Employment ..... 44
CHAPTER FIVE ........................................................................................................................ 46
ANNUAL WAGE BILL PROFILE.............................................................................................. 46
5.0 Introduction ..................................................................................................................... 46
5.1 Annual Wage Bill by Sector ............................................................................................ 46
5.2 Annual Wage Bill by Cash Earnings and Free Ration .................................................... 48
5.3 Percentage of Annual Wage Bill by Industry .................................................................. 49
5.4 Annual Wage Bill by Selected Regions and Terms of Employment .............................. 50
CHAPTER SIX ........................................................................................................................... 52
v
RECRUITMENT OF NEW WORKERS ..................................................................................... 52
6.0 Introduction ..................................................................................................................... 52
6.1 Newly Recruited Workers by Occupation and Sex ......................................................... 52
6.2 Newly Recruited Workers by Occupation and Level of Education ................................ 53
6.3 Newly Recruited Workers by Sector and Employment Status ........................................ 55
6.4 Newly Recruited Workers by Occupation and Citizenship ............................................. 56
6.5 Newly Recruited Workers by Occupation and Status of Employment ........................... 56
6.6 Newly Recruited Workers by Region and Sex ................................................................ 57
6.7 Newly Recruited Workers by Occupation and Starting Salary ....................................... 58
6.8 Newly Recruited Workers by Level of Education and Starting Salary ........................... 60
CHAPTER SEVEN ..................................................................................................................... 62
JOB VACANCIES........................................................................................................................ 62
7.0 Introduction ..................................................................................................................... 62
7.1 Job Vacancies by Occupation and Working Experience ................................................. 62
7.2 Job Vacancies by Occupation and Gender Preference .................................................... 63
7.3 Job Vacancies by Industry and Reason for Vacancy ....................................................... 64
7.4 Job Vacancies by Industry and Level of Education ........................................................ 66
APPENDICES .............................................................................................................................. 68
Appendix A: Employment ..................................................................................................... 68
Appendix B: Wage Rate ........................................................................................................ 77
Appendix C: Cash Earnings .................................................................................................. 80
Appendix D: Annual Wage Bill ............................................................................................ 82
Appendix E: Newly Recruited Workers ................................................................................ 85
Appendix F: Job Vacancies ................................................................................................... 88
EMPLOYMENT AND EARNING SURVEY QUESTIONNAIRE – 2012 ................................ 90
vi
LIST OF TABLES Table 1.1: Number of Establishments and Response Rates by Sector, 2012 ............................... 10
Table 2.1: Percentage Distribution of Total Employees by Sector, Terms of Employment and
Sex, 2012....................................................................................................................................... 11
Table 2.2: Percentage Distribution of Total Employees by Sector, Age and Sex, 2012 .............. 13
Table 2.3: Percentage Distribution of Total Employees by Selected Industries and Terms of
Employment, 2011 and 2012 ........................................................................................................ 14
Table 2.4: Percentage Distribution of Regular Employees by Citizenship and Sector, 2011 and
2012............................................................................................................................................... 15
Table 2.5: Percentage Distribution of Total Employees by Industry and Sector, 2011 and 2012 17
Table 2.6: Percentage Distribution of Total Employees by Industry and Sex, 2012 .................... 19
Table 2.7: Percentage Distribution of Regular Employees by Industry and Citizenship, 2011 and
2012............................................................................................................................................... 21
Table 2.8: Percentage Distribution of Total Employees by Region and Sector, 2011 and 2012 .. 23
Table 2.9: Percentage Distribution of Total Employees by Region, Terms of Employment and
Sex, 2012....................................................................................................................................... 25
Table 2.10: Percentage Distribution of Private Adult and Youth Total Employees by Region and
Sex, 2012....................................................................................................................................... 27
Table 2.11: Percentage Distribution of Adult and Youth Employees in Public Sector by Region
and Sex, 2012 ................................................................................................................................ 29
Table 3.1: Percentage Distribution of Citizen Employees by Sector and Wage Rate, 2012 ........ 32
Table 3.2: Percentage Distribution of Adult and Youth Citizen Employees by Sector and Wage
Rate, 2012 ..................................................................................................................................... 33
Table 3.3: Percentage Distribution of Citizen Employees by Wage Rate and Sex, 2012 ............ 34
Table 3.4 (a): Percentage Distribution of Adult Citizen Employees by Wage Rate, Sector and
Sex, 2012....................................................................................................................................... 35
Table 3.4 (b): Percentage Distribution of Youth Citizen Employees by Wage Rate, Sector and
Sex, 2012....................................................................................................................................... 36
Table 4.1: Monthly Average Cash Earnings by Broad Sector of Employment and Sex, 2012 .... 39
Table 4.2: Monthly Average Cash Earnings by Broad Sector and Terms of Employment, 2012 40
Table 4.3: Monthly Average Cash Earnings of Employees by Industry and Sex, 2012 ............... 41

vii
Table 4.4: Annual Cash Earnings of Employees by Industry, 2011 and 2012 ............................. 43
Table 4.5: Percentage Distribution of Annual Cash Earnings of Employees by Industry and
Terms of Employment, 2012 ........................................................................................................ 44
Table 5.1 Annual Wage Bill by Category of Employment and Sector, 2011 and 2012 ............... 48
Table 5.2: Percentage Distribution of Annual Wage Bill by Industry, 2011 and 2012 ................ 49
Table 6.1: Number of Newly Recruited Workers by Occupation and Sex, 2010/11 and 2011/12
....................................................................................................................................................... 53
Table 6.2 Newly Recruited Workers by Occupation and Level of Education, 2011/12 .............. 54
Table 6.3 Number of Newly Recruited Workers by Sector and Employment Status, 2011/12 ... 55
Table 6.4: Number of Newly Recruited Workers by Occupation and Citizenship, 2011/12 ....... 56
Table 6.5 Number of Newly Recruited Workers by Occupation and Status of Employment,
2011/12 ......................................................................................................................................... 57
Table 6.6: Number of Newly Recruited Workers by Region and Sex, 2010/11 and 2011/12 ...... 58
Table 6.7: Number of Newly Recruited Workers by Occupation and Starting Salary, 2011/12 .. 59
Table 6.8: Number of Newly Recruited Workers by Level of Education and Starting Salary,
2011/12 ......................................................................................................................................... 60
Table 7.1 Distribution of Job Vacancies by Occupation and Working Experience, 2012 ........... 62
Table 7.2: Distribution of Job Vacancies by Occupation and Gender Preference, 2012 .............. 64
Table 7.3: Distribution of Job Vacancies by Industry and Reason for Vacancy, 2012 ................ 65
Table 7.4: Number of Job Vacancies by Industry and Level of Education, 2012 ........................ 66

viii
LIST OF FIGURES
Figure 3.1: Distribution of Adult Employees by Wage Rate and Selected Industries, 2012 ........ 37
Figure 4.1: Monthly Average Cash Earnings by Sector and Sex, 2012 ....................................... 38
Figure 5.1 Distribution of Annual Wage Bill by Major Sector, 2011 and 2012........................... 47
Figure 5.2: Distribution of Annual Wage Bill by Selected Regions and Terms of Employment,
2011 and 2012 ............................................................................................................................... 50

ix
EXECUTIVE SUMMARY
Introduction
This part summarizes the state of employment in the formal sector establishments in Tanzania
Mainland. These surveys are conducted under the NBS Statistics Act of 2002 which empowers
NBS to collect, compile and disseminate official statistics from registered establishments in the
country.
Employment Profile
The findings show that a total of 1,550,018 persons were employed in the formal sector in 2012
as compared to 1,362,559 persons in 2011. This is an increase of 13.8 percent. The proportion of
total employment was higher in the private sector (63.1% in 2011 and 64.2% in 2012) than in the
public sector (36.9% in 2011 and 35.8% in 2012) for the two years.
Public Administration and Defence; Compulsory Social Security industry had the highest
proportion of the total regular employees in two reference years, despite the decrease from 27.7
percent in 2011 to 20.8 percent in 2012, followed by education with a noticeable increase from
13.6 percent in 2011 to 18.7 percent in 2012. Dar es Salaam Region had the largest proportion of
the total employees in each reference year which decreased slightly from 33.6 percent in 2011 to
33.0 percent in 2012 while the region with the smallest share of total employees was Rukwa with
a share of 0.8 percent in 2011 and 1.1 percent in 2012.
Wage Rates Profile
Public administration and defense; compulsory social security had the largest number of
employees (186,342) who earned wages below TShs. 500,000. The second largest number of
adult citizen employees who earned wages below TShs. 500,000 was in education industry with
151,965 employees. The findings further reveal that, the largest proportion of citizen employees
(21.8% of the total citizen employees) in the private sector received monthly wage rate of
between TShs. 65,000 and TShs. 150,000 while in the public sector majority of citizen
employees (13.8% of the total citizen employees) received monthly wage rate of between TShs.
500,001 and 1,500,000
x
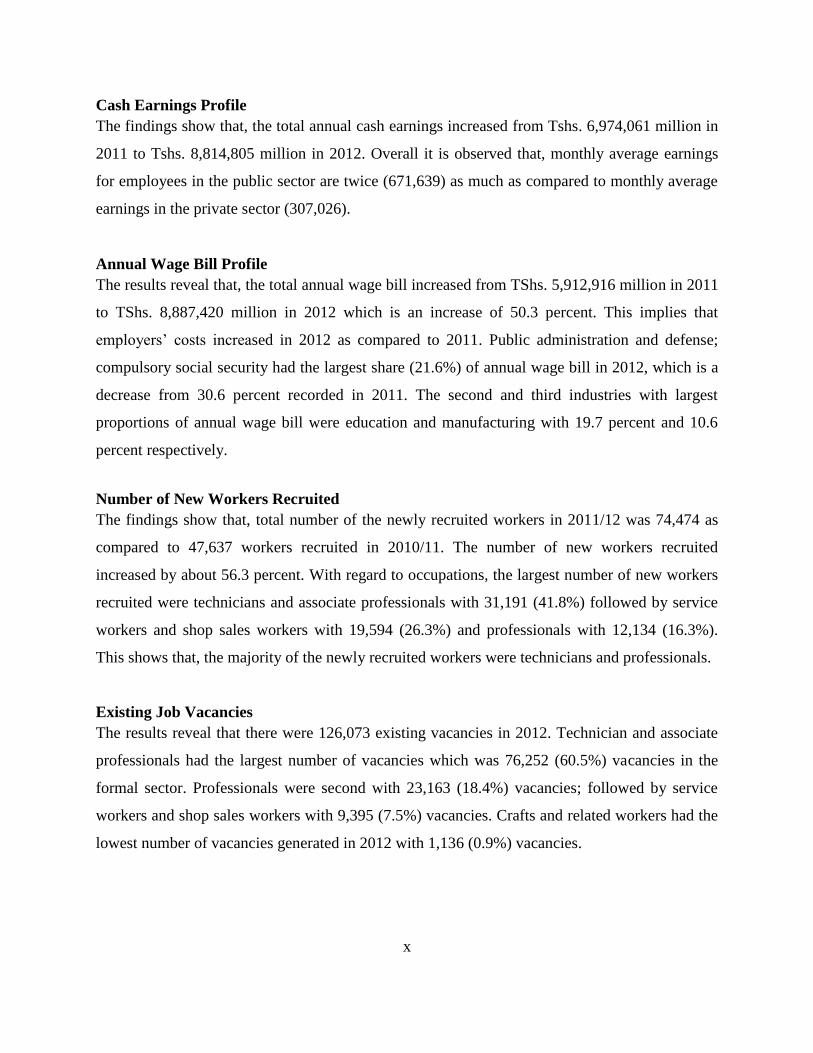
Cash Earnings Profile
The findings show that, the total annual cash earnings increased from Tshs. 6,974,061 million in
2011 to Tshs. 8,814,805 million in 2012. Overall it is observed that, monthly average earnings
for employees in the public sector are twice (671,639) as much as compared to monthly average
earnings in the private sector (307,026).
Annual Wage Bill Profile
The results reveal that, the total annual wage bill increased from TShs. 5,912,916 million in 2011
to TShs. 8,887,420 million in 2012 which is an increase of 50.3 percent. This implies that
employers’ costs increased in 2012 as compared to 2011. Public administration and defense;
compulsory social security had the largest share (21.6%) of annual wage bill in 2012, which is a
decrease from 30.6 percent recorded in 2011. The second and third industries with largest
proportions of annual wage bill were education and manufacturing with 19.7 percent and 10.6
percent respectively.
Number of New Workers Recruited
The findings show that, total number of the newly recruited workers in 2011/12 was 74,474 as
compared to 47,637 workers recruited in 2010/11. The number of new workers recruited
increased by about 56.3 percent. With regard to occupations, the largest number of new workers
recruited were technicians and associate professionals with 31,191 (41.8%) followed by service
workers and shop sales workers with 19,594 (26.3%) and professionals with 12,134 (16.3%).
This shows that, the majority of the newly recruited workers were technicians and professionals.
Existing Job Vacancies
The results reveal that there were 126,073 existing vacancies in 2012. Technician and associate
professionals had the largest number of vacancies which was 76,252 (60.5%) vacancies in the
formal sector. Professionals were second with 23,163 (18.4%) vacancies; followed by service
workers and shop sales workers with 9,395 (7.5%) vacancies. Crafts and related workers had the
lowest number of vacancies generated in 2012 with 1,136 (0.9%) vacancies.

1
CHAPTER ONE
INTRODUCTION
1.1 Introduction
The 2012 Employment and Earnings Survey is an annual survey conducted in Tanzania
Mainland by the National Bureau of Statistics. The survey covered three main categories of
employing establishments in both private and public sectors. The categories involved were: all
establishments of the public sector; all registered private establishments employing at least 50
persons; and a sample of all registered private establishments whose number of employees was
between 5 and 49 persons. The survey did not include domestic servants in private households,
non-salaried working proprietors and non-salaried family workers.
1.2 Background
The survey was a continuation of the previous similar surveys conducted each year. The first
Employment and Earnings Survey (EES) was conducted in 1963, followed by other annual
surveys up to 1984. However, due to lack of financial resources, these surveys were discontinued
after the 1984 survey. In 2001, the Employment and Earnings Surveys were re-started and were
done annually up to 2007. Reports for 2001, 2002, 2005, 2007 and 2010 - 2011 were published
and are available at the National Bureau of Statistics.
However, the results of 2005 to 2007 surveys were compiled in one report and the 2010 and
2011 results they are available in one report. The surveys for 2003 and 2004 were conducted but
due to low response rates, the results were not published. The 2008 and 2009 surveys were not
conducted due to financial constraints. This report is the fifth since 2001 when employment and
earnings surveys were re-started.

2
1.3 Objectives of the Survey
The main objective of the 2012 Employment and Earnings Survey was to obtain comprehensive
data on the annual status of Employment and Earnings as well as data on the socio-economic
characteristics of the Labour Market.
1.4. Scope
The term scope as far as Employment and Earnings Survey is concerned refers to the description
of the type of establishments and geographical areas that were covered by the survey in
accordance with the International Standard Industrial Classification (ISIC Rev. 4) in all regions
of Tanzania Mainland.
1.5 Concepts and Definitions
1.5.1 Employee
An employee is any person who is hired to work or perform a job or for a business, firm etc. in
return for payment under a contract of service with an employer whether as a manual labour,
clerical work or otherwise and whether the contract is expressed or implied or is oral or written.
With respect to this survey, the term Employee refers to all Wage Earners and Salaried
employees whether engaged full-time, part-time or casually in a full working day.
1.5.2 Regular Employee
The term Regular Employee refers to all permanent and temporary employees who have been
employed on a weekly or monthly basis for more than one month.
1.5.3 Casual Workers
The term Casual Workers refers to all persons receiving daily wages and other employees who
have not worked for the full month.
1.5.4 Youth Persons
The term Youth Persons, for the purpose of this survey, refers to all persons aged between 15 -
24 years.
1.5.5 Wage Rate
The term Wage Rate refers to the basic agreed rate of payment for normal time of work and
relate to a time-unit such as hour, day, week or month before any deductions are made.

3
1.5.6 Cash Earnings
The term Cash Earnings refers to the remuneration in cash paid to employees, for the time
worked or work done before any deductions are made, such as employers’ contribution to social
security or pension fund. They include payment for time not worked such as annual vacation and
other paid leave, other guaranteed and regular paid allowances, payment for overtime work and
house-rent paid directly by the employer.
1.5.7 Annual Wage-Bill
The term Annual Wage Bill comprises gross cash remunerations accrued as earnings of
employees and actual cost of free ration paid by employers in respect of their employees. They
represent workers claim for furnishing labour for the production of goods or services on behalf
of the employer. The wage bill does not include such non-cash benefits as pensions and
passages.
1.5.8 Free Housing
The term Free Housing refers to the employer’s housing facilities furnished and given to
employees free of charge or the amount of cash the employer pays to employees as housing
allowances.
1.5.9 Paid Leave
The term Paid Leave refers to the total number of person-days and total value concerning
different categories of normal paid leaves.
1.5.10 Maternity Leave
The term Maternity Leave refers to the total number of person-days and their total value in terms
of Tanzanian Shillings (TShs.) granted to female employees. An employee may commence
maternity leave at any time from four weeks before the expected date of confinement; or on an
earlier date if a medical practitioner certifies that it is necessary for the employee's health or that
of her unborn child.
1.5.11 Free Ration
The term Free Ration refers to the employer’s meals facilities supplied to employees free of
charge or the amount of cash the employer paid to employees as meals allowances.

4
1.5.12 Social Security Fund
The term Social Security Fund refers to the contributions by both employer and employee to the
social security scheme such as National Social Security Fund (NSSF), Parastatal Pension Fund
(PPF) and other schemes of fund of this nature organized by the establishment for the benefit of
employees.
1.5.13 Public Sector
Public Sector includes the Central Government, Local Government and Parastatal Organization
Institutions.
1.5.14 Private Sector
Private Sector includes Profit making Private Establishments, Non-Profit making Private
Establishments and Co-operative Establishments.
1.5.15 Industrial Classification
The Industrial Classification is based on the International Standard Industrial Classification of all
Economic Activities (ISIC) Revision 4. Establishments engaged in several activities were
classified under the industrial activity in which the majority of workers were employed. The
Government technical services were allocated as far as possible to the industry of the employing
department. The major industrial divisions are 21 according to the ISIC Revision 4 as follows:-
1.5.15.1 Agriculture, Forestry and Fishing
This industry includes the exploitation of vegetal and animal natural resources, comprising the
activities of growing of crops, raising and breeding of animals, harvesting of timber and other
plants, animals or animal products from a farm or their natural habitats.
1.5.15.2 Mining and Quarrying
The term Mining and Quarrying includes the extraction of minerals occurring naturally as solids
(coal and ores), liquids (petroleum) or gases (natural gas). This industry also includes
supplementary activities aimed at preparing the crude materials for marketing, for example,
crushing, grinding, cleaning, drying, sorting, concentrating ores, liquefaction of natural gas and
agglomeration of solid fuels.

5
1.5.15.3 Manufacturing
This industry includes the physical or chemical transformation of materials, substances, or
components into new products, although this cannot be used as the single universal criterion for
defining manufacturing .The materials, substances, or components transformed are raw materials
that are products of agriculture, forestry, fishing, mining or quarrying as well as products of other
manufacturing activities. Substantial alteration, renovation or reconstruction of goods is
generally considered to be manufacturing.
1.5.15.4 Construction
This industry includes general construction and specialized construction activities for buildings
and civil engineering works. It includes new works, repair, additions and alterations, the erection
of prefabricated buildings or structures on the site and also construction of a temporary nature.
1.5.15.5 Wholesale and Retail Trade; Repair of Motor Vehicles and Motorcycles
This industry includes wholesale and retail sale (i.e. sale without transformation) of any type of
goods and the rendering of services incidental to the sale of these goods. Also included in this
industry are the repair of motor vehicles and motorcycles.
1.5.15.6 Transportation and Storage
This industry includes the provision of passenger or freight transport, whether scheduled or not,
by rail, pipeline, road, water or air and associated activities such as terminal and parking
facilities, cargo handling, storage etc. It also includes renting of transport equipment with driver
or operator and postal and courier activities.
1.5.15.7 Accommodation, Food and Beverage Service Activities
This industry includes the provision of short-stay accommodation for visitors and other travellers
and the provision of complete meals and drinks fit for immediate consumption. The amount and
type of supplementary services provided within this section can vary widely. This industry
excludes the provision of long-term accommodation as primary residences. Also excluded is the
preparation of food or drinks that are either not fit for immediate consumption or that are sold
through independent distribution channels, i.e. through wholesale or retail trade activities.

6
1.5.15.8 Information and Communication
This industry includes the production and distribution of information and cultural products, the
provision of the means to transmit or distribute these products, as well as data or
communications, information technology activities and the processing of data and other
information service activities.
1.5.15.9 Financial and Insurance Activities
This section also includes the activities of holding assets, such as activities of holding companies
and the activities of trusts, funds and similar financial entities. This industry includes financial
service activities, including insurance, reinsurance and pension funding activities and activities
to support financial services.
1.5.15.10 Real Estate Activities
This industry includes acting as lessors, agents and/or brokers in one or more of the following:
selling or buying real estate, renting real estate, providing other real estate services such as
appraising real estate or acting as real estate escrow agents. Activities in this industry may be
carried out on own or leased property and may be done on a fee or contract basis. Also included
is the building of structures, combined with maintaining ownership or leasing of such structures.
1.5.15.11 Professional, Scientific and Technical Activities
This industry includes specialized professional, scientific and technical activities. These
activities require a high degree of training, and make specialized knowledge and skills available
to users.
1.5.15.12 Administrative and Support Service Activities
This industry includes a variety of activities that support general business operations. These
activities differ from those in professional, scientific and technical activities, since their primary
purpose is not the transfer of specialized Knowledge.

7
1.5.15.13 Public Administration and Defence; Compulsory Social Security
This industry includes activities of a governmental nature, normally carried out by the public
administration. It includes the enactment and judicial interpretation of laws and their pursuant
regulation, as well as the administration of programmes based on them, legislative activities,
taxation, national defence, public order and safety, immigration services, foreign affairs and the
administration of government programmes. This industry also includes compulsory social
security activities.
1.5.15.14 Education
This industry includes education at any level or for any profession, oral or written as well as by
radio and television or other means of communication. It includes education by the different
institutions in the regular school system at its different levels as well as adult education, literacy
programmes etc. Also included are military schools and academies, prison schools etc. at their
respective levels. The industry includes public as well as private education. For each level of
initial education, the classes include special education for physically or mentally handicapped
pupils.
1.5.15.15 Human Health and Social Work Activities
This industry includes the provision of health and social work activities. Activities include a
wide range of activities, starting from health care provided by trained medical professionals in
hospitals and other facilities, over residential care activities that still involve a degree of health
care activities to social work activities without any involvement of health care professionals.
1.5.15.16 Arts, Entertainment and Recreation
This industry includes a wide range of activities to meet varied cultural, entertainment and
recreational interests of the general public, including live performances, operation of museum
sites, gambling, sports and recreation activities.
1.5.15.17 Other Service Activities
This industry (as a residual category) includes the activities of membership organizations, the
repair of computers and personal and household goods and a variety of personal service activities
not covered elsewhere in the classification.

8
1.5.15.18 Activities of Households as Employers; Undifferentiated Goods- and Services-
Producing Activities of Households for Own Use
This class includes: activities of households as employers of domestic personnel such as maids,
cooks, waiters, valets, butlers, laundresses, gardeners, gatekeepers, stable-lads, chauffeurs,
caretakers, over nesses, babysitters, tutors, secretaries etc. It allows the domestic personnel
employed to state the activity of their employer in censuses or studies, even though the employer
is an individual. The product produced by this activity is consumed by the employing household.
1.5.15.19 Activities of Extraterritorial Organizations and Bodies
This class includes: activities of international organizations such as the United Nations and the
specialized agencies of the United Nations system, regional bodies etc., the International
Monetary Fund, the World Bank, the World Customs Organization, the Organization for
Economic Co-operation and Development, the Organization of Petroleum Exporting Countries,
the European Communities, the European Free Trade Association etc.
1.6 Survey Methodology and Estimation Procedure
1.6.1 The Sample Design
The Employment and Earnings Survey (EES) of 2012 covered a total of 9,431 establishments
from a sampling frame of 52,802 establishments consisting of all public and private
establishments employing at least five employees. In this survey, establishment is the sampling
unit which is a legal economic entity under a single control or ownership engaging itself in one
main kind of economic activity at a fixed location.
The EES covered formal establishments in both Private and Public Sectors in Tanzania Mainland
in such a way that they made a representative sample, reflecting the level and magnitude of the
economic activities within their respective industrial groups. The EES sample was based on a
sampling frame obtained from the Central Register of Establishments (CRE) maintained by the
NBS.
9
Sampling was done by the NBS in collaboration with an expert from the University of Dar es
Salaam. All public and private sector establishments employing at least 50 employees were
covered. The existing sampling frame was developed on the basis of International Standard
Industrial Classification Revision 4 (ISIC Rev.4).
In the overall, the multistage sampling technique was used. The first stage within a region
included stratification of all private establishments into two strata employing 5 – 9 and 10 – 49
persons. Then, the sample size for each stratum was developed in each region. Finally,
probability proportional to size (PPS) was used to draw the sample within each industry. A
similar approach was used in all the 21 regions to draw the sample size across all industrial
major divisions in the two strata separately to enhance representation of all economic activities to
the economy.
The 2012 sampling procedure is the same as that used in the 2011 EESs; hence the results from
this survey were consistent with the 2011 employment statistics.
1.6.2 Sources of Data
Data was collected using questionnaires delivered to the selected establishments by regional
statistical offices. Data collected refer to identification of establishments, regular employees,
casual workers, number of new workers recruited and the current job vacancies. The Survey did
not include the following:
1. Wage earners in seasonal small-holder agriculture
2. Employees in households
3. Members of the Foreign Diplomatic Missions, Corporation and International Aid
Organizations stationed in Tanzania
4. Members of armed forces

10
1.6.3 The Response Status
The accuracy of the statistical data provided in the tables is dependent on the rate of response,
especially where a few establishments are dominant in the industry. On average, the response
rate was about 88% for EES 2012. The summary of response rates for both public and private
sector is given in the table below;
Table 1.1: Number of Establishments and Response Rates by Sector, 2012
Sector Employment size
2012
Number of establishments selected
Responded Response rate
Private
5 - 9' 2,042 2,005 98.2
10 - 49' 2,411 1,935 80.3
50+ 1,278 981 76.8
Sub-Total 5,731 4,921 85.9
Public
5 - 9' 1,815 1,661 91.5
10 - 49' 2,018 1,814 89.9
50+ 1,153 1,035 89.8
Sub-Total 4,986 4,510 90.5
Grand Total 10,717 9,431 88.0
1.6.4 Weight
The sampling weights for the strata were calculated by using the simple expansion method
denoted as:-
Weight = N/n
Where: N = Total number of establishments before sampling
n = Total number of sampled establishments.

11
CHAPTER TWO
EMPLOYMENT PROFILE
2.0 Introduction
The employment profile highlights the performance of the formal sector in Tanzania Mainland.
This chapter discusses the employment situation for regular and casual employees, their sectors
and industries of employment, citizenship, sex and regional disparities. It also discusses findings
on the age of employees (adults and youth aged between 15 and 24 years).
2.1. Percentage of Employees by Sector, Terms of Employment and Sex
This section presents the characteristic of employees in term of sectors, terms of employment,
and gender disparity. It describes the strength and weakness on the performance of employment
in the formal sector in Tanzania, this information feeds into policy formulation and
implementation for betterment of the country’s labour utilization.
Table 2.1: Percentage Distribution of Total Employees by Sector, Terms of Employment
and Sex, 2012
Terms of Employment Private Public Total
Number Percent Number Percent Number Percent
Regular Employees
Adult males
508,288
32.8
312,621
20.2
820,909
53.0
Adult females 260,653 16.8 216,404 14.0 477,057 30.8
Youth males 9,294 0.6 3,233 0.2 12,527 0.8
Youth females 8,216 0.6 5,024 0.3 13,240 0.9
Sub Total 786,451 50.8 537,282 34.7 1,323,733 85.5
Casual Employees
Adult Males 114,482 7.4 12,154 0.8 126,636 8.2
Adult Females 82,920 5.3 4,524 0.3 87,444 5.6
Youth Males 6,712 0.4 187 0.0 6,899 0.4
Youth Females 5,140 0.3 166 0.0 5,306 0.3
Sub Total 209,254 13.4 17,031 1.1 226,285 14.5
Total 995,705 64.2 554,313 35.8 1,550,018 100.0

12
Table 2.1 shows that the total number of employees in the formal sector in Tanzania mainland
was 1,550,018 persons, of whom, 995,705 employees are in private sector compared to 554,313
who are in the public sector. Private sector was the driving force of the economy as expected,
and employees in this sector were 64.2 percent of the total number of employees in the formal
sector. Public sector composes 35.8 percent of total employees in the formal sector.
Employment in the formal sector constitutes regular employees and casual employees as
described in the concepts and definitions. Regular employees had the highest proportion of total
employees (85.5%) and the remaining 14.5 percent were casual employees. Regular employment
is the most desirable type of employment, and hence is a good sign when most of the employees
are in this type of employment.
Youths aged 15-24 years form a small proportion of the employees in the formal sector with less
than one percent in both public and private sector, perhaps because most of them are still in
school. The majority of persons employed in this sector are those aged 25 years and above.
Casual employees were more in the private sector (13.4% of total employees) than in the public
sector (1.1%).
Regular adult males in the private sector are about a third (32.8%) of total employees while the
regular adult females in the private sector are only 16.8 percent of total employees. On the other
hand, the regular adult males and females in the public sector are 20.2 percent and 14.0 percent
of total employees respectively. However, public sector recorded the lowest percentage point
difference between males and females (6.2%) as compared to private sector (16.0%).
2.2. Percentage of Employees by Sector, Age and Sex
The sector of employment is important in studying characteristics of employment, underscoring
the economic behavior of private and public institutions are of interest for policy formulation. In
addition, it is important to explore the characteristics of adults aged 25 years and above
separately with youths aged 15-24 years employed in these sectors.

13
Table 2.2: Percentage Distribution of Total Employees by Sector, Age and Sex, 2012
Sector Adult aged 25+ Youth aged 15-24
Total Male Female Total Male Female Total
A. Private Sector
Profit Making Institutions 32.3 16.4 48.7 0.9 0.8 1.7 50.4
Non-profit Making Institutions 6.7 5.3 12.0 0.1 0.1 0.2 12.2
Cooperatives 1.2 0.4 1.6 0.0 0.0 0.0 1.6
Total Percentage: A 40.2 22.1 62.3 1.0 0.9 1.9 64.2
B. Public Sector
Central and Local Government 19.0 12.8 31.8 0.3 0.3 0.6 32.4
Parastatal Organizations 2.0 1.4 3.4 0.0 0.0 0.0 3.4
Total Percentage: B 21.0 14.2 35.2 0.3 0.3 0.6 35.8
Total Percentage: (A+B) 61.2 36.3 97.5 1.3 1.2 2.5 100.0
Total Employees 947,544 564,502 1,512,046 19,427 18,545 37,972 1,550,018
Table 2.2 shows the total employment and the broader sectoral distribution, results reveal that the
highest proportion of employees in the formal sector were employed in the private profit making
institution (50.4%) followed by central and local government accounting for 32.4 percent of total
employees. Cooperatives constituted the lowest proportion of total employees (1.6%).
Adult employees comprise 97.5 percent of total employees in the formal sector, where adult
males dominate employment in the formal sector equivalent to 61.2 percent of all employees.
Adult females ranked second with 36.3 percent of total employees in the sector. Youth
employees aged between 15 and 24 years comprise only 2.5 percent of total employees in the
formal sector showing the low involvement of youths in the formal sector in Tanzania mainland.
Male youths have a slightly higher proportion to total employees (1.3 percent) compared to
female youths (1.2 percent).
In both private and public sectors, adult males have a higher proportion of total employees
(40.2% and 21.0%) compared to adult females (22.1% and 14.2% in private and public
respectively).
Around one third of employees in the formal sector (32.3%) are males aged 25 years and above
employed in private profit making institutions, while only 16.4 percent of female are employed
in this sector.

14
2.3. Percentage of Employees by Selected Industries and Terms of Employment
Employment by industry highlights the concentration of employees in the formal sector. This
shows the high or low employing activities and therefore areas which need policy intervention.
The performance of these activities over time is also assessed to inform policy makers on
performance of implemented policies. This section presents results for selected industries.
Table 2.3: Percentage Distribution of Total Employees by Selected Industries and Terms of
Employment, 2011 and 2012
Industry Regular Employees Casual Employees Total Employees
2011 2012 2011 2012 2011 2012
Agriculture, forestry and fishing 6.0 5.7 58.2 26.4 17.9 9.2
Manufacturing 17.5 19.0 26.2 54.4 19.5 24.8
Wholesale and Retail Trade 11.9 12.0 7.7 9.2 10.8 11.6
Financial and insurance activities 3.7 3.2 0.0 0.1 2.9 2.7
Public administration and defense 40.9 31.6 5.7 6.2 32.9 27.4
Education 20.0 28.5 2.2 3.7 16.0 24.3
Total Percentage 100.0 100.0 100.0 100.0 100.0 100.0
Table 2.3 shows the percentage distribution of total employees in the selected major industries
for the year 2011 and 2012. The table reveals a noticeable decrease in the proportion of
employees in public administration and defense from 32.9 percent of the total employees in year
2011 to 27.4 percent in year 2012. An increase of the proportion of employees was noticeable in
the education sector from 16.0 percent of total employees in 2011 to 24.3 percent in 2012. To a
larger extent, this increase reflects the government investment in education sector.
The proportion of employees in the manufacturing sector has increased from 19.5 percent of total
employees recorded in 2011 to 24.8 percent in 2012. However, the proportion of employees in
agriculture, forestry and fishing has decreased from 17.9 percent in 2011 to 9.2 percent in 2012.
This change shows that, the economy is slowly shifting to more manufacturing from agricultural
based.

15
Among regular employees, a big decrease in the employees’ proportion was realised in public
administration and defense from 40.9 percent in 2011 to 31.6 percent in 2012. Regular
employees in education sector had also increased from 20.0 percent in 2011 to 28.5 percent in
2012.
Among casual employees, a significant decrease was noticed in agriculture, where it declined
from 58.2 percent in 2011 to 26.4 percent in 2012. A significant increase in the proportion of
employees was also realised in the manufacturing sector, which increased from 26.2 percent in
2011 to 54.4 percent in 2012.
2.4. Percentage of Regular Employees by Citizenship and Sector
Citizenship in employment has gained importance following regional integrations such as East
African Community (EAC) that allows free movement of EAC residents. In assessing the
performance of employment in Tanzania, information on non citizen employees helps to inform
policy makers on areas that may need intervention.
Table 2.4: Percentage Distribution of Regular Employees by Citizenship and Sector, 2011
and 2012
Sector Citizens Non Citizens Total
2011 2012 2011 2012 2011 2012
A. Private
Profit Making Institutions 42.9 43.6 0.7 0.7 43.6 44.3
Non-profit Making Institutions 11.9 13.2 0.1 0.2 12.0 13.4
Cooperatives 0.8 1.7 0.0 0.0 0.8 1.7
Total Percentage: A 55.6 58.5 0.8 0.9 56.4 59.4
B. Public
Central and Local Government 39.4 36.7 0.0 0.0 39.4 36.7
Parastatal Organizations 4.2 3.9 0.0 0.0 4.2 3.9
Total Percentage: B 43.6 40.6 0.0 0.0 43.6 40.6
Total Percentage: (A+B) 99.2 99.1 0.8 0.9 100.0 100.0
Total Employees 1,093,853 1,311,327 8,620 12,406 1,102,473 1,323,733
Table 2.4 shows that, 99.1 percent of regular employees in the formal sector are Tanzanian
citizens. The proportion of non citizen employees has slightly increased from 0.8 percent in 2011
to 0.9 percent of total employees in 2012.
16
The proportion of Tanzanian citizen employees to total employees in the private sector has
increased from 55.6 percent in 2011 to 58.5 percent in 2012. In public sector, the proportion has
decreased from 43.6 percent in 2011 to 40.6 percent in 2012, indicating the increasing role of
private sector in employment in the formal sector.
Employment of citizen employees in private profit making institutions has increased from 42.9
percent of total employees in 2011 to 43.6 percent in 2012. On the other hand, the proportion of
employment in central and local government has decreased from the previous year from 39.4
percent of total employment in 2011 to 36.7 percent in 2012.
2.5 Percentage of Employees by Industry and Sector
Information on industry and sector of employment, altogether, is important as it highlights the
performance of employment in terms of levels for specific activities across the sector. The
comparison of employment for year 2011 and 2012 bring out the performance of industry and
sector over time.

17
Table 2.5: Percentage Distribution of Total Employees by Industry and Sector, 2011 and
2012
Industry Private Public Total
2011 2012 2011 2012 2011 2012
Agriculture, forestry and fishing 19.4 9.5 1.3 0.3 12.7 6.2
Mining and quarrying 1.3 1.5 0.0 0.0 0.8 1.0
Manufacturing 21.5 26.0 0.8 0.5 13.9 16.8
Electricity, gas, steam and air
conditioning supply 0.3 0.2 1.5 1.2 0.8 0.6
Water supply; sewerage, waste
management and remediation
activities
0.1 0.1 1.4 1.5 0.6 0.6
Construction 3.7 4.4 0.5 0.1 2.5 2.9
Wholesale and retail trade; repair of
motor vehicles, motorcycles and
personal and household goods
12.1 12.1 0.3 0.0 7.8 7.8
Transportation and storage 3.0 3.8 1.4 1.2 2.4 2.8
Accommodation and food service
activities 11.3 11.9 0 0.0 7.1 7.7
Information and communication 1.3 1.6 0.5 0.6 1.0 1.2
Financial and insurance activities 1.9 2.1 2.2 1.2 2.1 1.8
Real estate activities 0.1 0.1 0.3 0.1 0.1 0.1
Professional, scientific and technical
activities 0.8 1.5 1.8 3.0 1.1 2.0
Administrative and support service
activities 3.6 3.6 0.1 0.1 2.3 2.4
Public administration and defense;
compulsory social security 0.4 1.1 62.7 49.7 23.4 18.5
Education 7.6 7.7 17.8 32.1 11.3 16.4
Human health and social work activities
4.9 5.9 6.8 8.0 5.6 6.7
Arts, entertainment and recreation
0.4 0.3 0.2 0.1 0.3 0.3
Other service activities 6.3 6.6 0.7 0.3 4.2 4.2
Total Percentage 100.0 100.0 100.0 100.0 100.0 100.0
Total Employees 859,435 995,705 503,124 554,313 1,362,559 1,550,018

18
Table 2.5 gives the percentage distribution of total employees by sector and industry. The results
show that public administration was the leading employing industry with a share of 18.5 percent
of total employees in the formal sector, followed by manufacturing industry (16.8%). Arts and
entertainment had the least contribution with 0.3 percent of total employees.
From 2011 to 2012, education and manufacturing industries increased their shares from 11.3
percent to 16.4 percent and 13.9 percent to 16.8 percent respectively. However, employment in
the agricultural industry decreased from 12.7 percent of total employees in 2011 to 6.2 percent in
2012.
Results show that, the proportion of employees in public administration decreased from 62.7
percent of total employees in 2011 to 49.7 percent in 2012. On the other hand, education industry
recorded an increase in its share of total employees from 17.8 percent in 2011 to 32.1 percent in
2012.
Agricultural industry recorded a significant drop in its share of total employees from 19.4
percent in 2011 to 9.5 percent in 2012. This indicates the growing importance of other industries
in the formal sector in Tanzania Mainland.
2.6 Percentage of Employees by Industry and Age
The contribution to total employees differed between employed adults aged 25 years and above
and youths aged 15-24 years in various activities. Information on the activity performance of
youths, which is a growing concern, attracts policy consideration for youths’ betterment.

19
Table 2.6: Percentage Distribution of Total Employees by Industry and Sex, 2012
Industry Adult aged 25+ Youth aged 15-24
Total Male Female Total Male Female Total
Agriculture, forestry and fishing 6.6 5.4 6.2 9.4 4.8 7.1 6.2 Mining and quarrying 1.4 0.3 1.0 - - - 1.0 Manufacturing 17.3 15.5 16.7 26.3 21.6 24.0 16.8 Electricity, gas, steam and air conditioning supply 0.8 0.3 0.6 0.3 - 0.0 0.6 Water supply; sewerage, waste management and remediation activities 0.7 0.4 0.6 0.2 0.2 0.2 0.6 Construction 3.8 1.3 2.8 5.0 1.4 3.2 2.9 Wholesale and retail trade; repair of motor vehicles, motorcycles and personal and household goods 8.9 5.3 7.5 22.8 12.1 17.6 7.8 Transportation and storage 3.7 1.5 2.9 2.1 0.7 1.4 2.8 Accommodation and food service activities 5.6 10.7 7.5 7.0 21.0 13.9 7.5 Information and communication 1.3 1.1 1.3 0.5 1.0 0.7 1.2 Financial and insurance activities 1.6 2.3 1.8 0.7 0.7 0.7 1.8 Real estate activities 0.1 0.1 0.1 0.1 0.0 0.1 0.1 Professional, scientific and technical activities
2.2 1.7 2.0 0.6 0.4 0.5 2.0
Administrative and support service activities
2.9 1.5 2.4 2.7 0.8 1.8 2.4
Public administration and defense; compulsory social security
18.9 18.4 18.7 5.8 9.4 7.7 18.5
Education
15.1 18.8 16.5 12.7 17.7 15.2 16.4
Human health and social work activities 4.2 11.0 6.7 1.7 5.2 3.4 6.7 Arts, entertainment and recreation 0.3 0.2 0.3 0.0 0.2 0.1 0.3 Other service activities 4.6 4.2 4.4 2.1 2.8 2.4 4.4
Total Percentage 100.0 100.0 100.0 100.0 100.0 100.0 100.0
Total Employees 947,544 564,502 1,512,046 19,427 18,545 37,972 1,550,018

20
Results in Table 2.6 shows that, most youths aged 15-24 years (24.0%) were employed in
manufacturing industry followed by whole sale and retail trade comprising 17.6 percent of total
youths in the formal sector. Another important industry in employing youths in Tanzania
mainland was education with 15.2 percent of all youths in this sector.
Results also reveal that in mining and quarrying; and electricity and gas industries, youths had
the smallest shares in the formal sector in Tanzania employing nearly zero percent of total youth
employees.
Employment of both male and female youths was concentrated in manufacturing industry
employing 26.3 percent of youth males and 21.6 percent of females in 2012. Accommodation
and food services employed the majority of female youths in 2012 (21.0%) compared to males
(7.0%).
Public administration was the most important industry in employing adults aged 25 years and
above which comprises 18.7 percent of total adult employees in 2012, followed by
manufacturing industry (16.7%).
Most of female adults aged 25 years and above were employed in education industry (18.8%)
followed by public administration (18.4% of total adult females in the formal sector). Public
administration indicated to be the most important industry for males (employing 18.9% of all
adult males) in the formal sector. Manufacturing ranked second employing 17.3 percent of adult
males in 2012.
2.7 Percentage of Regular Employees by Industry and Citizenship
The analysis on the distribution of the total regular employees by industry and citizenship
focuses mainly on the selected major industries which are: Public administration and defence,
compulsory social security; education; manufacturing; and human health and social work
industry. It will also give insight on the distribution of citizen and non citizen regular employees
among industries.
21
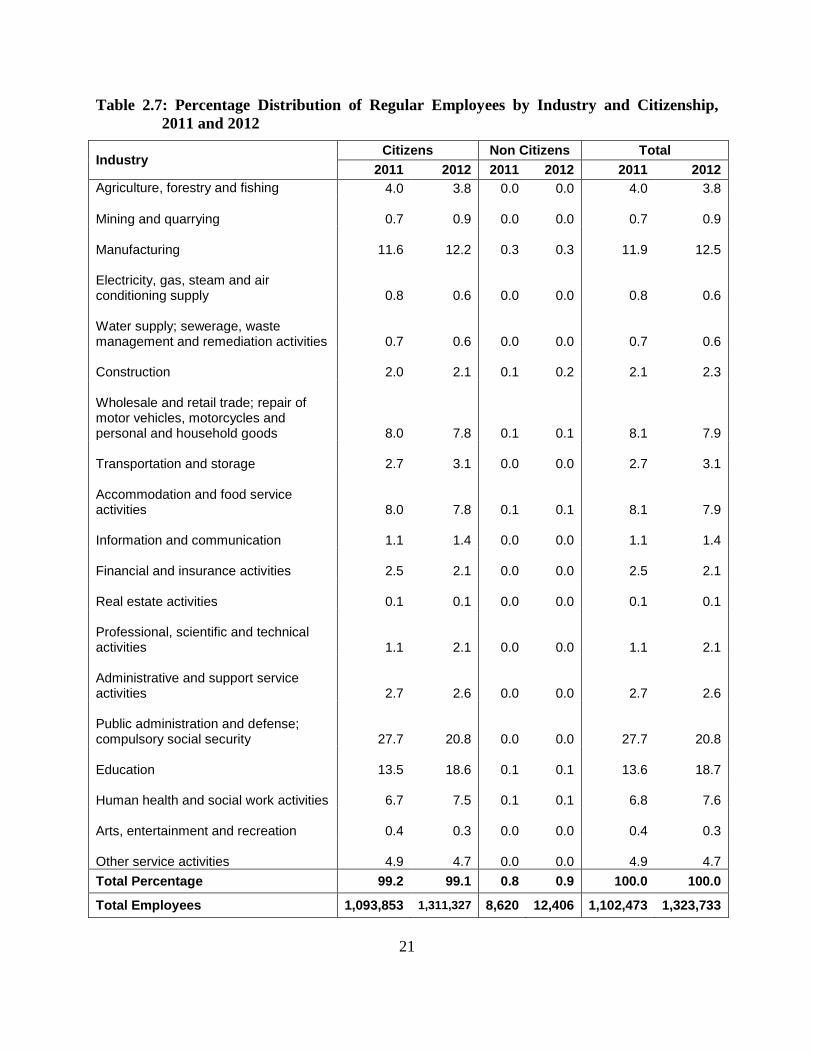
Table 2.7: Percentage Distribution of Regular Employees by Industry and Citizenship,
2011 and 2012
Industry Citizens Non Citizens Total
2011 2012 2011 2012 2011 2012
Agriculture, forestry and fishing 4.0 3.8 0.0 0.0 4.0 3.8 Mining and quarrying 0.7 0.9 0.0 0.0 0.7 0.9 Manufacturing 11.6 12.2 0.3 0.3 11.9 12.5 Electricity, gas, steam and air conditioning supply 0.8 0.6 0.0 0.0 0.8 0.6 Water supply; sewerage, waste management and remediation activities 0.7 0.6 0.0 0.0 0.7 0.6 Construction 2.0 2.1 0.1 0.2 2.1 2.3 Wholesale and retail trade; repair of motor vehicles, motorcycles and personal and household goods 8.0 7.8 0.1 0.1 8.1 7.9 Transportation and storage 2.7 3.1 0.0 0.0 2.7 3.1 Accommodation and food service activities 8.0 7.8 0.1 0.1 8.1 7.9 Information and communication 1.1 1.4 0.0 0.0 1.1 1.4 Financial and insurance activities 2.5 2.1 0.0 0.0 2.5 2.1 Real estate activities 0.1 0.1 0.0 0.0 0.1 0.1 Professional, scientific and technical activities 1.1 2.1 0.0 0.0 1.1 2.1 Administrative and support service activities 2.7 2.6 0.0 0.0 2.7 2.6 Public administration and defense; compulsory social security 27.7 20.8 0.0 0.0 27.7 20.8 Education 13.5 18.6 0.1 0.1 13.6 18.7 Human health and social work activities 6.7 7.5 0.1 0.1 6.8 7.6 Arts, entertainment and recreation 0.4 0.3 0.0 0.0 0.4 0.3 Other service activities 4.9 4.7 0.0 0.0 4.9 4.7
Total Percentage 99.2 99.1 0.8 0.9 100.0 100.0
Total Employees 1,093,853 1,311,327 8,620 12,406 1,102,473 1,323,733

22
Table 2.7 shows that, public administration and defence; compulsory social security industry had
the highest proportion of the total regular employees in two reference years, despite the decrease
from 27.7 percent in 2011 to 20.8 percent in 2012, followed by education with a noticeable
increase from 13.6 percent in 2011 to 18.7 percent in 2012. Manufacturing industry had the third
highest proportion of the total regular employees which increased from 11.9 percent in 2011 to
12.5 percent in 2012, followed by human health and social work industry, which also had an
increasing proportion of the total regular employees from 6.8 percent in 2011 to 7.6 percent in
2012.
The findings further show that, non citizen regular employees were very few in the formal
employment across all the industries in both years, although it slightly increased from 0.8 percent
in 2011 to 0.9 percent in 2012. However, there were noticeable proportions of non citizen regular
employees in the manufacturing, construction, accommodation and food services activities,
wholesale and retail trade; repair of motor vehicles, motorcycles and personal and household
goods and education industries.
2.8 Percentage of Employees by Region and Sector
This section shows percentage distribution of the total employees by region and sector. It also
analyses the information of a few selected regions such as Dar es Salaam, Morogoro, Singida,
Manyara, Lindi, Tabora, Pwani, and Rukwa by sector.

23
Table 2.8: Percentage Distribution of Total Employees by Region and Sector, 2011 and
2012
Region Private Public Total
2011 2012 2011 2012 2011 2012
Dodoma 0.9 1.2 1.5 1.4 2.4 2.6
Arusha 4.3 4.2 1.1 1.1 5.4 5.3
Kilimanjaro 3.1 4.4 2.1 2.0 5.2 6.4
Tanga 2.2 3.0 1.8 1.8 4.0 4.8
Morogoro 10.6 6.0 3.5 3.1 14.1 9.1
Pwani 0.6 0.7 1.3 1.1 1.9 1.8
Dar es Salaam 25.5 25.8 8.1 7.2 33.6 33.0
Lindi 0.3 0.3 0.8 1.0 1.1 1.3
Mtwara 1.2 1.4 0.8 0.8 2.0 2.2
Ruvuma 1.1 1.2 0.8 0.8 1.9 2.0
Iringa 1.5 2.1 1.7 1.8 3.2 3.9
Mbeya 2.6 3.1 2.2 2.2 4.8 5.3
Singida 0.6 0.7 0.9 0.9 1.5 1.6
Tabora 0.3 0.5 1.3 1.3 1.6 1.8
Rukwa 0.4 0.4 0.4 0.7 0.8 1.1
Kigoma 0.8 0.9 0.9 1.1 1.7 2.0
Shinyanga 1.4 1.7 2.8 2.6 4.2 4.2
Kagera 1.1 1.1 1.2 1.1 2.3 2.2
Mwanza 3.1 3.2 1.7 1.8 4.8 5.0
Mara 0.7 1.2 1.5 1.4 2.2 2.5
Manyara 0.8 1.1 0.5 0.7 1.3 1.8
Total Percentage 63.1 64.2 36.9 35.8 100.0 100.0
Total Employees 859,435 995,705 503,124 554,313 1,362,559 1,550,018
Table 2.8 shows that, Dar es Salaam Region had the largest proportion of the total employees in
each reference year which decreased slightly from 33.6 percent in 2011 to 33.0 percent in 2012.
In the private sector, the contribution of Dar es Salaam to total employees increased slightly from
25.5 percent in 2011 to 25.8 percent in 2012 while in the public sector, its contribution decreased
from 8.1 percent in 2011 to 7.2 percent in 2012.

24
Morogoro Region’s contribution to total employees decreased from 14.1 percent in 2011 to 9.1
percent in 2012. In the private sector, its contribution decreased from 10.6 percent in 2011 to 6.0
percent in 2012 while in the public sector, its contribution decreased from 3.5 percent in 2011 to
3.1 percent in 2012.
The region with the smallest share of total employees was Rukwa with a share of 0.8 percent in
2011 and 1.1 percent in 2012. The regions of Pwani, Lindi, Singida, Tabora, and Manyara had
almost equal shares of total employees ranging from 1.0 to 2.0 percent.
2.9 Percentage of Employees by Region, Terms of Employment and Sex
This section presents the distribution of total employees by region, terms of employment and sex.
It examines distribution of regular and casual employees by region and sex.
25
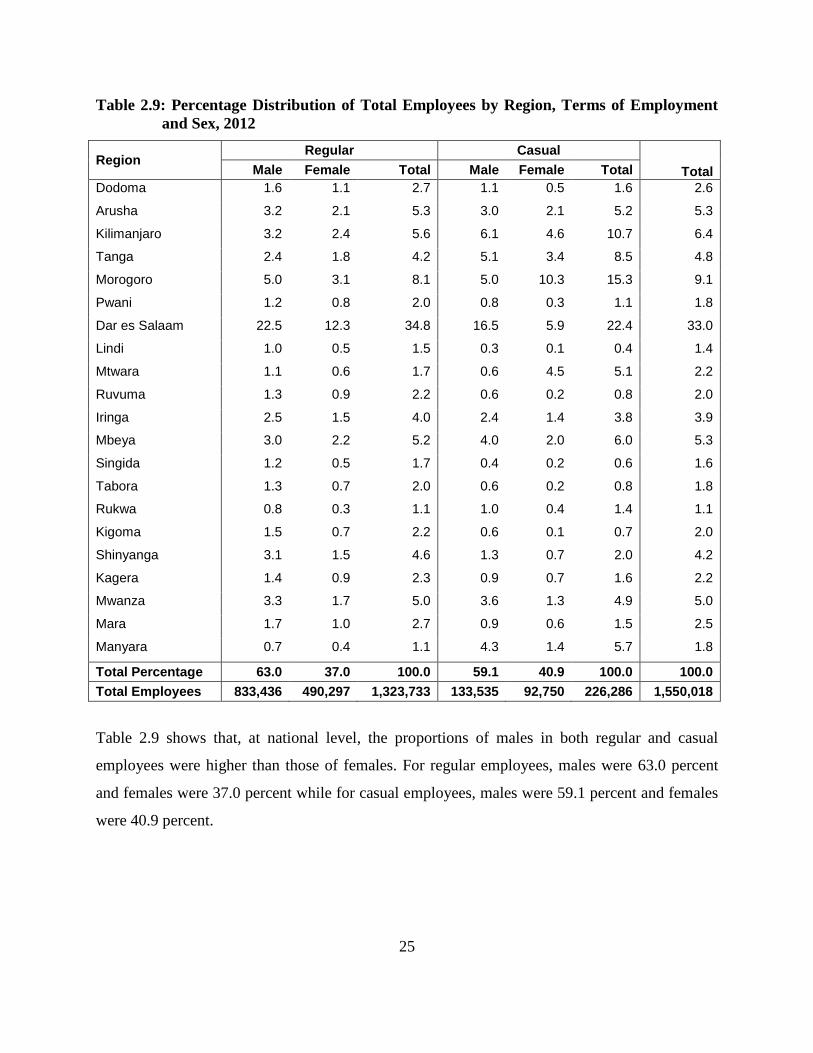
Table 2.9: Percentage Distribution of Total Employees by Region, Terms of Employment
and Sex, 2012
Region Regular Casual
Total Male Female Total Male Female Total
Dodoma 1.6 1.1 2.7 1.1 0.5 1.6 2.6
Arusha 3.2 2.1 5.3 3.0 2.1 5.2 5.3
Kilimanjaro 3.2 2.4 5.6 6.1 4.6 10.7 6.4
Tanga 2.4 1.8 4.2 5.1 3.4 8.5 4.8
Morogoro 5.0 3.1 8.1 5.0 10.3 15.3 9.1
Pwani 1.2 0.8 2.0 0.8 0.3 1.1 1.8
Dar es Salaam 22.5 12.3 34.8 16.5 5.9 22.4 33.0
Lindi 1.0 0.5 1.5 0.3 0.1 0.4 1.4
Mtwara 1.1 0.6 1.7 0.6 4.5 5.1 2.2
Ruvuma 1.3 0.9 2.2 0.6 0.2 0.8 2.0
Iringa 2.5 1.5 4.0 2.4 1.4 3.8 3.9
Mbeya 3.0 2.2 5.2 4.0 2.0 6.0 5.3
Singida 1.2 0.5 1.7 0.4 0.2 0.6 1.6
Tabora 1.3 0.7 2.0 0.6 0.2 0.8 1.8
Rukwa 0.8 0.3 1.1 1.0 0.4 1.4 1.1
Kigoma 1.5 0.7 2.2 0.6 0.1 0.7 2.0
Shinyanga 3.1 1.5 4.6 1.3 0.7 2.0 4.2
Kagera 1.4 0.9 2.3 0.9 0.7 1.6 2.2
Mwanza 3.3 1.7 5.0 3.6 1.3 4.9 5.0
Mara 1.7 1.0 2.7 0.9 0.6 1.5 2.5
Manyara 0.7 0.4 1.1 4.3 1.4 5.7 1.8
Total Percentage 63.0 37.0 100.0 59.1 40.9 100.0 100.0
Total Employees 833,436 490,297 1,323,733 133,535 92,750 226,286 1,550,018
Table 2.9 shows that, at national level, the proportions of males in both regular and casual
employees were higher than those of females. For regular employees, males were 63.0 percent
and females were 37.0 percent while for casual employees, males were 59.1 percent and females
were 40.9 percent.
26
Dar es Salaam Region had the largest proportion of regular employees at 34.8 percent, followed
by Morogoro Region with 8.1 percent of the total regular employees. The regions with lowest
proportion of regular employees were Manyara and Rukwa with 1.1 percent of the total regular
employees each.
In addition, the largest proportion of casual employees is observed in Dar es Salaam Region,
which accounts for 22.4 percent of the total casual employees; followed by Morogoro Region
which accounts for 15.3 percent of the total casual employees. The lowest proportion of casual
employees was observed in Lindi Region which accounts for 0.4 percent of the total casual
employees.
Apart from Dar es Salaam and Morogoro Regions that have already been explained, the third
highest proportion of male and female regular employees was in Kilimanjaro Region which
accounts for 3.2 percent and 2.4 percent of the total regular employees respectively.
2.10 Percentage of Private Sector Employees by Region and Sex
This section provides information on the distribution of the total employees in the private sector
by region and sex. The analysis in this section is crucial in the sense that private sector is an
engine of the economy of any country.

27
Table 2.10: Percentage Distribution of Private Adult and Youth Total Employees by
Region and Sex, 2012
Region Adult aged 25+ years Youth aged 15-24 years
Total Male Female Total Male Female Total
Dodoma 1.0 0.8 1.8 1.0 0.3 1.3 1.8
Arusha 4.1 2.5 6.6 1.5 1.8 3.3 6.5
Kilimanjaro 4.0 2.4 6.4 10.2 10.3 20.5 6.8
Tanga 2.9 1.8 4.7 0.9 0.5 1.4 4.6
Morogoro 5.2 4.2 9.4 3.0 2.2 5.2 9.4
Pwani 0.7 0.4 1.1 0.1 0.2 0.3 1.1
Dar es Salaam 27.8 12.6 40.4 16.0 15.7 31.7 40.2
Lindi 0.3 0.2 0.5 0.6 0.4 1.0 0.5
Mtwara 0.8 1.4 2.2 0.5 0.2 0.7 2.1
Ruvuma 1.1 0.6 1.7 3.4 2.4 5.8 1.8
Iringa 1.9 1.4 3.3 1.3 1.1 2.4 3.3
Mbeya 2.8 2.0 4.8 3.5 4.2 7.7 4.9
Singida 0.8 0.4 1.2 0.0 0.0 0.0 1.1
Tabora 0.6 0.3 0.9 0.3 0.3 0.6 0.9
Rukwa 0.5 0.2 0.7 0.3 0.1 0.4 0.7
Kigoma 1.1 0.3 1.4 1.8 0.6 2.4 1.4
Shinyanga 1.9 0.7 2.6 1.8 1.0 2.8 2.6
Kagera 1.1 0.7 1.8 1.1 0.7 1.8 1.8
Mwanza 3.5 1.5 5.0 3.2 2.0 5.2 5.0
Mara 1.1 0.7 1.8 1.5 1.5 3.0 1.8
Manyara 1.2 0.5 1.7 2.5 0.0 2.5 1.7
Total Percentage 64.4 35.6 100.0 54.5 45.5 100.0 100.0
Total Employees 622,770 343,573 966,343 16,007 13,356 29,362 995,705
Table 2.10 shows that, adult male employees in the private sector had a higher proportion (64.4
percent of the total adult employees) than adult female employees (35.6%). The same pattern
was observed with regard to youth employees where males were 54.5 percent and females were
45.5 percent of the total youth employees.

28
Adult male employees in Dar es Salaam Region had the highest proportion (27.8%) of the total
adult employees in the private sector, followed by Morogoro Region which had 5.2 percent of
the total adult employees. A similar observation was recorded for adult female employees who
had 12.6 percent and 4.2 percent in Dar es Salaam and Morogoro Region respectively.
On the other hand, Dar es Salaam Region had the largest proportion of youth employees with
16.0 percent for males and 15.7 percent for females of the total youth employees. The region
with second highest proportion of youth employees was Kilimanjaro with 10.2 percent for males
and 10.3 percent for females.
The regions with the lowest contribution to adult employees for both males and females were
Pwani, Lindi, Singida, Tabora and Rukwa, each with about 1.0 percent. On the other hand, the
regions with the lowest contribution to youth employees for both males and females were
Singida, Pwani, Rukwa, Tabora, Mtwara and Lindi, each with between 0.0 and 1.0 percent.
2.11 Percentage of Public Sector Employees by Region and Sex
This section gives information on the distribution of the total employees in the public sector by
region and sex. The analysis involves selected regions of Dar es Salaam, Morogoro and
Shinyanga.
29
Table 2.11: Percentage Distribution of Adult and Youth Employees in Public Sector by
Region and Sex, 2012
Region Adult Youth
Total Male Female Total Male Female Total
Dodoma 2.5 1.5 4.0 2.6 2.7 5.3 4.0
Arusha 1.7 1.4 3.1 1.5 1.7 3.2 3.1
Kilimanjaro 2.7 2.9 5.6 0.4 0.5 0.9 5.6
Tanga 2.8 2.5 5.2 0.0 0.0 0.0 5.2
Morogoro 4.7 4.0 8.7 3.2 6.5 9.7 8.8
Pwani 2.0 1.3 3.3 0.1 0.0 0.1 3.2
Dar es Salaam 11.3 9.0 20.3 7.6 8.9 16.5 20.2
Lindi 1.9 0.9 2.8 2.6 2.0 4.6 2.8
Mtwara 1.4 0.8 2.2 0.1 0.1 0.2 2.2
Ruvuma 1.4 1.0 2.4 0.0 0.0 0.0 2.4
Iringa 3.2 1.8 5.0 0.9 1.0 1.9 5.0
Mbeya 3.6 2.4 6.0 2.6 5.1 7.7 6.0
Singida 1.6 0.7 2.3 0.5 1.1 1.6 2.3
Tabora 2.2 1.3 3.5 1.9 2.2 4.1 3.5
Rukwa 1.4 0.6 2.0 0.0 0.0 0.0 2.0
Kigoma 2.0 0.9 2.9 3.5 5.0 8.5 2.9
Shinyanga 4.5 2.7 7.2 2.8 4.8 7.6 7.2
Kagera 1.8 1.1 2.9 1.5 2.4 3.9 2.9
Mwanza 3.0 1.7 4.7 4.0 9.3 13.3 4.9
Mara 2.5 1.3 3.8 3.0 4.8 7.8 3.8
Manyara 1.3 0.7 2.0 0.8 2.3 3.1 2.0
Total Percentage 59.5 40.5 100.0 39.6 60.4 100.0 100.0
Total Employees 324,774 220,929 545,703 3,421 5,190 8,610 554,313
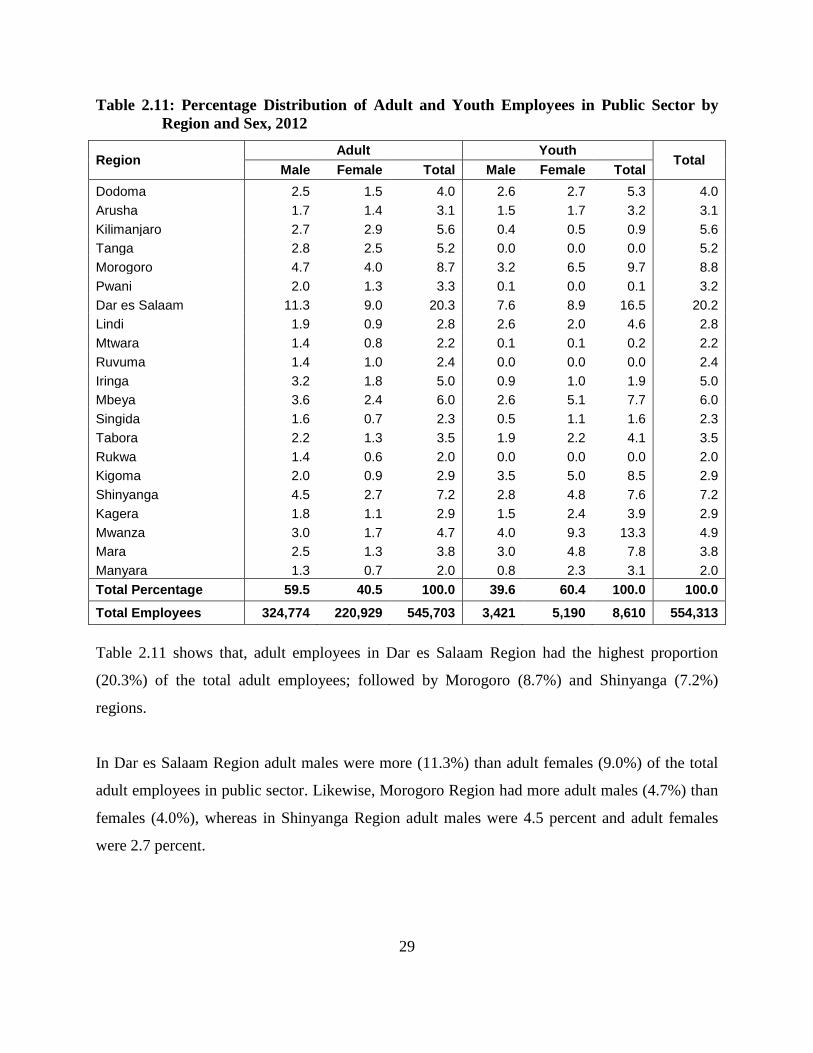
Table 2.11 shows that, adult employees in Dar es Salaam Region had the highest proportion
(20.3%) of the total adult employees; followed by Morogoro (8.7%) and Shinyanga (7.2%)
regions.
In Dar es Salaam Region adult males were more (11.3%) than adult females (9.0%) of the total
adult employees in public sector. Likewise, Morogoro Region had more adult males (4.7%) than
females (4.0%), whereas in Shinyanga Region adult males were 4.5 percent and adult females
were 2.7 percent.

30
With regard to youth employees, Dar es Salaam Region had the highest share (16.5%) of youth
employees in the public sector, followed by Mwanza Region (13.3%) and Kigoma Region
(8.5%).

31
CHAPTER THREE
WAGE RATES PROFILE
3.0 Introduction
The term Wage Rate refers to the basic agreed rate of payment for normal time of work and
relates to a time-unit such as hour, day, week or month before any deductions are made. The
analysis in this chapter provides information on wage rates of employees in the formal sector.
The information contained in this chapter can help to identify which groups of citizen employees
receive either higher or lower monthly wage rates across major sectors, industries, sex and
regions.
Wage rates data on the country’s workforce is crucial for the formulation and successful
implementation of national development programmes. Wage data is useful in investment
decisions and vocational guidance, economic and employment policy formulation. It can also be
used for minimum wage fixing, collective bargaining, and for assessment of the standard of
living. The wage data is useful in determining remuneration and employment trends for public
and private employees.
3.1 Percentage of Citizen Employees by Sector and Wage Rate
This section analyses the findings on how the proportion of adult citizen employees in both
private and public sector is distributed among the various monthly wage rate groups. Among
other usefulness, this information is of vital value to policy analysts when fixing wages between
major sectors of the economy.

32
Table 3.1: Percentage Distribution of Citizen Employees by Sector and Wage Rate, 2012
Monthly Wage Rate (TShs) Private Public Total
Below 65,000 3.8 0.1 3.9
65,000 - 150,000 21.8 0.9 22.7
150,001 - 300,000 15.6 12.2 27.8
300,001 - 500,000 8.4 12.5 20.8
500,001 - 1,500,000 8.1 13.8 21.9
Above 1,500,000 1.4 1.4 2.9
Total Percentage 59.1 40.9 100.0
Total Citizen Employees 775,154 536,934 1,312,088
Table 3.1 reveals that, the largest proportion of citizen employees (21.8% of the total citizen
employees) in the private sector received monthly wage rate of between TShs. 65,000 and TShs.
150,000 while in the public sector majority of citizen employees (13.8% of the total citizen
employees) received monthly wage rate of between TShs. 500,001 and 1,500,000. This implies
that majority of employees in the public sector received higher payments than those in the
private sector.
The lowest proportion of citizen employees in the private sector (1.4 percent of the total citizen
employees) received monthly wage rate of above TShs. 1,500,000 while in the public sector the
lowest proportion of citizen employees (0.1 percent of the total citizen employees) received
monthly wage rate of below TShs. 65,000.
The proportion of citizen employees wage rate gap was higher in the private sector (21.8% to
1.4% of the total citizen employees) compared to the public sector (13.8% to 0.1% of the total
citizen employees); this further suggests that employees are lowly paid in the private sector.
3.2 Percentage of Adult and Youth Citizen Employees by Sector and Wage Rate
This section analyses the distribution of employees among wage rate groups. Findings of this
analysis give an indication of the relative welfare of different groups of societies that supply
labour force to the economy. Analysis of the distribution of employees among wage rate groups
is further broken down by sector, sex, adult, youth, region and industrial major divisions.

33
Table 3.2: Percentage Distribution of Adult and Youth Citizen Employees by Sector and
Wage Rate, 2012
Monthly Wage Rate (TShs) Private Public Total
A. Adult Citizen
Below 65,000 3.6 0.2 3.8
65,000 - 150,000 21.5 0.9 22.4
150,001 - 300,000 15.6 12.0 27.6
300,001 - 500,000 8.5 12.6 21.1
500,001 - 1,500,000 8.2 14.0 22.2
Above 1,500,000 1.5 1.4 2.9
Total (A) 58.9 41.1 100.0
757,611 528,805 1,286,416
B. Youth Citizen
Below 65,000 11.9 0.4 12.3
65,000 - 150,000 37.6 1.6 39.2
150,001 - 300,000 14.0 21.9 35.9
300,001 - 500,000 3.4 6.2 9.6
500,001 - 1,500,000 1.1 1.6 2.7
Above 1,500,000 0.3 0.0 0.3
Total (B) 68.3 31.7 100.0
17,543 8,129 25,672
Table 3.2 above shows that, a large proportion of adult employees (27.6%) in both public and
private sectors received wages that were between TShs. 150,000 and 300,000, and the highest
wage rate of above TShs. 1,500,000 accounted for 2.9 percent of adult employees.
The table further indicates that, within the private sector, most of adult employees (21.5%)
received wages in the wage rate of between TShs. 65,000 and 150,000 and the smallest
proportion (1.5%) received wages of above TShs. 1,500,000.
It is also revealed that, a large proportion of adult employees in the public sector (14.0%)
received wages of between TShs. 500,000 and 1,500,000. And the highest wage rate of above
TShs. 1, 5000,000 accounted for 1.4 percent of all adult employees in the public sector.

34
The findings further reveal that, the largest proportion of youth employees (39.2%) in both
public and private sectors received wages between TShs. 65,000 and 150,000 and the smallest
proportion of youth employees 0.3 percent were on the wage rate group of above TShs.
1,500,000.
3.3 Percentage of Citizen Employees by Wage Rate and Sex
This section presents the distribution of citizen regular adult and youth employees by wage rate
groups. The findings from this section can be used to inform decisions for reviewing wage
structures among citizen employees as they are a target cohort for most of government
programmes that aim at enhancing remuneration packages to employees.
Table 3.3: Percentage Distribution of Citizen Employees by Wage Rate and Sex, 2012
Wage Rate (TShs) Regular Adult Regular Youth
Male Female Total Male Female Total
Below 65,000 1.9 1.8 3.7 5.2 7.2 12.4
65,000 - 150,000 14.8 7.6 22.4 21.2 18.0 39.2
150,001 - 300,000 18.1 9.5 27.6 17.0 18.9 35.9
300,001 - 500,000 12.6 8.5 21.1 4.5 5.0 9.5
500,001 - 1,500,000 13.6 8.7 22.3 1.2 1.5 2.7
Above 1,500,000 2.1 0.8 2.9 0.3 0.0 0.3
Total 63.1 36.9 100.0 49.4 50.6 100.0
811,235 475,181 1,286,416 12,672 13,000 25,672
Table 3.3 reveals that, the largest proportion of regular adult employees 27.6 percent received
wages between TShs. 150,001 and 300,000 and the smallest proportion of these employees
(2.9%) received wages of above TShs. 1,500,000.
It is also revealed that, the proportion of adult employees on wage rate of above TShs. 1,500,000
was higher for males with 2.1 percent as compared to females with 0.8 percent and there was a
small difference between regular adult males (1.9%) and females (1.8%) who received wages
below TShs. 65,000.
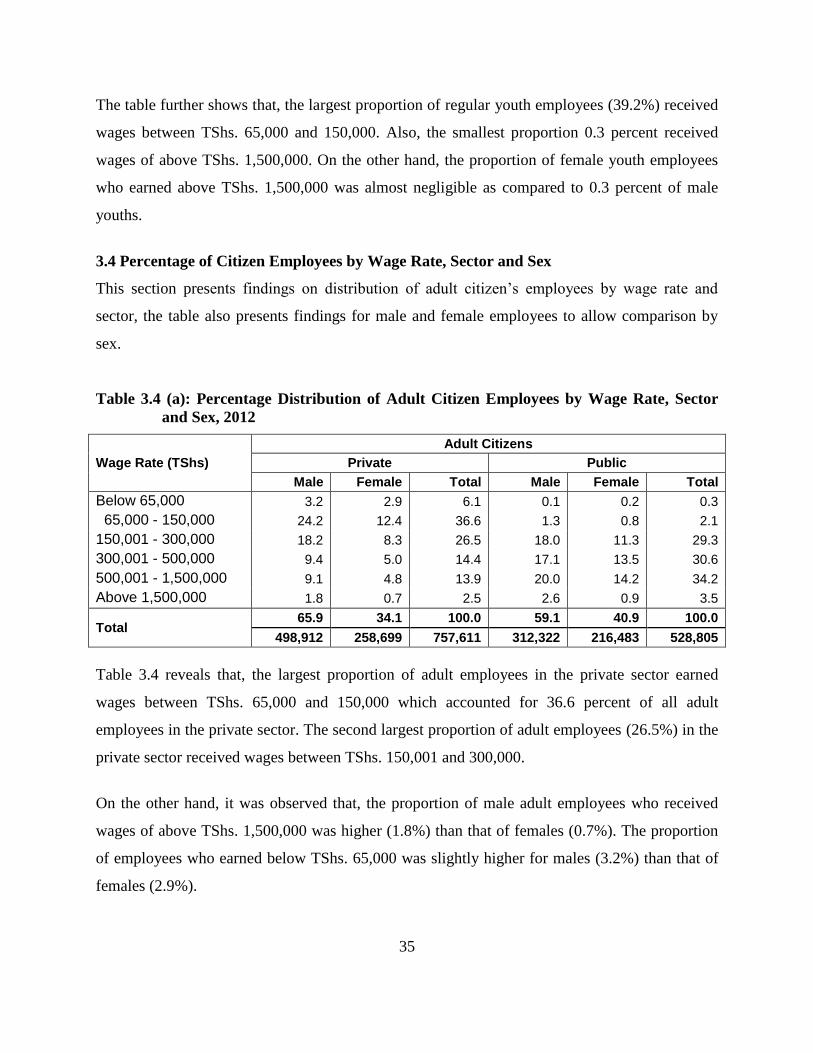
35
The table further shows that, the largest proportion of regular youth employees (39.2%) received
wages between TShs. 65,000 and 150,000. Also, the smallest proportion 0.3 percent received
wages of above TShs. 1,500,000. On the other hand, the proportion of female youth employees
who earned above TShs. 1,500,000 was almost negligible as compared to 0.3 percent of male
youths.
3.4 Percentage of Citizen Employees by Wage Rate, Sector and Sex
This section presents findings on distribution of adult citizen’s employees by wage rate and
sector, the table also presents findings for male and female employees to allow comparison by
sex.
Table 3.4 (a): Percentage Distribution of Adult Citizen Employees by Wage Rate, Sector
and Sex, 2012
Wage Rate (TShs)
Adult Citizens
Private Public
Male Female Total Male Female Total
Below 65,000 3.2 2.9 6.1 0.1 0.2 0.3
65,000 - 150,000 24.2 12.4 36.6 1.3 0.8 2.1
150,001 - 300,000 18.2 8.3 26.5 18.0 11.3 29.3
300,001 - 500,000 9.4 5.0 14.4 17.1 13.5 30.6
500,001 - 1,500,000 9.1 4.8 13.9 20.0 14.2 34.2
Above 1,500,000 1.8 0.7 2.5 2.6 0.9 3.5
Total 65.9 34.1 100.0 59.1 40.9 100.0
498,912 258,699 757,611 312,322 216,483 528,805
Table 3.4 reveals that, the largest proportion of adult employees in the private sector earned
wages between TShs. 65,000 and 150,000 which accounted for 36.6 percent of all adult
employees in the private sector. The second largest proportion of adult employees (26.5%) in the
private sector received wages between TShs. 150,001 and 300,000.
On the other hand, it was observed that, the proportion of male adult employees who received
wages of above TShs. 1,500,000 was higher (1.8%) than that of females (0.7%). The proportion
of employees who earned below TShs. 65,000 was slightly higher for males (3.2%) than that of
females (2.9%).
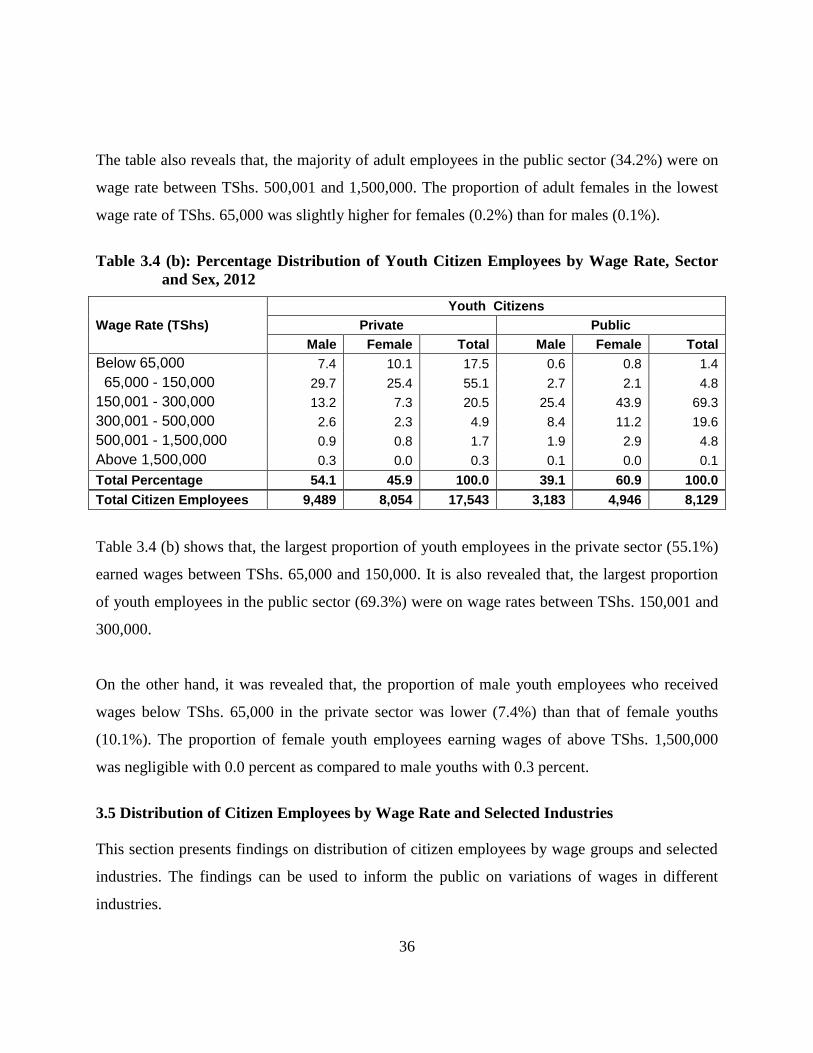
36
The table also reveals that, the majority of adult employees in the public sector (34.2%) were on
wage rate between TShs. 500,001 and 1,500,000. The proportion of adult females in the lowest
wage rate of TShs. 65,000 was slightly higher for females (0.2%) than for males (0.1%).
Table 3.4 (b): Percentage Distribution of Youth Citizen Employees by Wage Rate, Sector
and Sex, 2012
Wage Rate (TShs)
Youth Citizens
Private Public
Male Female Total Male Female Total
Below 65,000 7.4 10.1 17.5 0.6 0.8 1.4
65,000 - 150,000 29.7 25.4 55.1 2.7 2.1 4.8
150,001 - 300,000 13.2 7.3 20.5 25.4 43.9 69.3
300,001 - 500,000 2.6 2.3 4.9 8.4 11.2 19.6
500,001 - 1,500,000 0.9 0.8 1.7 1.9 2.9 4.8
Above 1,500,000 0.3 0.0 0.3 0.1 0.0 0.1
Total Percentage 54.1 45.9 100.0 39.1 60.9 100.0
Total Citizen Employees 9,489 8,054 17,543 3,183 4,946 8,129
Table 3.4 (b) shows that, the largest proportion of youth employees in the private sector (55.1%)
earned wages between TShs. 65,000 and 150,000. It is also revealed that, the largest proportion
of youth employees in the public sector (69.3%) were on wage rates between TShs. 150,001 and
300,000.
On the other hand, it was revealed that, the proportion of male youth employees who received
wages below TShs. 65,000 in the private sector was lower (7.4%) than that of female youths
(10.1%). The proportion of female youth employees earning wages of above TShs. 1,500,000
was negligible with 0.0 percent as compared to male youths with 0.3 percent.
3.5 Distribution of Citizen Employees by Wage Rate and Selected Industries
This section presents findings on distribution of citizen employees by wage groups and selected
industries. The findings can be used to inform the public on variations of wages in different
industries.

37
Figure 3.1: Distribution of Adult Employees by Wage Rate and Selected Industries, 2012
Figure 3.5 indicates findings on the distribution of adult citizen employees in selected industries
by wage rate. It was observed that, public administration and defense; compulsory social security
had the largest number of employees (186,342) who earned wages below TShs. 500,000. The
second largest number of adult citizen employees who earned wages below TShs. 500,000 was in
education industry with 151,965 employees.
On the other hand, it was observed that, public administration and defense; compulsory social
security had the highest number of employees who earned wages of above TShs. 1,500,000 with
7,840 employees and the least number of employees on wage rate of above TShs. 1,500,000 was
in agriculture, forestry and fishing industry with 406 employees.

38
CHAPTER FOUR
CASH EARNINGS PROFILE 4.0 Introduction
Cash earnings refer to the remuneration in cash paid to employees and are a major part of their
total earnings at work. Generally, cash earnings include payments for time not worked such as
annual vacation and other payments of accumulated leave made to employees, other guaranteed
and regular paid allowances, payments for overtime work and house-rent paid directly to the
employee.
4.1 Monthly Average Cash Earnings by Sector and Sex
This section presents the findings on differentials of distribution of cash earnings between the
public and the private. The information derived from this section can be used by the relevant
authorities in periodical reviews of wage structures in the private and public sectors in order to
enhance equity in the distribution of economic returns.
Figure 4.1: Monthly Average Cash Earnings by Sector and Sex, 2012
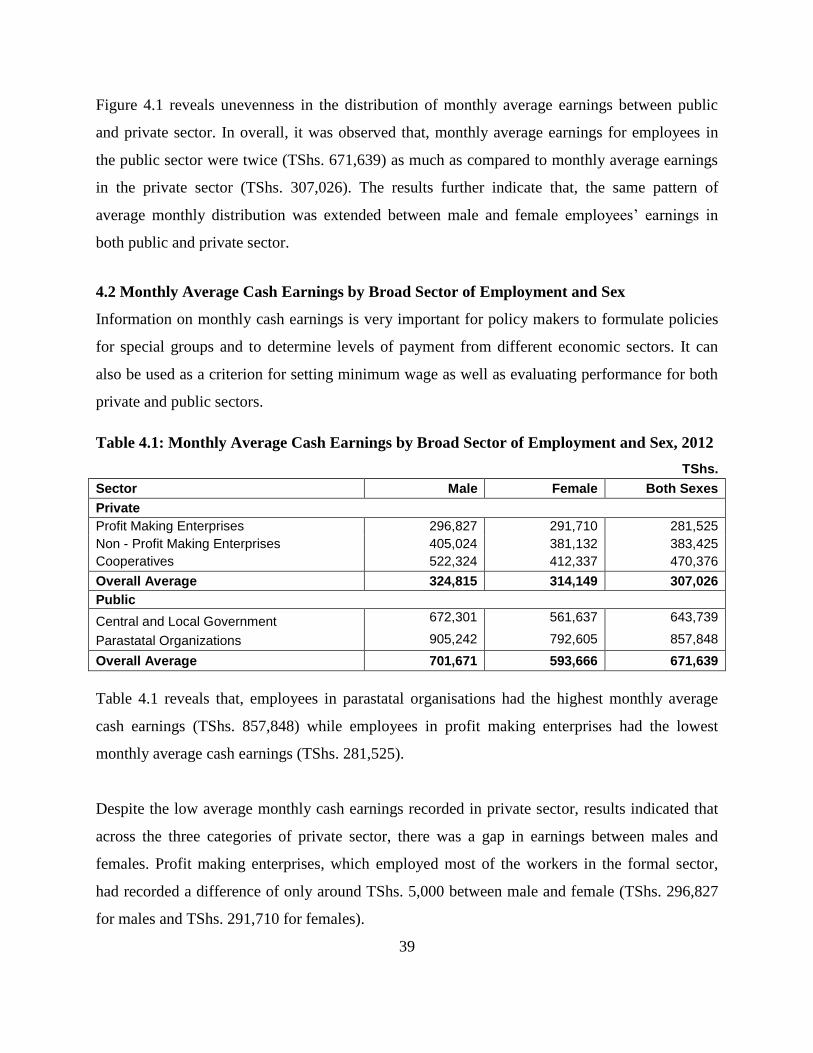
39
Figure 4.1 reveals unevenness in the distribution of monthly average earnings between public
and private sector. In overall, it was observed that, monthly average earnings for employees in
the public sector were twice (TShs. 671,639) as much as compared to monthly average earnings
in the private sector (TShs. 307,026). The results further indicate that, the same pattern of
average monthly distribution was extended between male and female employees’ earnings in
both public and private sector.
4.2 Monthly Average Cash Earnings by Broad Sector of Employment and Sex
Information on monthly cash earnings is very important for policy makers to formulate policies
for special groups and to determine levels of payment from different economic sectors. It can
also be used as a criterion for setting minimum wage as well as evaluating performance for both
private and public sectors.
Table 4.1: Monthly Average Cash Earnings by Broad Sector of Employment and Sex, 2012
TShs.
Sector Male Female Both Sexes
Private
Profit Making Enterprises 296,827 291,710 281,525
Non - Profit Making Enterprises 405,024 381,132 383,425
Cooperatives 522,324 412,337 470,376
Overall Average 324,815 314,149 307,026
Public
Central and Local Government 672,301 561,637 643,739
Parastatal Organizations 905,242 792,605 857,848
Overall Average 701,671 593,666 671,639
Table 4.1 reveals that, employees in parastatal organisations had the highest monthly average
cash earnings (TShs. 857,848) while employees in profit making enterprises had the lowest
monthly average cash earnings (TShs. 281,525).
Despite the low average monthly cash earnings recorded in private sector, results indicated that
across the three categories of private sector, there was a gap in earnings between males and
females. Profit making enterprises, which employed most of the workers in the formal sector,
had recorded a difference of only around TShs. 5,000 between male and female (TShs. 296,827
for males and TShs. 291,710 for females).

40
Central and local government was the major employer in the public sector; however, it recorded
a male-female gap of over TShs. 100,000 a month (TShs. 672,301 for males and Tshs. 561,637
for females).
4.3 Monthly Average Cash Earnings by Broad Sector and Terms of Employment
Terms of employment in this context refers to the regular and casual employment. Earnings by
terms of employment in this survey mean the earnings accrued by both regular and casual
employees. The data collected on these two categories provide basic information pertaining to
earning differences as illustrated by these groups.
Table 4.2: Monthly Average Cash Earnings by Broad Sector and Terms of Employment,
2012
TShs.
Sector
2012
Regular Employees
Casual Employees
Private Profit Making Institutions 301,693 100,926
Private Non-Profit Making Institutions 400,092 93,787
Cooperatives 480,728 98,055
Central and Local Government 662,249 128,926
Parastatal Organizations 876,259 113,876
Overall Average 375,781 101,477
Table 4.2 shows that, parastatal organizations had the highest monthly average cash earnings for
the regular employees with TShs. 876,259. Central and local government ranked the second with
monthly average cash earnings of TShs. 662,249 while private profit making institutions had the
lowest monthly average cash earnings of TShs. 301,693 for regular employees.
However, for casual employees, central and local government had the highest monthly average
cash earnings of TShs. 128,926 followed by the parastatal organizations with TShs. 113,876.
Private non-profit making institutions had the lowest monthly average cash earnings of TShs.
93,787 for casual employees.

41
4.4 Monthly Average Cash Earnings of Employees by Industry and Sex
The analysis on cash earnings data provides useful information for determining characteristics of
cash earnings for different categories of industrial groups. Availability of cash earnings data is
crucial in formulation and implementation of national development programmes.
Table 4.3: Monthly Average Cash Earnings of Employees by Industry and Sex, 2012
TShs.
Industry Male Female Both Sexes
Agriculture, forestry and fishing 319,560 287,224 306,411
Mining and quarrying 531,107 725,970 542,701
Manufacturing 239,520 230,637 229,327
Electricity, gas, steam and air conditioning supply 701,122 711,625 695,931
Water supply; sewerage, waste management and remediation activities
469,993 455,997 468,087
Construction
389,741 342,315 369,200
Wholesale and retail trade; repair of motor vehicles and
motorcycles
268,211 300,796 263,185
Transportation and storage 485,960 478,960 466,395
Accommodation and food service activities 162,191 146,154 150,994
Information and communication 878,060 766,401 811,781
Financial and insurance activities 1,203,007 1,207,298 1,148,299
Real estate activities 529,319 710,904 509,134
Professional, scientific and technical activities 785,544 700,265 724,280
Administrative and support service activities 351,256 403,545 362,041
Public administration and defence; compulsory social security 686,888 563,539 659,388
Education 523,812 479,758 508,450
Human health and social work activities 501,734 410,404 452,366
Arts, entertainment and recreation 392,034 333,970 375,760
Other service activities 323,486 322,045 306,760
Overall Average 376,804 354,810 356,666
Table 4.3 shows that, employees in financial and insurance activities had the highest monthly
average cash earnings (TShs. 1,148,299), followed by those in information and communication
(TShs. 811,781) and professional, scientific and technical employees (TShs. 724,280). High
remuneration in these industries is attributed to high profits.

42
Accommodation and food service activities had the lowest monthly average cash earnings (TShs.
150,994).
Normally, male employees have been getting higher cash earnings compared to female
employees; however, this gap has been narrowing over time. The results show that, female
employees in mining and real estate activities in the formal sector received higher earnings
compared to males (TShs. 725,970 for females and TShs. 531,107 for males; TShs. 710,904 for
females and TShs. 529,319 for males in mining and real estate respectively).
4.5 Annual Cash Earnings of Employees by Industry
Cash earnings of employees are useful in determining the level and standard of living and are the
basis for measurement of well-being of employees in different industrial groups.

43
Table 4.4: Annual Cash Earnings of Employees by Industry, 2011 and 2012
TShs. Million
Industry 2011 2012
Agriculture, forestry and fishing 184,847 250,192
Mining and quarrying 56,080 216,397
Manufacturing 683,236 932,760
Electricity, gas, steam and air conditioning supply 311,817 79,898
Water supply; sewerage, waste management and remediation activities 36,239 50,138
Construction 78,623 201,019
Wholesale and retail trade; repair of motor vehicles and motor cycles 677,003 551,755
Transportation and storage 243,730 295,045
Accommodation and food service activities 214,445 302,157
Information and communication 137,722 256,777
Financial and insurance activities 386,200 549,332
Real estate activities 6,279 14,638
Professional, scientific and technical activities 93,997 269,947
Administrative and support service activities 93,783 126,214
Public administration and defence; compulsory social security 1,839,556 1,895,277
Education 1,030,544 1,750,308
Human health and social work activities 688,123 772,008
Arts, entertainment and recreation 22,367 19,101
Other service activities 189,469 281,843
Total Cash Earnings 6,974,061 8,814,805
Table 4.4 shows that, the highest annual cash earnings were in the public administration and
defence; compulsory social security employees with TShs. 1,839,556 million in 2011 and TShs.
1,895,277 million in 2012 followed by education with TShs. 1,030,544 million in 2011 and
TShs. 1,750,308 million in 2012 while real estate activities had the lowest annual cash earnings
of TShs. 6,279 million in 2011 and TShs. 14,638 million in 2012.
Furthermore, results show that, the annual cash earnings of employees in 2012 ranged from the
lowest TShs. 14,638 million in the real estate activities to the highest TShs. 1,895,277 million in
the public administration and defence; compulsory social security.

44
4.6 Percentage of Cash Earnings of Employees by Industry and Terms of Employment
The availability and effective use of cash earnings information on the country’s workforce is
crucial for the formulation and successful implementation of national development programmes,
economic and basic earnings policy formulation. Cash earnings information is useful in
determining remuneration and earnings pattern for different industrial sectors.
Table 4.5: Percentage Distribution of Annual Cash Earnings of Employees by Industry and
Terms of Employment, 2012
Industry Regular
Employees Casual
Employees
Agriculture, forestry and fishing 2.4 16.5
Mining and quarrying 2.5 2.3
Manufacturing 9.8 36.9
Electricity, gas, steam and air conditioning supply 0.9 0.1
Water supply; sewerage, waste management and remediation
activities
0.6 1.0
Construction 2.1 6.5
Wholesale and retail trade; repair of motor vehicles and motorcycles
6.2 7.8
Transportation and storage 3.4 1.5
Accommodation and food service activities 3.4 5.1
Information and communication 3.0 0.4
Financial and insurance activities 6.4 0.4
Real estate activities 0.2 0.0
Professional, scientific and technical activities 3.1 2.1
Administrative and support service activities 1.4 1.7
Public administration and defense; compulsory social security 21.8 10.5
Education 20.4 3.3 Human health and social work activities 9.0 1.7 Arts, entertainment and recreation 0.2 0.2 Other service activities 3.2 2.0
Total Percentage 100.0 100.0
Annual Cash Earnings (TShs. million) 8,546,750 268,055

45
Table 4.5 shows that, for regular employees, public administration and defence; compulsory
social security had the highest proportion of annual cash earnings (21.8%) of the annual cash
earnings of regular employees, followed by education (20.4%), manufacturing (9.8%), human
health and social work activities (9.0%), financial and insurance activities (6.4%) and wholesale
and retail trade; repair of motor vehicles and motor motorcycles (6.2%). The remaining
industries each had less than 4.0 percent.
The results also show that, for casual employees, manufacturing industry had the highest
proportion of annual cash earnings (36.9%) of the total annual cash earnings of casual employees
followed by agriculture, forestry and fishing (16.5%), public administration and defense;
compulsory social security (10.5%), wholesale and retail trade; repair of motor vehicles and
motor cycles (7.8%) and construction (6.5%). Each of the remaining industries had less than 6.0
percent.

46
CHAPTER FIVE
ANNUAL WAGE BILL PROFILE
5.0 Introduction
Annual wage bill refers to gross cash payment accrued as earnings of employees and actual cost
of free rations paid by employers in respect of their employees. Generally, the figures represent
workers’ claims for furnishing labour for production of goods or services on behalf of the
employer.
Among the most pressing challenges to policy makers, employers and workers’ organizations is
the wage inequality. This chapter provides planners with some practical information on gross
cash earnings and free rations in the annual wage bills for 2011 and 2012.
The results can be used as evidence based indicators for policy formulation and amendments.
The analysis also focuses on the distribution of wage bill by sectors of employment, industries,
terms of employment and region.
5.1 Annual Wage Bill by Sector
This section illustrates the distribution of annual wage bill by public and private sectors of
employment. The analysis is done by considering the level of employment in a particular sector
over the same reference period to realize the real impact of changes in the annual wage bill
observed in 2011 and 2012.

47
Figure 5.1 Distribution of Annual Wage Bill by Major Sector, 2011 and 2012
Figure 5.1 shows that, the total annual wage bill increased from TShs. 5,912,916 million in 2011
to TShs. 8,887,420 million in 2012 which is an increase of 50.3 percent. This implies that
employers’ costs increased in 2012 as compared to 2011.
At the same time, the total number of employees as shown in chapter two increased from
1,362,559 in 2011 to 1,550,018 in 2012, which is an increase of 13.8 percent. Basing on those
evidence based indicators, the percentage increase of the annual wage bill from 2011 to 2012 is
almost three times as much as the increase in the level of employment over the same interval,
suggesting that, the living standard of employees improved in 2012 compared to 2011.
Furthermore, private sector had higher annual wage bill as compared to public sector in 2012.
There was an increasing pattern of the annual wage bill in both sectors with private sector
showing a higher rate of increase than the public sector from 2011 to 2012. This evidence also
implies that there was an increased cost to employers in 2012.

48
5.2 Annual Wage Bill by Cash Earnings and Free Ration
This section highlights the components of annual wage bill and their contributions to the change
in the total annual wage bill from 2011 to 2012. The annual cash earnings and free rations are the
two components of the wage bill. Cash earnings have been a major drive for changes noted in the
annual wage bill from 2011 to 2012 when compared to free rations.
Table 5.1 Annual Wage Bill by Category of Employment and Sector, 2011 and 2012
TShs. Million
Sector
2011 2012
Cash Earnings
Free Rations
Wage Bill % of Free
Ration
Cash Earnings
Free Rations
Wage Bill % of Free
Ration
Private Sector
Profit Making Institutions 1,993,393 27,425 2,020,818 1.4 3,562,859 35,491 3,598,350 1.0
Non-profit Making
Institutions 689,969 4,414 694,383 0.6 1,177,549 7,879 1,185,428 0.7
Cooperatives 38,162 284 38,446 0.7 142,472 90 142,562 0.1
Sub Total 2,721,524 32,123 2,753,647 1.2 4,882,880 43,460 4,926,339 0.9
Public Sector
Central and Local Government
2,662,362 19,535 2,681,898 0.7 3,399,945 28,955 3,428,899 0.8
Parastatal Organizations 475,718 1,654 477,372 0.3 531,981 201 532,182 0.0
Sub Total 3,138,080 21,190 3,159,269 0.7 3,931,926 29,155 3,961,081 0.7
Grand Total 5,859,604 53,312 5,912,916 0.9 8,814,805 72,615 8,887,420 0.8
Table 5.1 shows that, annual cash earnings increased from TShs. 5,859,604 million in 2011 to
TShs. 8,814,805 million in 2012, an increase of about 50.4 percent. Annual free rations increased
from TShs. 53,312 million in 2011 to TShs. 72,615 million in 2012, an increase of about 36.2
percent. As a result, a large proportion of the annual wage bill increase noted in 2012 is
attributed to an increase of the annual cash earnings.
The results further show that, employers had considerably increased cash earnings to their
employees and at the same time to some extent increased free rations to employees as shown in
Table 5.1. The proportion of free ration to the total annual wage bill decreased from 0.9 percent
in 2011 to 0.8 percent in 2012. This implies that, the employees’ free ration benefits decreased in
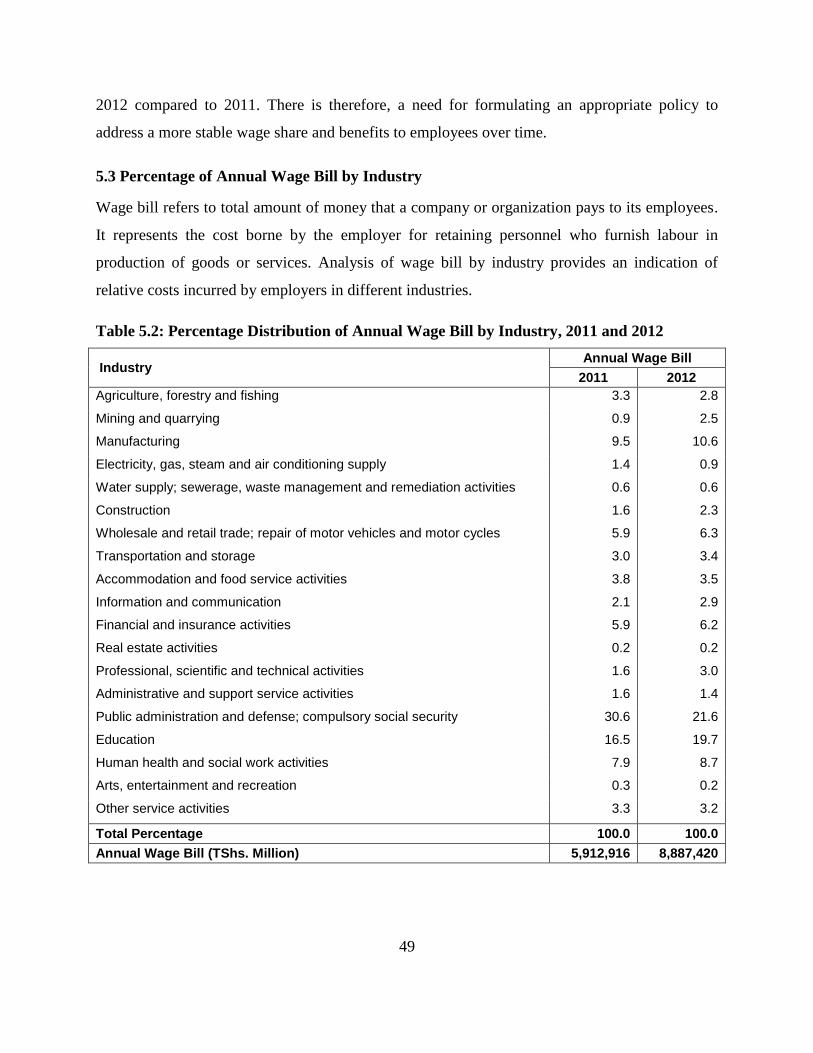
49
2012 compared to 2011. There is therefore, a need for formulating an appropriate policy to
address a more stable wage share and benefits to employees over time.
5.3 Percentage of Annual Wage Bill by Industry
Wage bill refers to total amount of money that a company or organization pays to its employees.
It represents the cost borne by the employer for retaining personnel who furnish labour in
production of goods or services. Analysis of wage bill by industry provides an indication of
relative costs incurred by employers in different industries.
Table 5.2: Percentage Distribution of Annual Wage Bill by Industry, 2011 and 2012
Industry Annual Wage Bill
2011 2012
Agriculture, forestry and fishing 3.3 2.8
Mining and quarrying 0.9 2.5
Manufacturing 9.5 10.6
Electricity, gas, steam and air conditioning supply 1.4 0.9
Water supply; sewerage, waste management and remediation activities 0.6 0.6
Construction 1.6 2.3
Wholesale and retail trade; repair of motor vehicles and motor cycles 5.9 6.3
Transportation and storage 3.0 3.4
Accommodation and food service activities 3.8 3.5
Information and communication 2.1 2.9
Financial and insurance activities 5.9 6.2
Real estate activities 0.2 0.2
Professional, scientific and technical activities 1.6 3.0
Administrative and support service activities 1.6 1.4
Public administration and defense; compulsory social security 30.6 21.6
Education 16.5 19.7
Human health and social work activities 7.9 8.7
Arts, entertainment and recreation 0.3 0.2
Other service activities 3.3 3.2
Total Percentage 100.0 100.0
Annual Wage Bill (TShs. Million) 5,912,916 8,887,420

50
Table 5.2 reveals that, public administration and defense; compulsory social security had the
largest share (21.6%) of annual wage bill in 2012, which is a decrease from 30.6 percent
recorded in 2011. The second and third industries with largest proportions of annual wage bill
were education and manufacturing with 19.7 percent and 10.6 percent respectively.
It is further revealed that, all other industries except human health and social work activities
(8.7%), wholesale and retail trade; repair of motor vehicles, motorcycles and personal and
household goods (6.3%) and financial and insurance activities (6.3%) had proportions of annual
wage bills below 4.0 percent of the annual wage bill in 2012.
5.4 Annual Wage Bill by Selected Regions and Terms of Employment
Distribution of Annual wage bill by region indicates variations of employers’ expenses in
different regions. Generally, employers’ expenses have an important bearing to the level of
economic activities, thus analysis of the distribution of wage bill by region can provide an insight
into disparities of economic activities in different regions.
Figure 5.2: Distribution of Annual Wage Bill by Selected Regions and Terms of
Employment, 2011 and 2012

51
Figure 5.2 indicates that, there was an increase in the wage bill in 2012 as compared to 2011.
Tanga Region registered the highest increase of the annual wage bill in 2012 with an increase of
70.8 percent as compared to the total wage bill registered in 2011. The second region with the
highest increase of annual wage bill is Dar es Salaam with 59.5 percent. Mwanza Region
registered an increase in total wage bill of about 53.6 percent in 2012 as compared to 2011. All
other regions combined registered an increase of annual wage bill of about 43.2 percent in 2012
as compared to 2011.

52
CHAPTER SIX
RECRUITMENT OF NEW WORKERS 6.0 Introduction
This chapter presents the findings on the number of newly recruited workers during 2012.
Employers were asked to state the number of new employees recruited into their institutions
during the last 12 months (from 1st July, 2011 to 30
th June, 2012).
The collected data were later categorized by sex; occupational title; the highest level of education
attained; main subjects of training attained; country of origin; employment status and the amount
of money (in Tanzanian Shillings) earned at the commencement of the service contract.
The main objective of this section is to evaluate the number of newly created jobs in 2012.The
results will, among other things, be useful to the National Programme for Youth Employment
which will be implemented over a three year period starting from 2013/14 to 2015/16 aiming at
creating a total of 600,000 job opportunities for the youths.
6.1 Newly Recruited Workers by Occupation and Sex
This section analyses the total number of jobs created during 2012 in comparison with 2011. It
also analyses the jobs created by occupation and sex.

53
Table 6.1: Number of Newly Recruited Workers by Occupation and Sex, 2010/11 and
2011/12
Occupation 2010/11 2011/12
Male Female Total Male Female Total
Legislators, administrators and managers 532 255 787 635 458 1,093
Professionals 4,015 1,915 5,931 7,025 5,109 12,134
Technicians and associate professionals 9,792 8,884 18,676 16,921 14,270 31,191
Clerks 1,223 5,204 6,427 666 1,731 2,397
Service workers and shop sales workers 3,148 5,079 8,227 15,434 4,160 19,594
Skilled agricultural and fishery workers 708 85 793 443 205 648
Craft and related workers 783 155 938 1,394 788 2,182
Plant and machine operators and assemblers 2,400 991 3,391 1,976 684 2,660
Elementary occupations 1,294 1,173 2,467 1,341 1,234 2,575
Total 23,896 23,741 47,637 45,835 28,639 74,474
Table 6.1 shows that, total number of the newly recruited workers in 2011/12 was 74,474 as
compared to 47,637 workers recruited in 2010/11. The number of new workers recruited
increased by about 56.3 percent.
With regard to occupations, Table 6.1 shows that in 2011/12 the largest number of new workers
recruited were technicians and associate professionals with 31,191 (41.8%) followed by service
workers and shop sales workers with 19,594 (26.3%) and professionals with 12,134 (16.3%).
This shows that, the majority of the newly recruited workers were technicians and professionals.
The results further show that, of the new workers recruited in 2011/12, about 61.5 % (45,835)
were males and 38.5% (28,639) were females. The gender gap was however largest for service
and shop sales workers. In addition, the results show that, females recruited as clerks was almost
twice the number of males (666 males and 1,731 females)
6.2 Newly Recruited Workers by Occupation and Level of Education
This section shows the distribution of the number of new workers by their level of education.
The finding shows major occupations in each level of education which recruit majority of the
employees. These results can be used to determine the minimum level of education required in
each occupation group.
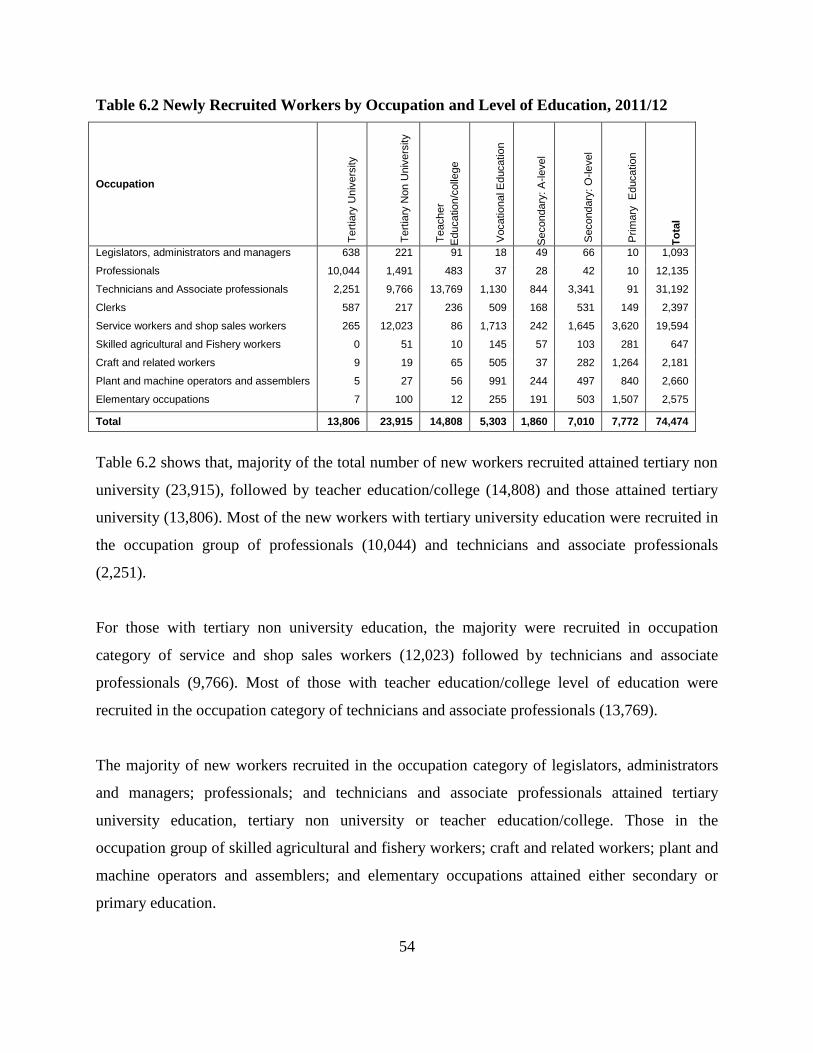
54
Table 6.2 Newly Recruited Workers by Occupation and Level of Education, 2011/12
Occupation
Te
rtia
ry U
niv
ers
ity
Te
rtia
ry N
on U
niv
ers
ity
Te
acher
Educatio
n/c
olle
ge
Vocatio
nal E
ducatio
n
Secondary
: A
-le
vel
Secondary
: O
-le
vel
Prim
ary
E
ducatio
n
To
tal
Legislators, administrators and managers 638 221 91 18 49 66 10 1,093
Professionals 10,044 1,491 483 37 28 42 10 12,135
Technicians and Associate professionals 2,251 9,766 13,769 1,130 844 3,341 91 31,192
Clerks 587 217 236 509 168 531 149 2,397
Service workers and shop sales workers 265 12,023 86 1,713 242 1,645 3,620 19,594
Skilled agricultural and Fishery workers 0 51 10 145 57 103 281 647
Craft and related workers 9 19 65 505 37 282 1,264 2,181
Plant and machine operators and assemblers 5 27 56 991 244 497 840 2,660
Elementary occupations 7 100 12 255 191 503 1,507 2,575
Total 13,806 23,915 14,808 5,303 1,860 7,010 7,772 74,474
Table 6.2 shows that, majority of the total number of new workers recruited attained tertiary non
university (23,915), followed by teacher education/college (14,808) and those attained tertiary
university (13,806). Most of the new workers with tertiary university education were recruited in
the occupation group of professionals (10,044) and technicians and associate professionals
(2,251).
For those with tertiary non university education, the majority were recruited in occupation
category of service and shop sales workers (12,023) followed by technicians and associate
professionals (9,766). Most of those with teacher education/college level of education were
recruited in the occupation category of technicians and associate professionals (13,769).
The majority of new workers recruited in the occupation category of legislators, administrators
and managers; professionals; and technicians and associate professionals attained tertiary
university education, tertiary non university or teacher education/college. Those in the
occupation group of skilled agricultural and fishery workers; craft and related workers; plant and
machine operators and assemblers; and elementary occupations attained either secondary or
primary education.
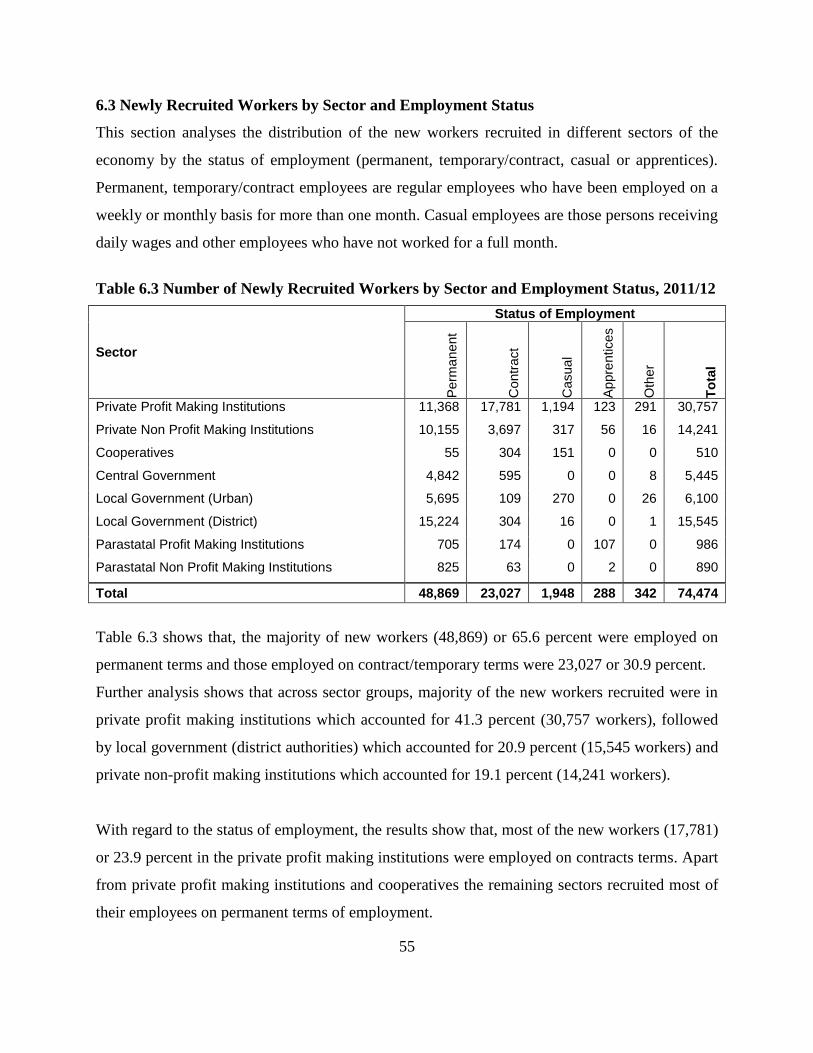
55
6.3 Newly Recruited Workers by Sector and Employment Status
This section analyses the distribution of the new workers recruited in different sectors of the
economy by the status of employment (permanent, temporary/contract, casual or apprentices).
Permanent, temporary/contract employees are regular employees who have been employed on a
weekly or monthly basis for more than one month. Casual employees are those persons receiving
daily wages and other employees who have not worked for a full month.
Table 6.3 Number of Newly Recruited Workers by Sector and Employment Status, 2011/12
Sector
Status of Employment
Perm
ane
nt
Contr
act
Casual
Appre
ntices
Oth
er
To
tal
Private Profit Making Institutions 11,368 17,781 1,194 123 291 30,757
Private Non Profit Making Institutions 10,155 3,697 317 56 16 14,241
Cooperatives 55 304 151 0 0 510
Central Government 4,842 595 0 0 8 5,445
Local Government (Urban) 5,695 109 270 0 26 6,100
Local Government (District) 15,224 304 16 0 1 15,545
Parastatal Profit Making Institutions 705 174 0 107 0 986
Parastatal Non Profit Making Institutions 825 63 0 2 0 890
Total 48,869 23,027 1,948 288 342 74,474
Table 6.3 shows that, the majority of new workers (48,869) or 65.6 percent were employed on
permanent terms and those employed on contract/temporary terms were 23,027 or 30.9 percent.
Further analysis shows that across sector groups, majority of the new workers recruited were in
private profit making institutions which accounted for 41.3 percent (30,757 workers), followed
by local government (district authorities) which accounted for 20.9 percent (15,545 workers) and
private non-profit making institutions which accounted for 19.1 percent (14,241 workers).
With regard to the status of employment, the results show that, most of the new workers (17,781)
or 23.9 percent in the private profit making institutions were employed on contracts terms. Apart
from private profit making institutions and cooperatives the remaining sectors recruited most of
their employees on permanent terms of employment.

56
6.4 Newly Recruited Workers by Occupation and Citizenship
This section analyses the distribution of the newly recruited workers by occupation and
citizenship.
Table 6.4: Number of Newly Recruited Workers by Occupation and Citizenship, 2011/12
Occupation Tanzania Kenya Uganda Other Total
Legislators, administrators and managers 1,017 21 11 44 1,093
Professionals 11,755 80 178 121 12,134
Technicians and associate professionals 30,018 1,080 27 66 31,191
Clerks 2,365 17 0 17 2,397
Service workers and shop sales workers 19,553 17 14 10 19,594
Skilled agricultural and fishery workers 647 0 0 0 647
Craft and related workers 2,115 65 0 1 2,181
Plant and machine operators and assemblers
2,653 6 0 1 2,660
Elementary occupations 2,575 0 0 0 2,575
Total 72,698 1,286 230 260 74,474
Table 6.4 shows that, the majority of newly recruited workers in 2011/12 were Tanzanian citizen
making a total of 72,698 (97.6%) followed by Kenya with 1,286 (1.7%) of the total workers
recruited.
Analysis further shows that, for Tanzanian citizens the largest number of new workers recruited
were in the group of technicians and associate professionals with 30,018 (40.3%) followed by
service workers and shop sales workers with 19,553 (26.3%) and professionals with 11,755
(15.8%). The largest numbers of recruited non citizens were in the occupation category of
legislators, administrators, managers, professionals, technicians and associate professionals.
6.5 Newly Recruited Workers by Occupation and Status of Employment
This section analyses the distribution of the new workers recruited in occupations by the status of
employment (permanent, temporary/contract, casual or apprentices).

57
Table 6.5 Number of Newly Recruited Workers by Occupation and Status of Employment,
2011/12
Occupation
Perm
ane
nt
Contr
act
Casua
l
Appre
ntices
Oth
er
To
tal
Legislators, administrators and managers 820 250 20 0 3 1,093
Professionals 10,042 1,667 312 58 55 12,134
Technicians and associate professionals 27,412 3,462 177 115 25 31,191
Clerks 1,716 641 27 3 12 2,399
Service workers and shop sales workers 3,738 15,063 614 42 137 19,594
Skilled agricultural and fishery workers 548 56 43 0 0 647
Craft and related workers 1,295 508 341 0 37 2,181
Plant and machine operators and
assemblers 1,954 684 16 0 6 2,660
Elementary occupations 1,344 696 398 70 67 2,575
Total 48,869 23,027 1,948 288 342 74,474
Table 6.5 shows that across all occupation categories, most workers were recruited on permanent
terms of employment except for the occupation category of service and shop sales workers which
shows that out of the total number of recruited workers in this category (15,063) or 76.9 percent
were employed on contract/temporary terms.
6.6 Newly Recruited Workers by Region and Sex
This section shows the distributions of the new workers recruited by regions and sex.

58
Table 6.6: Number of Newly Recruited Workers by Region and Sex, 2010/11 and 2011/12
Region 2010/11 2011/12
Male Female Total Male Female Total
Dodoma 1,011 867 1,878 1,489 1,365 2,854
Arusha 387 411 798 1,187 1,193 2,380
Kilimanjaro 1,634 1,122 2,756 2,135 1,745 3,880
Tanga 534 372 906 1,548 1,389 2,937
Morogoro 1,325 743 2,068 1,590 1,366 2,956
Pwani 75 69 144 540 599 1,139
Dar es Salaam 8,476 7,727 16,203 7,263 6,896 14,159
Lindi 38 27 65 838 786 1,624
Mtwara 148 85 233 142 114 256
Ruvuma 166 81 247 686 324 1,010
Iringa 1,131 746 1,877 1,618 1,383 3,001
Mbeya 1,333 1,319 2,652 2,972 2,400 5,372
Singida 280 339 619 133 113 246
Tabora 914 656 1,570 1,622 1,239 2,861
Rukwa 396 363 759 752 459 1,211
Kigoma 1,114 768 1,882 1,593 1,207 2,800
Shinyanga 1,438 1,483 2,921 2,292 1,696 3,988
Kagera 1,125 913 2,038 1,468 1,132 2,600
Mwanza 1,197 4,700 5,897 13,806 1,305 15,111
Mara 1,029 788 1,817 1,374 1,566 2,940
Manyara 145 162 307 787 362 1,149
Total 23,896 23,741 47,637 45,835 28,639 74,474
Table 6.6 shows that, the majority of workers recruited in 2011/12 were employed in Mwanza
Region (15,111) or 20.3 percent, followed by Dar es Salaam Region (14,159) or 19.0 percent and
Mbeya Region (5,372) or 7.2 percent. This could be attributed to the presence of more
establishments in Mwanza, Dar es Salaam and Mbeya regions.
6.7 Newly Recruited Workers by Occupation and Starting Salary
This section analyses the distribution of the number of new workers by occupation and starting
salary.

59
Table 6.7: Number of Newly Recruited Workers by Occupation and Starting Salary,
2011/12
Occupation
Starting Salary
Be
low
65,0
00/=
65,0
00
- 150,0
00
/=
150,0
01
-300,0
00
/=
300,0
01
-500,0
00
/=
500,0
01
-1,5
00,0
00/=
Above
1,5
00,0
00
/=
Tota
l
Legislators, administrators and managers 15 101 281 211 279 206 1,093
Professionals 12 78 956 5,579 4,988 521 12,134
Technicians and associate professionals 440 545 17,307 10,260 2,530 109 31,191
Clerks 2 708 647 674 365 1 2,397
Service workers and shop sales workers 1,307 17,175 708 263 98 43 19,594
Skilled agricultural and fishery workers 26 291 316 11 3 0 647
Craft and related workers 278 995 606 206 94 2 2,181
Plant and machine operators and assemblers
8 1,228 898 428 97 1 2,660
Elementary occupations 240 1,516 703 78 40 0 2,575
Total 2,328 22,637 22,422 17,710 8,494 883 74,474
Table 6.7 shows that, among the number of new workers (74,474), the majority (84.3%) received
a starting salary between TShs. 65,000 and 500,000 and only 3.1 percent received a starting
salary of less than TShs. 65,000.
The results show that, the majority (56.1%) of those who earned starting salary below TShs.
65,000 were in the occupation category of service and shop sales workers. For the income group
TShs. 65,000 – 150,000, about 75.9 percent fell under occupation category of service and shop
sales workers.
Further analysis shows that, the majority (77.2%) of those who earned TShs. 150,001 – 300,000
were in occupation category of technicians and associate professionals. Those who earned TShs.
300,001 – 500,000, the majority (57.9%) also fell under occupation category of technicians and
associate professionals.

60
Those who had a starting salary of TShs. 500,001 – 1,500,000, about 58.7 percent were
professionals followed by technicians and associate professionals (29.8%). For income group of
above TShs. 1,500,000, professionals led with 59.0 percent followed by legislators,
administrators and managers (23.3%).
6.8 Newly Recruited Workers by Level of Education and Starting Salary
This section analyses the distribution of the new workers recruited by level of education and
starting salary.
Table 6.8: Number of Newly Recruited Workers by Level of Education and Starting
Salary, 2011/12
Level of Education
Starting Salary
Be
low
65,0
00/=
65,0
00 -
150,0
00
/=
150,0
01
-300,0
00
/=
300,0
01
-500,0
00
/=
500,0
01
-1,5
00,0
00/=
Above
1,5
00,0
00
/=
To
tal
Tertiary University 201 146 2,067 5,407 5,291 694 13,806
Tertiary Non University 227 12,258 3,972 5,640 1,739 78 23,914
Teacher Education/College 209 307 8,859 4,564 829 40 14,808
Vocational Education 12 2,283 1,860 859 286 3 5,303
Secondary: O-level 195 1,872 4,166 559 197 22 7,011
Secondary: A-level 7 693 408 669 79 4 1,860
Primary Education 1,477 5,078 1,090 12 73 42 7,772
Total 2,328 22,637 22,422 17,710 8,494 883 74,474
Table 6.8 shows that among the number of new workers (74,474); the majority (32.1 %) attained
tertiary non university education, followed by teacher education/college (19.9%) and tertiary
university (18.5%).

61
The findings also show that, the majority (63.4%) of those with starting salary less than TShs.
65,000 attained primary education. For the income group of TShs. 65,000 – 150,000, the
majority (54.2%) of new workers attained tertiary non university followed by primary education
(22.4%). For the income group of TShs. 150,001–300,000, those workers who attained the level
of teacher education/college and secondary: O-level led with 39.5 percent and 18.6 percent
respectively.
Furthermore, for those workers with starting salary of TShs. 300,001 – 500,000, the majority
attained tertiary non university (31.8%), followed by tertiary university (30.5%). In all income
groups, workers with tertiary university education had the highest starting salary which
accounted for 62.3 percent in the income group of TShs. 500,001 – 1,500,000 and 78.6 percent
among those who earned a starting salary of above TShs. 1,500,000.

62
CHAPTER SEVEN
JOB VACANCIES
7.0 Introduction
Analysis of job vacancy statistics provides information on unmet labour demand. Information on
job vacancies is used for business cycle analysis and assessing the nature and structure of
mismatches in labour markets. In order to allow for a more structural and detailed analysis, the
information collected on the current job vacancies is further broken down by industry,
occupation, required qualification and reasons for vacancies.
7.1 Job Vacancies by Occupation and Working Experience
The current labour market is becoming competitive hence securing a job may require additional
attributes, sometimes experience being one of them. This section therefore, analyses distribution
of the existing vacancies by occupation and the duration of work experience required by most
employers in the Tanzania labour market.
Table 7.1 Distribution of Job Vacancies by Occupation and Working Experience, 2012
Occupation
Work Experience
Not
Requ
ired
1-2
years
3-4
years
5 o
r m
ore
years
Tota
l
Legislators, administrators and managers 1,760 409 292 161 2,622
Professionals 16,275 4,739 1,696 453 23,163
Technicians and associate professionals 63,016 11,161 1,962 113 76,252
Clerks 5,052 1,470 274 32 6,828
Service workers and shop sales workers 4,333 2,540 2,492 30 9,395
Skilled agricultural and fishery workers 1,387 30 18 18 1,453
Craft and related workers 538 507 77 14 1,136
Plant and machine operators and assemblers 720 512 489 68 1,789
Elementary occupations 2,793 460 155 27 3,435
Total Number of Vacancies 95,874 21,828 7,455 916 126,073

63
Table 7.1 shows that, there were 126,073 existing vacancies in 2012. Technician and associate
professionals had the largest number of vacancies which was 76,252 (60.5%) vacancies in the
formal sector. Professionals were second with 23,163 (18.4%) vacancies; followed by service
workers and shop sales workers with 9,395 (7.5%) vacancies. Crafts and related workers had the
lowest number of vacancies generated in 2011/12 with 1,136 (0.9%) vacancies.
The requirement for experience seems not very important as the results reveal that, a total of
95,874 (76.0%) of existing vacancies in 2012 did not require any experience. The job vacancies
that needed prior work experience of 1-2 years were 21,828 (17.3%). Vacancies that required
work experience of 5 or more years composed a minute number of total vacancies were 916
(0.7%).
The vacancies in the occupation of technicians and associate professionals that did not need any
prior work experience ranked first accounted for almost a half of the vacancies (63,016).
7.2 Job Vacancies by Occupation and Gender Preference
This section shows the distribution of the job vacancies by occupation. The information revealed
occupations with large proportions of vacancies. Information on sex preference is also given to
reveal the nature and magnitude of sex preference in employment.

64
Table 7.2: Distribution of Job Vacancies by Occupation and Gender Preference, 2012
Occupation Gender Preference
Male Female None Total
Legislators, administrators and managers 453 121 2,049 2,623
Professionals 1,931 2,029 19,203 23,163
Technicians and associate professionals 5,228 3,344 67,680 76,252
Clerks 249 1,021 5,558 6,828
Service workers and shop sales workers 1,874 1,269 6,252 9,395
Skilled agricultural and fishery workers 9 17 1,427 1,453
Craft and related workers 374 6 755 1,135
Plant and machine operators and assemblers 846 33 910 1,789
Elementary occupations 1,046 413 1,976 3,435
Total Number of Vacancies 12,010 8,253 105,810 126,073
Table 7.2 shows that, the largest number of vacancies (105,810) had no sex preference.
However, in 12,010 vacancies males were preferred and in the remaining 8,253 vacancies the
preference was for females.
7.3 Job Vacancies by Industry and Reason for Vacancy
Organisation structure and system of production tend to influence demand for workers and
vacancies in any industry. Job vacancies to remain unfilled for a long period of time adds more
work load to the existed few employees hence, reducing labour efficiency and in turn impairing
organizations’ performance.
The analysis in this section focuses on the level of job vacancies by industrial categories of the
economy over the survey period. The findings provide highlights to which industry poses the
highest proportion of job vacancies against their reasons in order to take appropriate measures.
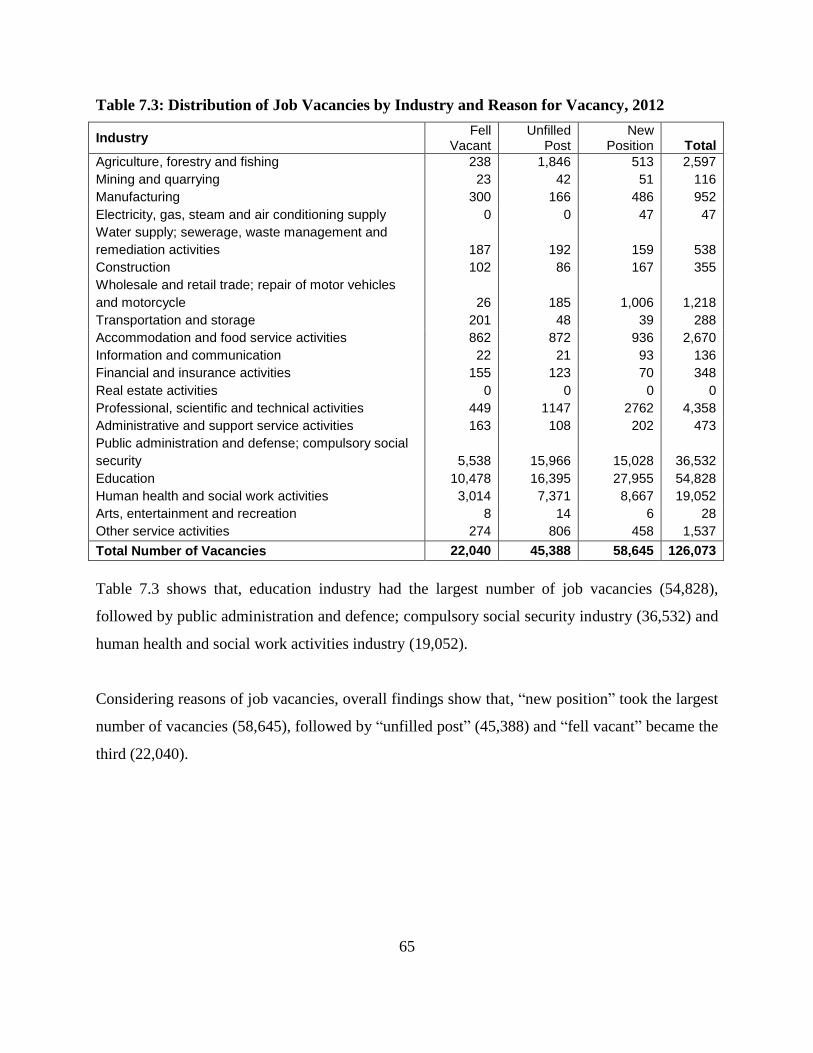
65
Table 7.3: Distribution of Job Vacancies by Industry and Reason for Vacancy, 2012
Industry Fell
Vacant Unfilled
Post New
Position Total
Agriculture, forestry and fishing 238 1,846 513 2,597
Mining and quarrying 23 42 51 116
Manufacturing 300 166 486 952
Electricity, gas, steam and air conditioning supply 0 0 47 47
Water supply; sewerage, waste management and
remediation activities 187 192 159 538
Construction 102 86 167 355
Wholesale and retail trade; repair of motor vehicles
and motorcycle 26 185 1,006 1,218
Transportation and storage 201 48 39 288
Accommodation and food service activities 862 872 936 2,670
Information and communication 22 21 93 136
Financial and insurance activities 155 123 70 348
Real estate activities 0 0 0 0
Professional, scientific and technical activities 449 1147 2762 4,358
Administrative and support service activities 163 108 202 473
Public administration and defense; compulsory social
security 5,538 15,966 15,028 36,532
Education 10,478 16,395 27,955 54,828
Human health and social work activities 3,014 7,371 8,667 19,052
Arts, entertainment and recreation 8 14 6 28
Other service activities 274 806 458 1,537
Total Number of Vacancies 22,040 45,388 58,645 126,073
Table 7.3 shows that, education industry had the largest number of job vacancies (54,828),
followed by public administration and defence; compulsory social security industry (36,532) and
human health and social work activities industry (19,052).
Considering reasons of job vacancies, overall findings show that, “new position” took the largest
number of vacancies (58,645), followed by “unfilled post” (45,388) and “fell vacant” became the
third (22,040).

66
7.4 Job Vacancies by Industry and Level of Education
Analysis in this section shows the distribution of the existing vacancies by industry and level of
education. This information helps to reveal what industrial categories have large proportions of
vacancies across levels of education. Information on level of education in relation to the job
vacancies may create a need for planners and decision makers to allocate more resources on level
of education that has many job vacancies.
Table 7.4: Number of Job Vacancies by Industry and Level of Education, 2012
Industry
Level of Education
Tert
iary
Univ
ers
ity
Tert
iary
Non
Univ
ers
ity
Teacher
Educatio
n/
colle
ge
Vocation
al
Educatio
n
Secon
dary
Educatio
n
Prim
ary
Educatio
n
To
tal
Agriculture, forestry and fishing 243 379 107 85 136 1,647 2,597
Mining and quarrying 44 42 0 8 21 0 115
Manufacturing 148 88 24 367 138 187 952
Electricity, gas, steam and air
conditioning supply 0 25 0 22 0 0 47
Water supply; sewerage, waste
management and remediation activities 254 132 19 95 35 2 537
Construction 120 132 4 49 42 10 357
Wholesale and retail trade; repair of
motor vehicles and motorcycle 130 46 58 146 369 470 1,219
Transportation and storage 63 59 16 43 107 0 288
Accommodation and food service
activities 75 180 357 354 844 860 2,670
Information and communication 101 10 13 13 0 0 137
Financial and insurance activities 233 28 11 12 64 0 348
Real estate activities 0 0 0 0 0 0 0
Professional, scientific and technical
activities 1,716 517 247 190 653 1,035 4,358
Administrative and support service activities
38 32 7 47 111 237 472
Public administration and defence; compulsory social security
7,907 12,310 9,853 1,714 4,373 374 36,531
Education 9,367 7,224 23,766 1,517 8,800 4,154 54,828
Human health and social work activities 1,878 10,864 3,318 377 2,182 434 19,053
Arts, entertainment and recreation 12 1 1 2 2 9 27
Other service activities 217 123 537 259 244 157 1,537
Total Number of Vacancies 22,546 32,192 38,338 5,300 18,121 9,576 126,073

67
Table 7.4 shows that, teacher education/college had the largest number (38,338) of vacancies;
followed by tertiary non university with 32,192 vacancies and tertiary university with 22,546. On
the other hand, those with vocational education had the smallest number of vacancies (5,300).
Comparing vacancies across industries, education industry had the largest number of vacancies
(54,828); followed by public administration and defence; compulsory social security industry
with 36,531 vacancies and human health and social work activities industry with 19,053
vacancies.

68
APPENDICES Appendix A: Employment
Table A1: Distribution of Total Employees by Sector and Sex, 2012
Sector Adult aged 25+ Youth aged 15-24
Total Male Female Total Male Female Total
A. Private Sector
Private Profit Making Institution
500,101 253,852 753,954 14,214 12,071 26,284 780,238
Private Non-profit Making Institution
104,127
82,832 186,960
1,270 1,252
2,521 189,481
Cooperatives
18,541
6,888 25,429
523 33 557 25,986
Total: A 622,770 343,573 966,343 16,007 13,356 29,362 995,705
B. Public Sector
Central and Local Government
294,255 199,075 493,330 3,352 5,094 8,446 501,777
Parastatal Organizations 30,519 21,854 52,373 68 95 164 52,537
Total: B 324,774 220,929 545,703 3,421 5,190 8,610 554,313
Total: (A+B) 947,544 564,502 1,512,046 19,427 18,545 37,972 1,550,018
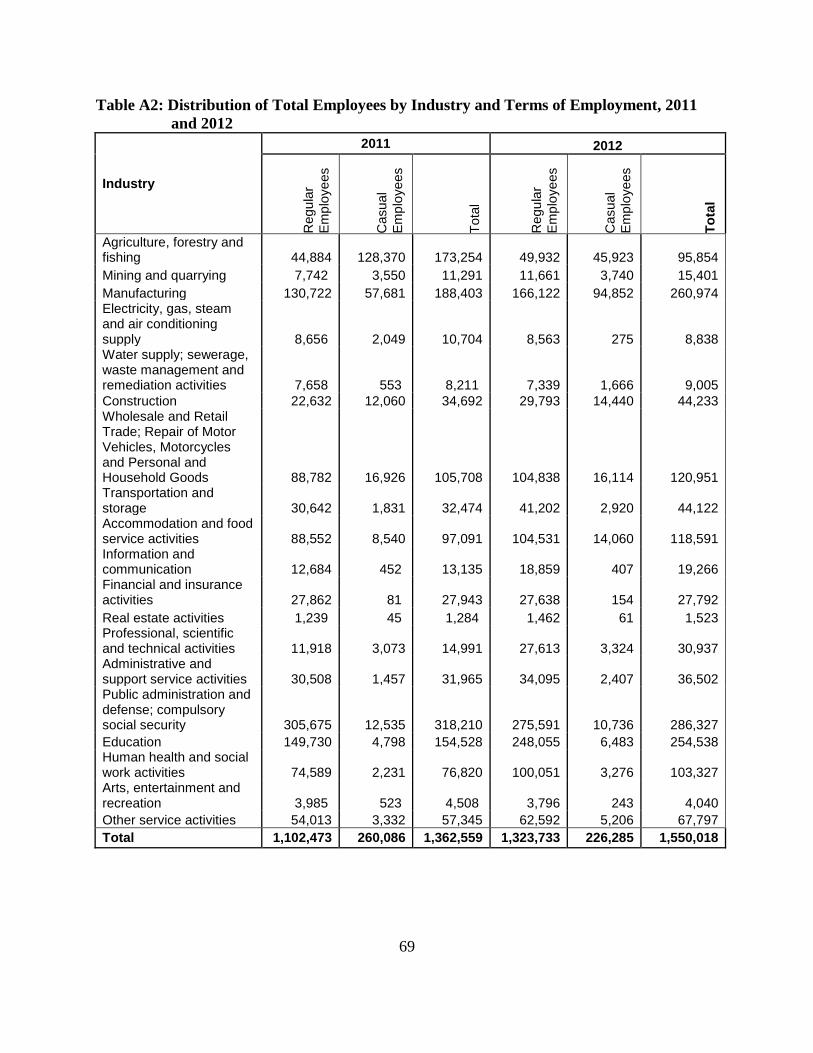
69
Table A2: Distribution of Total Employees by Industry and Terms of Employment, 2011
and 2012
Industry
2011 2012
Regu
lar
Em
plo
ye
es
Casual
Em
plo
ye
es
Tota
l
Regu
lar
Em
plo
ye
es
Casual
Em
plo
ye
es
To
tal
Agriculture, forestry and fishing 44,884 128,370 173,254 49,932 45,923 95,854
Mining and quarrying 7,742 3,550 11,291 11,661 3,740 15,401
Manufacturing 130,722 57,681 188,403 166,122 94,852 260,974 Electricity, gas, steam and air conditioning supply 8,656 2,049 10,704 8,563 275 8,838 Water supply; sewerage, waste management and remediation activities 7,658 553 8,211 7,339 1,666 9,005
Construction 22,632 12,060 34,692 29,793 14,440 44,233 Wholesale and Retail Trade; Repair of Motor Vehicles, Motorcycles and Personal and Household Goods 88,782 16,926 105,708 104,838 16,114 120,951 Transportation and storage 30,642 1,831 32,474 41,202 2,920 44,122 Accommodation and food service activities 88,552 8,540 97,091 104,531 14,060 118,591 Information and communication 12,684 452 13,135 18,859 407 19,266 Financial and insurance activities 27,862 81 27,943 27,638 154 27,792
Real estate activities 1,239 45 1,284 1,462 61 1,523 Professional, scientific and technical activities 11,918 3,073 14,991 27,613 3,324 30,937 Administrative and support service activities 30,508 1,457 31,965 34,095 2,407 36,502 Public administration and defense; compulsory social security 305,675 12,535 318,210 275,591 10,736 286,327
Education 149,730 4,798 154,528 248,055 6,483 254,538 Human health and social work activities 74,589 2,231 76,820 100,051 3,276 103,327 Arts, entertainment and recreation 3,985 523 4,508 3,796 243 4,040
Other service activities 54,013 3,332 57,345 62,592 5,206 67,797
Total 1,102,473 260,086 1,362,559 1,323,733 226,285 1,550,018

70
Table A3: Distribution of Regular Employees by Citizenship and Sector, 2011 and 2012
Sector Citizens Non Citizens Total
2011 2012 2011 2012 2011 2012
A. Private
Profit Making Institutions
473,218 577,683 7,238 9,235 480,456 586,918
Non-profit Making Institutions
131,608
174,734
1,146
2,134
132,753
176,867
Cooperatives
8,334
22,042
9
624
8,343
22,665
Total: A 613,160 774,458 8,393 11,993 621,552 786,451
B. Public
Central and Local Government
434,771 485,569 136 325 434,907 485,894
Parastatal Organization 45,923
51,299
91
88
46,013
51,388
Total: B 480,693 536,869 227 413 480,920 537,282
Total : (A+B) 1,093,853 1,311,327 8,620 12,406 1,102,473 1,323,733
Table A4: Distribution of Total Employees by Sector and Industry, 2011 and 2012
Industry Private Public Total
2011 2012 2011 2012 2011 2012
Agriculture, forestry and fishing 166,959 94,120 6,295 1,734 173,254 95,854 Mining and quarrying 11,259 15,401 33 . 11,291 15,401 Manufacturing 184,406 258,442 3,997 2,532 188,403 260,974 Electricity, gas, steam and air conditioning supply 2,934 2,057 7,770 6,781 10,704 8,838 Water supply; sewerage, waste management and remediation act 1,006 862 7,205 8,143 8,211 9,005 Construction 32,027 43,703 2,665 529 34,692 44,233 Wholesale and Retail Trade; Repair of Motor Vehicles, Motorcycles and Personal and Household Goods 104,249 120,913 1,459 39 105,708 120,951 Transportation and storage 25,371 37,390 7,102 6,732 32,474 44,122 Accommodation and food service activities 96,882 118,421 210 170 97,091 118,591 Information and communication 11,213 15,590 1,922 3,676 13,135 19,266 Financial and insurance activities 16,665 21,008 11,278 6,784 27,943 27,792 Real estate activities 1,087 1,187 197 336 1,284 1,523 Professional, scientific and technical activities 6,613 14,545 8,377 16,391 14,991 30,937 Administrative and support service activities 31,284 36,106 681 396 31,965 36,502 Public administration and defense; compulsory social security 2,635 11,073 315,575 275,254 318,210 286,327 Education 64,937 76,795 89,591 177,743 154,528 254,538 Human health and social work activities 42,515 58,731 34,305 44,596 76,820 103,327 Arts, entertainment and recreation 3,265 3,281 1,243 758 4,508 4,040 Other service activities 54,125 66,079 3,220 1,719 57,345 67,797
Total 859,435 995,705 503,124 554,313 1,362,559 1,550,018

71
Table A5: Distribution of Total Employees by Industry and Sex, 2012
Industry Adult aged 25+ Youth aged 15-24
Total Male Female Total Male Female Total
Agriculture, forestry and fishing
62,383
30,759
93,143
1,820
892
2,712 95,854
Mining and quarrying
13,611
1,790
15,401
0 0
0 15,401
Manufacturing
164,143
87,709
251,852
5,114
4,009
9,122 260,974 Electricity, gas, steam and air conditioning supply
7,157 1,671 8,827 11 0 11 8,838
Water supply; sewerage, waste management and remediation act
6,532
2,400
8,932
43
29
73 9,005
Construction
35,948
7,068
43,016
965
252
1,217 44,233 Wholesale and Retail Trade; Repair of Motor Vehicles, Motorcycles and Personal and Household Goods
84,479
29,802
114,281
4,427
2,243
6,670 120,951
Transportation and storage
34,910
8,678
43,587
409
126
535 44,122
Accommodation and food service activities
52,695
60,630
113,325
1,369
3,896
5,266 118,591
Information and communication
12,745
6,251
18,996
94
176
270 19,266
Financial and insurance activities
15,229
12,297
27,527
137
127
265 27,792
Real estate activities
1,060
436
1,496
20
6
26 1,523 Professional, scientific and technical activities
20,974 9,769 30,743 120 74 194 30,937
Administrative and support service activities
27,408 8,407 35,815 532 154 687 36,502
Public administration and defense; compulsory social security
179,558
103,862
283,420
1,132
1,774
2,907 286,327
Education
142,676
106,113
248,790
2,475
3,274
5,748 254,538
Human health and social work activities
39,937
62,095
102,032
337
958
1,295 103,327
Arts, entertainment and recreation
2,889
1,098
3,987
9
44
52 4,040
Other service activities
43,209
23,666
66,875
412
511
923 67,797
Total 947,544 564,502 1,512,046 19,427 18,545 37,972 1,550,018
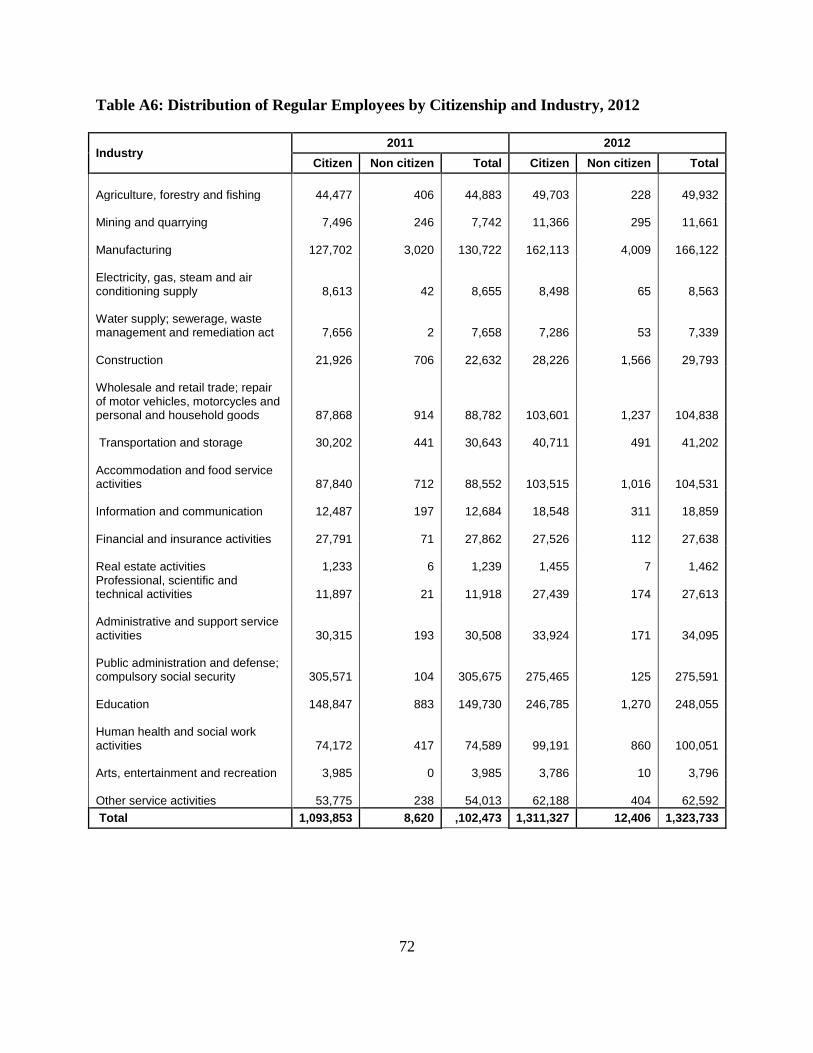
72
Table A6: Distribution of Regular Employees by Citizenship and Industry, 2012
Industry 2011 2012
Citizen Non citizen Total Citizen Non citizen Total
Agriculture, forestry and fishing
44,477 406
44,883
49,703 228
49,932
Mining and quarrying
7,496 246
7,742
11,366 295
11,661
Manufacturing
127,702 3,020
130,722
162,113 4,009
166,122 Electricity, gas, steam and air conditioning supply
8,613 42
8,655
8,498 65
8,563
Water supply; sewerage, waste management and remediation act
7,656 2
7,658
7,286 53
7,339
Construction
21,926 706
22,632
28,226 1,566
29,793 Wholesale and retail trade; repair of motor vehicles, motorcycles and personal and household goods
87,868 914
88,782
103,601 1,237
104,838
Transportation and storage
30,202 441
30,643
40,711 491
41,202 Accommodation and food service activities
87,840 712
88,552
103,515 1,016
104,531
Information and communication
12,487 197
12,684
18,548 311
18,859
Financial and insurance activities
27,791 71
27,862
27,526 112
27,638
Real estate activities
1,233 6
1,239
1,455 7
1,462 Professional, scientific and technical activities
11,897 21
11,918
27,439 174
27,613
Administrative and support service activities
30,315 193
30,508
33,924 171
34,095
Public administration and defense; compulsory social security
305,571 104
305,675
275,465 125
275,591
Education
148,847 883
149,730
246,785 1,270
248,055 Human health and social work activities
74,172 417
74,589
99,191 860
100,051
Arts, entertainment and recreation
3,985 0
3,985
3,786 10
3,796
Other service activities
53,775 238
54,013
62,188 404
62,592
Total 1,093,853 8,620 ,102,473 1,311,327 12,406 1,323,733

73
Table A7: Distribution of Total Employees by Region and Sector, 2011 and 2012
Region 2011 2012
Private Public Total Private Public Total
Dodoma 12,663 20,358 33,021 17,834 22,076 39,910
Arusha 59,262 15,170 74,432 64,666 17,336 82,002
Kilimanjaro 41,761 28,159 69,920 67,889 30,787 98,676
Tanga 30,109 24,413 54,522 46,241 28,556 74,798
Morogoro 143,984 47,489 191,473 92,903 48,513 141,416
Pwani 9,128 17,305 26,432 10,593 17,867 28,460
Dar es Salaam 347,030 109,785 456,815 399,371 112,225 511,596
Lindi 3,560 11,239 14,799 5,164 15,761 20,926
Mtwara 16,271 10,589 26,860 21,295 12,087 33,382
Ruvuma 15,559 11,570 27,128 18,375 13,101 31,476
Iringa 19,898 23,674 43,572 33,197 27,444 60,641
Mbeya 35,304 30,337 65,641 48,782 33,321 82,103
Singida 8,256 12,094 20,350 11,374 12,795 24,169
Tabora 3,896 17,701 21,597 8,489 19,667 28,156
Rukwa 5,338 5,937 11,275 6,734 10,823 17,557
Kigoma 10,329 11,760 22,088 14,379 16,737 31,117
Shinyanga 19,250 38,414 57,665 25,821 39,978 65,799
Kagera 15,318 15,849 31,167 17,729 16,164 33,892
Mwanza 42,547 23,703 66,250 49,915 27,017 76,932
Mara 9,677 20,549 30,226 18,212 21,052 39,264
Manyara 10,295 7,031 17,326 16,743 11,005 27,748
Total 859,435 503,124 1,362,559 995,705 554,313 1,550,018
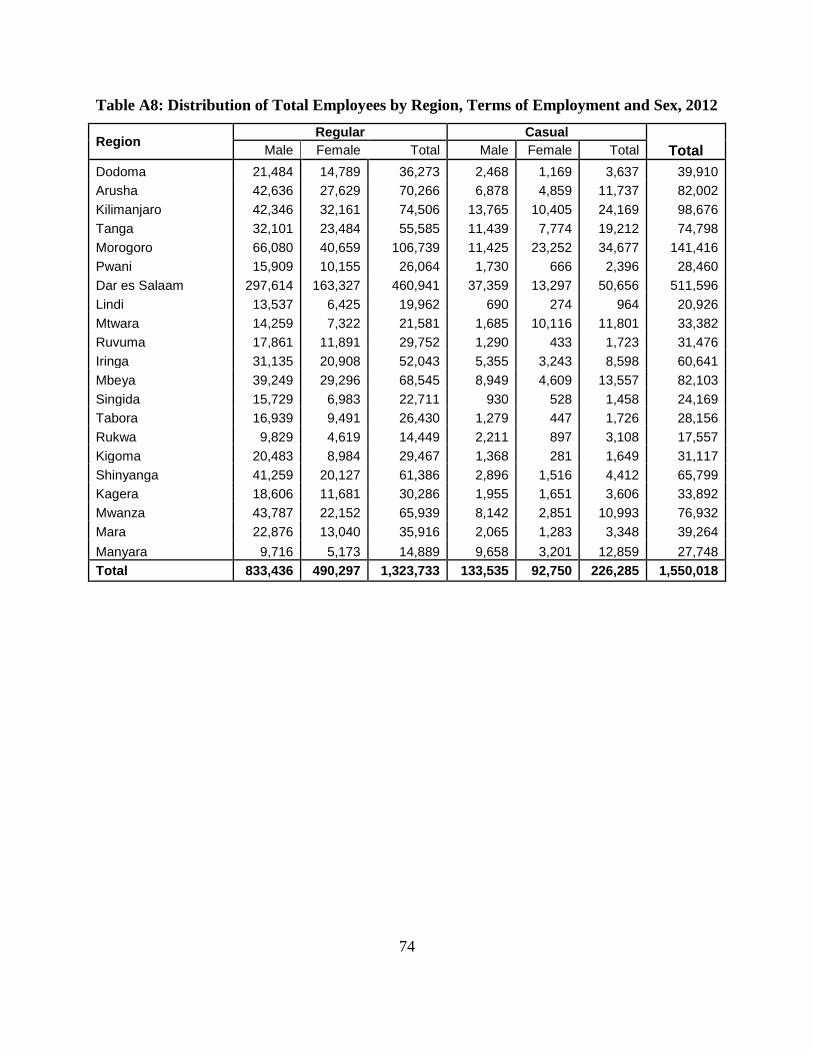
74
Table A8: Distribution of Total Employees by Region, Terms of Employment and Sex, 2012
Region Regular Casual
Total Male Female Total Male Female Total
Dodoma 21,484 14,789 36,273 2,468 1,169 3,637 39,910
Arusha 42,636 27,629 70,266 6,878 4,859 11,737 82,002
Kilimanjaro 42,346 32,161 74,506 13,765 10,405 24,169 98,676
Tanga 32,101 23,484 55,585 11,439 7,774 19,212 74,798
Morogoro 66,080 40,659 106,739 11,425 23,252 34,677 141,416
Pwani 15,909 10,155 26,064 1,730 666 2,396 28,460
Dar es Salaam 297,614 163,327 460,941 37,359 13,297 50,656 511,596
Lindi 13,537 6,425 19,962 690 274 964 20,926
Mtwara 14,259 7,322 21,581 1,685 10,116 11,801 33,382
Ruvuma 17,861 11,891 29,752 1,290 433 1,723 31,476
Iringa 31,135 20,908 52,043 5,355 3,243 8,598 60,641
Mbeya 39,249 29,296 68,545 8,949 4,609 13,557 82,103
Singida 15,729 6,983 22,711 930 528 1,458 24,169
Tabora 16,939 9,491 26,430 1,279 447 1,726 28,156
Rukwa 9,829 4,619 14,449 2,211 897 3,108 17,557
Kigoma 20,483 8,984 29,467 1,368 281 1,649 31,117
Shinyanga 41,259 20,127 61,386 2,896 1,516 4,412 65,799
Kagera 18,606 11,681 30,286 1,955 1,651 3,606 33,892
Mwanza 43,787 22,152 65,939 8,142 2,851 10,993 76,932
Mara 22,876 13,040 35,916 2,065 1,283 3,348 39,264
Manyara 9,716 5,173 14,889 9,658 3,201 12,859 27,748
Total 833,436 490,297 1,323,733 133,535 92,750 226,285 1,550,018

75
Table A9: Distribution of Private Adult and Youth Employees by Region and Sex, 2012
Region Adult aged 25+ years Youth aged 15-24 years
Total Male Female Total Male Female Total
Dodoma 9,978 7,466 17,444 301 89 389 17,834
Arusha 39,264 24,449 63,713 435 518 953 64,666
Kilimanjaro 38,253 23,619 61,872 2,984 3,034 6,017 67,889
Tanga 28,100 17,736 45,836 264 141 405 46,241
Morogoro 50,521 40,844 91,365 885 653 1,538 92,903
Pwani 6,752 3,758 10,511 26 56 82 10,593
Dar es Salaam 268,165 121,886 390,051 4,718 4,602 9,320 399,371
Lindi 3,414 1,453 4,867 166 131 297 5,164
Mtwara 7,940 13,147 21,087 135 72 207 21,295
Ruvuma 10,371 6,297 16,668 994 713 1,707 18,375
Iringa 18,657 13,822 32,479 403 315 718 33,197
Mbeya 27,393 19,140 46,533 1,015 1,234 2,249 48,782
Singida 7,778 3,590 11,368 0 6 6 11,374
Tabora 5,727 2,610 8,336 77 75 152 8,489
Rukwa 4,544 2,084 6,627 76 30 106 6,734
Kigoma 10,373 3,291 13,664 527 188 715 14,379
Shinyanga 18,669 6,338 25,007 526 288 813 25,821
Kagera 10,362 6,833 17,195 338 196 534 17,729
Mwanza 34,203 14,187 48,390 939 587 1,525 49,915
Mara 10,723 6,602 17,326 457 430 886 18,212
Manyara 11,582 4,420 16,002 741 0 741 16,743
Total 622,770 343,573 966,343 16,007 13,356 29,362 995,705

76
Table A10: Distribution of Private Adult and Youth Total Employment by Region and Sex,
2012
Region Adult Youth
Total Male Female Total Male Female Total
Dodoma 13,445 8,173 21,619 228 230 458 22,076
Arusha 9,685 7,373 17,058 130 148 278 17,336
Kilimanjaro 14,843 15,872 30,715 31 41 72 30,787
Tanga 15,173 13,381 28,554 2 0 2 28,556
Morogoro 25,824 21,856 47,679 275 559 834 48,513
Pwani 10,855 7,004 17,860 5 2 8 17,867
Dar es Salaam 61,433 49,367 110,800 656 769 1,425 112,225
Lindi 10,420 4,945 15,365 227 169 396 15,761
Mtwara 7,864 4,214 12,077 5 5 10 12,087
Ruvuma 7,787 5,314 13,101 0 0 0 13,101
Iringa 17,352 9,932 27,284 78 82 160 27,444
Mbeya 19,566 13,095 32,661 224 435 659 33,321
Singida 8,834 3,821 12,655 46 94 141 12,795
Tabora 12,248 7,063 19,312 166 189 355 19,667
Rukwa 7,421 3,399 10,820 0 4 4 10,823
Kigoma 10,653 5,355 16,008 298 431 730 16,737
Shinyanga 24,719 14,606 39,325 242 411 653 39,978
Kagera 9,728 6,098 15,826 133 205 337 16,164
Mwanza 16,443 9,426 25,868 344 804 1,149 27,017
Mara 13,503 6,875 20,378 258 416 674 21,052
Manyara 6,981 3,758 10,739 70 196 266 11,005
Total 324,774 220,929 545,703 3,421 5,190 8,610 554,313

77
Appendix B: Wage Rate
Table B1: Distribution of Citizen Employees by Sector and Wage Rate, 2012
Monthly Wage Rate (TShs) Private Public Total
Below 65,000 49,549 1,981 51,530
65,000 - 150,000 286,676 11,416 298,092
150,001 - 300,000 204,046 160,326 364,372
300,001 - 500,000 109,981 163,589 273,570
500,001 - 1,500,000 105,902 181,082 286,984
Above 1,500,000 19,001 18,540 37,541
Total 775,154 536,934 1,312,088
Table B2: Distribution of Adults and Youth Citizen Employees by Sector and Wage Rate,
2012
Monthly Wage Rate (TShs) Private Public Total
A. Adult Citizen
Below 65,000 46,483 1,868 48,351
65,000 - 150,000 277,014 11,026 288,040
150,001 - 300,000 200,447 154,700 355,147
300,001 - 500000 109,119 161,992 271,111
500,001 - 1,500,000 105,609 180,691 286,300
Above 1,500,000 18,939 18,528 37,467
Total (A) 757,611 528,805 1,286,416
B. Youth Citizen
Below 65,000 3,066 113 3,179
65,000 -150,000 9,662 390 10,052
150,001 - 300,000 3,599 5,626 9,225
300,001 - 500000 862 1,597 2,459
500,001 - 1,500,000 292 391 684
Above 1,500,000 61 12 73
Total (B) 17,543 8,129 25,672
Table B3: Distribution of Citizens Employees by Wage Rate and Sex, 2012
Wage Rate (TShs) Regular Adult Regular Youth
Male Female Total Male Female Total
Below 65,000 24,874 23,477 48,351 1,342 1,837 3,179 65,000 - 150,000 190,023 98,017 288,040 5,431 4,621 10,052 150,001 - 300,000 232,833 122,314 355,147 4,376 4,849 9,225 300,001 - 500000 161,941 109,169 271,111 1,149 1,310 2,459 500,001 - 1,500,000 174,325 111,975 286,300 309 375 684 Above 1,500,000 27,238 10,229 37,467 66 7 73
Total 811,235 475,181 1,286,416 12,672 13,000 25,672
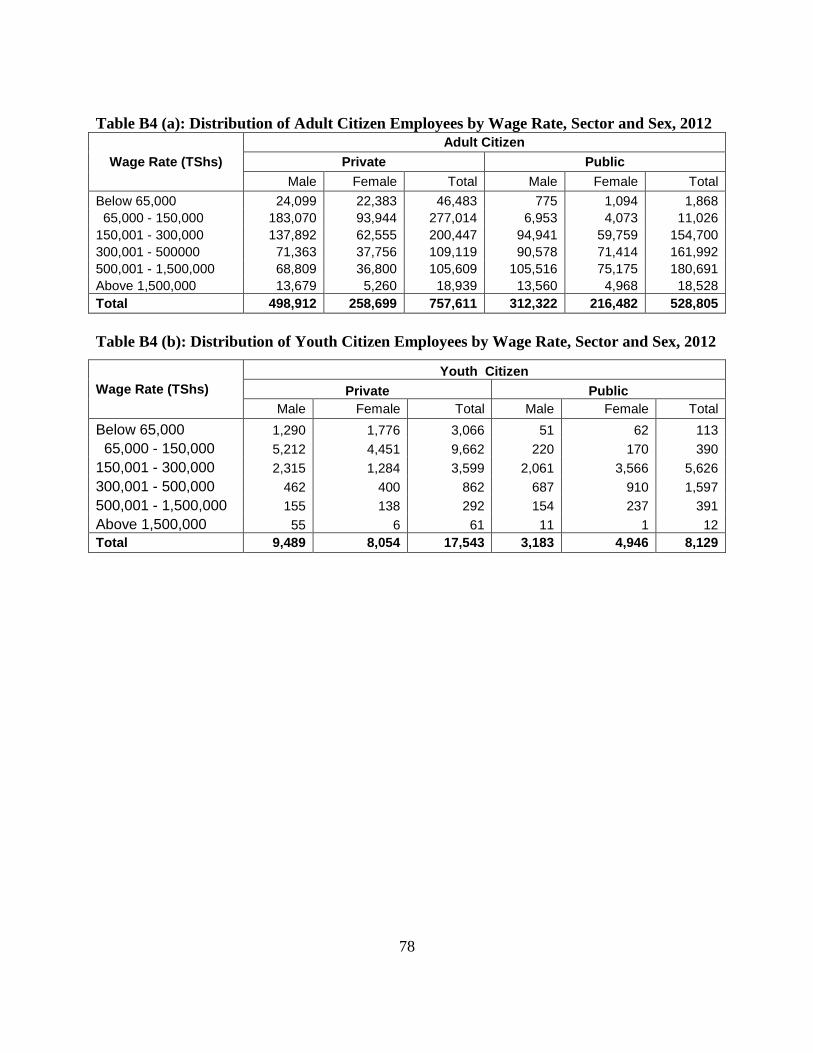
78
Table B4 (a): Distribution of Adult Citizen Employees by Wage Rate, Sector and Sex, 2012
Wage Rate (TShs)
Adult Citizen
Private Public
Male Female Total Male Female Total
Below 65,000 24,099 22,383 46,483 775 1,094 1,868
65,000 - 150,000 183,070 93,944 277,014 6,953 4,073 11,026
150,001 - 300,000 137,892 62,555 200,447 94,941 59,759 154,700
300,001 - 500000 71,363 37,756 109,119 90,578 71,414 161,992
500,001 - 1,500,000 68,809 36,800 105,609 105,516 75,175 180,691
Above 1,500,000 13,679 5,260 18,939 13,560 4,968 18,528
Total 498,912 258,699 757,611 312,322 216,482 528,805
Table B4 (b): Distribution of Youth Citizen Employees by Wage Rate, Sector and Sex, 2012
Wage Rate (TShs)
Youth Citizen
Private Public
Male Female Total Male Female Total
Below 65,000 1,290 1,776 3,066 51 62 113
65,000 - 150,000 5,212 4,451 9,662 220 170 390
150,001 - 300,000 2,315 1,284 3,599 2,061 3,566 5,626
300,001 - 500,000 462 400 862 687 910 1,597
500,001 - 1,500,000 155 138 292 154 237 391
Above 1,500,000 55 6 61 11 1 12
Total 9,489 8,054 17,543 3,183 4,946 8,129

79
Table B5: Distribution of Citizen Employees by Wage Rate and Region, 2012
Industry
Adult Youth
Under6
5,0
00
65,0
00 -
150,0
00
150,0
01-3
00,0
00
300,0
01-5
00,0
00
500,0
01-1
,500,0
00
Above 1
,500,0
00
To
tal
Under6
5,0
00
65,0
00 -
150,0
00
150,0
01-3
00,0
00
300,0
01-5
00,0
00
500,0
01-1
,500,0
00
Above 1
,500,0
00
To
tal
Dodoma 444 5,212 10,002 9,951 8,830 1,061 35,501 35 242 274 147 39 0 738
Arusha 1,738 23,874 18,371 12,615 10,721 1,474 68,793 49 349 162 119 33 3 715
Kilimanjaro 2,412 15,356 16,723 16,902 20,583 1,483 73,459 39 271 316 55 21 0 702
Tanga 1,689 12,129 14,523 13,101 12,840 931 55,213 19 125 17 0 4 0 165
Morogoro 4,085 25,154 28,382 24,912 19,862 2,025 104,420 424 530 402 268 38 0 1,661
Pwani 1,691 4,557 7,843 5,420 6,088 312 25,910 23 52 2 0 0 0 78
Dar es Salaam 13,432 118,867 126,561 70,873 91,347 22,601 443,680 1,080 4,471 3,330 580 310 71 9,842
Lindi 883 2,046 6,175 5,287 4,762 196 19,348 42 98 253 162 0 0 554
Mtwara 2,872 3,242 7,166 4,014 3,670 454 21,418 8 127 1 0 0 0 136
Ruvuma 1,050 9,619 6,988 5,191 4,983 174 28,006 780 852 87 0 0 0 1,718
Iringa 2,515 8,961 17,897 13,015 8,205 666 51,258 9 703 18 7 0 0 738
Mbeya 3,494 12,791 15,641 15,631 19,025 1,037 67,618 26 78 635 88 22 0 849
Singida 2,424 3,449 8,082 3,572 4,765 261 22,553 0 6 141 0 0 0 146
Tabora 348 2,437 8,086 7,760 6,968 300 25,899 53 47 369 2 2 0 472
Rukwa 479 1,925 4,428 3,518 3,884 126 14,360 48 28 12 0 21 0 110
Kigoma 1,332 4,314 6,099 6,922 8,714 199 27,580 78 406 652 74 0 0 1,211
Shinyanga 2,571 7,168 17,691 16,231 14,216 2,130 60,007 142 337 539 228 66 0 1,312
Kagera 1,450 4,818 6,495 7,474 8,969 301 29,506 118 69 260 242 19 0 708
Mwanza 1,903 16,743 12,380 15,080 15,387 1,321 62,814 127 880 1,016 239 15 0 2,278
Mara 1,438 4,406 10,283 9,484 8,656 278 34,544 77 380 666 112 34 0 1,270
Manyara 101 971 5,332 4,158 3,826 140 14,528 0 0 74 135 60 0 269
Total 48,351 288,040 355,147 271,111 286,300 37,467 1,286,416 3,179 10,052 9,225 2,459 684 73 25,672

80
Appendix C: Cash Earnings
Table C1: Monthly Average Earnings by Sector and Sex, 2012
TShs.
Sector Male Female Total
Private 324,815 314,149 307,026
Public 701,671 593,666 671,639
Table C2: Annual Cash Earnings of Employees by Industry Major Division, 2012
TShs. Million
Industry 2011 2012
Agriculture, forestry and fishing 184,847 250,192 Mining and quarrying 56,080 216,397 Manufacturing 683,236 932,760
Electricity, gas, steam and air conditioning supply 311,817 79,898
Water supply; sewerage, waste management and remediation act 36,239 50,138 Construction 78,623 201,019
Wholesale and retail trade; repair of motor vehicles and motorcycles 677,003 551,755 Transportation and storage 243,730 295,045 Accommodation and food service activities 214,445 302,157 Information and communication 137,722 256,777 Financial and insurance activities 386,200 549,332 Real estate activities 6,279 14,638 Professional, scientific and technical activities 93,997 269,947 Administrative and support service activities 93,783 126,214 Public administration and defence; compulsory social security 1,839,556 1,895,277 Education 1,030,544 1,750,308 Human health and social work activities 688,123 772,008 Arts, entertainment and recreation 22,367 19,101 Other service activities 189,469 281,843
Total 6,974,061 8,814,805

81
Table C3: Annual Cash Earnings of Employees by Industry and Terms of employment,
2012
TShs. Million
Industry Regular
Employees Casual
Employees
Agriculture, forestry and fishing 205,850 44,343
Mining and quarrying 210,357 6,040
Manufacturing 833,915 98,845
Electricity, gas, steam and air conditioning supply 79,565 333 Water supply; sewerage, waste management and remediation activities 47,337 2,801
Construction 183,673 17,345
Wholesale and retail trade; repair of motor vehicles and motorcycles 530,939 20,816
Transportation and storage 291,133 3,911
Accommodation and food service activities 288,476 13,681
Information and communication 255,612 1,165
Financial and insurance activities 548,297 1,035
Real estate activities 14,591 47
Professional, scientific and technical activities 264,371 5,575
Administrative and support service activities 121,615 4,599
Public administration and defence; compulsory social security 1,867,128 28,149
Education 1,741,341 8,967
Human health and social work activities 767,467 4,541
Arts, entertainment and recreation 18,549 552
Other service activities 276,535 5,308
Total 8,546,750 268,055

82
Appendix D: Annual Wage Bill
Table D1: Distribution of Annual Wage Bill by Cash earnings, Free Ration and Sector,
2012 TShs. Million
Sector
2011 2012
A
nnual C
ash E
arn
ing for
Regula
r E
mp
loyees
Annual C
ash E
arn
ings f
or
Casual E
mp
loyees
Annual fr
ee r
atio
n
Annual w
age b
ill
A
nnual C
ash E
arn
ing for
Regula
r E
mp
loyees
Annual C
ash E
arn
ings f
or
Casual E
mp
loyees
Annual fr
ee r
atio
n
Annual w
age b
ill
Private Profit Making Institutions
1,792,193 201,200 27,425 2,020,818 3,349,420 213,439 35,491 3,598,350
Private Non-Profit Making Institutions
678,011 11,958 4,414 694,383 1,163,148 14,402 7,879 1,185,428
Cooperatives 36,146 2,016 284 38,446 139,680 2,792 90 142,562
Central Government 1,103,448 7,032 16,876 1,127,356 1,209,771 8,614 27,992 1,246,377
Local Government ( Urban )
568,311 4,934 628 573,873 886,113 3,330 500 889,943
Local Government ( District )
970,763 7,874 2,031 980,668 1,268,192 23,924 462 1,292,578
Parastatal Profit Making Institutions
375,268 4,409 1,343 381,021 431,749 745 26 432,520
Parastatal Non-profit Making Institutions 92,132 3,908 311 96,351 98,677 810 174 99,662
Total 5,616,274 243,330 53,312 5,912,916 8,546,750 268,055 72,615 8,887,420

83
Table D2: Distribution of Annual Wage Bill by Industry Major Division, 2012
TShs. Million
Industry Annual Wage bill
2011 2012
Agriculture, forestry and fishing 194,445 252,110
Mining and quarrying 51,460 218,360
Manufacturing 563,831 939,781
Electricity, gas, steam and air conditioning supply 84,159 79,898
Water supply; sewerage, waste management and remediation activities 37,590 50,471
Construction 91,660 201,643
Wholesale and retail trade; repair of motor vehicles and motorcycles 346,401 556,645
Transportation and storage 180,216 300,227
Accommodation and food service activities 227,082 312,956
Information and communication 125,109 256,863
Financial and insurance activities 346,645 549,563
Real estate activities 9,664 14,638
Professional, scientific and technical activities 92,537 270,922
Administrative and support service activities 95,285 127,113
Public administration and defense; compulsory social security 1,808,678 1,923,067
Education 976,103 1,754,805
Human health and social work activities 464,228 774,310
Arts, entertainment and recreation 20,260 19,536
Other service activities 197,564 284,512
Total 5,912,916 8,887,420

84
Table D3: Distribution of Annual Wage Bill by Region and Terms of Employment, 2011
and 2012
2011
2012
Region Cash
earnings Regular
Cash earning
s casual
Free Ration
Annual Wage bill
Cash earnings Regular
Cash earning
s casual
Free Ration
Annual Wage bill
Dodoma 159,467 1,733 616 161,816 212,801 4,640 3,350 220,791
Arusha 247,879 7,541 6,146 261,566 363,719 16,167 8,924 388,810
Kilimanjaro 312,481 8,074 2,197 322,751 524,338 31,000 2,216 557,554
Tanga 186,359 13,039 288 199,686 318,584 20,183 2,324 341,091
Morogoro 379,819 33,848 1,716 415,383 603,592 32,032 2,788 638,412
Pwani 100,679 1,662 2,592 104,933 140,128 2,045 2,352 144,526
Dar es
Salaam 2,186,387 90,335 21,681 2,298,402 3,575,020 69,548 22,313 3,666,881
Lindi 74,448 816 255 75,520 110,218 930 1,165 112,313
Mtwara 78,232 9,446 323 88,001 111,732 7,432 1,917 121,081
Ruvuma 109,294 1,769 316 111,379 131,418 4,123 158 135,700
Iringa 189,794 3,098 160 193,052 276,965 24,337 126 301,428
Mbeya 323,665 6,272 2,476 332,412 401,601 12,980 2,601 417,183
Singida 86,140 1,080 4,057 91,278 112,745 1,530 4,514 118,789
Tabora 133,895 1,031 503 135,428 146,953 1,934 75 148,962
Rukwa 45,414 2,331 1,611 49,356 69,389 2,723 1,576 73,688
Kigoma 98,233 1,838 1,361 101,433 163,057 1,686 3,429 168,172
Shinyanga 297,227 6,753 724 304,703 344,406 4,390 3,367 352,163
Kagera 110,502 22,847 2,214 135,564 203,340 3,602 787 207,729
Mwanza 289,462 24,409 2,649 316,520 470,549 11,855 3,847 486,251
Mara 153,109 1,735 300 155,143 186,711 3,024 3,439 193,175
Manyara 53,788 3,674 1,130 58,591 79,485 11,892 1,345 92,721
Total 5,616,274 243,330 53,312 5,912,916 8,546,750 268,055 72,615 8,887,420

85
Appendix E: Newly Recruited Workers
Table E1: Number of Newly Recruited Workers by Occupation and Level of Subject of
Training, 2011/12
Subject of training
Le
gis
lato
rs, a
dm
inis
tra
tors
an
d m
ana
ge
rs
Pro
fessio
na
ls
Te
chn
icia
ns a
nd
asso
cia
te p
rofe
ssio
na
ls
Cle
rks
Se
rvic
e w
ork
ers
and
sh
op
sale
s w
ork
ers
Skill
ed
ag
ricu
ltu
ral
an
d fis
he
ry w
ork
ers
Cra
ft a
nd r
ela
ted
wo
rke
rs
Pla
nt
an
d m
ach
ine
ope
rato
rs
an
d a
sse
mb
lers
Ele
men
tary
occup
atio
ns
To
tal
General training programs 13 5 26 106 1,556 29 238 190 506 2,669
Education training 151 5,272 18,703 4 38 1 11 1 142 24,323
Fine and applied arts programs
0 2 2 0 58 0 0 13 0 74
Programs in languages 0 0 1 0 0 0 0 0 0 1
Other humanity courses 0 98 34 0 0 0 0 0 0 132
Social and behaviour science programs
112 388 75 0 4 0 0 0 0 580
Commercial, clerical, business and public administration pro
496 2,400 1,115 1,398 216 0 1 26 97 5,749
Programs in law 21 830 2 0 0 0 0 0 3 858
Natural science programs 0 56 4 0 0 0 0 0 0 60
Mathematics and computer science programs
20 418 139 39 2 0 0 0 5 624
Medicine and health related programs
26 1,128 7,007 1 261 0 0 1 98 8,523
Construction trades programs 0 3 56 0 0 0 217 73 0 350
Other craft, trade and industrial programs
4 3 147 0 0 0 776 575 15 1,520
Engineering and allied programs
34 623 324 0 0 6 245 49 27 1,310
Architectural & town planning programs
2 32 44 0 0 0 0 0 0 78
Agriculture, forestry & fishery programs
40 714 3,205 11 0 480 71 2 216 4,739
Home economics and domestic science programs
0 84 2 0 12,027 0 112 0 48 12,273
Transport and communication programs
0 2 14 3 0 0 2 1,197 58 1,276
Service trades programs 60 14 7 282 4,236 3 35 69 265 4,971
Programs in mass communication and documentation
21 56 2 42 0 0 0 86 0
207
Other programs 94 6 280 514 1,195 128 471 376 1,095 4,159
Total 1,093 12,134 31,191 2,397 19,594 647 2,181 2,660 2,575 74,474

86
Table E2: Newly Recruited Workers by Region and Occupation, 2011/12
Region
Occupation
Le
gis
lato
rs, a
dm
inis
tra
tors
an
d m
ana
ge
rs
Pro
fessio
na
ls
Te
chn
icia
ns a
nd
asso
cia
te
pro
fessio
nals
Cle
rks
Se
rvic
e w
ork
ers
and
sh
op
sale
s w
ork
ers
Skill
ed
ag
ricu
ltu
ral
an
d fis
he
ry w
ork
ers
Cra
ft a
nd r
ela
ted
wo
rke
rs
Pla
nt
an
d m
ach
ine
op
era
tors
an
d a
sse
mb
lers
Ele
men
tary
occup
atio
ns
To
tal
Dodoma 21 541 1,760 120 247 0 28 81 56 2,853
Arusha 85 763 623 81 363 106 72 144 145 2,381
Kilimanjaro 61 907 1,931 106 436 158 20 159 102 3,880
Tanga 13 434 1,425 73 118 19 30 535 290 2,937
Morogoro 139 325 1,531 70 45 0 596 108 141 2,956
Pwani 66 524 498 6 10 7 0 0 28 1,140
Dar es Salaam 325 2,906 2,819 1,344 3,957 102 953 908 844 14,158
Lindi 24 314 1,151 12 29 0 13 39 41 1,623
Mtwara 36 51 106 22 16 0 0 4 22 257
Ruvuma 17 74 746 7 73 0 67 6 21 1,011
Iringa 6 971 1,707 72 181 0 23 8 32 3,001
Mbeya 42 1,256 2,739 123 682 39 33 233 224 5,372
Singida 0 31 157 2 5 0 14 36 . 246
Tabora 43 266 1,958 123 140 146 83 54 48 2,861
Rukwa 0 69 718 44 113 5 181 80 1 1,212
Kigoma 10 971 1,590 12 122 7 2 15 71 2,800
Shinyanga 6 353 3,231 28 158 16 17 55 124 3,987
Kagera 14 348 1,937 17 167 19 45 23 30 2,600
Mwanza 33 598 1,649 74 12,437 20 4 58 237 15,111
Mara 58 102 2,405 27 280 4 1 1 60 2,940
Manyara 95 331 509 33 13 0 0 110 58 1,149
Total 1,093 12,134 31,191 2,397 19,594 647 2,181 2,660 2,575 74,474

87
Table E3: Number of Newly Recruited Workers by Industry and Level of Education,
2011/12
Industry
Level of Education
Te
rtia
ry U
niv
ers
ity
Te
rtia
ry N
on U
niv
ers
ity
Te
ach
er
Edu
ca
tio
n /
co
lleg
e
Vo
ca
tio
nal E
duca
tio
n
Se
co
nd
ary
Ed
uca
tio
n
Pri
ma
ry E
duca
tio
n
To
tal
Agriculture, forestry and fishing 320 168 13 165 137 711 1,515
Mining and quarrying 28 20 3 0 18 99 168
Manufacturing 734 12,544 45 661 763 1,956 16,703
Electricity, gas, steam and air
conditioning supply 78 123 9 5 0 0 215
Water supply; sewerage, waste
management and remediation act 150 22 10 98 30 21 330
Construction 142 35 64 135 47 204 626
Wholesale and retail trade; repair of
motor vehicles and motor 260 137 78 577 337 305 1,693
Transportation and storage 144 62 26 445 233 102 1,012
Accommodation and food service
activities 288 187 71 974 1,303 2,719 5,542
Information and communication 194 67 39 0 47 1 348
Financial and insurance activities 1,158 134 1 27 122 13 1,455
Real estate activities 0 0 0 0 2 0 2
Professional, scientific and technical
activities 956 196 13 41 69 106 1,381
Administrative and support service
activities 74 84 104 852 476 875 2,464
Public administration and defense;
compulsory social security 3,113 3,952 3,829 224 1,300 13 12,431
Education 3,931 2,698 8,980 690 3,102 344 19,745
Human health and social work activities 1,971 3,458 1,385 291 794 71 7,970
Arts, entertainment and recreation 6 5 0 10 0 14 36
Other service activities 259 24 140 109 89 216 836
Total 13,806 23,915 14,808 5,304 8,870 7,772 74,474

88
Appendix F: Job Vacancies
Table F1: Number of Job Vacancies by Qualification/Skill required and Gender
Preference, 2012
Qualification/ Skill Required Gender Preference
Male Female None Total
General training programs (including literacy) 194 240 764 1,198
Education training 3,143 1,730 48,541 53,414
Fine and applied arts programs 4 1 25 30
Programs in languages 0 0 9 9
Other humanity courses 42 1 122 166
Social and behavior science programs 205 214 2,633 3,052
Commercial, clerical, business and public administration
programs 911 1,449 7,329 9,690
Programs in law 21 9 848 878
Natural science programs 6 20 352 378
Mathematics and computer science programs 454 23 366 843
Medicine and health related programs 1,305 2,641 16,396 20,342
Construction trades programs 180 14 418 611
Other craft, trade and industrial programs 167 28 1,259 1,455
Engineering and allied programs 454 82 3,653 4,190
Architectural & town planning programs 70 28 533 631
Agriculture, forestry & fishery programs 1,491 285 11,461 13,237
Home economics and domestic science programs 36 52 788 877
Transport and communication programs 746 34 631 1,412
Service trades programs 1,253 567 2,748 4,569
Programs in mass communication and documentation 20 85 244 349
Other programs 1,306 747 6,690 8,743
Total 12,010 8,253 105,810 126,073
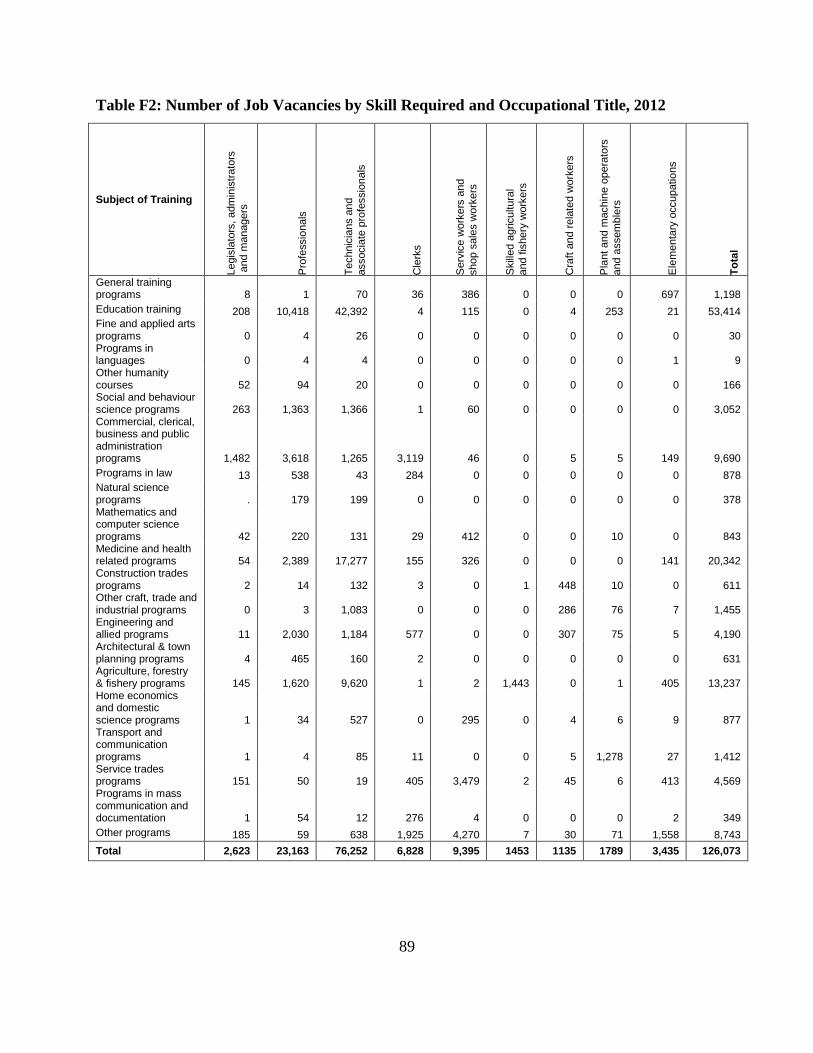
89
Table F2: Number of Job Vacancies by Skill Required and Occupational Title, 2012
Subject of Training
Legis
lato
rs, adm
inis
trato
rs
and m
anagers
Pro
fessio
nals
Te
chnic
ians a
nd
associa
te p
rofe
ssio
nals
Cle
rks
Serv
ice w
ork
ers
and
shop s
ale
s w
ork
ers
Skill
ed a
gricultura
l
and f
ishery
work
ers
Cra
ft a
nd r
ela
ted w
ork
ers
Pla
nt and m
achin
e o
pera
tors
and a
ssem
ble
rs
Ele
me
nta
ry o
ccupatio
ns
To
tal
General training programs 8 1 70 36 386 0 0 0 697 1,198
Education training 208 10,418 42,392 4 115 0 4 253 21 53,414 Fine and applied arts programs 0 4 26 0 0 0 0 0 0 30 Programs in languages 0 4 4 0 0 0 0 0 1 9 Other humanity courses 52 94 20 0 0 0 0 0 0 166 Social and behaviour science programs 263 1,363 1,366 1 60 0 0 0 0 3,052 Commercial, clerical, business and public administration programs 1,482 3,618 1,265 3,119 46 0 5 5 149 9,690
Programs in law 13 538 43 284 0 0 0 0 0 878 Natural science programs . 179 199 0 0 0 0 0 0 378 Mathematics and computer science programs 42 220 131 29 412 0 0 10 0 843 Medicine and health related programs 54 2,389 17,277 155 326 0 0 0 141 20,342 Construction trades programs 2 14 132 3 0 1 448 10 0 611 Other craft, trade and industrial programs 0 3 1,083 0 0 0 286 76 7 1,455 Engineering and allied programs 11 2,030 1,184 577 0 0 307 75 5 4,190 Architectural & town planning programs 4 465 160 2 0 0 0 0 0 631 Agriculture, forestry & fishery programs 145 1,620 9,620 1 2 1,443 0 1 405 13,237 Home economics and domestic science programs 1 34 527 0 295 0 4 6 9 877 Transport and communication programs 1 4 85 11 0 0 5 1,278 27 1,412 Service trades programs 151 50 19 405 3,479 2 45 6 413 4,569 Programs in mass communication and documentation 1 54 12 276 4 0 0 0 2 349
Other programs 185 59 638 1,925 4,270 7 30 71 1,558 8,743
Total 2,623 23,163 76,252 6,828 9,395 1453 1135 1789 3,435 126,073

90
EMPLOYMENT AND EARNING SURVEY QUESTIONNAIRE – 2012
CONFIDENTIAL
……………………………………………………………………………………………………………………………………..
National Bureau of Statistics, P.O.Box 796, Dar Es Salaam, Ofisi ya Taifa ya Takwimu Mkoa,
Telegram: STATISTICS, Telephone: 2122722/3 S.L.P…………………………………..……..
Fax: 2130852, Email: [email protected] Simu:……………................................
FIELD STAFF NAME………………………………………………………………
Tephone No./Simu:………………………………………………………………
ID No:
NAME (Estab.)
UNITED REPUBLIC OF TANZANIA
MINISTRY OF FINANCE
NATIONAL BUREAU OF STATISTICS (NBS)
EMPLOYMENT AND EARNINGS SURVEY 2012
Reg Code District Code Establishment ID

1
2 If you have not completed the form it must still be returned with the reasons clearly stated below
(a) No Employees
(b) Business Closed
(c) Business Sold (Give name and address of the new owner)……………………………………………………………………………………………
3
4 Do not include domestic servants in Private households, non- salaried working proprietors and non – salaried family workers.
5 All information relating to individual firms is confidential and will not be divulged to any other organization.
1
2 Huenda usiweze kujaza fomu hii, basi eleza wazi sababu zake kwa mfano:
(a) Hakuna mwajiriwa
(b) Mwajiri amefunga/amesitisha shughuli/kiwanda hiki.
(c) Kama kiwanda kimeuzwa (taja jina na anwani kamili ya mnunuzi mpya):…………………………………………………………..……
3
4 Watumishi wa nyumbani na wale wote wanaofanya kazi isiyo ya mshahara wasihesabiwe.
5 Habari zote zinazotolewa na mwajiri mmoja mmoja huhifadhiwa kwa siri sana na hazitolewi nje ya Ofisi ya Taifa ya Takwimu.
Habari hizi hukusanywa kwa mujibu wa sheria iitwayo “Statistics (Employees in Tanzania) Act 2002”. Inakuwa ni kuvunja sheria hiyo mwajiri asiporudisha
fomu zote zikiwa zimejazwa ipasavyo wiki mbili tangu tarehe utakapoipokea fomu hii.
Kama mishahara ya wasio raia hulipwa ng’ambo kadiria kiasi kile wanacholipwa hapa nchini. Wakurugenzi na wabia wanaopokea mshahara wa mwezi
wahesabiwe. Pia na wastani wa mapato yao mengine ya mwezi utolewe.
SURVEY OF EMPLOYMENT AND EARNINGS 2012
EXPLANATORY NOTES
UTAFITI WA AJIRA NA MAPATO WA MWAKA 2012
MAELEZO MUHIMU
These statistics are collected under the provision of the “Statistics (Employees in Tanzania) Act 2002”, which makes it legal requirement to complete
and return this form within two weeks from the day you receive it.
If non- citizen salaries are paid abroad; an estimate should be made for salaries remitted to this country. Directors and Partners receiving regular
salaries must be included in Part II. Commission works should be shown with average monthly earnings. Where an annual bonus is paid 1/12 should be
included with the cost earning.
Page 2

EMPLOYMENT AND EARNINGS SURVEY 2012 UTAFITI WA AJIRA NA MAPATO 2012
This form must be returned to the National Bureau of Statistics within two weeks from Unapaswa kurudisha fomu hii katika Ofisi ya Taifa ya Takwimu katika
the day you receive it even if you have no business or no employees. Kipindi cha wiki mbili baada ya kupokea fomu hii hata kama huna
wafanyakazi au hufanyi shughuli yoyote.
Separate form must be completed for employees working in different Administrative
Districts. Unahitaji fomu moja kwa kila ofisi, kiwanda au kazi uliyonayo. Mfano: ikiwa
All persons receiving monthly, weekly or daily wages must be shown on this form even if una viwanda viwili mbali mbali katika wilaya moja, wahitaji fomu 2. Ikiwa
they are on leave, absent or sick during or/on 30th June,2012 unaendesha kazi ile ile katika wilaya mbili unahitaji fomu mbili pia, moja kwa
kila wilaya.
Wote walipwao mshahara iwe kwa mwezi, juma au siku waingizwe katika
fomu hii hata wale waliokuwa wagonjwa au likizo tarehe 30 Juni 2012
(a) Identification:
Utambulisho: FOR OFFICIAL USE ONLY
NAME (Estab.)……………………………………………………………………………… CODE:
P.O.Box: ………………………… Town:………………………………… SECTOR:
LOCATION: NO. OF EMPLOYEES:
AREA:………………………… WARD:………..………………. PLOT No:…………………..
SIZE CLASS:
TELEPHONE No:……….…………….………… FAX No:……………………. ..
REGION
CODE:…… NAME:…………………………… DISTRICT:………………………….
(b) Description of Business:-
Aina ya kazi
ISIC (Rev 4)
(ii)Name any other /crops grown / articles made or repaired / services provided /etc (Halafu taja mazao
mengine utoayo / vitu vingine utoavyo /aina nyingine ya kazi ufanyayo)
………………………………………………………………………………………………………………………………………..
(i) Name MAIN /crop grown /article made or repaired /type of service provided /etc (Kwanza fafanua ni ZAO gani KUBWA
utoalo au UNASHUGHULIKA hasa na kazi ya aina gani.)
………………………………………………………………………………………………………………………………………..
Reg.Code Distr. Code Establishment ID
Page 2

INSTRUCTION FOR SECTION A
MAELEKEZO – SEHEMU A
Employment
Categories
CITIZEN OF
TANZANIA
Persons aged 25
years and above
Males 1 2 3
Females 4 5 6Persons aged 25 years and
above
Youth person’s 15 –
24 YRS Below 65,000 22a 31a
Males 7 8a 8b 65,001 - 150,000 23a 32a
Females 9 10a 10b 150,001 - 300,000 24a 33a
NON – CITIZENS 300,001 - 500,000 25a 34a
Persons aged 25
years and above 500,001 - 900,000 26a 35a
Males 11 12 900,001 - 1,200,000 27a 36a
Females 13 14 1,200,001 - 1,500,000 28a 37a
Youth person’s 15 –
24 YRS Above 1,500,000 29a 38a
Males 15 16
Females 17 18 TOTAL 30a 39a
Youth person’s 15 – 24 YRS
Below 65,000 22b 31b
65,001 - 150,000 23b 32b
150,001 - 300,000 24b 33b
300,001 - 500,000 25b 34b
a) Free Housing500,001 - 900,000 26b 35b
b) Paid leave900,001 - 1,200,000 27b 36b
c) Maternity Leave1,200,001 - 1,500,000 28b 37b
d) Free RationAbove 1,500,000 29b 38b
e) Any type of Social
Security SchemeTOTAL 30b 39b
Cash paid
SECTION B – WAGE RATES OF CITIZENS
MISHAHARA HALISI YA RAIA TU
UMRI MIAKA 15 NA KUENDELEA
SECTION A – EMPLOYMENT AND EARNINGS
TOTAL REGULAR
EMPLOYEES AND
CASH EARNINGS
BENEFITS:- Total Number
PART II – REGULAR EMPLOYEES – YAWAHUSU WAFANYAKAZI WA KUDUMU 2012
Number of
Males
Regular Employees: State the number of employees on
the permanent payroll, together with any temporary or
seasonal workers who have been employed on a weekly
or monthly basis for more than one month
Wafanyakazi wa kudumu: Onyesha idadi ya watu wote
walio kwenye orodha ya ajira ya kudumu, pamoja na
walioajiriwa kwa mshahara wa wiki au mwezi ambao
wamefanya kazi kwa zaidi ya mwezi mmoja.
Cash Earnings:
Gross Earnings: State the total cash earnings for the month
of June of all regular employees before deductions are made
for taxes, house rents, loan repayments etc. All cash
allowance such as overtime and other allowances should be
included.
Basic Earnings: Excluded overtime and other additional
pay in the Basic Earnings Column.
Mishahara: Onyesha jumla ya mishahara (ya mwezi juni) ya
wafanyakazi wa kudumu wote kabla hawajakatwa chochote.
Malipo mengine kama ya “masurufu ya safari” na “overtime”
yatiwe katika jumla hiyo. Usiyaingize malipo hayo katika “Basic
Earnings”.
SECTION B.
Wages Group: Wage groups refer to the agreed wage
rates, including pay addition paid regularly but excluding bonus
and overtime.
Vifungu vya mishahara:
Vifungu vya mishahara huonyesha mishahara halisi pamoja na
nyongeza za kawaida kama ilivyokubaliwa wakati wa kuingia
kazini. Malipo ya “overtime” na “allowances” hapa
hayaonyeshwi.
Gross Earnings Basic Earnings
19 20 21
State the number of Citizens (shown in Section A question number
01, 04 , 07 &08) in each of the wage groups shown below.
Onyesha idadi ya wafanyakazi walio raia wale wa sehemu A. swali
namba 01, 04 , 07 & 08 jinsi wanavyo gawanyika katika vifungu vya
mishahara hapa chini.
Number of Regular
Employees
AJIRA NA MAPATO
Cash earnings during June
(to the nearest shillings)
Number of FemalesWage Rate
(TZS per month)
Page 3

Employment Categories
Persons aged 25 years and
above
Males
40 41 42
Females
43 44 45
Youth person’s 15 – 24 YRS
Males
46 47 48
Females
49 50 51
TOTAL 52 53 54
INSTRUCTIONS – MAELEKEZO
All persons receiving daily wages and other
employees who have not worked for a full month
must be included in this section. Person - days
means the sum of total number of days worked by each
person during the month, whether he/she was actually
employed on 30th June or not. e.g. if one employee has
worked for 10 days and other two employees have
EACH worked for 20 days, the total person – days
worked = (1x10) + (2x20) = 50 person days.
Watu wote wanaolipwa kila mwisho wa siku ya kazi na
wengine wote waliofanya kazi kwa muda usiofikia mwezi
kamili waingizwe hapa. Jumla ya siku za vibarua
hupatikana kwa kujumlisha siku za vibarua wote wa
mwezi ule. MFANO:- Kibarua mmoja amepata siku kumi
mwezi June, wengine wawili siku 20 kila mmoja, basi
vibarua watatu wamefanya kazi ya siku (1x10) + (2x20) =
50
PART III – CASUAL WORKERS – YAWAHUSU VIBARUA
Number of casual workers
employed as on 30th June,
2012
Total person – days worked
during June, 2012
Total cash earnings for the month of
June, 2012
Page 4

INSTRUCTIONS
Q. 55. OCCUPATIONAL TITLE:
Q. 56. WORKERS BY SEX:
Record number of employees recruited in the same occupational title by sex.
Q. 57. HIGHEST LEVEL OF EDUCATION:
Indicate clearly the highest level of education code that the new recruited employee attained e.g. Primary Education = code 7 .
Q. 58. MAIN SUBJECT OF TRAINING:
State clearly the main subject of training attained by the new recruited employees e.g. Accounting Technician Grade 1 (ATEC. 1) .
Q. 59. CITIZENSHIP:
State clearly the country of origin for the new recruited employees e.g. Kenya .
Q. 60. EMPLOYMENT STATUS:
State clearly the Employment status of the new recruited employees e.g. Permanent Employees .
Q. 61. STARTING SALARY:
State clearly the amount of money in Tanzanian Shillings, which a new employee earns at the commencement of the service contract
PART IV: NUMBER OF NEW WORKERS RECRUITED DURING THE LAST 12 MONTHS:
If new employees recruited have the same occupational title, sex, level of education, main subject of training, citizenship, employment status and the
starting salary, record their information in one row, if it happens employees possess at least one different item of characteristics mentioned above, record
employees with similar characteristics in different rows.
State clearly the occupational title for the new employees recruited within the survey period i.e. during the last 12 months, starting from 1st July last year
to 30th
June this year
Page 5

57. Highest level of education 59. Citizenship 60. Employment
Status
Male Female
Tertiary University……….…..1
Tertiary Non University……...2
Teacher Education/College....3
Vocational Education……..….4
Secondary: O-Level…….…...5
Secondary: A-Level………....6
Primary Education………...….7
Tanzania….1
Kenya…..…2
Uganda …...3
Other………4
Permanent…..…1
Contract…….….2
Casual……….....3
Apprentices..…..4
Other…….…..….5
Eg1.Account Assistant 3 6 Accounting 1 2 350,000/=
eg2. Primary School Teacher 2 7 5 Teaching 2 1 230,000/=
1
2
3
4
5
6
7
8
9
10
11
12
13
PART IV: NUMBER OF NEW WORKERS RECRUITED DURING THE LAST 12 MONTHS
IDADI YA WAFANYAKAZI WAPYA WALIOAJIRIWA KATIKA KIPINDI CHA MIEZI 12 ILIYOPITA
Note: If you have more than 13 occupation titles with different characteristics, list the additional titles with their related information in a separate sheet
56. Number of
Workers by Sex
For Official Use
TASCO
55. Occupational Title (Write in full) e.g.
Accountant
58. Main Subject of Training For Official
Use
(SUBJECT
OF
TRAINING)
61. Starting salary
(TZS)
Page 6
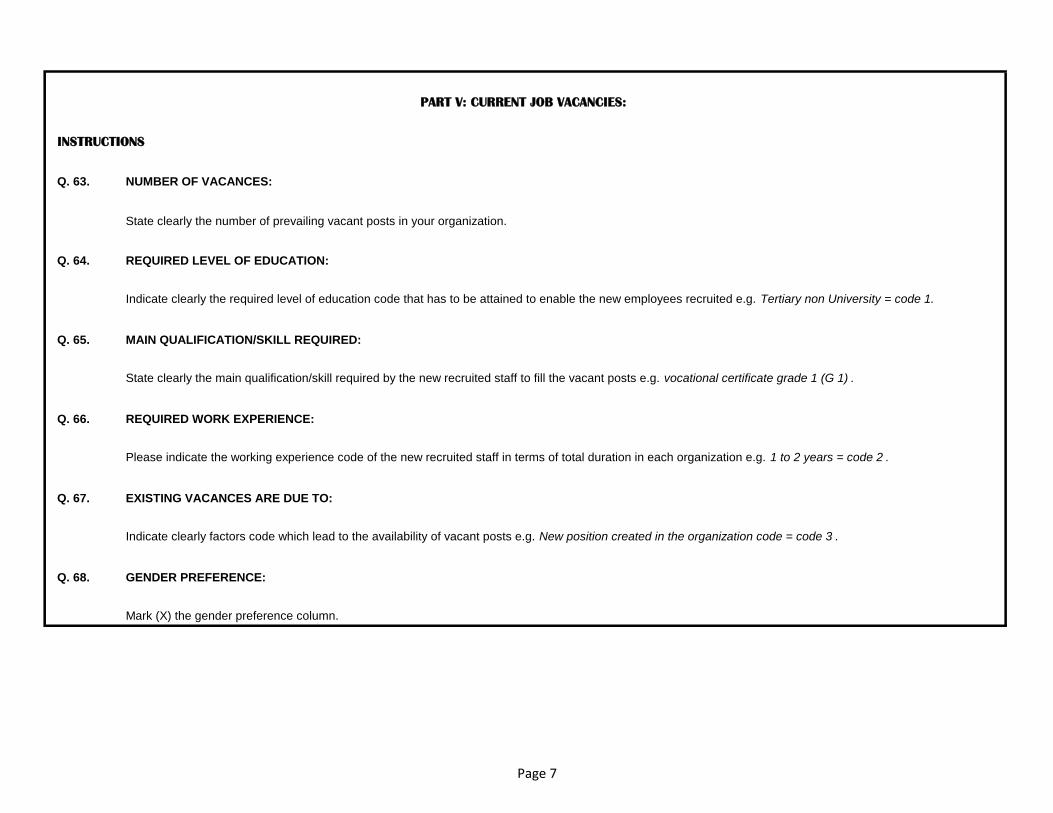
INSTRUCTIONS
Q. 63. NUMBER OF VACANCES:
State clearly the number of prevailing vacant posts in your organization.
Q. 64. REQUIRED LEVEL OF EDUCATION:
Indicate clearly the required level of education code that has to be attained to enable the new employees recruited e.g. Tertiary non University = code 1.
Q. 65. MAIN QUALIFICATION/SKILL REQUIRED:
State clearly the main qualification/skill required by the new recruited staff to fill the vacant posts e.g. vocational certificate grade 1 (G 1) .
Q. 66. REQUIRED WORK EXPERIENCE:
Please indicate the working experience code of the new recruited staff in terms of total duration in each organization e.g. 1 to 2 years = code 2 .
Q. 67. EXISTING VACANCES ARE DUE TO:
Indicate clearly factors code which lead to the availability of vacant posts e.g. New position created in the organization code = code 3 .
Q. 68. GENDER PREFERENCE:
Mark (X) the gender preference column.
PART V: CURRENT JOB VACANCIES:
Page 7

64. Required level of education 66. Required work
experience
67. Existing
vacancies are due to:
Tertiary University……….…..1
Tertiary Non University……...2
Teacher Education/College....3
Vocational Education…….….4
Secondary: O-Level…….…...5
Secondary: A-Level………....6
Primary Education………...….7
Not required……..1
1 to 2 years…...…2
3 to 4 years …..…3
5 or more years....4
Existing position
Fell vacant ...…1
Unfilled post…..2
New position …3
1
2
3
4
5
6
7
8
9
10
11
12
I certify that to the best of my knowledge the information stated on this form is correct.
Nathibitisha kuwa habari zote nilizotoa katika fomu hii ni za kweli kabisa.
Name/Jina:…………..………….……………………………….. Position/Cheo:………………………………………………..
Signed/Saini…………………..…………………………………..
Date/Tarehe:…………………..…………………………… Tephone No./Simu:………………………………
ASANTE KWA USHIRIKIANO WAKO. THANK YOU FOR YOUR CO – OPERATION.
PART V: CURRENT JOB VACANCIES (NAFASI ZA KAZI AMBAZO ZIPO WAZI KWA SASA)
68.
Gender
Preference
Note: If you have more than 12 occupation titles with different characteristics, list the additional titles with their related information in a separate sheet
62. Occupational Title
(Write in full)
e.g. Accountant
63. Number
of
vacancies
For Official Use
TASCO
65. Main
Qualification
/Skill required
(Write in full)
For Official
Use
(SUBJECT
OF
TRAINING)
Male ….…1
Female…..2
None …….3
Page 8