Employment Change in the Small Business Sector: Evidence from Five Manufacturing Industries Author(s): Peter Johnson Source: Small Business Economics, Vol. 1, No. 4 (1989), pp. 315-323 Published by: Springer Stable URL: http://www.jstor.org/stable/40228534 . Accessed: 14/06/2014 08:53 Your use of the JSTOR archive indicates your acceptance of the Terms & Conditions of Use, available at . http://www.jstor.org/page/info/about/policies/terms.jsp . JSTOR is a not-for-profit service that helps scholars, researchers, and students discover, use, and build upon a wide range of content in a trusted digital archive. We use information technology and tools to increase productivity and facilitate new forms of scholarship. For more information about JSTOR, please contact [email protected]. . Springer is collaborating with JSTOR to digitize, preserve and extend access to Small Business Economics. http://www.jstor.org This content downloaded from 185.2.32.141 on Sat, 14 Jun 2014 08:53:35 AM All use subject to JSTOR Terms and Conditions
Transcript
Employment Change in the Small Business Sector: Evidence from Five ManufacturingIndustriesAuthor(s): Peter JohnsonSource: Small Business Economics, Vol. 1, No. 4 (1989), pp. 315-323Published by: SpringerStable URL: http://www.jstor.org/stable/40228534 .
Accessed: 14/06/2014 08:53
Your use of the JSTOR archive indicates your acceptance of the Terms & Conditions of Use, available at .http://www.jstor.org/page/info/about/policies/terms.jsp
.JSTOR is a not-for-profit service that helps scholars, researchers, and students discover, use, and build upon a wide range ofcontent in a trusted digital archive. We use information technology and tools to increase productivity and facilitate new formsof scholarship. For more information about JSTOR, please contact [email protected].
.
Springer is collaborating with JSTOR to digitize, preserve and extend access to Small Business Economics.
http://www.jstor.org
This content downloaded from 185.2.32.141 on Sat, 14 Jun 2014 08:53:35 AMAll use subject to JSTOR Terms and Conditions
Employment Change in the Small Business Sector: Evidence from Five Manufacturing Industries Peter Johnson
ABSTRACT. This paper examines the scale and nature of employment flows into and out of the small business sector (SBS) in five United Kingdom manufacturing industries over the period 1979-85. It first provides a taxonomic framework for analysing these flows. It then draws on specially prepared analyses from the Annual Census of Production (ACOP) for the UK to show that the SBS in each industry has experienced very substantial turbulence: although the SBS (across all five industries) lost only four per cent of 1 979 employment over the period, movement in and out each represented about half of 1979 employment. Most gains and losses were in the very- small size bands. The paper also briefly explores the relation- ship between births and deaths and industrial characteristics across the five industries. The study raises questions about the causes and costs of high turbulence in the SBS. It also demonstrates the potential value of the ACOP data base for longitudinal studies of business in the UK.1
I. Introduction
Recent years have seen a considerable growth in both policy and research interest in employment generation in the small business sector (SBS). The present UK government clearly sees this sector as playing an important role in job creation.2 Academic research on employment in the SBS, in part stimulated by the work of Birch (1979) in the US, has been largely concerned with constructing job accounts.3 This approach has yielded much valuable information on small business employ- ment. In particular it has shown that small firms are growing in relative importance as a source of
employment in most advanced economies, and that net employment generation is at its highest among small firms. (For a review of studies, see Storey and Johnson, 1987, for Europe, and Brock and Evans, 1989, for the US.) However, these studies have not provided an assessment of the relative importance of different components of employment change which together determine the way in which employment in the SBS as a whole changes. Yet such an assessment is vitally impor- tant for the formulation of policy towards the SBS. It is likely, for example, that the policy implica- tions of a declining SBS which is due to firms growing out of the sector and not being replaced by a sufficient flow of new formations are likely to be very different from those where the SBS is shrinking because the death rate exceeds the birth rate. Again, an SBS which is growing because of a relatively high birth rate offers different challenges to one which is expanding because large units are becoming smaller.
This paper goes some way towards rectifying this deficiency by looking at the scale and nature of employment flows into and out of the SBS in five manufacturing industries over the period 1979-85. The data presented here are used to consider three questions. First, how large were the movements into and out of the SBS during the period? Secondly, what form did such movement take? And, finally, why did industries differ in the scale of inward and outward flows? This third question is given preliminary consideration only. Some of the underlying factors that might explain variations across industries are briefly suggested, but the limited nature of the data currently available means that virtually no formal testing of hypotheses is possible. The 1979-85 period is a particularly attractive one because it covers a time
Final version accepted on May 30, 1989
Department of Economics University of Durham 23-26 Old Elvet Durham DH13HY U.K.
when much policy emphasis has been given to small firms. (1985 was the latest year for which data were available at the time of writing.) It should be noted however that manufacturing as a whole experienced a substantial decline in em- ployment during this period.
The paper draws on specially prepared tabula- tions, from the Annual Census of Production (ACOP). As indicated below, ACOP, unlike many of the data bases used in job accounting studies, is national in character and has been in existence for many years. It contains a wealth of information on individual enterprises and establishments whose histories may each be tracked through time. Suitably harnessed, the ACOP data could provide a very rich source of industrial statistics and eliminate the substantial costs incurred in the construction and maintenance of one off data bases for particular research projects. This study gives some indication of the potential of ACOP in this respect.
Section II of this paper considers the different ways in which SBS employment may change. Section in examines the nature of the ACOP statistics and the way in which they are used in this paper. Section IV presents some results and places them in the context of findings from other studies. Section V briefly explores the reasons behind the differences between the industries. The final section reviews the study and the potential for further ACOP based work.
II. Components of employment change Table I categorises establishments that affect employment in the SBS. The basis of categorisa- tion is the particular way in which they impact on such employment in a case study industry. The notation is as follows. The upper case letters refer to the size of the establishment in the base and end years respectively (S = small; L = large). The subscript refers to the industry in which the establishment is found (i = case study industry; n = industry other than case study industry). Where an establishment was not traceable anywhere in manufacturing, the relevant upper case letter is replaced by a zero. It is of course necessary for each establishment included in the study to be small and in the case study industry (S,) in at least the base or end years.
TABLE I Classification of small establishments3
Flows of Flows of Employment change employment into employment out within SBS the SBS of the SBS
SA la sa LA sjlh SAi sa O St S, O
a The notation is as follows. The first upper case letter refers to the size of the establishment in the base year. The second upper case letter refers to the size of the same establishment in the end year. (5 = small; L = large; O - untraceable). The subscripts i and n refer respectively to the case study industry, and to industries other than the case study industry. Thus an establishment labelled LjSn was large in the case study industry in the base year but small and operating outside the case study industry in the end year.
It should be noted that a zero does not neces- sarily mean that the establishment was not in existence outside manufacturing. However it is likely that movement from "untraceable" is likely to consist primarily of newly born establishments and that movement to "untraceable" will largely consist of deaths. It is assumed in this paper that OS, establishments were "born" and that S^O establishments "died" during the period.
HI. The data
ACOP
ACOP is a statutory enquiry conducted by the UK government through its Business Statistics Office (BSO).4 The census covers UK establishments in industrial production which includes manufactur- ing,5 the subject of this paper. Results include estimates for non-respondents, unsatisfactory returns and establishments not selected for the census. An establishment is defined for ACOP purposes as the smallest production unit for which the information required for the census can be provided. (An establishment may sometimes con- sist of several factories or sites; an enterprise -
broadly equivalent to a firm - may consist of several establishments.)
The census is based on a register which is maintained by the BSO and which is intended to
This content downloaded from 185.2.32.141 on Sat, 14 Jun 2014 08:53:35 AMAll use subject to JSTOR Terms and Conditions
Employment Change in the Small Business Sector 317
include a comprehensive listing of all manufactur- ing establishments in the UK. The register is maintained from a variety of sources, although heavy use is now made of VAT registration data. The census enquiry itself also provides a source of information for updating the register.
A complicating factor as far as this paper is concerned is that towards the end of 1984, revision of the register led to substantial removals and additions, mostly at the very small end. While this revision may have introduced some 'spurious' births and deaths into the data set considered here, it is likely also to have identified genuine births and deaths occurring between 1979 and 1985 that would not otherwise have been picked up. Although it is not possible to say what the overall impact of the revision has been, it is clear that employment data - the subject of this paper - were much less affected than those on numbers of establishments.
Each establishment's entry on the register contains, inter alia, a figure for employment. This figure is either obtained directly from the esta- blishment itself or imputed from turnover data given in VAT returns. The BSO admits that the turnover data 'may occasionally be erroneous' (Perry, 1985).
Estimation and sampling is used in the lower half of the 'small' range. Questionnaires are not sent to establishments of less than 20 employees6 and in general there is a 1 in 4 sample of esta- blishments with 20- -49 employees7 and a 1 in 2 sample for establishments with 50-99 employees.8
Given the estimation and sampling used in the census, and the changes in the register, it is difficult to assess how accurate the ACOP data are. However it is probably true to say that ACOP is superior to any other data base used to collect information on small establishments in manufac- turing. Most relate to particular areas of the UK: see Storey and Johnson (1987) for a summary. The nearest competitor is the Dun and Bradstreet (D&B) enterprise data base, utilised by Gallagher and Stewart (1986). The D and B data have been constructed primarily to offer a credit rating service. It is therefore less likely to cover firms for whom such a rating is not required.9 Certainly, as Gallagher and Stewart themselves show, its cover- age of small manufacturing establishments is less
than that of ACOP.10 The D and B data base is also rather more restricted in terms of its statistical coverage.
Because of statutory restrictions on the dis- closure of ACOP statistics, the tabulations on which this paper is based were provided by the BSO to the author's specification. Cost considera- tions meant that the coverage of the tabulations was restricted to employment data. Such con- siderations have also meant that this paper covers only two years - a base and an end year (1979 and 1985 respectively) - but there is no reason, in principle, given the annual nature of the census, why a year by year "tracking" of the experience of individual establishments should not be under- taken.
ACOP is establishment based and the data presented in this paper therefore take the esta- blishment as the unit of analysis. Enterprise analyses are also feasible but must await further resources. However as has been shown elsewhere (Johnson, 1989) most small establishments belong to single establishment enterprises; hence equating 'establishment' with 'enterprise' is unlikely to be wildly inaccurate.
Definition of "Smair
For the purposes of this paper the SBS consists of all establishments with under 200 employees. This definition follows that adopted by the Bolton Committee of Inquiry on Small Firms (HMSO, 1971).
The case study industries
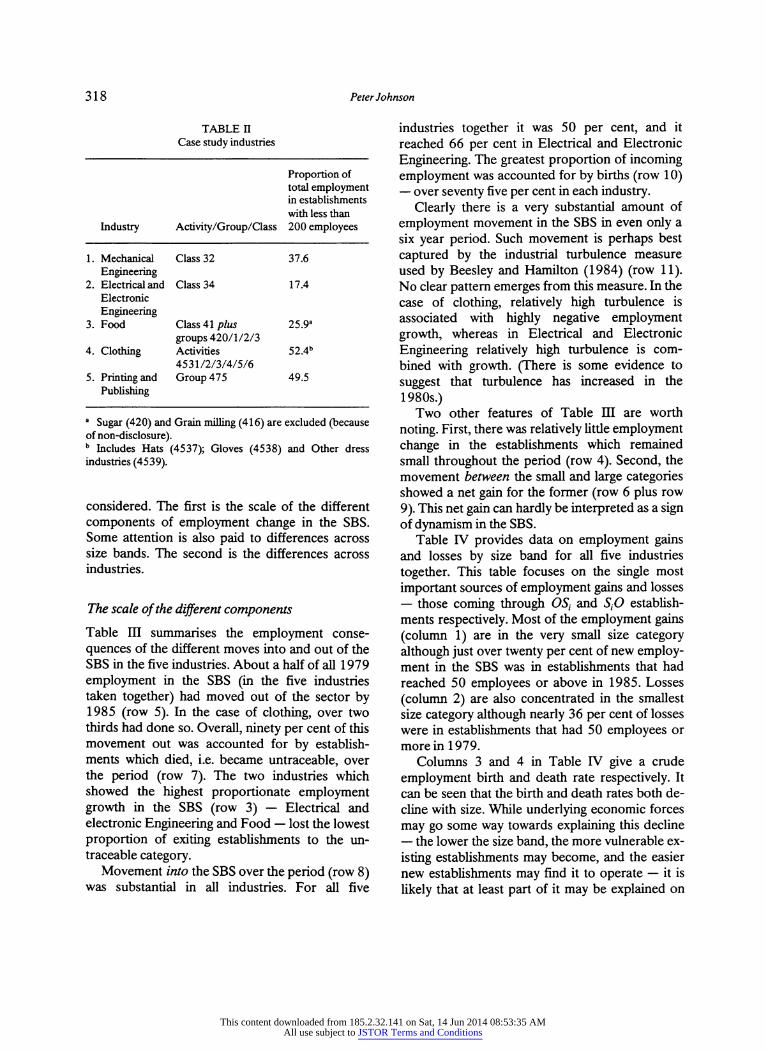
The industries covered in this paper are given in Table II. The general criteria used for selection were that the industries chosen should cover a fairly broad spectrum of activities and charac- teristics and that the number of small establish- ments should be sufficiently large to avoid prob- lems over disclosure. As Table II shows, the industries vary substantially in the proportion of total employment accounted for by establishments with less than 200 employees.
IV. Some results
In this section two aspects of the results are
This content downloaded from 185.2.32.141 on Sat, 14 Jun 2014 08:53:35 AMAll use subject to JSTOR Terms and Conditions
Proportion of total employment in establishments with less than
Industry Activity /Group/Class 200 employees
1. Mechanical Class 32 37.6 Engineering
2. Electrical and Class 34 17.4 Electronic Engineering
3. Food Class 41 plus 25.9a groups 420/1/2/3
4. Clothing Activities 52.4b 4531/2/3/4/5/6
5. Printing and Group 475 49.5 Publishing
a Sugar (420) and Grain milling (416) are excluded (because of non-disclosure). b Includes Hats (4537); Gloves (4538) and Other dress industries (4539).
considered. The first is the scale of the different components of employment change in the SBS. Some attention is also paid to differences across size bands. The second is the differences across industries.
The scale of the different components Table m summarises the employment conse- quences of the different moves into and out of the SBS in the five industries. About a half of all 1979 employment in the SBS (in the five industries taken together) had moved out of the sector by 1985 (row 5). In the case of clothing, over two thirds had done so. Overall, ninety per cent of this movement out was accounted for by establish- ments which died, i.e. became untraceable, over the period (row 7). The two industries which showed the highest proportionate employment growth in the SBS (row 3) - Electrical and electronic Engineering and Food - lost the lowest proportion of exiting establishments to the un- traceable category.
Movement into the SBS over the period (row 8) was substantial in all industries. For all five
industries together it was 50 per cent, and it reached 66 per cent in Electrical and Electronic Engineering. The greatest proportion of incoming employment was accounted for by births (row 10) - over seventy five per cent in each industry.
Clearly there is a very substantial amount of employment movement in the SBS in even only a six year period. Such movement is perhaps best captured by the industrial turbulence measure used by Beesley and Hamilton (1984) (row 11). No clear pattern emerges from this measure. In the case of clothing, relatively high turbulence is associated with highly negative employment growth, whereas in Electrical and Electronic Engineering relatively high turbulence is com- bined with growth. (There is some evidence to suggest that turbulence has increased in the 1980s.)
Two other features of Table EQ are worth noting. First, there was relatively little employment change in the establishments which remained small throughout the period (row 4). Second, the movement between the small and large categories showed a net gain for the former (row 6 plus row 9). This net gain can hardly be interpreted as a sign of dynamism in the SBS.
Table IV provides data on employment gains and losses by size band for all five industries together. This table focuses on the single most important sources of employment gains and losses - those coming through OSt and Sfi establish- ments respectively. Most of the employment gains (column 1) are in the very small size category although just over twenty per cent of new employ- ment in the SBS was in establishments that had reached 50 employees or above in 1985. Losses (column 2) are also concentrated in the smallest size category although nearly 36 per cent of losses were in establishments that had 50 employees or more in 1979.
Columns 3 and 4 in Table IV give a crude employment birth and death rate respectively. It can be seen that the birth and death rates both de- cline with size. While underlying economic forces may go some way towards explaining this decline - the lower the size band, the more vulnerable ex- isting establishments may become, and the easier new establishments may find it to operate - it is likely that at least part of it may be explained on
This content downloaded from 185.2.32.141 on Sat, 14 Jun 2014 08:53:35 AMAll use subject to JSTOR Terms and Conditions
a The other category of employment loss arises from SjSn establishments, but this is very small. b The other category of employment gain arises from Sn 5, establishments, but this is very small. Source: Author's data.
TABLE IV Employment gains and losses 1979-85 by size category
Employment Employment gained through lost through
Employment Employment births 1979- 85: deaths 1979- 85: gained through lost through % of 1 979 % of 1 979
Size births, 1979- 85: deaths, 1979- 85: employment in employment in category % of total % of total size band size band
more simple terms. Ceteris paribus, new establish- ment will find it more difficult to reach the higher size bands in any given period. Conversely, exiting establishments have longer to 'fall' the higher the size band they occupy.
Table IV also shows that only in the 1-19 size band is the death rate lower than the birth rate.
Comparisons with the results of other studies are difficult because investigators have not tended to take the SBS as the unit of analysis.12 Further- more published studies cover a variety of time periods, economic environments and industries. They also employ different data sources and size bands. However the following points may be made. Firstly, a number of other studies have also shown that movement between small and large size categories is very restricted (see for example, Gallagher and Stewart, 1986; Macey, 1982; Storey, 1982, p. 22). Secondly although there are no data directly comparable to those contained in this paper, the scale, in employment terms, of births and deaths is not seriously out of line with other results. For example Gallagher and Doyle's study (1986) of the much shorter period, 1982- 84 for all industries using the D&B data base showed, for the 1-99 size category, an annu- alised13 employment change from births and deaths of 4.1 per cent and 4.5 per cent respec- tively, compared with 7.2 per cent for both births and deaths in this study. Very similar figures may be derived from Gallagher and Stewart's (1986) study which uses the same data source but which covers the much longer period 1971-81. Macey's (1982) study of manufacturing between 1972 and 1975 gives an annualised employment change from births and deaths of 3.0 and 1.1 respectively for the 11-^-200 size band compared with 3.4 and 5.0 per cent in the 20-199 size band in the present study. (Comparisons across exactly the same size band is not possible.) Thirdly, there is other evidence to support the finding that births and deaths tend to be highest in the very small size bands: see for example, Gallagher and Stewart (1986). Finally, the substantial movement in and out is consistent with findings from VAT registra- tions that show very high rates of registration and deregistration. For example in 'production' - a rather larger category than manufacturing - new registrations and deregistrations between 1980
and 1986 accounted for 101 and 84 per cent respectively of the initial stock of registrations.14
Variations across industries
Because of the small number of industries and the limited data available, it is not possible to under- take any formal analysis of industry differences. However very preliminary consideration may be given to the relationship between birth and death rates (as defined in this paper) and to the way in which economic factors may affect those rates.
It might be anticipated that industries which have higher birth rates would have lower death rates on the grounds that factors which encourage birth (for example, high profitability, rapid growth) are also likely to be those which make death less likely. However although the correlation coefficient between birth and death rates is negative as expected it is very low (-0.20) and insignificant. The coefficient is also negative (-0.49) for the 100-199 size band, although still insignificant. Clearly the relationship between birth and death rates, is more complex than can be detected from the correlation coefficient alone.
The relationship between variations across industries in key economic characteristics and variations first in births, and second in deaths was then examined. The economic characteristics chosen were as follows (notation is given in brackets).
(a) Capital investment per head (CIPH). The more investment per worker in the industry the lower the birth rate is likely to be, because of the existence of economies of scale in the raising of capital (Scherer, 1980, p. 140f; Brock and Evans, 1989). To the extent that any investment is also a sunk cost, newcomers will be less willing to commit themselves, the higher the investment required (Clarke, 1985, p. 95). It might be expected too that the higher the investment per head, the higher the death rate, because of the greater financial pressures the investment may generate.
(b) Research and development (R&D) intensity (RDI). Similar reasoning to that relating to (a) may be applied here. Although high R&D intensity
This content downloaded from 185.2.32.141 on Sat, 14 Jun 2014 08:53:35 AMAll use subject to JSTOR Terms and Conditions
Employment Change in the Small Business Sector 321
may sometimes indicate scope for innovative activity for small firms, and hence encourage births and discourage deaths, it is more likely to generate disadvantages for smaller businesses because of the existence of economies of scale in R&D (Scherer, 1980, pp. 416-418).
(c) Growth (G). High growth is likely to encour- age births and discourage deaths, by providing more market 'space' for smaller businesses, and by reducing the need for existing firms to introduce measures to stop new entrants from coming in and thereby to protect their own markets. At the same time growth may raise paid employment prospects and reduce the flow of founders into business. Empirical work on the effects of growth on formation activity have yielded inconclusive results. (Gudgin, 1978 p. 133f; Johnson and Cathcart, 1979).
(d) Employment share of small establishments (ES). It may be argued that the higher this share, the more congenial generally an industry is likely to be for small scale activity (Gudgin 1978, p. 140). Thus, births are likely to be encouraged and deaths discouraged.
The Appendix describes the data sources used for these measures.
The following birth and death rates are used (the establishment notation is given in brackets):
(a) 1985 employment in OSt establishments as a percentage of total SBS employment in 1979 (OS0);
(b) 1985 employment in OSt establishments
with between 100 and 199 employees in 1985 as a percentage of total SBS employment in 1979 (OS}00);
(c) 1979 employment in S(O establishments as a percentage of total SBS employment in 1979 (5?O);and
(d) 1979 employment in 5,0 establishments with between 100 and 199 employees in 1979 as a percentage of total SBS employment in 1979 (S}00O).
Measures (b) and (d) have been included as they abstract from any problems that may have arisen from changes in the register (see Section IE above). As Table V shows (a) and (b), and (c) and (d) are highly correlated.
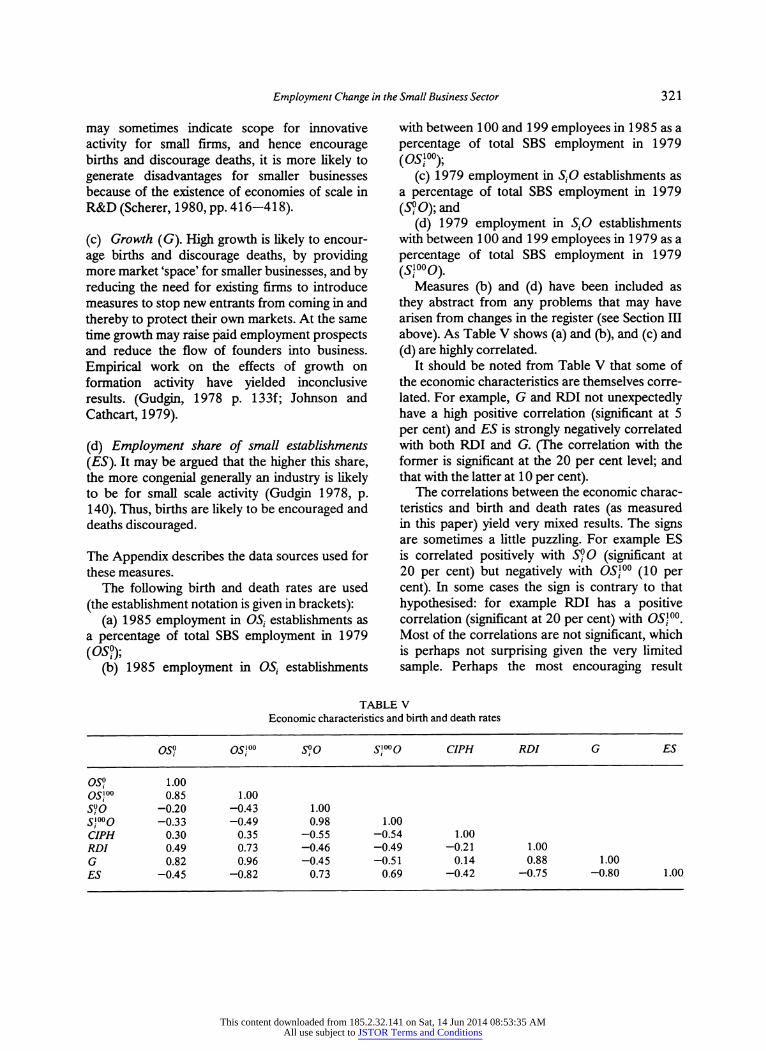
It should be noted from Table V that some of the economic characteristics are themselves corre- lated. For example, G and RDI not unexpectedly have a high positive correlation (significant at 5 per cent) and ES is strongly negatively correlated with both RDI and G. (The correlation with the former is significant at the 20 per cent level; and that with the latter at 1 0 per cent).
The correlations between the economic charac- teristics and birth and death rates (as measured in this paper) yield very mixed results. The signs are sometimes a little puzzling. For example ES is correlated positively with S°O (significant at 20 per cent) but negatively with OS}00 (10 per cent). In some cases the sign is contrary to that hypothesised: for example RDI has a positive correlation (significant at 20 per cent) with OS}00. Most of the correlations are not significant, which is perhaps not surprising given the very limited sample. Perhaps the most encouraging result
table v Economic characteristics and birth and death rates
however is that G is positively correlated with OS? (10 per cent significance) and OS}00 (5 per cent significance). Clearly the relationship between births and deaths and economic variables is a complex one. A more refined methodology and a bigger sample of industries are required for further work.
V. Review
This paper has shown how ACOP data may be used to shed light on the nature and scale of employment flows into and out of the SBS in the UK, with the progress of individual establishments being tracked through time. The results of this exercise indicate that the relatively slight (4 per cent) overall decline in SBS employment in the five industries over the period masks very sub- stantial turbulence among small establishments. This finding raises at least two questions. First, why does this turbulence occur? Detailed studies of birth and death rates are required. The restricted nature of the sample used in this paper has not permitted much progress on this issue. Data on a much wider range of industries is necessary although if ACOP data are used, the costs of extraction are likely to be heavy. Second, what are the private and social costs of high turbulence? The process of movement in and out is likely to generate resource costs, which might to some extent be reduced with better training or information. Little research has been done in this area.
This paper has also demonstrated the way in which ACOP data may be used for longitudinal studies in the UK. Such studies need not be restricted to the SBS. Furthermore analyses of the histories of enterprises as well as establishments could be carried out. Although this paper has focused - for cost reasons - on employment data alone, the ACOP data base contains information, on an annual basis, on a wide range of other variables including wages and salaries, net and gross output, gross value added, sales revenue, and net investment. There is no reason in principle why the unit of analysis should not be the individual enterprise or establishment. Break- downs by industry and geographical area are possible. Clearly the potential of the ACOP data is substantial. Its use would remove the need to build
up other data bases, a procedure which involves painstaking effort and cost. The main barriers to the use of ACOP data for research purposes are the disclosure restrictions in the Statistics of Trade Act, and the costs of extraction. However the former is not insurmountable given the political will; the latter are still likely to be less than the cost of setting up a data base from scratch.
Appendix
Sources of data for Table V
GPH was derived from the annual Census of Production for 1982.
RDI was obtained by dividing industrial R&D expenditure for 1982 by net output. The R&D figures were obtained from Indus- trial Research and Development Expendi- ture and Employment 1981 Business Monitor MO 14. The net output figures were extracted from the annual Census of Production.
G used output indices published in the Monthly Digest of Statistics for 1979- 1985.
ES was extracted from the annual Census of Production for 1982.
Notes 1 This research was financed by generous financial assistance from the University of Durham. The author is grateful to staff at the Business Statistics Office for their assistance in pro- viding the data on which this paper is based, and to colleagues in the Department of Economics who commented on earlier drafts. An anonymous referee also provided helpful com- ments. However, any errors or omissions are the responsibil- ity of the author alone. 2 In his 1 988 Budget speech the Chancellor of the Exchequer referred to "the continuing vigour of the [small business] sector which is such an important source of enterprise, innovation and of new jobs" (Financial Times, 16 March, 1988). 3 See for example Cross (1981), Storey (1982, 1985), and
Gallagher and Stewart (1986), Gallagher and Doyle (1986). 4 For a full description of ACOP see Business Monitor PA 1001, 1985 Report on Census of Production: Introductory Notes (HMSO: London). 5 In addition to manufacturing, 'industrial production' in- cludes mining and quarrying, construction, and the gas, electricity and water supply industries. 6 In 1978 (a year outside the period covered in this study)
This content downloaded from 185.2.32.141 on Sat, 14 Jun 2014 08:53:35 AMAll use subject to JSTOR Terms and Conditions
Employment Change in the Small Business Sector 323
questionnaires were sent to a 1 in 10 sample of establishments in this size band. 7 In 1979 the sample was 1 in 2 for 68 industries. In 1980, it was cut to 1 in 4. 8 There are a number of exceptions to the sampling rules, one of which is that the BSO samples move intensely in industries where it believes that there would otherwise be an unacceptable level of estimation. It should also be noted that until 1986, all establishments with an employment of 20 or more which covered sites at more than one address were required to complete a questionnaire and that prior to 1980, all establishments in the 50-99 size band were included in the survey. For the "benchmark" Census of 1984, all esta- blishments with an employment of 50 or more and in general 1 in 2 of those with an employment of between 20 and 49 were sent questionnaires. 9 Gallagher and Stewart (1986) have argued that firms are likely to respond reasonably accurately to a questionnaire from D&B because their business could depend on their credit rating. But it might equally be argued that respondents have an incentive to distort the information they provide in order that their business affairs are seen in the best possible light. Gallagher and Doyle (1986) argue that Foley (1983) shows that the D&B data have fuller coverage than ACOP. This is puzzling since Foley does not include ACOP in his study. 10 There has been some debate over the reliability and coverage of the D&B data base: see Storey and Johnson (1 986) and Gallagher and Doyle (1 986). 11 Both VAT regulations and deregulations have shown a strongly upward trend since 1981: see British Business, 12 August 1983 and 12 August 1988. See also Johnson (1989) Table 1. 12 Most job generation studies attribute expansion/contrac- tion to the size band to which the establishment/enterprise is classified in the base year, irrespective of whether or not that establishment/enterprise lies outside that size band in the end year. This procedure makes the tracking of movements into/ out of the SBS difficult since it is not usually possible to establish which growing establishments/enterprises are still within the 'small' size band in the end year. 13 Annualising employment change is a rather crude way of standardising for different time periods, since it takes no account of the life cycle of employment growth and decline in establishments/enterprises. However it is the best that can be done with the current data set. 14 See British Business, 1 2 August 1 988.
References
Beesley, M. E. and R. T. Hamilton, 1984, 'Small Firms' Seedbed Role and the Concept of Turbulence', Journal of Industrial Economics 33(2), 217-31.
Birch, D., 1979, The Job Generation Process, MIT Program on Neighborhood and Regional Change, Cambridge, Mass.: MIT.
Brock, W. A. and D. S. Evans, 1989, 'Small Business Economies', Small Business Economics 1(1), 7-20.
Clarke, R., 1985, Industrial Economics, Oxford: Blackwell. Cross, M., 1981, New Firm Formation and Regional Develop-
ment, Farnborough, Hants: Gower. Foley, M, 1983, 'A Comparison of Four Industrial Data
Sources', in M. Healey (ed.), Urban and Regional Indus- trial Research: The Changing UK Data Base, Norwich: Geobooks.
Gallagher, C. and J. Doyle, 1986, 'Small Firms - Net Job Generators', British Business (17 October).
Gallagher, C. and J. Doyle, 1986, 'Job Generation Research: A Reply to Storey and Johnson', International Small Business Journal 4(4), 47-54.
Gallagher, C. and H. Stewart, 1986, 'Jobs and the Business Life Cycle in the UK', Applied Economics 18(8), 875- 900.
HMSO, 1971, Report of the Committee of Inquiry on Small Firms, Cmnd. 481 1, London: HMSO.
Johnson, P., 1989, 'Employment Change in the Small Esta- blishment Sector in UK Manufacturing', Applied Eco- nomics 21(2), 251-60.
Johnson, P. S. and D. G. Cathcart, 1979, 'New Manufacturing Firms and Regional Development', Journal of Industrial Economics 28(2), 269-280.
Macey, R. D., 1982, Job generation in British Manufacturing Industry: Employment Change by Size of Establishment and by Region, Government Economic Service Working Paper, No. 55 (Department of Industry Regional Research Series No. 4), London: Department of Industry.
Perry, J. A., 1985, 'The Development of a New Register of Businesses', Statistical News 70, 70.13-70.14.
Scherer, F. M., 1980, Industrial Market Structure and Eco- nomic Performance, Chicago: Rand McNally.
Storey, D., 1982, Entrepreneurship and the New Firm, London: Croom Helm.
Storey, D., 1985, 'Manufacturing Employment Change in Northern England 1965-78: The Role of Small Busi- nesses', in D. Storey (ed.), Small Firms in Regional Economic Development, Cambridge: Cambridge Univer- sity Press, 1-41.
Storey, D. and S. Johnson, 1986, 'Job Generation in Britain: A Review of Recent Studies', International Small Business Journal 4(4), 29-45.
Storey, D. and S. Johnson, 1987, Job Creation in Small and Medium Sized Enterprises, Summary Report: Issues for Research and Policy, United Kingdom and Italy, Vol. 1: Main Report. Luxemburg: Commission of the European Communities.
This content downloaded from 185.2.32.141 on Sat, 14 Jun 2014 08:53:35 AMAll use subject to JSTOR Terms and Conditions