Transmission of material in this release is embargoed until USDL-10-0535 8:30 a.m. (EDT) Friday, April 30, 2010 Technical information: (202) 691-6199 • [email protected]• www.bls.gov/ect Media contact: (202) 691-5902 • [email protected](NOTE: Employment Cost Index data from June 2009 through September 2010 have been found to contain errors in several data series and will be corrected in the public database available on the BLS website. This news release will not be corrected. The primary errors are in wage and salary data for State and local government public administration. Additional series are subject to correction as well. For further information see: www.bls.gov/bls/eci_corrections_111910.htm.) EMPLOYMENT COST INDEX – MARCH 2010 Compensation costs for civilian workers increased 0.6 percent, seasonally adjusted, for the 3-month period ending March 2010, the U.S. Bureau of Labor Statistics reported today. Wages and salaries (which make up about 70 percent of compensation costs) increased 0.4 percent while benefits (which make up the remaining 30 percent of compensation)—increased 1.1 percent. Civilian Worker Data Compensation costs for civilian workers increased 1.7 percent for the 12-month period ending March 2010. This was smaller than the 2.1 percent increase for the 12-month period ending in March 2009. Wages and salaries increased 1.5 percent for the current 12-month period, slowing from a 2.2 percent increase for the 12-month period ending in March 2009. Benefit costs rose 2.2 percent, compared with a 2.0 percent increase for the 12-month period ending March 2009. Private Industry Worker Data Compensation costs for private industry workers increased 1.6 percent, compared to 1.9 percent for the 12-month period ending March 2009. The wage and salary series increased 1.5 percent for the current 12-month period, compared to 2.0 percent for the period ending March 2009. The cost of benefits 0.0 1.0 2.0 3.0 4.0 M ar 08 Jun 08 Sep 08 Dec 08 M ar 09 Jun 09 Sep 09 Dec 09 M ar 10 Percent change Chart 2. Employment Cost Index, 12-month percent change, not seasonally adjusted, private industry workers, wages and salaries, Mar. 2008-Mar. 2010 Percent change 0.0 0.2 0.4 0.6 0.8 M ar 08 Jun 08 Sep 08 Dec 08 M ar 09 Jun 09 Sep 09 Dec 09 M ar 10 Chart 1. Employment Cost Index, 3-month percent change, seasonally adjusted, civilian workers, compensation, Mar. 2008-Mar. 2010
Transcript
Transmission of material in this release is embargoed until USDL-10-0535 8:30 a.m. (EDT) Friday, April 30, 2010
Technical information: (202) 691-6199 • [email protected] • www.bls.gov/ect Media contact: (202) 691-5902 • [email protected] (NOTE: Employment Cost Index data from June 2009 through September 2010 have been found to contain errors in several data series and will be corrected in the public database available on the BLS website. This news release will not be corrected. The primary errors are in wage and salary data for State and local government public administration. Additional series are subject to correction as well. For further information see: www.bls.gov/bls/eci_corrections_111910.htm.)
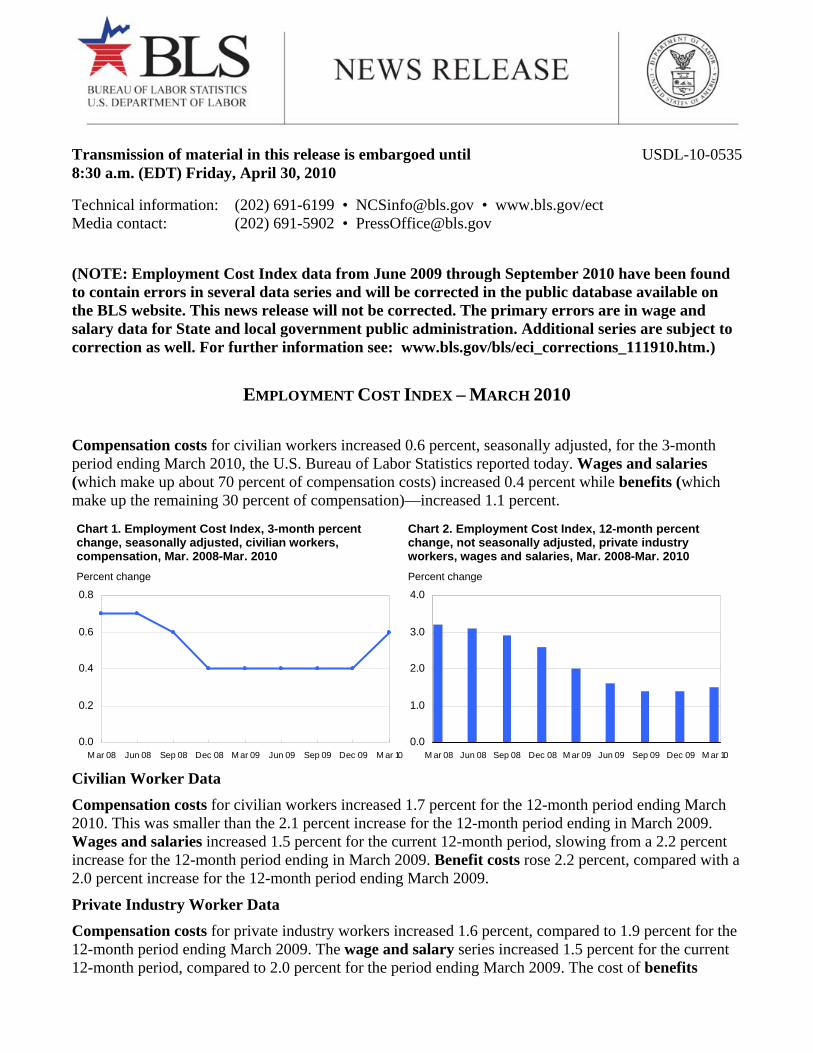
EMPLOYMENT COST INDEX – MARCH 2010 Compensation costs for civilian workers increased 0.6 percent, seasonally adjusted, for the 3-month period ending March 2010, the U.S. Bureau of Labor Statistics reported today. Wages and salaries (which make up about 70 percent of compensation costs) increased 0.4 percent while benefits (which make up the remaining 30 percent of compensation)—increased 1.1 percent.
Civilian Worker Data
Compensation costs for civilian workers increased 1.7 percent for the 12-month period ending March 2010. This was smaller than the 2.1 percent increase for the 12-month period ending in March 2009. Wages and salaries increased 1.5 percent for the current 12-month period, slowing from a 2.2 percent increase for the 12-month period ending in March 2009. Benefit costs rose 2.2 percent, compared with a 2.0 percent increase for the 12-month period ending March 2009.
Private Industry Worker Data
Compensation costs for private industry workers increased 1.6 percent, compared to 1.9 percent for the 12-month period ending March 2009. The wage and salary series increased 1.5 percent for the current 12-month period, compared to 2.0 percent for the period ending March 2009. The cost of benefits
0.0
1.0
2.0
3.0
4.0
M ar 08 Jun 08 Sep 08 Dec 08 M ar 09 Jun 09 Sep 09 Dec 09 M ar 10
Percent change
Chart 2. Employment Cost Index, 12-month percent change, not seasonally adjusted, private industry workers, wages and salaries, Mar. 2008-Mar. 2010
Percent change
0.0
0.2
0.4
0.6
0.8
M ar 08 Jun 08 Sep 08 Dec 08 M ar 09 Jun 09 Sep 09 Dec 09 M ar 10
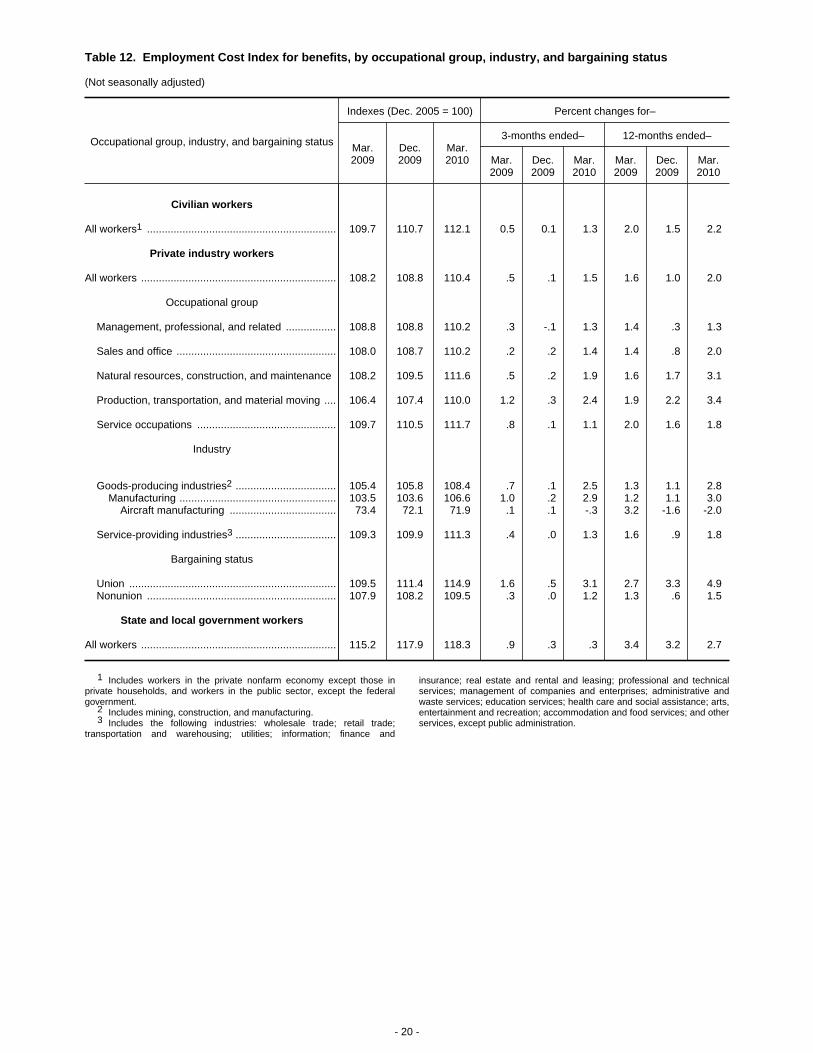
increased 2.0 percent for the 12-month period ending March 2010 primarily due to increases in the cost of health benefits and defined benefit retirement plans. In March 2009, benefits increased 1.6 percent. Employer costs for health benefits increased 4.5 percent for the 12-month period ending March 2010. In March 2009, the 12-month percent change was 4.6 percent.
Among occupational groups, compensation cost increases for private industry workers for the 12-month period ending March 2010 ranged from 1.3 percent for management, professional, and related occupations to 2.1 percent for natural resources, construction, and maintenance occupations.
Among industries, compensation cost increases for private industry workers for the current 12-month period ranged from 1.0 percent for professional and business services to 2.8 percent for financial activities.
State and Local Government Workers
Compensation costs for State and local government workers increased 2.0 percent for the 12-month period ending March 2010. Prior published values ranged from 2.3 to 9.6 percent since the series began in June 1982. Wages and salaries increased 1.8 percent. Prior published values ranged from 1.9 to 8.5 percent since the series began, also in June 1982. Benefit costs increased 2.7 percent. Prior published values ranged from 1.2 to 8.3 percent since the series began in June 1990.
The Employment Cost Index for June 2010 is scheduled to be released on Friday, July 30, 2010, at 8:30 a.m. (EDT).
Information in this release will be made available to sensory impaired individuals upon request— Voice phone: (202) 691-5200; Federal Relay Service: (800) 877-8339.
This release incorporates annual revisions in seasonally adjusted Employment Cost Index (ECI) data for total compensation, wages and salaries, and benefit costs. Seasonally adjusted data for 2005-2009 were revised to reflect updated seasonal factors.
BLS news releases, including the ECI, are available through an e-mail subscription service at: www.bls.gov/bls/list.htm.
- 3 -
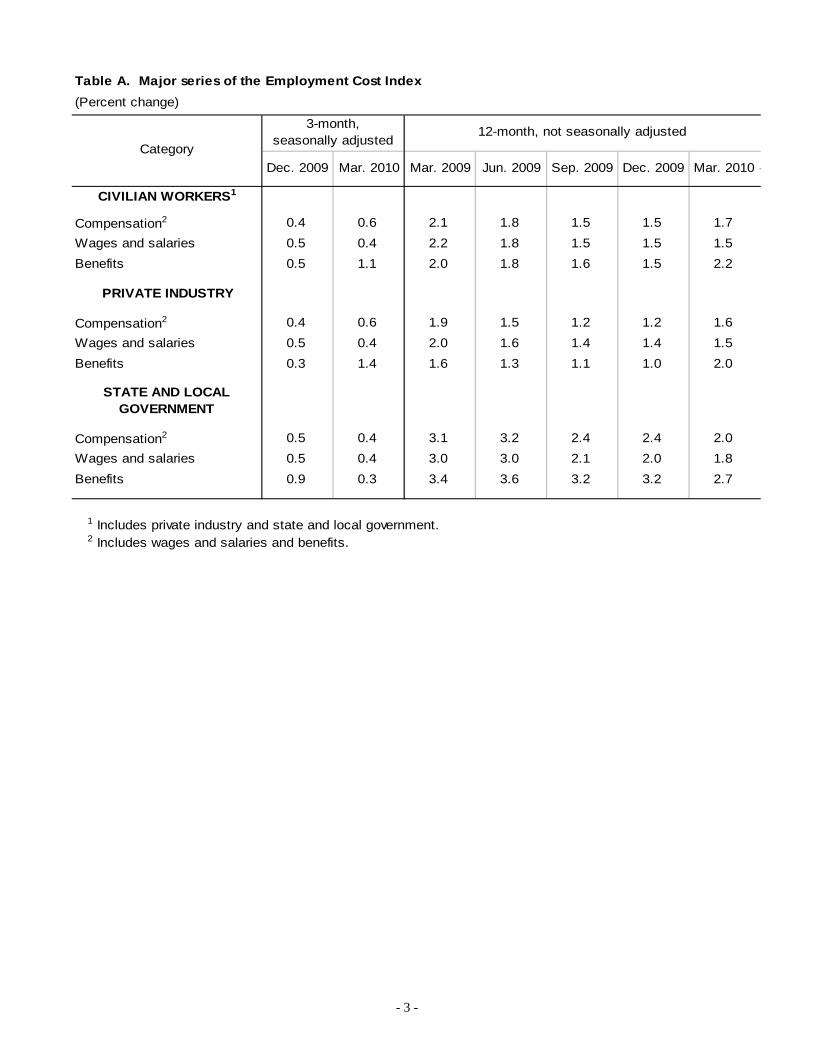
Table A. Major series of the Employment Cost Index
(Percent change)
CIVILIAN WORKERS1
Compensation2 0.4 0.6 2.1 1.8 1.5 1.5 1.7
Wages and salaries 0.5 0.4 2.2 1.8 1.5 1.5 1.5
Benefits 0.5 1.1 2.0 1.8 1.6 1.5 2.2
PRIVATE INDUSTRY
Compensation2 0.4 0.6 1.9 1.5 1.2 1.2 1.6
Wages and salaries 0.5 0.4 2.0 1.6 1.4 1.4 1.5
Benefits 0.3 1.4 1.6 1.3 1.1 1.0 2.0
STATE AND LOCAL GOVERNMENT
Compensation2 0.5 0.4 3.1 3.2 2.4 2.4 2.0
Wages and salaries 0.5 0.4 3.0 3.0 2.1 2.0 1.8
Benefits 0.9 0.3 3.4 3.6 3.2 3.2 2.7
1 Includes private industry and state and local government.2 Includes wages and salaries and benefits.
Mar. 2010
12-month, not seasonally adjustedCategory
3-month,seasonally adjusted
Sep. 2009 Dec. 2009Dec. 2009 Mar. 2010 Mar. 2009 Jun. 2009
- 4 -
TECHNICAL NOTE
The Employment Cost Index (ECI) measures the change in the cost of labor, free from the influence of employment shifts among occupations and industries. Detailed information on survey concepts, coverage, and methods can be found in BLS Handbook of Methods, Chapter 8, “National Compensation Measures,” Bureau of Labor Statistics, on the Internet at www.bls.gov/opub/hom/pdf/homch8.pdf.
Sample size
Data for the March 2010 reference period were collected from a probability sample of approximately 63,300 occupational observations selected from a sample of about 13,300 establishments in private industry and approximately 11,600 occupations from a sample of about 1,800 establishments in State and local governments.
Health insurance data
Data from the ECI that provides 12-month percent changes in employer costs for health insurance in private industry are also available at www.bls.gov/ect/sp/echealth.pdf.
Historical listings
Historical listings that provide all ECI data are available at www.bls.gov/ect/#tables. Included among these listings is one that provides continuous occupational and industry series. This listing uses the Standard Industrial Classification Manual and Census of Population series through 2005 and the North American Industry Classification System and Standard Occupational Classification from 2006 to the present. It provides the official series from the beginning of the ECI in 1975 through the current quarter. For more information on the criteria used in defining continuous series, see the article published in the Monthly Labor Review at www.bls.gov/opub/mlr/2006/04/art2full.pdf.
Employer Costs for Employee Compensation data
The costs per hour worked of compensation components, based on data from the ECI, are published in a separate news release titled "Employer Costs for Employee Compensation" (ECEC). The next ECEC release is scheduled for 10:00 AM EDT, Wednesday, June 9, 2010. Historical ECEC data are available in summary documents. Since the ECEC is calculated with current employment weights rather than the fixed weights used in computing the ECI, year-to-year changes in the cost levels usually differ from those in the ECI.
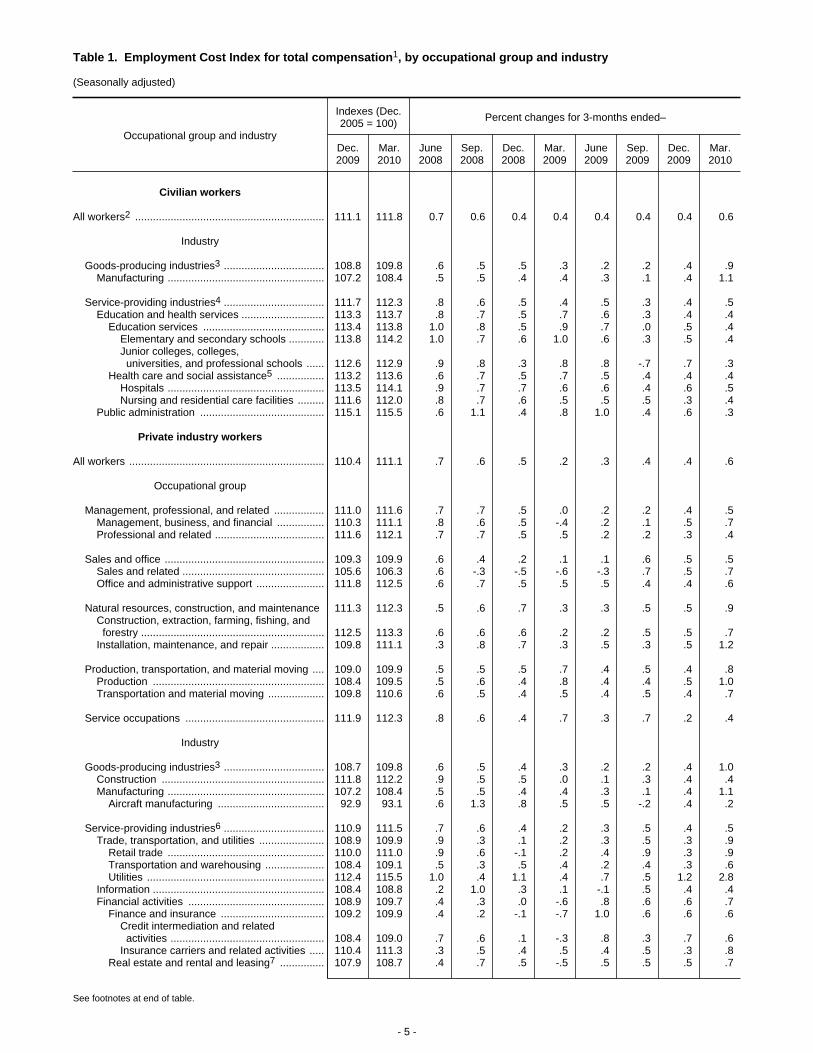
Table 1. Employment Cost Index for total compensation1, by occupational group and industry
(Seasonally adjusted)
Occupational group and industry
Indexes (Dec.2005 = 100) Percent changes for 3-months ended–
1 Includes wages, salaries, and employer costs for employee benefits.2 Includes workers in the private nonfarm economy except those in
private households, and workers in the public sector, except the federalgovernment.
3 Includes mining, construction, and manufacturing.4 Includes the following industries: wholesale trade; retail trade;
transportation and warehousing; utilities; information; finance and insurance;real estate and rental and leasing; professional and technical services;management of companies and enterprises; administrative and wasteservices; educational services; health care and social assistance; arts,entertainment and recreation; accommodation and food services; otherservices, except public administration; and public administration.
5 Includes ambulatory health care services and social assistance, notshown separately.
6 Includes the following industries: wholesale trade; retail trade;
transportation and warehousing; utilities; information; finance and insurance;real estate and rental and leasing; professional and technical services;management of companies and enterprises; administrative and wasteservices; education services; health care and social assistance; arts,entertainment and recreation; accommodation and food services; and otherservices, except public administration.
7 Seasonally adjusted indexes and 3-month percent changes for thisseries are being published for the first time with the 2010 seasonal adjustmentrevisions. Historical data for this series are published beginning with March2005.
NOTE: ECI series are reviewed annually for seasonality. Seasonal adjustmentis discontinued for the private wholesale trade compensation series as ofMarch 2010, as no identifiable seasonality was found for this series.
- 6 -
Table 2. Employment Cost Index for wages and salaries, by occupational group and industry
(Seasonally adjusted)
Occupational group and industry
Indexes (Dec.2005 = 100) Percent changes for 3-months ended–
1 Includes workers in the private nonfarm economy except those inprivate households, and workers in the public sector, except the federalgovernment.
2 Includes mining, construction, and manufacturing.3 Includes the following industries: wholesale trade; retail trade;
transportation and warehousing; utilities; information; finance and insurance;real estate and rental and leasing; professional and technical services;management of companies and enterprises; administrative and wasteservices; educational services; health care and social assistance; arts,entertainment and recreation; accommodation and food services; otherservices, except public administration; and public administration.
4 Includes ambulatory health care services and social assistance, notshown separately.
5 Includes the following industries: wholesale trade; retail trade;transportation and warehousing; utilities; information; finance and insurance;real estate and rental and leasing; professional and technical services;management of companies and enterprises; administrative and wasteservices; education services; health care and social assistance; arts,entertainment and recreation; accommodation and food services; and otherservices, except public administration.
NOTE: ECI series are reviewed annually for seasonality. Seasonal adjustmentis discontinued for the civilian nursing home and private retail trade wageseries as of March 2010, as no identifiable seasonality was found for theseseries.
- 8 -
Table 3. Employment Cost Index for benefits, by occupational group and industry
(Seasonally adjusted)
Occupational group and industry
Indexes (Dec.2005 = 100) Percent changes for 3-months ended–
1 Includes workers in the private nonfarm economy except those inprivate households, and workers in the public sector, except the federalgovernment.
2 Includes mining, construction, and manufacturing.3 Includes the following industries: wholesale trade; retail trade;
transportation and warehousing; utilities; information; finance and insurance;real estate and rental and leasing; professional and technical services;management of companies and enterprises; administrative and waste
services; education services; health care and social assistance; arts,entertainment and recreation; accommodation and food services; and otherservices, except public administration.
NOTE: ECI series are reviewed annually for seasonality. Seasonal adjustmentis discontinued for the private aircraft manufacturing benefit cost series as ofMarch 2010, as no identifiable seasonality was found for this series.
- 9 -
Table 4. Employment Cost Index for total compensation1, for civilian workers, by occupational group andindustry
1 Includes wages, salaries, and employer costs for employee benefits.2 Includes workers in the private nonfarm economy except those in
private households, and workers in the public sector, except the federalgovernment.
3 The index for this series is not strictly comparable with other series inthis table.
4 Includes mining, construction, and manufacturing.5 Includes the following industries: wholesale trade; retail trade;
transportation and warehousing; utilities; information; finance andinsurance; real estate and rental and leasing; professional and technicalservices; management of companies and enterprises; administrative andwaste services; educational services; health care and social assistance;arts, entertainment and recreation; accommodation and food services;other services, except public administration; and public administration.
6 Includes ambulatory health care services and social assistance, notshown separately.
- 10 -
Table 5. Employment Cost Index for total compensation1, for private industry workers, by occupational groupand industry
Other services, except public administration .......... 110.8 111.5 112.2 .8 -.3 .6 1.9 1.5 1.3
1 Includes wages, salaries, and employer costs for employee benefits.2 The index for this series is not strictly comparable with other series in
this table.3 Includes mining, construction, and manufacturing.4 Includes the following industries: wholesale trade; retail trade;
transportation and warehousing; utilities; information; finance and insurance;real estate and rental and leasing; professional and technical services;
management of companies and enterprises; administrative and wasteservices; education services; health care and social assistance; arts,entertainment and recreation; accommodation and food services; and otherservices, except public administration.
5 Includes ambulatory health care services and social assistance, notshown separately.
- 12 -
Table 6. Employment Cost Index for total compensation1, for private industry workers, by bargaining statusand census region and division
1 Includes wages, salaries, and employer costs for employee benefits.2 Includes mining, construction, and manufacturing.3 Includes the following industries: wholesale trade; retail trade;
transportation and warehousing; utilities; information; finance andinsurance; real estate and rental and leasing; professional and technicalservices; management of companies and enterprises; administrative andwaste services; education services; health care and social assistance; arts,entertainment and recreation; accommodation and food services; and otherservices, except public administration.
4 The states (including the District of Columbia) that comprise thecensus divisions are: New England: Connecticut, Maine, Massachusetts,New Hampshire, Rhode Island, and Vermont; Middle Atlantic: New Jersey,New York, and Pennsylvania; South Atlantic: Delaware, District of
Columbia, Florida, Georgia, Maryland, North Carolina, South Carolina,Virginia, and West Virginia; East South Central: Alabama, Kentucky,Mississippi, and Tennessee; West South Central: Arkansas, Louisiana,Oklahoma, and Texas; East North Central: Illinois, Indiana, Michigan, Ohio,and Wisconsin; West North Central: Iowa, Kansas, Minnesota, Missouri,Nebraska, North Dakota, and South Dakota; Mountain: Arizona, Colorado,Idaho, Montana, Nevada, New Mexico, Utah, and Wyoming; and Pacific:Alaska, California, Hawaii, Oregon, and Washington.
NOTE: The indexes for these series are not strictly comparable to thosefor the aggregate, occupation, and industry series. Dashes indicate datanot available.
- 13 -
Table 7. Employment Cost Index for total compensation1, for State and local government workers, byoccupational group and industry
1 Includes workers in the private nonfarm economy except those inprivate households, and workers in the public sector, except the federalgovernment.
2 The index for this series is not strictly comparable with other series inthis table.
3 Includes mining, construction, and manufacturing.4 Includes the following industries: wholesale trade; retail trade;
transportation and warehousing; utilities; information; finance and
insurance; real estate and rental and leasing; professional and technicalservices; management of companies and enterprises; administrative andwaste services; educational services; health care and social assistance;arts, entertainment and recreation; accommodation and food services;other services, except public administration; and public administration.
5 Includes ambulatory health care services and social assistance, notshown separately.
- 15 -
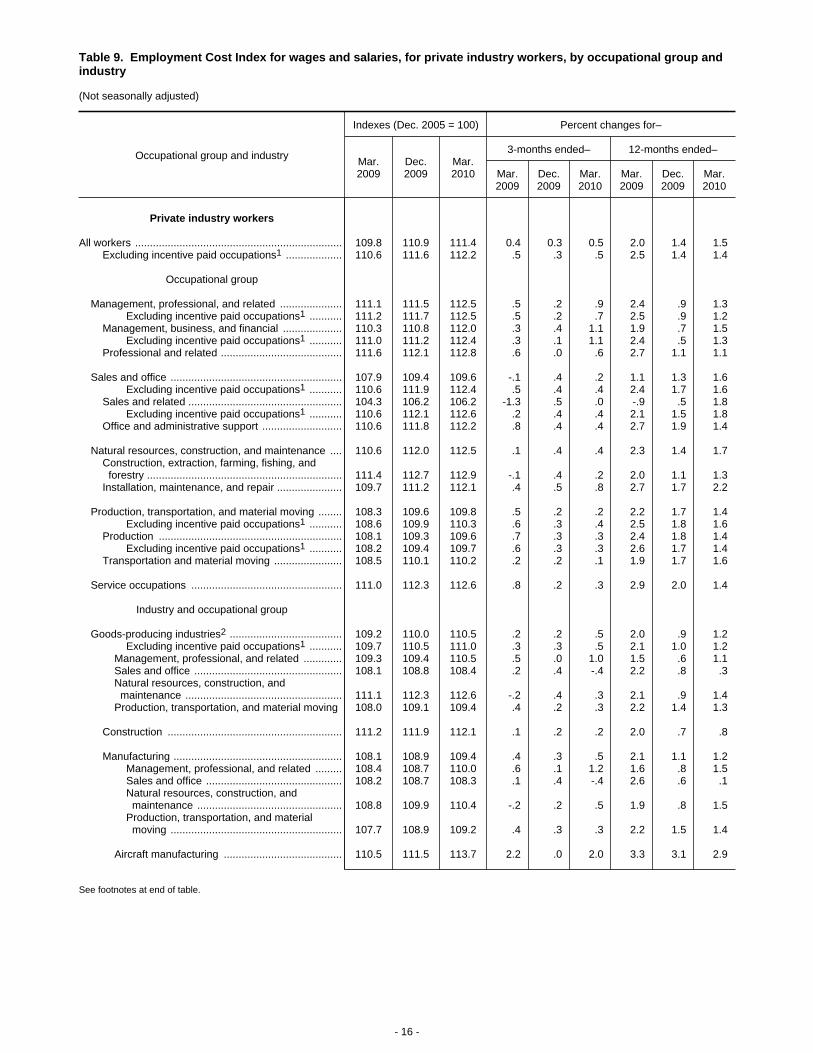
Table 9. Employment Cost Index for wages and salaries, for private industry workers, by occupational group andindustry
Other services, except public administration .......... 111.4 112.1 112.3 .9 -.4 .2 2.0 1.5 .8
1 The index for this series is not strictly comparable with other series inthis table.
2 Includes mining, construction, and manufacturing.3 Includes the following industries: wholesale trade; retail trade;
transportation and warehousing; utilities; information; finance and insurance;real estate and rental and leasing; professional and technical services;
management of companies and enterprises; administrative and wasteservices; education services; health care and social assistance; arts,entertainment and recreation; accommodation and food services; and otherservices, except public administration.
4 Includes ambulatory health care services and social assistance, notshown separately.
- 17 -
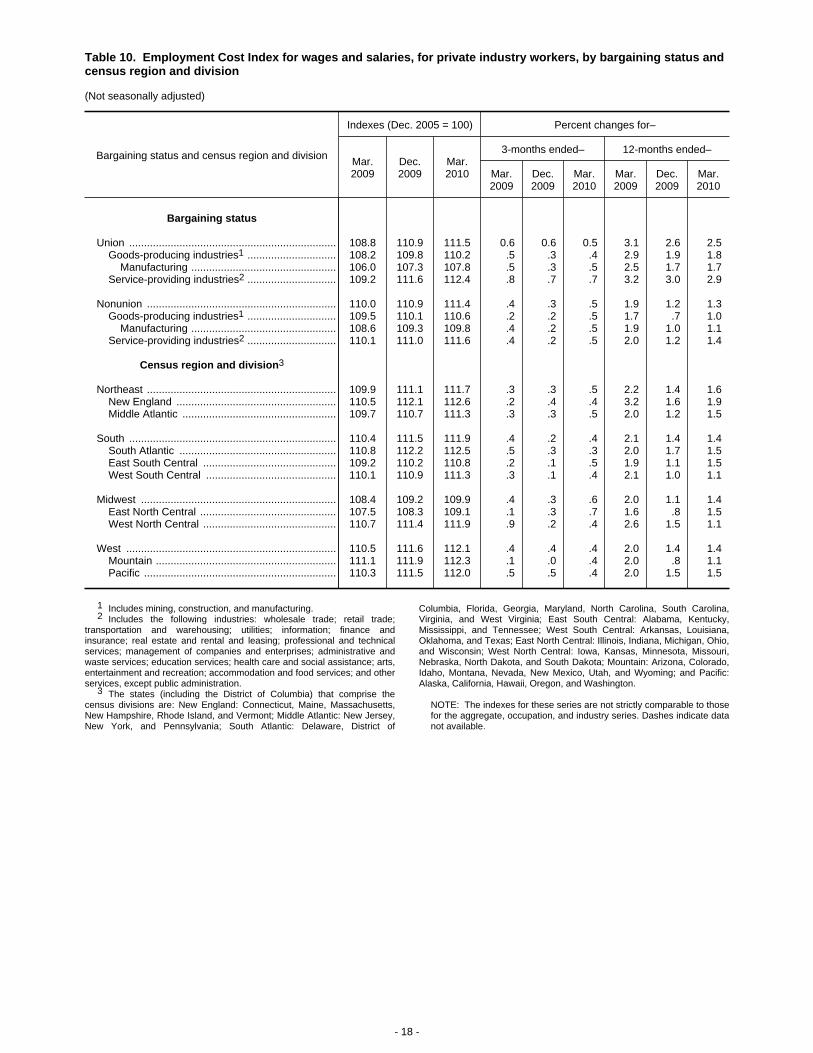
Table 10. Employment Cost Index for wages and salaries, for private industry workers, by bargaining status andcensus region and division
1 Includes mining, construction, and manufacturing.2 Includes the following industries: wholesale trade; retail trade;
transportation and warehousing; utilities; information; finance andinsurance; real estate and rental and leasing; professional and technicalservices; management of companies and enterprises; administrative andwaste services; education services; health care and social assistance; arts,entertainment and recreation; accommodation and food services; and otherservices, except public administration.
3 The states (including the District of Columbia) that comprise thecensus divisions are: New England: Connecticut, Maine, Massachusetts,New Hampshire, Rhode Island, and Vermont; Middle Atlantic: New Jersey,New York, and Pennsylvania; South Atlantic: Delaware, District of
Columbia, Florida, Georgia, Maryland, North Carolina, South Carolina,Virginia, and West Virginia; East South Central: Alabama, Kentucky,Mississippi, and Tennessee; West South Central: Arkansas, Louisiana,Oklahoma, and Texas; East North Central: Illinois, Indiana, Michigan, Ohio,and Wisconsin; West North Central: Iowa, Kansas, Minnesota, Missouri,Nebraska, North Dakota, and South Dakota; Mountain: Arizona, Colorado,Idaho, Montana, Nevada, New Mexico, Utah, and Wyoming; and Pacific:Alaska, California, Hawaii, Oregon, and Washington.
NOTE: The indexes for these series are not strictly comparable to thosefor the aggregate, occupation, and industry series. Dashes indicate datanot available.
- 18 -
Table 11. Employment Cost Index for wages and salaries, for State and local government workers, byoccupational group and industry
1 Includes workers in the private nonfarm economy except those inprivate households, and workers in the public sector, except the federalgovernment.
2 Includes mining, construction, and manufacturing.3 Includes the following industries: wholesale trade; retail trade;
transportation and warehousing; utilities; information; finance and
insurance; real estate and rental and leasing; professional and technicalservices; management of companies and enterprises; administrative andwaste services; education services; health care and social assistance; arts,entertainment and recreation; accommodation and food services; and otherservices, except public administration.
- 20 -
Table 13. Employment Cost Index for total compensation,1 and wages and salaries, forprivate industry workers, by area