Employment Effects of Waste Management Policies Final Report – January 2001 prepared for European Commission, Directorate-General Environment by Risk & Policy Analysts Limited, Farthing Green House, 1 Beccles Road, Loddon, Norfolk, NR14 6LT, UK Tel: +44 1508 528465 Fax: +44 1508 520758 Email: [email protected]Web: www.rpaltd.demon.co.uk in association with: Cambridge Econometrics Pearce Environmental Management Institute of Economic Research RPA REPORT - ASSURED QUALITY Project: Ref/Title J314/EC Waste Approach: According to Specification, taking into account comments made by the European Commission Report Status: Final Report Prepared by: Jan Vernon, Business Development Director Carolyn George, Researcher Approved for issue by: Meg Postle, Director Date: 25 January 2001 This report is published on chlorine free, 100% recycled paper.
Transcript
Employment Effects of Waste Management Policies
Final Report – January 2001
prepared for
European Commission, Directorate-General Environment
by
Risk & Policy Analysts Limited,Farthing Green House, 1 Beccles Road, Loddon, Norfolk, NR14 6LT, UK
Approach: According to Specification, taking into account commentsmade by the European Commission
Report Status: Final Report
Prepared by: Jan Vernon, Business Development DirectorCarolyn George, Researcher
Approved for issue by: Meg Postle, Director
Date: 25 January 2001
This report is published on chlorine free, 100% recycled paper.
Risk & Policy Analysts
- i -
Executive Summary
1. Background
The drive to create a more sustainable Europe has required governments, business andindividuals alike to examine the environmental and social impacts of current and proposedactivities and to balance these impacts against goals such as economic growth, lowinflation and full employment. The potential economic consequences of socially andenvironmentally driven regulations should also be examined, including the changes in costsfaced by business and consumers, the wider economic effects and any shifts in employmentpatterns.
Within the field of waste management, there has been considerable debate on theemployment effects that may occur from shifts in policy. It has been argued that recyclingand other waste management activities create employment, and in particular may provideinitial routes into employment for the socially excluded or the low skilled. At the sametime, the increased cost of waste management may lead to the loss of (potentially higherquality) jobs in other sectors of the economy. This study has been commissioned inresponse to the debate, to examine how the employment effects of waste managementpolicies can better be taken into account. Its key objectives are:
• to critically evaluate and complete existing information on employment activitiesrelated to waste management policies;
• to look at the issue of opportunity costs in terms of reduced job levels in othereconomic sectors; and
• to identify ways in which employment effects can usefully be integrated into evaluatingpolicy instruments in the field of waste management.
To assist in meeting these objectives, the study included three case studies. Theseexamined the impacts of changes in waste management policy on the chemicals industry,the impacts of introducing the directive on waste electrical and electronic equipment andthe impacts of Regulation (EEC)259/93 on the secondary metals industry.
2. Approaches for Assessing Employment and Wider Effects
To understand how employment effects can be better taken into account when evaluatingpolicies, it is necessary to recognise the different levels at which impacts may arise.Policies that influence waste management practices can have both positive and negativedirect effects. Expenditure on waste management generates direct employment in carryingout waste management activities. This employment may arise either in specialised wastemanagement firms or in companies in other sectors. Such expenditure may also havedirect negative effects for waste generators. For individual companies, higher wastemanagement costs could potentially increase prices, reduce market share, lower outputand potentially reduce employment. The negative effect for an individual firm, though,may be offset by gains in market share for other companies.
The Employment Effects of Waste Management Policies
- ii -
Indirect effects result from changes in direct employment and can also be either positiveor negative. If direct employment increases, then there is a ‘multiplier’ effect becausethose people directly employed spend their salaries on goods and services. This can createadditional employment in the sectors supplying those goods and services (or reduceemployment if direct employment decreases). However, if increased expenditure on wastemanagement means that there is less expenditure in other sectors, then jobs in thosesectors may be lost. This is known as a ‘crowding-out’ effect.
The interaction between the direct and indirect effects changes the structure andcomposition of the overall demand for labour in the economy. This is termed the netmacroeconomic effect and needs to be understood in order to evaluate the impact ofwaste management policies on total employment. Whether there is a net increase orreduction in aggregate employment depends upon two key factors. Firstly, whether wastemanagement activities are more labour intensive than other activities, so that expenditureon waste management results in more jobs than equivalent expenditure elsewhere.Secondly, whether waste management expenditure feeds through into higher productprices and lower real wages, which may affect labour supply.
The current basis for policy appraisal is cost-benefit analysis (CBA) which usually focuseson the sectors that will be directly impacted by a policy. As a result, the analysis may failto capture significant indirect effects on other sectors of the economy. In addition, thetheory underlying CBA assumes that no social costs arise from unemployment. For thesereasons, there may be a need to supplement any CBA with information on eitheremployment effects or wider macroeconomic effects. Potential approaches include:
• supply side approaches: using data on the supply of labour, for example the numberof tonnes of waste per job for a particular type of treatment, to determine directemployment effects ;
• demand side approaches: using data on jobs per unit of expenditure, to estimate directand first order indirect employment effects, but not overall net effects; and
• macroeconomic modelling approaches: modelling the interactions between direct andindirect employment effects to determine the impact that changes in a sector's supplyand demand for goods and services will have on employment and the wider economy.
Each type of approach has advantages and disadvantages. These include the scope of theindirect impacts taken into account, the accuracy of results and the complexity of modelspecification. It should be noted though that the supply and demand side approaches onlycover employment effects that are directly (or indirectly via multipliers) linked to themeasure under consideration. They cannot be used to answer questions as to what theeffect of a particular measure is on the overall (macroeconomic) level of employment. Thisquestion can only be answered using macroeconomic modelling approaches, even thoughthe results of such models are subject to significant uncertainty. These issues areexplored through an examination of supply-side data on waste management-relatedemployment and then through the case studies.
Risk & Policy Analysts
- iii -
3. Waste Management-Related Employment Activities
Statistical data collected at the European level provides poor quality information on wastemanagement-related employment because:
• the classifications used exclude a wide range of waste related activities; and• few countries submit regular, up-to-date information.
Specialised studies, whether they are country-, waste stream-, or activity-specific, can beused to provide more information. However, differences in approaches and definitionscan lead to wide-ranges and incompatibility in the data generated.
Taking account of the range of data available from both these sources, the probable levelof employment in the EU in organisations for which waste management is a primaryactivity totals around 200,000 to 400,000. This represents approximately 0.2-0.4%of total EU employment. There is also waste-related employment in other sectors,though numbers of jobs are small compared to the specialised waste management sector(possibly another 3000 to 12000 jobs). Discussions with industry indicate that there is atendency for increased out-sourcing of waste management to specialist companies.
Information on the nature of waste management employment is limited and appearssomewhat contradictory. Some studies indicate that jobs are of a higher quality in wastemanagement than in some other environment-sector activities. Other data indicate thatwaste management jobs are mainly low-skilled and low-paid. The poorest quality jobsappear to be in collection and transport, manual sorting and composting. Higher-qualityjobs are associated with the more technology-intensive, specialised activities.
Data on trends in employment in waste management are ambiguous. Industry expertsindicate that there is a general trend towards fewer, but higher quality, jobs arising fromproductivity increases as processing technologies improve. The trend for loweremployment per tonne of waste may, however, be compensated by a growth in absolutewaste quantities and potentially by increasing levels of control over waste disposal.
4. The Chemicals Sector
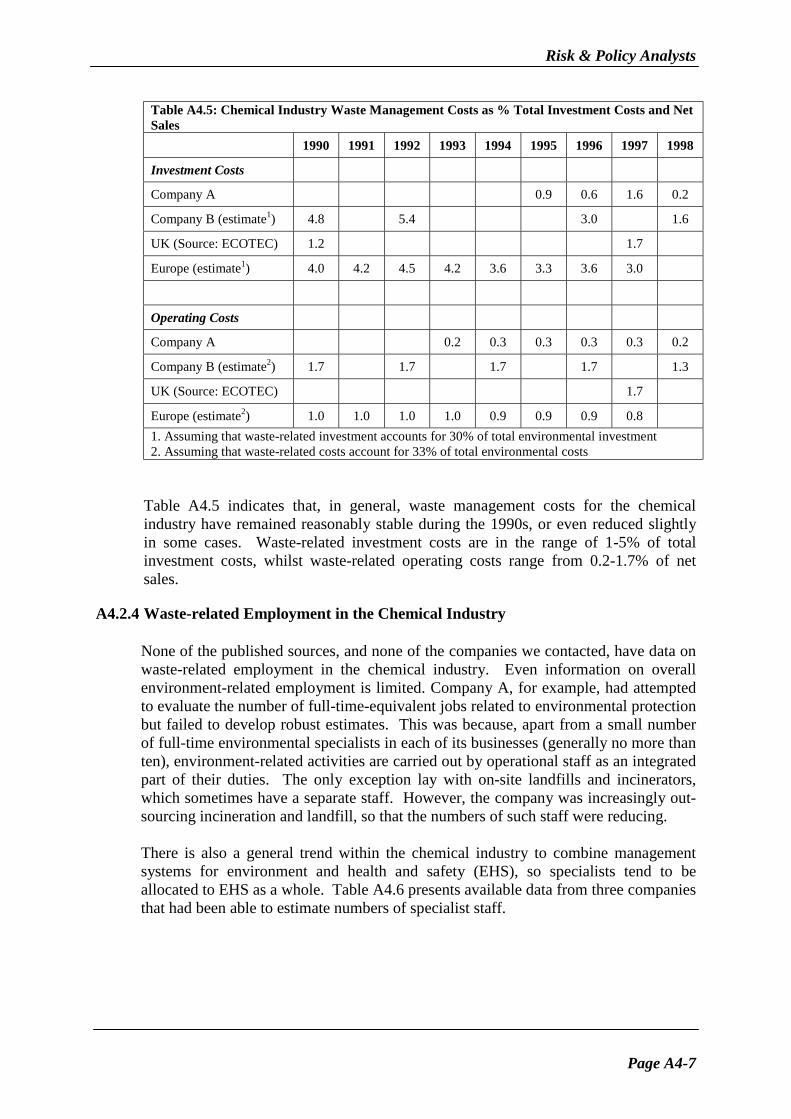
There are approximately 36,000 chemical companies within the EU, employing a total ofaround 1.7 million people. The industry is expanding, with a 25% increase in productionin real terms between 1990 and 1998, but employment has reduced by 14% over the sameperiod due to efficiency improvements and outsourcing. During the 1990s, a number ofwaste management policies were adopted at EU level with potential impacts on thechemicals industry. Over this period, waste-related investment accounted for between 1%and 5.4% of total chemical industry investment, and remained fairly constant whilst otherinvestment reduced. Waste-related operating costs range from 0.2-1.7% of net sales; alevel that is unlikely to have had a significant impact on profits.
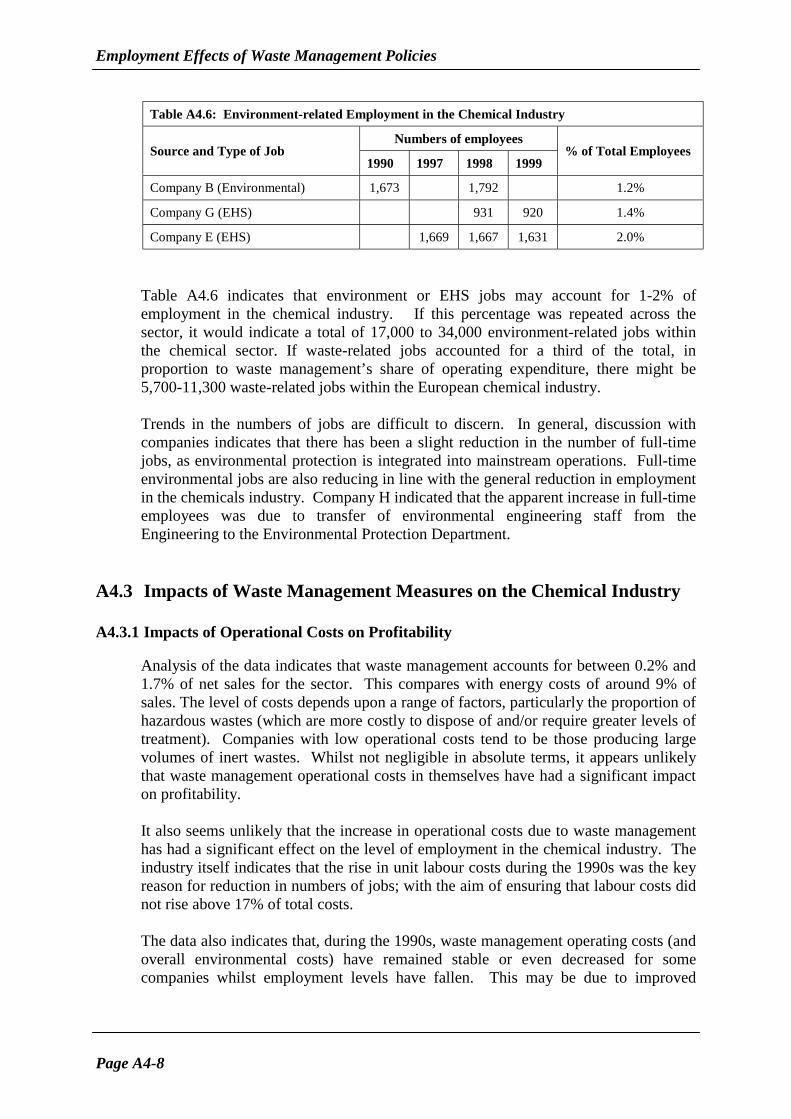
There are an estimated 5,700 to 11,300 waste-related jobs within the European chemicalindustry. There is little evidence that waste management measures have increased the
The Employment Effects of Waste Management Policies
- iv -
numbers of such jobs; the trend-towards out-sourcing may even have reduced them. Anysuch reduction may have been compensated, though, by increased investment andemployment in the waste management sector. Only limited information is available oninvestment by the waste management sector in relation to chemical industry waste, but upto 5,000 jobs may have been created in hazardous waste management.
Macroeconomic modelling using the Cambridge Econometrics E3ME model indicates afall in total employment of 18,000 jobs across the EU over the period from 2000 to 2005arising from the impact of waste management costs on prices and the EU share of worldmarkets. This estimate, less than 0.01% of the EU total, excludes any jobs created inhazardous waste management and is also subject to uncertainties in the data.
5. Waste Electrical and Electronic Equipment
Whilst EU Directives on Waste Electrical and Electronic Equipment (WEEE) are still atthe proposal stage, broadly similar legislation concerning WEEE has already beenimplemented in the Netherlands. The Netherlands legislation allows manufacturers andimporters to fulfil their responsibility for collection and re-processing of WEEE eitherindividually or collectively; almost all have signed up to one of two collective schemes.
The available data on the Netherlands indicates that WEEE-related operating costsaccount for well below 0.5% of turnover for electrical and electronics companies. As thecosts of the scheme are re-charged to consumers in the form of a levy on prices of newproducts, they are therefore unlikely to have a significant impact on profitability.Investment costs for the electrical and electronics industry are minimal. Because of theway the collective schemes are organised, the majority of the investment has been madeby the transport and recycling firms contracted by the schemes
Data on the employment effects of the WEEE legislation are limited; in the Netherlands,the consensus is that few, if any, jobs have been created other than a small number in localauthorities. Additional employment in administration of the collective schemes has beenkept to a minimum to reduce costs. Meanwhile, the organisation of the collective schemeshas resulted in significant consolidation in the recycling sector with the displacement ofsmall organisations, including social welfare organisations. The loss of jobs in these smallorganisations has probably been offset by increases in employment in the larger firms todeal with additional throughput of WEEE.
The E3ME model was used to model the macroeconomic implications of adopting WEEElegislation across the EU, based on the type of approach taken in the Netherlands. Thepolicy is predicted to increase direct employment across the EU by roughly 2,900 jobsafter five years. A further 2,000 plus indirect jobs are predicted to result from multipliereffects. There would also be net increases in GDP across Europe as a whole. Again, thesefigures should be viewed with some degree of caution due to data uncertainties and modelassumptions.
Risk & Policy Analysts
- v -
6. Secondary Metals Industry
The non-ferrous secondary metals recycling industry employs a workforce ofapproximately 100,000 people in 15,000 enterprises. Statistics show that 40% of non-ferrous metal produced in the EU is currently based on recycled materials, and thisproportion is increasing. Council Regulation (EEC)259/93 on the supervision and controlof shipments of wastes within, into and out of the European Union implements the BaselConvention but has a much broader scope. The level of control imposed on wastedepends on the intended treatment, its destination and its position within three lists thatdistinguish waste according to its degree of hazard (green/amber/red lists). Exports ofamber and red listed wastes outside the OECD are banned. Most non-ferrous scrapmetals traded internationally are green listed, but some are amber listed.
The Regulation may have both positive and negative impacts on employment in theindustry. It has been suggested that many companies have had to hire at least one extraperson in order to deal with the extra administration and legal aspects that have arisenfrom the Regulation, indicating over 6,000 additional jobs. However, the extra burdenof administration and delays in trade due to additional notification procedures may havecontributed to contract failures restricted trade with some countries.
The E3ME model was used to assess the effects of a theoretical situation, where there isno international trade in amber-listed metals (in reality there is only a ban on trade to non-OECD countries). The model suggests that an initial gain of over 6,000 jobs will changeto a loss of nearly 2,000 jobs in total EU employment five years later. The effects on GDPare negative in each of the five years, with the greatest impact on occurring in year twowith a predicted decrease in GDP of €390 million (0.006%). Due to the nature of theassumed situation, the data uncertainties and inherent model assumptions, these resultsshould also be viewed with caution. The effects of waste legislation may be masked orseem overstated by market developments which are unrelated to regulation.
7. Integration of Employment and Wider Effects into Appraisals
A simple comparative assessment was made of how well the estimates generated throughthe E3ME econometric model might compare to those derived through the application ofa supply-side and demand-side analysis. Table 1 provides a summary of the predicted jobnumbers under each of the three approaches.
Table 1: Comparison of Predicted Employment and GDP Effects in EU 15Supply-Side Demand-Side MacroeconomicCase Study
DirectEmployment
Only
Direct andFirst Round Indirect
Employment
TotalEmployment
GDP(€ million)
Chemicals Industry 5,700 -11,300 18,774 -18,000 -660WEEE Directive 1,500 to 2,000 14,150 5,600 145Metals RecyclingIndustry
6,250 5,020 -1,700 -368
The Employment Effects of Waste Management Policies
- vi -
The differences between the various predictions are considerable. The supply-side anddemand-side figures reflect only direct and first order indirect employment creation. Theydo not consider the negative macroeconomic effects that arise from reducedinvestment/expenditure on other goods and services. Only by expanding the analysis tothe macroeconomic level can the influence of changes in output or price increases,changes in investment and changes in consumer spending be addressed.
This comparison then raises questions as to when the various approaches might be themost appropriate as a means of supplementing the results provided by CBAs. Ourconclusion is that for those policies which are likely to have only small impacts on theprices faced in the directly regulated markets, use of the simpler methods for estimatingchanges in direct and indirect employment should be sufficient. It should be made clearthough that these methods are only partial analyses which can only give an idea abouteffects directly linked to a measure but do not give a full picture of net employment effectson a macroeconomic level. However, where a policy will have significant compliance costimplications for one or more sectors of the economy, then use of the more sophisticatedmacroeconomic modelling approaches may be important for supplementing CBA results.This latter scenario is one that is likely to arise often in the context of waste management,and understanding the impact of a policy on the linkages between different sectors maybe essential to understanding the overall employment and economic effects. This shouldnot hide the fact that due to the high complexity of macroeconomic issues, results of suchstudies should be viewed with a certain degree of caution.
It must be emphasised that none of these approaches alone will provide decision makerswith an indication of whether or not the benefits of a proposed policy would outweigh thecosts. To achieve this, the outputs of such analyses would need to be presented as partof a comprehensive CBA.
8. Conclusions
A key finding of the study is that the relationship between waste management policies andemployment is more complex than the ongoing debate might indicate. Although wastemanagement policies may increase demand for waste management services, this does notnecessarily result in additional jobs. Instead, technology substitution for labour, increasedproductivity and consolidation in the waste management sector may severely constrain jobcreation. There is also some evidence that these factors could reduce employmentopportunities for the socially-excluded in waste management.
The three case studies indicate that the impact of waste management policies on thecompetitive position of the sectors they regulate has been limited to date. Wastemanagement accounts for a small proportion of total expenditure and companies subjectto regulation naturally act to minimise the costs of compliance. Some companies alsoseem to have gained efficiency benefits through focusing on waste minimisation.
Overall, the study demonstrates that waste management measures are likely to have onlya small effect, either positive or negative, on employment. The detailed way in which apolicy is implemented and complied with is most likely to determine the direction and
Risk & Policy Analysts
- vii -
scale of the effect, and this is often the hardest to predict. The most significant effectsmay arise outside the directly-regulated sector, making the use of approaches that takeaccount of indirect effects particularly important.
The Employment Effects of Waste Management Policies
- viii -
Abbreviations
CBA - Cost-benefit analysisCEA - Cost-effectiveness analysisGE - General equilibrium modelFTE - Full time equivalentGDP - Gross domestic productI-O - Input-output modelMSW - Municipal solid wasteNVMP- The Association of Metal ProducersPACE - Pollution abatement cost estimatesWEEE - Waste electrical and electronic equipment
Risk & Policy Analysts
- ix -
CONTENTS
Executive SummaryAbbreviations
1. INTRODUCTION
1.1 The Policy Context 11.2 The Links between Employment and Waste Management 11.3 Objectives of the Study 21.4 Approach 21.5 Organisation of the Report 4
2. APPROACHES FOR ASSESSING EMPLOYMENT AND WIDER EFFECTS
2.1 Introduction 52.2 Treatment of Employment and Wider Economic Effects in CBA 72.3 Extension of the Partial Equilibrium Framework of CBA 82.4 Supply-Side Approaches 92.5 Demand-Side Approaches 92.6 Macroeconomic Modelling Approaches 122.7 Non-Monetary Assessment Approaches 14
3. WASTE MANAGEMENT-RELATED EMPLOYMENT ACTIVITIES
3.1 Introduction 153.2 Levels of Employment 163.3 Nature of Employment 193.4 Impacts of Waste Management Policies on Employment 19
4. THE CHEMICALS SECTOR
4.1 Background 214.2 Data Analysis 214.3 Impacts of Waste Management Measures on the Chemical Industry 224.4 Application of the E3ME Model 23
5. WASTE ELECTRICAL AND ELECTRONIC EQUIPMENT
5.1 Background 255.2 Data Analysis 255.3 Impacts of WEEE Policy Measures 265.4 Application of E3ME Model 27
6. THE NON-FERROUS METALS RECYCLING INDUSTRY
6.1 Background 296.2 Data Analysis 306.3 Impacts of Waste Management Policies on the Non-Ferrous Metals
Recycling Industry 306.4 Application of the E3ME Model 31
Employment Effects of Waste Management Policies
- x -
7. INTEGRATION OF EMPLOYMENT AND WIDER ECONOMIC EFFECTS INTO CBA7.1 Introduction 337.2 Supply-Side Analysis 337.3 Demand-Side Analysis 357.4 Macroeconomic Analysis 367.5 Implications for Integration of Results into CBA-Based Appraisals 37
8. SUMMARY AND CONCLUSIONS
8.1 Introduction 398.2 Information on Employment Activities in Relation to Waste Management 398.3 Opportunity Costs in Other Economic Sectors 408.4 Integration of Employment and Wider Effects into Appraisals 428.5 Links Between Employment and Waste Management 43
9. REFERENCES 45
Annex 1: Approaches for Assessing Employment and Wider Economic EffectsAnnex 2: The E3ME Model Used in the Case Study AnalysisAnnex 3: Analysis of Data on Employment Activities Related to Waste ManagementAnnex 4: The Chemicals SectorAnnex 5: Waste Electrical and Electronic EquipmentAnnex 6: The Non-Ferrous Metals Recycling Industry
Risk & Policy Analysts
Page 1
1. INTRODUCTION
1.1 The Policy Context
The move towards creating a sustainable Europe has required governments, businessand individuals alike to consider their impacts on both the environment and societymore generally. Not only do the environmental and social impacts of actions need tobe taken into account, they also should be balanced against economic goals such ascontinued economic growth, low inflation and full employment. In recent years,employment in particular has become a priority in the work of European institutions.
Our understanding of the linkages that exist between economic growth and sociallyand environmentally driven activities has improved over the past few years. There iswider recognition of the potential consequences of environmental regulations,including not only changes to the costs faced by business and consumers but also thewider economic effects, such as shifts in employment patterns.
The key problem for policy-makers is that traditional cost-benefit analysis (CBA)based appraisals may fail to address the full range of likely impacts. This isparticularly relevant for employment. CBA typically treats labour as a valuableresource, with the market price of labour acting as an indicator of its value.Therefore, when a policy measure increases the amount of labour used by a firm toperform its activities this is considered as a social cost within a CBA, as the labourused to implement the policy is now no longer available for other productivepurposes. In essence, there is an opportunity cost to using labour, and this is capturedby the CBA.
This approach makes perfect sense in a situation where labour is relatively mobile andflexible, and where employees are free to move from one job to another at the marketwage. However, it is less acceptable where the policy causes changes in the demandfor labour that affect categories of workers who would normally be unemployed (as aresult of structural unemployment). In such cases, traditional CBA will understate thebenefits of a policy that raises the net demand for labour, and some adjustment to theanalysis should be considered.
1.2 The Links Between Employment and Waste Management
Along with a range of other organisations, the European Commission has, on variousoccasions, examined the links between environmental and employment policies toexploit possible cross-benefits. This includes a Communication on Environment andEmployment – Building a Sustainable Europe (COM/97/0592). From thesedocuments, a number of hypotheses on the links between employment and wastemanagement have emerged. These include:
• well designed environmental policies can offer opportunities to create positiveeffects on employment;
Employment Effects of Waste Management Policies
Page 2
• in the field of waste management, employment benefits may be particularlysignificant due to the high labour-intensity of processes for collection, sorting andrecycling of wastes;
• employment in waste management is often unskilled and low paid, with poorerquality jobs in waste replacing higher quality jobs elsewhere;
• such jobs, though, may provide an initial route back into employment for thesocially-excluded;
• there are significantly higher risks associated with certain waste-relatedoccupations, such as hand-sorting, and such activities should not be encouraged;
• waste management measures can give rise to a range of costs and related impacts,including impacts on the competitive position of industry, which can in turn affectemployment levels;
• advanced technologies and waste minimisation measures may be encouragedthrough the implementation of high standards for waste treatment, these can havesignificant business benefits.
1.3 Objectives of the Study
The aim of this study is to provide additional information to the EnvironmentDirectorate-General on the employment impacts of waste management policies. Theobjectives, as set out in the Technical Annex to the terms of reference, are to:
• critically evaluate and complete existing information on employment activitiesrelated to waste management;
• look at the issue of opportunity costs in terms of reduced job levels in othereconomic sectors; and
• identify ways in which employment effects can usefully be integrated intoevaluating policy instruments in the field of waste management.
1.4 Approach
The study involved the following analytical steps:
• review of available data on waste management and employment;• analysis of job types within waste-related employment1;
1 Due to the commissioning of a study by DG Enterprise, which placed greater emphasis on the quality of
jobs in the environmental sector, this issue is not considered in depth in this report. For furtherinformation see AK Wien (2000).
Risk & Policy Analysts
Page 3
• determination of the opportunity cost impacts of waste management andevaluation of the macroeconomic effects on employment across the EU throughthe use of case studies.
In this context, opportunity costs refer to the benefits, or gains, that individualcompanies or industry sectors may have to forego as a result of having to invest inwaste management rather than some other aspect of production. At a sectoral level,expenditure on waste management may reduce the level of growth that a sector is ableto achieve as the money is diverted from investments that could increase output orreduce costs, for example. At the macroeconomic level, this may result in reducedeconomic growth across the economy as a whole, or simply result in shifts in relativegrowth rates between different sectors (for example, increasing growth in the wastemanagement sector compared to manufacturing).
These changes in investment (which act as changes in demand for the goods andservices produced by different sectors) may also result in the net creation or loss ofemployment. This in turn may have an impact on the demand for different goods andservices, as levels of employment affect levels of consumption. This pattern mayrepeat itself for several iterations.
In some cases, such sectoral and macroeconomic effects may be minimal and will becaptured by the traditional cost-benefit analyses used in the appraisal ofenvironmental policies. In other cases, a cost-benefit analysis will be insufficient, asit will fail to capture the significant economic impacts occurring in sectors other thanthose which will be directly affected by the change in policy. Because wastemanagement policies are often cited as examples of the latter case, the failure toaccount for such wider effects may result in policies being adopted which do notproduce net economic benefits.
In order to determine the degree to which opportunity costs might be arising andhow the wider economic and employment impacts of waste management policiescould best be integrated into policy appraisal, three case-studies were selected fordetailed examination. These were:
• Chemicals industry: an examination of the cost implications of wastemanagement policies for the chemicals sector;
• Producer responsibility: waste electrical and electronic equipment: thispolicy-based case study assesses the implications for the electrical and electronicsindustry of producer responsibility, focusing on the Netherlands decree on brownand white goods, implemented in 1999; and
• Non-ferrous metals recycling industry: a sector-based case study examining theimplications of waste shipment regulations on the non-ferrous metals recyclingindustry.
The outputs of the desk based case study work was fed into an econometrics-basedmacroeconomic model, the E3ME model, to evaluate the net employment and widereconomic impacts of the policies for the EU economy as a whole. Based on this
Employment Effects of Waste Management Policies
Page 4
analysis of the impact of waste management policies in macroeconomic terms, thestudy then focused on how best to incorporate such predictions into policy appraisals.This involved an analysis of the current approaches for valuing employment (rangingfrom qualitative to monetary) to determine the relative merits of different approachesas ways of supplementing the cost-benefit analyses that normally form the basis forsuch appraisals.
1.5 Organisation of the Report
The remainder of this report sets out the key findings of the study:
• Section 2 reviews the approaches available for addressing employment and widereconomic issues in policy appraisals;
• Section 3 presents an analysis of available statistics and other data sources onwaste management-related employment (referred to in Section 2 as supply-sideinformation);
• Sections 4 to 6 consider the three case studies and the predicted net employmentand net economic effects of the waste management policies, using the E3MEmodel;
• Section 7 draws conclusions on the appropriateness of the different approaches forestimating employment and wider economic effects; and
• Section 8 provides a summary of the conclusions drawn from the study.
The main report is supplemented by additional data and detailed discussion in theAnnexes. This includes a more in-depth consideration of the various approaches forassessing employment and wider economic effects (Annex 1) and details of keyassumptions underlying the E3ME econometric model (Annex 2). Additional,relevant data on employment in the waste sector is given in Annex 3. Finally, moredetailed discussions of the case study findings are presented in Annexes 4 to 6.
Risk & Policy Analysts
Page 5
2. APPROACHES FOR ASSESSING EMPLOYMENT AND WIDEREFFECTS
2.1 Introduction
One of the key aims of this study is to identify ways in which the net employment andwider macroeconomic effects of waste management policies can be incorporated intopolicy appraisals. A number of different approaches could be adopted to do this,ranging from the use of current waste-related employment and economic growthstatistics to the application of sophisticated predictive modelling techniques.However, the appropriateness of adopting the different approaches varies, dependingon the nature of the waste management policies in question.
This section provides an overview of the available approaches, highlighting what theycover and some of the key advantages and drawbacks in the context of wastemanagement. The starting point for this review is an examination of how these issuesare treated in cost-benefit analysis (CBA) which acts as the basis for most policyappraisals. A more detailed discussion of the approaches is presented in Annex 1.
2.2 Treatment of Employment and Wider Economic Effects in CBA
2.2.1 CBA and Employment
The theory underlying the application of CBA (and CEA) is that of neo-classicalwelfare economics2. Essentially, this theory assumes that there are no social costs orbenefits associated with changes in employment because such changes only representtransfers of activity within a sector, or within the economy more generally.
The result of this assumption is that changes in employment are not taken into accountin CBAs. In reality of course, the above assumptions do not hold for manyeconomies. Instead, structural unemployment exists and labour is not fully mobile.As a result, the introduction of a new policy may create new employmentopportunities and not simply result in individuals transferring from one job to another.When a net gain in jobs occurs across the economy, real social benefits will arise froma policy’s introduction. Such gains are only likely to arise, however, when a policy islikely to affect either the supply of, or demand for, the goods and services producedby one or more sectors.
One approach that could be adopted to account for employment effects is toincorporate estimates of the economic value of changes in employment into theestimated costs or benefits. This would require first estimating the number of jobs thatwould be created or lost by introducing a policy and then multiplying this by theeconomic value associated with each job. Theoretically speaking, this economicvalue is defined in terms of the net income gained from the new job, plus anyimprovements in quality of life, minus the value of any lost leisure time. Because
2 See also OECD (1992) for a discussion on the theory and practical application of CBA.
Employment Effects of Waste Management Policies
Page 6
deriving estimates for each of these factors may be difficult, wage rates are often usedas a proxy for this value. In order to correctly reflect economic value, the wage rateused for this purpose should reflect the opportunity costs of labour. In economieswhere social policy subsidises certain types of labour, market wage rates may notequate to the opportunity costs of labour3. However, within the EU there isconsiderable mobility of labour and relatively low levels of structural unemployment,so the market wage rate is likely to act as a reasonable approximation of theopportunity cost of labour (i.e. it will reflect the value of output foregone if the labourwas engaged in other productive activities).
Thus, wage rates can provide a measure of the economic value of the changes inemployment arising from the changes in waste management policy. However, it mustbe recognised that direct changes in labour costs should be captured by a CBA in anyevent. Changes in labour costs will form one aspect of estimated changes in costs toproducers of complying with a new policy. In other words, they will be included inestimates of any investment in capital equipment required and in changes in operatingcosts arising from use of the new equipment. As a result, adding a further sum toestimated compliance costs to reflect changes in employment will result in doublecounting for any direct employment changes and for some indirect changes. Thisproblem will be compounded if separate estimates are also prepared on the widereconomic effects (indirect and induced) stemming from changes in demand andsupply relationships (see Section 2.2.2).
The alternative is to measure and present data on changes in employment in terms ofthe number of jobs created or lost. Such changes, whether positive or negative, can beestimated using a number of different approaches. For the purposes of this study,these have been grouped into three categories (based on OECD, 1997):
• Supply-side approaches: these rely on the use of current employment data, forexample, tonnage of waste treated per full-time job equivalent, to estimate thenumber of jobs to be created by a change in policy;
• Demand-side approaches: these predict the number of jobs that will be created(or lost) as a result of new investment or an increase (or decrease) in demand forthe goods and services provided by a particular sector (e.g. the waste managementsector); and
• Macroeconomic approaches: these estimate the net changes in employment thatwill occur as a result of changes in both demand and supply relationships.
Table 2.1, overleaf, gives an overview of the approaches in each category. Each ofthe above approaches can be used to develop estimates of the number of jobs that maybe directly created or lost as a result of a change in waste management policies. Anexample of such direct effects would be the creation of jobs in the recycling sectorand the loss of jobs in landfill and other forms of disposal as a result of a policysetting increased recycling targets.
3 For example, this may be the case in a developing country context.
Risk & Policy Analysts
Page 7
Table 2.1: Approaches to Assessing Employment and Wider Economic Effects
Approach Scope of Analysis Methodology Data Sources
Analysis ofmicroeconomic data andjob losses surveys
Survey data
Direct positiveemployment effects
Calculation of manpowerper unit of expenditure
Statistics on jobs per unitof expenditure
Direct and indirectpositive employmenteffects
Input-output andmultiplier basedcalculations usingchanges in final demand
Statistics onenvironmentalexpenditures and input-output tables
Demand-sideApproaches
Direct and indirectpositive or negativeeconomic growth effects
Analysis ofmicroeconomic data,investment and growthsurveys
Survey data
EconometricandMacroeconomic models
Net employment andGDP effects ofenvironmentalexpenditures
Behaviour equations usedto link changes inexpenditure to changes ininter-sectoral supply anddemand
Econometric models andinput-output equations
Computablegeneralequilibriummodels
Net employment andGDP effects ofenvironmental measures
Modelling of long-runchanges in supply anddemand equations untilall markets reachequilibrium
Detailed data on inter-sectoral linkages,including input-outputdata
Source: Based on OECD, 1997 (pg 22).
However, the impact of creating or losing a net number of jobs may go beyond thedirect gains or losses. As a previously unemployed person takes a new job, hisexpenditure on a range of goods and services increases, with this in turn leading to anincrease in demand for those goods and services. This increase in demand may, insome cases, be significant enough to lead to the creation of other new jobs, which inturn will lead to further increases in expenditure and, hence, which may lead to afurther round of job creation. The first round of jobs created through increaseddemand are referred to as indirect employment, while the subsequent rounds areinduced employment.
2.2.2 CBA and Wider Economic Effects
In addition to generating direct, indirect and induced employment effects, wastemanagement policies can also result in indirect and induced economic effects acrossthe economy as a whole. When a waste management policy has significant impactson the costs of producing a particular good by one sector, then this may affect thedemand for substitute and complementary goods and services produced by othersectors. When the change in demand for the substitute or complementary goods andservices is accompanied by a price change, then this may lead to indirect effects onproducers and consumers of the substitute or complementary good. These indirect
Employment Effects of Waste Management Policies
Page 8
effects may then have an impact on the behaviour of producers and consumers,leading to further changes in demand and potentially a further round of inducedeffects. Such effects may be either positive or negative.
Because most CBAs focus on the sectors that are directly affected by the introductionof a new policy, they will not capture any impacts arising from shifts in demand andhence changes in the prices faced in other sectors4. In many cases, this failure toconsider the impacts of a measure on related markets will not be significant, as theimpacts themselves will be small in magnitude compared to the costs incurred by thedirectly affected sector. However, in other cases, it may result in a significantmiscalculation of the net economic effects of introducing a new policy. In particular,the more difficult it is to substitute the regulated good or service with another good orservice, the greater may be the costs arising to producers and consumers in the relatedmarkets, and in secondary markets.
These indirect and induced effects may be either negative or positive in nature,depending on the supply and demand relationships that are affected by the new policy.As a result, a policy leading to significant direct compliance costs for one sector maygenerate net gains for the economy, as a whole as a result of changes in spending andhence the demand for different goods and services. Equally, it may create net lossesto the economy, for example, as a result of investment being diverted from measuresthat would increase output or productivity.
The picture is therefore complex within the context of waste management. In manycases, the traditional CBA approach of focusing on the directly affected sectors willbe sufficient to capture the economic effects arising from the introduction of a newpolicy. However, the more sophisticated demand-side or macroeconomic approachesmay be needed in other cases to gain a fuller understanding of the net economiceffects to other sectors and the economy as a whole.
For this reason, the relative advantages and disadvantages of the approaches describedin Table 2.1 are examined in more detail below.
2.3 Extension of the Partial Equilibrium Framework of CBA
One approach to dealing with the failure of CBA to account for wider economiceffects is to extend the boundaries of the analysis so that it covers all of the relatedmarkets likely to be affected by the policy. Each of these markets would then beexamined individually to determine any changes in costs to producers and consumersstemming from changes in the directly affected sector. Any estimated changes canthen be added to those calculated for the directly affected sector.
The advantage of this approach is that it ensures that any estimates of direct andindirect effects are soundly based in economic theory and are consistent with thosegenerated for the directly affected sector. It may also help retain a focus to the
4 Also referred to as related markets - see Annex 1 for a more detailed discussion on why such indirect
and induced effects occur.
Risk & Policy Analysts
Page 9
appraisal, enabling any estimated indirect effects to be accounted for within the CBAitself.
The disadvantage is that it may be difficult to properly scope the range of markets thatmay be affected by a change in policy. In addition, this type of approach will not beable to capture the impacts which any net changes in employment may give rise, eitherin terms of indirect and induced employment effects or the changes in spending and,hence, demand to which any net change in employment may lead.
2.4 Supply-Side Approaches
Approaches falling under this heading use data on the number of people currentlyemployed in various waste management activities (i.e. the supply of labour) togenerate estimates of the number of jobs that might be created or lost from shifts inactivities. The types of data presented in Section 3 are essentially supply-side data.For example, the data include figures for the volume of waste treated per employeefor different activities, which would allow the impacts on total waste relatedemployment of a change in policy to be predicted.
Many issues arise though in the adoption of this type of approach, including:
• the a lack of reliable data on the level of employment generated per unit of wastefor many of the activities (discussed in Section 3);
• difficulties in capturing indirect employment effects and a failure to captureinduced effects; and
• new policies may be implemented in a different manner than previous policies,meaning that data for existing levels of employment are invalid (as in the WEEEcase study presented in Section 5).
The use of supply-side data may, however, be useful in providing order-of-magnitudeestimates of the direct employment effects arising from a change in wastemanagement policy, where the use of more sophisticated methods is constrained.
2.5 Demand-Side Approaches
2.5.1 Overview
Three different types of demand-side approach can be identified from the literature:
• input-output models for predicting total net direct and indirect output andemployment effects;
• multipliers for predicting the number of direct, indirect and induced jobs createdas a result of new expenditure. Related to these are manpower to expenditureratios for estimating the number of direct and indirect jobs created; and
Employment Effects of Waste Management Policies
Page 10
• econometric analyses for estimating the impacts that expenditure on compliancecosts has had on sector and economic productivity and employment.
2.5.2 Input-Output Models
Input-output (I-O) models provide a systematic description of the interdependenciesthat exist between sectors in the economy. These models indicate, for any one sector,how much input from other sectors (and in what proportions) is required to produce aunit of output. For example, the production of chemicals requires a range of inputssuch as energy, raw materials, engineering equipment, as well as waste disposal,transport and other services. In turn, the production of energy, raw materials,engineering equipment, etc. will require a number of inputs, including chemicals.
Because I-O models map these interrelationships, they can be used to examine howchanges in the total output of one sector (or in household consumption or governmentexpenditure) is likely to impact on the demand for inputs from other sectors. Inaddition, the basic set of input and output tables that provide the core to such modelscan be expanded to include both labour and the production of waste by-products, toenable the impacts of policies on these two aspects to be examined.
I-O models can be used to compare two distinct states of the economy; pre- and post-policy implementation. The difference between the two ‘states’ represents the neteconomic effect (expressed in terms of a change in output) of implementing the wastemanagement policy in question. These estimated net economic effects could then beadded to estimates of the compliance costs falling on the regulated sectors forinclusion in a CBA-based analysis. This would allow the wider economic effects tobe taken into account in comparing the total (net) costs and benefits of a proposedwaste management policy.
The use of I-O models may be important to understanding the full economicimplications of a policy when it is likely to affect not only supply and demand in thedirectly affected sectors but also in related markets, as they can provide informationon impacts at both the sectoral and macroeconomic level (Fankhauser & McCoy,1995). However, their application for the purposes of inclusion in a CBA should beundertaken with care, as they ignore any changes in demand that may occur as a resultof price effects (including changes in relative prices), and may not be flexible enoughto take into account changes in production relationships (for example as a result oftechnology changes). The result is that they may miscalculate the net employmentand economic effects stemming from a policy change.
2.5.3 Multiplier-Based Approaches
Multipliers essentially provide a measure of the extent to which a change in directoutput or direct employment will result in additional changes in output oremployment, through further rounds of spending (i.e. indirect and induced effects).For example, it has been estimated that every €1 increase demand results in a totalincrease in output of €1.1 in France (OECD, 1997). The output multiplier in this caseis 1.1.
Risk & Policy Analysts
Page 11
Multipliers are often derived through the manipulation of input-output tables, with theaim of providing an alternative means of capturing the (positive) direct, indirect andinduced effects of changes in final demand for particular goods and services (Abelson,1996). In practice, they can be defined at different levels. For example, they can bedeveloped so as to capture only direct and indirect effects. Or, they can be developedto also include induced effects, thereby providing a more comprehensive picture of neteconomic or employment effects. Within the context of waste management,multipliers that capture induced effects are likely to yield better estimates of neteconomic effects or changes in employment. This is because they will take intoaccount changes arising from activities such as the sub-contracting or contracting-outof services; key characteristics of the waste management sector.
Although multipliers can be used to provide ‘order of magnitude’ estimates of thegrowth in output or income resulting from the expenditures required to comply with achange in new policy, their use warrants some care. Multipliers assume that alladditional spending is new spending (rather than transfers from one set of goods andservices to another) and, therefore, acts as a net addition to real output. Whereexpenditure is not new but a transfer, then multipliers will overestimate effects onboth output and employment.
Furthermore, multipliers will change in value as a result of shifts in technology. Forexample, a waste management policy encouraging end-of-life recovery might result inchanges to products so that they require fewer inputs during production and lessprocessing prior to re-use. In this case, the application of old-technology basedmultipliers will lead to incorrect estimates of total output and employment effects.
2.5.4 Manpower to Expenditure Ratios
Related to the use of input-output based multipliers is the use of manpower toexpenditure ratios (which are effectively the same but more crudely derived). Theseratios provide an indication of the number of direct and indirect jobs created as aresult of the new expenditure (capital and operating) required by a policy.
The argument underlying the use of this approach is that it provides a good reflectionof the more tangible employment impacts arising from a policy, and does not confusethese effects with several rounds of downstream effects. As a result, these ratiosresult in a better indication of the actual relationships between different environmentalpolicies and employment and avoid reliance on assumptions concerning marketequilibrium and full employment common to the macroeconomic modellingapproaches. Such ratios are developed in two recent studies undertaken for theCommission on the numbers of jobs created by changes in environmental policy(WRc, 1999 and Heady et al, 2000).
However, manpower to expenditure ratios suffer from the same disadvantages asinput-output based multipliers. They fail to capture induced demand effects andignore any price-related adjustments that may occur more as a result of changes indemand and supply relationships. In addition, they assume that expenditure leads tonew jobs, rather than transfers in activity. As a result, they may result in eithersignificant over- or under-estimates of employment effects.
Employment Effects of Waste Management Policies
Page 12
2.5.5 Change in Productivity Estimates
The final form of demand side analysis is the use of econometric analysis to examinethe impacts that environmental regulations have had on both sectoral and economy-wide productivity. A number of studies has been undertaken in the US on this issue,with the aim of determining whether environmental regulations essential ‘crowd out’investment on more growth generating activity, thereby reducing the productivity ofthose affected. The research has had two different purposes. The first is to determinethe degree to which compliance costs estimates capture the full costs incurred bycompanies in meeting environmental requirements. The second is to provideestimates of the sum of the direct and indirect costs to the economy as whole arisingfrom the need to divert expenditure towards meeting environmental requirements.
Although most of the research carried out on this issue has found that the effects havebeen minimal5, such analyses again focus only on the impacts of direct changes indemand. They do not take into account the full interrelationships that exist within aneconomy. As a result, they do not recognise that increased investment inenvironmental goods and services may offset some of the estimated decreases inproductivity experienced by the regulated sectors.
2.6 Macroeconomic Modelling Approaches
2.6.1 Overview
Only the macroeconomic modelling approaches recognise that the implementation ofwaste policies by individual companies affects their behaviour as both ‘buyers’ and‘sellers’, in turn affecting interactions at inter- and intra-sectoral levels. As a result,they are the only approaches that are able to predict the full net effects generated by achange in waste policy.
Two different types of models can be used for analysing effects at the macroeconomiclevel. These are:
• econometric models; and• general equilibrium (GE) models.
2.6.2 Econometric Models
Econometric models may be either macroeconomic or sectoral in coverage and areessentially applicable to analysing short to medium term policy impacts. They are allhighly complex, involving numerous equations and time lags to allow for a dynamicanalysis. Examples of such models include HERMES and the E3ME model used inthis study.
5 See for example OECD (1997) and Worldwatch Institute (2000).
Risk & Policy Analysts
Page 13
The models are generally based upon an input-output based accounting framework towhich behavioural data are added (OECD, 1997). As with input-output models,changes in final demand are taken as the starting point but are then linked toproduction or input demand functions that incorporate capital, energy, labour andintermediate goods. Through these functions and the associated impacts on demand,prices and real wages, new supply and demand relationships (equilibria) are reachedfor the various sectors. Once these new relationships have been calculated, changesin output and employment can be determined at a sectoral and macroeconomic level.
One of the key advantages of this type of model is that they are developed to reflectactual behaviour, drawing upon historic data for these purposes. In addition, althoughthey start from a demand perspective, they do take into account the likely effects thatchanges in demand will have on prices and on the substitution of one input ofproduction for others (e.g. labour for energy). There are, however, drawbacks to theiruse when compared to general equilibrium models, including:
• the short forecasting time-frame over which they are considered appropriate(generally between five and seven years in order to ensure that the underlyingassumptions reflect changes in the structure of the economy);
• their reliance on measures such as changes in gross domestic product (GDP) as aproxy for economic costs;
• the use of fixed production relationships that may not take into account recenttechnical innovations and associated changes in market structure; and
• because they are governed mainly by demand rather than supply considerations,they may be unable to reflect the full extent of impacts on unemployment.
2.6.3 General Equilibrium Models
In contrast to the econometric models (which are driven by changes in aggregatedemand), GE models are driven by changes in price. They consider both supply anddemand interactions and are capable of dealing with longer planning horizons. As aresult, analysts can examine long-term movements in economic variables (i.e. GDPand employment) as an economy moves towards a new equilibrium. In addition, theyare more compatible with CBA, as welfare is explicitly accounted for by assumingthat individuals maximise their utility (or satisfaction) for a given level of income.
The models are based on the concept underlying I-O models, but the system iscompleted by including all relationships needed to represent the related flows withinthe economy. Within these models, production in each sector is a function of inputprices and the output price, while consumption becomes a function of income andprices, with prices determined by the model. Computable GE models can be used tocompare two distinct states of the economy; pre-policy versus post-policy, with thedifference between the two ‘states’ representing the net (economic) effects ofimplementing the policy in question.
Employment Effects of Waste Management Policies
Page 14
The inherent complexity of CGE models means that the amount of time and effortrequired to collect the basic data, and build a suitable model, is often prohibitive. Asa result, no model can actually include all possible markets, with many markets oftenaggregated together and other simplifications made to create a useable and practicalmodel. As a result, models are generally tailored to particular needs and functionalforms are chosen with an eye to reducing the number of elasticity-related parametersthat must be estimated. This usually means that most CGE models have an I-O modelcore that defines production relationships in terms of intermediate inputs, and the onlyflexibility in production is usually some substitution between capital and labour asinputs.
In addition, most CGE models start from the assumption that there is nounemployment, i.e. the labour market is in equilibrium. Consequently, any change inemployment is a result of voluntary decisions on the part of the workforce. Thisaspect of CGE models causes studies to reach different conclusions regarding theimpact on employment of implementing environmental policies, and subsequentlyleads the OECD (1997) to advise that the results of studies using such models shouldbe considered with reservations.
2.7 Non-Monetary Assessment Approaches
In contrast to the use of quantitative, economics-based approaches for examining theimpacts of waste management policies on employment and the economy moregenerally, it is often suggested that more qualitative approaches are applied. Forexample, a qualitative assessment could describe impacts in terms of:
• number of long-term full-time job equivalents;• number of jobs by occupational skill category;• change in employment relative to regional or national average rates;• the quality of the job created (e.g. taking into account associated health risks); and• the average wage rates associated with the jobs created.
Such assessments could be based on the recommendations that exist in a range ofappraisal guidelines concerning the assessment of equity and distributional issues6
(see for example Ontario Ministry of Environment & Energy, 1996 and US EPA,1999). Alternatively, an approach based on the use of simple '+' and ' -' scores couldbe adopted to provide an indication of the direction and significance of likely effects.A further approach has been suggested by the Worldwatch Institute (2000) based onconsideration of the life-cycle effects of a proposed policy (see Annex 1 for anexample), although such approaches may need to be expanded to ensure that theyreflect indirect and induced economic and employment effects.
6 Where equity relates to ‘fairness’ and distribution to the share of costs or benefits to sub-populations
within society arising from the introduction of a policy.
Risk & Policy Analysts
Page 15
3. WASTE MANAGEMENT-RELATED EMPLOYMENT ACTIVITIES
3.1 Introduction
3.1.1 Waste Management and the Environment Sector in Europe
A range of studies has been carried out on the environment industry and the wastemanagement sector in Europe, attempting to define the scope and size of the industry,levels of employment, prospects for growth and the impact of environmental policies.A range of statistical data is also gathered at European and national level. The keyfindings of these sources are outlined in Annex 3.
A considerable degree of uncertainty exists over the current size of the EUenvironment industry, owing to limited data availability, variations in definitions ofthe sector and possible differences in the bases used by different Member States forrecording environmental expenditure. An estimate of €110 billion for turnover in theEU environment industry was derived by ECOTEC (1997) from three estimates,which ranged from €105.9 – €133 billion.
Within the environment industry, the turnover of waste management activities isestimated at approximately €44 billion, with operating expenditure accounting for80% of this (€35.2 billion) and capital expenditure 20% or €8.8 billion (ECOTEC1999). The waste management industry encompasses many different organisations,ranging from specialist multi-national companies to small-scale social enterprises,with significant public sector (mainly local government) involvement. The sector isin a state of flux, with consolidation in some areas (e.g. municipal waste collection inthe UK) but a large number of small companies remaining.
3.1.2 Quality of Data on Waste-Related Employment
Drawing conclusions on the level and quality of employment related to wastemanagement is hampered by the poor quality of the statistical data available.Particular problems arise from the classifications used, which tend to cover businesseswhere waste management is a primary activity but exclude companies where wastemanagement is a subsidiary activity and, potentially, some waste managementactivities in the public sector (see Annex 3 for a fuller explanation and list of wastemanagement activities). Specialised studies, whether they are country-, waste stream-or activity-specific, can be used to provide more information. However, differencesin approaches and definitions can lead to wide-ranging and incompatible data.
Sections 3.2 and 3.3 examine the level and nature of employment in the wastemanagement sector respectively, while 3.4 looks at the overall balance of employmenteffects due to waste legislation.
Employment Effects of Waste Management Policies
Page 16
3.2 Levels of Employment
3.2.1 Overall Employment
Table 3.1 summarises the available statistics on employment in the environmentindustry and the waste management sector. There is reasonable consistency betweenOECD (1997) and ECOTEC (1997) on the overall level of employment in theenvironment industry in Europe, totalling somewhere between one and three million.This amounts to between 0.4% and 1.2% of overall employment.
Because of the definitional and statistical difficulties noted above, it is likely thatofficial statistics under-estimate the level of employment in waste management by aconsiderable margin. All of the studies of waste management employmentsummarised in Annex 3 give higher numbers than Eurostat’s figures for employmentin the three main NACE6 categories, with the multiple ranging from 1.2 (for Sweden)to seven for the UK. The Association of Cities for Recycling (1999) derives a figurefor total employment in waste management of 3 – 3.5 million, which is significantlyhigher than estimates from other sources and is at the upper boundary of ECOTEC’sestimate of total environment industry employment.
Taking account of the range of data within the statistics and studies on wastemanagement, the probable level of employment in organisations for which wastemanagement is a primary activity totals around 200,000 to 400,000. Thisrepresents 20-40% of total employment in the environment sector and, therefore,approximately 0.1-0.4% of total employment. In addition to companies where wastemanagement is a primary activity, there is also waste related employment in non-specialised companies in other sectors. Indications are, though, that this employmentis small compared to the specialised waste management businesses (maybe another3,000 to 12,000 jobs). Data on waste management expenditure by industry, togetherwith industry expertise, indicates that there is a tendency for companies to outsourcewaste management to specialist companies, reducing the need for in-houseemployment. Under these circumstances, employment related to waste managementin industry should, in theory, be included in the main NACE categories.
3.2.2 Employment in Recycling
A number of the studies reviewed in Annex 3 provide information on the employmentcontent of specific waste management activities. Three sources give data on levels ofemployment in recycling. The Association of Cities for Recycling (1999) gives afigure of 300,000, equivalent to 10-11% of total waste management employment.Statistics Sweden (1999) and Profeta (1996) indicate that 21% and 20% of wastemanagement jobs are in recycling for Sweden and France respectively.
6 NACE is a system of statistical classification, used for assessing economic activity and
competitiveness. The three main NACE categories which cover data relating to waste management are37 (recycling), 51.57 (wholesale of waste or scrap) and 90 (sewage and refuse disposal, sanitation andsimilar activities). For further explanation see Annex 3.
Table 3.1: Overview of Statistical Employment Data
Sources: 1ECOTEC 1997, 2OECD 1997, 3Statistics Netherlands 2000, 4Instituto Nacional de Estatistica do Portugal, 5Statistics Sweden 1999,6 The core industries are considered to contain 100% environmental industry, mainly waste treatment, wastewater and recycling. The core industries are the NACE codeheadings 25.12, 37, 51.57 and 90.7Eurostat Structural Business Statistics, 8Association of Cities for Recycling 1999, 9Statistics Denmark 1999, 10Profeta 1996, 11DTI 1997, 12CWESAR 199913 Data in source is given as 8,500 for Scandinavia, so figure has been divided between Denmark, Finland, Sweden relative to total population.
Employment Effects of Waste Management Policies
Page 18
Information on the breakdown of employment in municipal waste recycling for theUK is given by Waste Watch (1999). This indicates that 41% of recycling jobs are incollection and sorting, with 56% in reprocessing. Community sector jobs account forthe remaining 3%. This study also notes that the relationship between increasedrecycling tonnage and increased employment is not directly proportional. Jobcreation will also be affected by factors such as the efficiency of the processes and thechanges made to accommodate the increased tonnage (Waste Watch, 1999).
3.2.3 Employment in Social Enterprises
Although they are often present in the form of scattered associations and are poorlystructured, social enterprises may be significant in some areas for the level ofemployment they generate, their employment of the socially-excluded and thetonnage of waste that they handle. In the UK, for example, the Community RecyclingNetwork has over 250 member organisations, the majority of which run weeklykerbside collection schemes, covering 4.1 million households (20% of the UK).Employment in these organisations in 1999 comprised 1,000 full time and 660 parttime staff (Waste Watch, 1999).
An assessment of the numbers of jobs associated with social enterprises carrying outrecycling was undertaken by CWESAR (1999); its findings are summarised Annex 3.The study’s total estimate of around 35,000 jobs appears reasonably consistent withthe Association of Cities for Recycling’s total of 300,000 recycling jobs, which wouldimply that just over 10% of recycling jobs are in social enterprises. The numbers lookhigh, however, compared to the Eurostat data on recycling employment. They implythat 13% of French recycling jobs and 45% of Swedish recycling jobs are in socialenterprises. The authors of the CWESAR report note that their work was carried outrapidly with limited resources, and that it is based on discussions with key players inthe sector and their own knowledge rather than statistical sampling. Nevertheless, itdoes appear to indicate that social enterprises may make a significant contribution toemployment in recycling.
3.2.4 Links Between Employment Levels and Waste Volumes
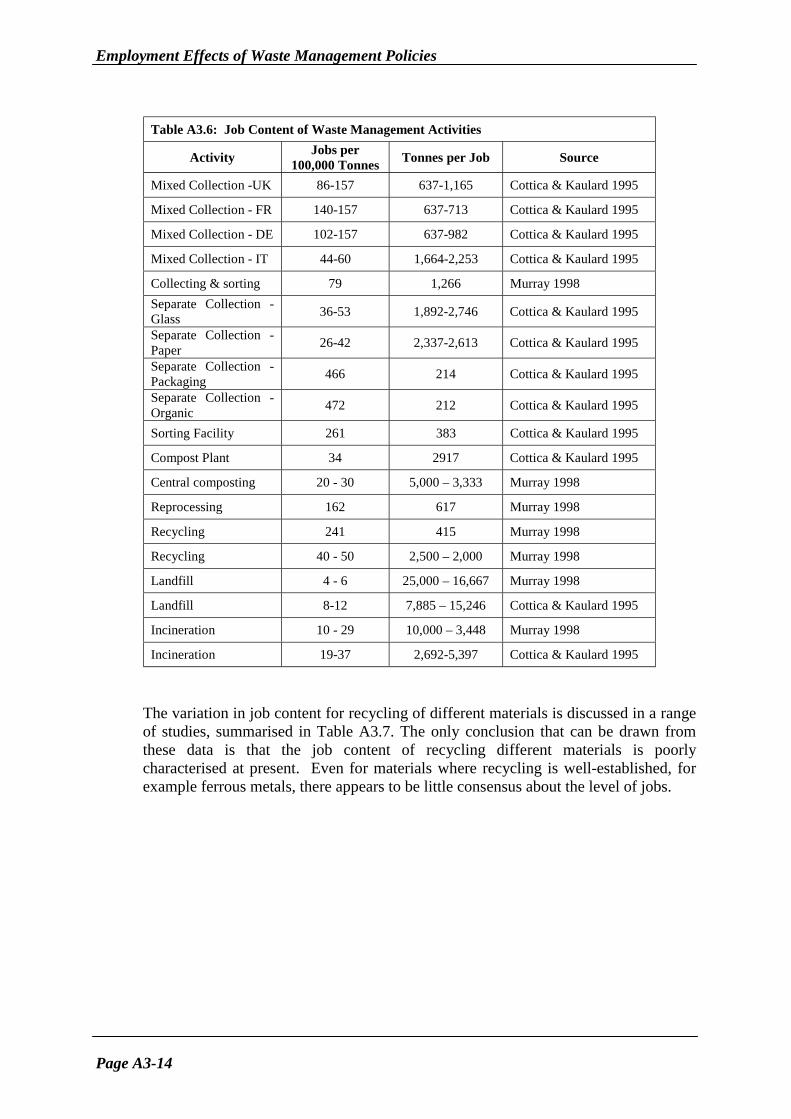
A range of studies provides information on the job content of specific wastemanagement activities, in terms of numbers of jobs per volume of waste or thevolume of waste associated with a single job.
The level of employment in waste management, in terms of tonnes of waste per job,appears to vary significantly between different activities. Although there are someinconsistencies in the data, there is general agreement that the most labour-intensiveactivities (<500 tonnes of waste per job) are manual sorting, some separate collectionprocesses and waste and scrap wholesale. The least labour intensive activities (over1,000 tonnes of waste per job) are landfill, incineration and composting together withmost forms of collection. Recycling and reprocessing fall in between these twoextremes, depending upon the materials involved and the processes used. Because ofthese differences, the impacts of waste management policies on employment levelswill be highly dependent on the methods used to implement the policies.
Risk & Policy Analysts
Page 19
3.3 Nature of Employment
3.3.1 Job Quality
Information on the nature of waste management employment is limited. The poorest-quality jobs appear to be in collection and transport, manual sorting and composting,with landfill also towards the lower end of the spectrum. Higher-quality jobs areassociated with the more technology-intensive, specialised activities. One factor notcovered by the studies in Austria and Sweden is the contribution of wastemanagement to employment of the socially-excluded. This has long been claimed asa benefit, particularly of recycling jobs, but little evidence has been produced.Perhaps, though, the importance of social enterprises in recycling is one indicator thatsuch an effect is occurring. Further information on the quality of employment inwaste management can be found in Annex 3 and AK Wien (2000).
3.3.2 Salaries
Some of the studies reviewed in Annex 3, for example Fritz et al. (1997), concludethat waste management jobs are less well paid than the average. Experts within theUK waste industry, by contrast, indicated that salaries in the industry were generallyabove average. Statistics Sweden (1998) found that salaries were reasonably in linewith the labour market average, but varied by activity and gender. Eurostat datasuggest that labour costs per employee are somewhat higher for NACE category37.10 (metal recycling) than for the other categories, although in France costs arehighest for the wholesale of waste and scrap. On average, labour costs in recyclingdecreased over the period 1995-1997, although this varies between countries. Austria(for NACE 37.10), Belgium, Denmark and Luxembourg saw reductions whilst theUK and Sweden saw cost increases. It is not clear whether these changes are specificto recycling or follow overall labour market changes. Industry experts believe thatoverall labour costs for the sector will reduce over time, as more processes aremechanised. Mechanisation, however, is likely to replace the most unskilled and thuslowest-paying jobs, so that average labour costs per employee may increase.
3.4 Impacts of Waste Management Policies on Employment
3.4.1 Trends in Employment Over Time
The OECD (1996) considered the role of the environment industry in creating jobs,and data presented suggest that there has been a positive effect with the growth of theindustry. However, it is recognised that there are also job losses, with the overallemployment change being the sum of jobs created by the growing environmentalgoods and services industry and those either created or destroyed by the impacts ofenvironmental regulation on other industries. The aggregate direct and indirectbenefits and costs, gains and losses due to the impacts of regulation proved difficult tomodel.
Employment Effects of Waste Management Policies
Page 20
Data on trends in employment in waste management are ambiguous. Industry expertsindicate that there is a general trend towards reduced but higher quality employment,in the course of productivity increases as processing technologies become moresophisticated. This trend for lower employment per tonne of waste may, however, becompensated by a growth in absolute waste quantities and potentially by increasinglevels of control over waste disposal. Unfortunately, the limited nature of the datamakes interpretation of trends over time difficult.
3.4.2 Impacts of Specific Policies
A number of the studies reviewed in Annex 3 have attempted to model the impacts ofparticular waste management policies upon employment. The demand-side approachtaken by WRc (1999) in evaluating the impacts of EU environmental policies wasbased on manpower per unit expenditure. As noted in Section 2, it was restricted tothe direct and first round indirect employment created as a result of specificexpenditures related to environmental policies. The policies studied included theHazardous Waste Incineration Directive, Packaging and Packaging Waste Directiveand the Directive on End-of-Life Vehicles.
The overall conclusion of this report was that environmental policies have a small butpositive impact on employment. Waste management policies tend to be more labourintensive than air or water directives, and the relative level of expenditure per FullTime Equivalent (FTE) is lower. WRc highlight that there is often a choice availablebetween strategies to reach the same environmental goals, and these may havevariable labour intensities associated with them. An assessment, made in the case ofthe Directive on End of Life Vehicles, demonstrated that employment can vary by afactor of five depending on the strategy used.
Such studies provide very specific data on the employment effects of specificenvironmental policies, and recognise that waste management policies may have bothnet positive and negative effects on employment, both within the waste managementsector and total employment.
Risk & Policy Analysts
Page 21
4. THE CHEMICALS SECTOR
4.1 Background
4.1.1 The Policy Context
During the 1990s, several waste management policies were adopted at the EU levelthat have potential impacts on the chemical industry. These include:
• measures concerning disposal methods, such as the Directive on Hazardous WasteIncineration and the recently-adopted Landfill Directive;
• measures concerning the definition of wastes, such as the Hazardous WasteDirective;
• regulations concerning transport of waste;• industry-specific directives, such as the Directive on Waste from Titanium
Dioxide Manufacture; and• producer-responsibility measures, such as the Packaging Directive.
In addition to waste-specific measures, policies to reduce air and water pollution haveled to an increase in solid waste volumes in the form of residues from wastewatertreatment and end-of-pipe air pollution control. This case study examines thepotential macroeconomic implications of these measures (with Annex 4 providing amore detailed account).
4.1.2 The Business Context
There are approximately 36,000 chemical companies within the EU, with a turnoverin 1998 of €402 billion. The industry is expanding, with a 25% increase in productionin real terms between 1990 and 1998 (CEFIC, 1999). The industry employs a total ofaround 1.7 million people who tend to be better qualified and more highly trainedthan average, which is reflected in above-average salaries. Employment within thesector has reduced significantly, with approximately 14% fewer employees in 1998than in 1990. As well as increased efficiency, this reduction has been achievedthrough outsourcing of non-core functions, including some aspects of wastemanagement.
4.2 Data Analysis
This case study looks at current waste management costs to the chemical industry ingeneral, rather than those related to any specific policies. Data on specific wastemanagement costs for the chemical industry are limited and there is considerablevariation in costs between companies. In general, though, costs have remainedreasonably stable during the 1990s or even reduced slightly in some cases. Waste-related investment costs are in the range of 1-5% of total investment costs, whilstwaste-related operating costs range from 0.2-1.7% of net sales.
Employment Effects of Waste Management Policies
Page 22
Little information is available on waste-related employment in the chemical industry.Waste and other environment-related activities tend to be carried out by operationalstaff as an integrated part of their duties. Data from three companies indicate thatenvironment or environment, health and safety (EHS) jobs may account for 1-2% ofemployment in the chemical industry. If this percentage were repeated across thesector, it would indicate a total of 17,000 to 34,000 environment-related jobs. Ifwaste-related jobs accounted for a third of the total, in proportion to wastemanagement’s share of operating expenditure, there might be 5,700-11,300 waste-related jobs within the European chemical industry.
Trends in the numbers of jobs are difficult to discern. In general, discussion withcompanies indicates that there has been a slight reduction in the number of full-timeenvironment-related jobs, as environmental protection is integrated into mainstreamoperations. Full-time environmental jobs are also reducing in line with the generalreduction in employment in the chemicals industry.
4.3 Impacts of Waste Management Measures on the Chemical Industry
Whilst the operational costs of waste management to the chemical industry are notnegligible in absolute terms, it appears unlikely that the costs in themselves have had asignificant impact on profitability.
Waste-related investment by the chemical industry is equivalent to €249 million to€1,347 million in 1999. Waste-related investment has remained stable throughout the1990s, whilst overall investment dipped significantly during the mid-1990s and onlyexceeded 1990 levels in 1997. This suggests that waste-related investment costs mayhave displaced some production-related investment (i.e. the crowding out effectleading to possible opportunity costs as discussed in Section 2).
It has not been possible, within the scope of this study, to compare waste managementcosts for the European chemical industry with costs elsewhere. However, the averagegrowth rate of the European chemical industry compares favourably with that of theUSA and Japan, suggesting that waste management policies have not had an adverseeffect overall on the competitive position of the European chemicals industry.
Industry representatives indicate that environmental costs (including wastemanagement costs) may be a contributing factor to the general trend towards re-location of bulk chemical processes outside Europe. Other factors, such as labour andenergy costs and proximity to markets, may however be at least equally significant.
It seems unlikely that the increase in operational costs due to waste management hashad a significant effect on the overall level of employment in the chemical industry.During the 1990s, waste-related operational costs remained stable or even decreasedwhilst employment fell significantly. The industry itself indicates that the rise in unitlabour costs during the 1990s was the key reason for reductions in the number of jobs.It is difficult to estimate the potential impacts of any displacement of production-related investment by waste-related investment, as no data are available on the relativenumbers of jobs associated with different types of investment.
Risk & Policy Analysts
Page 23
There also appears to be little evidence that waste management measures haveincreased waste-related jobs in the chemical industry. The trend towards out-sourcingof waste management may even have reduced the number of waste-related jobs withinthe sector. Even where significant investment has been made on in-house wastemanagement facilities, these tend not to be labour-intensive due to a high degree ofautomation.
The tendency for increased out-sourcing of waste management might be expected toresult in increased investment, and potentially employment, in the waste managementsector. Unfortunately, only limited data are available on investment and employmentby the waste management sector in relation to services to the chemical industry. Thehazardous waste management organisation in Finland, Ekokem, employed 189 peoplein 1999 to treat 1.1 million tonnes of waste. If a similar level of employment appliesto treatment of all hazardous wastes, then the external employment associated withtreatment of chemical industry wastes could total around 5,000 jobs.
4.4 Application of the E3ME Model
Cambridge Econometrics’ E3ME model (described in Annex 2) was used to examinethe impact of the chemical industry’s current level of waste management expenditureon both employment and GDP. The aim is to determine the net effects of industry’scurrent annual expenditure of €804 million on waste management.
In applying the E3ME model, it is assumed that waste management policies have ledto the chemical industry spending the equivalent of 0.8% of its net sales on wastemanagement. The model treats these extra costs as being passed on in higher prices,depending on the competitive position of the industry in different Member States.The extra costs will lead to higher prices and a loss in the European share of worldmarkets. The model has assumed that crowding out of investment is not taking place,since waste management is generally integrated into production process andinvestments are likely to have improved product qualities. Instead, the extrainvestment implied by waste management regulations is assumed to lead to extraoutput and jobs in the investment industries (i.e. providers of waste managementrelated goods and services), with multiplier effects throughout the EU economies. Noextra direct employment in the chemicals sector or in chemicals waste management isassumed.
The most important findings of the analysis are that the current level of costs will leadto a less than 0.01% reduction in gross domestic product (GDP) by the end of the fiveyear period, as a result of increased prices being passed on to private domesticconsumption and exports. The increase in consumer prices leads to reductions inhousehold consumption and hence GDP. The increase in export prices leads to a fallin exports to countries outside the EU and hence GDP. The increase in prices alsomakes imports more price-competitive and so increases European imports. However,the fall in consumers’ expenditure reduces imports, offsetting these increases,resulting in the net effect being negligible. A fall in employment of less than 0.01% isalso predicted.
Employment Effects of Waste Management Policies
Page 24
The impacts of the waste management costs and investment vary considerably acrossthe Member States; some countries experience a net gain in employment, while othersexperience significant losses. Most notable of those experiencing losses are the UKand France, which by 2005 are predicted as losing 10,000 jobs between them. Thepattern is generally one of an increase in employment followed by decreases, with thenumber of jobs lost by the end of the five year period estimated at around 17,000.The first-year increase in employment is a short-term effect arising from the initial fallin real labour costs across industries. This is the effect of the lag between rises inchemicals costs and, therefore, prices more generally and the consequent rise in wagerates. The effect is particularly noticeable for the UK, which according to the modelhas a more responsive labour market with more employment generated for a fall inreal wage rates compared to most other EU economies.
These estimated losses in jobs are likely to be over-predictions as they take noaccount of the potential creation of additional jobs in hazardous waste management.Based on an assumption that every 10 direct jobs leads to 6 indirect and induced jobs(which has been found by the E3ME model to generally be the case for themanufacturing sector), this implies some 8,000 jobs in total may have been created inhazardous waste management and indirectly in those sectors supplying this activity.These indirect and induced jobs would offset the losses stemming from the initial risein prices.
The percentage change in GDP also varies by country. The UK is expected toexperience relatively significant losses, as are Greece and Sweden. In contrast, anumber of countries, including France, realise small gains. GDP across the EU as awhole is reduced by 0.008% (equivalent to €600 million) by the fifth year of themodelling period (2005) as a result of higher prices and loss in exports. There is aconfounding factor in that the model is unable to take into account the extracompetitiveness effects of regulations. In addition, the eco-efficiency gains that havebeen achieved within the industry may not be adequately accounted for. Thesecombined effects may, therefore, counteract the predicted reductions in GDP andemployment. The predicted losses in GDP would also be reduced if account wastaken of the potential jobs created in hazardous waste management and the indirectand induced employment effects stemming from these.
Risk & Policy Analysts
Page 25
5. WASTE ELECTRICAL AND ELECTRONIC EQUIPMENT
5.1 Background
5.1.1 The Policy Context
The main objectives of the Directive on Waste Electrical and Electronic Equipment(WEEE) are to prevent waste by increasing re-use, recycling and other forms ofrecovery and to improve the performance of all operators in the life cycle of electricaland electronic equipment, particularly WEEE treatment. The main measures used toachieve these objectives are set out in Box 5.1.
Box 5.1: Main Measures of the Draft Directive on Waste Electrical and Electronic Equipment
• Separate collection of WEEE, free of charge to households, and provision for collection ofnon-household WEEE;
• Targets for separate collection of WEEE from private households;• Provision for treatment of WEEE to specified standards, at permitted establishments;• Provision for recovery of WEEE, to meet specified rates for overall recovery, reuse and
recycling of components, materials and substances;• Provision of appropriate information and marking of equipment; and• Financing of the system primarily by producers, either individually or collectively.
Whilst the EU Directive is still at the proposal stage, legislation concerning WEEEhas already been adopted and implemented in the Netherlands. The Decree on theDisposal of White and Brown Goods came into force from 1 June 1998 and was fullyimplemented from 1 January 2000. The Decree imposes similar requirements to thosein the proposed EU Directive; it may therefore provide a useful indication of thepotential impacts of the proposed Directive. Annex 5 provides a more detailedaccount of this case study.
5.1.2 The Business Context
In the EU, there are over 100,000 small and medium sized enterprises involved in themanufacture and supply of electrical and electronic equipment. The sector, though, isdominated by a small number of large companies that typically account for 80% ofturnover and employment. Total employment is estimated at around 1.4 million.Manufacturers are located primarily in Germany, the UK, France, Italy, theNetherlands and Sweden. In the Netherlands, there are around 600 manufacturers,most of which are very small companies. However, the majority of goods areimported and there are estimated to be several thousand importers. As in the overallEU situation, a small number of manufacturers or importers (30 for white goods and33 for brown goods) cover 85% to 90% of the market.
5.2 Data Analysis
Clearly, no actual data on the costs of the proposed EU Directive on WEEE are yetavailable. Estimates of the potential costs, though, have been prepared by theEuropean Commission, by industry organisations and by national governments
Employment Effects of Waste Management Policies
Page 26
including the UK Government. There is considerable variation between theseestimates, depending upon the underlying assumptions. Data on the impacts of theNetherlands Decree on the Disposal of Brown and White Goods are available fromthe Netherlands Government, local authorities, industry and the two collectiveorganisations implementing industry responsibilities for take-back.
Only limited investment is thought to have been required by the Netherlands Decree.Known investment costs total approximately €7 million. This represents an initialoutlay of €114- €209 /tonne of waste (depending on whether the volume of wastecollected is taken as the 1999 actual level or the expected long-term level). Furtherinvestment may not be required for 10 or 15 years, though, depending on the lifetimeof the assets. The operating costs have been reduced considerably below the predictedlevel through the use of collective schemes, reducing the number of recycling facilitiesand taking advantage of existing transport routes and networks.
No detailed data have been collected on the employment impacts of the Decree;however, they are thought to be minimal. One of the key effects has been theconsolidation of the recycling industry for WEEE. Jobs may therefore have been lostin smaller organisations, including social welfare organisations, although this mayhave been offset by increased employment in the large organisations to handle theadditional throughput of waste. A small number of additional jobs (perhaps 90 to 100)is also thought to have been created in local authorities, in separating out usable goodsfor sale on the second-hand market. The number of additional jobs in administeringthe scheme (fewer than 10) has been kept to a minimum to reduce costs.
5.3 Impacts of WEEE Policy Measures
The impacts of the EU Directive on employment in the electrical and electronicsindustry are likely to be minimal. The UK Government predicts that one day per yearwill be required by each manufacturer/importer in compiling relevant information tobe provided to treatment facilities. This is in line with experience in the Netherlands.Some additional employment may be generated through product innovation, to reducethe generation of waste and to enhance the potential for recycling and re-use. This ismost likely to occur when the costs to manufacturers of implementing WEEE policyare linked to the amount of waste associated with their products and the ease withwhich they can be recycled. The collective scheme in the Netherlands does notencourage innovation because a single levy is applicable to each type of product,regardless of individual product design. It is not thought, therefore, to have led tosignificant product innovation or associated employment increases.
WEEE policy has the potential for greater impacts on investment and employment inthe waste management and transport sectors. The UK Government has estimated thatimplementation of the Directive in the UK could create of 500 to 600 jobs. This isequivalent to 1 to 1.25 jobs per thousand tonnes of WEEE collected, compared withup to 1.6 jobs per thousand tonnes of WEEE in the Netherlands in the long term, andwould imply creation of 1,500 to 2,000 jobs across the EU.
Risk & Policy Analysts
Page 27
Table 5.1 compares the actual operating costs of the Netherlands Decree and theestimated costs of the proposed EU Directive with the turnover of the electrical andelectronics industry at Netherlands and EU level.
Table 5.1: Comparison of WEEE Operating Costs with Turnover (in € million)
Operating Costsof WEEE Policy
Turnover ofElectrical and
Electronics Sector
Operating Costs as% of Turnover
Netherlands: actual costs, 1999 15.3 7,110 0.22 %
Netherlands: ‘normal situation’ 18.9 7,110 0.27 %
EU: Commission low estimate1 500.0 175,000 0.29%
EU: Commission high estimate1 900.0 175,000 0.51%
EU: Industry estimate2 7,500.0 175,000 4.29%
Sources:1. Commission of the European Communities (2000): Proposal for a Directive on WasteElectrical and Electronic Equipment, Brussels, CEC (COM (2000) 347).2. Orgalime (2000): Detailed Position of Orgalime’s Electrical and Electronic LiaisonCommittee in Co-operation with the European Sector Committees, Brussels, Orgalime.
In most cases, the impacts of WEEE operating costs appear likely to be minimal asthey account for well below 1% of turnover. The operating costs of the Decree in theNetherlands have been minimised through the use of a collective scheme. Providedthat implementation of the WEEE Directive allows for similar economies of scale, itappears unlikely that WEEE policy will have a significant impact upon profitability.
Analysis by the European Commission indicates that the proposed WEEE Directivecould increase the prices of electrical and electronic goods by an average of 1%, withincreases of 2-3% for certain products such as refrigerators, televisions and othermonitors. Under the Netherlands’ schemes, the cost-recovery levies charged on mostwhite goods are around 1-2% of prices but can be up to 5% for some refrigerators andfreezers. Research for the Netherlands Government indicates that these increases areunlikely to lead to long-term sales changes.
One other potential effect of WEEE legislation could be the substitution of newelectrical and electronic goods components by components recovered from recycledgoods. At present in the Netherlands, processing of WEEE primarily takes the formof materials recycling (e.g. metals recovery) rather than component recovery, so thatno such substitution effects arise.
5.4 Application of the E3ME Model
The E3ME model was used to examine the macroeconomic implications arising fromincrease in consumer product prices with the adoption of WEEE legislation across theEU. The modelling assumes that the direct effects of the legislation estimated for theNetherlands would be similar for all other Member States. There would be somesmall extra direct employment by the waste recycling industry resulting from an
Employment Effects of Waste Management Policies
Page 28
increase in the purchase of waste recycling services by the electrical and electronicsindustries, leading to higher costs of their products and extra output of waste-relatedservices. There would also be more investment in recycling equipment. The overallpicture is one of increases in employment and investment, increasing EU GDP andindirect employment.
The increases in costs and prices have negative effects on GDP via reductions inconsumers’ expenditures and exports, but these are generally smaller than the positiveeffects. The cost-inflation effects are modelled to outweigh the direct employmentand investment effects only in Member States that have had a tendency to high wageinflation (e.g. Greece and Spain). However, the advent of the single currency maywell mean that these countries will experience a change in behaviour implying smallerinflationary responses. In this case, the loss in GDP from the policy will beoverstated.
The policy is predicted as yielding increases in employment, with a total gain in directemployment across the EU of roughly 2,800 jobs relative to the base year at the endof the five year simulation period. The effects are in direct proportion to the dataprovided for the Netherlands, hence the largest economies (Germany, France, UK,Italy) account for around 70% of the total, owing to their higher consumption ofelectrical goods. Net changes in total employment are generally small, but positive,across the Member States. They do, however, illustrate the potential importance ofaccounting for the indirect and induced effects when considering the employmentimplications of a policy. Added to the direct job gains are a further 2,000 plus jobsresulting from multiplier effects. In other words, for almost every three direct jobscreated, two additional indirect/induced jobs are created.
This increase in employment is accompanied by slight increases in GDP in mostMember States. The gains would peak in 2002 at an estimated increase in GDP of0.021% (€163 million), but by the end of the five year period the increase in GDP isslightly reduced at roughly 0.016% (€145 million). The countries benefiting mostfrom increases in GDP would be Germany, followed by France.
Risk & Policy Analysts
Page 29
6. THE NON-FERROUS METALS RECYCLING INDUSTRY
6.1 Background
6.1.1 The Policy Context
The non-ferrous metals recycling industry is affected by both the Waste FrameworkDirective and Council Regulation (EEC) 259/93 on the supervision and control ofshipments of wastes within, into and out of the European Union. The case studyfocuses on the latter legislation due to better data availability. Council Regulation(EEC) 259/93 on the supervision and control of shipments of wastes within, into andout of the European Union implements the Basel Convention on the TransboundaryMovements of Hazardous Wastes and their Disposal, but is much broader in scope,extending control to all wastes (except radioactive waste).
The Regulation controls the shipment of waste based on a system of notificationbetween the exporting/importing and transit countries. The level of control is variabledepending on the proposed treatment of the waste, its destination and its assignmentto one of three lists according to the degree of hazard of the waste (red, amber orgreen lists) (TN Sofres, 2000). Exports of red and amber listed wastes are bannedoutside the OECD. Most non-ferrous scrap metals traded internationally are greenlisted (non-hazardous), but some are amber listed. None currently appear on the redlist (most hazardous). It is, therefore, the amber procedures for waste for recoverythat are the most important. These require the notification of the competentauthorities in the countries of dispatch, transit and destination, any of which mayrequest additional information and documentation. These authorities then have aperiod of 30 days in which to object to the shipment. If no objection is lodged after30 days the shipment may be effected; however, the consent expires within a year ofthat date. Annex 6 provides a more detailed account of the case study.
6.1.2 The Business Context
The ferrous and non-ferrous recycling industries are the two most widely and longestestablished recycling sectors, with the non-ferrous secondary metals recyclingindustry employing a workforce of approximately 100,000 people in 1995. It isestimated to consist of approximately 15,000 enterprises of which 10% are large, 30%medium and 60% small (IPTS, 1997).
Exisiting statistics show that 40% of non-ferrous metal produced in the EU iscurrently produced from recycled materials, and this proportion is increasing. Clubb(1997) reports that the value of the non-ferrous recycling industry is approximately€4.2 billion, with 3.5 million tonnes traded within the EU, 441,000 tonnes exportedoutside the EU and 880,000 tonnes imported to the EU. Price and transport costs areusually the determining factors in whether scrap is sold domestically or is exported,and the EU scrap industry relies heavily on exports for economic viability when thedomestic market is depressed.
Employment Effects of Waste Management Policies
Page 30
6.2 Data Analysis
There is no single source of reliable and comprehensive data on the recycling of non-ferrous metals, and data therefore have to be extracted from a number of sources.Countries such as France, Germany and Italy dominate the EU non-ferrous metalsrecycling industry, both in terms of number of enterprises and level of employment.The average number of employees per enterprise varies between Member States but inno country is it more than 20, with an EU average of six, suggesting that the majorityof non-ferrous metal recycling is undertaken by small businesses. Eurostat data showthat on average 31 tonnes of metal are recycled per job, which compares to the figureof 44 tonnes/job given by the Association of Cities for Recycling (1999).
The export market for non-ferrous secondary metal is considerable, accounting for 2.4million tonnes within the EU (€2.3 billion), and 700,000 tonnes (€657 million) to non-EU countries in 1998. Between 1995 and 1998, the volume of trade within the EUdecreased, while exports out of the EU increased. There are significant variations,however, by both country and by metal, with very few trends noticeable. Althoughthere has been an overall increase in both intra- and extra-EU aluminium exports, thishas not occurred in all countries. Likewise, the overall decrease in exports of metalash and residues has not been experienced by all countries, with Austria and theNetherlands both significantly increasing their exports. Exports in general havefluctuated over the 1995 to 1998 period, as has the price per tonne of metals. Againthere is no clear trend between these two factors.
In general, the volume and value of green listed metal scrap is much greater then thatof amber listed. However, for Greece, Spain and Sweden, amber listed metal ash andresidues accounts for more than 50% of their total exports of non-ferrous secondarymetals.
6.3 Impacts of Waste Management Policies on the Non-Ferrous MetalsRecycling Industry
Regulation (EEC) 259/93 may impact both positively and negatively on employmentin the non-ferrous metals recycling industry. A study by TN Sofres (2000) attemptsto quantify the costs associated with this legislation to the non-ferrous industry, butconcludes that the costs are extremely variable across companies. Estimates of thecompliance costs incurred by the Italian non-ferrous metals recycling sector inimplementing Decree 22/97 suggest that costs approximate to 0.5% - 1.0% ofturnover. TN Sofres (2000) estimates the additional costs associated with Regulation(EEC) 259/93 range from 0.0016% to 1.3%. It has also been suggested that manycompanies have had to hire at least one extra person in order to deal with the extraadministration and legal aspects that have arisen from the Regulation. This was thecase in Italy. If similar costs to those arising in Italy were incurred due to theimplementation of Regulation (EEC) 259/93, then this would result in 40% (10%large and 30% medium sized companies) of the total 15,616 companies having toemploy one extra person, creating over additional 6,000 jobs.
Risk & Policy Analysts
Page 31
However, the restrictions to trade in non-ferrous metal scrap may also have a negativeeffect on employment. The extra burden of administration, variation in requirementsfor information, and delays in trade due to additional notification procedures havecaused contract failures and have deterred some companies from trading with certaincountries. The main costs are reported as hidden costs in terms of losses of margins;but notification fees and administration costs are also significant, with administrationfees varying greatly between countries (Clubb, 1997).
It should be remembered that the Regulation has the advantages of reducing illegalshipments and treatment practices through better control and of protecting developingcountries from importing waste that they cannot handle properly. However, the banon trade with non-OECD in (red and) amber listed wastes also has obvious effects onthe industry, although the extent of this is not clear from the data available. Currentexports of amber listed metals have a value of approximately €400 million, includingboth intra- and extra-EU trade, but there has been a noticeable decline in the volumeof trade within the EU between 1995 and 1999. Therefore, such restrictions may havewider implications than at first thought, owing to the fact that the EU scrap industryrelies heavily on exports for economic viability when the domestic market isdepressed. However, other, unrelated market developments may conceal the effects ofwaste management measures, or make them seem larger than they are in reality.
6.4 Application of the E3ME Model
As for the other case studies, the E3ME model was used to predict the total netemployment and GDP effects associated with the impact that Regulation (EEC)259/93 has had on the export of secondary non-ferrous metals. The modellingassumes a theoretical situation where there is no international trade in amber listednon-ferrous metals. In practice, only exports to non-OECD countries are forbidden.This assumption was made on the basis that it was not possible to ascertain from theavailable data the proportion of exports going to non-OECD countries before the banwas implemented. The data, as discussed in Section 6.3, also shows a decrease intrade in amber listed metals within the EU, which may have been caused by extraadministration costs and delays. Hence, the results of the model present a worst casescenario.
The assumption was made in modelling the Regulation to treat the policy effects as ifthey were taking place in a closed system (in other words to assume that the metalwas not exported, but simply ended up sitting in stockpiles). It was not possible tomodel a more dynamic system involving delayed sales. From the information on thesize of export markets, it was possible to infer the number of job losses through notbeing able to trade in amber-listed metals. The job losses were added to the directgains created by the additional administrative and legal requirements to work out theoverall net employment effect and the consequent impact on GDP by Member State.
In all but two countries the model indicates that the Regulation has led to an increasein direct employment. These direct job gains reflect the need for companies to hirein additional legal and administrative assistance in order to deal with the additional
Employment Effects of Waste Management Policies
Page 32
burdens in these two areas stemming from the change in legislation. The number ofadditional direct jobs remains fairly constant over the five year period, with thempredicted at roughly 6,150 by the end of the modelling period. Owing to predictedlosses in GDP, the pattern for total employment for the EU moves from beingpositive in the first two years following implementation of the Regulation to beingnegative in year five, although the magnitude of the net losses (at 1,700 jobs) is small.
The losses in GDP are negative in each of the five years, however, due to the fact thatthe non-ferrous metals recycling industry is a highly integrated sector, withconsiderable demand and supply linkages to other sectors of the economy. Thus,impacts on this sector have significant knock-on effects for other sectors (throughimpacts on demand and supply relationships). The greatest impact on GDP occurs inyear two at a predicted decrease in GDP of 0.006%, with GDP down by 0.005% byyear five. However, these are likely to be over-estimates of the effects of theRegulation given that the impact may be more one of delaying export rather thanpreventing it.
Risk & Policy Analysts
Page 33
7. INTEGRATION OF EMPLOYMENT AND WIDER ECONOMICEFFECTS INTO CBA
7.1 Introduction
As discussed in Section 2, no social costs are normally associated with unemploymentas part of the preparation of a CBA. This stems from assumptions that the economy iseffectively fully employed (with only transitional employment occurring), that labouris mobile and thus any measured unemployment is the result of the need to match achanging demand for labour to a changing supply.
These assumptions rarely hold, however, for most EU countries, indicating that theremay be employment related costs and benefits arising from changes in policy. Oneapproach that could be adopted in doing this is to incorporate economic estimates ofthe social effects associated with changes in employment. This requires firstestimating the number of jobs that would be created or lost by introducing a policyand then multiplying this by the economic value of each job. Theoretically speaking,this economic value is defined in terms of the net income gained from the new job,plus any improvements in quality of life, minus the value of any lost leisure time. Inpractice, wage rates are often used as a proxy measure for this value (with the marketwage rate assumed to reflect the shadow wage rate in developed economies).
However, care is required in incorporating such welfare measures into CBA on top ofestimates of changes in compliance costs (which are used as proxy for economiclosses). Such compliance cost estimates will already include the wage component ofany new capital or operating requirements. As a result, adding further sums tocompliance costs to reflect changes in employment will result in double counting forany direct employment changes and, potentially, for some indirect changes. Thisproblem will be compounded if separate estimates are also prepared on the widereconomic effects (indirect and induced) stemming from changes in demand andsupply relationships.
This, together with the case study findings, suggests that in the context of wastemanagement, there is likely to be value in supplementing traditional CBAs by the useof additional assessments of employment and economic effects. In order to examinethe degree to which the different approaches discussed in Section 2 can assist in thisprocess, a simple analysis is presented below that compares the types of results thatwould be produced through each approach.
7.2 Supply-Side Analysis
As discussed in Section 2 (and Annex 1) adopting a supply-side approach generallyinvolves the use of existing data on the number of jobs per unit of activity to predictthe impacts which a change in policy will have on employment. Table 7.1 provides asummary of the relationships that various researchers have found between tonnes of
Employment Effects of Waste Management Policies
Page 34
Table 7.1: Job Content of Waste Management Activities*
Activity Jobs per 100 000tonnes Tonnes per Job Source
Collection-Packaging 466 214 Cottica and Kaulard (1995)
* See Annex 3 for further discussion of these figures
waste processed per direct job created. As can be seen from the table, the figures varyconsiderably across the different waste management activities.
How well would these figures predict the levels of direct employment quoted in eachof the case studies? In the Chemicals Industry case study, a ratio of 5,820 tonnes ofhazardous waste per job was estimated from the data provided for one country's mainhandling facility. This figure corresponds well to the figures given in Table 7.1 forincineration - one of the main disposal routes for such wastes. However, the datapresented in the table also suggest that changes in regulation, such as the LandfillDirective which will prevent the co-disposal of wastes, may lead to increases in thenumber of jobs, owing to a shift from a high tonne/job ratio to a lower tonne/job ratio(because incineration is more labour intensive than landfill).
For the WEEE case study, estimates of the direct number of jobs created through theintroduction of the Directive suggested that 1 to 1.25 jobs would be created inreprocessing activities per thousand tonnes of waste. This is significantly lower thanthe figure quoted above, suggesting that use of the data provided in Table 7.1 wouldlead to an over-estimate of direct job creation by almost 60%. This difference islikely to be owing to variations in the way in which past policies have beenimplemented compared to WEEE, and to economies of scale that are occurring in themove from smaller to larger operations under WEEE (this includes the potentialsubstitution of technology for labour).
Research on Regulation 259/93/EEC and the non-ferrous metals recycling sectorestimated that some 6,250 high income, direct jobs in the sector will be createdowing to the need for new legal and administrative expertise. Against these gains,however, are any direct losses stemming from a reduction in exports. Under thehypothetical case study scenario, export of roughly 730,000 tonnes of amber listedmetals to non-OECD countries ceases to take place. Based on statistics for theindustry indicating a ratio of 31 tonnes of recycled metals per job, this suggests thatsome 23,000 jobs would be lost. The net effect in terms of predicted changes in
Risk & Policy Analysts
Page 35
direct employment would, thus, be the loss of around 17,000 jobs using this type ofdata.
These simple comparisons imply that use of standard tonne per job ratios may lead toincorrect estimates of the direct employment arising from changes in waste policy.This is in addition to the fact that they provide only a partial analysis, because theyfail to account for any indirect and induced effects. As the case studies show, sucheffects may be significant and may lead to net total effects that run contrary toconsideration of the direct effects alone.
The use of these types of ratios should not be discounted completely, however. Theymay be valuable in providing a quick understanding of the degree to which shifts inwaste management activities would lead to net changes in employment. They mayalso assist in informing discussions on policies that would lead to ‘more of the same’,assuming this would not be accompanied by economies of scale or technology shifts.
7.3 Demand-Side Analysis
Demand-side approaches assume that a policy leads to a change in demand, which inturn then leads to changes in employment and output. Three key approaches wereidentified: input-output models, multipliers and the use of econometric analyses.
Because of their widespread use, multipliers in the form of manpower to expenditureratios are applied to the case studies to examine how well these correspond to theestimates generated through the case study analysis. The ratios calculated by thestudy undertaken by WRc (1999) for the Commission are used for this purpose. Thisstudy found average ratios of expenditure to employment as follows for three wasterelated policies (see also Annex 1 for more detail):
• one FTE (first order indirect) job created per €115,700 capital expenditure; and• one FTE (direct and first order indirect) job created per €53,000 operating
expenditure.
The sum of these two ratios provides the total employment associated withexpenditure on waste management. The results of applying these ratios to theestimated capital and operating costs associated with the three policies considered inthis study are presented in Table 7.2.
Table 7.2: Application of 'Standard' Manpower to Expenditure Ratios
Expenditure (M Euro)Employment
Related to CapitalExpenditure
Employment Relatedto OperatingExpenditureCase Study
Capital Operating Total FTEs Total FTEs
Chemicals Industry 249 804 2 152 16 622
WEEE Directive N/A 750 N/A 14 150
Non-Ferrous MetalsRecycling Industry
N/A 266 N/A 5 020
Employment Effects of Waste Management Policies
Page 36
For the Chemicals Industry, the results indicate a total of 18,774 direct and first orderindirect jobs. If the assumed figure of around 5,000 direct jobs involved in treatmentof hazardous waste is correct, the above results suggest that for every one persondirectly employed in chemical industry waste management, another 2.5 are indirectlyemployed in providing related services. This compares with a multiplier generallyused for the manufacturing sector (in the E3ME model) of 10 direct jobs leading tosix indirect jobs. The latter figure, however, takes into any negative impacts arisingfrom account wage and price effects, while also including induced employment.
For the WEEE case study, it has been predicted that 1 to 1.25 direct jobs will becreated per thousand tonnes of WEEE collected, with this implying the creation of1,500 to 2,000 direct jobs across the EU as a whole. This differs considerably fromthe estimates given in Table 7.2 of over 14,000 direct and indirect jobs being created.The implied ratio of direct to indirect jobs in this case is roughly 1:7 - significantlydifferent to the figures calculated above for the chemical industry.
The estimate of 6,200 direct jobs being created in the Non-Ferrous Metals RecyclingIndustry as a result of Regulation (EEC)/259/93 is considerably higher than the figuregiven in Table 7.2, especially as the latter includes both direct and indirect jobs. Thisdifference arises because this type of demand-side approach neglects the fact that apolicy may lead to more than just increases in compliance costs. Again, the mannerin which a policy is implemented may be crucial to assessing the resulting changes inoutput and hence direct employment, particularly where there may be effects onmarket structure and the need for individuals with specialist skills.
From the above and the discussion presented in Section 2, it can be concluded that theuse of these types of multipliers is best confined to those cases where: a) it can beargued that the policy will lead to an increase in demand, rather than transfers; b)compliance with the policy will mainly involve capital and operating expenditure,rather than more subtle changes in current practice; and c) there is a desire to focus onthe more direct additional effects of a policy, rather than the net effects (which mayinclude negative impacts).
7.4 Macroeconomic Analysis
As noted above, macroeconomic analysis (as carried out using an econometric modelsuch as E3ME or a GE model) involves a more complex analysis of the interractionsthat are likely to occur within an economy. This type of analysis takes into accountthe implications of both changes in demand and prices, and the effects which thesehave on consumption, wages and relative input and output mixes. It therefore is ableto capture both the negative and positive effects that a policy may generate, includingdirect, indirect and induced economic and employment effects.
The degree to which it may be important to capture such wider effects is illustrated byTable 7.3. By expanding the analysis to the macroeconomic level, the potentialnegative net effects of changes in investment patterns on net employment levels andGDP are also incorporated into the analysis. Only for the WEEE case study is the neteffect at a macroeconomic level considered to be positive; even in this case, the net
Risk & Policy Analysts
Page 37
Table 7.3: Comparison of Predicted Employment and GDP Effects in EU 15
Supply-Side Demand-Side Macroeconomic
Case Study DirectEmployment
Only
Direct andFirst Round Indirect
Employment
TotalEmployment
GDP(€ million)
Chemicals Industry 5,000 18,774 -18,000 -660
WEEE Directive 1,500 to 2,000 14,150 5,600 145
Non-Ferrous MetalsRecycling Industry
6,250 5,020 -1,700 -368
employment gains predicted by the macroeconomic modelling exercise are lower thanthose predicted using the manpower to expenditure ratios as described above.
Although a number of simplifying assumptions were made in the macroeconomicmodelling undertaken for the case studies, the above comparisons highlight thepotential importance of expanding the scope of an analysis to incorporate the fullrounds of indirect and induced effects. This is likely to be particularly important forthose waste management policies that will: a) result in significant cost increases toone particular sector; b) impact on the costs faced by a number of different sectors; orc) result in significant costs to the waste management industry itself, which will thenbe passed on through increased prices to other sectors.
However, it should be noted that the application of these more sophisticatedmacroeconomic models is complex. In addition, as for the other approaches, theresults may also be confounded by a number of factors related to the modelling. Inthis regard, it is important that the influence that key model uncertainties (surroundingthe data underlying the model, assumptions concerning full employment, behaviouralassumptions and model specification) are likely to have on the predicted changes inGDP and employment are understood.
7.5 Implications for Integration of Results into CBA-Based Appraisals
Table 7.4 pulls together the conclusions drawn above and from the discussionpresented in Section 2 on the factors affecting the appropriateness of each of theabove approaches. Essentially, the conclusions are that when a policy would result inonly minor changes or shifts in waste management activity, such as an increase in thescale of existing levels of recycling, then the use of the less complex supply, demandand qualitative approaches may be appropriate. However, these approaches can onlyprovide data on the direct effects (or indirect via multipliers) of the policy in question.This information may be enough for many appraisals, but cannot answer questionsconcerning the impact of the policy at a macroeconomic level.
When a policy would impact on the prices faced by non-target sectors, then themacroeconomic approaches will be more appropriate. Only these approaches willprovide an indication of the total net effects of a policy. Both econometric modelsand GE models provide a means of calculating these net effects, although theassumptions underlying these and their appropriateness in terms of the period of likelyimpacts differs.
Table 7.4: Coverage and Appropriateness of Alternative Assessment Approaches as Supplements to CBAType of Approach Scope of Effects Direction of Effects
( + or - )Compliance
RequirementsTime Period and
TechnologyConsistency with CBA
Supply-sideApproach
Direct employmenteffects only
Measures additionaljobs
Only reliable whenpolicy is either an
increase in the level ofactivity or a shift in
activity, withimplementation based
on current practice
Will miscalculate whentechnology shifts oreconomies of scalemay occur; best as
short-term indicators
Indicates change inemployment in terms ofnumber of jobs created
Most appropriate forshort-term; may requireadaptation to accountfor technology shifts
Uses measures such asGDP as a proxy for
economic value
Macro-economicModels
GeneralEquilibriumModels
Direct, indirect andinduced employment
and GDP effects
Positive and negativeeffects into estimates
of net change
Can examine changesin investment and inemployment; models
may labour market is inequilibrium
Most appropriate forlong-term; may requireadaptation to accountfor technology shifts
Uses measures ofeconomic change that are
consistent with CBA
QualitativeAssessments
Can capture directand indirect
employment effects
Positive and negativeeffects can be
indicated
Type of compliancerequired not a
constraining factor
Only really appropriatefor indicating short-
term effects
Can be designed to beconsistent with principles
underlying CBA
Risk & Policy Analysts
Page 39
8. SUMMARY AND CONCLUSIONS
8.1 Introduction
The objectives of this study were to:
• critically evaluate and complete existing information on employment activities relatedto waste management;
• look at the issue of opportunity costs in terms of reduced job levels in other economicsectors; and
• identify ways in which employment effects can usefully be integrated into evaluatingpolicy instruments in the field of waste management.
Below we set out our conclusions in relation to each of these objectives, and also moregenerally on the links between employment and waste management.
8.2 Information on Employment Activities in Relation to WasteManagement
8.2.1 Sources of Information
Information on employment activities related to waste management can be found in twomain sources. These are statistical employment data, collected at European and nationallevel and specific, one-off studies of particular aspects of waste-management relatedemployment. Currently, statistical data collected at the European level provide limitedand poor quality information on employment in waste management. This is because:
• the classifications used exclude a wide range of waste related activities; and• few countries appear to submit regular, up-to-date information that is publicly-
accessible (in some cases the data are specified as confidential).
Particular problems arise from the classifications used, which tend to focus on businesseswhere waste management is the primary activity and exclude waste-related jobs in othersectors. The statistics also fail to separate solid waste management from wastewatermanagement activities. The fact that the waste management sector includes largenumbers of small organisations, including social organisations, makes collection ofaccurate statistics particularly problematic.
Specialised one-off studies, whether they are country-, waste stream-, or activity-specific,can provide additional information. However differences in approaches and definitions,as well as the variations in time-scale, can lead to wide variations and incompatibility inthe data generated.
The Employment Effects of Waste Management Policies
Page 40
8.2.2 Levels of Employment
Taking account of the range of data available from both statistical sources and specialiststudies, the probable number of jobs in the EU in organisations for which wastemanagement is a primary activity lies between 200,000 and 400,000. This representsapproximately 0.2-0.4% of total employment. (This compares to the turnover of thewaste management sector which, at approximately €44 billion in 1997, is around 0.6%of EU gross domestic product). In addition to companies where waste management is aprimary activity, there are also waste-related jobs in companies in other sectors. Theindications are that such employment is limited (possibly another 3,000 to 12,000 jobs). Discussion with industry indicates that there is an increasing tendency for companies toout-source waste management to specialist companies.
Data on trends in employment in waste management are ambiguous. Industry expertsindicate that there is a general trend towards reduced but higher quality employment, asprocessing technologies become more sophisticated and productivity increases. Thistrend for lower employment per tonne of waste may, however, be compensated by agrowth in absolute waste quantities and potentially by increasing levels of control overwaste disposal. Unfortunately, a lack of data makes interpretation of trends over timedifficult.
Neither the statistical data nor the specialist studies indicate a consistent relationshipbetween volumes of waste and numbers of jobs. However, there seems generalagreement that the most labour-intensive activities are manual sorting, some separatecollection processes and waste and scrap wholesale. The least labour-intensive activitiesare landfill, incineration and composting, together with most forms of collection.
8.3 Opportunity Costs in Other Economic Sectors
8.3.1 Opportunity Costs for the Chemicals Sector
During the 1990s, a number of waste management policies were adopted at EU level withpotential impacts on the chemicals industry. Over this period, waste-related investmentaccounted for between 1% and 5.4% of total investment, and remained fairly constantwhilst other investment reduced. Waste-related operating costs range from 0.2-1.7% ofnet sales. This level is unlikely to have had a significant impact on profits or onemployment (which reduced significantly owing to productivity improvements).
There are an estimated 5,700 to 11,300 waste-related jobs within the European chemicalindustry. There is little evidence that waste management measures have increased thenumbers of such jobs; the trend-towards out-sourcing may even have reduced thenumbers employed. This reduction may have been compensated by increased investmentand employment in the waste management sector. Based on the limited informationavailable around 5,000 jobs may have been created in hazardous waste management.
Risk & Policy Analysts
Page 41
Based solely on consideration of the industry’s expenditure on waste-related goods andservices, the E3ME model calculates the change in employment and GDP that wouldarise if all of this expenditure were met through increases in prices for chemical goods.The calculated change is a drop in total employment of 18,000 jobs across the EU overthe period from 2000 to 2005, with this representing less than 0.01% of the EU total;GDP is also predicted as falling by less than 0.01%. These figures should be viewed withsome caution; they exclude jobs created in hazardous waste management and potentialeco-efficiency gains.
8.3.1 Opportunity Costs of Policies on Waste Electrical and Electronic Equipment
Whilst EU Directives on Waste Electrical and Electronic Equipment (WEEE) are still atthe proposal stage, broadly similar legislation concerning WEEE has already beenimplemented in the Netherlands. The Netherlands legislation allows industry to fulfil itsresponsibility for collection and re-processing of WEEE either individually orcollectively; in practice, almost all companies have signed up to collective schemes. Theavailable data on the Netherlands indicates that WEEE-related operating costs accountfor well below 0.5% of turnover for electrical and electronics companies. As the costs ofthe scheme are re-charged to consumers in the form of a levy on prices of new products,they are unlikely to have a significant impact on profitability. Investment costs for theelectrical and electronics industry are minimal. Because of the way the collectiveschemes are organised, the majority of the investment costs have been born by thetransport and recycling firms contracted by the schemes.
Data on the employment effects of the Netherlands legislation are limited. The consensusis that few, if any, jobs have been created, other than a small number in local authorities.Additional employment in administration of the collective schemes has been minimisedto reduce costs. Meanwhile, the organisation of the collective schemes has resulted insignificant consolidation in the recycling sector, with the displacement of smallorganisations, including social welfare organisations. The loss of jobs in these smallorganisations has probably been offset by increases in employment in the larger firms todeal with additional throughput of WEEE.
The E3ME model was used to model the macroeconomic implications arising fromadoption of WEEE legislation across the EU, based on the approach taken in theNetherlands. The policy is predicted to increase employment, with a total gain across theEU of roughly 2,900 direct jobs after five years. Added to this are a further 2,000 plusjobs resulting from multiplier effects. There would also be net increases in GDP acrossEurope as a whole. Again, these figures should be viewed with some degree of cautiondue to data uncertainties and model assumptions.
8.3.3 Opportunity Costs in the Secondary Metals Industry
Under Council Regulation (EEC)259/93 on the supervision and control of shipments ofwastes, the level of control imposed depends on the intended treatment, its destinationand its inclusion on three lists that distinguish waste according to its degree of hazard(green/amber/red lists). Exports of amber and red listed wastes outside the OECD are
The Employment Effects of Waste Management Policies
Page 42
banned, whilst green listed wastes are subject to different controls. Most non-ferrousscrap metals traded internationally are green listed, but some are amber listed.
The Regulation may have both positive and negative impacts on employment. It has beensuggested that many secondary metals companies have hired additional staff to deal withthe extra administration and legal issues arising from the Regulation, potentiallygenerating over 6,000 additional jobs. However, the extra burden of administration anddelays in trade due to additional notification procedures may have contributed to contractfailures and deterred some companies from trades with certain countries.
Modelling using E3ME of a hypothetical situation, where there is no international tradein amber-listed metals suggests that an initial gain of over 6,000 jobs will change to a lossof nearly 2,000 jobs in total EU employment five years later. (In reality there is only a banon trade to non-OECD countries). Impacts on GDP are negative in each of the five years,with the greatest impact occurring in year two (a predicted decrease of €390 million).Given the non-realistic basis for the modelling, as well as the data uncertainties, theseresults should also be viewed with caution. In addition, the effects of waste legislationmay be masked or seem overstated by market developments unrelated to regulation.
8.3.4 Overall Conclusions
The three case studies suggest that waste management policies, in the three sectorsstudied, have so far had limited direct effects on total employment. Few additionalwaste-related jobs appear to have been created in either of the three sectors and theimpact of waste management measures on operating costs seems unlikely to have had asignificant effect on overall employment in the sectors.
The macroeconomic modelling has indicated that, for each of the three sectors studied,the impact of increases in waste-related expenditure has resulted in additional indirectand induced impacts on employment and GDP. For the chemicals and metals sectors,these result in an overall loss of jobs and a reduction in GDP through increased productprices and reduced world market share. For WEEE, the overall impact is a minorincrease in jobs and GDP.
8.4 Integration of Employment and Wider Effects into Appraisals
8.4.1 Comparison of the Estimates Generated through Different Approaches
In order to assess how employment and other wider effects might be incorporated intoappraisals of waste management policies, a simple assessment was undertaken tohighlight the differences in estimated employment and GDP effects that might arisethrough the use of the supply-side, demand-side and macroeconomic analysis. Asexpected, the differences between the predictions are considerable. The supply-side anddemand-side figures reflect only direct and first order indirect employment creation. Theydo not consider the negative macroeconomic effects that arise from reducedinvestment/expenditure on other goods and services. Only by expanding the analysis to
Risk & Policy Analysts
Page 43
the macroeconomic level can the influence of changes in output or price increases,changes in investment and changes in consumer spending be added into the analysis.
This comparison raises questions as to the appropriateness of the different approaches indifferent decision contexts. Our general conclusion is that for some waste policies aCBA alone will be sufficient to capturing the total economic effects, and that this canthen be supplemented using the simpler supply- and demand-side methods to provide anindication of direct (and indirect multiplier) employment effects. However, given thatwaste management forms an integral part of the costs of productions faced by mostsectors in the economy, a policy that would lead to significant changes in waste relatedactivities or costs and, thus, have impacts at the macroeconomic level will require a moresophisticated analysis of total employment and GDP effects. This is likely to be bestachieved through the use of macroeconomic models, such as the E3ME model, which canreflect changes in both supply and demand relationships within the economy. Theemployment effects can then be presented alongside the CBA results; similarly the GDPeffects could be presented alongside or integrated into the CBA results.
8.5 Links Between Employment and Waste Management
A key finding is that the relationship between waste management policies andemployment is more complex than the simple hypotheses outlined in Section 1 wouldimply. Although waste management policies may increase demand for wastemanagement services, this does not necessarily result in additional jobs. Instead,technology substitution for labour, increased productivity and consolidation in the wastemanagement sector may severely constrain job creation. Unfortunately, data on trendsin waste-related employment are inadequate to determine the net effect.
Certain waste management jobs, especially in manual sorting for recycling, are clearlyof poor quality but may provide a route into employment for the socially-excluded.Experience with WEEE policy in the Netherlands, though, indicates that wastemanagement organisations focussed on the socially excluded may be forced out byindustry consolidation even as the level of recycling increases. Evidence from otherstudies (for example AK Wien, 2000) also indicates that such jobs may not be sociallysustainable because of factors such as their increased health and safety risks.
The three case studies indicate that the impact of waste management policies on thecompetitive position of the sectors they regulate has been limited to date. Companiessubject to regulation naturally act to minimise the costs of compliance and there appearsto be a very limited effect on profitability or employment. Some companies also appearto have achieved significant efficiency benefits by focusing on waste minimisation.
Overall, therefore, the study demonstrates that waste management measures are likely tohave only a small effect, positive or negative, on employment and the economy moregenerally. The detailed manner in which a policy is implemented is most likely todetermine the direction and scale of the effect, and this is often the hardest aspect topredict.
The Employment Effects of Waste Management Policies
Page 44
Risk & Policy Analysts
Page 45
9. REFERENCES
Abelson P (1996): Project Appraisal and Valuation of the Environment, London,Macmillan Press Limited.
AK Wien (2000): Umwelt und Beschäftigung: Strategien für eine nachhaltigeEntwicklung und deren Auswirkungen auf die Beschäftigung, Vienna.
Arnold F (1995): Economic Analysis of Environmental Policy and Regulation, NewYork, John Wiley & Sons.
Association of Cities for Recycling (1999): Newsletter Number 18, Brussels.
Bartholomew et al / ECOMAC (1999): Eco-Management Accounting: Based upon theECOMAC research project sponsored by the EU’s Environment and ClimateProgramme (DG XII, Human Dimension of Environmental Change), KluwerAcademic Publishers, London.
CEFIC (1999): Facts and Figures 1999, Brussels, CEFIC.
Chemical Industries Association (1996): The UK Indicators of Performance 1990-96,London, CIA.
Chemical Industries Association (1999): Industry Facts 1999, London, CIA.
Commission of the European Communities (2000): Proposal for a Directive on WasteElectrical and Electronic Equipment, Brussels, CEC (COM (2000) 347).
Coopers & Lybrand (1996): Cost-Benefit Analysis of the Different Municipal SolidWaste Management Systems: Objectives and Instruments for the Year 2000,Final Report to the European Commission DGXI, Brussels.
Cottica A & Kaulard A (1995): The Costs, Environmental Benefits and DirectEmployment Implication of Greening Municipal Waste Management in Europe:An Engineering Estimation, NOMISA, Bologna.
CWESAR (1999): La Place de l’Economie Sociale dans les Matiersde la Recuperation etdu Recyclage.
Davis HC (1990): Regional Economic Impact Analysis and Project Evaluation.
Department of Trade and Industry (2000): Consultation Paper: Proposed EC Directive onWaste Electrical and Electronic Equipment, London, DTI.
Department of Trade and Industry (1997): The Competitiveness of the UK WasteManagement Industry, London, DTI.
Employment Effects of Waste Management Policies
Page 46
ECOTEC (1999): The EU Eco-Industry’s Export Potential, Final Report to DGXI of theEuropean Commission, Brussels.
ECOTEC (1997): Environmental Protection Expenditure by UK Industry, London,Department of the Environment, Transport and the Regions.
ECOTEC (1994): The Potential for Employment Opportunities from PursuingSustainable Development, Report to the European Foundation for the Improvementof Living and Working Conditions, ECOTEC, Birmingham/Brussels.
Energy Technology Best Practice Programme (2000): Benchmarking Tool for theChemical Industry, Harwell, UK, ETBPP.
EURITS (European Union for Responsible Incineration and Treatment of Special Waste)2000:
Eurostat (1994): SERIEE, Luxembourg.
Fischer C (1999): Hazardous Waste Generation in Selected European Countries,Copenhagen, European Environment Agency.
Frankhauser S & McCoy D (1995): Principles of Environmental and Resource Economics: AGuide for Students and Decision-Makers, in Modelling the Economic Consequencesof Environmental Policies, (Eds: Folmer H, Gabel HL & Opschoor H), EdwardElgar Publishing Ltd.
Fritz et al ((1997): Die Beschaftigungssituation im Umweltbereich, Eine empirischeUntersuchung fur Osterreich (The Employment Situation in the EnvironmentField, an Empirical Investigation for Austria).
Gramlich E (1990): A Guide to Benefit Cost Analysis, Second Edition, New Jersey,Prentice-Hall Inc.
Gray WB & Shadbegian RJ (1993): Environmental Regulation and ManufacturingProductivity at the Plant Level, Discussion Paper, Centre for Economic Studies, USBureau of the Census, Washington DC.
Gray WB & Shadbegian RJ (1994): Pollution Abatement Costs, Regulation and Plant-Level Productivity, Discussion Paper, Centre for Economic Studies, US Bureau ofthe Census, Washington DC.
Heady CJ et al (2000): Study on the Relationship between Environmental/EnergyTaxation and Employment Creation, Report prepared for the EuropeanCommission: Directorate General XI.
Henstock ME (1996): The Recycling of Non-Ferrous Metals, ICME, Ottawa.
Risk & Policy Analysts
Page 47
Hufschmidt M et al (1990): Environment, Natural Systems, and Development: AnEconomic Valuation Guide, Baltimore, The John Hopkins University Press.
Instituto Nacionale de Estatistica do Portugal (2000): Environment Industry andEmployment in Portugal, 1997, prepared for DG Environment and Eurostat.
IPTS (1997): The Legal Definition of Waste and its Impact on Waste Management inEurope, Seville, IPTS.
Jacobs M (1994): Green Jobs? The Employment Implications of Environmental Policy.Report prepared by CAG Consultants for WWF.
John Clubb (1997): A Study of the Impact of European Community EnvironmentalDirectives and Regulations on the Ferrous and Non-Ferrous Metals RecyclingIndustries of the Community.
Jonsson PO (1997): Trends in Waste Management in Relation to Increasing Recycling,Annals of Agricultural and Environmental Medicine, Vol.4, No.1, 1997, pp3-6.
Joshi S et al (1997): Impact of Environmental Regulations on the US Steel Industry,Mimeo, Carnegie Mellon University.
KPMG (1995): Eindrapport: Economische Effecten als Gevolg van AfwijkendeFinancieringssystemen voor de Verwijderingskosten van Wit- en Bruingoed, DenHaag, KPMG.
Little I & Mirrlees J (1974): Project Appraisal and Planning for Developing Countries,London, Heinemann.
Malmros P (1997): Occupational Health Problems Associated with Increased Recycling ofHousehold Waste, Annals of Agricultural and Environmental Medicine, Vol.4, No.1,1997, pp7-9.
Mishan EJ (1994): Cost-Benefit Analysis, Fourth Edition, London, Routledge.
Morgenstern RD et al (2000): Jobs Versus the Environment: An Industry-LevelPerspective. Discussion Paper 99-01-REV, Washington DC, Resources for theFuture.
Morgenstern RD et al (1997): Are We Overstating the Real Economic Costs ofEnvironmental Protection? Discussion Paper 97-36-REV, Washington DC,Resources for the Future.
Murray R (1998): Re-Inventing Waste, London, Ecologika.
OECD (1985): The Macroeconomic Impact of Environmental Expenditure, Paris,OECD.
OECD (1996): The Global Environmental Goods and Services Industry, Paris, OECD.
OECD (1997): Environmental Policies and Employment, Paris, OECD.
Office for National Statistics (1997): Input-Output Methodological Guide, London,Government Statistical Service.
Ontario Ministry of Environment and Energy (1996): Economic Techniques forEnvironmental Policy Evaluation: A Training Manual, Economic ServicesBranch, Ontario Ministry of Environment and Energy.
Orgalime (2000): Detailed Position of Orgalime’s Electrical and Electronic LiaisonCommittee in Co-operation with the European Sector Committees, Brussels,Orgalime.
Owen D (2000): Forces for a Change – a View from the City, presented at the Institute ofWaste Management Conference, Torquay, UK, June 2000.
Pizer WA (1997): Prices vs. Quantities Revisited: The Case of Climate Change,Discussion Paper 98-02, Washington DC, Resources for the Future.
Porter ME & Van der Linde C (1995): Toward a new Conception of the Environment-Competitiveness Relationship, Journal of Economic Perspectives, Vol. 9, No.4.
Profeta L (1996): Waste Management and Employment, Brussels, European CommissionDG XI.B.1.
Quirion P & Glachant M (1996): The Employment Potential of Site Remediation Policies,CERNA (centre d’economie industrielle)/ Ecole des Mines de Paris, Paris.
Renner M (2000): Working for the Environment: A Growing Source of Jobs,Worldwatch Paper 152, Washington DC, Worldwatch Institute.
RPA (1999): Induced and Opportunity Costs and Benefit Patterns in the Context ofCost-Benefit Analysis in the Field of Environment, report prepared for DGIII of theEuropean Commission.
Robinson JC (1995): The Impact of Environmental and Occupational Health Regulation onProductivity Growth in US Manufacturing, Yale Journal on Regulation, Vol.12,No.387.
Scottish Executive (2000), Scottish Economic Statistics 2000, from www.scotland.gov.uk.
Statistics Netherlands (2000): Environment-related Employment in the Netherlands,1997, prepared for DG Environment and Eurostat.
Statistics Sweden (1998): The Environment Industry in Sweden, Orebro, StatisticsSweden.
Statistics Sweden (1999): The Environment Industry in Sweden in 1999, Orebro,Statistics Sweden.
Taylor Nelson Sofres Consulting (2000): Extra-Costs Induced by the Application ofWaste Regulations to Certain Materials, Final Report prepared for DG Enterprise.
USEPA (1999): Guidelines for Preparing Economic Analyses, June 1999, United StatesEnvironmental Protection Agency.
Waste Watch (1999): Jobs from Waste-Employment Opportunities in Recyling, London,Waste Watch.
Whiston TG (1995): Employment Considerations and Consequences Pertinent toAutomobile Disposal and Recycling: An EU Perspective, Science Policy ResearchUnit, University of Sussex, Brighton, UK.
Worldwatch Institute (2000): Working for the Environment: A Growing Source of Jobs,Worldwatch Paper 152, Washington DC, Worldwatch Institute.
WRc (1999): Study on Investment and Employment Related to EU Policy on Air, Waterand Waste, Final Report, for European Commission Directorate General XI-Environment, Nuclear Safety and Civil Protection, WRc Medmenham, Marlow,Bucks, UK.
Zerbe R & Dively (1994): Benefit Cost Analysis: In Theory and Practice, New York,Harper Collins Publishers.
Employment Effects of Waste Management Policies
Page 50
Risk & Policy Analysts
ANNEXES 1 TO 6
Risk & Policy Analysts
- i -
CONTENTS - ANNEXES
Abbreviations
A1. APPROACHES FOR ASSESSING EMPLOYMENT AND WIDER EFFECTSA1.1 Introduction A1-1A1.2 Economic Efficiency and Wider Employment Effects A1-1A1.3 Extension of the Partial Equilibrium Framework of CBA A1-7A1.4 Supply-Side Approaches A1-8A1.5 Demand-Side Approaches A1-9A1.6 Macroeconomic Modelling Approaches A1-18A1.7 Non-Monetary Assessment Approaches A1-23
A2. THE E3ME MODEL USED IN THE CASE STUDY ANALYSISA2.1 Overview of the Model A2-1A2.2 The Model Assumptions and Their Implications for Case Studies A2-2
A3. ANALYSIS OF DATA ON EMPLOYMENT ACTIVITIES RELATED TO WASTE
MANAGEMENTA3.1 Existing Studies on the Environment and Employment A3-1A3.2 Availability and Applicability of Waste-Related Employment Statistics A3-4A3.3 Employment in Waste Management A3-5A3.4 Nature of Jobs and Employee Characteristics A3-16
A4. THE CHEMICALS SECTORA4.1 Background A4-1A4.2 Data Analysis A4-3A4.3 Impacts of Waste Management Measures on the Chemical Industry A4-8A4.4 Application of the E3ME Model A4-12
A5. WASTE ELECTRICAL AND ELECTRONIC EQUIPMENTA5.1 Background A5-1A5.2 Data Analysis A5-4A5.3 Impacts of WEEE Policy Measures A5-10A5.4 Application of E3ME Model A5-14
A6. THE NON-FERROUS METALS RECYCLING INDUSTRYA6.1 Background A6-1A6.2 Data Analysis A6-3A6.3 Impacts of Waste Management Policies on the Non-Ferrous Metals
Recycling Industry A6-6A6.4 Application of the E3ME Model A6-8
A7. REFERENCES A7-1
Employment Effects of Waste Management Policies
- ii -
Abbreviations
CBA - Cost-benefit analysisCEA - Cost-effectiveness analysisGE - General equilibrium modelFTE - Full time equivalentGDP - Gross domestic productI-O - Input-output modelMSW - Municipal solid wasteNVMP- The Association of Metal ProducersPACE - Pollution abatement cost estimatesWEEE - Waste electrical and electronic equipment
Risk & Policy Analysts
Page A1-1
A1.1 APPROACHES FOR ASSESSING EMPLOYMENT AND WIDERECONOMIC EFFECTS
A1.1 Introduction
There is a range of approaches that could be adopted for incorporating data on theemployment and wider macroeconomic effects of a proposed policy into regulatoryappraisals. These vary from reliance on current waste and economic growth statisticsto the application of sophisticated predictive modelling techniques. However, theappropriateness of adopting the different approaches varies, depending on the natureof the waste management policies in question and the availability of data.
This annex provides a more detailed review of the available approaches, highlightingboth their advantages and drawbacks. This review starts with the treatment of sucheffects within CBA, and then examines the use of the alternative supply- and demand-side approaches.
A1.2 Economic Efficiency and Wider Economic Effects
A1.2.1 Efficiency and Employment Effects
The theory underlying the application of CBA (and CEA) is that of neo-classicalwelfare economics1. As part of the theoretical underpinnings to such analyses, it isassumed that no social costs arise as a result of unemployment. The reasons for thisrelate to assumptions that:
• the economy is effectively fully employed;
• any measured unemployment is the result of the need to match changing demandfor labour to a changing supply;
• because of the need to match skills with changes in demand, there will be periodswhen individuals can anticipate that they will be out of work as they move fromjob to job; and
• such periods are reflected in employment contracts and in unemployment benefits,there is no cost to society from the existence of a pool of unemployed workers.
In reality of course, many economies are far from conforming to the definitions of awell-functioning and stable economy at full employment. In addition, employmentcontracts and unemployment benefits may not fully reflect social costs. As a result,examination of employment effects may be important when a policy is likely to resultin significant changes in demand for the services produced by either one or a numberof sectors. Where significant changes in sectoral demand would result, there may alsobe net increases or decreases in employment across the economy as a whole. For
1 See also OECD (1992) for further discussion on the theory and practical application of CBA.
Employment Effects of Waste Management Policies
Page A1-2
example, where a policy results in increases in demand for more labour intensivegoods and services, new jobs may be created in order to meet productionrequirements.
When a policy creates a job, it has a benefit to society to the extent that the personemployed would otherwise not have been employed (with the reverse being the case ifwith the loss of a job). The benefits of employment, therefore, are equal to the socialcosts of unemployment avoided as a result of a policy. The magnitude of thesebenefits will depend primarily on:
• the period that the person will be employed;• what state support is offered during any period of unemployment; and• what opportunities are available for informal activities that generate income or
cash in kind.
In addition, unemployment is known to lead to health problems, which have to beconsidered as part of the social cost.
To estimate benefits, figures are required on the number of jobs that would be createdor lost by introducing a policy. This should include measure of the direct, indirectand induced effects if the total change in employment is to be accounted for. Oncethese figures are available, it is possible to place a monetary value on them.Theoretically speaking, the economic benefit, or welfare gain, arising from anadditional job is defined as:
• the gain in net income as a result of the new job, after allowing for anyunemployment benefit, informal employment, work-related expenses, etc., minus
• the value of the additional time that the person has at his or her disposal as aresult of being unemployed, which is lost as a result of being employed, plus
• the value of any health related consequences of being unemployed that are nolonger incurred.
Because deriving estimates for each of these factors may be difficult, wage rates areoften used as a proxy for this value. In order to correctly reflect welfare gains, thewage rate used for this purpose should reflect the opportunity costs of labour. Ineconomies where social policy subsidises certain types of labour, market wage ratesmay not equate to the opportunity costs of labour2. However, within the EU there isconsiderable mobility of labour and relatively low levels of structural unemployment,so the market wage rate is likely to act as a reasonable approximation of theopportunity cost of labour (i.e. it will reflect the value of output foregone if the labourwas engaged in other productive activities). Thus, in the context of this study,market-clearing wage rates can act as a measure of the welfare gains or losses causedby changes in employment arising from the changes in waste management policy.
2 For example, this may be the case in a developing country context.
Risk & Policy Analysts
Page A1-3
However, it must be recognised that direct changes in labour costs should be capturedby a CBA in any event. Such changes will form one aspect of the estimated costs toproducers and consumers of complying with a new policy. In other words, they willbe included in estimates of any the capital and operating expenditure required to meetthe requirements of a change in policy. As a result, adding a further sum to theestimated compliance costs to reflect changes in employment will result in doublecounting for any direct employment changes and for those indirect changes stemmingfrom compliance related expenditure. This problem will be compounded if separateestimates are also prepared on the wider economic effects (indirect and induced)stemming from changes in demand and supply relationships (see Section 2.2.2).
The alternative is to measure and present data on changes in employment in terms ofthe number of jobs created or lost. Such changes, whether positive or negative, can beestimated using a number of different approaches. For the purposes of this study,these have been grouped into three categories (based on OECD, 1997):
• Supply-side approaches: these rely on the use of current employment data, forexample tonnage of waste treated per full-time job equivalent, to estimate thenumber of jobs to be created by a change in policy;
• Demand-side approaches: these predict the number of jobs that will be createdas a reult of a new investment or increase in demand for the goods and servicesprovided by a particular section (e.g. the waste management sector); and
• Macroeconomic approaches (econometric and general equilibrium models):these estimate the net changes in employment that will occur as a result of changesin both demand and supply relationships.
All three types of approach can provide estimates of the direct effects on employmentof a proposed policy. This may relate to the creation of new jobs in the wastemanagement sector or in other sectors that must add staff to meet new requirements.It may also relate to the direct loss of jobs, where waste management shifts from onetype of activity to another (e.g. landfill to waste recovery). In the latter case, the lossof jobs in one activity may be offset by gains in employment in another activity.Thus, waste management policies can have wither net positive or net negative directeffects.
However, the impact of creating a net number of new jobs may go beyond the directgains to those taking those jobs. As a previously unemployed person takes a new job,his expenditure on other goods and services increases, with this in turn leading to anincrease in demand for those goods and services, and so on. The result may be theindirect creation of jobs, which can in turn result in changes in consumption, withthese induced changes in consumption commonly referred to as the multiplier effect3.
3 It should be noted that the multiplier effect is based on the assumption that there is a shortfall of
demand in the economy, thus implying that current macroeconomic policy is incorrect. Ifmacroeconomic policy was to correct to shortfall, then no multiplier effect would be observed as aresult of changes in environmental (or other sector) policies. Instead, environmental policies wouldresult only in the transfer of activities between sectors and not the net creation or loss of demand and
Employment Effects of Waste Management Policies
Page A1-4
Of note in this regard is the potential importance of the creation of large numbers offairly low wage jobs as a result of changes in waste management policies. Becausethose on lower wages spend a higher proportion on their income (the marginalpropensity to consume) that those in higher earning occupations, increasing thenumber of lower wage jobs available can lead to relatively higher levels of spendingthroughout the economy.
Thus, a policy may lead to a series of net changes in employment, where these mayinclude direct employment, indirect (first order) employment or induced employment.As indicated in Table A1.1, the different approaches can capture the indirect andinduced employment effects to varying degrees.
Table A1.1: Approaches to Assessing Employment and Wider Economic Effects
Approach Scope of Analysis Methodology Data Sources
Analysis ofmicroeconomic data andjob losses surveys
Survey data
Supply-sideApproaches Direct and indirect
positive or negativeeconomic growth effects
Analysis ofmicroeconomic data,investment and growthsurveys
Survey data
Direct positiveemployment effects
Calculation of manpowerper unit of expenditure
Statistics on jobs per unitof expenditure
Demand-sideApproaches Direct and indirect
positive employmenteffects
Input-output andmultiplier basedcalculations usingchanges in final demand
Statistics onenvironmentalexpenditures and input-output tables
EconometricModels
Net employment andGDP effects ofenvironmentalexpenditures
Behaviour equations usedto link changes inexpenditure to changes ininter-sectoral supply anddemand
Econometric models andinput-output equations
ComputableGeneralEquilibriumModels
Net employment andGDP effects ofenvironmental measures
Modelling of long-runchanges in supply anddemand equations untilall markets reachequilibrium
Detailed data on inter-sectoral linkages,including input-outputdata
Source: Based on OECD, 1997 (pg 22)
A1.2.2 Efficiency and Indirect Effects on Related Markets
In addition to having net employment effects, waste management policies can alsohave wider economic effects. When a waste management policy has significantimpacts on the costs of production faced by one sector, then this may also effect the
hence employment. The implication of this is that such shortfalls in demand would be better correctedthrough changes in macroeconomic policy than through environmental or other policies.
Risk & Policy Analysts
Page A1-5
demand for the goods and services produced by one or more other sectors. Suchshifts in demand can have a significant affect on the prices faced by consumers inthese other sectors, which in turn can have an impact on the supply and demandrelationships across the economy more generally.
Box A1.1 illustrates why such impacts may arise. In this example, it is assumed thatthe introduction of a new policy on hazardous waste management increases the costsof consuming a good, say a chemical that acts as an input to production. In response,demand for the primary chemical decreases and demand for a non-hazardoussubstitute increases. The market for this non-hazardous substitute is a related market,and as demand shifts outward for this substitute, the price which producers are able tocharge also increases. This increase in price leads to a transfer in welfare fromconsumers of the substitute to producers, but overall there is a net loss in welfare.
The degree to which such losses in welfare are significant and, thus, will need to betaken into account in a policy appraisal will depend on the magnitude of the pricechanges in the related markets. These in turn will depend on the nature of the supplyand demand functions underlying those related markets. The easier it is to substituteone good for another (i.e. the more elastic are the supply curves in the relatedmarkets), the less importance that needs to be placed on consideration of relatedmarkets. The less easy it is to substitute one good for another, the more importantconsideration of price effects and, hence, wider economic impacts will be4.
What are the implications of the above analysis on the need to examine the widereconomic effects of waste management policies. Because CBA is a partial equilibriumanalysis, it assumes that prices in related markets are unaffected. Use of CBA toestimate the welfare effects of a policy is, therefore, appropriate in those cases wherea policy would affect a good which has ready substitutes (in such cases, changes insupply and demand in the primary market will capture the majority of any changes inwelfare). In such cases, prices in the related market(s) should not be significantlyaffected by the change in policy. As a result, focusing on the directly affected sectorand, perhaps, one or two key related sectors should provide a good estimate of thetotal welfare effects arising from the policy.
However, the greater the expected impact on prices in related markets, the moreimportant it is likely to be to apply one of the more sophisticated modellingapproaches listed in Table A1.1, and in particular either econometric or generalequilibrium models. Indeed, waste management is often highlighted as a keyenvironmental policy area requiring such analyses for the full economic effects of aproposed policy to be understood (Fankhauser & McCoy, 1995). The argument isthat unless the negative impacts which such policies may have on the demand forgoods in other market sectors are understood, the benefits of such policies may beconsiderably overestimated.
4 For further discussion as to when it is important to go beyond the directly affected markets in an
environmental policy context, see Arnold (1995, pg 84).
Employment Effects of Waste Management Policies
Page A1-6
Box A1.1: The Impact of Regulation on other Markets
Consider a policy that is aimed at reducing the quantities of hazardous waste produced by a particular industrysector. Assume that a regulation is introduced that means additional procedures are required in the handlingand treatment of a specific hazardous substance. The companies affected by this regulation are able to switchinstead to a substitute substance that produces less hazardous waste and, hence, reduces costs and improvesenvironmental requirements.
The substitute is sold in what is called a related market, in that demand for this good is related to demand forthe regulated substance. When the supply curve for the substitute good is not perfectly elastic, then an increasein demand for the substitute will lead to an increase in the price (as indicated below). This increase in price isinconsistent with the demand curve developed for the regulated substance which assumed a constant price forthe substitute (the assumption of ceteris paribus underlying partial equilibrium analysis.) As the prices in therelated market changes, this causes a shift in the position and (potentially) shape of the damand curve for thismarket. When such changes in damand occur, there will be welfare effects (transfers from demanders toproducers).
Consider the demand and supply curves in this related market. As the supply curve for the substitute is notperfectly elastic, price rises when demand increases. The post-regulation demand curve for the substitute isD1. This is the demand curve that is used to measure the welfare effects arising from the higher price beingcharged in this market as a result of the increased costs of using the regulated substance. In this case,demanders of the substitute substance lose areas A, B and C and producers gain B and C. The net social costof this induced price increase is measured by area C.
The implications of this analysis are that where markets that are undisturbed by any regulation � in the sencethat their demand and supply curves do not shift � then consideration of related markets is not necessary and apartial equilibrium approach will capture all welfare effects. Where related markets are affected by a change inanother market � in the sense that their demands (or supplies) shift in response to price changes in the primarymarket � then the impacts on these markets must also be examined if the total welfare effects are to becalculated. The easier it is to substitute one good or service for another (i.e. the more elastic the supply curve),the less important consideration of related markets is likely to be.
Source: Adapted from Arnold, 1995
S
D1
D0
Q0 Q1
P0
P1
A BC
Risk & Policy Analysts
Page A1-7
The above discussion implies that in order to determine whether the total effects of apolicy are positive or negative, then consideration of indirect and induced economiceffects may be important for waste management policies when the following hold:
• the waste management policy affects a highly integrated good or service (widelydemanded by most other sectors with the economy), meaning that increases incosts arising from this policy to the waste sector may affect the costs of productionexperienced by other sectors where these are passed on to �users� of the wastemanagement services;
• however, waste management costs would need to comprise a significantproportion of the manufacturing costs faced by the 'user' sectors so that theincreases affected the supply curves for these markets and the prices in relatedmarkets; and
• where the change in policy has no technology forcing or 'market consolidationeffects' on either the waste management industry or those sectors calling upon thewaste management services affected by the policy.
With regard to the above rules, it should be recognised that failure to adopt anapproach which will take such impacts into account when they are significant mayresult in a considerable miscalculation of a policy�s net economic effect. At thesimplest level, it may fail to take into account the types of indirect welfare lossesillustrated in Box A1.1. It may also lead to the failure to identify cases whereinvestment in waste management might forestall other, more growth-generatinginvestment. Such �crowding-out� of investment (and hence the creation of newemployment opportunities) has led to numerous claims by industry and others thatenvironmental policies are damaging economic growth and employment; although theresearch carried out on this question reaches varying conclusions [see for exampleMorgenstern, Pizer & Shih (2000) with regard to jobs versus the environment andGray & Shadbegian (1994) with regard to productivity effects].
The picture then is complex within the context of waste management. In many cases,the traditional boundary adopted in CBAs of focusing on the directly affected sectorsand perhaps one or two indirectly affected (or related) markets will be sufficient.However, the more sophisticated demand-side approaches or macroeconomicmodelling approaches may be needed in other cases to gain a better understanding ofthe likely impacts on other sectors of the economy.
For this reason, the characteristics of the different approaches listed in Table A1.1 aredescribed in more detail below.
A1.3 Extension of the Partial Equilibrium Framework of CBA
When the CBA of a policy is based on appropriate measures of the opportunity costsarising from its introduction, then the estimated net present value of a policy shouldinclude all direct costs and benefits. As noted above, however, this focus on directly
Employment Effects of Waste Management Policies
Page A1-8
affected markets may fail to take into account significant welfare effects arising inother related markets.
One approach to rectifying this situation is to extend the CBA to cover all of therelated markets that may experience significant changes in supply and demandrelationships (USEPA, 1999). This would involve determining the changes in demandthat would occur in these relating markets and calculating the corresponding changesin welfare. The estimated change in welfare (whether positive or negative) would thenbe added to those estimated for the directly affected sectors to derive estimates of thetotal economic costs of the policy.
Firstly, it should be noted that this type of approach will not address employmentissues, only impacts on related markets. In addition, prior to gaining information onall of the related markets with regard to their underlying supply and demandrelationships, it may be difficult to set the boundaries for the analysis. It may beparticularly hard to specify the boundaries where a waste management policy mayresult in significant shifts in activity. This suggests that specifying what should beexamined is likely to be problematic for those commissioning the CBA. Indeed,earlier work (RPA, 1999) has highlighted the difficulties faced by those preparingCBAs in accounting for the full range of direct costs and benefits (where theseinclude environmental and health effects).
A1.4 Supply-Side Approaches
As noted in Section 3 and discussed further in Annex 3, a range of data is collectedfrom industry on the number of people employed in various waste managementactivities. This includes data on the volume of waste processed per employee for avariety of different waste management activities.
Use of this data to predict the number of jobs that will be created or lost owing to achange of policy forms the first of the so-called supply-side estimation approaches. Itis termed a supply-side approach because it is using actual data on the existing supplyof labour to meet a given demand. So for example, assume that a policy would shiftwaste management from a landfill-based approach to a recycling-based approach.The net change in employment would then be calculated by comparing the relativeemployment per unit of waste data for landfill versus recycling for the volume ofwaste affected. Say that existing data suggest that one job is created for every 1,000tonnes of waste going to landfill, while 1.5 jobs are created for every 1,000 tonnesgoing to recycling. If the policy were to affect 10,000 tonnes of waste, then therecycling policy would be estimated to result in the creation of five new jobs based oncurrent data.
The key difficulties in adopting such approaches are:
• a lack of reliable data as to current levels of direct waste related employment uponwhich to base any predictions;
Risk & Policy Analysts
Page A1-9
• definitional problems as to who is included in current statistics, as differentdefinitions are adopted in different countries;
• related to the above two points, there are problems in moving from direct toindirect employment as the latter is captured by the data even less often; and
• the need to adjust the data to reflect differences between past policies and themanner in which new policies are likely to be implemented, given that suchdifferences can have a significant effect on employment levels.
The waste-related employment data presented in Section 3 of this document couldessentially provide the basis for undertaking a supply-side analysis of the impact ofpast regulations (ex post) and of proposed changes in policy (ex ante) on employmentin the various waste management activities. However, the discussion notes thesignificant definitional and boundary problems involved in trying to estimate thenumber of jobs connected with different waste management 'supply' services. Asidefrom these problems, such data - based as it is on previous policies and responses tothem - may also be a poor predictor of how those supplying waste services mayrespond to future regulations. Technological innovation and changes in marketstructures (e.g. consolidation in the recycling industry) are key factors affecting thepredictive ability of past data.
It should also be noted that this type of approach cannot capture any of the inducedemployment effects arising from job creation, nor will capture any negative indirecteffects arising from the losses of jobs as a result from changes in activities.
The use of supply-side data may, however, provide rough order-of-magnitudeestimates of the direct employment effects arising from a change in wastemanagement policy. Where the use of more sophisticated methods is constrained, thismay be better than no data on the likely effects.
A1.5 Demand-Side Approaches
A1.5.1 Overview
With regard to the demand-side approaches, three different forms of demand-sideanalysis for calculating direct and indirect economic and employment effects can beidentified:
• approaches based on the use of input-output models to predict direct and indirectoutput and employment effects.
• approaches based on the use of multipliers, ranging from the use of engineeringbased manpower requirements per unit of expenditure ratios, or income andemployment multipliers (derived from input-output tables); and
Employment Effects of Waste Management Policies
Page A1-10
• approaches based on the use of econometric analysis to predict the changes inproductivity caused by environmental regulations �crowding out� otherexpenditure.
These three forms of analysis are discussed further below. This discussion starts withthe use of input-output models, then proceeds to the use of multipliers derived fromsuch models, followed by a discussion on the use of manpower to expenditure ratios.Finally, a brief overview is provided on the use of econometric analysis to predict thenegative effects which environmental regulations have had on industry and henceeconomic productivity.
A1.5.2 Input-Output Models
The key purpose of input-output (I-O) models is to provide a systematic description ofthe interdependencies that exist between sectors in the economy and, by so doing, toenable recording of the transactions that take place between different sectors. Forexample, the production of electrical goods requires a range of other inputs, such asenergy, raw materials, chemicals, engineering equipment, as well as transport andother services required for distribution of the goods to consumers. In turn, theproduction of energy, raw materials, engineering equipment, etc. require a number ofinputs including electrical goods.
I-O models map these flows of between sectors and indicate, for any one sector, howmuch input from other sectors (and in what proportions) is required to produce a unitof output. As a result, they can be used to examine how changes in the total output ofone sector (or in household consumption or government expenditure) is likely toimpact on the demand for inputs from other sectors (including labour).
Since their first development, I-O models have been used to address not onlyeconomic linkages but also economic-employment linkages. The primary purpose ofeconomic-employment models is to examine how a policy which will affect either thelevel or structure of demand (for a given set of goods or final demand for theeconomy as a whole) will affect the demand for labour. They enable both changes inthe direct and indirect demand for labour to be predicted.
It is relatively straightforward to expand an I-O model to incorporate employment, asit is simply treated as primary inputs. For example, once final sectoral output hasbeen determined, these figures can be translated into employment. This is based ondeveloping a matrix reflecting industry-occupation relationships and correspondingemployment/output coefficients from data on manpower requirements, man-hours,and productivity within each sector (OECD, 1997).
Also of relevance to waste management policy development is that I-O models can beused to assess both the direct and indirect effect of controlling waste by-products fromeconomic activities. This is done by incorporating waste products (includingemissions or discharges to the environment) into the model. In the waste managementcontext, the first step would be to work out the contributions (direct and indirect) ofeach sector to waste arisings. Then through manipulating different sectoral outputlevels, one would predict the structural adjustments necessary to meet reductions in
Risk & Policy Analysts
Page A1-11
arising, such as a 30% cut in hazardous waste streams. An example of how such anapproach was applied to analysing alternative strategies for reducing carbon dioxideemissions is given in Proops et al (1993 - as described in Frankhauser & McCoy,1995).
I-O models obviously provide a means of examining the employment implications ofadopting alternative waste management policies. Their use as a supplement to a CBAbased regulatory appraisal is appropriate when:
• a policy would be likely to affect not only supply and demand in the directlyaffected sectors but also in related markets; in addition, the expected changes inprices in the related markets would need to be significant. Note that wastemanagement policies are often cited as key examples of where these conditionsare likely to be met (Frankhauser & McCoy, 1995); and
• where a detailed analysis of impacts at a sectoral level is desired (as opposed toless detailed macroeconomic indicators of change).
I-O models can be used to compare two distinct states of the economy; pre-policyintervention versus post-policy intervention. The difference between the two �states�represents the net economic effect (expressed in terms of a change in output) ofimplementing the waste management (or other) policy in question. These estimatednet economic effects could then be added to estimates of the compliance costs fallingon the target sectors for inclusion in an expanded CBA-based framework. This wouldallow the wider economic effects to be taken into account in comparing the total costsand benefits of a proposed waste management policy.
While I-O models provide a useful means of describing the interconnected naturesupply and demand relationships across an economy, they have a number ofshortcomings. Most of these stem directly from the need to contain a large range ofproduction information at the sectoral level. Key shortcomings (see also: OECD,1997; and Hufschmidt, 1990):
• there is no ability within these models to determine how demand for a sector�soutput may respond to changes in price;
• no flexibility in production is allowed for, as fixed relationships are assumedconcerning the inputs required to produce a given unit of output; this raises furtherproblems in economic-employment and economic-environment models, as fixedcoefficients do not accurately describe real production relationships and enablesubstitution effects (e.g. the substitution of labour for other inputs as relative priceschange) to be taken into account. The use of fixed relationships also implies thatmarginal outputs in an industry require the same proportional mix of inputs as doesthe average unit of output; and
• owing to the fact that the models fail to take into the impacts of changes in relativeprices on the demand for the various factors of production (labour, energy, rawmaterials, etc.), they ignore several relevant channels of indirect employmenteffects. These include effects stemming from price and wage adjustments, induced
Employment Effects of Waste Management Policies
Page A1-12
consumption effects of the incremental employment (i.e. the multiplier effects),and induced investment or accelerator effects.
A1.5.3 Multiplier-Based Approaches
Multipliers are essentially numbers which provide a measure of the degree to which achange in direct output or direct employment will result in additional changes inoutput or employment, through further rounds of spending. For example, employmentmultipliers reflect the following process:
• the introduction of a new policy, results in expenditure and, hence, new jobs;
• a previously unemployed person taking one of the new jobs will now increasehis/her own expenditure on other goods and services (housing, food, clothing,etc.);
• this increased expenditure on (and hence demand for) housing, food and clothingcreates additional new jobs in these sectors, resulting in further increases in incomeand expenditure and, thus, another round of additional new jobs; and so forth untilthe additional income is too small to lead to sufficient increase in demand to leadto further new jobs being created.
It is important to note that multipliers are often derived through the manipulation ofinput-output tables, with the aim of providing an alternative means of capturing the(positive) direct, indirect and induced effects of changes in final demand for particulargoods and services (Abelson, 1996). They can provide, therefore, an indication ofhow a waste management policy, involving new expenditure and/or new jobs, is likelyto impact on output or employment across the whole economy.
Output and income multipliers provide a measure of the change in total output andincome that will result for some change in expenditure (e.g. spending on the capitalcosts of new technologies) or in direct income (e.g. the introduction of an economicinstrument such as product taxes or subsidies). Employment multipliers provide ameasure of the change in employment that will result from changes in directemployment levels. Box A1.2, overleaf, provides a more detailed explanation of howmultipliers operate.
In practice, multipliers at different levels to account for varying degrees of indirecteffects and induced effects. For example, with regard to output multipliers5:
• Type I multipliers provide a measure of the sum of the direct and indirect (firstorder) effects on the change in output resulting from a unit increase in finaldemand; while
5 There are also Type III multipliers, which are a modified form of the Type II multiplier. They are
modified with the aim of minimising any potential over-estimation of effects that may occur byassuming linear relationships, for example between consumption and income.
Risk & Policy Analysts
Page A1-13
• Type II multipliers take into account the changes in consumption generated byhigher personal incomes that will result from the increases in direct and indirectoutput; they, therefore, provide a measure of the sum of direct, indirect andinduced (e.g. second and third order) output changes resulting from a unit increasein final demand.
Within the context of waste management, the use of a Type II multiplier instead of aType I may be important. This is because the Type II multiplier, by accounting fordirect, indirect and induced effects, will take into account changes arising fromactivities such as the sub-contracting or contracting-out of services. In addition, TypeII multiplier are better able to capture the effects of increased specialisation over time,which may be ignored by Type I multipliers. Because waste management ischaracterised by both sub-contracting and the specialisation of services, both of thesefactors may be important when assessing the introduction of a new waste managementpolicy. As a result, the use of Type I multipliers which only cover direct and indirect(first order) effects may incorrectly calculate the end impacts.
Box A1.2: Multipliers and the Marginal Propensity to Consume
Multipliers operate as follows, assuming a standard consumption function represented by6:
cYCC +=
If it is then assumed that a waste management policy results in an increased demand for newtechnology, this then translates to an increase in investment or autonomous expenditure (denoted by∆Ā). Production has to expand to meet this increase in demand with output then also expanding by∆Ā. The increase in production gives rise to an equivalent increase in income which, in turn, results insecondary expenditures equal to c∆Ā.
Production again expands to meet the increase in spending. The corresponding increase inproduction, and then income, is c∆Ā. This gives rise to a further round of secondary spending equalto the marginal propensity to consume times the increase in income, in other words:
AcAcc ∆=∆ 2)(
Since the marginal propensity to consume is less than 1, the term c2 is less than c. Secondaryexpenditures in round three are therefore less than in round two.
The total change in income for successive rounds of increased secondary spending is given by:
AcccAcAcAcAAD ∆++++=+∆+∆+∆+∆=∆ ...)1(... 3232
As c is less than 1, the total value is a decreasing geometric series, the sum of which is equal to:
YcAAD ∆=−∆=∆ −1)1(
Therefore, the cumulative change in aggregate output is equal to a multiple of the increase inautonomous spending. The multiple, (1-c)-1, is the multiplier7, the size of which is directlyproportional to the size of the marginal propensity to consume.
6 Lower case c is the marginal propensity to consume and Y is output. The marginal propensity
to consume is the increase in consumption per unit increase in income.
Employment Effects of Waste Management Policies
Page A1-14
Although multipliers provide �order of magnitude� estimates of the growth in outputor income resulting from the capital expenditures stemming from a new policy, theytend not to be included in CBAs8. The argument for not including output/incomemultiplier effects is that induced or secondary benefits are generally viewed astransfers within an economy rather than net additions to the productivity or income ofthat economy (Abelson, 1996). This argument for ignoring induced effects is basedon the presumption that resources are essentially fully employed, and any unemployedresources are completely mobile and are distributed evenly throughout the economy.9If resources are fully employed (or completely mobile and evenly distributed), thenthe effect of the multiplier is cancelled out as all additional demand must be met byimports. In such cases, there are no secondary economic benefits.
Because the above conditions do not generally hold, however, secondary benefits mayoccur which reflect more than just transfers within the economy. As a result,examination of multiplier effects may be important. Inclusion of such effectswarrants some care, though, as it unlikely that all additional spending will be new andhence a net addition to real output. This indicates that where expenditure is not new,multipliers will overestimate effects on both output and employment.
This is because they ignore any impacts stemming from possible reductions in supplyand demand which may occur as a result of a given sector (or consumers moregenerally) having to fund the expenditure required by the policy. As a result, they donot provide an indication of the net effect of the changes that may filter through theeconomy as a result of the introduction of a new regulation. Such net effects can onlybe captured through the use of macroeconomic modelling techniques.
In addition multipliers will change in value as a result of shifts in technology. So, forexample, where a waste management policy would lead to such shifts (with end-of-life recovery perhaps being examples of policies leading to such shifts), theapplication of old-technology based multipliers will lead to incorrect estimates ofeither total output or total employment effects.
A1.5.4 Manpower to Expenditure Ratios
Related to the Type I multipliers discussed above is the use of manpower toexpenditure ratios to predict increases in direct and indirect employment as a result ofthe new expenditure required by a policy. These are presented separately here as theyare generally derived using less disaggregated data than those that are based on formalinput-output tables.
In relation to environmental policies, these ratios are generally developed as follows:
7 It is also possible to express the multiplier in terms of the marginal propensity to save, i.e. 1/s.
8 In the above example, the effects of taxes and imports have been ignored. These serve to lessen theincreases in demand for domestic output induced by secondary increases in income, and thereby lowerthe multiplier.
9 It will be recalled from earlier in this discussion, the mobility of labour was cited as one of theunderpinning reasons for employment not being taken into account in cost-benefit analyses.
Risk & Policy Analysts
Page A1-15
• identifying the types of actions that will be taken in order to implement a newpolicy (e.g. adoption of pollution abatement equipment or construction of arecycling facility);
• developing engineering estimates of the capital and operating expenditurerequired;
• linking these estimates to the sectors that would supply goods and servicesrequired by the capital and operating expenditure; and
• combining data on the number jobs created per unit of expenditure in each of thesectors supply the goods and services with the levels of expenditure required todetermine the number of new jobs created by the policy.
Two recent examples of the use of this type of approach to examine the number ofjobs created by changes in environmental policy are given by WRc (1999) and Headyet al (2000). The most relevant of these, as it examines waste management policies isthe work undertaken by WRc for DG Environment. Manpower to expenditure ratioswere used in this study to predict:
• the direct employment stemming from the increased labour requirementsassociated with operating expenditure (whether stemming from the introduction ofnew plant or other increased manpower requirements);
• the (first order) indirect employment arising in the industry sectors meeting newcapital requirements (where these included the capital goods, construction andservice sectors); and
• the (first order) indirect employment stemming from operating expenditure onmaintenance, energy, materials and other non-labour from capital expenditure(where new jobs would be crated and operating expenditure.
The argument underlying the use of this approach is that it provides a good reflectionof the more tangible employment impacts arising from a policy, and does not confusethese effects with several rounds of downstream effects (i.e. the use of a Type IImultiplier). As a result, these ratios result in a better indication of the actualrelationships between different environmental policies and employment (and in sodoing avoid reliance on assumptions concerning market equilibrium and fullemployment common to the macroeconomic modelling approaches); the results areoutputs that are more policy relevant. The authors accept, however, that the approachhas limitations in that the analysis is only partial.
The approach involved the adoption of an engineering analysis building upon themethodology developed by ECOTEC (1997), which categorises the recipients ofcapital expenditure and operating expenditure for five different types ofenvironmental policies/projects. The recipients were broken into six categories:labour, energy, intermediate goods, capital goods, construction and services. Theoutputs are a series of relationships indicating the percentage of expenditure that is
Employment Effects of Waste Management Policies
Page A1-16
likely to be spent on the services provided by the different sectors when undertakingdifferent environment-based measures.
The analysis found that for waste the relative expenditure per full time equivalent(FTE) job is lower than for other policy related to air and water. It also highlightedthe influence that the strategy adopted for implementing a policy can have toemployment creation, with a case study on End of Life Vehicles suggesting thatemployment effects can vary by a factor of five depending on the nature of thestrategy used.
Table A1.2 provides a summary of the expenditure to employment relationships foundfor the three waste related policies examined by the study. Of note from the table arethe capital and operating expenditure to employment ratios implied by the studyfindings. For example, one FTE job is created indirectly through roughly €115,000expenditure on capital requirements, with this apparently varying only to small adegree when moving to other environmental policy areas. The picture is morecomplex with regard to operating expenditure; the average figure of roughly €53,000for the three waste management policies covers both direct and indirect employmentcreated. From a more detailed review of the findings, however, it can be seen that thedirect employment costs are roughly €30,000 per FTE, with expenditure per indirectFTE job created more in line with the figure quoted above for capital expenditures.
Table A1.2: Manpower to Expenditure Ratios for Selected EC Policies
Source: WRc, 19991 Based on the assumption that no new hazardous waste incinerators are built and that the pollutionabatement equipment needs to be replaced in all existing facilities.2 Based on the assumption that all Member States just fulfil the minimum targets at the lowestpossible costs. This is a theoretical calculation that does not reflect the empirically found costs ofimplementing schemes in Member States.3 The figures for the individual policies were calculated by RPA based on the figures given for totalwaste and all policies within the various WRc reports.
How good an indicator are such figures as to the real employment impacts of thesewaste management policies? Firstly, the accuracy of the above figures will dependupon the accuracy and robustness of the assumptions underlying the development of
Risk & Policy Analysts
Page A1-17
the capital and operating cost requirements. More importantly for the purposes of thisstudy, this modified multiplier-based approach fails to capture induced demandeffects, including multiplier effects stemming from increased employment and wageincomes and any accelerator effects resulting from increased investment. This failureto include second order effects may result in either significant over- or under-estimates of employment effects.
In addition, the criticisms noted above with regard to the more formal input-outputtable based multipliers, also apply to the use of these ratios. In particular, theyassume that the expenditure leads to new jobs (as opposed to shifts in employment)and they fail to recognise that expenditure on waste management may result in shiftsin spending and income (thus affecting supply and demand relationships in othermarkets), which may significantly decrease the estimated gains.
A1.5.5 Change in Productivity Estimates
The final form of demand-side analysis is the use of econometric analyses to derviseestimate of the impacts that environmental regulations have had on the productivity ofindividual industry sectors and, thus, indirectly on the economy more generally.Much of the research concerning this issue has been undertaken in the US in responseto business claims that environmental policy damages competitiveness, leading toindirect impacts on economic growth across the economy as a whole. The line ofargument is that the compliance costs arising from environmental regulations lead to alack of investment and, therefore, a reduction in productivity. As a result, there is aloss in both the productivity of and employment by companies in the regulated sector.These losses in productivity and employment then leads to further reductions ininvestment and consumer spending, which in turn lead to a reduced demand for thegoods produced by other sectors and, hence, in economic growth in general.
The research carried out on this issue has reached varying conclusions, although mosthas concluded that the effects have been minimal10.
The premise of most of this research has been that estimates of environmentalexpenditure costs alone are under-predictors of the true costs to companies ofenvironmental regulations. The true economic costs of regulation will vary fromcompliance costs figures as a result of (Morgenstern et al, 1997):
• the adoption of cost-saving innovations (a positive effect in contrast to those thatfollow);
• changes in operating flexibility;
• the crowding-out of non-environmental investments; and/or
• discouraging investment in new equipment as a result of differential performancerequirements for new versus existing plant.
10 See for example OECD (1997) and Worldwatch Institute (2000), Robinson (1995), Gray & Shadbegian
(1994) and Morgenstern et al, 2000.
Employment Effects of Waste Management Policies
Page A1-18
The estimation approaches that have been adopted to predict the magnitude of indirectand induced economic effects have generally been based on the use of compliancecost estimates (or Pollution Abatement Cost Estimates - PACE), which are generatedthrough industry surveys or through review of CBAs prepared as part of theregulatory approvals process. Econometric analysis is then used to derive anindication of the relationship between environmental expenditure and total costs,based on industry production function data. The studies themselves produce widelyvarying results. At the high end is a calculated relationship of $1 in environmentalexpenditures leading to $12 increase in total compliance costs (Joshi et al, 1997),while the low end suggest a relationship closer to $1:$1.13 (Morgenstern et al,1997)11.
The purpose of such studies varies. Some are aimed at providing a means for moreaccurately predicting the direct compliance costs implications to industry ofimplementing new environmental regulations. They therefore address questionsrelated to the potential opportunity costs faced by a particular company or industrysector arising from new regulations. Other of the studies, such as that undertaken byRobinson (1995), are aimed at identifying the sum of direct and indirect costs (asmeasured by a loss in productivity) to the economy more generally.
However, it should be recognised that these analyses focus on the changes in inputdemand and hence productivity resulting from investment in compliance costs ratherthan other factors of production. They do not recognise the full interrelationships thatexist within an economy, for example, that investment in pollution abatement(including waste management) increases the demand for the goods and servicesprovided by the environment industry, which may offset decreases in the productivityof the economy.
A1.6 Macroeconomic Modelling Approaches
A1.6.1 Overview
Macroeconomic modelling recognises that the implementation of new regulations byindividual companies affects their behaviour as �buyers� and �sellers�, which in turnaffects their interactions at inter- and intra-sectoral levels. They contrast to I-Omodels, which often forms the starting point for such models, as they provide moresophisticated representations of the supply and demand relationships within aneconomy, allowing for price and substitution effects to take place. They also varyfrom a CBA-based (partial equilibirum) approach in that they model the impacts of apolicy intervention in terms of its impacts on the economy as a whole (generalequilibrium).
To illustrate the difference between a CBA-based appraisal and the use of amacroeconomic model, assume a tax is imposed on waste disposed to landfill. It islikely that the imposition of such a tax will have impacts beyond the waste disposalindustry. Firstly, the increase in waste disposal costs will affect the production costs
11 See also Gray & Shadbegian (1993), Robinson (1995) and Porter & Van der Lindhe (1995).
Risk & Policy Analysts
Page A1-19
and, hence, supply curves (shifting them upwards) of the markets relying on landfillfor the disposal of residuals. As prices in these markets rise, demand for their goodsand services will fall, inducing a second round of effects on the demand for wastedisposal. As demand for substitute goods rises (with the demand curves shifting outand upwards) production inputs will be reallocated across the economy, with this alsoaffecting the earnings attributable to different factors of production (e.g. labour,capital, etc.). Finally, since different actors in the economy may not have the samemarginal propensity to save/consume, the pattern of relative demand for differentgoods and services may change. These changes will result in a new set ofconsumption levels and product prices, which, in turn, will directly affect the rate ofproductive capital formation, technological innovation, labour supply, and theeconomy�s dynamic growth path.
When the increase in waste disposal costs would lead to significant impacts on theprices faced by consumers in other sectors, partial equilibrium calculations of thecosts and benefits of the tax will give a very poor approximation of the overallimpacts of the tax policy12. The assumption of ceteris paribus, which underlies theuse of a partial equilibrium approach such as those adopted in conventional CBAs(and CEAs) becomes invalid (Mishan, 1994). Thus, when a policy induces pricechanges in related markets (non-marginal price changes), macroeconomic models,because they explicitly model the interactions between markets, give a relatively moreaccurate picture of the overall impact of a policy.
Two different types of models can be used for analysing effects at the macroeconomiclevel. These are:
• econometric models which are essentially aimed at predicting macroeconomicperformance in relation to a number of key variables such as growth, inflation andunemployment rates; and
• general equilibrium (GE) models that are more concerned with the use ofresources and ensuring that they are allocated to generate the highest possible levelof output.
A1.6.2 Econometric Models
The first category of macroeconomic model is that of the econometric models, wherethis includes the EC�s model HERMES and the E3ME model used in this study.Econometric models may be either macroeconomic or sectoral in coverage and areessentially applicable to analysing short to medium term policy impacts. They are allhighly complex, involving numerous equations and time lags to allow for a dynamicanalysis.
The models are generally based upon an accounting framework to which behaviouraldata are added (OECD, 1997). As with input-output models, changes in final demand
12 It will be recalled from the discussion given above that the more inelastic the supply functions are in
the related markets, the more important it is likely to be that a general equilibrium analysis isundertaken rather than a partial equilibrium analysis.
Employment Effects of Waste Management Policies
Page A1-20
are taken as the starting point but they are then linked to production or input demandfunctions that incorporate capital, energy, labour and intermediate goods. Throughthese functions and the associated impacts on demand, prices and real wages, newequilibria are reached for the various sectors. Once these equilibria have beencalculated, changes in output and employment can be determined at a sectoral andmacroeconomic level.
The main drawbacks commonly noted in the literature surrounding these types ofmodels with regard to the assessment of waste management policies are:
• the forecasting time frame for most models is generally limited to between fiveand seven years (in order to ensure that the underlying assumptions reflectchanges in the structure of the economy). This may be too short a time period forexamining the full effects of certain waste management policies as it may notallow for fundamental structural and relative price changes to captured in the endpredictions;
• these models do not include any explicit welfare functions to explain individuals�behaviour and thus allow for non-optimal solutions to be found in terms of welfaremaximisation;
• because the models do not specifically model changes in welfare (as do CBA orGE models), they rely instead use measures such as changes in gross domesticproduct (GDP) as a proxy. Such measures of change would therefore need to becombined with a CBA to determine whether a proposed policy would deliver neteconomic benefits;
• these models assume fixed production relationships that are developed on thebasis of time series data. Where a policy would alter these relationships, forexample as a result of technical innovation, then the estimated effects will beincorrect (Frankhauser & McCoy, 1995); and
• because of their structure, they are governed mainly by demand rather than supplyconsiderations and, as a result, the model design may set limits to any predictedimpacts on unemployment rates; and
• they are commonly criticised for being overly sensitive to assumptions set out intheir underlying equations, with uncertainty on key equations resulting inuncertainty over the analysis results.
One of the main advantages of these models is that they are good at providingpredictions of big macroeconomic numbers, such as changes in employment. Inaddition, as they are based on historical, empirical data, they are often more accuratethan GE models. In this regard, it important to note that (in contrast to many of thegeneral equilibrium (GE) models) several of the econometric models currently in use(such as the E3ME model which is described in more detail in Annex 2) allow forunemployment and do not assume perfect competition; they also allow for non-linearities between input demand and productivity.
Risk & Policy Analysts
Page A1-21
A1.6.3 General Equilibrium Models
In contrast to the econometric models (which are driven by changes in aggregatedemand), GE models are driven by changes in price. These models consider bothsupply and demand interactions (in contrast to the econometric models which focusmore on demand), and are capable of dealing with longer planning horizons. As aresult, analysts can examine the long-term movements in economic variables as aneconomy moves towards a new equilibrium. An equilibrium in the economy isachieved at the set of prices that equate supply and demand in every market, with thisset of prices being referred to as market-clearing prices. In addition, welfare isexplicitly accounted for by assuming that individuals maximise their utility (orsatisfaction) for a given level of income.
These models are based on the concepts underlying I-O models, but the system iscompleted by including all of the relationships needed to represent the entire circularflow of the economy. Choices are then determined within the model (endogenous toit) by allowing some relationships to take a flexible functional form to enableindividuals� to adopt optimal responses to changes in prices. Thus, production in eachsector becomes a function of input prices and output prices, consumption becomes afunction of income and prices, and those prices are determined by the model. Themodel is then solved to find the level of prices, consumption, and production such thatthe quantity supplied is equal to the quantity demanded in all markets.
Applied, or computable, GE models are the most sophisticated type of GE models andare capable of quantifying the direct and indirect effects of environmental policies onthe structure of the economy and product mix, economic growth, the allocation ofresources and the distribution of income. Although there are many examples of CGEmodels, Zerbe & Dively (1994) suggest that the best �thought-out� models will havethe following elements:
• a description of the utility functions and budget constraints of each household inthe economy;
• a description of the production functions of each company in the economy;
• the government�s budget constraint;
• a description of the resource constraints of the economy; and
• assumptions relating to the behaviour of households and companies in theeconomy.
There are also variations in how a CGE analysis is conducted, although most analysesinvolve the following basic steps (Gramlich, 1990):
1) the baseline, or pre-policy change world is represented by a system ofempirical equations describing demand and supply in all relevant markets.This model is subsequently solved, usually by computer, to yield a pre-policyvector of production and consumption prices;
Employment Effects of Waste Management Policies
Page A1-22
2) the proposed policy change is then modelled by shifting the supply anddemand curves appropriately;
3) the model is re-solved, yielding a new vector of production and consumptionprices; and
4) finally, the overall net benefit/cost of the proposed policy is determined byexamining the difference pre- and post-policy vectors of prices.
Various applied CGE models have been used to assess the implementation ofenvironmental policies, with the results concerning the impacts on employment andGDP indicating in general positive impacts. This is illustrated by the studies reportedin the OECD (1985) report on the 'Macroeconomic Impact of EnvironmentalExpenditure', and several more recent studies (described in OECD, 1997). The typesof results generated through these analyses for a range of countries are presented inTable A1.3.
Table A1.3: Estimated Macroeconomic Impacts for Various Environmental Investments
Country Policy Period GDP Unemployment
Netherlands Doubling annualenvironmental expenditure 1979-87 -0.3 to 0.6% +10 000 to
-6 000
Norway Increases in private sectorenvironmental expenditure 1974-83 +0.1 to
0.9%-25 000 (fall inunemployment)
USA Additional Federalexpenditure 1970-87 -0.7% -0.4% (fall in
unemploymentBelgiumGermanyFranceUK
Doubling of environmentalinvestment with policycoordination across fourcountries
5 years
+0.06+1.21+0.90+0.96
- 18 300-106 000- 66 000-103 000
Source: OECD, 1997
As indicated, CGE models compare two distinct states of the economy; pre-policyversus post-policy. The difference between the two �states� represents the net(economic) effects of implementing the policy in question on the economy, which canbe used to supplement the outputs of a CBA as part of decision making. Theestimated net effects will, however, relate only to the (compliance) costs ofimplementing an environmental policy, and will not account for any social orenvironmental benefits that remain external (outside) the market.
CGE models give an indication of what should happen in response to a policy or othereconomic change, assuming that the economy in question conforms to theassumptions of the model. As a result, some commentators take the view that thesemodels are too abstract for the real world, arguing instead for use of more traditionalpartial equilibrium approaches that take a set of observations relating to what isactually happening.
The inherent complexity of CGE models means that the amount of time and effortrequired to collect the basic data, and build a suitable model, is often prohibitive. As
Risk & Policy Analysts
Page A1-23
a result, no model can actually include all possible markets. In practice, manymarkets are aggregated together and other simplifications are made to create a useableand practical model. As a result, models are generally tailored to particular needs andfunctional forms are chosen with an eye to reducing the number of elasticity-relatedparameters that must be estimated. This usually means that most CGE models have anI-O model core that defines production relationships in terms of intermediate inputs,and the only flexibility in production is usually some substitution between capital andlabour as inputs.
In addition, most CGE models start from the assumption that there is nounemployment, i.e. the labour market is in equilibrium. Consequently, any change inemployment levels is a result of voluntary decisions on the part of the workforce.This aspect of CGE models causes studies to reach different conclusions regarding theimpact on employment of implementing environmental policies, and subsequentlyleads the OECD (1997) to advise that the results of studies using models should beconsidered with reservations.
A1.7 Non-Monetary Assessment Approaches
The previous sections detailed the quantitative, economics-based approaches forexamining the impacts of waste management policies on employment and theeconomy more generally. It is important to stress that employment and indirecteconomic impacts can also be assessed using more qualitative/semi-quantitativeapproaches. For example, impacts could be assessed in terms of:
• number of long-term full-time job equivalents;• number of jobs by occupational skill category;• change in employment relative to regional or national average rates;• the quality of the job created (e.g. taking into account associated health risks); and• the average wage rates associated with the jobs created.
In addition, one could always define a range of lower level, more specific indicatorsdepending on the nature of the proposed measures under consideration and their likelyimpacts (for example drawing on social sustainability indicators). Whateverindicators are selected, it will be important to ensure that they are capable ofdistinguishing between alternative policy proposals in terms of the end impacts.
What types of approaches could provide the basis for such assessments? In manypolicy appraisals, employment and wider economic effects are considered togetherwith equity and distributional issues13. This is the case, for example, in the US andCanada [see for example Ontario Ministry of Environment & Energy (1996) and USEPA (1999) for further details of the specific requirements of these countries]. Thetypes of issues taken into account in these assessments will generally relate to a rangeof considerations in addition to employment, such as:
13 Where equity relates to �fairness� and distribution to the share of costs or benefits to sub-populations
within society arising from the introduction of a policy.
Employment Effects of Waste Management Policies
Page A1-24
• impacts on vulnerable or other particular groups within society;• impacts on income distribution;• impacts on industry, taking into account size, age of plant, etc.;• creation of barriers to entry into a market sector; and• impacts on price inflation across the economy.
Formal equity analysis has both a descriptive and a normative component. Thedescriptive component will generally include describing the populations that will beaffected (where these effects are significant enough to matter) and the degree to whichcosts and benefits are likely to be shifted between groups. The more quantitative(normative) component involves directly incorporating such effects into aggregatemeasures of option performance. This requires that costs and benefits falling on eachgroup are quantified and then weighted, with the latter reflecting the importance thatshould be placed on the impacts incurred by different sections of society. Althoughsuch weights can be derived through the use of utility theory and other approaches, anumber of problems arises in so doing (see Little & Mirrlees (1974) and Ableson(1996) for further discussion). As a result, the direct incorporation of utility weightsinto economic appraisals is rarely undertaken. There are, however, examples of theuse of �distributional weighting� systems as part of CBAs concerning land use issuesand project and policy proposals in developing countries, where equity issues can beof prime importance. For most developed countries, however, the use of this type ofapproach is not as common, with such information being provided throughsupplemental analyses.
Instead, a simplified version of equity analysis is sometimes adopted. This againinvolves describing the likely impacts across different end points and for differentgroups or populations of concern. Once it is known what end points are of concernand for what sub-populations, simple scoring methods can be used to indicate thelikely direction of impact. An example of a simple �trend analysis� for increasedrecycling is given in Table A1.4, covering not only employment and indirect effectsbut also other considerations.
Assuming that these end impacts are of equal importance (an assumption which isunlikely to hold in reality), the above table suggests that there would be net benefits interms of the wider effects of the proposed waste management policies. However, thevalue in applying this type of approach is not in being able to add up the numbers of'+' and ' -' scores. It is in setting out the impacts of concern and systematicallydefining what they might be. Through this type of process alone, without any furtherquantification, decision makers will be provided with valuable information to setalongside the results of any CBA.
Alternatively, an approach based on consideration of the life-cycle effects of thepolicy could be adopted. Table A1.5 sets out an example summary table (based onWorldwatch Institute, 2000) concerning the employment implications of policiessimilar to the WEEE and End of Life Vehicles Directives. A complementary tablecould be developed to reflect the likely indirect and induced economic impacts.
Risk & Policy Analysts
Page A1-25
Table A1.4: Example of a Simple Approach to Assessing Wider Effects of Increased Recycling
Type of Impact Gain or Loss Comment
Prices of end products - Prices to consumers may increase
Impacts on manufacturingsector -
Price increases may affect demand, but keyconcern surrounds the ability of smaller
companies to absorb cost increases in order toremain competitive
Reduction in materials coststo other sectors + Recycled goods acting as lower cost inputs to
other production processesImpacts on exports 0 No impacts likely
Unskilled Employment ++
Waste recycling will lead to gain in direct andindirect employment although some
rationalisation of current operations expected;some concern over quality of jobs
Specialist Employment + Product re-design, etc. will lead to gains inindirect employment
Total ++Overall judgement is that there will be a net
gain
Table A1.5: Example Summary Table of Employment Implications of Durable, Repairable andUpgradable ProductsProduct-Life-CycleStage Observation Employment
Effect
Design and engineering Intense redesign of products and productionprocesses required Positive
Energy and materialsinputs
Fewer products, therefore fewer raw materialsinputs needed but more robust materials required Negative
Manufacturing/assemblyFewer products, but production more attentive todurability and quality and likely to be produced insmaller batch mode
Mixed
Distribution/transportationFewer products shipped to end consumer butincreased local circulation from users to repairshops, recyclers and back to consumers
Mixed
Maintenance Revitalising almost abandoned functions; labourintensive Positive
Re-manufaturing Currently limited; labour intensive Positive
Upgrading Currently limited; labour intensive Positive
Consulting/performancecontracting
Advisce on maximizing product utility andextending product-life; guidance on substitutingservices for goods
Positive
Disposal at end of life-cycle/ reuse and recylcing
Fewer products to be disposed of; but greaterrecycling plus disassembly of parts andcomponents for reuse; more labour-intensive thanlandfilling and incineration
Positive
Source: Worldwatch Institute, 2000
Employment Effects of Waste Management Policies
Page A1-26
Risk & Policy Analysts
Page A2-1
A2. THE E3ME MODEL USED IN THE CASE STUDY ANALYSIS
A2.1 Overview of the Model
The E3ME model has been used in the case study analyses (see Sections 4 to 6) toexamine the impacts that the various waste management policies have had onemployment and gross domestic product (GDP). It is an econometric model thatincorporates input-output tables to provide its accounting framework, with a series ofbehavioural relationships then used to model responses to changes in demand andprices.
In order to estimate the total value of the direct and indirect economic impacts of apolicy on output (as measured by GDP) and on employment, the following types ofimpacts were fed into the model for each of the case studies:
• changes in direct sectoral employment and associated average wage rates;• capital investment requirements and associated operating costs; and• data on changes in final demand at a sectoral level.
Figure 2.1 provides a flow chart representation of the some of the key interactionsallowed for in the model. Given the changes predicted for each of the case studies,estimates were generated on changes in total employment (covering direct, indirectand induced) employment, as well as in GDP for the economy as a whole. Theimpacts on GDP stem from any changes in income generated by changes inemployment, resulting in an increase/decrease in consumer expenditure, which arepredicted as leading to further rounds of increases/decreases in demand. These in turnmay lead to increases/decreases in import demand, with this and all of the otherinteractions simulated until a new stable solution is reached across the EU.
Figure A2.1: Interactions within the E3ME Model
Activity, Prices
EU Transportation & Distribution
Exports
Total Demand
Employment
EC Policy
Consumers' Expenditure
Incomes
Imports
OutputInvestment & Inputs to
Production(input-output)
Other Regions'Output
EU Outside Region
Rest of the World
EU Inside Region
Employment Effects of Waste Management Policies
Page A2-2
A2.2 The Model Assumptions and Their Implications for Case Studies
The E3ME is a model is based on historical data for the EU, which in some case mayhave been estimated. This is a strength in that the behaviour represented in the modelis based on statistical analysis of past behaviour of industries and consumer over theyears, with the data covering the period from 1970 to 1995. However, the model isused to give projections of what might happen in the future. In most areas ofeconomic life, behaviour in the past is a good guide to behaviour in the future; insome areas though there may be evidence of a change in underlying relationships. Inmany cases, such changes can be included in the model projection by introducingspecial assumptions. This is done for new infrastructure projects, such as investmentsin transport links. Similarly, new technologies are introduced by changing the input-output coefficients. Other changes in behaviour may be more far-reaching and lessamenable to simple adjustments.
One area where substantial changes are expected is that of price formation in thesingle European market, following reductions in trade barriers and the moves towardsa single monetary area. Economies, such as Greece, Italy and Spain, where inflationhas been significantly higher than in the rest of the EU have switched from nationalcurrencies to the euro. As a result, it is no longer possible for their currencies to bedevalued to compensate for high domestic inflation. This change may lower theexpected inflation rate and, hence, actual inflation following an inflationary shock,such as an increase in costs as a result of an environmental regulation or tax.
Aside from changes to behavioural relationships, which can be altered to a limitedextent through changes to the input-output coefficients, there are factors that themodel takes as given, known exogenous variables. These fall into a variety ofcategories, such as demography (population, working population), monetary policy(interest rates, exchange rates), and fiscal policy (direct and indirect tax rates). Noattempt was made to alter the profile of these assumptions in the policy scenariosadopted for the case studies. So, for example, the €/$ exchange rate is the same in allmodel runs. In reality, these factors will change. A policy that induces greaterinflationary pressure will be met by tighter monetary policy, which in turn can affectthe exchange rate. On the whole, however, the view has been taken that the relativelysmall changes to the macro aggregates of employment and output brought about bythe waste policy measures are unlikely to have brought about changes inmacroeconomic policy.
Another point concerning the uncertainties surrounding the model projections isrelated to the econometric nature of the E3ME model. In any exercise such as this, avariety of sources of uncertainty exist:
• data: historical time series data may be estimated, incurring measurement errors;
• parameters: the values used in the equations are point estimates, in that they arethe mean value from a larger distribution of possible values;
• assumptions: errors could be made in exogenous forecasts, as mentioned above;and
Risk & Policy Analysts
Page A2-3
• model: results are presented on the assumption that the model is correctlyspecified with appropriate functional forms.
Data uncertainty seems inherent in this process, as much of the series required are notdirectly observable and, therefore, need to be estimated. Parameter uncertainty willalso be present, and is a particular problem when underlying relationships arebelieved to have changed, perhaps through a new era of price stability brought aboutby the introduction of the euro and the independence of the new ECB. Modeluncertainty is present whatever the model type, whether econometric, generalequilibrium, etc.
It is sometimes possible to convey the degree of uncertainty surrounding a modelprojection by adding in what are called ‘confidence limits’, which represent the rangeof uncertainty in the projections to a certain degree, say 95%. The interpretation isthat one is 95% confident that the projection will lie between the upper and lowerboundaries, with the point forecast usually lying somewhere in the middle. There aretwo caveats to this approach. Firstly, the confidence limits only take account of theparameter uncertainty and, thus, still assume that the model is correctly specified,assumptions are accurate, and the data do not suffer from measurement errors.Secondly, in a model as complex and large as E3ME, it is simply not feasible toidentify the uncertainty element in the model parameters.
In spite of this, there is a number of ways of conveying uncertainty in results, the mostcommon of which is through sensitivity and scenario analysis. Sensitivity involvesrunning the model with singular changes, e.g. to a particular parameter, to test the sizeof the reaction. Scenario analysis, as undertaken in this study, aims to build up amore complete set of changes to check whether the results conform to priorexpectations. More could be done in this area, for example by altering the magnitudeof the various waste policy changes to gage whether the effects on output andemployment were proportional, but this is beyond the remit of the current study.
Employment Effects of Waste Management Policies
Page A2-4
Risk & Policy Analysts
Page A3-1
A3. ANALYSIS OF DATA ON EMPLOYMENT ACTIVITIES RELATEDTO WASTE MANAGEMENT
A3.1 Existing Studies on the Environment and Employment
A3.1.1 The Literature Review
In order to identify literature relevant to this study, a number of sources have beenconsulted. An extensive Internet search was undertaken, covering sites such as theOECD, European Commission, Eurostat, the European Topic Centre on Waste,national statistics offices, national environment agencies and governmentdepartments. Contact was made with a number of associations and companies, whichprovided additional publications as well as information on employment within thewaste management industry based on their experience.
The major studies reviewed generally fall into one of four categories:
• the environment industry, both internationally and nationally;• waste management;• studies looking specifically at the impacts of directives and policies; and• studies which focus on specific waste activities.
A3.1.2 Environment Industry Studies – International
A number of studies have looked at the environment industry in general with regardsto employment, number of enterprises, turnover and so on. These include studies bythe OECD (1996) and by ECOTEC (1999). The OECD study describes the status ofthe environment industry in the main OECD countries and examines the prospects forgrowth, related to market developments and environmental policies. The ECOTECreport was prepared for the European Commission, DGXI, to provide an analysis ofcurrent export activity by the EU eco-industry, the employment effects of this exportactivity, future export opportunities and to develop appropriate policyrecommendations for promoting EU eco-industry exports and employment in thefuture.
OECD (1996) discusses the main obstacles in analysing the environment industry,which are in part due to the complexity of definition but also due to the lack ofinformation in some newer areas. The first problem is the heterogeneous nature of theindustry, and the goods and services produced, making data collection complicatedand comparisons difficult. Secondly, many producers of environmental equipmentand services have a low degree specialisation in these products, and are thereforeclassified under another line of business. Thirdly, there are problems in agreeing theboundaries of the industry.
OECD (1996) also considers the role of the environment industry in creating jobs, anddata presented suggests that there has been a positive effect with the growth of theindustry. However, it is recognised that there are also job losses, with the overall
Employment Effects of Waste Management Policies
Page A3-2
employment change being the sum of two different effects, those jobs created by thegrowing environmental goods and services industry, and those either created ordestroyed by the impacts of environmental regulation on other industries. Theaggregate direct and indirect benefits and costs, gains and losses due to the impacts ofregulation have proved difficult to model.
The wide ranging definitions and data for the environment industry as a wholeprovide little more than an indication of waste management employment. Accordingto OECD (1996) the environment industry accounts for no more than 1% of the totalemployment in any country, and waste management produces 20-30% of the overallEuropean environment industry output.
A3.1.3 Environment Industry Studies – National
Three national studies have been identified, two covering Sweden and one focusingon Austria. The Swedish studies aimed to identify enterprises where environmentalproduction is the principal activity, rather than measuring total environmentproduction. The Austrian work concentrated first on providing quantitative measuresof employment, and secondly on the quality of environmental employment, with anemphasis on waste management.
These reports provide more specific information on the waste management sector ofthe environmental industry, and provide a breakdown of employment in terms of age,sex, education and related factors. Both Austrian and Swedish research shows thatconditions may be below average. There is a low concentration of qualifications, andsubsequently lower incomes. The risks of accidents and ill health are potentiallysignificant, but there is insufficient research to evaluate these risks fully.
A3.1.4 Waste Management Studies
Several studies focused specifically on the waste management sector. The Coopers &Lybrand (1996) study aims to identify the combination of Municipal Solid Waste(MSW) treatment methods which would minimise the total net economic costs ofMSW management. The key findings from the study are that, as expected, the unitcosts of collection are significantly higher in rural areas than urban areas. The costsof semi-automatic sorting/processing are two and a half times those of manualprocessing. However, the costs of reprocessing vary significantly between materials.
In comparison, Cottica & Kaulard (1995), attempted to model the choice of municipalwaste management options for a hypothetical European medium-sized city based onresearch in four countries (France, Germany, Italy and the UK). The costs andbenefits of selecting ‘green’ waste management solutions as opposed to baselinemanagement (good quality waste management, but with no particular emphasis onrecycling) were estimated for each town. The study found that increasing recyclingwithin municipal waste management has a strong and positive effect on employment,but incurs higher capital costs.
Risk & Policy Analysts
Page A3-3
A3.1.5 Studies of Waste Management Directives and Policies
Three key studies have been identified:
• WRc (1999) considered the investment and employment impacts of EUenvironmental policies. This included the Hazardous Waste Incineration Directive,Packaging and Packaging Waste Directive and Directive on End of Live Vehicles;
• Whiston (1995) looked specifically at employment associated with therequirements for increased recycling and improved disposal of the materials andcomponents in the context of the End of Life Vehicles Directive. The prime focuswas on the employment consequences of different technological andorganisational options;
• Quirion & Glachant (1996) reviewed the employment potential of contaminatedsite remediation policies in the Netherlands, Germany and France.
The overall conclusion of the WRc report was that environmental policies are havinga small but positive impact on employment. The authors highlight that alternativestrategies to reach the same environmental goals may have variable labour intensitiesassociated with them. An assessment, made in the case of the Directive on End ofLife Vehicles, has demonstrated that employment can vary by a factor of fivedepending on the nature of the strategy used.
Whiston similarly emphasises that, as the End of Life Vehicles Directive specifiestargets rather than techniques, there are a number of ways in which manufacturerscould meet the requirements, and hence there is a range of employment scenarios. Theemployment effects may not be similar in each Member State, as some countries mayspecialise in particular processes, depending on the existing expertise andinfrastructure. There may be a reduction in employment if current dismantlingprocesses are rationalised as a result of increased recycling.
Quirion & Glachant concluded that, as each contaminated site is different as regardsits geographical features, the available technical options and their related costs andemployment may differ significantly. There may also be a negative employmenteffect in the polluting firms, due to the increasing requirements (and associated costs)to decontaminate sites. Site remediation also requires a rather skilled workforce andis, therefore, not likely to provide employment for those with few qualifications.
A3.1.6 Studies on Specific Waste Activities
The majority of the reports considering specific waste streams and employment tendto focus on household waste and recycling. They focus on the job creationopportunities in recycling, but give no consideration to the quality of such work.Although they recognise that job replacement may occur if recycling is increased,there is no attempt to evaluate the extent of this. Estimates of employment levelsconnected with recycling are therefore gross estimates and no account is taken ofopportunity costs.
Employment Effects of Waste Management Policies
Page A3-4
A3.2 Availability and Applicability of Waste-Related EmploymentStatistics
A3.2.1 Sources Consulted
European-wide data on employment in environmental industries, as well as in othersectors, are collated as part of Eurostat’s Structural Business Statistics. There are twokey problems with these data:
• a mis-match between the NACE codes used for classification of industry sectorsand the structure of the waste management industry; and
• incomplete data, even within the relevant NACE codes.
In order to address the issue of definitional mis-match, we also reviewed statistics onwaste-related data at the national level to identify countries where a more detailedbreakdown of the environment sector was used. To address the problem of dataincompleteness, we sought European-wide data on waste streams within individualcountries from the Eurostat MILIEU database, the European Topic Centre on Wasteand the European Environment Agency, in order to combine this with data from thewaste studies on the numbers of jobs created per tonne of waste.
A3.2.2 Definitional Issues
The main NACE codes covering the waste management sector are:
• 37: recycling of refuse or waste;• 51.57: wholesale of waste or scrap; and• 90: sewage and refuse disposal, sanitation and similar activities.
These definitions pose problems of both over-estimation and under-estimation inevaluating waste-related employment.
The potential for over-estimation arises because NACE 90 includes employment insewage, sanitation and amenity activities such as street cleaning as well as wastemanagement. At national level, the Sweden and Denmark have developed a furtherbreakdown of NACE 90 to separate out waste management from sewage disposal andsanitation. The Swedish approach also separates out street cleaning.
The potential for under-estimation arises because the NACE codes cover onlyspecialised producers, who carry out waste management as a principal activity. Theyexclude other producers, for whom waste management is a subsidiary activity, generalgovernment activities and social enterprises as well as manufacturers and suppliers ofequipment and services to the waste management industry.
A3.2.3 Data Completeness
Although data on waste-related employment are available for all 15 EU memberStates, its completeness varies significantly. Information on NACE 90 activities, in
Risk & Policy Analysts
Page A3-5
particular, is very sparse. Certain countries have classified some data, includingemployment figures, as confidential so that its availability to researchers is verylimited.
The year of the most recent data available also varies between countries although,with the exception of NACE 90, there is generally information available between1995 and 1997. The most recent NACE 90 data are for 1995, and in some cases 1994.
A3.3 Employment in Waste Management
A3.3.1 The Waste Management Industry in Europe
Estimates of the overall size of the environment sector in Europe at the end of thetwentieth century range from $100 – 200 billion, with around $25 billion of thiscoming from Eastern Europe and the newly-industrialised states. Waste managementis thought to account for 20-30% of this expenditure (OECD, 1996). Eurostat’sMILIEU database identifies expenditure on waste management in seven EU memberStates totalling €1.3 billion in the mid-1990s.
The waste management industry encompasses many different organisations, rangingfrom specialist multi-national companies to small-scale social enterprises, withsignificant public sector (mainly local government) involvement. The sector is in astate of flux, with consolidation in some areas (e.g. municipal waste collection in theUK) but a large number of small companies remaining. Eurostat data indicates a totalnumber of enterprises of between 15,000 – 26,000, having an average size of below25 employees. Table A3.1 summarises data on the size of enterprises. According tothe OECD (1992), companies supplying waste management equipment tend to belarger than those in waste management operation.
The waste management industry undertakes a wide range of activities. The balancebetween activities varies between countries in line with differences in wastemanagement regulations and practices. The proportion of municipal waste going tolandfill varies from almost 100% (Finland, Ireland) to 20% or below (Denmark,Netherlands). The proportion of municipal waste recycled ranges from near zero(Spain, Greece) to nearly 50% (Luxembourg). At the same time, the volume ofmunicipal waste arisings per capita ranges from below 300kg/year in Ireland to over400 kg/year in Germany.
As well as companies directly involved in waste management operations, it involvescompanies providing equipment and services to the industry including design andconsultancy. The focus of the remainder of this section is on direct employment.
Table A3.1: Number of Waste Management Enterprises in Europe
Source: EUROSTAT Structural Business Statistics Database (numbers in italics are calculated from other Eurostat data), c = confidential
Risk & Policy Analysts
Page A3-7
A3.3.2 Overall Level of Employment
Table A3.2 summarises available statistics on the overall level of employment in thewaste management industry within Europe. There is reasonable consistency betweenOECD (1997) and ECOTEC (1997) on the overall level of employment in theenvironment industry in Europe, totalling somewhere between one and three million.This amounts to between 0.4% and 1.2% of overall employment, although datacollected by Statistics Sweden (1999) using a different definition of the environmentindustry gives a proportion of 2.5%.
Both OECD and Statistics Sweden define the ‘core’ environmental industries ascomprising waste and wastewater treatment and recycling. This accords closely toEurostat’s NACE categories 90, 37 and 51.57. However, there are significantdifferences in the employment numbers given by the OECD/Statistics Sweden andthose contained within the Eurostat database. These variations are particularlystriking for the UK, where a Eurostat total of 9,318 contrasts with a figure of 103,200from the OECD. The OECD figure for core industry employment in the UK alsocomprises a much higher proportion of total employment in the environment industry(73%) than for other countries, where the proportion ranges from below 20%(Sweden, Denmark) to around 50% (Austria, France).
A number of the studies reviewed in Section A3.1 also give data on employmentlevels in waste management. The Association of Cities for Recycling (1999) derives afigure for total employment in waste management of 3 – 3.5 million, which issignificantly higher than estimates from other sources and is at the upper boundary ofECOTEC’s estimate of total environment industry employment. All of the studies ofwaste management employment, however, give higher numbers than Eurostat’sfigures for employment in the three main NACE categories, with the multiple rangingfrom 1.2 (for Sweden) to seven for the UK.
Three sources also give data on levels of employment in recycling. The Associationof Cities for Recycling (1999) gives a figure of 300,000 which is 10-11% of totalwaste management employment. Statistics Sweden (1999) and Profeta (1996)indicate that 27% and 25% of waste management jobs are in recycling for Sweden andFrance respectively.
As well as showing the diversity of estimates of employment in the wastemanagement industry, these data indicate that Eurostat data on the three main NACEcategories do appear more likely to under-estimate than over-estimate the level ofemployment in waste management. Whilst the Association of Cities for Recyling’sfigure of 3 – 3.5 million appears very high in comparison to other sources, it appearslikely that the Eurostat data may underestimate total employment in wastemanagement by two to five times.
If this is correct, then the total number of jobs in waste management in Europecould be in the region of 200,000 to 400,000. Waste management would thenprobably comprise between 20% and 40% of overall employment in the environment
Table A3.2: Overview of Statistical Employment Data
Sources: 1ECOTEC 1997, 2OECD 1997, 3Statistics Netherlands 2000, 4Instituto Nacional de Estatistica do Portugal, 5Statistics Sweden 1999,6 The core industries are considered to contain 100% environmental industry, mainly waste treatment, wastewater and recycling. The core industries are the NACE codeheadings 25.12, 37, 51.57 and 90.7Eurostat Structural Business Statistics, 8Association of Cities for Recycling 1999, 9Statistics Denmark 1999, 10Profeta 1996, 11DTI 1997, 12CWESAR 199913 Data in source is given as 8,500 for Scandinavia, so figure has been divided between Denmark, Finland, Sweden relative to total population.
Risk & Policy Analysts
Page A3-9
sector. This figure accords reasonably well with the OECD finding that wastemanagement accounts for 20-30% of total environmental expenditure in Europe.
A3.3.3 Employment in Main NACE Categories
Table A3.3 summarises information from Eurostat on employment levels in the threemain NACE categories relevant to waste management, categories 37, 51.57 and 90. Itcan be seen that data for category 90, covering waste and wastewater disposal, areparticularly sparse. For countries where data on category 90 employment areavailable, this category represents two-thirds or more of total employment in the threecategories. Absence of data on category 90, therefore, is likely to lead to significantunder-estimation of total waste management employment.
Distribution of employment between categories 37 (recycling) and 51.57 (wholesaleof waste and scrap) varies amongst countries. In some cases employment in 51.57 issignificantly higher than in 37, in other cases the position is reversed. This may bedue to differences in the structure of the recycling industry or definitional differences.The year with the most complete data, 1996, gives a total employment in category 37of around 50,000 whilst employment in category 51.57 is nearly 34,000.
Even added together, these figures are far lower than the 300,000 total for jobs inrecycling derived by the Association of Cities for Recycling (see Table A3.4). Thefigure of around 21,000 recycling-related jobs for France, however, comparesreasonably well with the 26,000 figure identified by Profeta. Similarly, the total ofcategories 37 and 51.57 for Sweden, nearly 3,000, compare reasonably with the figureof 4,707 from Statistics Sweden.
It seems possible, therefore, that Eurostat data on employment in recycling are morereliable than those on employment in waste and wastewater treatment. Unfortunately,though, waste treatment jobs are likely to be considerably more numerous than thosein recycling. This means that the least accurate data are those covering the largestcategory of employment.
Table A3.3: Number of Employees by the Main Waste Management NACE Categories
UK 9,318 7,657 3,749 5,246 4,627 2,348 4,073 3,030 1,401
Total 44,742 47,939 23,114 23,232 24,251 10,894 22,074 22,429 11,764 26,506 33,414 35,785 13,097 42,884 39,881Source: EUROSTAT Structural Business Statistics Database (numbers in italics are calculated from other Eurostat data), c = confidential. 1 These figures havebeen calculated using the figure for number of employees per enterprise for the overall 37 category, and therefore slightly overestimate the employees in 371 & 372
Risk & Policy Analysts
Page A3-11
A3.3.4 Employment in Social Enterprises
Section A3.2.2 noted that one potential source of under-estimation of employmentnumbers in the Eurostat data was the exclusion of social enterprises. An assessmentof the numbers of jobs associated with social enterprises carrying out recycling wasundertaken by CWESAR (1999); its findings are summarised in Table A3.4.
Table A3.4: Numbers of Recycling Jobs in Social Enterprises
Country Numbers of Jobs(minimum assessment)
Austria 80
Belgium 2,100
France 4,000
Germany 8,130
Greece 50
Ireland 500
Italy 2,500
Luxembourg 100
Netherlands 4,000
Portugal 400
Scandinavia 8,500
Spain 1,500
United Kingdom 3,000 – 5,000
Total 34,860 – 36,860
Source: CWESAR, 1999
The study’s total of around 35,000 jobs appears reasonably consistent with theAssociation of Cities for Recycling’s total of 300,000 recycling jobs, where it wouldimply that just over 10% of recycling jobs are in social enterprises. This compareswith Waste Watch (1999) findings that 3% of UK recycling jobs are in the communitysector.
The numbers look high, however, compared to the Eurostat data on recyclingemployment. They would imply that 15% of French recycling jobs and over 80% ofSwedish recycling jobs were in social enterprises. The authors of the CWESARreport note that their work was carried out rapidly with limited resources, and is basedon discussions with key players in the sector and their own knowledge rather thanstatistical sampling. Nevertheless, it does appear to indicate that social enterprisesmay make a significant contribution to employment in recycling.
Employment Effects of Waste Management Policies
Page A3-12
A3.3.5 Employment in Public Authorities
Waste-related operational employment in public authorities is covered by the threemain waste-related NACE categories. Within Eurostat data, no distinction is madebetween public and private sector employment in waste management operations.However, regulatory activities involving measurement and control, as defined bySERIEE, are not covered by the three main categories. There is no specific NACEcode which distinguishes regulatory activities related to waste management, but theEurostat MILIEU database does include information on waste-related employmentwithin public administration for selected countries.
There is significant variation between countries in the numbers of employees reported,ranging from zero for Denmark and below 500 for Finland to over 18,000 in Austriaand nearly 55,000 in Germany. The numbers show no consistency with data onemployment in the three main NACE categories; for example the number of waste-related public sector jobs in Germany is more than twice the number of jobs in themain NACE categories.
There is no clear pattern, either, to the distribution of jobs between different levels ofpublic administration, although, in general, there are fewer jobs in central and stategovernment than in general government or local government. This is not unexpected,given the different governmental structures in different countries and differentallocation of responsibilities for waste management.
The only conclusion that can be drawn from these data is that numbers of waste-related jobs in public administration, encompassing both operational and regulatoryroles vary significantly between countries, probably reflecting differences ingovernment structure as well as the organisation of waste management.
A3.3.6 Employment in Specific Activities
A number of the studies reviewed in Section A3.1 provide information on theemployment content of specific waste management activities in terms of theproportion of total waste management employment they represent or in tonnes ofwaste per job.
Statistics Sweden (1999) provides a breakdown of Swedish waste managementemployment by activity, shown in Table A3.5. The highest percentage ofemployment is in collection, sorting and reloading of non-hazardous waste, at 59%,with wholesale of waste and scrap (NACE 51.57) at half of this. All other activitiesaccount for less than 5% of total waste management employment.
Risk & Policy Analysts
Page A3-13
Table A3.5: Breakdown of Swedish Waste Management Employees by Activity
Activity Number ofEmployees
% of Total forWaste Management
Recycling of metal waste and scrap 468 4.7
Recycling of non-metal waste and scrap 116 1.2
Wholesale of waste and scrap 2,853 28.4
Collection, sorting and reloading of non-hazardous waste
5,922 59.0
Composting and digestion of non-hazardouswaste
4 0.04
Deposit on landfills of non-hazardous wastes 107 1.1
Receiving, reloading and intermediatestorage of hazardous waste
268 2.7
Treatment and permanent storage ofhazardous waste
127 1.3
Other waste management 173 1.7
Total 10,038 100
Source: Statistics Sweden, 1998
Information on the breakdown of employment in municipal waste recycling for theUK is given by Waste Watch (1999). This indicates a total of 41% of employment incollection and sorting, with 56% in reprocessing. Community sector jobs account forthe remaining 3%.
A range of studies provide information on the job content of specific wastemanagement activities in terms of numbers of jobs per volume of waste or the volumeof waste associated with a single job. Table A3.6 compares the findings of the Cottica& Kaulard (1995) study with work carried out in the USA.
Employment Effects of Waste Management Policies
Page A3-14
Table A3.6: Job Content of Waste Management Activities
Activity Jobs per100,000 Tonnes Tonnes per Job Source
The variation in job content for recycling of different materials is discussed in a rangeof studies, summarised in Table A3.7. The only conclusion that can be drawn fromthese data is that the job content of recycling different materials is poorlycharacterised at present. Even for materials where recycling is well-established, forexample ferrous metals, there appears to be little consensus about the level of jobs.
Risk & Policy Analysts
Page A3-15
Table A3.7: Job Content for Recycling of Specific Materials from Different Sources(tonnes per job per annum)
Material ACR 1999 NRF1998
ILSR1999
LPWAP1997
COM (463)1998
Paper/card 500 530 296 486 228
Plastics 583 149 26 214 35
Aluminium 44 933 28
Ferrous metals 700 2,102 162 1,667 290
Glass 493 3,207 138 500 253
Textiles 210 83 100 39
Wood 317
Asphalt/concrete 2,400
Vehicle batteries 24
Rubber 69
Composting 3,000
A3.3.7 Employment Outside the Waste Management Sector
Waste-related employment in management outside the waste management sector is bydefinition excluded from the three main NACE categories. Waste-relatedemployment in these sectors can include:
• waste management activities, such as collection and storage of waste prior to itscollection by a specialist waste management organisation, on-site treatment anddisposal; and
• prevention of pollution through adoption of clean technologies or use of adaptedproducts.
Limited information on labour inputs into waste management by industry is containedwithin Eurostat’s MILIEU database. Data are only available for the Netherlands andAustria; they indicate a total of 650 – 700 jobs in each country. This compares with12,000 and 5,000 NACE main category jobs respectively, with industry sector jobsaccounting for 6-12% of the total. The distribution of jobs between sectors is quitedifferent for each country. This may partly be due to differences in industry structure,but definitional differences may also be involved.
Discussions with industry experts indicate that an increasing number of largecompanies contract out their waste management activities to specialist organisations.In the UK, this has been part of a general move to ‘contractorisation’ with non-coreactivities ranging from energy supply through to waste and wastewater treatment nowcarried out by specialist organisations under contract. Under these circumstances,
Employment Effects of Waste Management Policies
Page A3-16
employment related to waste management in industry would generally be includedunder NACE codes 90 and 37.
A3.3.8 Growth in Employment
The Eurostat Structural Business Statistics include information on the annual rate ofgrowth in employment in NACE categories 37, 51.57 and 90. Unfortunately, thelimited nature of the data (particularly for NACE 90) makes interpretation of trendsdifficult, with large swings between years making it difficult to discern trends. Whilstsome countries appear to have experienced significant growth in recyclingemployment in both years, for example the UK, others such as Italy have seen moremodest growth or even a reduction in employment.
A3.4 Nature of Jobs and Employee Characteristics
A3.4.1 Full-Time and Part Time Employment
Eurostat Structural Business Statistics contain only limited information on workinghours in waste management, for the NACE categories 37 and 5157, coveringrecycling. No data are available on working hours for NACE category 90. For thecountries where data are available, part-time workers generally comprise less than10% of the total workforce. This figure was exceeded only for category 51.57 in theNetherlands, in 1995 and 1996.
A3.4.2 Salaries
Some of the studies reviewed in Section A3.1 of the report, for example Fritz et al,conclude that waste management jobs are of poorer quality and less well paid than theaverage. Experts within the UK waste industry, by contrast, indicated that salaries inthe industry were generally above average. Statistics Sweden (1998), found thatsalaries were reasonably in line with the labour market average, but varied by activityand gender, as shown in Table A3.8.
Risk & Policy Analysts
Page A3-17
Table A3.8: Employee Annual Income (100 SEK) by Activity, Gender and Sector 1995
Women Men Activity
Govt Private Govt Private
Recycling of metal waste and scrap 0 1,679 0 2,233
Recycling of non-metal waste and scrap 0 2,071 0 2,207
Wholesale of waste and scrap 2,004 1,431 1,535 1,711
Collection, sorting and reloading of non-hazardouswaste
1,599 1,698 1,969 2,032
Composting and digestion of non-hazardous waste 0 1,181 0 1,606
Deposit on landfills of non-hazardous wastes 1,796 0 1,777 1,601
Other waste management 1,575 1,700 2,497 2,412
Receiving, reloading and intermediate storage ofhazardous waste
0 2,115 0 1,995
Treatment and permanent storage of hazardous waste 1,506 1,709 2,230 1,872
Core Industries1 1,645 1,618 2,008 1,923
Total Labour Market 1,597 1,473 2,151 2,028
Source: Statistics Sweden 1998. 1The core industries are considered to contain 100% environmentalindustry, mainly waste treatment, wastewater and recycling. The core industries are NACE headings25.12, 37, 51.57, and 90.
The table shows that salaries for women in waste management were generally near toor above the labour market average, except for private sector employment in wasteand scrap wholesale (NACE category 51.57) and composting. For men, a wider rangeof waste management jobs had salaries below the labour market average. The lowestpaid jobs were wholesale of waste and scrap, composting and landfill of non-hazardous waste. In the private sector, hazardous waste operations also paid belowthe labour market average. With some exceptions, salaries for women were belowthose for men.
The Eurostat Structural Business Statistics Database contains no information on wastemanagement salaries, but it does give information on labour costs per employee forNACE categories 37 and 51.57, covering recycling activities. These are shown inTable A3.9. There are, of course, significant variations in labour costs betweencountries, due to factors such as general labour market conditions and social costs.Generally, labour costs appear to be somewhat higher for NACE category 37.1 (metalrecycling) than for the other categories, although in France costs are highest forwholesale of waste and scrap
The data appear to indicate that, on average, labour costs in recycling decreased overthe period 1995-1997, although this varies between countries. Austria (for category37.1), Belgium, Denmark and Luxembourg saw reductions whilst the UK and Sweden
Source: : EUROSTAT Structural Business Statistics Database (numbers in italics are calculated from otherEurostat data), c = confidential
saw cost increases. It is not clear whether these changes are characteristic to recyclingor follow overall labour market changes. Industry experts believe that overall labourcosts for the sector will reduce over time, as more processes are mechanised.Mechanisation, however, is likely to replace the most unskilled and thus lowest-paying jobs, so that average labour costs per employee may increase.
A3.4.3 Skills and Educational Level
Information on the skill levels of waste management jobs in Austria and France isgiven by Fritz et al (1997) and Profeta (1996) respectively.
In Austria, the proportion of unskilled jobs in waste management is very high. Morethan three quarters of jobs in collection and transport, sorting, utilisation and handlingof waste are unskilled. Amongst operational activities, only in maintenance does theproportion of skilled workers exceed the proportion of those who are unskilled. InFrance, the situation is quite different, with similar proportions of skilled andunskilled workers in waste collection and disposal and more skilled than unskilledworkers in recycling. Experts in the UK waste management industry have indicatedthat the situation in the UK is similar to that in France.
Risk & Policy Analysts
Page A3-19
In Austria a number of apprentices are identified, particularly in maintenance. Noneare identified in France. According to Eurostat’s Structural Business Statistics, thereare also apprentices in the recycling sector in Ireland and Italy. The lack ofapprentices may reflect differences in approaches to training in different countries, forexample, a preference for extended full-time education combined with other forms ofon-the-job training. On the other hand, it may indicate that training is a low priorityin waste management.
In Austria, the lowest levels of education are found amongst employees in wastesorting, where a significant proportion of employees (14%) have not even completedcompulsory schooling. The highest levels of education are found, not surprisingly, inconsultancy and in administration/management. The Swedish data indicate thatemployees in landfill have the lowest educational levels and those in hazardous wastemanagement have the highest. All waste management activities have a lowerproportion of highly-educated employees and a higher proportion of those with onlycompulsory schooling than the labour market as a whole.
A3.4.4 Health and Safety Issues
In the literature reviewed, there is little evaluation of the relative health and safetyimpacts of employment in waste management. Fritz et al (1997) concludes that,although the risks may be considerable, there is insufficient evidence to prove thisconclusively.
Jonsson (1997) claims that numerous investigations have shown that workers whohandle wastes are exposed to bioaerosols and also experience ergonomic problems ata level well above the average. Increased recycling, resulting in a greater need toseparate wastes, will result in a greater number of workers being exposed to theserisks.
Research in Denmark (Malmros, 1997) found that, in a sorting facility where wastewas sorted both manually and mechanically, 10 out of the 20 employees registeredcases of occupational illness. These illnesses were primarily bronchial and wereassociated with microbial activity arising from contamination of the material beingsorted with food residues.
There is little information at present, however, to evaluate how widespread such risksare in the waste management sector.
Employment Effects of Waste Management Policies
Page A3-20
Risk & Policy Analysts
Page A4-1
A4. THE CHEMICALS SECTOR
A4.1 Background
A4.1.1 The Policy Context
During the 1990s, a number of waste management policies have been developed at theEU level that have potential impacts on the chemical industry and these aresummarised in Table A4.1.
Table A4.1: Key Waste Management Measures Affecting the Chemical Industry
Constitutes the basic frameworkfor waste legislation
The definition of waste entailsthe application of wastelegislation, leading to associatedcosts
Wastes from the TitaniumDioxide Industry (82/883/EC)
Limits disposal routes fortitanium dioxide industry wastes
Increased investment costs inmodified processes and wastetreatment, increased operatingcosts
Hazardous Waste Directive(91/689/EC)
Definition of hazardous wastes,requirements for record-keeping
Increased costs for disposal ofwastes defined as hazardous
Supervision and Control ofShipments of Waste (259/93)
Implementation of the BaselConvention
Possible constraints on wastedisposal and recycling options
Hazardous Waste IncinerationDirective (94/67/EC)
Control of emissions fromhazardous waste incinerators
Increased investment andoperating costs for incinerators
Packaging Directive(94/62/EC)
Requirements for recovery andrecycling of packaging materials
Increased costs for certainspeciality chemical sectors
Directive on PCBs and PCTs(96/59/EC)
Controls on the disposal ofPCBs and PCTs
Increased treatment facilityinvestment and operating costs
Landfill Directive(1999/31/EC)
Bans on landfill of some wastes,tighter controls on landfills
Increased disposal costs andinvestment in on-site landfills
In addition to these waste-specific measures, policies to reduce air and water pollutionhave led to an increase in solid waste volumes in the form of residues fromwastewater treatment and end-of-pipe air pollution control.
A4.1.2 The Business Context
There are approximately 36,000 chemical companies within the EU. The industry isexpanding, with a 25% increase in production in real terms between 1990 and 1998(CEFIC, 1999). The industry has grown at an average rate of 2.7% per year since1988, compared with an average of 1.7% for manufacturing as a whole. The turnoverof the industry in 1998 was approximately €402 billion, second only in turnover to theUS chemical industry at €407 billion. The chemical industry operates across the EU,with the highest percentage of total turnover in Germany (24%), France (18%), theUK (12%) and Italy (11%).
Employment Effects of Waste Management Policies
Page A4-2
The chemical industry employs a total of around 1.7 million staff, or 7% of the totalmanufacturing workforce. Employees within the industry tend to be better qualifiedand more highly trained than average, which is reflected in above-average salaries. Inthe UK for example, chemical industry employee earnings are 22% higher than inmanufacturing generally (CIA, 1999).
However, employment within the sector has reduced significantly, withapproximately 14% fewer employees in 1998 than in 1990, so that unit labour costshave actually reduced by 4% over the period. As well as increased efficiency, thisreduction has been achieved through increased outsourcing of non-core functions suchas IT, logistics and support services (including some aspects of waste management).As with other manufacturing sectors, every 10 manufacturing jobs is thought tosupport six in other sectors.
A4.1.3 Potential for Impacts on Employment
There are a number of ways in which waste management policy might affectemployment, both within the chemical industry and in other sectors:
• increased waste management operating costs may affect the profitability of thesector, leading to reduced growth rates and/or a more rapid reduction inemployment levels;
• increased requirements for investment in waste management may divert fundsfrom other investments, leading to reduced growth rates and hence more rapidreduction in employment levels;
• increased waste-related operating and investment costs may reduce thecompetitiveness of the European chemical industry, resulting in a shift of jobsoutside Europe;
• tighter waste management controls may lead to increased numbers of wastemanagement jobs within the chemical industry;
• tighter waste management controls may encourage innovation and higherlevels of recycling in the sector, leading to improved profitability and potentialnew markets, which could increase (or at least reduce the rate of decrease of)employment; and
• outsourcing of waste management may lead to increased investment andemployment in the waste management sector, but potentially at lower salariesand in lower quality jobs.
These impacts are likely to be increased if the costs of waste management comprise asignificant proportion of total costs for the sector. The chemicals industry is one of thehighest-spending sectors on solid waste management, according to a 1997 survey ofenvironmental expenditure in the UK (ECOTEC, 1997).
Risk & Policy Analysts
Page A4-3
A4.2 Data Analysis
A4.2.1 Data Availability and Reliability
Although data on specific waste management costs are limited, information on theoverall costs of environmental protection measures for the chemical industry isavailable from a range of sources. These include trade associations, governmentsurveys and the environmental performance reports that are published by anincreasing number of major chemical companies. In some cases, the data cover totalexpenditure on environment, health and safety measures (which the chemical industrytends to manage in an integrated manner).
There are a number of acknowledged shortcomings with this information. The mostsignificant of these is that data tend to focus on end-of-pipe environmental protectionmeasures and ignore the increasing integration of environmental protection intoprocess operations. The environment-related share of integrated investments cannotbe determined from accounting systems and thus has to be evaluated subjectively.Some research has also indicated that data on environmental expenditure significantlyunder-estimates environment-related labour costs (Bartolomeo, 1999). This isbecause the number of staff working solely on environment-related tasks is low;environment-related activities are generally carried out as only part of a job. Thismakes it difficult to determine with any precision the proportion of staff time spent onenvironmental tasks.
Relatively few published sources provide a breakdown of environmental expenditureinto different media, to enable spending on solid waste management to be identified.This is partly because of the interactions between expenditure on different media. Forexample, an incinerator may be designed to handle solid, liquid and gaseous wastes sothat determining the proportion of costs attributable to each type is very difficult.Similarly, an effluent treatment plant may generate solid residues; should the costsassociated with disposal of these residues be allocated to solid waste or to watertreatment? We were, however, able to access data on waste-related costs from anumber of the companies that account for environmental costs for managementpurposes and/or for publication in environmental reports. These sources, togetherwith limited survey data, provide a range for the proportion of environmental costsallocated to waste management.
A further problem arising with data on both environmental expenditure overall andwaste management expenditure concerns definitions. Companies differ in the scopeof data included as environmental expenditure; there are particular difficulties inrelation to on-site treatment and recycling of materials. CEFIC, the Europeanconfederation of chemical industries, has issued guidance to members onenvironmental reporting but environment-related costs are an optional parameter onlyand no detailed guidance is given on definitions. For the purposes of this report, wehave assumed that the definitional differences do not have a significant impact onreported costs.
Employment Effects of Waste Management Policies
Page A4-4
A4.2.2 Environmental Protection Costs in the Chemical Industry
In order to assess the likely costs associated with waste management, we firstexamined the overall costs of environmental protection for the chemical industry.Table A4.2 presents the most recent data available from a number of sources. Ingeneral, the sources refer to data from the year prior to the publication date.
Table A4.2: Environmental Protection Costs for the Chemical Industry
Type of Cost Investment Costs OperatingCosts Overall Costs Source
Although there is some variation in the costs, environment-related investment isgenerally within the range of 5-11% of total capital expenditure whilst environment-related operating costs range from 2-4% of net sales or 4-5% of total operating costs.A number of sources give data on environmental expenditure as a whole, withoutseparating investment from operating costs. These sources give a range of 1.3-4% ofcosts or 3-4% of net sales.
Information is also available on trends in environmental expenditure by the chemicalindustry over time. This is summarised in Table A4.3.
Table A4.3 shows that, in general, environmental costs for the chemical industryappear to have remained reasonably stable during the 1990s. Increases in costs in theearly to mid-1990s were followed by a period of reducing costs in the late 1990s formost companies. This may be related to an increase in integrated approaches toenvironmental protection rather than end-of-pipe measures, and/or to improvedefficiency in management of environmental measures.
Table A4.3: Trends in Chemical Industry Environmental Expenditure, 1990-99
Source:1 CEFIC, 19992 CIA, 1999Other data from company environmental reports
Employment Effects of Waste Management Policies
Page A4-6
A4.2.3 Chemical Industry Waste Management Costs
Data on specific waste management costs are more limited. A number of companies,however, have been able to provide information on the proportion of environmentalcosts that are associated with waste management. This is summarised in Table A4.4.
Table A4.4: Chemical Industry Waste Management Costs
Type of Cost Investment Costs OperatingCosts Overall Costs Source
Waste-relatedexpenditure, UK
15% ofenvironmentalinvestment
34% ofenvironmentaloperating costs
ECOTEC, 1997
Waste-related costs,Company D
12% of totalenvironmentalcosts
Companyenvironmentalreport, 1999
Waste-related costs,Company C
29% of totalenvironmentalcosts
Privatecommunication,2000
Waste-related costs,Company A
3-18% ofenvironmentalinvestment
9% ofenvironmentaloperating costs
Privatecommunication,2000
There is considerable variability in the proportion of environmental investment costsallocated to waste management. This is because investment in new or improvedwaste facilities tends to involve a high level of expenditure over a relatively shortperiod. Thus, during a period of investment in a new waste facility, it will account foran increased proportion of total environmental investment. In order to manage theircapital costs, companies may tend to phase expenditure so that major investment in awaste facility does not coincide with major investment in other environmentalfacilities. This would increase the proportion of environmental investment accountedfor by waste even further.
There is less variation over time in the proportion of environmental operating costsallocated to waste management. However, there is considerable variation betweencompanies. A key factor here appears to be the proportion of hazardous wastes in thewaste stream. Although there are differences in definitions, these appear to varyconsiderably. For Company A, for example, hazardous wastes generally compriseless than 1% of arisings, for Company D 26% of waste is hazardous and for CompanyC over 40%.
Based on the data summarised in Table A4.4, together with qualitative informationfrom a range of sources, it seems reasonable to assume that at a maximum wastemanagement would account for 30% of environmental investment and 33% ofenvironmental operating costs. Table A4.5 uses these estimates, together with actualdata where available, to calculate waste-related expenditure as a percentage of totalinvestment by the chemical industry and of net sales.
Risk & Policy Analysts
Page A4-7
Table A4.5: Chemical Industry Waste Management Costs as % Total Investment Costs and NetSales
1990 1991 1992 1993 1994 1995 1996 1997 1998
Investment Costs
Company A 0.9 0.6 1.6 0.2
Company B (estimate1) 4.8 5.4 3.0 1.6
UK (Source: ECOTEC) 1.2 1.7
Europe (estimate1) 4.0 4.2 4.5 4.2 3.6 3.3 3.6 3.0
Operating Costs
Company A 0.2 0.3 0.3 0.3 0.3 0.2
Company B (estimate2) 1.7 1.7 1.7 1.7 1.3
UK (Source: ECOTEC) 1.7
Europe (estimate2) 1.0 1.0 1.0 1.0 0.9 0.9 0.9 0.8
1. Assuming that waste-related investment accounts for 30% of total environmental investment2. Assuming that waste-related costs account for 33% of total environmental costs
Table A4.5 indicates that, in general, waste management costs for the chemicalindustry have remained reasonably stable during the 1990s, or even reduced slightlyin some cases. Waste-related investment costs are in the range of 1-5% of totalinvestment costs, whilst waste-related operating costs range from 0.2-1.7% of netsales.
A4.2.4 Waste-related Employment in the Chemical Industry
None of the published sources, and none of the companies we contacted, have data onwaste-related employment in the chemical industry. Even information on overallenvironment-related employment is limited. Company A, for example, had attemptedto evaluate the number of full-time-equivalent jobs related to environmental protectionbut failed to develop robust estimates. This was because, apart from a small numberof full-time environmental specialists in each of its businesses (generally no more thanten), environment-related activities are carried out by operational staff as an integratedpart of their duties. The only exception lay with on-site landfills and incinerators,which sometimes have a separate staff. However, the company was increasingly out-sourcing incineration and landfill, so that the numbers of such staff were reducing.
There is also a general trend within the chemical industry to combine managementsystems for environment and health and safety (EHS), so specialists tend to beallocated to EHS as a whole. Table A4.6 presents available data from three companiesthat had been able to estimate numbers of specialist staff.
Employment Effects of Waste Management Policies
Page A4-8
Table A4.6: Environment-related Employment in the Chemical Industry
Numbers of employeesSource and Type of Job
1990 1997 1998 1999% of Total Employees
Company B (Environmental) 1,673 1,792 1.2%
Company G (EHS) 931 920 1.4%
Company E (EHS) 1,669 1,667 1,631 2.0%
Table A4.6 indicates that environment or EHS jobs may account for 1-2% ofemployment in the chemical industry. If this percentage was repeated across thesector, it would indicate a total of 17,000 to 34,000 environment-related jobs withinthe chemical sector. If waste-related jobs accounted for a third of the total, inproportion to waste management’s share of operating expenditure, there might be5,700-11,300 waste-related jobs within the European chemical industry.
Trends in the numbers of jobs are difficult to discern. In general, discussion withcompanies indicates that there has been a slight reduction in the number of full-timejobs, as environmental protection is integrated into mainstream operations. Full-timeenvironmental jobs are also reducing in line with the general reduction in employmentin the chemicals industry. Company H indicated that the apparent increase in full-timeemployees was due to transfer of environmental engineering staff from theEngineering to the Environmental Protection Department.
A4.3 Impacts of Waste Management Measures on the Chemical Industry
A4.3.1 Impacts of Operational Costs on Profitability
Analysis of the data indicates that waste management accounts for between 0.2% and1.7% of net sales for the sector. This compares with energy costs of around 9% ofsales. The level of costs depends upon a range of factors, particularly the proportion ofhazardous wastes (which are more costly to dispose of and/or require greater levels oftreatment). Companies with low operational costs tend to be those producing largevolumes of inert wastes. Whilst not negligible in absolute terms, it appears unlikelythat waste management operational costs in themselves have had a significant impacton profitability.
It also seems unlikely that the increase in operational costs due to waste managementhas had a significant effect on the level of employment in the chemical industry. Theindustry itself indicates that the rise in unit labour costs during the 1990s was the keyreason for reduction in numbers of jobs; with the aim of ensuring that labour costs didnot rise above 17% of total costs.
The data also indicates that, during the 1990s, waste management operating costs (andoverall environmental costs) have remained stable or even decreased for somecompanies whilst employment levels have fallen. This may be due to improved
Risk & Policy Analysts
Page A4-9
efficiency in waste management and/or the integration of waste-minimisation intoprocess development. This issue is discussed further in A4.3.3 below.
A4.3.2 Impacts of Waste-related Investment Costs on Other Investment
The available data indicate that waste-related investment accounts for between 1% and5.4% of total investment by the chemical industry. This represents a high level ofexpenditure, given the capital intensity of the sector as a whole, equivalent to €249million to €1,347 million in 1999.
The trend in waste-related investment is again one of stability throughout the 1990s,with a slight reduction in investment in some companies. This compares with overallinvestment by the sector, which dipped significantly during the mid-1990s and onlyexceeded 1990 levels in 1997, reflecting market conditions. The fact that waste-related investment did not follow this dip indicates that it may have displaced someproduction-related investment, with potential knock-on effects on profitability.
It is difficult to estimate the potential impacts of any displacement of production-related investment by waste-related investment, as no data are available on the relativenumbers of jobs associated with different types of investment.
A4.3.3 Impacts on Competition
It has not been possible, within the scope of this study, to compare waste managementcosts for the European chemical industry with costs elsewhere. Although Robinson(1995) indicates that pollution abatement expenditure in 1986 equated to 2.8% of thevalue of sales. The European chemical industry’s main competitors are the USA andJapan, both of which have reasonably similar levels of environmental regulation toEurope. The average growth rate of the European chemical industry between 1988and 1998 (2.7%) compares favourably with that of the USA (2.3%) and Japan (2.4%).This appears to indicate that waste management policy measures have not had anadverse effect overall on the competitive position of the European chemicals industry.
The position may be different, however, for particular processes that produce highlevels of waste requiring extensive treatment. Chemical industry representativesindicate that environmental costs (including waste management costs) may be acontributing factor to the general trend towards re-location of bulk chemical processesoutside Europe. One example cited was the move of fertiliser production to countriesof the former Soviet Union, where waste management measures are considerably lessstringent than in Europe. Other factors, though, such as labour and energy costs andproximity to markets, may be at least equally significant.
A4.3.4 Impact on Waste Management Jobs Within the Chemical Industry
Although the data are limited and there are significant definitional problems, thereappears to be little evidence that waste management measures have increased waste-related jobs in the chemical industry. The trend towards out-sourcing of wastemanagement may even have reduced the number of waste-related jobs within thesector. Even where significant investment has been made on in-house waste
Employment Effects of Waste Management Policies
Page A4-10
management facilities, these tend not to be labour-intensive. Indeed, the moreadvanced the facilities installed, the greater the degree of automation is likely to be.
A4.3.5 Business Benefits from Recycling and Waste Minimisation
One reason why waste-related operating costs have remained stable or reduced duringthe 1990s is the progress made by chemical companies in waste minimisation throughprocess improvements:
• Company A has maintained waste volumes (and related costs) at similarlevels, despite a 15% increase in sales, through a combination of wastemanagement measures and product changes;
• Company B reduced waste generation by 13% between 1990 and 1998 whilstproduction volumes over the same period grew by 30%;
• Company C reduced the volume of its waste going to landfill by over 90%between 1990 and 1998 through improved production processes and recycling;and
• Despite an increase in production volume of 21% between 1988 and 1998,Company F reduced waste generation by 50%.
There are sound economic reasons for focusing on waste minimisation. Research inthe UK has shown that the costs associated with waste are significantly higher than thecosts of disposal. Research under the UK’s Environmental Technology Best PracticeProgramme (ETBPP, 2000) indicated that the true cost of waste, taking account of rawmaterial costs and lost product value, could be up to 25 times the cost of disposalalone. One chemical plant was able to identify savings of over 10% of manufacturingcosts per year through waste minimisation (Bartolomeo, 1999).
A further approach to reducing waste management costs is to increase recycling ofwaste materials. Again, chemical companies have made considerable progress in thisarea:• material recycling accounted for 36% of Company B’s waste in 1998,
compared with 20% in 1990. A further 14% was incinerated with heatrecovery;
• Company C constructed a recycling plant in 1990 to handle building rubble,other materials are collected for recycling off-site or incinerated with energyrecovery; and
• Company G recycles 73% of its chemical waste and by-products, resulting in“both environmental and financial gains”.
In each case, significant capital investment in the early 1990s in incineration andrecycling plant has enabled operating costs throughout the 1990s to be reduced. Insome cases, the combination of investment and waste minimisation has enabledcompanies to offer waste management services to external organisations:
Risk & Policy Analysts
Page A4-11
• since 1990, Company B has been able to treat external waste in capacity freedup by its waste minimisation programme; and
• Company C accepts some waste from customers for incineration.
It is unlikely that such services provide a major source of profit for the companiesconcerned (no data are available), but they can assist in off-setting waste-relatedoperating costs.
The extent to which such savings are attributable to waste management measures isdebatable. It could be argued that companies should adopt waste minimisation andrecycling for economic reasons regardless of policy developments. However, fewcompanies appear to have examined their waste-related costs in detail until triggeredto do so by regulatory developments.
The impacts on employment of waste minimisation and recycling are unclear. Whilstwaste minimisation might be expected to reduce the number of jobs in wastemanagement, collection and recycling of materials might be expected to increaseemployment. Overall, there is little evidence from the chemical companies ofsignificant changes either way.
A4.3.6 Impacts on Investment Outside the Chemicals Sector
The tendency for increased out-sourcing of waste management by the chemicalsindustry might be expected to result in increased investment, and potentiallyemployment, in the waste management sector. The types of waste managementactivity out-sourced vary:
• hazardous waste treatment: as controls over hazardous waste disposal havetightened, some chemical companies have out-sourced rather than investing intheir own treatment facilities. In some countries (for example Finland andDenmark) a central organisation has been developed, with public sectorinvolvement, to handle hazardous waste for the country as a whole;
• landfill: reasons for out-sourcing of landfill include avoiding the investmentcosts of new landfill facilities, taking advantage of competitive prices andavoiding the potential liabilities associated with on-site landfills. Company Bincreased the proportion of waste going to external, as opposed to internal,landfill from 19% to 31% between 1990 and 1998; Company D increasedexternal disposal of waste by 10% between 1997 and 1999 alone; and
• recycling: recycling of non-chemical materials is often carried out externally.Although Company C recycles building rubble on-site, metal scrap,incinerator ash, wood, cardboard and paper are recycled off-site.
Unfortunately, only limited data are available on investment and employment by thewaste management sector in relation to services to the chemical industry. Nor is thetotal volume of waste out-sourced known. Research published by the EuropeanEnvironment Agency (Fischer, 1999) indicates that the chemical industry may account
Employment Effects of Waste Management Policies
Page A4-12
for around 30% of total EU waste arisings, which totalled approximately 30 milliontonnes per year in the mid-1990s.
The specialist hazardous waste incineration sector has a current capacity forincineration of two million tonnes. This has required investment of around €2 billionover the last 10-20 years (EURITS, 2000). Assuming that the proportion of wastefrom the chemical industry treated by this sector is the same as the proportion ofarisings, this would indicate that external investment attributed to the chemicals sectorcould be as high as €600 million.
EURITS does not maintain data on employment in the sector. However, thehazardous waste management organisation in Finland, Ekokem, employed 189 peoplein 1999 to treat 1.1 million tonnes of waste. The treatment methods includedincineration, physico-chemical treatment and recycling as well as landfill of treatmentresidues. If a similar level of employment applies to treatment of all hazardouswastes, then the external employment associated with treatment of chemical industrywastes could total around 5,000 jobs.
Waste management policies appear to have been the driver behind investment by thehazardous waste incineration sector, which invested heavily in the 1980s and early1990s in anticipation of regulatory changes. Indeed, commentators on the sectorbelieve that lack of strict enforcement of waste management policies in some countrieshas led to the low profitability and ‘unsustainably low prices’ faced by wastemanagement companies (Owen, 2000).
A4.4 Application of the E3ME Model
Cambridge Econometrics’ E3ME model (see Annex 2 for a detailed description) wasused to examine the impact of the chemical industry’s current level of wastemanagement expenditure on both employment and GDP. The case study is, therefore,general in nature, and does not refer to any single waste policy. The aim is to seewhat the net effects are of the industry currently spending some €804 million perannum on waste management.
The approach taken in applying the E3ME model is to assume that the chemicalsindustry is being required to spend the equivalent of 0.8% of its net sales on wastemanagement. The model treats these extra costs as being passed on in higher prices,depending on the competitive position of the industry in different Member States.The extra costs will lead to higher prices and a loss in the European share of worldmarkets. Since the waste management processes are generally integrated into theproduction process, it seems likely that the environmental investments have improvedproduct qualities. The model, therefore, has not assumed that crowding out of otherinvestment is taking place. Instead, the extra environmental investment expenditureimplied by waste management regulations is assumed to lead to extra output and jobsin the investment industries (i.e. providers of the necessary waste management relatedgoods and services), with multiplier effects throughout the EU economies. As thecase study found little evidence that waste management measures affecting this
Risk & Policy Analysts
Page A4-13
industry have increased waste-related jobs, no extra direct employment in thechemicals sector or in chemicals waste management is assumed.
The results of the analysis are presented in Tables A4.7 and A4.8, for the period from2000 (acting as the baseline) to 2005. The most important findings are that thecurrent level of costs will lead to less than a 0.01% reduction in gross domesticproduct (GDP) by the end of the five year period as a result of increased prices beingpassed on to private domestic consumption and exports. The increase in consumerprices leads to reductions in household consumption and hence GDP. The increase inexport prices leads to a fall in exports to countries outside the EU and hence GDP.The increase in prices also makes imports more price-competitive and so increasesEuropean imports. However, the fall in consumers’ expenditure reduces imports,offsetting these increases, resulting in the net effect being negligible. A fall inemployment of less than 0.01% is also predicted.
Table A4.7 provides a breakdown by country of the predicted employment effects(direct, indirect and induced) and for the EU as a whole. As can be seen from thistable, the impacts of the waste management costs and investment vary considerablyacross the Member States. Some countries experience a net gain in employment,while others experience significant losses. Most notable of those experiencing lossesare the UK and France, which by 2005 are predicted as losing 10,000 jobs betweenthem. The pattern is generally one of an increase in employment followed bydecreases, with the number of jobs lost by the end of the five year period estimated ataround 17,000. The first-year increase in employment is a short-term effect arisingfrom the initial fall in real labour costs across industries. This is the effect of the lagbetween rises in chemicals costs and, therefore, prices more generally and theconsequent rise in wage rates. The effect is particularly noticeable for the UK, whichaccording to the model has a more responsive labour market with more employmentgenerated for a fall in real wage rates compared to most other EU economies.
Table A4.8 presents the percentage change in GDP by country, showing that the UKis expected to experience relatively significant losses, as do Greece and Sweden. Incontrast, a number of countries, including France, realise small gains. GDP across theEU as a whole is reduced by 0.008% (equivalent to €600 million) by the fifth year ofthe modelling period (2005) as a result of higher prices and loss in exports. There isalso a confounding factor in that the model is unable to take into account the extracompetitiveness effects of regulations; in addition, the eco-efficiency gains that havebeen achieved within the industry may not be adequately accounted for. Some of theinvestment considered in the above analysis may also be creating efficiency gains,enhancing the ability of the EU industry to compete globally. These combined effectsmay, therefore, counteract the predicted reductions in GDP and employment.
Employment Effects of Waste Management Policies
Page A4-14
Table A4.7: Change in Total Employment Resulting from Waste Management PoliciesAffecting the Chemicals Industry (change from 2000 figures)
2000 2001 2002 2003 2004 2005
Austria 0 20 -40 -120 -130 -100
Belgium 0 30 100 80 30 -20
Denmark 0 20 100 130 130 90
Finland 0 10 -20 -240 -570 -910
France 0 1,500 400 -1,560 -3,690 -5,670
Germany 0 640 840 860 740 820
Greece 0 -50 -590 -1,100 -1,510 -1,880
Ireland 0 300 150 140 130 130
Italy 0 970 -180 -740 -1,610 -1,960
Luxembourg 0 -10 -10 -20 -20 -20
Netherlands 0 410 -80 -80 -130 -180
Portugal 0 490 -100 -320 -410 -520
Spain 0 -1420 -2140 -2120 -1820 -1340
Sweden 0 60 170 -430 -870 -1,060
United Kingdom 0 3,900 -2,900 -5,130 -4,550 -4,290
Total EU 0 7,430 -4,160 -10,450 -14,140 -16,830
Table A4.8: Change in GDP Resulting from Waste Management Policies Affecting theChemicals Industry (% change from 2000 figures)
2000 2001 2002 2003 2004 2005
Austria 0 0.014 0.024 0.029 0.038 0.047
Belgium 0 0.031 0.036 0.039 0.041 0.044
Denmark 0 -0.003 0.001 0.003 0.003 0.002
Finland 0 -0.066 -0.041 -0.026 -0.019 -0.016
France 0 -0.004 -0.006 -0.004 -0.001 0.003
Germany 0 0.007 0.009 0.009 0.008 0.007
Greece 0 -0.020 -0.019 -0.014 -0.010 -0.059
Ireland 0 -0.018 -0.040 -0.027 -0.010 0.000
Italy 0 0.002 0.002 -0.001 -0.004 -0.008
Luxembourg 0 0.338 0.342 0.343 0.340 0.338
Netherlands 0 0.011 0.020 0.025 0.027 0.028
Portugal 0 -0.125 -0.068 -0.041 -0.035 -0.036
Spain 0 -0.032 -0.045 -0.043 -0.035 -0.025
Sweden 0 -0.045 -0.113 -0.154 -0.162 -0.145
United Kingdom 0 -0.056 -0.025 -0.027 -0.036 -0.038
Total EU 0 -0.012 -0.008 -0.009 -0.009 -0.008
Risk & Policy Analysts
Page A5-1
A5. WASTE ELECTRICAL AND ELECTRONIC EQUIPMENT
A5.1 Background
A5.1.1 The Policy Context: EU
Measures at European level to address the environmental problems associated withwaste electrical and electronic equipment have been under discussion for a number ofyears. An EC project group was established in 1994 to devise a strategy for reducingthe end-of-life impact on the environment of such equipment. On 13 June 2000, theCommission’s proposals for a Directive on Waste Electrical and ElectronicEquipment and a companion Directive on the Restriction of the Use of CertainHazardous Substances in Electrical and Electronic Equipment were adopted.
The main objectives of the Directive on Waste Electrical and Electronic Equipment(WEEE) are:
• the prevention of waste electrical and electronic equipment;
• increasing re-use, recycling and other forms of recovery of end-of-lifeelectrical and electronic equipment, contributing to enhanced environmentalprotection and encouraging resource efficiency; and
• improving the performance of all operators involved in the life cycle ofelectrical and electronic equipment, particularly those involved in thetreatment of WEEE.
The main measures used to achieve these objectives are set out in Box A5.1.
Box A5.1: Main Measures of the Draft Directive on Waste Electrical and Electronic Equipment
• Separate collection of WEEE, free of charge to households, and provision for collection ofnon-household WEEE;
• Targets for separate collection of WEEE from private households;• Provision for treatment of WEEE to specified standards, at permitted treatment
establishments;• Provision for recovery of WEEE, to meet specified rates for overall recovery, reuse and
recycling of components, materials and substances;• Provision of appropriate information and marking of equipment; and• Financing of the system primarily by producers, either individually or through collective
schemes.
The Directive on the Restriction of the Use of Certain Hazardous Substances inElectrical and Electronic Equipment aims to prevent the use of substances that couldlimit the potential for recycling and re-use of WEEE and to contribute to theenvironmentally-sound recovery and disposal of WEEE.
Employment Effects of Waste Management Policies
Page A5-2
A5.1.2 The Policy Context: the Netherlands
Whilst the EU Directive is still at the proposal stage, legislation concerning WEEEhas already been adopted and implemented in the Netherlands. The Decree on theDisposal of White and Brown Goods came into force from 1 June 1998 and was fullyimplemented from 1 January 2000. The Netherlands Decree imposes similarrequirements to those in the proposed EU Directive; it may therefore provide a usefulindication of the potential impacts of the proposed Directive.
The main provisions of the Decree are outlined in Box A5.2. Its overall objectives areto achieve a leak-tight structure for disposal of WEEE that will result in the re-use ofas many products as possible and disposal of the wastes in such a way that risks to theenvironment are minimised. The operation of the scheme in practice is described inBox A5.3 (overleaf).
Box A5.2: Main Provisions of the Decree on the Disposal of Brown and White Goods
• Manufacturers and importers are obliged to take back and process all discarded brown andwhite goods and must notify the Minister of the means they propose to use to achieve this;
• When supplying a new product suppliers must take back free of charge, as a minimum, asimilar product that has been discarded after use;
• The final user does not have to pay at the time of discarding a product;• Landfill or incineration of products that have been taken back or collected separately is
prohibited; and• Commercial re-use of discarded refrigerators and freezers containing CFCs is prohibited.
A5.1.3 The Business Context
Table A5.1 compares the electrical and electronic goods sector in the Netherlands withthat of the EU as a whole.
Table A5.1: Comparison of the Sector in the Netherlands and the EU
Netherlands1 EU2
Turnover (€ million) 7,110 175,000
Number of enterprises (manufacturers + suppliers) 3,950 > 100,000
Annual volume of discarded equipment (1000 tonnes) 1953 6,000
Annual volume per person (kg) 12 12
Expected collection volume per person (kg) 3.9 4
1. Source: Netherlands Ministry of Housing, Spatial Planning and the Environment (1999)2. Source: European Commission, ORGALIME3. Anticipated level by 2005
Risk & Policy Analysts
Page A5-3
Box A5.3: Operation of the Decree on the Disposal of Brown and White Goods
ConsumersConsumers wishing to dispose of waste brown and white goods or ICT equipment (computers,telecommunications) can either hand their waste to the local authority for separate collection or handit to a retailer when buying a similar new product. Consumers must pay the levy on new brown andwhite goods, shown separately on the invoice, that funds the collective scheme.
RetailersRetailers must accept waste products handed in by consumers when buying a new product. Retailerscan then either hand waste goods to the local authority, return them to a distribution centre (‘reverselogistics’), deliver them to a Regional Storage Station operated by the appropriate collective schemeor, if they hold a large volume of waste goods, ask the appropriate collective scheme to collect thegoods. Retailers may also sell waste goods on the second hand market, except for refrigerators andfreezers containing CFCs. Retailers are responsible for collecting the levy on new brown and whitegoods that finances the collective scheme.
Local AuthoritiesThe Decree places obligations on local authorities to provide for separate collection of productsdiscarded by households and to set up locations where retailers can deposit products discarded byhouseholds.
Manufacturers and ImportersThe Decree allows manufacturers/importers to fulfil their responsibility for collection andreprocessing of brown and white goods either individually or collectively. In practice, although someindividual schemes have been submitted, none have been approved and almost allmanufacturers/importers have signed up to one of two collective schemes:
• one scheme covers consumer goods and is operated by a specially-formed joint organisation(NVMP), financed by a levy on the price of new consumer goods. The levy is set at a fixed levelfor each type of product, sufficient to cover the costs of collection and reprocessing. Collectionof waste goods from local authorities, 67 Regional Storage Stations, 20 distribution centres andindividual retailers, is carried out by two contractors, one a distribution company and one a wastemanagement company. Processing of the waste is carried out by three specialist recycling firms;and
• the second scheme is a looser arrangement covering ICT equipment organised by the relevanttrade associations. Collection of waste equipment, transport and processing is carried out by twotransport and two recycling firms. The recycling companies sort and weigh the items accordingto brand and costs of transport and processing are allocated to individual manufacturers/importersaccordingly. ‘Orphan’ brands, imported or manufactured by companies no longer operating inthe Netherlands, are also weighed and their costs allocated to existing companies in the sameproportion. (For example, if equipment manufactured by Company X accounts for 30% of thebranded products processed, then Company X will pay 30% of the costs for ‘orphan’ brands).
At the EU level, there are over 100,000 small and medium sized enterprises involvedin the manufacture and supply of electrical and electronic equipment. The market,though, is dominated by a small number of large companies that typically account for80% of turnover and employment in the sector, where total employment is estimatedat around 1.4 million. Manufacturers are located primarily in Germany, the UK,France, Italy, the Netherlands and Sweden.
Employment Effects of Waste Management Policies
Page A5-4
In the Netherlands, there are around 600 manufacturers, most of which are very smallcompanies. However, the majority of goods are imported and there are estimated tobe several thousand importers. As in the overall EU situation, a small number ofmanufacturers or importers (30 for white goods and 33 for brown goods) cover 85% to90% of the market. There are over 3,000 suppliers of electrical and electronicequipment.
A5.1.4 Potential for Impacts on Employment
There are a number of ways in which policy on WEEE might affect employment, bothwithin the electrical and electronics industry and in other sectors:
• jobs may be created within the electrical and electronics industry in productre-design, establishing take-back systems and providing information toconsumers, regulatory authorities and treatment facilities;
• WEEE regulations may encourage innovation and development of re-usable/upgradeable products in the sector, leading to improved profitabilityand potential new markets, which could increase employment;
• outsourcing of take-back and recycling may lead to increased investment andemployment in the waste management sector, but potentially at lower salariesand in lower quality jobs;
• the operating costs for take-back and treatment of WEEE may affect theprofitability of the electrical and electronics sector, leading to reduced growthrates and/or a reduction in employment levels;
• requirements for investment in take-back and treatment facilities, and in re-design of products to remove harmful substances and facilitate recycling, maydivert funds from other investments, leading to reduced growth rates and aconsequent reduction in employment levels; and
• where costs are passed on to consumers, in the form of increased prices, thismay reduce or postpone sales leading to reduced turnover and profitability inthe electrical and electronics sector and hence reduced employment.
The scale of these impacts will be influenced by the size of the costs involved in take-back and treatment of waste, the level of recycling required and the extent to whichcosts can be recovered through increased prices.
A5.2 Data Analysis
A5.2.1 Data Availability and Reliability
Clearly, no actual data on the costs of the proposed EU Directive on WEEE are yetavailable. Estimates of the potential costs, though, have been prepared by theEuropean Commission, by industry organisations and by national governments
Risk & Policy Analysts
Page A5-5
including the UK Government. There is considerable variation between theseestimates, as is usual in such circumstances, depending upon the underlyingassumptions.
Prior to introduction of the Decree on the Disposal of Brown and White Goods, theNetherlands Government undertook a series of studies to estimate the costs of theproposed measure. This included an evaluation of the economic effects of introducinga different financing system for WEEE in the Netherlands from neighbouringcountries, Belgium and Germany.
Following implementation of the Decree, data on the actual costs and amounts ofWEEE were collected by industry representatives, local authorities and the Ministryof Environment. Financial data for 1999 are considered by the Ministry to be reliableestimates, although not based on fully-audited accounts. Based on the actual data for1999, the Ministry of the Environment developed a model for the ‘normal’ situation,when the Decree is fully implemented, which provides information on expected costsand collection levels possible within a few years.
Additional information on the impacts of the Netherlands Decree has been providedby the two collective organisations implementing industry responsibilities for take-back. This again is based on monitoring of actual costs during the first year ofoperation of the Decree. Information from individual companies on the impacts of thedecree is limited, partly because collective solutions to meeting industry obligationshave been adopted. However, some qualitative information is available fromcompany environmental reports on the wider implications of WEEE policy.
A5.2.2 Overall Costs of the Netherlands Decree on Disposal of Brown and White Goods
Table A5.2 presents the Netherlands Government’s estimates of the costs of theDirective prior to its implementation. Table A5.3 shows the actual costs of theDecree in the first year of implementation, together with the estimated long-term costsonce the Decree is fully operational (the ‘normal’ situation).
Unfortunately, the data on the actual and long-term costs of the scheme are not brokendown between sectors in the same way as the estimated costs. Costs of transport,sorting and logistics, for example, include both local authority collection costs andsome expenditure by retailers and by the collective schemes (for facilities at theregional collection centres). The treatment costs for collective schemes also includesome transport costs born by one of the schemes. Nevertheless, a number ofconclusions can be drawn about the costs of the Decree:
• the actual total costs of the scheme under the ‘normal’ situation are 10% lowerthan the estimated costs;
• actual costs of treatment are significantly below the estimated costs (35%lower for the ‘normal’ situation); and
Employment Effects of Waste Management Policies
Page A5-6
Table A5.2: Estimated Costs of White and Brown Goods Disposal (1998 estimate, € million)1
LocalAuthority
Costs Priorto Decree
LocalAuthority
Costs AfterDecree
IndustryCosts After
Decree
Total AfterDecree
Collection 2.25 3.15 3.15
Processing products containingCFCs and HCFCs
3.60 4.95 4.95
Processing other white andbrown goods
8.10 8.10
Logistics (transportation) 1.03 0.14 2.02 2.36
Management/ administration 1.48 1.48
Landfill/incineration 2.03 0.81 0.81
Total 9.00 4.10 16.55 20.851 Overall costs, including annualised investment costsSource: adapted from Netherlands Ministry of Environment
Table A5.3: Actual Costs of White and Brown Goods Disposal (1999 actual costs plus estimatedlong-term annual costs (‘normal’ situation), € millions)
1999 ‘Normal’ Situation
Transport, sorting and logistics 5.85 7.65
Treatment by collectiveschemes
5.40 8.55
Management and administration 3.6 2.7
Start-up costs (1998 costsdivided over two years)
0.45 0
Total 15.30 18.9
Source: adapted from Netherlands Ministry of Environment
• transport and logistics costs are significantly higher than estimated (nearly40% higher, including the costs of collection), as are management andadministration costs (80% higher).
A5.2.3 Capital Costs
Little information is available on the capital costs of the Netherlands Decree onDisposal of Brown and White Goods, although only limited investment is thought tohave been required. The two collective schemes have contracted out collection andrecycling services to existing transport and reprocessing companies, which alreadyhad facilities available to carry out these services. Any investment requirements havetherefore been met by these companies and reflected in their charges to the collectiveschemes, making them difficult to identify. One company carrying out recycling ofrefrigerators and freezers is known to have invested in refurbishment of one of its twoplants, at a probable cost of around €5 million. It is not clear whether the otherrecycling companies, or the transport companies, have faced similar investment costs.
Risk & Policy Analysts
Page A5-7
The only other known capital cost has been the provision of facilities at the RegionalStorage Stations for separation of waste products into different types. Under theNVMP scheme, containers for the four main types of waste (refrigerators and freezers,large white goods, televisions and small appliances) are provided at each of the 65regional stations. Four containers are also provided at each regional station for ICTwaste. These containers range up to the size of a sea freight container, and werespecially manufactured. No detailed information is available on the cost; however astandard new sea freight container costs in the region of €3,500. This would indicate atotal cost of nearly €2 million for eight containers at each regional station (thecontainers have an expected life of 10-15 years).
No information is available to indicate that significant additional investment has beenmade by manufacturers/importers, retailers or local authorities to meet therequirements of the Netherlands Decree to date.
Known investment costs associated with the Netherlands Decree therefore totalapproximately €7 million. This represents an initial outlay of €114- €209/tonne ofwaste (depending on whether the volume of waste collected is taken as the 1999 actuallevel or the expected ‘normal situation’ level). Further investment, though, may notbe required for 10 or 15 years, depending on the lifetime of the assets.
A5.2.5 Operating Costs
Table A5.4 sets out the overall operating costs of the Netherlands Decree per tonne ofwaste recovered. Operating costs have been reduced considerably below the predictedlevel of €340 to €600 per tonne, depending upon the volume of waste collected.
Table A5.4: Operating Costs per Tonne of White and Brown Goods Disposal (1999 actual costsplus estimated long-term annual costs (‘normal’ situation), € per tonne)
1999(33,500 tonnes collected)
‘Normal’ Situation(61,500 tonnes collected)
Transport, sorting and logistics 174 125
Treatment by collectiveschemes
161 139
Management and administration 121 44
Total 456 308
Source: adapted from Netherlands Ministry of Environment
The operating costs of the decree have been minimised through the use of a collectivescheme, which has been able to negotiate favourable prices for transport and recyclingwith existing firms. By using a limited number of recycling facilities, it has beenpossible to take advantage of economies of scale. There have also been opportunitiesto take advantage of existing routes and networks of the transport companies.
The proportion of the costs born by different manufacturers/importers depends uponthe types and numbers of products they provide to the market. Under the ICT scheme,the costs to manufacturers/importers are standard, at €518 per tonne of wastecollected. This is equivalent to around €13.5 for a complete personal computer or €2.3
Employment Effects of Waste Management Policies
Page A5-8
for a printer. The costs to members of the NVMP scheme vary, from €18 for a fridgeor freezer to €6.8 for a microwave oven or a video recorder. Individual price leviesare set for each product type at a level sufficient to cover the full costs of transport andprocessing.
As well as the costs to manufacturers/importers, which are recovered throughincreased prices, there may be additional costs to retailers in handling productsreturned under the ‘new for old’ system. No information is available on retailer costs;however, it appears that most retailers pass waste products on to local authorities forstorage, therefore minimising costs (the NVMP collects only 20% of its total wastedirect from retailers or distribution centres).
A5.2.6 Employment Impacts
No detailed data has been collected by either the Netherlands Government or industryon the employment impacts of the Decree, however, they are thought to be minimal.One of the key effects of implementing the Decree primarily through collectiveschemes has been the consolidation of the recycling industry for WEEE. Betweenthem, the two collective schemes contract with only five recycling companies. Onlyone company now recycles refrigerators and freezers whereas prior to the Decree therewere twelve. Organisations that have lost out in this consolidation are primarilysmaller organisations, including social welfare organisations. Jobs may therefore havebeen lost in the smaller organisations, although this may have been offset by greateremployment in the large organisations to handle the additional throughput of waste.
A small number of additional jobs is also thought to have been created in localauthorities, in separating out usable goods for sale on the second-hand market. Thenumber of additional jobs in administering the scheme (fewer than 10) has been keptto a minimum to reduce costs.
There is no evidence of additional employment creation amongst retailers to deal withthe requirements of the Decree. Nor is there evidence of any increased employmentamongst manufacturers/retailers to complete the information requirements of thescheme (including twice-monthly reporting by NVMP members on product numbersput on the market).
A5.2.7 Comparison With Other Cost Data
Table A5.5 compares the costs per tonne of waste handled under the NetherlandsDecree with other actual and estimated costs of WEEE collection and treatment.
It can be seen that the majority of actual costs and estimates lie within the range €200-€500 per tonne. Actual costs in Germany for reprocessing IT waste, at €500/tonne,are very similar to the costs of the ICT collective scheme in the Netherlands,€517/tonne. These probably represent the upper end of the range of costs for WEEE.One factor contributing to the variation in costs may be the proportion of WEEEexpected to enter the system. The proportion of waste collected in the Netherlands,for example, is currently below the target set in the proposed Directive. TheNetherlands actual data and cost estimates by the European Commission and the UK
Risk & Policy Analysts
Page A5-9
Table A5.5: Comparison of WEEE Collection and Treatment Costs
EU: estimated cost of WEEE Directive3 (European Commission, high case) 720
EU: estimated cost of WEEE Directive4 (industry estimate) 5,000
Sources:1. Department of Trade and Industry (2000): Consultation Paper: Proposed EC Directive on
Waste Electrical and Electronic Equipment, London, DTI.2. Commission of the European Communities (2000): Proposal for a Directive on Waste
Electrical and Electronic Equipment, Brussels, CEC (COM (2000) 347).3. Bartolomeo M et al (1999): Eco-Management Accounting, Dordrecht, Netherlands, Kluwer
Academic Publishers.4. Orgalime (2000): Detailed Position of Orgalime’s Electrical and Electronic Liaison
Committee in Co-operation with the European Sector Committees, Brussels, Orgalime.
Government all indicate that there are significant economies of scale in WEEEcollection and treatment, with costs per tonne reducing considerably as volumescollected increase.
Two estimates are well outside this range; the industry estimate of costs of the WEEEDirective and the UK Government estimate including retailer costs. We have not beenable to establish the basis for the industry estimates; this has been prepared on aconfidential basis by Orgalime (although we understand that additional informationhas been made available to the European Commission). It is understood thatcollection and transport of wastes accounts for over 50% of the estimated costs. TheUK Government figure includes an estimate of up to £500m per annum costs forretailer take-back, the majority of which relates to staff training. The basis of thisestimate is not known, but it does not appear to be supported by the experience in theNetherlands. Clearly, however, the way in which take-back is organised can have asignificant impact on costs and their allocation; the Netherlands experience has shownthat collective schemes can increase the efficiency of collection and treatment,resulting in reduced costs.
The UK Government estimates make explicit reference to investment costs associatedwith WEEE collection and treatment. The costs of investment in additional treatmentequipment are estimated to be minimal, at around €1.7 per tonne. There are alsoestimated to be one-off investment costs of around €12 million to €14 millionassociated with the modification of manufacturing equipment for product marking. Itis acknowledged that some additional investment may be required, for example WEEE
Employment Effects of Waste Management Policies
Page A5-10
storage bins at local authority collection sites, but no estimates are made of the likelycost.
Orgalime has estimated that new investment totalling €15 billion will be required toaddress the requirements of the proposed EU policy on WEEE. The basis for thisestimate is not known, but it is thought to relate primarily to the Directive on theRestriction of the Use of Certain Hazardous Substances in Electrical and ElectronicEquipment.
A5.3 Impacts of WEEE Policy Measures
A5.3.1Impact on Waste Management Jobs Within the Electrical and ElectronicsIndustry
As noted in A5.2.5, data on the employment effects of WEEE policy are very limited.The UK Government analysis of the proposed WEEE Directive identifies someadditional labour requirements, primarily associated with treatment of WEEE. It alsoidentifies limited additional requirements in the electrical and electronics industryrelated to administration, including one day per year for each manufacturer/importer incompiling relevant information to be provided to treatment facilities. This appearsunlikely to result in the generation of significant additional jobs.
This is born out by experience in the Netherlands, where few if any additional jobs inthe electronics industry have been created by the Decree. The only exception to this isa small number of people involved in administration of the collective schemes.Additional employment here has been kept to a minimum in order to reduce costs.
A5.3.2 Impacts on Innovation
One potential benefit of the proposed EU Directive is to encourage better design ofelectrical and electronic equipment to reduce the generation of waste and to enhancethe potential for recycling and re-use. This effect is most likely to occur when thecosts to manufacturers of implementing WEEE policy are linked to the amount ofwaste associated with their products and the ease with which they can be recycled.
It could be argued, therefore, that the NVMP collective scheme in the Netherlandsdoes not encourage innovation because a single levy is applicable to each type ofproduct. There is no differentiation between products on the basis of their design. Thefact that all the costs of recycling are recovered through a levy on the price of newproducts provides no incentive for producers in terms of reduced costs. By contrast,under the collective scheme for ICT waste, each manufacturer/importer pays the costsassociated with collection and processing of its own equipment.Manufacturers/importers therefore have an incentive to reduce the costs of recyclingtheir products, as this will generate direct financial savings. The Netherlands Decreehas been in operation too short a time to determine whether any impacts on productinnovation will occur in practice.
Risk & Policy Analysts
Page A5-11
In the absence of clear regulatory drivers, it is interesting to note that a number ofmanufacturers of electrical and electronic equipment have already developed productinnovation programmes. IBM, for example, has put in place an EnvironmentalConscious Products Programme that includes consideration of re-use and recycling,product lifetimes and up-gradeability, reducing the material content of products andthe use of recycled materials. It has set up nine Materials Recovery Centres aroundthe world; these dealt with 54,000 tonnes of materials in 1998. Xerox has alsodeveloped a programme to take-back and re-manufacture printer cartridges. Althoughthis requires more handling and thus has higher labour costs than manufacturing fromnew, the material costs are considerably lower, leading to a reduced overall cost. Thisis an indication that product innovation to reduce waste and encourage recycling canhave business benefits. Policies that encourage innovation could therefore be regardedas offering advantages to the electrical and electronics industry.
A5.3.3 Impacts Outside the Electrical and Electronics Sectors
In the Netherlands, the two collective schemes contract out all transport andprocessing of waste products. Only a small number of contractors are used; theycomprise relatively large firms from the waste management and transport sectors. It islikely that schemes developed in other countries would take a similar approach, as itappears to offer opportunities for considerable economies of scale. WEEE policytherefore has potential for significant impacts on investment and employment in thewaste management, and potentially the transport, sectors.
In the Netherlands, the majority of investment related to implementation of theNetherlands Decree on the Disposal of Brown and White Goods has been made by thewaste management sector. Of the known capital investment total of €7 million, €5million comprises the costs of upgrading a treatment facility operated by one of therecycling contractors. Clearly the investment costs faced by the recycling industry inother countries will depend upon the current level of recycling and the status offacilities. The UK Government, for example, estimated that expenditure by the UKrecycling sector would amount to only around €300,000.
On the same basis, any positive impact of WEEE policy on jobs is most likely to arisein the waste management and transport industries. The UK Government has estimatedthat implementation of the proposed WEEE Directive in the UK could lead to thecreation of 500 to 600 jobs (calculated on the basis of additional labour time requiredto process WEEE in line with the Directive). This is equivalent to 1 to 1.25 jobs perthousand tonnes of WEEE collected, which would imply creation of 1,500 to 2,000jobs across the EU as a whole.
Such an increase in jobs might not, however, be realised in practice. One of the mostsignificant impacts of the Netherlands Decree on the Disposal of Brown and WhiteGoods has been the consolidation of the waste management sector responsible forrecycling these goods. For example, prior to the Decree there were approximatelytwelve companies involved in recycling of refrigerators and freezers, whilst now thereis only one large company. Similar consolidation has taken place amongst recyclersof other types of goods. This is thought to have resulted in little or no net change inthe numbers of jobs associated with WEEE recycling. The loss of jobs in small
Employment Effects of Waste Management Policies
Page A5-12
organisations, which include some social welfare organisations, has probably beenoffset by increases in jobs in the large recyclers to deal with the additional throughputof WEEE. No firm data on this are available, however.
A5.3.4 Impacts of Operational Costs on Profitability
Table A5.6 compares the actual operating costs of the Netherlands Decree and theestimated costs of the proposed EU Directive with the turnover of the electrical andelectronics industry at Netherlands and EU level. In the case of the Netherlands,because the distribution of the actual costs between industry and local authorities isnot clear, it is assumed that all of the costs of the Decree are born by industry. In thecase of the proposed EU Directive, estimates of costs made by the Commission and bythe industry are included.
Table A5.6: Comparison of WEEE Operating Costs with Turnover (in € million)
Operating Costsof WEEE Policy
Turnover ofElectrical and
Electronics Sector
Operating Costs as% of Turnover
Netherlands: actual costs, 1999 15.3 7,110 0.22 %
Netherlands: ‘normal situation’ 18.9 7,110 0.27 %
EU: Commission low estimate1 500.0 175,000 0.29%
EU: Commission high estimate1 900.0 175,000 0.51%
EU: Industry estimate2 7,500.0 175,000 4.29%
Sources:1. Commission of the European Communities (2000): Proposal for a Directive on WasteElectrical and Electronic Equipment, Brussels, CEC (COM (2000) 347).2. Orgalime (2000): Detailed Position of Orgalime’s Electrical and Electronic LiaisonCommittee in Co-operation with the European Sector Committees, Brussels, Orgalime.
In most cases, the impacts of WEEE operating costs appear likely to be minimal asthey account for well below 1% of operating costs. This is particularly the casewhere, as under the Netherlands NVMP scheme, costs are recovered through a levy onthe purchase of new white and brown goods. Only in the case of the industry estimatedo WEEE operating costs appear likely to have the potential for a significant impacton profitability. Orgalime has noted that collection and recovery of WEEE ‘currentlyaccounts for between 5% and 15% of manufacturing costs’ and that this amount is‘regularly higher than industry’s profits’. As discussed in A5.2.6, however, theindustry estimate of costs is significantly higher than other estimates and than actualcosts experienced in the Netherlands.
Provided that implementation of WEEE policy allows for the economies of scale thatappear to be associated with collective schemes and the use of a small number ofcontractors for transport and recycling of WEEE, it appears unlikely that WEEEpolicy will have a significant impact upon profitability.
Risk & Policy Analysts
Page A5-13
A5.3.5 Impacts of WEEE-related Investment Costs on Other Investment
The available data on the Netherlands indicates that WEEE-related investment costsfor the electrical and electronics industry are minimal. Because of the way that thecollective schemes are organised, the majority of the estimated €7 million ofinvestment costs are born by the transport and recycling firms contracted by theschemes. The UK Government analysis of the proposed Directive identified potentialcosts of €12 million to €14 million for the electrical and electronics industry, tomodify manufacturing equipment so that products can be appropriately marked.
Only the industry estimates indicate a significant investment requirement to ensurecompliance with WEEE policy. Orgalime’s estimate of €15 billion for investmentappears to relate primarily to the Directive on the Restriction of the Use of CertainHazardous Substances in Electrical and Electronic Equipment. If correct, this estimatewould be equivalent to 8.6% of the industry’s annual turnover. Unfortunately, no datais available on overall investment levels by the sector against which this figure can becompared. Nevertheless, if Orgalime’s estimate is correct, it appears that there couldbe potential for a significant impact on overall investment by the industry, at least inthe short-term.
A5.3.6 Impacts on Prices and Markets
Analysis by the European Commission indicates that the proposed WEEE Directivecould increase the prices of electrical and electronic goods by an average of 1%, withincreases of 2-3% for certain products such as refrigerators, televisions and othermonitors. Under the Netherlands NVMP schemes, the cost-recovery levies chargedon most white goods are around 1-2% of prices but can be up to 5% for somerefrigerators and freezers. Of course, if industry estimates of the costs of WEEEpolicy are correct, price increases would be 8-15 times higher.
In the Netherlands, research was commissioned prior to adoption of the Decree onDisposal of Brown and White Goods into the potential impacts on markets and oncross-border traffic (KPMG, 1999). The research concluded that demand for manywhite and brown goods was inelastic (including refrigerators, washing machines,heating boilers, televisions and computers). An increase in prices of these goods by 1-3% was therefore unlikely to lead to long-term sales changes. Only a small number ofproducts, including video recorders and electric razors, were classified asinelastic/elastic. For these products, the maximum loss of sales from a 1-3% priceincrease was estimated as 1-2%, but the loss of sales was likely to be made up in thelonger term. The research also identified some potential for postponement ofpurchases, movement within price segments (to cheaper models) and loss ofpurchasing power associated with the price increases.
Given the likely price increases resulting from WEEE policy, therefore, the impact onprices and markets is likely to be significant. There is also evidence of customers’willingness to pay for the benefits of take-back of used electrical and electronicequipment. IBM in Germany takes back products from customers for recycling for afixed fee, ranging from €26 for personal computers to €2,000 for mainframecomputers. Sony Germany takes back and recycles computer monitors for a fee of
Employment Effects of Waste Management Policies
Page A5-14
€15. If price increases were significantly larger than 1-3%, for example in line withindustry estimates of the costs of the proposed WEEE Directive, there could of coursebe potential for more significant impacts.
A5.4 Application of the E3ME Model
The E3ME model was used to examine the macroeconomic implications arising fromincrease in consumer product prices with the adoption of WEEE legislation across theEU.
The modelling assumes that the direct effects of the legislation, estimated for theNetherlands, would be similar for all Member States. There would be some smallextra direct employment by the waste recycling industry resulting from an increase inthe purchase of waste recycling services by the electrical and electronics industries,leading to higher costs of their products and extra output of waste-related services.There would also be more investment in recycling equipment. The overall picture isof the increases in employment and investment increasing EU GDP and indirectemployment.
The increases in costs and prices have negative effects on GDP via reductions inconsumers’ expenditures and exports, but these are generally smaller than the positiveeffects. The cost-inflation effects are modelled to outweigh the direct employmentand investment effects only in those Member States that have had a tendency to highwage inflation (e.g. Greece and Spain). However, with the advent of the singlecurrency it may well be the case that these countries will experience a change inbehaviour implying smaller inflationary responses. In this case the results reportedbelow will overstate the loss in GDP from the policy.
As Table A5.7 shows, the policy is predicted as yielding increases in employment,with a total gain in direct employment across the EU of roughly 2,800 jobs relative tothe base year at the end of the five year simulation period. The effects are in directproportion to the data provided for the Netherlands, hence the largest economies(Germany, France, UK, Italy) account for around 70% of the total, owing to theirhigher consumption of electrical goods.
Table A5.8 provides predictions of changes in total employment. These are generallysmall, but positive, across the Member States; they do, however, illustrate thepotential importance of accounting for the indirect and induced effects whenconsidering the employment implications of a policy. Added to the direct job gains ofroughly 2,800 by the end of the period are a further 2,000 plus jobs resulting frommultiplier effects. In other words, for almost every three direct jobs created, twoadditional indirect/induced jobs are created.
Risk & Policy Analysts
Page A5-15
Table A5.9 shows that this increase in employment is accompanied by slight increasesin GDP in most Member States. The gains would peak in 2002 at an estimatedincrease in GDP of 0.021% (€163 million), but by the end of the five year period theincrease in GDP is slightly reduced at roughly 0.016% (€145 million). The countriesbenefiting most from increases in GDP would be Germany, followed by France.
It should be noted though that not all countries would experience a gain in total jobs.Indeed, it is predicted that the net effect in Greece and Spain would be a small declinein total employment (less than one hundred jobs in both cases). These results are dueto the different behaviour for Greece and Spain estimated in the model. In the past,these economies have tended to respond to cost increases by greater-than-averageprice increases. This tendency is reflected in the parameters of the model which areestimated on data over the period 1960 to 1995. In consequence, in the modelsimulation GDP and consumption are reduced and employment is also lower. In thefuture, it may well be the case that since both countries are now in the EuropeanMonetary Union they will behave closer to the European average.
Table A5.7: Additional Direct Employment in Recycling Resulting from EU Directive onWEEE (change from 2000 figures)
2000 2001 2002 2003 2004 2005
Belgium 0 40 40 30 30 30
Denmark 0 40 40 40 40 40
Germany 0 1,030 1,010 1,010 1,020 1,030
Greece 0 10 10 10 10 10
Spain 0 110 110 110 110 110
France 0 400 420 430 440 440
Ireland 0 40 40 40 50 50
Italy 0 250 250 250 240 230
Luxembourg 0 0 0 0 0 0
Netherlands 0 10 10 10 90 90
Portugal 0 30 30 30 30 30
United Kingdom 0 510 530 550 570 580
Austria 0 50 50 50 40 40
Finland 0 70 80 80 90 90
Sweden 0 30 30 30 30 30
Total EU 0 2,710 2,730 2,780 2,800 2,820
Employment Effects of Waste Management Policies
Page A5-16
Table A5.8: Differences in Total Employment Resulting from EU Directive on WEEE (changefrom 2000 figures)
2000 2001 2002 2003 2004 2005
Austria 0 50 40 40 30 20
Belgium 0 110 100 90 60 30
Denmark 0 110 110 90 80 70
Finland 0 90 120 130 120 110
France 0 1,340 1,060 1,700 1,620 1,580
Germany 0 1,020 980 920 870 810
Greece 0 10 -50 -80 -100 -90
Ireland 0 60 50 50 40 30
Italy 0 870 1,170 1,590 1,980 2,280
Luxembourg 0 0 0 0 0 0
Netherlands 0 110 170 140 130 120
Portugal 0 50 50 50 40 30
Spain 0 70 40 -10 -50 -60
Sweden 0 190 130 150 170 200
United Kingdom 0 900 320 120 140 200
Total EU 0 5,040 4,340 5,030 5,150 5,320
Table A5.9: Change in GDP Resulting from EU Directive on WEEE (% change from 2000)
2000 2001 2002 2003 2004 2005
Austria 0 0.007 0.008 0.008 0.009 0.009
Belgium 0 0.001 0.002 0.002 0.002 0.002
Denmark 0 0.002 0.004 0.004 0.004 0.004
Finland 0 -0.001 0.004 0.004 0.005 0.005
France 0 0.000 0.004 0.003 0.004 0.004
Germany 0 0.004 0.005 0.005 0.005 0.005
Greece 0 -0.001 -0.001 -0.001 -0.001 -0.001
Ireland 0 0.002 0.000 -0.001 0.000 0.000
Italy 0 0.002 0.000 -0.002 -0.003 -0.005
Luxembourg 0 0.001 0.002 0.001 0.001 0.001
Netherlands 0 0.002 0.002 0.003 0.004 0.005
Portugal 0 0.001 0.001 0.002 0.003 0.003
Spain 0 0.000 0.000 -0.001 0.000 0.000
Sweden 0 -0.002 -0.003 -0.002 0.000 0.001
United Kingdom 0 -0.002 0.000 0.000 0.000 0.000
Total EU 0 0.001 0.002 0.002 0.002 0.002
Risk & Policy Analysts
Page A6-1
A6. THE NON-FERROUS METALS RECYCLING INDUSTRY
A6.1 Background
A6.1.1 The Business Context
The ferrous and non-ferrous recycling industries are the two most widely and longestablished recycling sectors, with the non-ferrous secondary metals recyclingindustry employing a workforce of approximately 100,000 people in 1995. It isestimated to consist of approximately 15,000 enterprises of which 10% are large, 30%medium and 60% small (IPTS, 1997).
Statistics show that 40% of non-ferrous metal produced in the EU is currentlyproduced from recycled materials, and this proportion is increasing. Clubb (1997)reports that the non-ferrous recycling industry is worth approximately €4.2 billionwith 3.5 million tonnes traded within the EU, 441,000 tonnes exported outside the EUand 880,000 tonnes imported to the EU.
The recyclable material used is predominantly from high-grade streams arising fromindustrial sectors, although separately collected cans provide the best-organisedsource of metals from commercial and household waste. There are three main typesof metal scrap:
• home scrap, such as trimmings, ingot croppings and other non-product material,which seldom enters the market;
• new scrap, which arises from the conversion of the raw material into finishedproducts; and
• old scrap, from discarded products.
The recovery and recycling of metals is an economic activity, driven by marketforces. The industry benefits from high prices for metals and well-establishedmarkets for their products. Where material is not recovered, it is generally because itis not financially viable to do so. It is influenced little by environmental legislation,although waste shipment legislation has been reported to restrict the markets forcertain recyclable metals and this is discussed below.
When metal is recovered it can be done so with little or no loss in the properties of themetal and in many cases secondary metals are of a similar quality to primary metals.The recycling process can be much less energy-intensive than the production ofprimary metals, for example, re-melting aluminium scrap consumes only 5% of theenergy needed in the whole primary production process and is therefore extremelyattractive. The profit usually generated provides a margin for covering the costs ofcollection and separation of waste. The capital requirements for non-ferrous metalprocessing are lower than those of ferrous metal and hence entry into the non-ferroussecondary metals industry is somewhat easier, leading to a degree of fragmentation inthe industry. Overall, there has been a trend for dealers to specialise in certain metalsin order to take advantage of economies of scale.
Employment Effects of Waste Management Policies
Page A6-2
Trade outside Europe is reaching highly significant proportions both in absolute andrelative terms. A proportion of EU scrap metal is exported to developing countries, asthese lack the pools of indigenous scrap from which to recover their own secondarymetals. Price and transport costs are usually the determining factors in whether scrapis sold domestically or is exported, and the EU scrap industry relies heavily on exportsfor economic viability when the domestic market is depressed.
A6.1.2 The Policy Context
The non-ferrous metals recycling industry is affected by both the Waste FrameworkDirective and Council Regulation (EEC) 259/93 on the supervision and control ofshipments of wastes within, into and out of the European Union. This case studyfocuses on the latter legislation due to data availability.
Council Regulation (EEC) 259/93 on the supervision and control of shipments ofwastes within, into and out of the European Union implements the Basel Conventionon the Transboundary Movements of Hazardous Wastes and their Disposal, but ismuch broader in scope, extending control to all wastes (except radioactive waste). TheConvention was originally negotiated to protect developing countries from being usedas cheap disposal sites for the industrial wastes of developed countries. Theimplication is that such wastes are sent to countries that are ill equipped to deal withthem properly, and hence they pose environmental hazards which are accepted for thesake of the disposal fees that they earn. In 1994, at the Second Conference of theParties, a consensus declaration was made that there was to be an immediate ban onhazardous wastes destined for final disposal between OECD and non-OECDcountries, and a phased-in ban for materials destined for recycling, with completecessation by December 31, 1997. In line with this, the Regulation was amended sothat trade in certain wastes outside the OECD were forbidden.
The Regulation controls the shipment of waste based on a system of notificationbetween the exporting/importing and transit countries. The level of control is variabledepending on the proposed treatment of the waste, its destination and its assignmentto one of three lists according to the degree of hazard of the waste (red, amber orgreen lists) (TN Sofres, 2000). Exports of red and amber listed wastes are bannedoutside the OECD. Most non-ferrous scrap metals traded internationally are greenlisted (non-hazardous), but some are amber listed. None currently appear on the redlist (most hazardous), although Article 10 of the Regulation allows for red listprocedures to be applied to any unlisted materials, and red list procedures may beapplied by any non-OECD country to any listed material.
In this case then, it is the amber procedures for waste for recovery which are mostimportant. This requires the notification of the competent authorities in the countriesof dispatch, transit and destination, any of which may request additional informationand documentation. These authorities then have a period of 30 days in which toobject to the shipment. If no objection is lodged after 30 days the shipment may beeffected, however the consent expires within a year of that date.
Risk & Policy Analysts
Page A6-3
A6.2 Data Analysis
A6.2.1 Data Availability and Reliability
Like the majority of the waste management industry, there is no single source ofreliable and comprehensive data on the recycling of non-ferrous metals, and datatherefore have to be extracted from a number of sources. A number of reports giveapproximate values for employment, turnover, tonnage involved, etc., where ingeneral this is given as a total for the EU.
Data from Eurostat relating to NACE codes 37.1 (recycling of metal waste and scrap)and 51.57 (wholesale of waste and scrap) have been used to give an indication of thedistribution of the industry among Member States (see Annex 3 for furtherexplanation of these statistics). Previous analysis has shown NACE 37 to comparefavourably with other sources of data on employment in recycling, although it isexpected that there may be a degree of underestimation relating to recycling activitiesin social enterprises and other sectors not covered by NACE 37. NACE 51.57 coversthe wholesale of any waste and scrap, not just metal, and therefore may overestimateemployment in the sector. However, the total for employment of NACE 37.1 and51.57 falls well below the estimated 100,000 people given by the industry tradeassociation, hence it has been scaled up according to the proportions indicated byEurostat data. Data from Eurostat on the number of enterprises involved in this sectorcompares more favourably with industry estimates.
The value and volume of metal imports and exports, both intra- and extra- EU hasalso been obtained from Eurostat using the following customs codes:
• 7404 for copper scrap;• 7602 for aluminium scrap;• 7802 for lead scrap;• 7902 for zinc scrap;• 8002 for tin scrap;• 7503 for nickel scrap; and• 2620 for metal ash and residues.
Code 2620 for metal ash and residues is the only one of the above list to be includedon the Amber list under Regulation (EEC) 259/93, and while it is considered that thiscovers the majority of non-ferrous metal on the list, it is recognised that this mightunderestimate the total volume/value of exports affected by amber list procedures.The remaining codes all fall under the green list and these are also considered to coverthe majority of non-ferrous trade.
A6.2.2 Employment in the Non-Ferrous Metals Recycling Industry
As previously indicated, the EU non-ferrous metals recycling industry employsapproximately 100,000 people in 15,000 enterprises. Table A6.1 shows thedistribution of these among EU Member States.
Employment Effects of Waste Management Policies
Page A6-4
Table A6.1: Number of Enterprises and Employment in the EU Non-Ferrous Metals RecyclingIndustry, 1995
Number of Enterprises Number EmployedCountry
Actual % of Total Actual % of Total
Austria 250 1.6 3,300 3.3
Belgium 255 1.6 2,800 2.8
Denmark 655 4.2 2,900 2.9
Finland 435 2.8 1,600 1.6
France 3,000 19.2 19,800 19.9
Germany 1,925 12.3 34,800 34.9
Greece 150 1.0 1,600 1.6
Ireland 35 0.2 100 0.1
Italy 4,475 28.7 15,000 15.0
Luxembourg 5 0.0 100 0.1
Netherlands 1,095 7.0 7,400 7.4
Portugal 150 1.0 1,400 1.4
Spain 25 0.2 500 0.5
Sweden 835 5.3 4,500 4.5
United Kingdom 2,325 14.9 3,900 3.9
Total EU 15,615 100 99,700 100
Table A6.1 shows that countries such as France, Germany and Italy dominate theindustry, both in terms of number of enterprises and level of employment. While theaverage number of employees per enterprise varies between Member States, in nocountry is it more than 20, with an EU average of six, suggesting that the majority ofnon-ferrous metal recycling is undertaken by small businesses.
Eurostat data shows that on average 31 tonnes of metal are recycled per job, whichcompares to the figure of 44 tonnes/job given by the Association of Cities forRecycling (1999).
A6.2.3 Size of Export Market
The export market for non-ferrous secondary metal is considerable, accounting for 2.4million tonnes within the EU (€2.3 billion), and 700,000 tonnes (€657 million) to non-EU countries in 1998. Table A6.2 illustrates the degree of change in the exportmarkets, in terms of volume, between 1995 and 1998. This shows that during thisperiod the volume of trade within the EU has decreased, while extra-EU exports haveincreased. However there are huge variations, both by country and by metal, withvery few trends noticeable, even if yearly data are analysed. The most obvious trendis a reduction in intra-EU lead exports, which have declined significantly. This is
Risk & Policy Analysts
Page A6-5
Table A6.2: Difference in Volume of Intra-EU and Extra-EU Exports between 1995-1998 (‘000s tonnes)
Copper Aluminium Lead Zinc Metal Ash &Residue
Total1
Intra Extra Intra Extra Intra Extra Intra Extra Intra Extra Intra Extra
thought to be due to other regulations concerning lead, rather than Regulation (EEC)259/93.
Although there has been an overall increase in both intra- and extra-EU aluminiumexports, this has not been experienced by all countries. Likewise, the overall decreasein exports of metal ash and residues has not been experienced by all countries, withAustria and the Netherlands both significantly increasing their exports.
Although 1999 export data was obtained from Eurostat, it was not used in thiscomparison as it was not complete for all of the Member States. Had it been usedhowever, it would have had a significant effect on a number of trends, not least theAmber-listed metal ash and residues, where 1999 sees huge increases in extra-EUexports for Denmark, Italy and the UK. Therefore, the figures used in this analysis arevery sensitive to the year assumed.
Exports in general have fluctuated over the 1995 to 1998 period, as has the price pertonne of metals. Again there is no clear trend between these two factors. In somecases where the volume of exports has decreased the price has risen, so that the totalvalue of exports for a particular metal has increased. For example, in the UK, intra-EU exports of amber listed metal ash and residues fell by more than 10,000 tonnes, a
Employment Effects of Waste Management Policies
Page A6-6
reduction of nearly 40%. However, the price per tonne rose from €949 to €2,319, sothat the total value of exports increased by more than 50% over the same period. Inother cases, the value of exports has decreased in line with a reduction in volume.
Table A6.3 gives actual volume and value data for non-ferrous metal scrap exports,according to their classification by Regulation (EEC) 259/93, for 1995. In general, thevolume and value of green listed metal scrap is much greater then that of amber listed.However, for Greece, Spain and Sweden, metal ash and residues accounts for morethan 50% of their exports.
Table A6.3: Volume and Value of Green Listed and Amber Listed Non-Ferrous Metals, 1995
Green Listed Metal Exports Amber Listed Metal ExportsCountry Volume of Metal/
TonnesValue of Metal/
1000 €Volume of Metal/
TonnesValue of Metal/
1000 €Austria 53,193 58,346 3,911 6,878
Belgium 233,439 172,729 100,025 33,438
Denmark 110,586 120,229 3,676 1,368
Finland 51,896 47,518 4,886 2,207
France 281,119 350,099 146,373 53,791
Germany 783,782 860,124 156,368 42,985
Greece 14,701 16,714 26,870 1,810
Ireland 23,929 29,194 100 154
Italy 75,285 78,268 57,445 23,513
Luxembourg 6,805 4,208 10,014 1,984
Netherlands 373,725 393,995 39,615 16,765
Portugal 17,403 21,909 165 59
Spain 49,328 69,724 72,554 27,270
Sweden 70,716 64,582 70,483 21,695
UK 259,407 337,738 37,050 63,612
EU 2,395,300 2,623,393 729,535 297,529
A6.3 Impacts of Waste Management Policies on the Non-Ferrous MetalsRecycling Industry
Regulation (EEC) 259/93 may impact both positively and negatively on employmentin the non-ferrous metals recycling industry. A study by TN Sofres (2000) attemptsto quantify the costs associated with this legislation on the non-ferrous industry, butconcludes that the costs are extremely heterogeneous due to the variety of situationsexperienced by companies (e.g. type of waste, country of exchange, role asimporter/exporter etc.).
Risk & Policy Analysts
Page A6-7
Table A6.4 indicates the compliance costs incurred by Italian non-ferrous recyclingcompanies with respect to the strict application of Decree 22/97 (which implementsDirectives 91/156/EEC, 91/698/EEC and 94/62/EEC), where these costs areapproximate to 0.5% - 1.0% of turnover. TN Sofres (2000) report the additional costsassociated with Regulation (EEC) 259/93 are equal to a similar percentage ofturnover, ranging from 0.0016% to 1.3%.
Table A6.4: Estimated Compliance Costs for the non-ferrous metal industry in Italy (€/Year)
Costs Small Firm Medium Firm Large FirmExtra person foradministrative procedures
It has been suggested that many companies have had to hire at least one extra personin order to deal with the extra administration and legal aspects that have arisen fromthe Regulation. Table A6.4 shows that this was also the case in Italy, so if similarcosts were incurred due to the implementation of Regulation (EEC) 259/93 then thiswould result in 40% (10% large and 30% medium sized companies) of the total15,616 companies having to employ one extra person, creating an additional 6,246jobs.
However, the restrictions to trade in non-ferrous metal scrap may also have a negativeeffect on employment. The extra burden of administration, variation in requirementsfor information, and delays in trade due to additional notification procedures havecaused contract failures and have deterred some companies from dealing with certaincountries. The main costs are reported as hidden costs in terms of losses of margins;but notification fees and administration costs are also significant, with administrationfees varying greatly between countries (Clubb, 1997).
Extra administration costs can render the exportation of quantities lower than 100tonnes unprofitable, causing a limitation of exports. A company surveyed by TNSofres (2000), which specialises in aluminium scrap, suggests that the cost of lostopportunities resulting from administrative trade barriers are far greater than directadministration costs (20 to 30 times greater).
The price of primary and secondary metal can vary a good deal, sometimes daily. Bycontrast, scrap processing costs are relatively stable over periods of months or longer.
Employment Effects of Waste Management Policies
Page A6-8
The lower the secondary price, the greater is the relative importance of processingcosts, and the smaller is the profit margin, to a point at which reclamation may not beworthwhile (Henstock, 1996). Most trade in recyclable metals needs to be settledquickly to take advantage of world prices, exchange rates, interest rates, freightcharges and the availability of the material. Some materials, such as aluminiumdrosses and lead drosses are perishable.
It should be remembered that the Regulation has the advantages of reducing illegalshipments and treatment practices through better control and protects developingcountries from importing waste which they cannot handle. However, the ban on tradewith non-OECD in red and amber listed wastes also has obvious effects on theindustry, although it is not clear to what extent with the data available. Currentexports of amber listed metals reach a value of approximately €400 million, where thisincludes both intra- and extra-EU trade, but there has been a noticeable decline in thevolume of intra-EU trade between 1995 and 1999. Therefore such restrictions mayhave wider implications than at first thought, due to the fact that the EU scrap industryrelies heavily on exports for economic viability when the domestic market isdepressed. However, other, unrelated market developments may conceal the effects ofwaste management measures, or make them seem larger than they are in reality.
A6.4 Application of the E3ME Model
As for the other case studies, the Cambridge Econometrics model was used to predictthe total net employment and GDP effects associated with the impact that Regulation(EEC) 259/93 has had on the export of secondary non-ferrous metals. The modellingassumes a theoretical situation where there is no international trade in amber listednon-ferrous metals. In practice, only exports to non-OECD countries are forbidden.This assumption was made on the basis that it was not possible to ascertain from theavailable data the proportion of exports going to non-OECD countries before the banwas implemented. The data also shows a decrease in trade in amber listed metalswithin the EU, which may have been caused by extra administration costs and delays.Hence, the results of the model present a worst case scenario where all trade isprevented, for whatever reason. It should be remembered though that the actual datadoes not show this to have happened and the decrease in trade experienced may bedue to other, unrelated market developments.
The assumption was made in modelling the Regulation to treat the policy effects as ifthey were taking place in a closed system (in other words to assume that the metalwas not exported, but simply ended up sitting in stockpiles). It was not possible tomodel a more dynamic system involving delayed sales. From the information on thesize of export markets, it was possible to infer the number of job losses through notbeing able to trade in amber-listed metals. The job losses were added to the directgains created by the additional administrative and legal requirements to work out theoverall net employment effect and the consequent impact on GDP by Member State.
The results of the econometric modelling are presented in Tables A6.5 to A6.7. Ascan be seen from Table A6.5, in all but two countries the Regulation has led to an
Risk & Policy Analysts
Page A6-9
increase in direct employment. These direct job gains are as would be expected inthat they reflect the need for companies to hire in additional legal and administrativeassistance in order to deal with the additional burdens in these two areas stemmingfrom the change in legislation. Note that the number of additional direct jobs remainsfairly constant over the five year period, with them predicted at roughly 6,150 by theend of the modelling period.
Table A6.6 presents the net predicted losses in total employment, where this includesthe multiplier effects of the changes in direct employment. As can be seen from thistable, owing to predicted losses in GDP (as given in Table A6.7) the pattern for totalemployment for the EU moves from being positive in the first two years followingimplementation of the Regulation to being negative in year five, although themagnitude of the net losses (at 1,700 jobs) is small.
The losses in GDP are negative in each of the five years, however, due to the fact thatthe non-ferrous metals recycling industry is a highly integrated sector, withconsiderable demand and supply linkages to other sectors of the economy. Thus,impacts on this sector have significant knock-on effects for other sectors (throughimpacts on demand and supply relationships). The greatest impact on GDP occurs inyear two at a predicted decrease in GDP of 0.006%, with GDP down by 0.005% byyear five. However, these are likely to be over-estimates of the effects of theRegulation given that the impact may be more one of delaying export rather thanpreventing it.
Table A6.5: Change in Direct Employment in the Non-Ferrous Metal Recycling IndustryResulting from Regulation (EEC) 259/93 (change from 2000)
2000 2001 2002 2003 2004 2005
Austria 0 100 100 100 100 100
Belgium 0 100 100 100 100 100
Denmark 0 260 270 280 280 280
Finland 0 170 170 170 170 170
France 0 1200 1220 1230 1210 1200
Germany 0 770 750 740 740 740
Greece 0 60 60 60 60 60
Ireland 0 10 10 10 10 10
Italy 0 1,790 1,780 1,780 1,780 1,780
Luxembourg 0 0 0 0 0 0
Netherlands 0 440 440 430 430 430
Portugal 0 60 60 60 60 60
Spain 0 10 0 -10 -20 -30
Sweden 0 340 340 330 330 340
United Kingdom 0 930 930 940 930 910
Total EU 0 6,250 6,230 6,230 6,190 6,150
Employment Effects of Waste Management Policies
Page A6-10
Table A6.6: Change in Total Employment Resulting from Regulation (EEC) 259/93 (changefrom 2000)
2000 2001 2002 2003 2004 2005
Austria 0 90 80 80 90 100
Belgium 0 -10 -200 -330 -380 -340
Denmark 0 310 300 290 270 260
Finland 0 200 210 220 210 210
France 0 1,220 860 70 -620 -1,240
Germany 0 430 50 -30 -150 -200
Greece 0 70 70 60 50 60
Ireland 0 10 10 10 10 10
Italy 0 1,500 1,420 1,410 1,370 1,340
Luxembourg 0 0 -10 -40 -70 -90
Netherlands 0 400 390 400 400 410
Portugal 0 70 80 80 80 70
Spain 0 -190 -440 -550 -730 -920
Sweden 0 250 200 230 260 300
United Kingdom 0 1,760 1,040 -980 -1,600 -1,630
Total EU 0 6,110 4,060 940 -800 -1,690
Table A6.7: Change in GDP resulting from Regulation (EEC) 259/93 (% change from 2000)
2000 2001 2002 2003 2004 2005
Austria 0 0.001 0.003 0.006 0.008 0.011
Belgium 0 -0.020 -0.035 -0.029 -0.027 -0.008
Denmark 0 0.004 0.004 0.005 0.005 0.005
Finland 0 0.005 0.006 0.007 0.006 0.006
France 0 -0.005 -0.010 -0.010 -0.010 -0.011
Germany 0 -0.002 -0.004 -0.003 -0.004 -0.004
Greece 0 -0.001 -0.002 -0.002 -0.001 -0.001
Ireland 0 0.000 0.000 0.001 0.001 0.000
Italy 0 0.000 0.000 0.001 0.001 0.001
Luxembourg 0 -0.008 -0.011 -0.009 -0.010 -0.010
Netherlands 0 -0.003 -0.004 -0.001 0.001 0.001
Portugal 0 0.002 0.003 0.003 0.003 0.003
Spain 0 -0.005 -0.009 -0.010 -0.011 -0.013
Sweden 0 0.001 0.010 0.016 0.019 0.021
United Kingdom 0 -0.007 -0.011 -0.010 -0.013 -0.015
Total EU 0 -0.003 -0.006 -0.005 -0.005 -0.005
Risk & Policy Analysts
Page A7-45
A7. REFERENCES
Abelson P (1996): Project Appraisal and Valuation of the Environment, London,Macmillan Press Limited.
AK Wien (2000): Umwelt und Beschäftigung: Strategien für eine nachhaltigeEntwicklung und deren Auswirkungen auf die Beschäftigung, Vienna.
Arnold F (1995): Economic Analysis of Environmental Policy and Regulation, NewYork, John Wiley & Sons.
Association of Cities for Recycling (1999): Newsletter Number 18, Brussels.
Bartholomew et al / ECOMAC (1999): Eco-Management Accounting: Based upon theECOMAC research project sponsored by the EU’s Environment and ClimateProgramme (DG XII, Human Dimension of Environmental Change), KluwerAcademic Publishers, London.
CEFIC (1999): Facts and Figures 1999, Brussels, CEFIC.
Chemical Industries Association (1996): The UK Indicators of Performance 1990-96,London, CIA.
Chemical Industries Association (1999): Industry Facts 1999, London, CIA.
Commission of the European Communities (2000): Proposal for a Directive on WasteElectrical and Electronic Equipment, Brussels, CEC (COM (2000) 347).
Coopers & Lybrand (1996): Cost-Benefit Analysis of the Different Municipal SolidWaste Management Systems: Objectives and Instruments for the Year 2000,Final Report to the European Commission DGXI, Brussels.
Cottica A & Kaulard A (1995): The Costs, Environmental Benefits and DirectEmployment Implication of Greening Municipal Waste Management in Europe:An Engineering Estimation, NOMISA, Bologna.
CWESAR (1999): La Place de l’Economie Sociale dans les Matiersde la Recuperation etdu Recyclage.
Davis HC (1990): Regional Economic Impact Analysis and Project Evaluation.
Department of Trade and Industry (2000): Consultation Paper: Proposed EC Directive onWaste Electrical and Electronic Equipment, London, DTI.
Department of Trade and Industry (1997): The Competitiveness of the UK WasteManagement Industry, London, DTI.
Employment Effects of Waste Management Policies
Page A7-46
ECOTEC (1999): The EU Eco-Industry’s Export Potential, Final Report to DGXI of theEuropean Commission, Brussels.
ECOTEC (1997): Environmental Protection Expenditure by UK Industry, London,Department of the Environment, Transport and the Regions.
ECOTEC (1994): The Potential for Employment Opportunities from PursuingSustainable Development, Report to the European Foundation for the Improvementof Living and Working Conditions, ECOTEC, Birmingham/Brussels.
Energy Technology Best Practice Programme (2000): Benchmarking Tool for theChemical Industry, Harwell, UK, ETBPP.
EURITS (European Union for Responsible Incineration and Treatment of Special Waste)2000:
Eurostat (1994): SERIEE, Luxembourg.
Fischer C (1999): Hazardous Waste Generation in Selected European Countries,Copenhagen, European Environment Agency.
Frankhauser S & McCoy D (1995): Principles of Environmental and Resource Economics: AGuide for Students and Decision-Makers, in Modelling the Economic Consequencesof Environmental Policies, (Eds: Folmer H, Gabel HL & Opschoor H), EdwardElgar Publishing Ltd.
Fritz et al ((1997): Die Beschaftigungssituation im Umweltbereich, Eine empirischeUntersuchung fur Osterreich (The Employment Situation in the EnvironmentField, an Empirical Investigation for Austria).
Gramlich E (1990): A Guide to Benefit Cost Analysis, Second Edition, New Jersey,Prentice-Hall Inc.
Gray WB & Shadbegian RJ (1993): Environmental Regulation and ManufacturingProductivity at the Plant Level, Discussion Paper, Centre for Economic Studies, USBureau of the Census, Washington DC.
Gray WB & Shadbegian RJ (1994): Pollution Abatement Costs, Regulation and Plant-Level Productivity, Discussion Paper, Centre for Economic Studies, US Bureau ofthe Census, Washington DC.
Heady CJ et al (2000): Study on the Relationship between Environmental/EnergyTaxation and Employment Creation, Report prepared for the EuropeanCommission: Directorate General XI.
Henstock ME (1996): The Recycling of Non-Ferrous Metals, ICME, Ottawa.
Risk & Policy Analysts
Page A7-47
Hufschmidt M et al (1990): Environment, Natural Systems, and Development: AnEconomic Valuation Guide, Baltimore, The John Hopkins University Press.
Instituto Nacionale de Estatistica do Portugal (2000): Environment Industry andEmployment in Portugal, 1997, prepared for DG Environment and Eurostat.
IPTS (1997): The Legal Definition of Waste and its Impact on Waste Management inEurope, Seville, IPTS.
Jacobs M (1994): Green Jobs? The Employment Implications of Environmental Policy.Report prepared by CAG Consultants for WWF.
John Clubb (1997): A Study of the Impact of European Community EnvironmentalDirectives and Regulations on the Ferrous and Non-Ferrous Metals RecyclingIndustries of the Community.
Jonsson PO (1997): Trends in Waste Management in Relation to Increasing Recycling,Annals of Agricultural and Environmental Medicine, Vol.4, No.1, 1997, pp3-6.
Joshi S et al (1997): Impact of Environmental Regulations on the US Steel Industry,Mimeo, Carnegie Mellon University.
KPMG (1995): Eindrapport: Economische Effecten als Gevolg van AfwijkendeFinancieringssystemen voor de Verwijderingskosten van Wit- en Bruingoed, DenHaag, KPMG.
Little I & Mirrlees J (1974): Project Appraisal and Planning for Developing Countries,London, Heinemann.
Malmros P (1997): Occupational Health Problems Associated with Increased Recycling ofHousehold Waste, Annals of Agricultural and Environmental Medicine, Vol.4, No.1,1997, pp7-9.
Mishan EJ (1994): Cost-Benefit Analysis, Fourth Edition, London, Routledge.
Morgenstern RD et al (2000): Jobs Versus the Environment: An Industry-LevelPerspective. Discussion Paper 99-01-REV, Washington DC, Resources for theFuture.
Morgenstern RD et al (1997): Are We Overstating the Real Economic Costs ofEnvironmental Protection? Discussion Paper 97-36-REV, Washington DC,Resources for the Future.
Murray R (1998): Re-Inventing Waste, London, Ecologika.
OECD (1985): The Macroeconomic Impact of Environmental Expenditure, Paris,OECD.
OECD (1996): The Global Environmental Goods and Services Industry, Paris, OECD.
OECD (1997): Environmental Policies and Employment, Paris, OECD.
Office for National Statistics (1997): Input-Output Methodological Guide, London,Government Statistical Service.
Ontario Ministry of Environment and Energy (1996): Economic Techniques forEnvironmental Policy Evaluation: A Training Manual, Economic ServicesBranch, Ontario Ministry of Environment and Energy.
Orgalime (2000): Detailed Position of Orgalime’s Electrical and Electronic LiaisonCommittee in Co-operation with the European Sector Committees, Brussels,Orgalime.
Owen D (2000): Forces for a Change – a View from the City, presented at the Institute ofWaste Management Conference, Torquay, UK, June 2000.
Pizer WA (1997): Prices vs. Quantities Revisited: The Case of Climate Change,Discussion Paper 98-02, Washington DC, Resources for the Future.
Porter ME & Van der Linde C (1995): Toward a new Conception of the Environment-Competitiveness Relationship, Journal of Economic Perspectives, Vol. 9, No.4.
Profeta L (1996): Waste Management and Employment, Brussels, European CommissionDG XI.B.1.
Quirion P & Glachant M (1996): The Employment Potential of Site Remediation Policies,CERNA (centre d’economie industrielle)/ Ecole des Mines de Paris, Paris.
Renner M (2000): Working for the Environment: A Growing Source of Jobs,Worldwatch Paper 152, Washington DC, Worldwatch Institute.
RPA (1999): Induced and Opportunity Costs and Benefit Patterns in the Context ofCost-Benefit Analysis in the Field of Environment, report prepared for DGIII of theEuropean Commission.
Robinson JC (1995): The Impact of Environmental and Occupational Health Regulation onProductivity Growth in US Manufacturing, Yale Journal on Regulation, Vol.12,No.387.
Scottish Executive (2000), Scottish Economic Statistics 2000, from www.scotland.gov.uk.
Statistics Netherlands (2000): Environment-related Employment in the Netherlands,1997, prepared for DG Environment and Eurostat.
Statistics Sweden (1998): The Environment Industry in Sweden, Orebro, StatisticsSweden.
Statistics Sweden (1999): The Environment Industry in Sweden in 1999, Orebro,Statistics Sweden.
Taylor Nelson Sofres Consulting (2000): Extra-Costs Induced by the Application ofWaste Regulations to Certain Materials, Final Report prepared for DG Enterprise.
USEPA (1999): Guidelines for Preparing Economic Analyses, June 1999, United StatesEnvironmental Protection Agency.
Waste Watch (1999): Jobs from Waste-Employment Opportunities in Recyling, London,Waste Watch.
Whiston TG (1995): Employment Considerations and Consequences Pertinent toAutomobile Disposal and Recycling: An EU Perspective, Science Policy ResearchUnit, University of Sussex, Brighton, UK.
Worldwatch Institute (2000): Working for the Environment: A Growing Source of Jobs,Worldwatch Paper 152, Washington DC, Worldwatch Institute.
WRc (1999): Study on Investment and Employment Related to EU Policy on Air, Waterand Waste, Final Report, for European Commission Directorate General XI-Environment, Nuclear Safety and Civil Protection, WRc Medmenham, Marlow,Bucks, UK.
Zerbe R & Dively (1994): Benefit Cost Analysis: In Theory and Practice, New York,Harper Collins Publishers.