4 Employment Perspective and Labour Policy 4.1. The generation of productive and gainful employment, with decent working conditions, on a sufficient scale to absorb our growing labour force must form a critical element in the strategy for achieving inclusive growth. Past record in this respect is definitely inadequate and the problem is heightened by the fact that the relatively higher rate of growth achieved during the last decade or so is not seen to generate a sufficient volume of good quality employment. 4.2. The Eleventh Plan provides an opportunity to focus on and diagnose the reasons for past failings observed in the employment situation and to reverse at least some of the adverse employment outcomes associated with the pattern of economic growth in the recent past. WEAKNESSES IN PAST PERFORMANCE 4.3. The basic weakness in our employment performance is the failure of the Indian economy to create a sufficient volume of additional high quality employment to absorb the new entrants into the labour force while also facilitating the absorption of surplus labour that currently exists in the agricultural sector, into higher wage, non-agricultural employment. A successful transition to inclusive growth requires migration of such surplus workers to other areas for productive and gainful employment in the organized or unorganized sector. Women agricultural workers in families where the male head has migrated, also require special attention given the need for credit and other inputs if they are self-employed in agriculture or for wage employment if they do not have land. 4.4. The approach to the Eleventh Plan had identified the following specific weaknesses on the employment front which illustrate the general failing just discussed. • The rate of unemployment has increased from 6.1% in 1993–94 to 7.3% in 1999–2000, and further to 8.3% in 2004–05. 1,2 • Unemployment among agricultural labour households has risen from 9.5% in 1993–94 to 15.3% in 2004–05. • Under-employment appears to be on the rise, as evident from a widening of the gap between the usual status (us) and the current daily status measures of creation of incremental employment opportunities between the periods 1994 to 2000 and 2000 to 2005 (Annexure 4.1). • While non-agricultural employment expanded at a robust annual rate of 4.7% during the period 1999– 2000 to 2004–05, this growth was largely in the unorganized sector. • Despite fairly healthy GDP growth, employment in the organized sector actually declined, leading to frustration among the educated youth who have rising expectations. • Although real wages of casual labour in agriculture continue to rise during 2000–2005, growth has decelerated strongly, as compared to the previous 1 Unless otherwise stated, the employment and unemployment estimates are on ‘Current Daily Status’ (CDS) basis. See Box 4.1 for other measures of employment which are also relevant. 2 Three kinds of estimates for the unemployed are obtained following the three different approaches. See Box 4.1.
Transcript
Employment Perspective and Labour Policy 63
4Employment Perspective andLabour Policy
4.1. The generation of productive and gainful employment,with decent working conditions, on a sufficient scale toabsorb our growing labour force must form a criticalelement in the strategy for achieving inclusive growth.Past record in this respect is definitely inadequate andthe problem is heightened by the fact that the relativelyhigher rate of growth achieved during the last decadeor so is not seen to generate a sufficient volume of goodquality employment.
4.2. The Eleventh Plan provides an opportunity to focuson and diagnose the reasons for past failings observed inthe employment situation and to reverse at least some ofthe adverse employment outcomes associated with thepattern of economic growth in the recent past.
WEAKNESSES IN PAST PERFORMANCE4.3. The basic weakness in our employment performanceis the failure of the Indian economy to create a sufficientvolume of additional high quality employment to absorbthe new entrants into the labour force while also facilitatingthe absorption of surplus labour that currently exists inthe agricultural sector, into higher wage, non-agriculturalemployment. A successful transition to inclusive growthrequires migration of such surplus workers to other areasfor productive and gainful employment in the organizedor unorganized sector. Women agricultural workers infamilies where the male head has migrated, also requirespecial attention given the need for credit and otherinputs if they are self-employed in agriculture or for wageemployment if they do not have land.
4.4. The approach to the Eleventh Plan had identifiedthe following specific weaknesses on the employmentfront which illustrate the general failing just discussed.
• The rate of unemployment has increased from 6.1%in 1993–94 to 7.3% in 1999–2000, and further to 8.3%in 2004–05.1,2
• Unemployment among agricultural labour householdshas risen from 9.5% in 1993–94 to 15.3% in 2004–05.
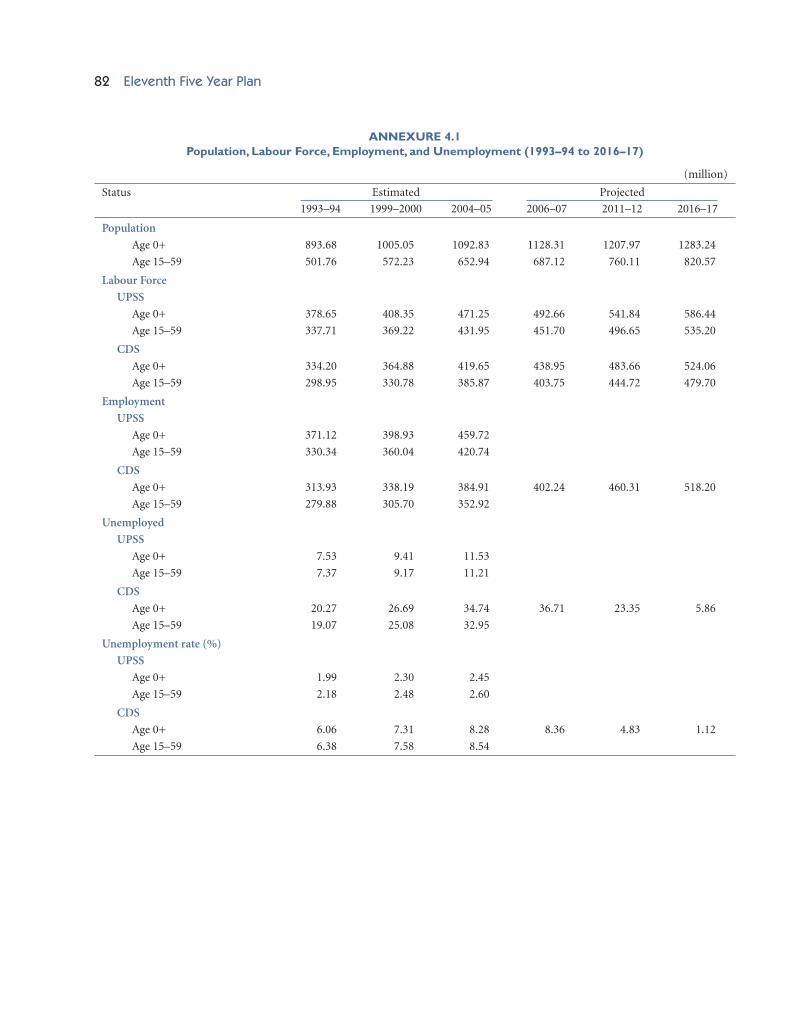
• Under-employment appears to be on the rise, as evidentfrom a widening of the gap between the usual status(us) and the current daily status measures of creationof incremental employment opportunities between theperiods 1994 to 2000 and 2000 to 2005 (Annexure 4.1).
• While non-agricultural employment expanded at arobust annual rate of 4.7% during the period 1999–2000 to 2004–05, this growth was largely in theunorganized sector.
• Despite fairly healthy GDP growth, employment inthe organized sector actually declined, leading tofrustration among the educated youth who have risingexpectations.
• Although real wages of casual labour in agriculturecontinue to rise during 2000–2005, growth hasdecelerated strongly, as compared to the previous
1Unless otherwise stated, the employment and unemploymentestimates are on ‘Current Daily Status’ (CDS) basis. See Box 4.1 forother measures of employment which are also relevant.2Three kinds of estimates for the unemployed are obtained followingthe three different approaches. See Box 4.1.
64 Eleventh Five Year Plan
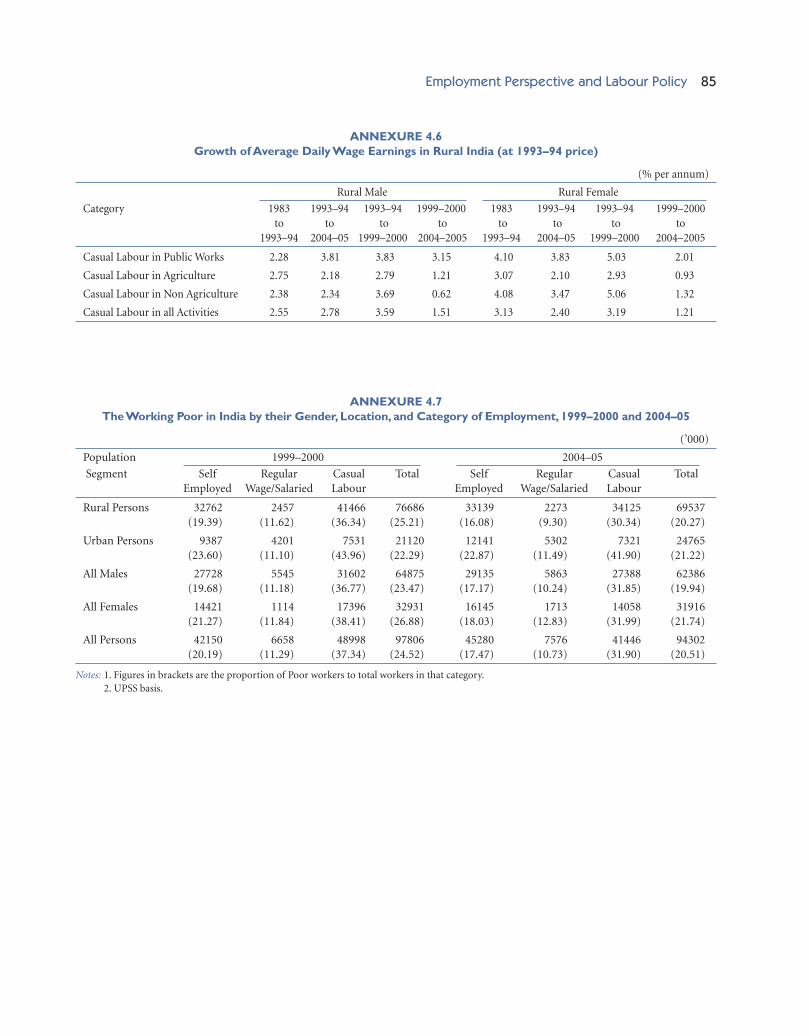
quinquennium (1994–2000), almost certainly reflectingpoor performance in agriculture. However, over thelonger periods 1983 to 1993–94 (period I) and 1993–94 to 2004–05 (Period II), the decline is moderate forrural male agricultural casual labour, from 2.75% to2.18% per annum.
• Growth of average real wage rates in non-agricultureemployment in the period 1999–2000 to 2004–05 hasbeen negligible. Seen over the longer period of twodecades (Period I and Period II), the wages havesteadily increased at over 2% per annum.
• In respect of entire rural male casual labour, the growthin real wages accelerated from 2.55% (Period I) to2.78% per annum (Period II) (Annexure 4.6).
• Real wages stagnated or declined even for workers inthe organized industry although managerial andtechnical staff did secure large increase.
• Wage share in the organized industrial sector hashalved after the 1980s and is now among the lowest inthe world.
4.5. It is only through a massive effort at employmentcreation, of the right quality, and decent conditions ofwork for all sections of population and at all locationsthat a fair redistribution of benefits from growth can beachieved. This indeed is a stupendous task. Alternativepolicy measures focusing on different sectors and
occupations, and the specific requirements of differenttarget groups are needed to create employment on asustainable basis.
RECENT EXPERIENCE REVISITED4.6. The Tenth Plan was framed against the backdropof concerns that were posed by the employment andunemployment survey in 1999–2000 (NSS 55th Round),which showed very low growth of employment comparedwith 1993–94. Jobless growth therefore became a keyconcern and the Plan set a target of creating 50 millionnew employment opportunities on a current daily statusbasis. (For a brief description of different concepts ofemployment see Box 4.1.)
4.7. The results of the most recent 61st Round of NSS for2004–05 reveal a somewhat better picture of employmentgrowth in the Tenth Plan period than in the previousperiod. During 1999–2000 to 2004–05, about 47 millionwork opportunities were created as compared to only24 million in the previous period 1993–94 to 1999–2000.Further, employment growth accelerated from 1.25% perannum during the period 1993–94 to 1999–2000 to 2.62%per annum during the period 1999–2000 to 2004–05. Theannual increase in work opportunities increased from 4.0million per year in the first period to 9.3 million per annumin the second period (Table 4.1).
Box 4.1The Three Kinds of Estimates of the Unemployed1
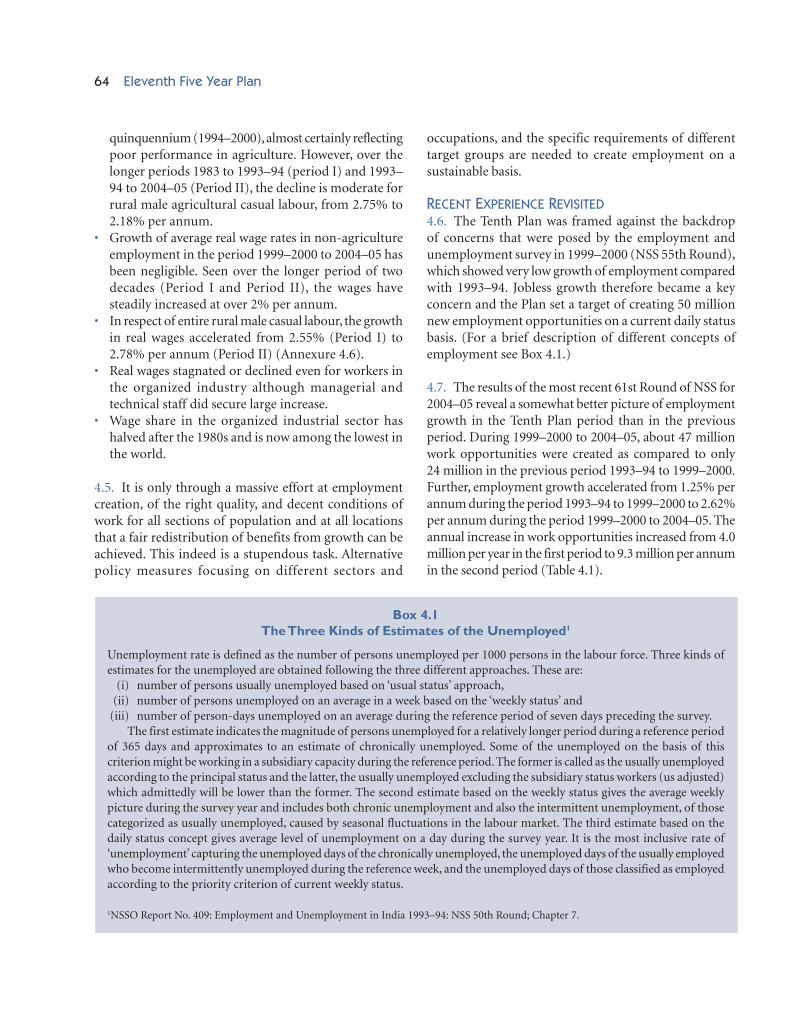
Unemployment rate is defined as the number of persons unemployed per 1000 persons in the labour force. Three kinds ofestimates for the unemployed are obtained following the three different approaches. These are:
(i) number of persons usually unemployed based on ‘usual status’ approach,(ii) number of persons unemployed on an average in a week based on the ‘weekly status’ and
(iii) number of person-days unemployed on an average during the reference period of seven days preceding the survey.The first estimate indicates the magnitude of persons unemployed for a relatively longer period during a reference period
of 365 days and approximates to an estimate of chronically unemployed. Some of the unemployed on the basis of thiscriterion might be working in a subsidiary capacity during the reference period. The former is called as the usually unemployedaccording to the principal status and the latter, the usually unemployed excluding the subsidiary status workers (us adjusted)which admittedly will be lower than the former. The second estimate based on the weekly status gives the average weeklypicture during the survey year and includes both chronic unemployment and also the intermittent unemployment, of thosecategorized as usually unemployed, caused by seasonal fluctuations in the labour market. The third estimate based on thedaily status concept gives average level of unemployment on a day during the survey year. It is the most inclusive rate of‘unemployment’ capturing the unemployed days of the chronically unemployed, the unemployed days of the usually employedwho become intermittently unemployed during the reference week, and the unemployed days of those classified as employedaccording to the priority criterion of current weekly status.
1NSSO Report No. 409: Employment and Unemployment in India 1993–94: NSS 50th Round; Chapter 7.
Employment Perspective and Labour Policy 65
4.8. Despite these positive features, it must also be notedthat the labour force also grew faster in the second period.However, the pace of growth in labour force in the secondperiod at 2.84% per annum exceeded the growth in theworkforce (employment) of 2.62% per annum, so thatthe unemployment rate increased from 7.3% in 1999–2000to 8.3% in 2004–05.
LONG-TERM TRENDS IN EMPLOYMENTSITUATION: 1983 THROUGH 20054.9. Some analysts have viewed the 1999–2000 surveyas an ‘outlier’ because of the relatively depressedemployment situation in that year, and have commentedthat 1999–2000 was a case of low statistical base, whichshows up as high growth of employment in the nextperiod 2000–05. On this view, a better assessmentof trends emerges if we compare developments overtwo relatively longer periods, that is, 1983 to 1993–94(period I–10.5 years) and 1993–94 to 2004–05 (periodII–11 years).
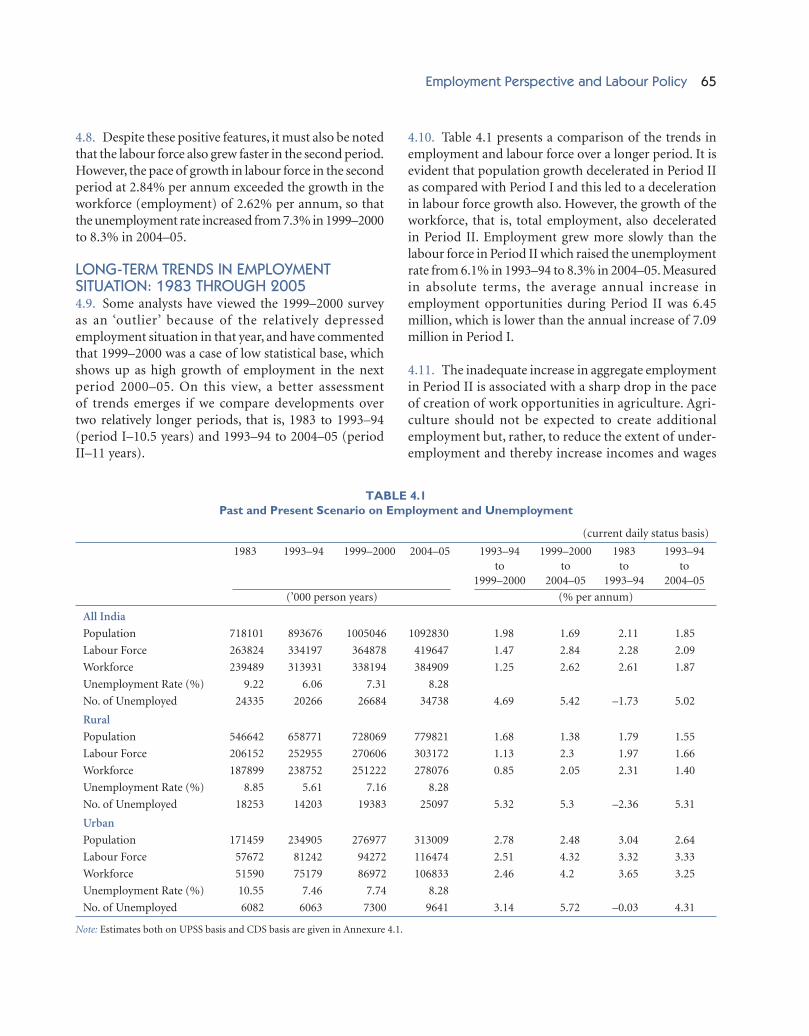
4.10. Table 4.1 presents a comparison of the trends inemployment and labour force over a longer period. It isevident that population growth decelerated in Period IIas compared with Period I and this led to a decelerationin labour force growth also. However, the growth of theworkforce, that is, total employment, also deceleratedin Period II. Employment grew more slowly than thelabour force in Period II which raised the unemploymentrate from 6.1% in 1993–94 to 8.3% in 2004–05. Measuredin absolute terms, the average annual increase inemployment opportunities during Period II was 6.45million, which is lower than the annual increase of 7.09million in Period I.
4.11. The inadequate increase in aggregate employmentin Period II is associated with a sharp drop in the paceof creation of work opportunities in agriculture. Agri-culture should not be expected to create additionalemployment but, rather, to reduce the extent of under-employment and thereby increase incomes and wages
(current daily status basis)
1983 1993–94 1999–2000 2004–05 1993–94 1999–2000 1983 1993–94to to to to
1999–2000 2004–05 1993–94 2004–05
(’000 person years) (% per annum)
All India
Population 718101 893676 1005046 1092830 1.98 1.69 2.11 1.85
Labour Force 263824 334197 364878 419647 1.47 2.84 2.28 2.09
Note: Estimates both on UPSS basis and CDS basis are given in Annexure 4.1.
TABLE 4.1Past and Present Scenario on Employment and Unemployment
66 Eleventh Five Year Plan
of those employed in agriculture while surplus labourshifts to the non-agriculture sector. However, theincrease in employment in the non-agricultural sectorswas disappointing.
4.12. As shown in Table 4.2, the dependence of the work-force on agriculture and allied sectors declined from 61%in 1993–94 to 52% in 2004–05, that is, a decline of9 percentage points as compared with a decline of only4 percentage points in the period 1983 to 1993–94. Thus,work opportunities diversified away from agriculture at afaster pace during the latter period 1993–94 to 2004–05.
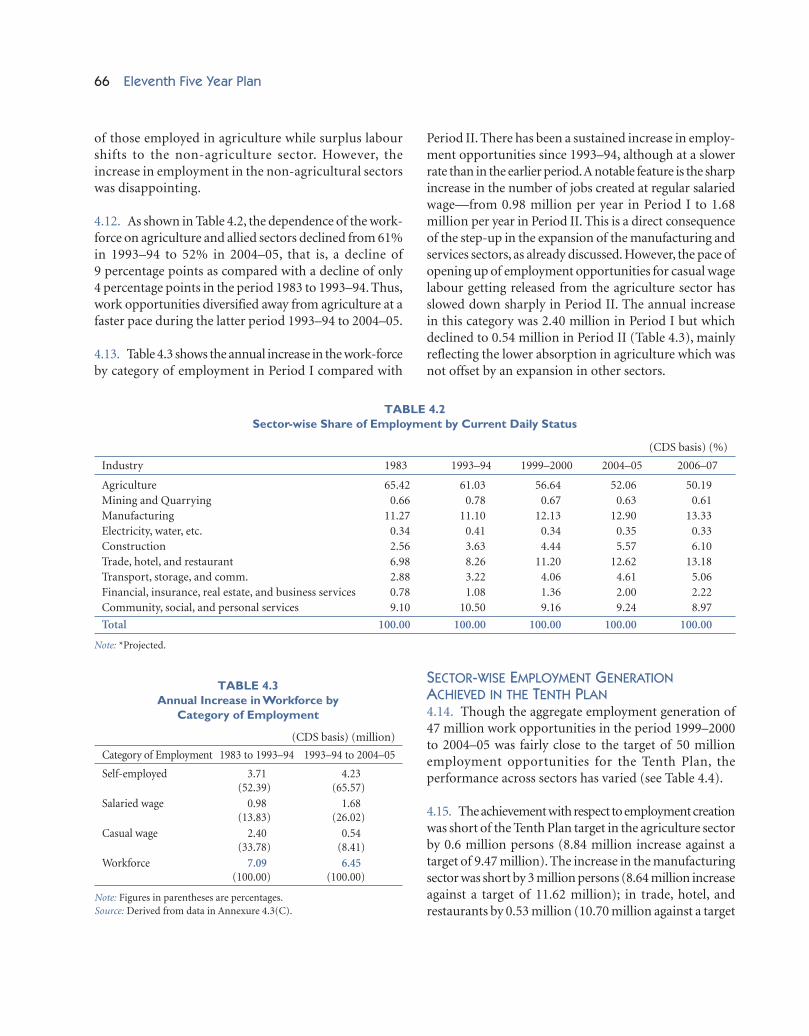
4.13. Table 4.3 shows the annual increase in the work-forceby category of employment in Period I compared with
Period II. There has been a sustained increase in employ-ment opportunities since 1993–94, although at a slowerrate than in the earlier period. A notable feature is the sharpincrease in the number of jobs created at regular salariedwage—from 0.98 million per year in Period I to 1.68million per year in Period II. This is a direct consequenceof the step-up in the expansion of the manufacturing andservices sectors, as already discussed. However, the pace ofopening up of employment opportunities for casual wagelabour getting released from the agriculture sector hasslowed down sharply in Period II. The annual increasein this category was 2.40 million in Period I but whichdeclined to 0.54 million in Period II (Table 4.3), mainlyreflecting the lower absorption in agriculture which wasnot offset by an expansion in other sectors.
(CDS basis) (million)
Category of Employment 1983 to 1993–94 1993–94 to 2004–05
Self-employed 3.71 4.23(52.39) (65.57)
Salaried wage 0.98 1.68(13.83) (26.02)
Casual wage 2.40 0.54(33.78) (8.41)
Workforce 7.09 6.45(100.00) (100.00)
Note: Figures in parentheses are percentages.Source: Derived from data in Annexure 4.3(C).
TABLE 4.3Annual Increase in Workforce by
Category of Employment
(CDS basis) (%)
Industry 1983 1993–94 1999–2000 2004–05 2006–07
Agriculture 65.42 61.03 56.64 52.06 50.19Mining and Quarrying 0.66 0.78 0.67 0.63 0.61Manufacturing 11.27 11.10 12.13 12.90 13.33Electricity, water, etc. 0.34 0.41 0.34 0.35 0.33Construction 2.56 3.63 4.44 5.57 6.10Trade, hotel, and restaurant 6.98 8.26 11.20 12.62 13.18Transport, storage, and comm. 2.88 3.22 4.06 4.61 5.06Financial, insurance, real estate, and business services 0.78 1.08 1.36 2.00 2.22Community, social, and personal services 9.10 10.50 9.16 9.24 8.97
Total 100.00 100.00 100.00 100.00 100.00
Note: *Projected.
TABLE 4.2Sector-wise Share of Employment by Current Daily Status
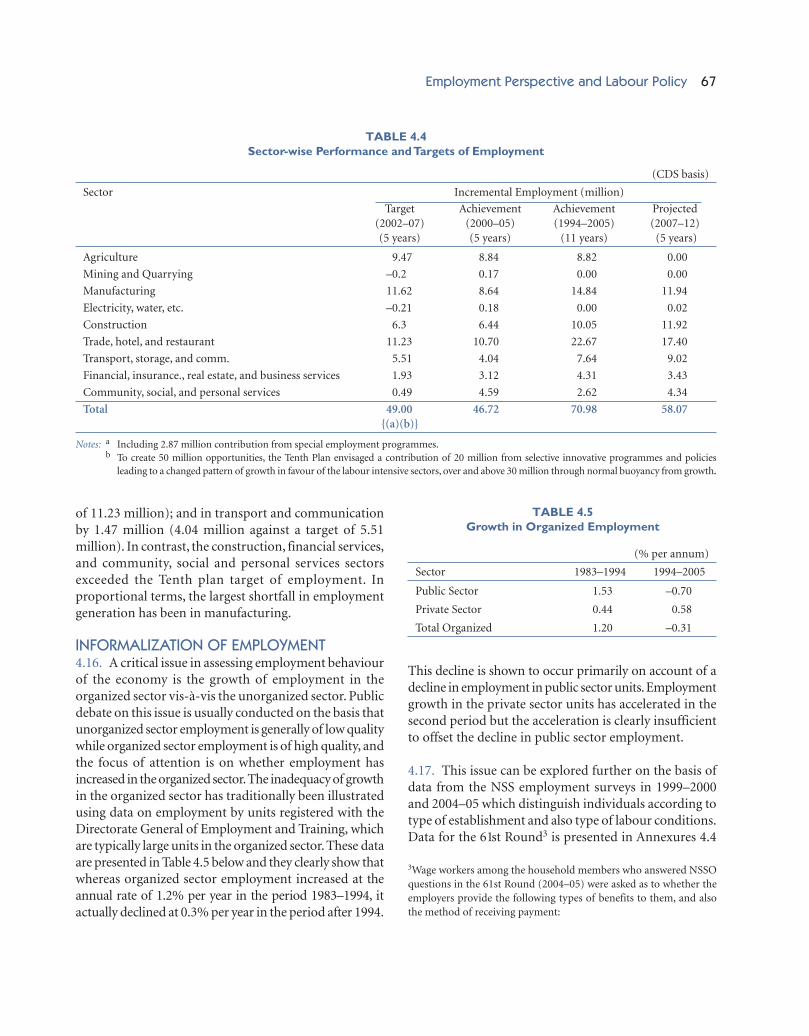
SECTOR-WISE EMPLOYMENT GENERATIONACHIEVED IN THE TENTH PLAN4.14. Though the aggregate employment generation of47 million work opportunities in the period 1999–2000to 2004–05 was fairly close to the target of 50 millionemployment opportunities for the Tenth Plan, theperformance across sectors has varied (see Table 4.4).
4.15. The achievement with respect to employment creationwas short of the Tenth Plan target in the agriculture sectorby 0.6 million persons (8.84 million increase against atarget of 9.47 million). The increase in the manufacturingsector was short by 3 million persons (8.64 million increaseagainst a target of 11.62 million); in trade, hotel, andrestaurants by 0.53 million (10.70 million against a target
Employment Perspective and Labour Policy 67
of 11.23 million); and in transport and communicationby 1.47 million (4.04 million against a target of 5.51million). In contrast, the construction, financial services,and community, social and personal services sectorsexceeded the Tenth plan target of employment. Inproportional terms, the largest shortfall in employmentgeneration has been in manufacturing.
INFORMALIZATION OF EMPLOYMENT4.16. A critical issue in assessing employment behaviourof the economy is the growth of employment in theorganized sector vis-à-vis the unorganized sector. Publicdebate on this issue is usually conducted on the basis thatunorganized sector employment is generally of low qualitywhile organized sector employment is of high quality, andthe focus of attention is on whether employment hasincreased in the organized sector. The inadequacy of growthin the organized sector has traditionally been illustratedusing data on employment by units registered with theDirectorate General of Employment and Training, whichare typically large units in the organized sector. These dataare presented in Table 4.5 below and they clearly show thatwhereas organized sector employment increased at theannual rate of 1.2% per year in the period 1983–1994, itactually declined at 0.3% per year in the period after 1994.
This decline is shown to occur primarily on account of adecline in employment in public sector units. Employmentgrowth in the private sector units has accelerated in thesecond period but the acceleration is clearly insufficientto offset the decline in public sector employment.
4.17. This issue can be explored further on the basis ofdata from the NSS employment surveys in 1999–2000and 2004–05 which distinguish individuals according totype of establishment and also type of labour conditions.Data for the 61st Round3 is presented in Annexures 4.4
Trade, hotel, and restaurant 11.23 10.70 22.67 17.40
Transport, storage, and comm. 5.51 4.04 7.64 9.02
Financial, insurance., real estate, and business services 1.93 3.12 4.31 3.43
Community, social, and personal services 0.49 4.59 2.62 4.34
Total 49.00 46.72 70.98 58.07{(a)(b)}
Notes: a Including 2.87 million contribution from special employment programmes.b To create 50 million opportunities, the Tenth Plan envisaged a contribution of 20 million from selective innovative programmes and policies
leading to a changed pattern of growth in favour of the labour intensive sectors, over and above 30 million through normal buoyancy from growth.
TABLE 4.4Sector-wise Performance and Targets of Employment
(% per annum)
Sector 1983–1994 1994–2005
Public Sector 1.53 –0.70
Private Sector 0.44 0.58
Total Organized 1.20 –0.31
TABLE 4.5Growth in Organized Employment
3Wage workers among the household members who answered NSSOquestions in the 61st Round (2004–05) were asked as to whether theemployers provide the following types of benefits to them, and alsothe method of receiving payment:
68 Eleventh Five Year Plan
and 4.5. The design of enquiry in the two rounds wasnot identical, and in the 55th Round it was restricted onlyto the receipt of PF benefits by employees.4
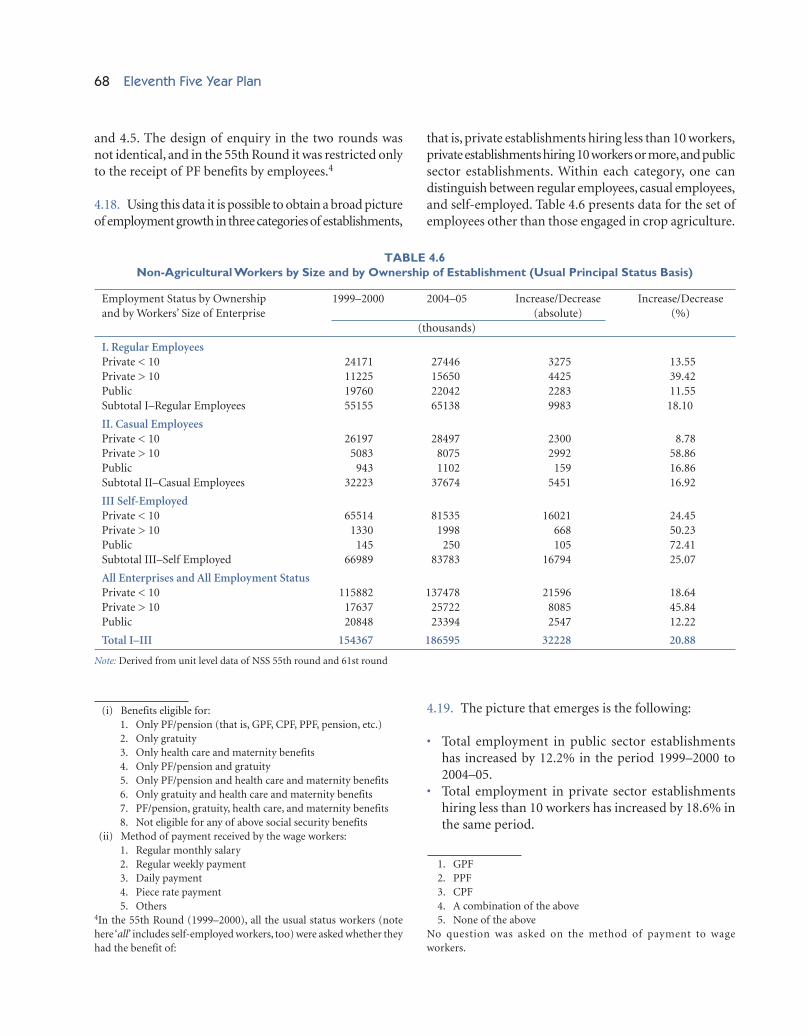
4.18. Using this data it is possible to obtain a broad pictureof employment growth in three categories of establishments,
that is, private establishments hiring less than 10 workers,private establishments hiring 10 workers or more, and publicsector establishments. Within each category, one candistinguish between regular employees, casual employees,and self-employed. Table 4.6 presents data for the set ofemployees other than those engaged in crop agriculture.
(i) Benefits eligible for:1. Only PF/pension (that is, GPF, CPF, PPF, pension, etc.)2. Only gratuity3. Only health care and maternity benefits4. Only PF/pension and gratuity5. Only PF/pension and health care and maternity benefits6. Only gratuity and health care and maternity benefits7. PF/pension, gratuity, health care, and maternity benefits8. Not eligible for any of above social security benefits
(ii) Method of payment received by the wage workers:1. Regular monthly salary2. Regular weekly payment3. Daily payment4. Piece rate payment5. Others
4In the 55th Round (1999–2000), all the usual status workers (notehere ‘all’ includes self-employed workers, too) were asked whether theyhad the benefit of:
Employment Status by Ownership 1999–2000 2004–05 Increase/Decrease Increase/Decreaseand by Workers’ Size of Enterprise (absolute) (%)
All Enterprises and All Employment StatusPrivate < 10 115882 137478 21596 18.64Private > 10 17637 25722 8085 45.84Public 20848 23394 2547 12.22
Total I–III 154367 186595 32228 20.88
Note: Derived from unit level data of NSS 55th round and 61st round
TABLE 4.6Non-Agricultural Workers by Size and by Ownership of Establishment (Usual Principal Status Basis)
1. GPF2. PPF3. CPF4. A combination of the above5. None of the above
No question was asked on the method of payment to wageworkers.
4.19. The picture that emerges is the following:
• Total employment in public sector establishmentshas increased by 12.2% in the period 1999–2000 to2004–05.
• Total employment in private sector establishmentshiring less than 10 workers has increased by 18.6% inthe same period.
Employment Perspective and Labour Policy 69
• Total employment in private sector establishmentshiring more than 10 workers has increased by as muchas 45.8%!
4.20. If we treat employment in establishments hiringmore than 10 workers as a measure of organized sectoremployment, the increase in organized sector employmentin the private sector is more than the increase in theprivate unorganized sector.
4.21. If we limit our focus on regular employees in thelarger private sector units, this category shows growth of39.42%. However, the growth of casual employees in thelarger private sector units was even faster at 58.9%.
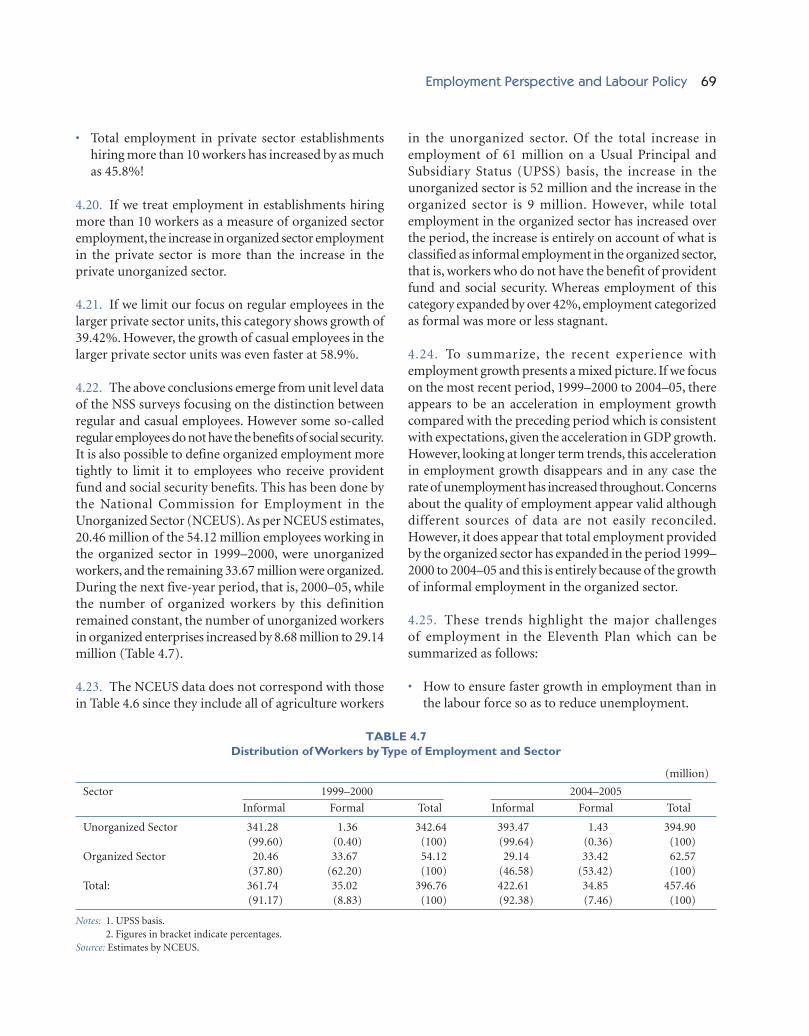
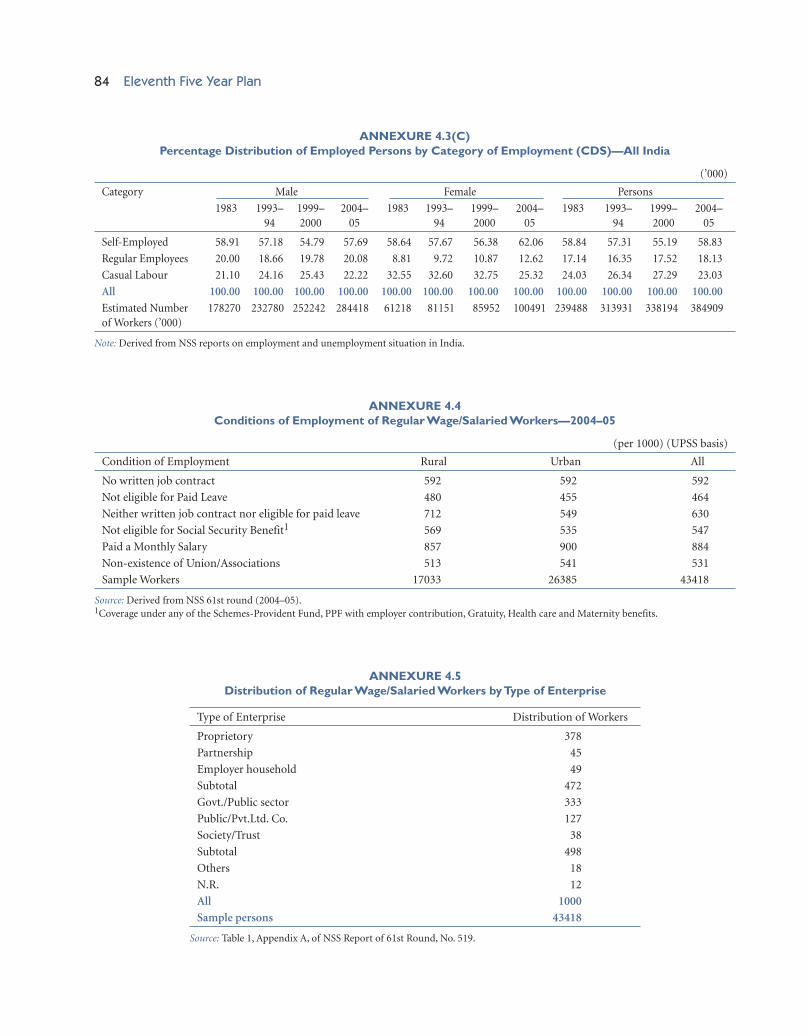
4.22. The above conclusions emerge from unit level dataof the NSS surveys focusing on the distinction betweenregular and casual employees. However some so-calledregular employees do not have the benefits of social security.It is also possible to define organized employment moretightly to limit it to employees who receive providentfund and social security benefits. This has been done bythe National Commission for Employment in theUnorganized Sector (NCEUS). As per NCEUS estimates,20.46 million of the 54.12 million employees working inthe organized sector in 1999–2000, were unorganizedworkers, and the remaining 33.67 million were organized.During the next five-year period, that is, 2000–05, whilethe number of organized workers by this definitionremained constant, the number of unorganized workersin organized enterprises increased by 8.68 million to 29.14million (Table 4.7).
4.23. The NCEUS data does not correspond with thosein Table 4.6 since they include all of agriculture workers
in the unorganized sector. Of the total increase inemployment of 61 million on a Usual Principal andSubsidiary Status (UPSS) basis, the increase in theunorganized sector is 52 million and the increase in theorganized sector is 9 million. However, while totalemployment in the organized sector has increased overthe period, the increase is entirely on account of what isclassified as informal employment in the organized sector,that is, workers who do not have the benefit of providentfund and social security. Whereas employment of thiscategory expanded by over 42%, employment categorizedas formal was more or less stagnant.
4.24. To summarize, the recent experience withemployment growth presents a mixed picture. If we focuson the most recent period, 1999–2000 to 2004–05, thereappears to be an acceleration in employment growthcompared with the preceding period which is consistentwith expectations, given the acceleration in GDP growth.However, looking at longer term trends, this accelerationin employment growth disappears and in any case therate of unemployment has increased throughout. Concernsabout the quality of employment appear valid althoughdifferent sources of data are not easily reconciled.However, it does appear that total employment providedby the organized sector has expanded in the period 1999–2000 to 2004–05 and this is entirely because of the growthof informal employment in the organized sector.
4.25. These trends highlight the major challengesof employment in the Eleventh Plan which can besummarized as follows:
• How to ensure faster growth in employment than inthe labour force so as to reduce unemployment.
Notes: 1. UPSS basis.2. Figures in bracket indicate percentages.
Source: Estimates by NCEUS.
TABLE 4.7Distribution of Workers by Type of Employment and Sector
(million)
70 Eleventh Five Year Plan
• How to ensure faster growth in the organized sectorthan the unorganized sector so that the share oforganized sector employment increases.
• How to ensure growth in formal employment in theorganized sector and not just the informal employment.
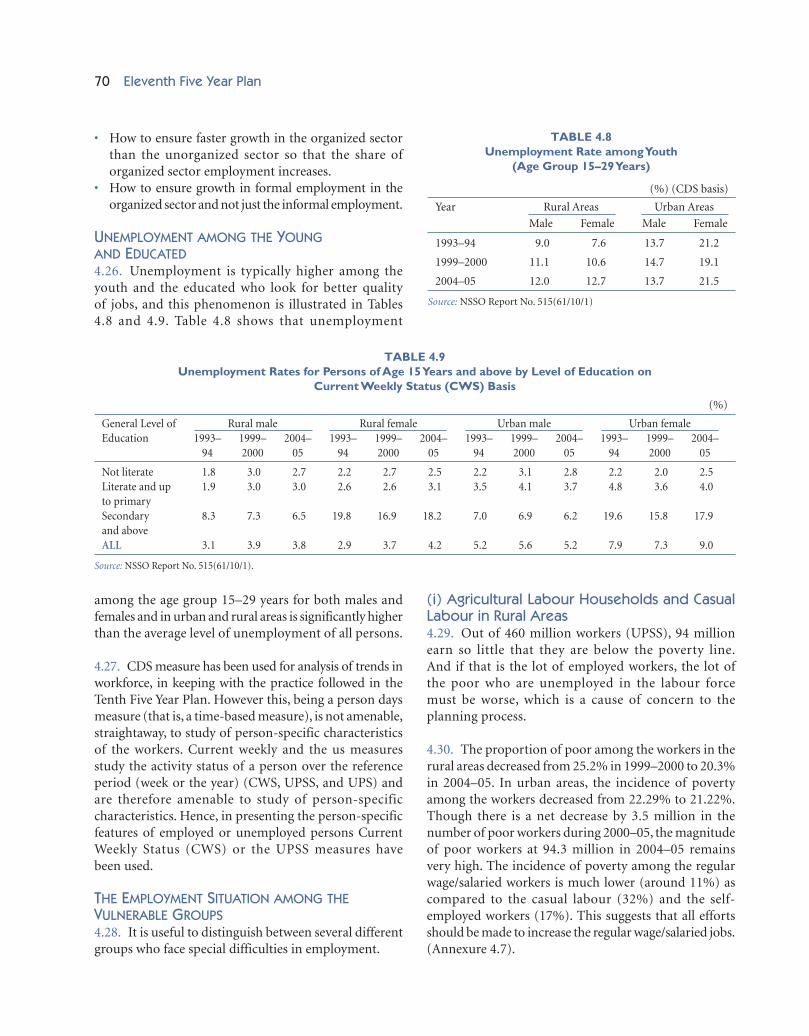
UNEMPLOYMENT AMONG THE YOUNGAND EDUCATED4.26. Unemployment is typically higher among theyouth and the educated who look for better qualityof jobs, and this phenomenon is illustrated in Tables4.8 and 4.9. Table 4.8 shows that unemployment
(%) (CDS basis)
Year Rural Areas Urban Areas
Male Female Male Female
1993–94 9.0 7.6 13.7 21.2
1999–2000 11.1 10.6 14.7 19.1
2004–05 12.0 12.7 13.7 21.5
Source: NSSO Report No. 515(61/10/1)
TABLE 4.8Unemployment Rate among Youth
(Age Group 15–29 Years)
General Level of Rural male Rural female Urban male Urban femaleEducation 1993– 1999– 2004– 1993– 1999– 2004– 1993– 1999– 2004– 1993– 1999– 2004–
TABLE 4.9Unemployment Rates for Persons of Age 15 Years and above by Level of Education on
Current Weekly Status (CWS) Basis
(%)
among the age group 15–29 years for both males andfemales and in urban and rural areas is significantly higherthan the average level of unemployment of all persons.
4.27. CDS measure has been used for analysis of trends inworkforce, in keeping with the practice followed in theTenth Five Year Plan. However this, being a person daysmeasure (that is, a time-based measure), is not amenable,straightaway, to study of person-specific characteristicsof the workers. Current weekly and the us measuresstudy the activity status of a person over the referenceperiod (week or the year) (CWS, UPSS, and UPS) andare therefore amenable to study of person-specificcharacteristics. Hence, in presenting the person-specificfeatures of employed or unemployed persons CurrentWeekly Status (CWS) or the UPSS measures havebeen used.
THE EMPLOYMENT SITUATION AMONG THEVULNERABLE GROUPS4.28. It is useful to distinguish between several differentgroups who face special difficulties in employment.
(i) Agricultural Labour Households and CasualLabour in Rural Areas4.29. Out of 460 million workers (UPSS), 94 millionearn so little that they are below the poverty line.And if that is the lot of employed workers, the lot ofthe poor who are unemployed in the labour forcemust be worse, which is a cause of concern to theplanning process.
4.30. The proportion of poor among the workers in therural areas decreased from 25.2% in 1999–2000 to 20.3%in 2004–05. In urban areas, the incidence of povertyamong the workers decreased from 22.29% to 21.22%.Though there is a net decrease by 3.5 million in thenumber of poor workers during 2000–05, the magnitudeof poor workers at 94.3 million in 2004–05 remainsvery high. The incidence of poverty among the regularwage/salaried workers is much lower (around 11%) ascompared to the casual labour (32%) and the self-employed workers (17%). This suggests that all effortsshould be made to increase the regular wage/salaried jobs.(Annexure 4.7).
Employment Perspective and Labour Policy 71
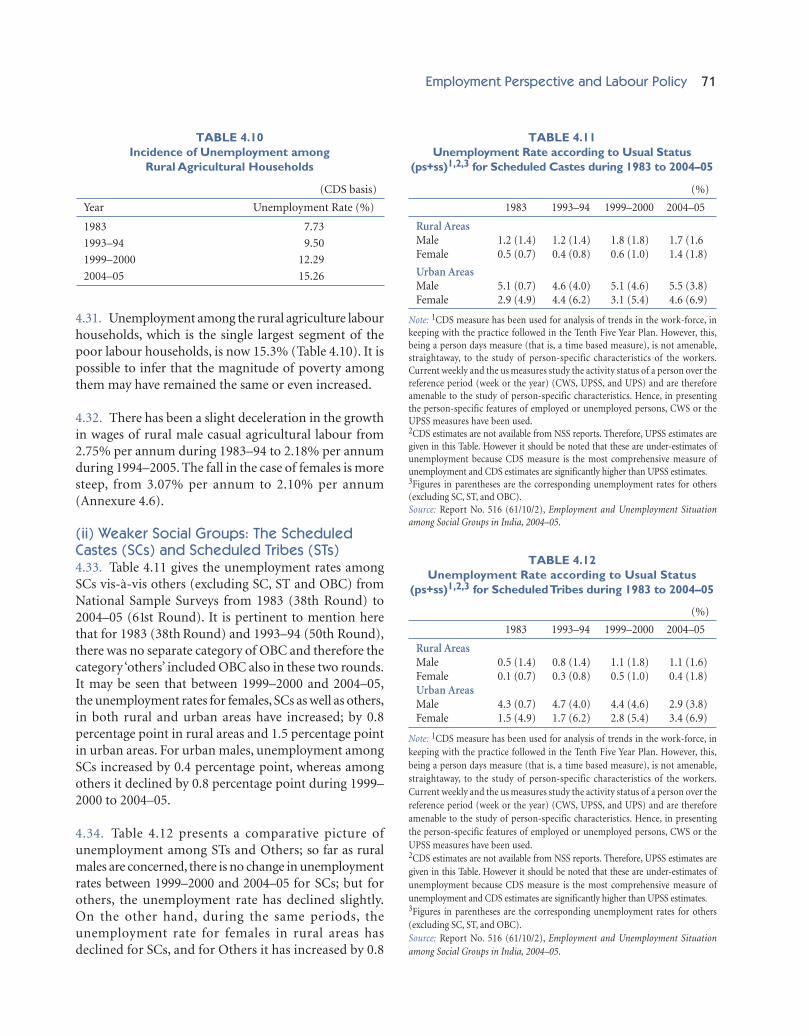
4.31. Unemployment among the rural agriculture labourhouseholds, which is the single largest segment of thepoor labour households, is now 15.3% (Table 4.10). It ispossible to infer that the magnitude of poverty amongthem may have remained the same or even increased.
4.32. There has been a slight deceleration in the growthin wages of rural male casual agricultural labour from2.75% per annum during 1983–94 to 2.18% per annumduring 1994–2005. The fall in the case of females is moresteep, from 3.07% per annum to 2.10% per annum(Annexure 4.6).
(ii) Weaker Social Groups: The ScheduledCastes (SCs) and Scheduled Tribes (STs)4.33. Table 4.11 gives the unemployment rates amongSCs vis-à-vis others (excluding SC, ST and OBC) fromNational Sample Surveys from 1983 (38th Round) to2004–05 (61st Round). It is pertinent to mention herethat for 1983 (38th Round) and 1993–94 (50th Round),there was no separate category of OBC and therefore thecategory ‘others’ included OBC also in these two rounds.It may be seen that between 1999–2000 and 2004–05,the unemployment rates for females, SCs as well as others,in both rural and urban areas have increased; by 0.8percentage point in rural areas and 1.5 percentage pointin urban areas. For urban males, unemployment amongSCs increased by 0.4 percentage point, whereas amongothers it declined by 0.8 percentage point during 1999–2000 to 2004–05.
4.34. Table 4.12 presents a comparative picture ofunemployment among STs and Others; so far as ruralmales are concerned, there is no change in unemploymentrates between 1999–2000 and 2004–05 for SCs; but forothers, the unemployment rate has declined slightly.On the other hand, during the same periods, theunemployment rate for females in rural areas hasdeclined for SCs, and for Others it has increased by 0.8
Note: 1CDS measure has been used for analysis of trends in the work-force, inkeeping with the practice followed in the Tenth Five Year Plan. However, this,being a person days measure (that is, a time based measure), is not amenable,straightaway, to the study of person-specific characteristics of the workers.Current weekly and the us measures study the activity status of a person over thereference period (week or the year) (CWS, UPSS, and UPS) and are thereforeamenable to the study of person-specific characteristics. Hence, in presentingthe person-specific features of employed or unemployed persons, CWS or theUPSS measures have been used.2CDS estimates are not available from NSS reports. Therefore, UPSS estimates aregiven in this Table. However it should be noted that these are under-estimates ofunemployment because CDS measure is the most comprehensive measure ofunemployment and CDS estimates are significantly higher than UPSS estimates.3Figures in parentheses are the corresponding unemployment rates for others(excluding SC, ST, and OBC).Source: Report No. 516 (61/10/2), Employment and Unemployment Situationamong Social Groups in India, 2004–05.
TABLE 4.11Unemployment Rate according to Usual Status
(ps+ss)1,2,3 for Scheduled Castes during 1983 to 2004–05
Note: 1CDS measure has been used for analysis of trends in the work-force, inkeeping with the practice followed in the Tenth Five Year Plan. However, this,being a person days measure (that is, a time based measure), is not amenable,straightaway, to the study of person-specific characteristics of the workers.Current weekly and the us measures study the activity status of a person over thereference period (week or the year) (CWS, UPSS, and UPS) and are thereforeamenable to the study of person-specific characteristics. Hence, in presentingthe person-specific features of employed or unemployed persons, CWS or theUPSS measures have been used.2CDS estimates are not available from NSS reports. Therefore, UPSS estimates aregiven in this Table. However it should be noted that these are under-estimates ofunemployment because CDS measure is the most comprehensive measure ofunemployment and CDS estimates are significantly higher than UPSS estimates.3Figures in parentheses are the corresponding unemployment rates for others(excluding SC, ST, and OBC).Source: Report No. 516 (61/10/2), Employment and Unemployment Situationamong Social Groups in India, 2004–05.
TABLE 4.12Unemployment Rate according to Usual Status
(ps+ss)1,2,3 for Scheduled Tribes during 1983 to 2004–05
72 Eleventh Five Year Plan
percentage point. In urban areas, the unemploymentrate for males in both categories, namely SCs and Othershas declined, but for females it has increased.
(iii) The Children at Work4.35. Estimates from the 61st Round reveal that 5.82million children (age 5–14 years) work; 1.136 million inurban areas and 4.682 million in rural areas (Table 4.13).
Integrated Child Development Scheme (ICDS), also, hasa responsibility with regard to the development ofadolescent girls and thus keeping them away fromwage employment.
4.38. The focus of efforts to eradicate child labour hasto be location specific, confined to those pockets whereemployers are prone to be exploitative in accessing thecheapest cost labour. High per-capita income locations(metro towns, in particular), destinations of migrantworker families and ‘industrial belts’, where informalwork relationships for labour-intensive occupationsthrive, have therefore to be closely monitored throughinnovative mechanisms that provide intelligence to theenforcement agencies.
4.39. Any expansion of the Child Labour EradicationPlan has to be made only after a careful evaluation of theexisting scheme with regard to:
• Its effectiveness in dovetailing SSA and ICDS;• The ability to involve State administrations which
implement the CSS pertaining to the development,education, nutrition, and protection of children;
• A purely Central Plan funded effort should be in thenature of an emergent action over a limited durationat the location, where the local administration are, byignorance or by design, seem to be aiding the use ofcheap child labour for serving the profit motive of thecitizens at that location.
• A suitable form of penalization should be imposed insuch local and State Governments that seem to bepaying only ‘lip service’ to curb the problem of theuse of ‘cheap cost child labour’.
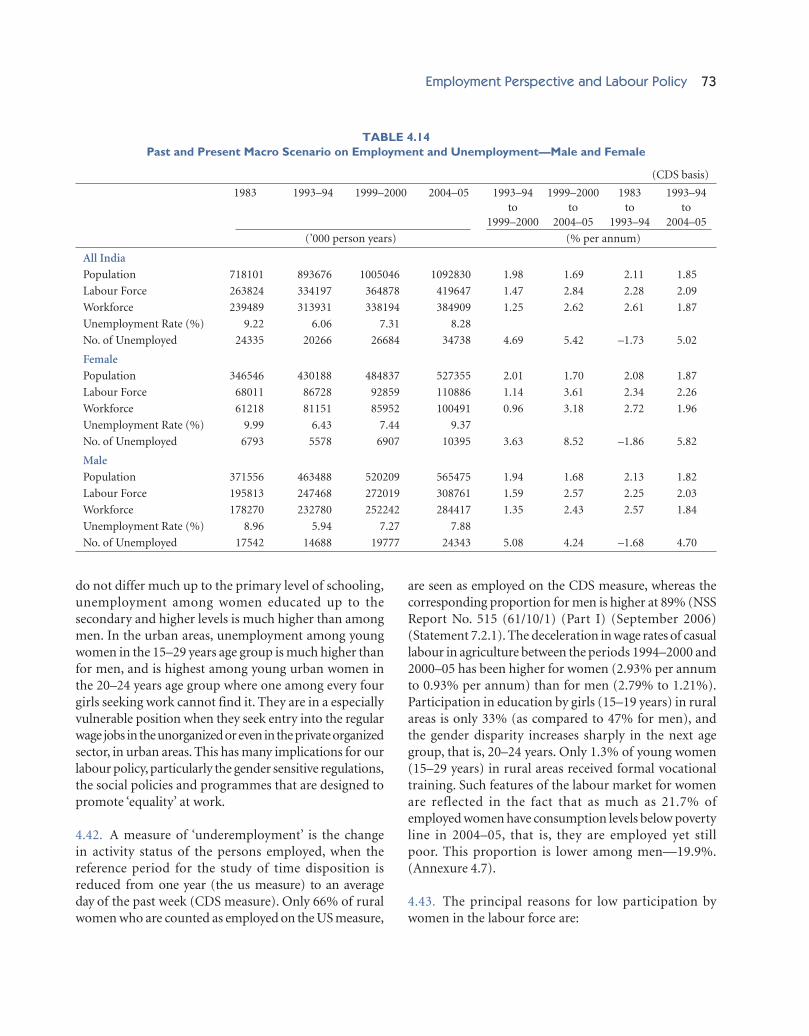
(iv) Women Workers4.40. Women comprise 48.3% of the population but haveonly 26.1% share in the persons employed. This ispresently because their share is in the labour force is only26.4% (Table 4.14). The female labour force participationrates (LFPR) across all age groups are 25 to 30% of themale LFPR in urban areas, and 35 to 40% of male LFPRin the rural areas.
4.41. Along with lower participation rates, womenface a higher incidence of unemployment than men.This is especially so for higher levels of education. Whilethe unemployment rates between men and women
TABLE 4.13Estimated Number of Children (5–14 Years)
in the Labour Force, Workforce, and Unemployed—All India (CDS Basis)
4.36. The Child Labour (Prohibition and Regulation) Act,1986 prohibits employment of children below 14 years inhazardous occupations and processes and regulates theworking conditions in other employments. Compliancewith the provisions of this Act is the responsibilityof Labour Sector of the Plan (Ministry of Labourand Employment). At present, the laws do not prohibitemployment of children in non-hazardous occupationsbut children so employed must have access to education.Against this background, the Eleventh Plan WorkingGroup on Child Labour has estimated that 3.643 millionchildren (5–14 years) were working in the non-agricultural sector, out of which 1.219 million childrenwere engaged in hazardous occupations. Chapter 6(Volume II) Towards Women’s Agency and Child Rightsgives the comprehensive approach to deal with the problemof children at work and exposed to other risks.
4.37. The education sector has a pre-eminent role inensuring that all children in the age group 9–14 years areat school. To the extent this goal of SSA can be ensured(now that there is a fourfold increase, at constant price,in the Eleventh Plan over the Tenth Plan, duly backedby scheme-tied revenue through a Cess), the tendencyto utilize child labour at a cheap cost to increase profitsfrom making children work, can be curbed. The
Employment Perspective and Labour Policy 73
do not differ much up to the primary level of schooling,unemployment among women educated up to thesecondary and higher levels is much higher than amongmen. In the urban areas, unemployment among youngwomen in the 15–29 years age group is much higher thanfor men, and is highest among young urban women inthe 20–24 years age group where one among every fourgirls seeking work cannot find it. They are in a especiallyvulnerable position when they seek entry into the regularwage jobs in the unorganized or even in the private organizedsector, in urban areas. This has many implications for ourlabour policy, particularly the gender sensitive regulations,the social policies and programmes that are designed topromote ‘equality’ at work.
4.42. A measure of ‘underemployment’ is the changein activity status of the persons employed, when thereference period for the study of time disposition isreduced from one year (the us measure) to an averageday of the past week (CDS measure). Only 66% of ruralwomen who are counted as employed on the US measure,
are seen as employed on the CDS measure, whereas thecorresponding proportion for men is higher at 89% (NSSReport No. 515 (61/10/1) (Part I) (September 2006)(Statement 7.2.1). The deceleration in wage rates of casuallabour in agriculture between the periods 1994–2000 and2000–05 has been higher for women (2.93% per annumto 0.93% per annum) than for men (2.79% to 1.21%).Participation in education by girls (15–19 years) in ruralareas is only 33% (as compared to 47% for men), andthe gender disparity increases sharply in the next agegroup, that is, 20–24 years. Only 1.3% of young women(15–29 years) in rural areas received formal vocationaltraining. Such features of the labour market for womenare reflected in the fact that as much as 21.7% ofemployed women have consumption levels below povertyline in 2004–05, that is, they are employed yet stillpoor. This proportion is lower among men—19.9%.(Annexure 4.7).
4.43. The principal reasons for low participation bywomen in the labour force are:
(CDS basis)
1983 1993–94 1999–2000 2004–05 1993–94 1999–2000 1983 1993–94to to to to
1999–2000 2004–05 1993–94 2004–05
(’000 person years) (% per annum)
All India
Population 718101 893676 1005046 1092830 1.98 1.69 2.11 1.85
Labour Force 263824 334197 364878 419647 1.47 2.84 2.28 2.09
TABLE 4.14Past and Present Macro Scenario on Employment and Unemployment—Male and Female
74 Eleventh Five Year Plan
• Wage rates of women are lower than of male forcomparable occupations.
• Women are denied access to certain occupations,though they may be capable of doing that work as wellas the men.
• Skill development of women is not uniform across alltrades; participation by them remains confined to afew labour-intensive occupations such as stitching,teachers training, etc., which forces a majority of thewomen to enter the labour market as unskilled labour.
4.44. Whenever equal opportunity has been given towomen in recruitments, equality in wage with the menhas been ensured, and an equal exposure in training hasbeen given, the participation by women in work hasimproved. This is illustrated in ample measure in theIT and enabled services sectors and in various otherprofessional services—legal, financial, commercial,education and health.
4.45. In order to promote gender equity, steps have tobe taken to increase women’s participation in the labourforce. This has to be pursued through skill development,labour policies and also the social security framework.Significant outcomes can be expected only if the genderissue is addressed through the planning initiatives acrossall the ‘heads of development’ in the Plan, with requisitelead from the ‘Women and Child Development’ Head.Gender-budgeting has not, so far, received due attention.
4.46. The Eleventh Plan must seek to reduce the genderdifferentials by pursuing (i) target shares for womenbeneficiaries in the programmes for ‘Skill Developmentinitiatives’, ‘New initiatives at Social Security’, implemen-tation of regulations such as the Apprentices Act, 1961, theFactories Act, the Building and Construction Workers(Conditions of Service) Act, and better implementationof The Maternity Benefit Act, 1976 and The EqualRemuneration Act, 2000, and for guarding against sexualharassment at the work place.
(v) Migrant Workers4.47. Inter-State population migration rates for the inter-census period (1991–2001) are given in Annexure 4.8. Thenet out-migrant and in-migrant States are presented inthis Annexure. Large absorbers of migrants are the Statesof Punjab, Haryana, Delhi, Gujarat, Maharashtra,Karnataka and Goa. The large net out-migrant States are
Rajasthan, Uttar Pradesh, Bihar, Assam, West Bengal,Jharkhand, Orissa, Chhattisgarh, Andhra Pradesh, Kerala,and Tamil Nadu. Implicit in these population movementsis an origin-destination migration matrix of workers. Thenumbers shown in the Annexure are inter-decadal andare presumably much smaller than the shorter periodmovements of migrant workers.
4.48. Migration itself is not an abnormal phenomenonand is common all over the world since growth centreswhich generate demand for labour often tend toconcentrate in certain areas. However, migrant workersare the most vulnerable and exploited among the informalsector workers, and have not received any attention inthe labour policy. In the States which are sources (origin)of supply of migrant workers—and most of them migrateto take up some labour-intensive, low-wage occupation—an effective and large-scale effort for vocational trainingin the labour intensive occupations is required. And sucha programme should be amenable to the special needs ofthe entrants to informal labour markets. In the destinationStates, the focus of public policy (including LabourPolicy) should be to improve the conditions under whichthe bulk of these in-migrants live and work. And in sofar as the destination locations fail to provide certain basicminimum conditions to the new in-migrants, it would bebetter to restrain economic growth at such locations. Inthe labour and employment sector, better implementationof certain legislations pertaining to unorganized workerscan protect the interests of most of the migrant workers;for example, the Building and Other Construction Workers(Regulation of Employment and Conditions of Service)Act, 1976; the Building and Other Construction Workers(Cess) Act, 1976; the Workmen’s Compensation Act, 1923and the Minimum Wages Act, 1948. An initiative has beentaken recently by the government (in September 2007)with the introduction of ‘The Unorganized Workers’Social Security Bill, 2007’ in the Rajya Sabha.
(vi) The Self-employed and CasualWage Employed4.49. The self-employed and casual wage employedaccount for 83% of the workforce. About 20–25 millionenter the labour force each year. Thus 17–21 millionwill enter the labour market in the non-regular wageemployed category. The only strength of the self and thecasual employed is their occupational skill, and theentrepreneurial skill to negotiate the price of labour put
Employment Perspective and Labour Policy 75
in by them. At present, a majority of the new entrants inthis category have little or no education, not to speak ofany vocational training. And many of them migrate tonew locations, and to new occupations other than theirtraditional ones. The skill development set up of thegovernment(s) has practically no space for them, atpresent. The National Skills Mission, discussed in theChapter 5 on Skill Development and Training could makea major difference by upgrading the skills of new entrantsto the informal sector.
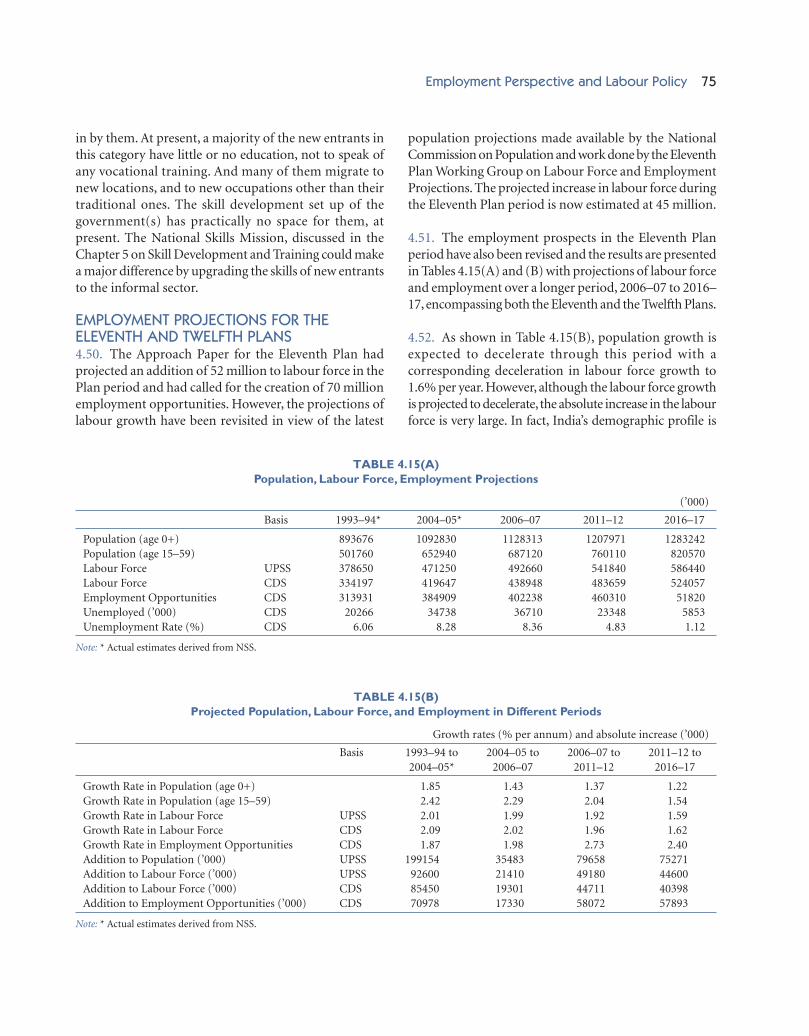
EMPLOYMENT PROJECTIONS FOR THEELEVENTH AND TWELFTH PLANS4.50. The Approach Paper for the Eleventh Plan hadprojected an addition of 52 million to labour force in thePlan period and had called for the creation of 70 millionemployment opportunities. However, the projections oflabour growth have been revisited in view of the latest
population projections made available by the NationalCommission on Population and work done by the EleventhPlan Working Group on Labour Force and EmploymentProjections. The projected increase in labour force duringthe Eleventh Plan period is now estimated at 45 million.
4.51. The employment prospects in the Eleventh Planperiod have also been revised and the results are presentedin Tables 4.15(A) and (B) with projections of labour forceand employment over a longer period, 2006–07 to 2016–17, encompassing both the Eleventh and the Twelfth Plans.
4.52. As shown in Table 4.15(B), population growth isexpected to decelerate through this period with acorresponding deceleration in labour force growth to1.6% per year. However, although the labour force growthis projected to decelerate, the absolute increase in the labourforce is very large. In fact, India’s demographic profile is
TABLE 4.15(A)Population, Labour Force, Employment Projections
Growth rates (% per annum) and absolute increase (’000)
Basis 1993–94 to 2004–05 to 2006–07 to 2011–12 to2004–05* 2006–07 2011–12 2016–17
Growth Rate in Population (age 0+) 1.85 1.43 1.37 1.22Growth Rate in Population (age 15–59) 2.42 2.29 2.04 1.54Growth Rate in Labour Force UPSS 2.01 1.99 1.92 1.59Growth Rate in Labour Force CDS 2.09 2.02 1.96 1.62Growth Rate in Employment Opportunities CDS 1.87 1.98 2.73 2.40Addition to Population (’000) UPSS 199154 35483 79658 75271Addition to Labour Force (’000) UPSS 92600 21410 49180 44600Addition to Labour Force (’000) CDS 85450 19301 44711 40398Addition to Employment Opportunities (’000) CDS 70978 17330 58072 57893
Note: * Actual estimates derived from NSS.
TABLE 4.15(B)Projected Population, Labour Force, and Employment in Different Periods
76 Eleventh Five Year Plan
such that the expansion in the labour force in India willbe larger than in the industrialized countries, and evenChina. As discussed in Chapter 5, the demographicdividend could be a source of global competitive advantageif it is combined with successful efforts at skill upgradationand at expansion of employment opportunities.
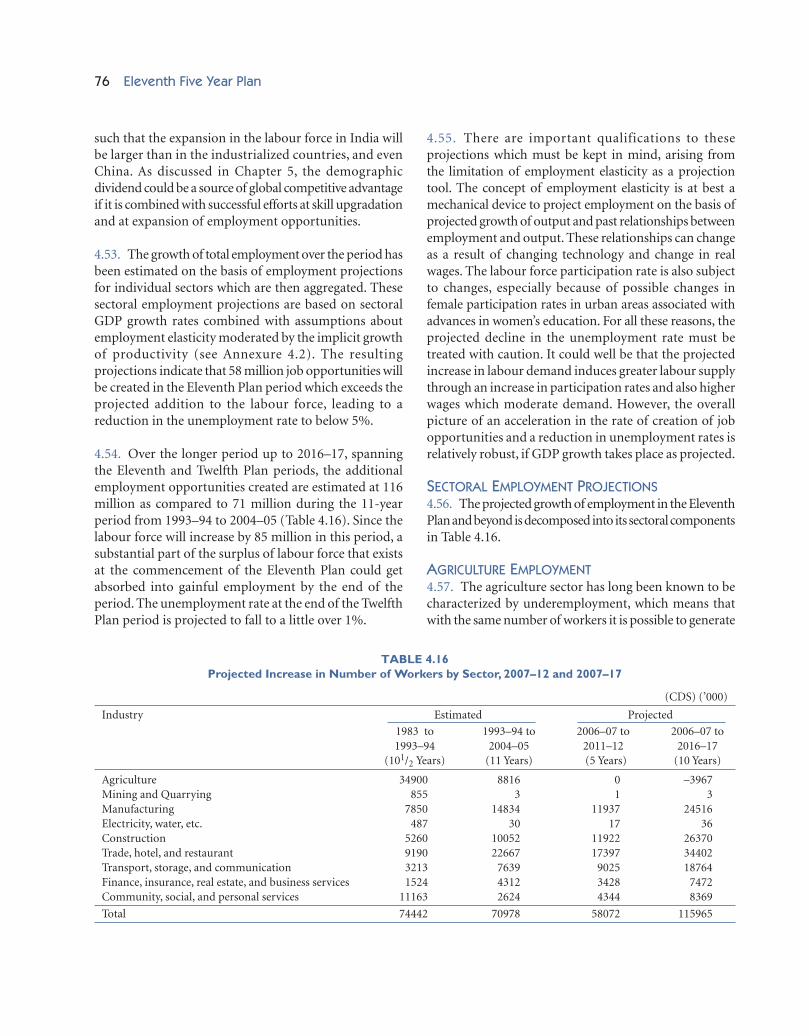
4.53. The growth of total employment over the period hasbeen estimated on the basis of employment projectionsfor individual sectors which are then aggregated. Thesesectoral employment projections are based on sectoralGDP growth rates combined with assumptions aboutemployment elasticity moderated by the implicit growthof productivity (see Annexure 4.2). The resultingprojections indicate that 58 million job opportunities willbe created in the Eleventh Plan period which exceeds theprojected addition to the labour force, leading to areduction in the unemployment rate to below 5%.
4.54. Over the longer period up to 2016–17, spanningthe Eleventh and Twelfth Plan periods, the additionalemployment opportunities created are estimated at 116million as compared to 71 million during the 11-yearperiod from 1993–94 to 2004–05 (Table 4.16). Since thelabour force will increase by 85 million in this period, asubstantial part of the surplus of labour force that existsat the commencement of the Eleventh Plan could getabsorbed into gainful employment by the end of theperiod. The unemployment rate at the end of the TwelfthPlan period is projected to fall to a little over 1%.
4.55. There are important qualifications to theseprojections which must be kept in mind, arising fromthe limitation of employment elasticity as a projectiontool. The concept of employment elasticity is at best amechanical device to project employment on the basis ofprojected growth of output and past relationships betweenemployment and output. These relationships can changeas a result of changing technology and change in realwages. The labour force participation rate is also subjectto changes, especially because of possible changes infemale participation rates in urban areas associated withadvances in women’s education. For all these reasons, theprojected decline in the unemployment rate must betreated with caution. It could well be that the projectedincrease in labour demand induces greater labour supplythrough an increase in participation rates and also higherwages which moderate demand. However, the overallpicture of an acceleration in the rate of creation of jobopportunities and a reduction in unemployment rates isrelatively robust, if GDP growth takes place as projected.
SECTORAL EMPLOYMENT PROJECTIONS4.56. The projected growth of employment in the EleventhPlan and beyond is decomposed into its sectoral componentsin Table 4.16.
AGRICULTURE EMPLOYMENT4.57. The agriculture sector has long been known to becharacterized by underemployment, which means thatwith the same number of workers it is possible to generate
(CDS) (’000)
Industry Estimated Projected
1983 to 1993–94 to 2006–07 to 2006–07 to1993–94 2004–05 2011–12 2016–17
(101/2 Years) (11 Years) (5 Years) (10 Years)
Agriculture 34900 8816 0 –3967Mining and Quarrying 855 3 1 3Manufacturing 7850 14834 11937 24516Electricity, water, etc. 487 30 17 36Construction 5260 10052 11922 26370Trade, hotel, and restaurant 9190 22667 17397 34402Transport, storage, and communication 3213 7639 9025 18764Finance, insurance, real estate, and business services 1524 4312 3428 7472Community, social, and personal services 11163 2624 4344 8369
Total 74442 70978 58072 115965
TABLE 4.16Projected Increase in Number of Workers by Sector, 2007–12 and 2007–17
Employment Perspective and Labour Policy 77
rural areas which can provide additional income for therural workforce by providing additional non-agriculturalemployment.
EMPLOYMENT IN MANUFACTURING, CONSTRUCTION,AND SERVICES4.60. The Eleventh Plan should aim at significantly steppingup growth in employment in other sectors, counteringthe long-term trends observed in the past. Employmentin manufacturing should grow at 4% per annum againstthe trend of growth in the preceding 11 years (1994–2005)of 3.3% per annum. Employment in construction shouldgrow at 8.2% per annum against the trend of 5.9%growth, and in the transport and communication sectorat 7.6% against the long-term trend of 5.3%.
4.61. These growth rates in employment in individualsectors are achievable provided they are supported byprogrammes for skill development, which will ensureavailability of the relevant skills without which the growthof employment will probably choke. It is also necessaryto ensure a wider provision of social security and welfareof unorganized workers, particularly in sectors such asconstruction and transport. Initiatives for these areas areelaborated in the Chapters on ‘Skill Development andTraining’ and ‘Nutrition and Social Safety Net’.
4.62. The sectors with prospects for high growth inoutput, creation of new establishments and for creationof new employment opportunities (direct as alsoindirect) are:
Services• IT-enabled Services• Telecom Services• Tourism• Transport Services• Health Care• Education and Training• Real Estate and Ownership of Dwellings• Banking and Financial Services• Insurance• Retail Services• Media and Entertainment Services
Other Sectors and Sub-Sectors• Energy-Production, Distribution and Consumption
of Horticulture
more output. The projection for the Eleventh Plan assumesthat the projected doubling of the rate of agriculturalgrowth during the Eleventh Plan will be possible withoutany increase in agricultural employment. Whereasagriculture contributed 8.8 million job opportunities inthe 11-year period from 1993–94 to 2004–05, it is projectedto contribute no increase in the Eleventh Plan and a netdecrease of 4 million agricultural workers over the TwelfthPlan period (2006–07 to 2016–17). This is a reasonableprojection considering that the number of main workersin agriculture declined by about 1.8 crore between 1991and 2001 and there has been a large increase in marginalworkers in agriculture during 1991–2001. Rising wagedifferentials between the agriculture and non-agriculturesectors are also very likely to shift labour out of agriculture,and the continued growth into the Twelfth Plan periodwould provide sufficient pull factor from non-agricultureto encourage such a shift.
4.58. An alternative projection of agricultural employmenthas also been made, applying the actual employmentelasticity (0.15) observed during 1993–94 to 2004–05 tothe projected growth of output over the perspective period(2007–2017). This gives an estimate of employment inagriculture for 2011–12, that is, about 9 million more thanin Table 4.16. In this projection there is positive growth ofemployment in agriculture at 0.6% per year andproductivity growth is correspondingly lower at 3.4% perannum. In this scenario, employment increase would be9 million more, with unemployment correspondingly lessat only 14 million in 2011–12. However, this would be atthe cost of lower productivity growth and, therefore,wages and incomes in agriculture and a larger proportionof low quality jobs.
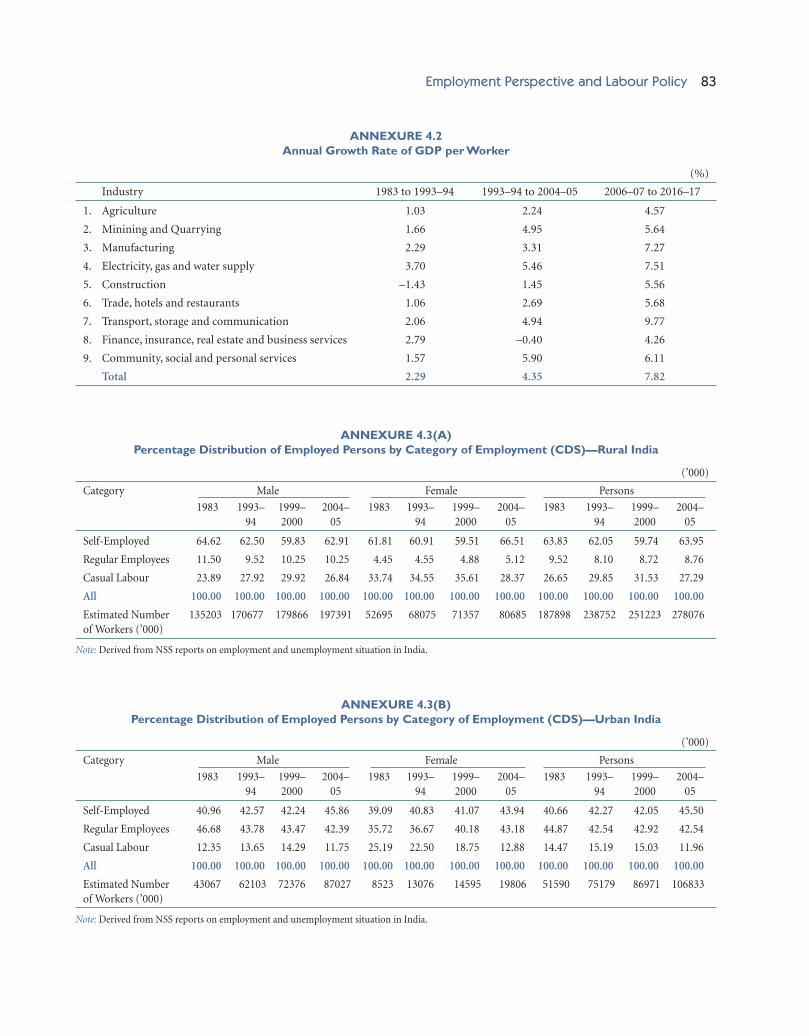
4.59. During the 11-year period 1994–2005, the pace ofincrease in per worker GDP in agriculture was only 2.24%per annum as compared to 4.35% per annum growthin aggregate GDP per worker. (Annexure 4.2). Duringthe Eleventh Plan, also, the pace of productivity increasebeing projected is lower for agriculture than for theaggregate economy, irrespective of the scenario regardingemployment growth in agriculture. Since the mainemployment issue in the agriculture sector is the increasein farm labour income, and not the creation of a largernumber of employed workers, it would be appropriateto work towards a strategy in which there is highergrowth in non-services employment opportunities in
78 Eleventh Five Year Plan
• Floriculture• Construction of Buildings• Infrastructure Projects Construction
Industry Groups• Automotive• Food Products• Chemical Products• Basic Metals• Non-Metallic Mineral Products• Plastic and Plastic Processing Industry• Leather• Rubber and Rubber Products• Wood and Bamboo Products• Gems and Jewellery• Handicrafts• Handlooms• Khadi and Village Industries
The Services Sector4.63. The services sector is currently the fastest growingsector of the economy, and employment growth in thesector has remained more than 5% per annum sincethe 1990s as compared with the aggregate employmentgrowth at less than 2%. This sector has the uniqueopportunity to grow due to its labour cost advantage,reflecting one of the lowest salary and wage levels in theworld coupled with a rising share of working agepopulation. However, two types of initiatives are required:(i) fostering the establishment of a viable size for deliveryof services based on labour intensive occupations. Onlyin establishments of a reasonable size (in contrast to theaverage enterprise size of 1.2 workers, as it exists today),with a reasonable level of occupational specializationand corresponding productivity and wage levels, is thisfeasible; and (ii) a massive skill development effort, asdiscussed later, for vocational training of the new entrantsto the labour force.
4.64. Planning initiatives in health, nutrition, care ofchildren, care of the aged, education, skill developmentand expansion of social security services will create a largepotential for employment for delivery of these services.Quantum jumps in the requirement of personnel, theirskill and in their composition—by gender, by social groupand by location in favour of the backward regions—willarise from:
• A massive increase in Central funding of educationwhich is a four fold increase over the Tenth Plan inconstant price;
• Emphasis on the next phase of SSA on improvementin the quality of education;
• Reaching these services to the districts having aconcentration of SC, ST, and minorities;
• Rapid expansion in the mid-day meal (MDM) schemeto cover 60 million additional children at the upperprimary level by 2008–09; and
• Enrolling one crore children in vocational education–skill development streams.
4.65. Already, a substantial increase in the number ofteachers has been made, which will continue further.During the three-year period of 2002–03 to 2005–06, 0.285million para teachers were recruited, of which 0.27 millionare in the rural areas (NUEPA; Progress Towards UEE—Analytical Report 2005–06; Table E 20). And much of thisexpansion has occurred in the low per capita incomeStates of Bihar, Madhya Pradesh, Chhattisgarh, Rajasthan,and Uttar Pradesh. Further, the expansion of mid-daymeals programme, will require a substantial step up inthe personnel required for delivery of such services.
4.66. The Central Government has recently announcedan expansion in social security services such as: (i) Oldage pension to all citizens, (ii) Life and disability coveragainst injury or death to either the head of, or to oneearning member of each poor family; and (iii) Healthinsurance, so that the poor do not have to bear a high costof medical care. These would require a commensurateexpansion in the requirement of a variety of professionallytrained and skilled personnel by the institutions that(i) cover risk; (ii) identify, issue and update the identityof the beneficiaries (smart cards); (iii) design specificschemes for the target groups and market the same;(iv) render medical services; or (v) reach out to theprospective beneficiaries. Most of the beneficiaries of thenew Central initiatives would be the aged, the poor andthe landless, and thus vulnerable to vagaries of the market.The institutional base that exists at present for deliveryof the kinds of services, discussed here, is quite insensitiveto the special needs of the prospective beneficiaries, andbreeds ‘exclusion’. While the beneficiaries could be (andshould be) expected to make a contribution, howsoeversmall, to participate in the scheme, the personnel that are
Employment Perspective and Labour Policy 79
hired for rendering these services have to be trained toreach out to the prospective beneficiaries, in a manner thatis responsible and transparent, and thus evokes her/hisconfidence to participate in the scheme. Moreover, sometoken contribution to become a member of the schemeis essential to empower these beneficiaries to lay a claimto the services that especially allocated funds by theCentral Government for their benefit.
(i) EXPANSION OF IT SERVICES IN RURAL AREAS4.67. Village kiosks will require expansion of IT personneldeployment across the rural areas of the country, inparticular to facilitate the expansion of an IT enabledgovernance set-up. Such improvements are essential forkeeping pace with the demand for public services thatwill guide the diversification of the economy away fromagriculture and towards the secondary and tertiarysectors, duly supported by: (i) investments in industrialinfrastructure, (ii) creation of institutional infrastructurein the rural areas, and (iii) for fostering integration ofrural markets with the rest of the economy. These wouldrequire manifold expansion in a variety of matchingservices to be delivered by the local governments and bythe village Panchayats, and that would be feasible only ifthe governance set-up at the local level is overhauled andhandled in an IT-friendly mode.
(ii) PERSONAL SERVICES4.68. The increase in the income of middle-class householdsin the high growth phase entails a spurt in consumptionof personal services related to attire, appearance, babycare, health upkeep, personal drivers, security, care for theaged dependents, household governance and management,and so on. And such personal services have to be deliveredby professionally trained, hired personnel of formalestablishments, quite distinct from the earlier one-personoperations. But in this area, a major effort at nurturingthe right type of serving establishments at reasonable fees,training and certification of their personnel who can earna reasonable income and thereby keep themselves aboveexploitation by the well off and informal employers, byway of access to the social security arrangements, isrequired. So far, services of a reasonable standard have byand large remained confined to the few who have a veryhigh level of personal income, leaving the average urbanconsumer of such services to the vagaries of a market drivenby ‘short-life’, one or two-person establishments, thriving
on profits from cheap and untrained young in-migrantsto high-income locations. The local administrations,including the labour administrations, have not handledthe issue in a labour–employment–income perspective,and have generally ignored the problems arising due tothe law and order enforcement agencies.
EMPLOYMENT AND LABOUR POLICY4.69. The employment strategy for the Eleventh Planmust ensure rapid growth of employment while alsoensuring an improvement in the quality of employment.While self employment will remain an importantemployment category in the foreseeable future—itaccounted for 58% of all employment in 2004–05—thereis need to increase the share of regular employees in totalemployment. As shown in Annexure 4.3(C), this categoryhas increased from 17% of total employment in 1983 to18% in 2004–05. It should be the focus of policy toachieve a substantial increase in the share of regularemployment with a matching reduction in the share ofcasual employment which at present is as high as 23%.
4.70. The above analysis implies that the success oflabour policy should be seen in terms of the number ofregular wage employment opportunities based on someform of a written contract between the employer and theemployee, that is, an increase in the number of ‘formal’jobs. The potential for creation of formal employmentcan be fully utilized by making appropriate changes inrules and procedures. It is often said that one of theobstacles to growth of formal employment in theorganized sector is the prevalence of excessively rigidlabour laws which discourage such employment. Stepsthat should be taken for a greater flexibility in labourlaws are discussed in the Chapter on Industry. Broadly, itis necessary to review existing laws and regulations witha view to making changes which would:
• encourage the corporate sector to move into morelabour-intensive sectors
• facilitate the expansion of employment and output ofthe unorganized enterprises that operate in the labour-intensive sectors.
4.71. At present, the incentives and subsidies are sodesigned as to strongly penalize entrepreneurs forcrossing a threshold size from a micro/small to a medium/
80 Eleventh Five Year Plan
large unit. The excise and other taxation policies need tobe reviewed in this perspective.
4.72. Changes in policies also need to be examined inregard to:
• Linking incentives with the outcomes measured interms of employment. For example, incentives aregiven to a wide range of production activities primarilywith the objective of promoting employment andincome of workers engaged in such activities. However,such incentives are hardly ever calibrated against thebenefits realized in terms of employment and wages.
• Regular wage employment, that is, formal employ-ment, merits fiscal incentives. Such incentives alreadyexist at a limited scale for the larger establishments,but are so designed as to make it difficult for mediumand small establishments to benefit from these.
4.73. Changing labour laws is a sensitive issue and it isnecessary to build a consensus. However, there are severalchanges short of hire and fire which should not presentproblems. These include:
• The locations and production activities that have ahigh potential for employment creation merit adifferential treatment.
• Employment of women must be encouraged ensuring,inter alia, the special needs that they may have byvirtue of change in working hours (night shifts, forexample) or the requirements of the family, for example,child care.
• Contract labour in the domestic tariff area meritsencouragement, provided commensurate steps aretaken to increase social security
• Monitoring the implementation of labour laws, thatis, the reporting system should be simplified and bepermitted in an IT-friendly mode.
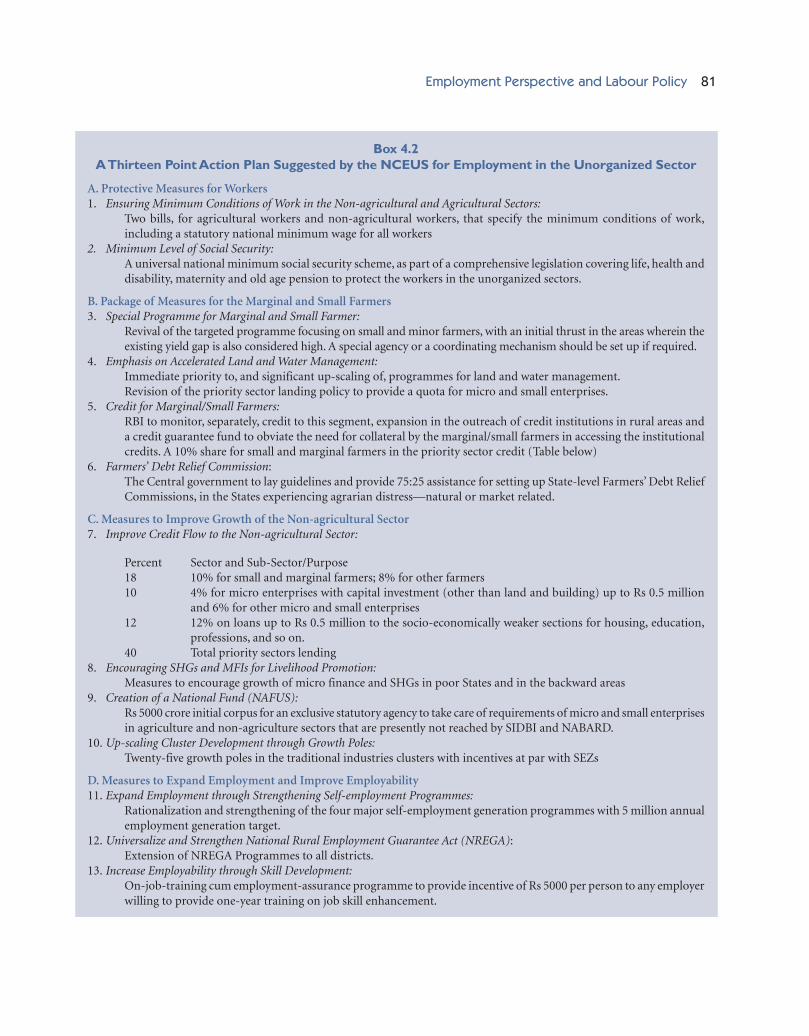
4.74. Even as steps are taken to increase the volume offormal or regular employment, it is also necessary to takesteps to improve the quality of employment in theunorganized sector. NCEUS in its August 2007 Report hassummarized, in the form of a 13-point Action Programme,the main recommendations for the workers of Enterprisesin the Unorganized/Informal Sector. These are presentedin Box 4.2.
4.75. Unorganized sector enterprises mostly hire mostworkers who get released, or relocated, from cropagriculture (due to the reasons discussed earlier), andseek wage employment in the manufacturing or servicessector. Any significant improvement in their income, andquality of employment, is feasible only if the institutionalenvironment in the labour market makes it feasible forthe formal sector to reach out to such workers on adecentralized basis rather than through a centralized planprogramme. The large coverage (in terms of absolutenumbers) through Provident Fund (43 million), EmployeeState Insurance (33.0 million) a variety of welfare funds(5.0 million), for beedi workers, for example) has beenpossible because the institutional framework createdthrough the various Acts5 (P.F., E.S.I., Beedi WorkersWelfare Fund, etc.) recognized a relationship of thoseemployed on regular wage, with either the employer, orthe specific formal commodity market that provides workto (that is, absorbs the output of labour put in by) theunorganized enterprises’ workers.
4.76. As already argued, the creation of a formalrelationship between the worker and the hiringestablishment, in the regular wage employment mode, isa critical factor in improving the quality of employmentof the workers hired by the unorganized enterprises. Inthis context, the work being done by NCEUS6 on: (i) the‘employment strategy’ to be pursued in respect of, andthrough the, unorganized enterprises, (ii) the regime oflabour regulations to attract the unorganized enterpriseto give a formal recognition to the multitudes of workershired by them, and (iii) to enable them to gain access to‘social security’, is of paramount importance.
5Of course, many of these organizations have to reorient their patternof working to the new realities of the market for wage labour in whichthe role of public sector is diminishing and the average number of workershired by the private enterprises is reducing consequent upon changes intechnology leading to improvement in the productivity of labour.6The relevant terms of reference of NCEUS are:• Suggest elements of an employment strategy focusing on the
informal sector;• Review Indian labour laws, consistent with labour rights, and with
the requirements of expanding growth of industry and services,particularly in the informal sector, and improving productivityand competitiveness; and
• Review the social security system available for labour in theinformal sector, and make recommendations for expanding theircoverage.
Employment Perspective and Labour Policy 81
Box 4.2A Thirteen Point Action Plan Suggested by the NCEUS for Employment in the Unorganized Sector
A. Protective Measures for Workers1. Ensuring Minimum Conditions of Work in the Non-agricultural and Agricultural Sectors:
Two bills, for agricultural workers and non-agricultural workers, that specify the minimum conditions of work,including a statutory national minimum wage for all workers
2. Minimum Level of Social Security:A universal national minimum social security scheme, as part of a comprehensive legislation covering life, health anddisability, maternity and old age pension to protect the workers in the unorganized sectors.
B. Package of Measures for the Marginal and Small Farmers3. Special Programme for Marginal and Small Farmer:
Revival of the targeted programme focusing on small and minor farmers, with an initial thrust in the areas wherein theexisting yield gap is also considered high. A special agency or a coordinating mechanism should be set up if required.
4. Emphasis on Accelerated Land and Water Management:Immediate priority to, and significant up-scaling of, programmes for land and water management.Revision of the priority sector landing policy to provide a quota for micro and small enterprises.
5. Credit for Marginal/Small Farmers:RBI to monitor, separately, credit to this segment, expansion in the outreach of credit institutions in rural areas anda credit guarantee fund to obviate the need for collateral by the marginal/small farmers in accessing the institutionalcredits. A 10% share for small and marginal farmers in the priority sector credit (Table below)
6. Farmers’ Debt Relief Commission:The Central government to lay guidelines and provide 75:25 assistance for setting up State-level Farmers’ Debt ReliefCommissions, in the States experiencing agrarian distress—natural or market related.
C. Measures to Improve Growth of the Non-agricultural Sector7. Improve Credit Flow to the Non-agricultural Sector:
Percent Sector and Sub-Sector/Purpose18 10% for small and marginal farmers; 8% for other farmers10 4% for micro enterprises with capital investment (other than land and building) up to Rs 0.5 million
and 6% for other micro and small enterprises12 12% on loans up to Rs 0.5 million to the socio-economically weaker sections for housing, education,
professions, and so on.40 Total priority sectors lending
8. Encouraging SHGs and MFIs for Livelihood Promotion:Measures to encourage growth of micro finance and SHGs in poor States and in the backward areas
9. Creation of a National Fund (NAFUS):Rs 5000 crore initial corpus for an exclusive statutory agency to take care of requirements of micro and small enterprisesin agriculture and non-agriculture sectors that are presently not reached by SIDBI and NABARD.
10. Up-scaling Cluster Development through Growth Poles:Twenty-five growth poles in the traditional industries clusters with incentives at par with SEZs
D. Measures to Expand Employment and Improve Employability11. Expand Employment through Strengthening Self-employment Programmes:
Rationalization and strengthening of the four major self-employment generation programmes with 5 million annualemployment generation target.
12. Universalize and Strengthen National Rural Employment Guarantee Act (NREGA):Extension of NREGA Programmes to all districts.
13. Increase Employability through Skill Development:On-job-training cum employment-assurance programme to provide incentive of Rs 5000 per person to any employerwilling to provide one-year training on job skill enhancement.
82 Eleventh Five Year Plan
(million)
Status Estimated Projected
1993–94 1999–2000 2004–05 2006–07 2011–12 2016–17
Population
Age 0+ 893.68 1005.05 1092.83 1128.31 1207.97 1283.24
Age 15–59 501.76 572.23 652.94 687.12 760.11 820.57
Labour Force
UPSS
Age 0+ 378.65 408.35 471.25 492.66 541.84 586.44
Age 15–59 337.71 369.22 431.95 451.70 496.65 535.20
CDS
Age 0+ 334.20 364.88 419.65 438.95 483.66 524.06
Age 15–59 298.95 330.78 385.87 403.75 444.72 479.70
Employment
UPSS
Age 0+ 371.12 398.93 459.72
Age 15–59 330.34 360.04 420.74
CDS
Age 0+ 313.93 338.19 384.91 402.24 460.31 518.20
Age 15–59 279.88 305.70 352.92
Unemployed
UPSS
Age 0+ 7.53 9.41 11.53
Age 15–59 7.37 9.17 11.21
CDS
Age 0+ 20.27 26.69 34.74 36.71 23.35 5.86
Age 15–59 19.07 25.08 32.95
Unemployment rate (%)
UPSS
Age 0+ 1.99 2.30 2.45
Age 15–59 2.18 2.48 2.60
CDS
Age 0+ 6.06 7.31 8.28 8.36 4.83 1.12
Age 15–59 6.38 7.58 8.54
ANNEXURE 4.1Population, Labour Force, Employment, and Unemployment (1993–94 to 2016–17)
Employment Perspective and Labour Policy 83
(%)
Industry 1983 to 1993–94 1993–94 to 2004–05 2006–07 to 2016–17
1. Agriculture 1.03 2.24 4.57
2. Minining and Quarrying 1.66 4.95 5.64
3. Manufacturing 2.29 3.31 7.27
4. Electricity, gas and water supply 3.70 5.46 7.51
5. Construction –1.43 1.45 5.56
6. Trade, hotels and restaurants 1.06 2.69 5.68
7. Transport, storage and communication 2.06 4.94 9.77
8. Finance, insurance, real estate and business services 2.79 –0.40 4.26
9. Community, social and personal services 1.57 5.90 6.11
Note: Derived from NSS reports on employment and unemployment situation in India.
ANNEXURE 4.3(C)Percentage Distribution of Employed Persons by Category of Employment (CDS)—All India
(per 1000) (UPSS basis)
Condition of Employment Rural Urban All
No written job contract 592 592 592
Not eligible for Paid Leave 480 455 464
Neither written job contract nor eligible for paid leave 712 549 630
Not eligible for Social Security Benefit1 569 535 547
Paid a Monthly Salary 857 900 884
Non-existence of Union/Associations 513 541 531
Sample Workers 17033 26385 43418
Source: Derived from NSS 61st round (2004–05).1Coverage under any of the Schemes-Provident Fund, PPF with employer contribution, Gratuity, Health care and Maternity benefits.
ANNEXURE 4.4Conditions of Employment of Regular Wage/Salaried Workers—2004–05
Type of Enterprise Distribution of Workers
Proprietory 378
Partnership 45
Employer household 49
Subtotal 472
Govt./Public sector 333
Public/Pvt.Ltd. Co. 127
Society/Trust 38
Subtotal 498
Others 18
N.R. 12
All 1000
Sample persons 43418
Source: Table 1, Appendix A, of NSS Report of 61st Round, No. 519.
ANNEXURE 4.5Distribution of Regular Wage/Salaried Workers by Type of Enterprise
Employment Perspective and Labour Policy 85
(% per annum)
Rural Male Rural Female
Category 1983 1993–94 1993–94 1999–2000 1983 1993–94 1993–94 1999–2000to to to to to to to to