Issued August 2003 Census 2000 found that 63.9 percent of the 217.2 million people aged 16 and over in the United States were in the labor force. 1 Of the 138.8 mil- lion people in the labor force, 129.7 million were employed, 7.9 million were unemployed, and 1.2 million were in the Armed Forces. The civil- ian unemployment rate was 5.8 percent. 2 Note that, in general, the estimates in this report will differ from the official labor force data collected in the Current Population Survey and released by the Bureau of Labor Statistics. For further information on these differences, see the text box on page 3. U S C E N S U S B U R E A U Helping You Make Informed Decisions U.S. Department of Commerce Economics and Statistics Administration U.S. CENSUS BUREAU C2KBR-18 Employment Status: 2000 Census 2000 Brief By Sandra Luckett Clark and Mai Weismantle LAST WEEK, did this person do ANY work for either pay or profit? Mark the "Yes" box even if the person worked only 1 hour, or helped without pay in a family business or farm for 15 hours or more, or was on active duty in the Armed Forces. Yes No Skip to 25a x Figure 1. Reproduction of the Questions on Employment Status From Census 2000 Source: U.S. Census Bureau, Census 2000 questionnaire. Yes Skip to 25c No a. LAST WEEK, was this person on layoff from a job? Yes, on vacation, temporary illness, labor dispute, etc. Skip to 26 No Skip to 25d b. LAST WEEK, was this person TEMPORARILY absent from a job or business? Yes Skip to 25e No c. Has this person been informed that he or she will be recalled to work within the next 6 months OR been given a date to return to work? Yes No Skip to 26 d. Has this person been looking for work during the last 4 weeks? Yes, could have gone to work e. LAST WEEK, could this person have started a job if offered one, or returned to work if recalled? No, because of own temporary illness No, because of all other reasons (in school, etc.) 21 25 1 The labor force includes all people classified in the civilian labor force (employed or unem- ployed) plus members of the U.S. Armed Forces. Employed people include civilians 16 and over who were either “at work” or were “with a job but not at work.” Unemployed civilians are those who did not have a job during the reference period, were active- ly looking for work, or waiting to be called back to a job from which they had been laid off, and were available to go to work. 2 This rate is defined as the number of unemployed people divided by the sum of employed plus unemployed people.
Transcript
Issued August 2003
Census 2000 found that63.9 percent of the 217.2 million people aged16 and over in the UnitedStates were in the laborforce.1 Of the 138.8 mil-lion people in the laborforce, 129.7 million wereemployed, 7.9 millionwere unemployed, and1.2 million were in theArmed Forces. The civil-ian unemployment ratewas 5.8 percent.2
Note that, in general,the estimates in thisreport will differ fromthe official labor forcedata collected in theCurrent PopulationSurvey and released bythe Bureau of LaborStatistics. For furtherinformation on thesedifferences, see the textbox on page 3.
U S C E N S U S B U R E A UHelping You Make Informed Decisions
U.S.Department of CommerceEconomics and Statistics Administration
U.S. CENSUS BUREAU
C2KBR-18
Employment Status: 2000Census 2000 Brief
By Sandra Luckett ClarkandMai Weismantle
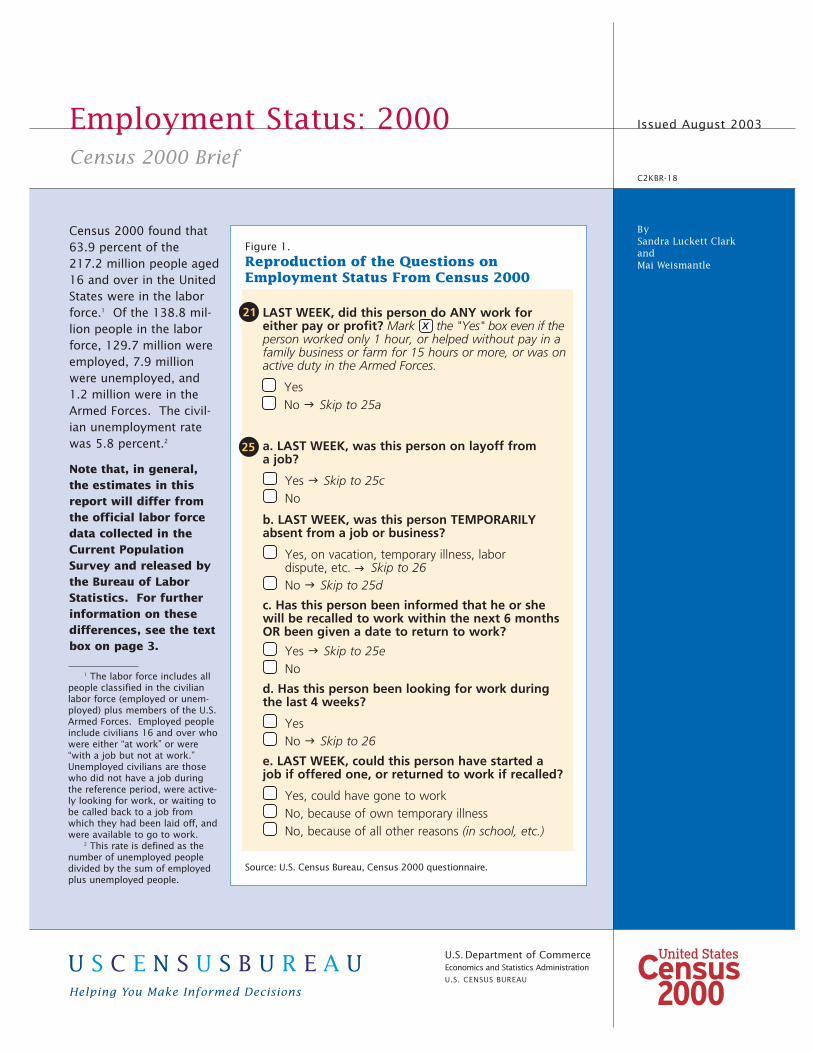
LAST WEEK, did this person do ANY work foreither pay or profit? Mark the "Yes" box even if theperson worked only 1 hour, or helped without pay in afamily business or farm for 15 hours or more, or was onactive duty in the Armed Forces.
YesNo Skip to 25a
x
Figure 1.
Reproduction of the Questions on Employment Status From Census 2000
Source: U.S. Census Bureau, Census 2000 questionnaire.
Yes Skip to 25cNo
a. LAST WEEK, was this person on layoff froma job?
Yes, on vacation, temporary illness, labordispute, etc. Skip to 26No Skip to 25d
b. LAST WEEK, was this person TEMPORARILYabsent from a job or business?
Yes Skip to 25eNo
c. Has this person been informed that he or shewill be recalled to work within the next 6 monthsOR been given a date to return to work?
YesNo Skip to 26
d. Has this person been looking for work duringthe last 4 weeks?
Yes, could have gone to work
e. LAST WEEK, could this person have started ajob if offered one, or returned to work if recalled?
No, because of own temporary illnessNo, because of all other reasons (in school, etc.)
21
25
1 The labor force includes allpeople classified in the civilianlabor force (employed or unem-ployed) plus members of the U.S.Armed Forces. Employed peopleinclude civilians 16 and over whowere either “at work” or were“with a job but not at work.”Unemployed civilians are thosewho did not have a job duringthe reference period, were active-ly looking for work, or waiting tobe called back to a job fromwhich they had been laid off, andwere available to go to work.
2 This rate is defined as thenumber of unemployed peopledivided by the sum of employedplus unemployed people.
2 U.S. Census Bureau
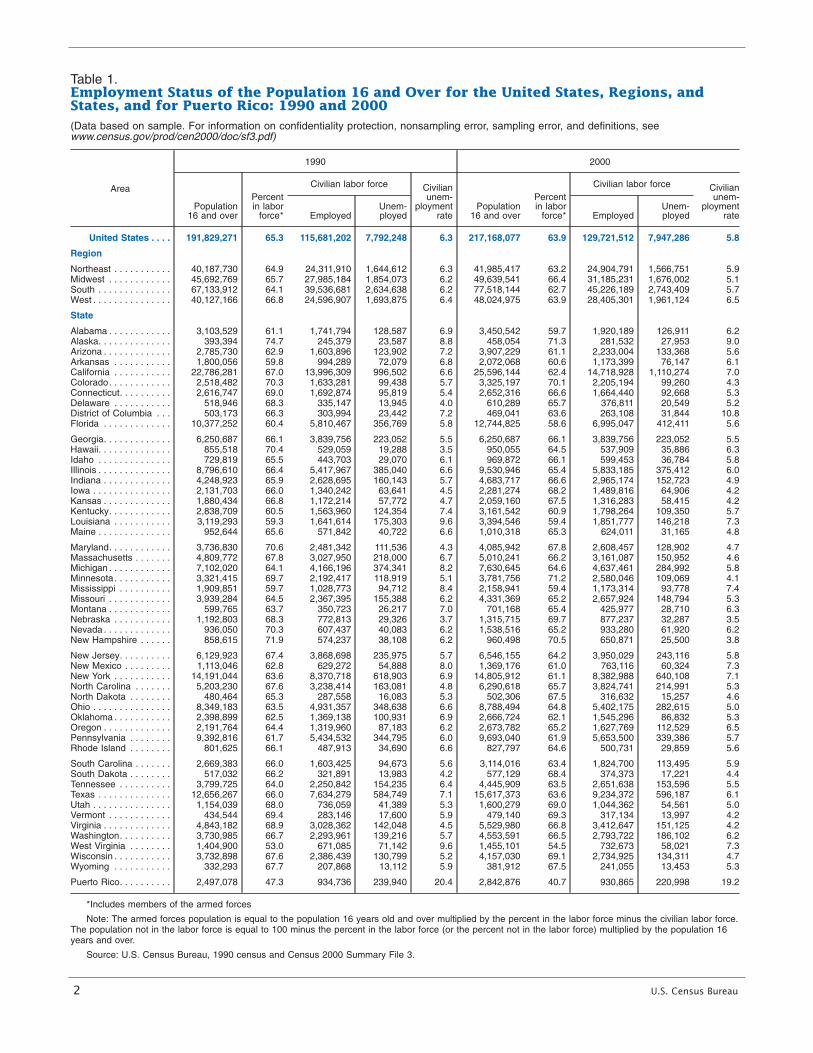
Table 1.Employment Status of the Population 16 and Over for the United States, Regions, andStates, and for Puerto Rico: 1990 and 2000(Data based on sample. For information on confidentiality protection, nonsampling error, sampling error, and definitions, seewww.census.gov/prod/cen2000/doc/sf3.pdf)
Area
1990 2000
Population16 and over
Percentin labor
force*
Civilian labor force Civilianunem-
ploymentrate
Population16 and over
Percentin labor
force*
Civilian labor force Civilianunem-
ploymentrateEmployed
Unem-ployed Employed
Unem-ployed
United States . . . . 191,829,271 65.3 115,681,202 7,792,248 6.3 217,168,077 63.9 129,721,512 7,947,286 5.8
Note: The armed forces population is equal to the population 16 years old and over multiplied by the percent in the labor force minus the civilian labor force.The population not in the labor force is equal to 100 minus the percent in the labor force (or the percent not in the labor force) multiplied by the population 16years and over.
Source: U.S. Census Bureau, 1990 census and Census 2000 Summary File 3.
Decennial censuses have includedquestions on employment statussince 1930. Census 2000 collect-ed information on employment sta-tus from people aged 15 and over;however, all published tabulationsof employment-status data arerestricted to the population aged16 and over. Questions 21 and 25on the Census 2000 forms askedpeople about their connection tothe paid workforce in the weekbefore they filled out the question-naire (see Figure 1). Answers tothese questions were used tomeasure labor force participation,the unemployment rate, and otherindicators of the economic activityof the population.3
The battery of Census 2000 ques-tions that collected employmentstatus information differed slightly
from the 1990 census questions.The new questions were developedin cooperation with the Bureau ofLabor Statistics (BLS) of the Depart-ment of Labor. Highlights of thechanges include the addition of thewords “for either pay or profit” tothe “work last week” item (ques-tion 21); the removal of the 1990question “How many hours did youwork last week?”; the division andexpansion of the “temporaryabsence from a job or layoff” iteminto three separate questions (25a,25b, and 25c); and the revision ofthe definition of “available” in the“availability to work” item (ques-tion 25e) from being able to “takea job” to being able to “start a jobif offered one, or return to work if recalled.”
This report is part of a series thatpresents population and housingdata collected by Census 2000.The report provides data on theemployment status of people 16
and over and how employmentstatus varies among regions,states, counties, and places withpopulations of 100,000 or more.4
The U.S. labor force increased over the decade.
Between 1990 and 2000, the num-ber of people in the U.S. laborforce increased by 13.5 million, or10.8 percent (see Table 1).5 Thepopulation 16 and over increasedby 25.3 million (13.2 percent),while the population not in thelabor force grew 17.8 percent.
U.S. Census Bureau 3
3 While both questions are used to deter-mine a person’s employment status, they arenot discussed individually within this report.
4 The text of this report discusses datafor the United States, including the 50 statesand the District of Columbia. Data for theCommonwealth of Puerto Rico are shown inTable 1 and Figure 3.
5 The estimates in this report are basedon responses from a sample of the popula-tion. As with all surveys, estimates mayvary from the actual values because of sam-pling variation or other factors. All state-ments made in this report have undergonestatistical testing and are significant at the90-percent confidence level, unless other-wise noted.
Employment and unemployment estimates fromCensus 2000 will, in general, differ from the officiallabor force data collected in the Current PopulationSurvey (CPS) and released by the Bureau of LaborStatistics, because the design and collection method-ology of the census and the CPS meet different purposes.
Census 2000 was designed to collect general infor-mation about the labor force for very small geo-graphic areas on a one-time basis. It was primarily amail-out/mail-back data collection that asked fewerand less precise questions than the CPS on employ-ment and unemployment.
The CPS is specifically designed to produce the offi-cial estimates of employment and unemployment forthe United States each month. Data collection con-sists of personal interviews of respondents by fieldrepresentatives who ask numerous detailed ques-tions on labor force participation. For example, the
CPS asks a more detailed and extensive series ofquestions about whether a person is "actively look-ing for work" than can be asked in the census.
Specifically, at the national level, Census 2000 esti-mates of employment were considerably below, andestimates of unemployment above, the correspondingCPS estimates. Subnational estimates from the twosources may exhibit even wider relative differences.
A known problem in Census 2000 increased thenumber of unemployed people for some places withrelatively large numbers of people living in civiliannoninstitutional group quarters, such as college dor-mitories, worker dormitories, and group homes, andmay have affected comparisons of labor force datafor higher levels of geography. For more informationon this specific problem, see Data Note 4 in Chapter9 of the technical documentation for Census 2000Summary File 3 at www.census.gov/prod/cen2000/doc/sf3.pdf.
Differences between Census 2000 and Current Population Survey (official) estimates of the labor force
Labor force participation bywomen increased between1990 and 2000, but at a slowerpace than in previous decades.
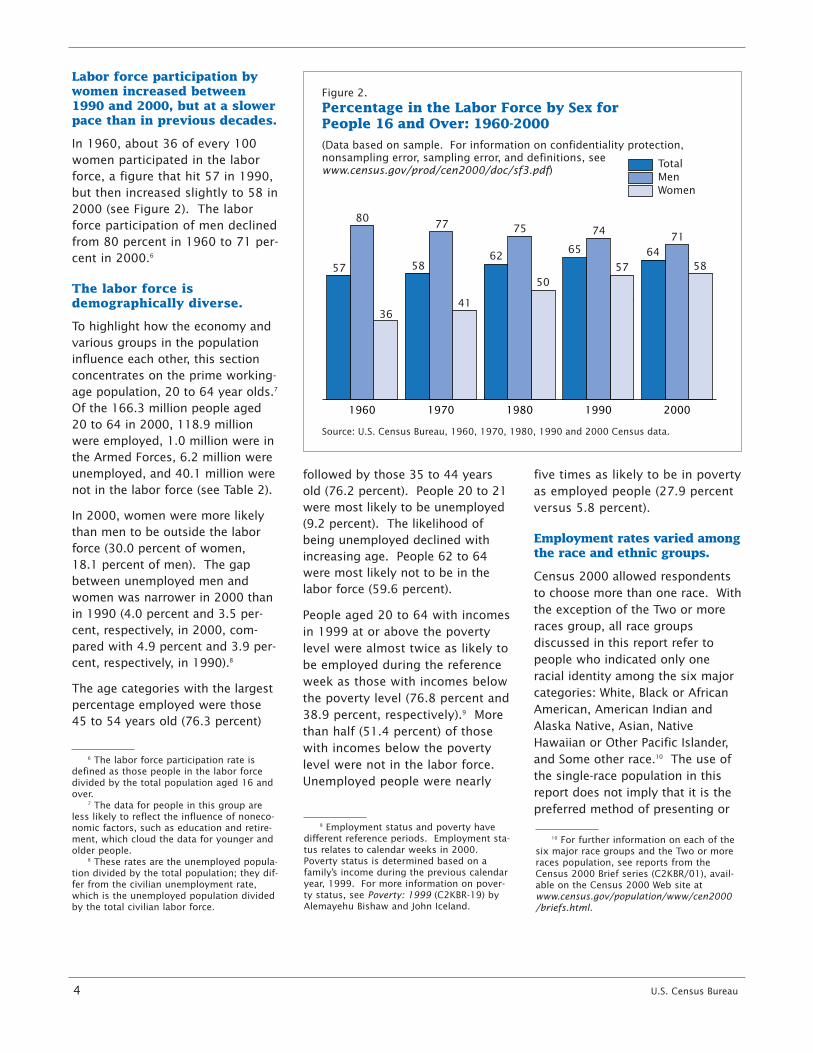
In 1960, about 36 of every 100women participated in the laborforce, a figure that hit 57 in 1990,but then increased slightly to 58 in2000 (see Figure 2). The laborforce participation of men declinedfrom 80 percent in 1960 to 71 per-cent in 2000.6
The labor force isdemographically diverse.
To highlight how the economy andvarious groups in the populationinfluence each other, this sectionconcentrates on the prime working-age population, 20 to 64 year olds.7
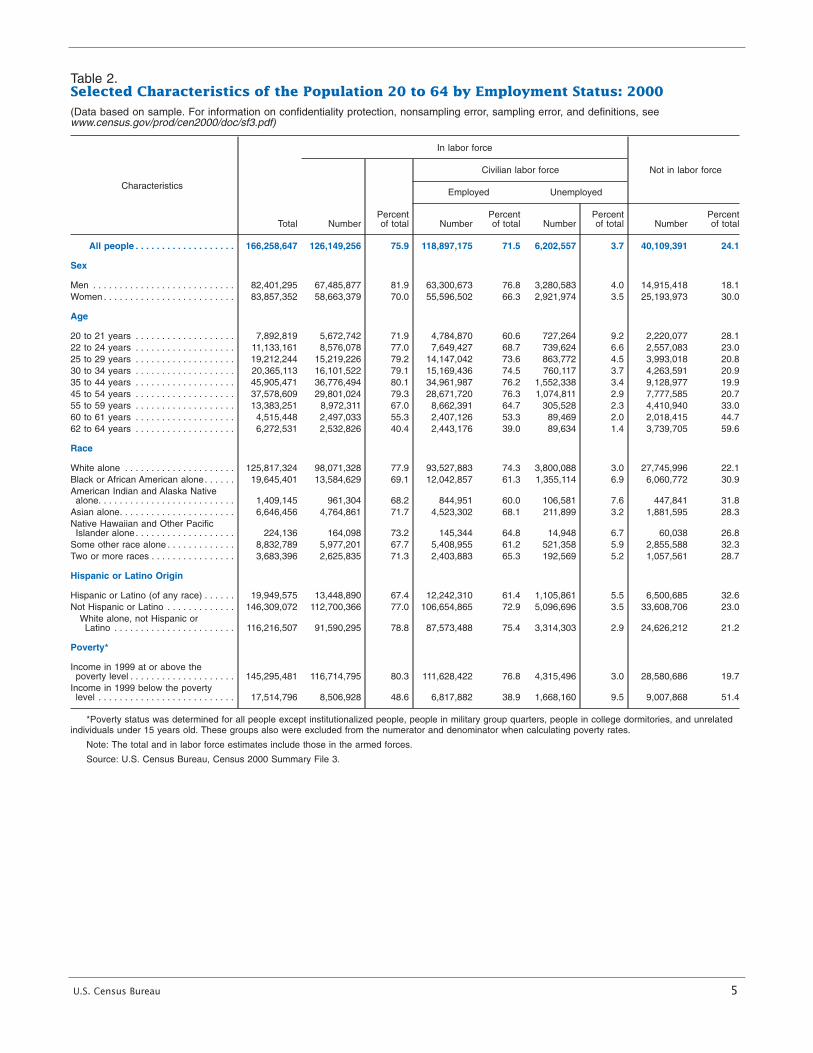
Of the 166.3 million people aged20 to 64 in 2000, 118.9 millionwere employed, 1.0 million were inthe Armed Forces, 6.2 million wereunemployed, and 40.1 million werenot in the labor force (see Table 2).
In 2000, women were more likelythan men to be outside the laborforce (30.0 percent of women, 18.1 percent of men). The gapbetween unemployed men andwomen was narrower in 2000 thanin 1990 (4.0 percent and 3.5 per-cent, respectively, in 2000, com-pared with 4.9 percent and 3.9 per-cent, respectively, in 1990).8
The age categories with the largestpercentage employed were those45 to 54 years old (76.3 percent)
followed by those 35 to 44 yearsold (76.2 percent). People 20 to 21were most likely to be unemployed(9.2 percent). The likelihood ofbeing unemployed declined withincreasing age. People 62 to 64were most likely not to be in thelabor force (59.6 percent).
People aged 20 to 64 with incomesin 1999 at or above the povertylevel were almost twice as likely tobe employed during the referenceweek as those with incomes belowthe poverty level (76.8 percent and38.9 percent, respectively).9 Morethan half (51.4 percent) of thosewith incomes below the povertylevel were not in the labor force.Unemployed people were nearly
five times as likely to be in povertyas employed people (27.9 percentversus 5.8 percent).
Employment rates varied amongthe race and ethnic groups.
Census 2000 allowed respondentsto choose more than one race. Withthe exception of the Two or moreraces group, all race groupsdiscussed in this report refer topeople who indicated only oneracial identity among the six majorcategories: White, Black or AfricanAmerican, American Indian andAlaska Native, Asian, NativeHawaiian or Other Pacific Islander,and Some other race.10 The use ofthe single-race population in thisreport does not imply that it is thepreferred method of presenting or
4 U.S. Census Bureau
6 The labor force participation rate isdefined as those people in the labor forcedivided by the total population aged 16 andover.
7 The data for people in this group areless likely to reflect the influence of noneco-nomic factors, such as education and retire-ment, which cloud the data for younger andolder people.
8 These rates are the unemployed popula-tion divided by the total population; they dif-fer from the civilian unemployment rate,which is the unemployed population dividedby the total civilian labor force.
9 Employment status and poverty havedifferent reference periods. Employment sta-tus relates to calendar weeks in 2000.Poverty status is determined based on afamily’s income during the previous calendaryear, 1999. For more information on pover-ty status, see Poverty: 1999 (C2KBR-19) byAlemayehu Bishaw and John Iceland.
10 For further information on each of thesix major race groups and the Two or moreraces population, see reports from theCensus 2000 Brief series (C2KBR/01), avail-able on the Census 2000 Web site atwww.census.gov/population/www/cen2000/briefs.html.
Figure 2.
Percentage in the Labor Force by Sex for People 16 and Over: 1960-2000
Source: U.S. Census Bureau, 1960, 1970, 1980, 1990 and 2000 Census data.
50.5
(Data based on sample. For information on confidentiality protection, nonsampling error, sampling error, and definitions, see www.census.gov/prod/cen2000/doc/sf3.pdf)
20001990198019701960
TotalMenWomen
5857
80
36
58
77
41
62
75
50
65
74
5764
71
U.S. Census Bureau 5
Table 2.Selected Characteristics of the Population 20 to 64 by Employment Status: 2000(Data based on sample. For information on confidentiality protection, nonsampling error, sampling error, and definitions, seewww.census.gov/prod/cen2000/doc/sf3.pdf)
*Poverty status was determined for all people except institutionalized people, people in military group quarters, people in college dormitories, and unrelatedindividuals under 15 years old. These groups also were excluded from the numerator and denominator when calculating poverty rates.
Note: The total and in labor force estimates include those in the armed forces.
Source: U.S. Census Bureau, Census 2000 Summary File 3.
6U
.S. Cen
sus Bu
reau
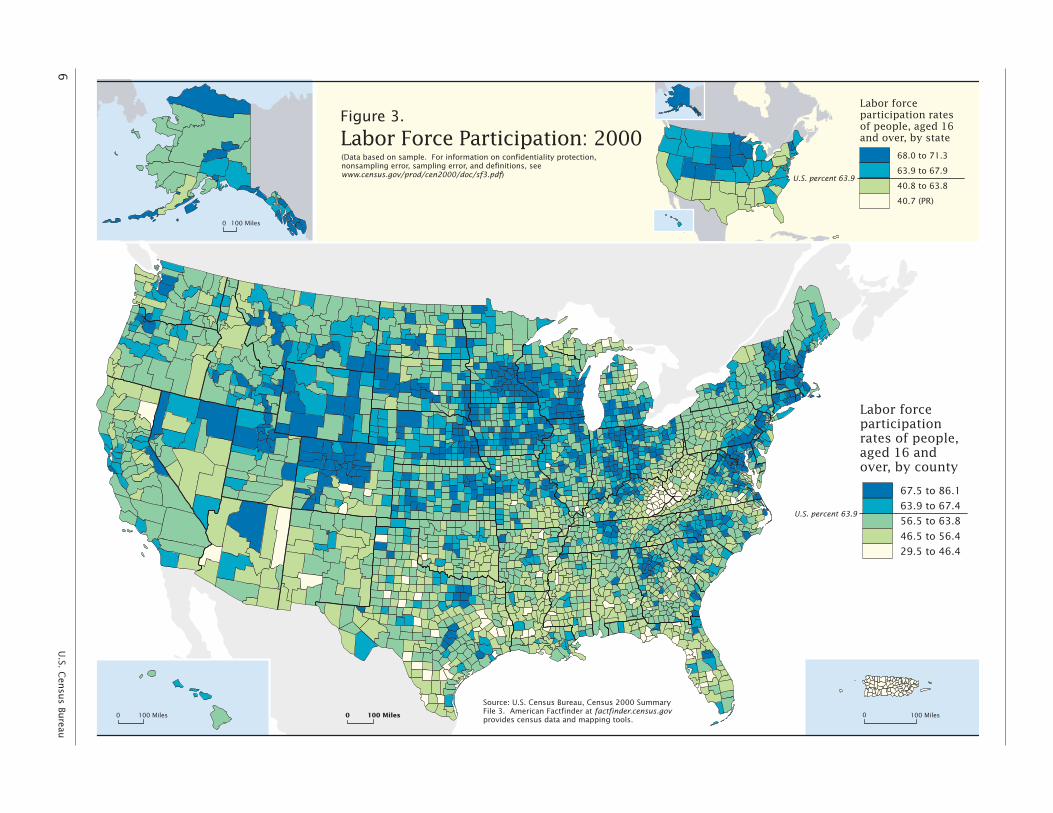
68.0 to 71.3
63.9 to 67.9
40.8 to 63.8
40.7 (PR)
Labor Force Participation: 2000
Source: U.S. Census Bureau, Census 2000 SummaryFile 3. American Factfinder at factfinder.census.govprovides census data and mapping tools.
Labor forceparticipation ratesof people, aged 16 and over, by state
67.5 to 86.1
63.9 to 67.4
56.5 to 63.8
46.5 to 56.4
29.5 to 46.4
U.S. percent 63.9
U.S. percent 63.9
(Data based on sample. For information on confidentiality protection, nonsampling error, sampling error, and definitions, see www.census.gov/prod/cen2000/doc/sf3.pdf)
Figure 3.
0 100 Miles0 100 Miles0 100 Miles
0 100 Miles
Labor forceparticipationrates of people,aged 16 andover, by county
analyzing data. The Census Bureauuses a variety of approaches.11
Among the race and Hispanic orLatino origin categories in Table 2,non-Hispanic Whites (single race)were most likely to be employed(75.4 percent) and least likely to beunemployed (2.9 percent). Of theAsian population who reported onlyone race, 68.1 percent wereemployed and 3.2 percent wereunemployed. The percent of peopleunemployed was highest for thosein the American Indian and AlaskaNative category, 7.6 percent.
The percentage of people ofHispanic or Latino origin between20 and 64 years who wereemployed, 61.4 percent, wasconsiderably below the correspon-ding 72.9 percent for those whowere not Hispanic.12 Non-HispanicWhites accounted for 79.4 percentof the non-Hispanic population inthis age group. The 5.5 percent ofHispanics who were unemployedwas nearly double the 2.9 percentof non-Hispanic Whites who wereunemployed.
GEOGRAPHICDISTRIBUTION OF LABORFORCE PARTICIPATION
More than one-third of the laborforce lived in the South.13
Census 2000 data showed that 35.0 percent of the nation’s laborforce lived in the South, and 23.8 percent lived in the Midwest,percentages that closely follow thedistribution of the population aged16 and over (see Table 1). Thelabor force participation rate washighest in the Midwest, at 66.4 percent. The region with thelowest labor force participation wasthe South, at 62.7 percent. Theonly region where the labor forceparticipation rate increased from1990 to 2000 was the Midwest(65.7 percent to 66.4 percent).
Alaska and Minnesota led the states in labor forceparticipation.
Labor force participation rateswere highest in Alaska andMinnesota, at 71.3 percent and71.2 percent, respectively (seeTable 1).14 The state map locatedat the top of Figure 3 also shows acluster of states in the Midwestwith high labor force participationrates. The state with the lowestrate was West Virginia, 54.5 per-cent, followed by Florida, at
58.6 percent. Labor force partici-pation was also low in many othersouthern states.
The state with the highest civilianunemployment rate was Alaska(9.0 percent), but the District ofColumbia’s rate was even higher(10.8 percent). Nebraska’s unem-ployment rate was the lowestamong the states (3.5 percent).
From 1990 to 2000, Iowa was theonly state with an increase in itslabor force participation rate thatwas greater than 2 percentagepoints (see Table 1).15 Hawaii wasthe only state who’s rate decreasedmore than 5 percentage pointsfrom 1990 to 2000.16 Texas expe-rienced the largest state-levelincrease in the number ofemployed people from 1990 to2000 (1.6 million).
Labor force participation rateswere high in some counties in the Northeast and upperMidwest and low in parts of Appalachia.
Counties in the upper interiorMidwest from Chicago toMinneapolis-St. Paul displayed highlabor force participation rates, asdid a band of counties stretchingfrom southern Maine to northernVirginia (see Figure 3). Labor forceparticipation rates were also highin several metropolitan areas in theSouth, such as Atlanta, Nashville,Dallas-Fort Worth, and Austin. InCensus 2000, low labor forceparticipation was found in manyAppalachian counties and in scat-tered nonmetropolitan countiesthroughout the South.
U.S. Census Bureau 7
11 This report draws heavily on SummaryFile 3, a Census 2000 product that can beaccessed through American FactFinder, avail-able from the Census Bureau’s Web site,www.census.gov. Information on people whoreported more than one race, such as “Whiteand American Indian and Alaska Native” or“Asian and Black or African American,” isforthcoming in Summary File 4, which willalso be available through AmericanFactFinder in 2003. About 2.6 percent ofpeople reported more than one race.
12 Because Hispanics may be of any race,data in this report for Hispanics overlap withdata for racial groups. Based on Census 2000sample data, the proportion Hispanic was 8.0 percent for the White alone population,1.9 percent for the Black alone population,14.6 percent for the American Indian andAlaska Native alone population, 1.0 percentfor the Asian alone population, 9.5 percent forthe Native Hawaiian and Other Pacific Islanderalone population, 97.1 percent for the Someother race alone population, and 31.1 percentfor the Two or more races population.
13 The Northeast region includes the statesof Connecticut, Maine, Massachusetts, NewHampshire, New Jersey, New York,Pennsylvania, Rhode Island, and Vermont. TheMidwest region includes the states of Illinois,Indiana, Iowa, Kansas, Michigan, Minnesota,Missouri, Nebraska, North Dakota, Ohio,South Dakota, and Wisconsin. The Southregion includes the states of Alabama,Arkansas, Delaware, Florida, Georgia,Kentucky, Louisiana, Maryland, Mississippi,North Carolina, Oklahoma, South Carolina,Tennessee, Texas, Virginia, West Virginia, andthe District of Columbia, a state equivalent.The West region includes the states of Alaska,Arizona, California, Colorado, Hawaii, Idaho,Montana, Nevada, New Mexico, Oregon, Utah,Washington, and Wyoming.
14 These rates are not statistically differ-ent from each other.
15 South Dakota and North Dakota alsohad labor force participation rates greaterthan two percentage points, however theywere not statistically greater than two per-centage points.
16 Nevada’s labor force rate alsodecreased more than five percentage points,however the decrease was not statisticallymore than five percentage points.
8 U.S. Census Bureau
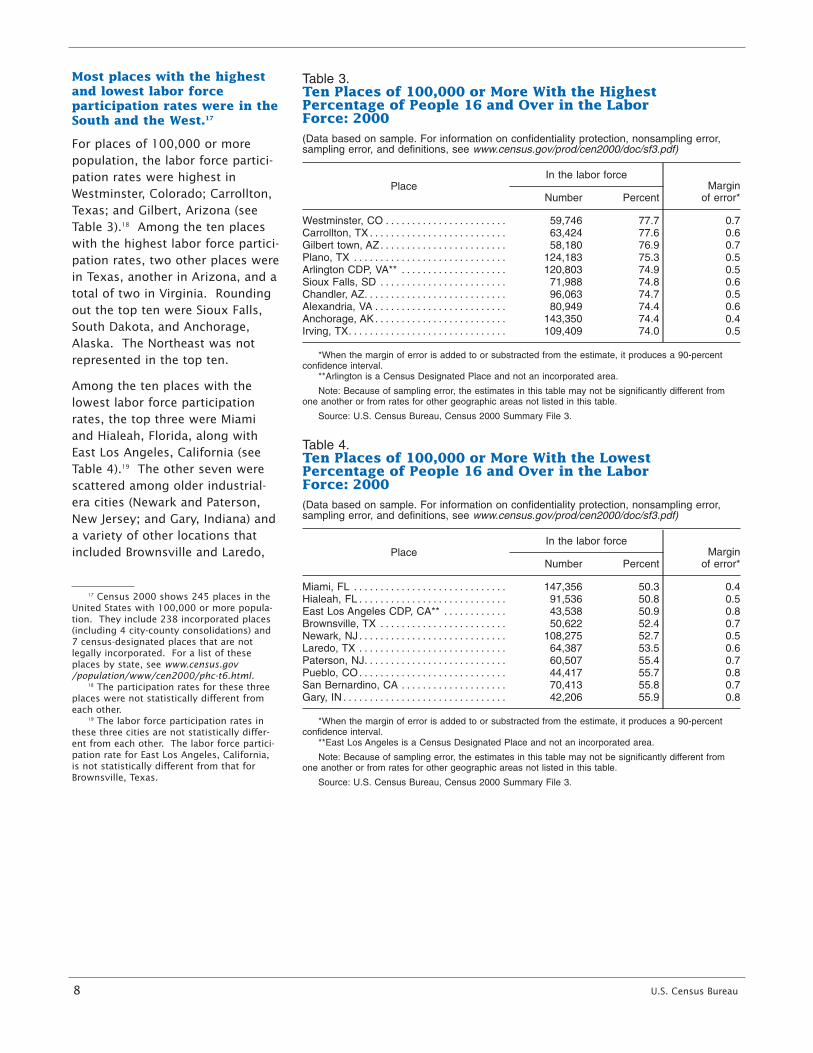
Most places with the highestand lowest labor forceparticipation rates were in theSouth and the West.17
For places of 100,000 or morepopulation, the labor force partici-pation rates were highest inWestminster, Colorado; Carrollton,Texas; and Gilbert, Arizona (seeTable 3).18 Among the ten placeswith the highest labor force partici-pation rates, two other places werein Texas, another in Arizona, and atotal of two in Virginia. Roundingout the top ten were Sioux Falls,South Dakota, and Anchorage,Alaska. The Northeast was notrepresented in the top ten.
Among the ten places with thelowest labor force participationrates, the top three were Miamiand Hialeah, Florida, along withEast Los Angeles, California (seeTable 4).19 The other seven werescattered among older industrial-era cities (Newark and Paterson,New Jersey; and Gary, Indiana) anda variety of other locations thatincluded Brownsville and Laredo,
Table 3.Ten Places of 100,000 or More With the HighestPercentage of People 16 and Over in the LaborForce: 2000(Data based on sample. For information on confidentiality protection, nonsampling error,sampling error, and definitions, see www.census.gov/prod/cen2000/doc/sf3.pdf)
*When the margin of error is added to or substracted from the estimate, it produces a 90-percentconfidence interval.
**Arlington is a Census Designated Place and not an incorporated area.
Note: Because of sampling error, the estimates in this table may not be significantly different fromone another or from rates for other geographic areas not listed in this table.
Source: U.S. Census Bureau, Census 2000 Summary File 3.
Table 4.Ten Places of 100,000 or More With the LowestPercentage of People 16 and Over in the LaborForce: 2000(Data based on sample. For information on confidentiality protection, nonsampling error,sampling error, and definitions, see www.census.gov/prod/cen2000/doc/sf3.pdf)
*When the margin of error is added to or substracted from the estimate, it produces a 90-percentconfidence interval.
**East Los Angeles is a Census Designated Place and not an incorporated area.
Note: Because of sampling error, the estimates in this table may not be significantly different fromone another or from rates for other geographic areas not listed in this table.
Source: U.S. Census Bureau, Census 2000 Summary File 3.
17 Census 2000 shows 245 places in theUnited States with 100,000 or more popula-tion. They include 238 incorporated places(including 4 city-county consolidations) and7 census-designated places that are notlegally incorporated. For a list of theseplaces by state, see www.census.gov/population/www/cen2000/phc-t6.html.
18 The participation rates for these threeplaces were not statistically different fromeach other.
19 The labor force participation rates inthese three cities are not statistically differ-ent from each other. The labor force partici-pation rate for East Los Angeles, California,is not statistically different from that forBrownsville, Texas.
U.S. Census Bureau 9
Texas; Pueblo, Colorado; and SanBernardino, California. Texas hadtwo places among the bottom ten,giving it the distinction, with
Colorado, of making both the top-ten and bottom-ten lists. Atleast one place from every regionwas in the bottom ten.
ADDITIONAL FINDINGS
Where are people on activeduty in the U.S. Armed Forcesconcentrated?20
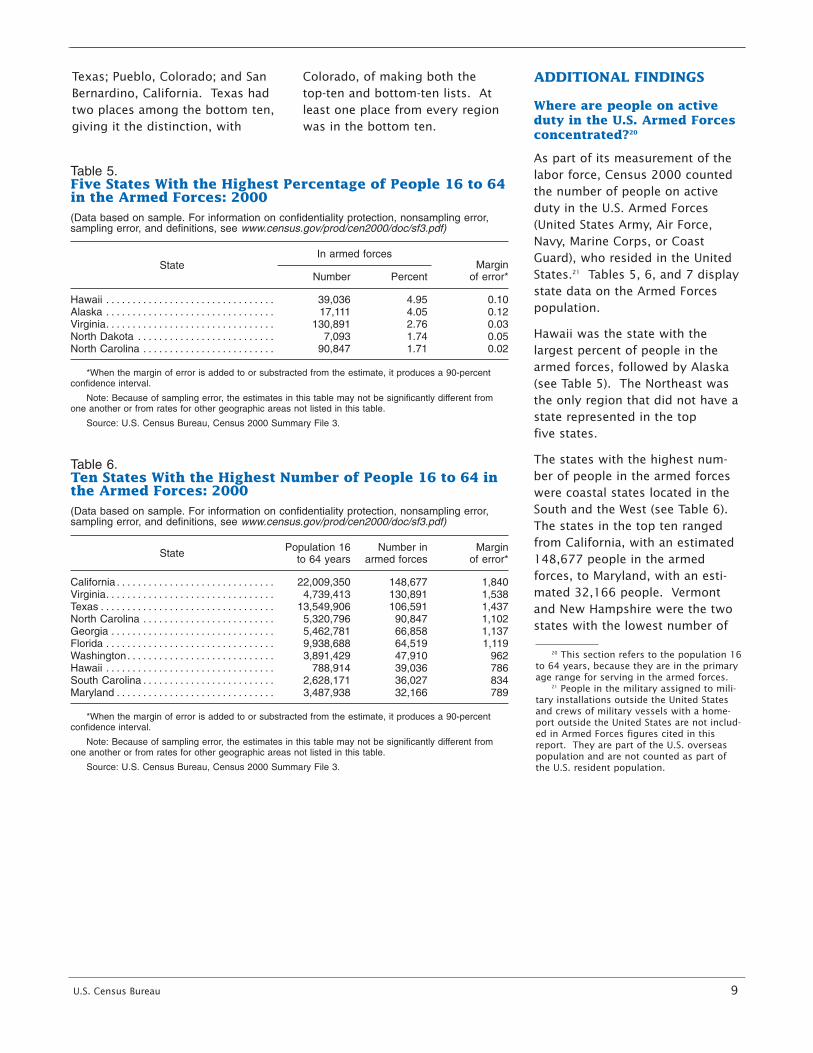
As part of its measurement of thelabor force, Census 2000 countedthe number of people on activeduty in the U.S. Armed Forces(United States Army, Air Force,Navy, Marine Corps, or CoastGuard), who resided in the UnitedStates.21 Tables 5, 6, and 7 displaystate data on the Armed Forcespopulation.
Hawaii was the state with thelargest percent of people in thearmed forces, followed by Alaska(see Table 5). The Northeast wasthe only region that did not have astate represented in the top five states.
The states with the highest num-ber of people in the armed forceswere coastal states located in theSouth and the West (see Table 6).The states in the top ten rangedfrom California, with an estimated148,677 people in the armedforces, to Maryland, with an esti-mated 32,166 people. Vermontand New Hampshire were the twostates with the lowest number of
Table 5.Five States With the Highest Percentage of People 16 to 64in the Armed Forces: 2000(Data based on sample. For information on confidentiality protection, nonsampling error,sampling error, and definitions, see www.census.gov/prod/cen2000/doc/sf3.pdf)
*When the margin of error is added to or substracted from the estimate, it produces a 90-percentconfidence interval.
Note: Because of sampling error, the estimates in this table may not be significantly different fromone another or from rates for other geographic areas not listed in this table.
Source: U.S. Census Bureau, Census 2000 Summary File 3.
Table 6.Ten States With the Highest Number of People 16 to 64 inthe Armed Forces: 2000(Data based on sample. For information on confidentiality protection, nonsampling error,sampling error, and definitions, see www.census.gov/prod/cen2000/doc/sf3.pdf)
*When the margin of error is added to or substracted from the estimate, it produces a 90-percentconfidence interval.
Note: Because of sampling error, the estimates in this table may not be significantly different fromone another or from rates for other geographic areas not listed in this table.
Source: U.S. Census Bureau, Census 2000 Summary File 3.
20 This section refers to the population 16to 64 years, because they are in the primaryage range for serving in the armed forces.
21 People in the military assigned to mili-tary installations outside the United Statesand crews of military vessels with a home-port outside the United States are not includ-ed in Armed Forces figures cited in thisreport. They are part of the U.S. overseaspopulation and are not counted as part ofthe U.S. resident population.
10 U.S. Census Bureau
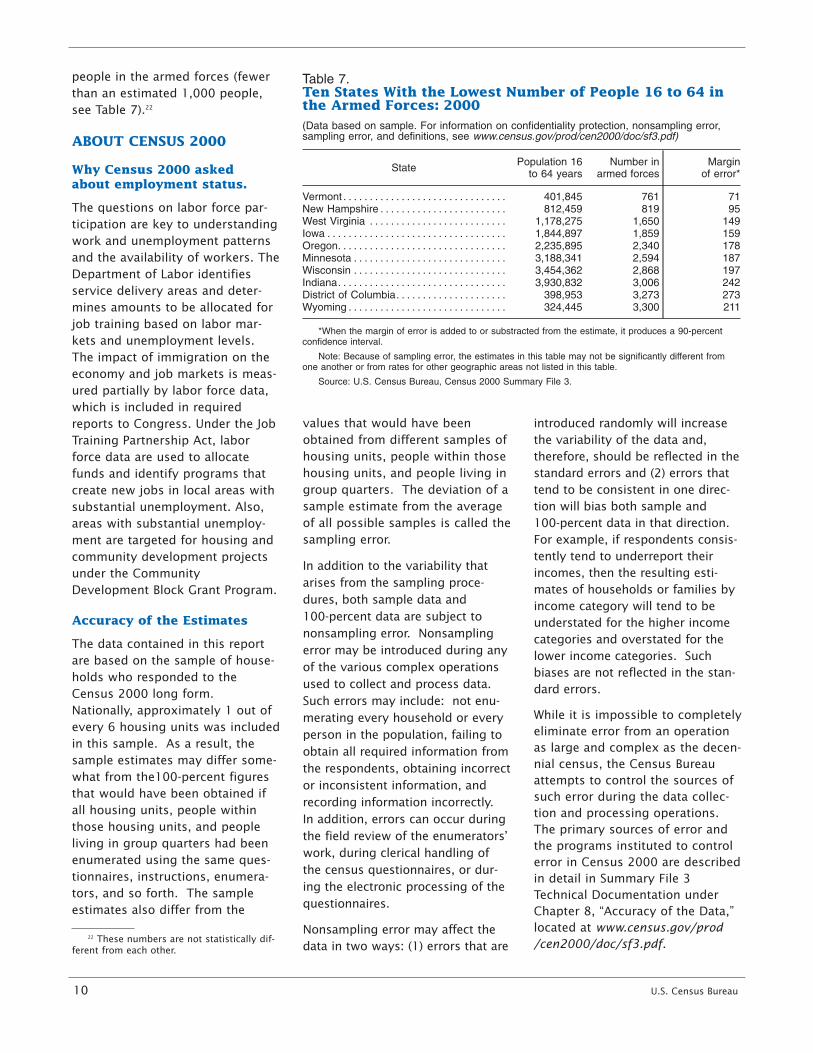
people in the armed forces (fewerthan an estimated 1,000 people,see Table 7).22
ABOUT CENSUS 2000
Why Census 2000 asked about employment status.
The questions on labor force par-ticipation are key to understandingwork and unemployment patternsand the availability of workers. TheDepartment of Labor identifiesservice delivery areas and deter-mines amounts to be allocated forjob training based on labor mar-kets and unemployment levels.The impact of immigration on theeconomy and job markets is meas-ured partially by labor force data,which is included in requiredreports to Congress. Under the JobTraining Partnership Act, laborforce data are used to allocatefunds and identify programs thatcreate new jobs in local areas withsubstantial unemployment. Also,areas with substantial unemploy-ment are targeted for housing andcommunity development projectsunder the CommunityDevelopment Block Grant Program.
Accuracy of the Estimates
The data contained in this reportare based on the sample of house-holds who responded to theCensus 2000 long form.Nationally, approximately 1 out ofevery 6 housing units was includedin this sample. As a result, thesample estimates may differ some-what from the100-percent figuresthat would have been obtained ifall housing units, people withinthose housing units, and peopleliving in group quarters had beenenumerated using the same ques-tionnaires, instructions, enumera-tors, and so forth. The sampleestimates also differ from the
values that would have beenobtained from different samples ofhousing units, people within thosehousing units, and people living ingroup quarters. The deviation of asample estimate from the averageof all possible samples is called thesampling error.
In addition to the variability thatarises from the sampling proce-dures, both sample data and 100-percent data are subject tononsampling error. Nonsamplingerror may be introduced during anyof the various complex operationsused to collect and process data.Such errors may include: not enu-merating every household or everyperson in the population, failing toobtain all required information fromthe respondents, obtaining incorrector inconsistent information, andrecording information incorrectly.In addition, errors can occur duringthe field review of the enumerators’work, during clerical handling ofthe census questionnaires, or dur-ing the electronic processing of thequestionnaires.
Nonsampling error may affect thedata in two ways: (1) errors that are
introduced randomly will increasethe variability of the data and,therefore, should be reflected in thestandard errors and (2) errors thattend to be consistent in one direc-tion will bias both sample and 100-percent data in that direction.For example, if respondents consis-tently tend to underreport theirincomes, then the resulting esti-mates of households or families byincome category will tend to beunderstated for the higher incomecategories and overstated for thelower income categories. Suchbiases are not reflected in the stan-dard errors.
While it is impossible to completelyeliminate error from an operationas large and complex as the decen-nial census, the Census Bureauattempts to control the sources ofsuch error during the data collec-tion and processing operations.The primary sources of error andthe programs instituted to controlerror in Census 2000 are describedin detail in Summary File 3Technical Documentation underChapter 8, “Accuracy of the Data,”located at www.census.gov/prod/cen2000/doc/sf3.pdf.
Table 7.Ten States With the Lowest Number of People 16 to 64 inthe Armed Forces: 2000(Data based on sample. For information on confidentiality protection, nonsampling error,sampling error, and definitions, see www.census.gov/prod/cen2000/doc/sf3.pdf)
*When the margin of error is added to or substracted from the estimate, it produces a 90-percentconfidence interval.
Note: Because of sampling error, the estimates in this table may not be significantly different fromone another or from rates for other geographic areas not listed in this table.
Source: U.S. Census Bureau, Census 2000 Summary File 3.
22 These numbers are not statistically dif-ferent from each other.
U.S. Census Bureau 11
All statements in this Census 2000brief have undergone statisticaltesting and all comparisons aresignificant at the 90-percent confi-dence level, unless otherwisenoted. The estimates in tables,maps, and other figures may varyfrom actual values due to samplingand nonsampling errors. As aresult, estimates in one categorymay not be significantly differentfrom estimates assigned to a dif-ferent category. Further informa-tion on the accuracy of the data islocated at www.census.gov/prod/cen2000/doc/sf3.pdf. For furtherinformation on the computationand use of standard errors, contactthe Decennial Statistical StudiesDivision at 301-763-4242.
For More Information
The Census 2000 Summary File 3data are available from theAmerican Factfinder on theInternet (factfinder.census.gov).They were released on a state-by-state basis during 2002. For infor-mation on confidentiality protec-tion, nonsampling error, samplingerror, and definitions, also seewww.census.gov/prod/cen2000/doc/sf3.pdf or contact theCustomer Services Center at 301-763-INFO (4636).
Information on population andhousing topics is presented in theCensus 2000 brief series, locatedon the Census Bureau’s Web site atwww.census.gov/population/www/cen2000/briefs.html. This series,
which will be completed in 2003,presents information on race,Hispanic origin, age, sex,household type, housing tenure,and social, economic, and housingcharacteristics, such as ancestry,income, and housing costs.
For additional information onemployment status, includingreports and survey data, visit theCensus Bureau’s Internet siteat www.census.gov/hhes/www/laborfor.html. To find informationabout the availability of data prod-ucts, including reports, CD-ROMs,and DVDs, call the CustomerServices Center at 301-763-INFO(4636), or e-mail [email protected].
U.S. Department of CommerceEconomics and Statistics AdministrationU.S. CENSUS BUREAU
Washington, DC 20233
OFFICIAL BUSINESS
Penalty for Private Use $300
FIRST-CLASS MAILPOSTAGE & FEES PAIDU.S. Census Bureau