12
Enabling Faster Business Decisions Democratization of Statistical and Predictive Analysis Point of View Author: Shreya Tiwa, Sanjivani Jadhav
Enabling FasterBusiness Decisions Democratization of Statistical and Predictive Analysis
Point of View
Author: Shreya Tiwa�, Sanjivani Jadhav
However, for a manager to make critical
decisions, it is beneficial to perform
predictive and statistical analysis,
benchmarking their performance. By
benchmarking, managers can create a
wealth of information for their organization
that can be critical while responding to
RFPs and managing contract renewals.
The entire process requires a lot of study,
analysis, and understanding of statistics,
which is highly technical and
effort-intensive, making it a significant
challenge for organizations. The top-down
approach works well for a strategic
initiative, but it can be augmented with a
bottom-up strategy to drive continuous
performance improvement through
statistical analysis. And that is where
methodologies, such as CMMI and Six
Sigma, have created a lot of impact in
organizations to create high maturity
models.
As an organization or
system, we continuously
need to track project
parameters and take
corrective action if any
outliers are spotted. Of
late, managers have been
improvising their
processes and focusing on
data collection to perform
various analyses, such as
trend analysis, root cause
analysis, and more, to
avoid recurring issues.
Introduc�on
Enabling Faster Business Decisions | 02
As stated above, being data-driven and continuously improving processes requires a lot of
proactive and predictive analysis, which effectively applies statistical concepts. So, it
becomes essential to discuss statistical analysis, why it is crucial, and how it helps
managers make faster decisions.
Enabling Faster Business Decisions | 03
The process is data-driven, managed, and controlled by quantitative objectives.
The correct measurement data is selected.
The focus is on continuous process improvement, which includes analyzing
variations, having the ability to derive the impact of a change, and knowing what
to do with data to support effective decision making, thereby improving
performance, stability, and predictability.
High maturity means:
Before we delve into how we implement
a bottom-up approach to democratize
statistical analysis, enabling faster
decisions and deploying high maturity
models, let us quickly look at what is
considered a high maturity model
according to CMMI.
CMMI- The Capability Maturity Model
Integration, a performance improvement
approach, is a process model that
provides a clear definition of what an
organization should do to promote
behaviors that lead to improved
performance. CMMI can be used as a
benchmark to measure the maturity of
an organization's software process.
Levels 4 and 5 of the CMMI are
considered 'High Maturity' and are
predominantly characterized by
quantitative improvement.
Defining High Matu�ty Models
Enabling Faster Business Decisions | 04
What is sta�s�cal analysis?
Statistics is about the development of methods for the collection and analysis of data in order to answer specific questions in an unbiased way, so that the conclusions depend only on the data and not on any preconceived ideas.
Statistical tests are essential for a CMMI High Maturity (HM) compliant project or organization, helping in:
- Bryan Manly, author of Multivariate Statistical Methods, Fourth Edition
Discovering crucial measures within the data, such as the 'mean' or average.
Summarizing and presenting the data in a graph or chart to present key findings.
Calculating if the data is clustered or spread out, allowing us to make educated
guesses, assumptions, and hypotheses.
Making future predictions based on past behavior.
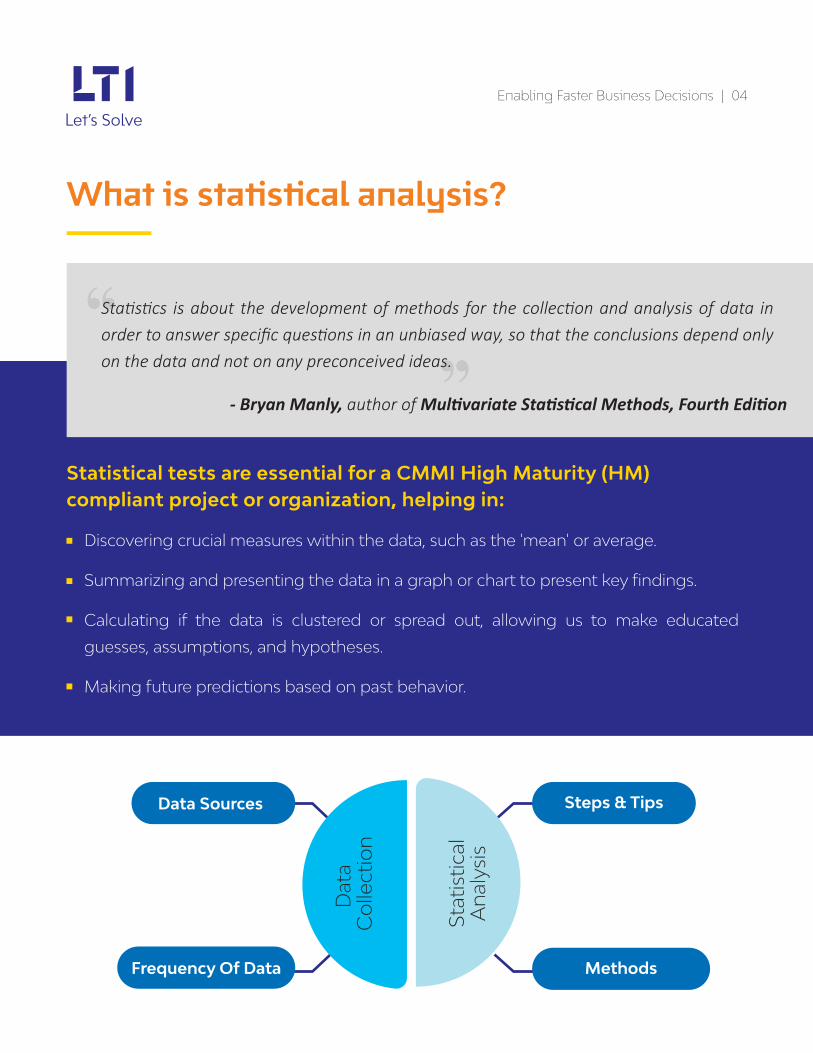
Data Sources
Frequency Of Data
Steps & Tips
Methods
Dat
a C
olle
ctio
n
Stat
istic
alA
nal
ysis
Why should a project manager opt for sta�s�cal analysis? And how does sta�s�cal analysis help in enabling faster decisions?
Enabling Faster Business Decisions | 05
Statistics enable organizations to predict future trends, optimize operations, and gain
actionable insights. Most business-based decisions need to be backed by metrics, facts, or
figures supporting the organization's aims, goals, or initiatives, providing a stable backbone
for management reports and business operations.
Know how much variation the project process can handle without severing SLAs or
missing deadlines.
Learn what is required to achieve Six Sigma benefits.
Understand the productivity of the team and analyze their performance against defined
benchmarks.
Perform 'what-if analysis' and assess the impact of changes.
Let's look at some examples where a project manager would leverage statistical analysis:
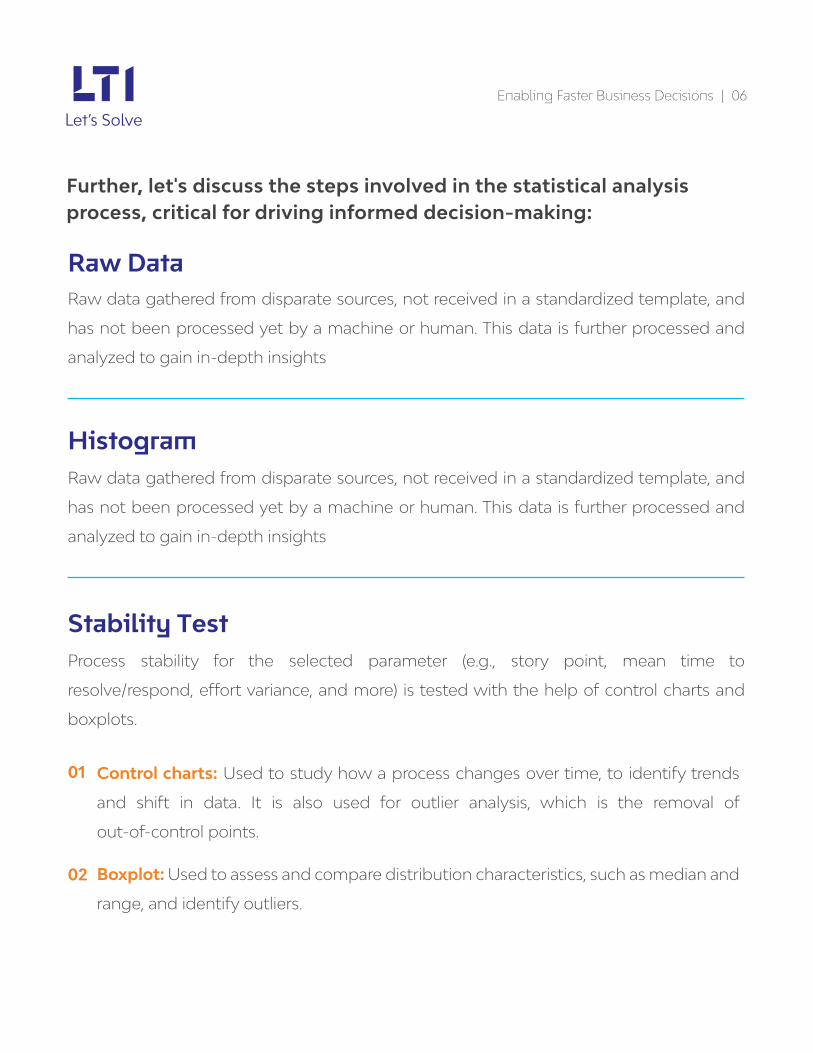
Raw DataRaw data gathered from disparate sources, not received in a standardized template, and
has not been processed yet by a machine or human. This data is further processed and
analyzed to gain in-depth insights
Histogram Raw data gathered from disparate sources, not received in a standardized template, and
has not been processed yet by a machine or human. This data is further processed and
analyzed to gain in-depth insights
Stability TestProcess stability for the selected parameter (e.g., story point, mean time to
resolve/respond, effort variance, and more) is tested with the help of control charts and
boxplots.
Control charts: Used to study how a process changes over time, to identify trends
and shift in data. It is also used for outlier analysis, which is the removal of
out-of-control points.
Boxplot: Used to assess and compare distribution characteristics, such as median and
range, and identify outliers.
01
02
Enabling Faster Business Decisions | 06
Further, let's discuss the steps involved in the statistical analysis process, critical for driving informed decision-making:
Enabling Faster Business Decisions | 07
The Goodness of Fit (GoF) Test: This test helps determine which distribution
does the data fit. The GoF Test also gives percentiles that indicate the percentage
of data points (story point, MTTR, etc.) that fall below a specific data point. For
example, if a story point 3.4 lies at the 75th percentile, it is higher than 75 percent
of other story points or lies in the third quartile.
Hypothesis Test: Hypothesis testing is an approach for analyzing data. It helps
managers understand if the effect they think they observe in the data is real.
Hypothesis testing is vital in quality improvement to assess if the change made to
the process creates a meaningful difference in the output.
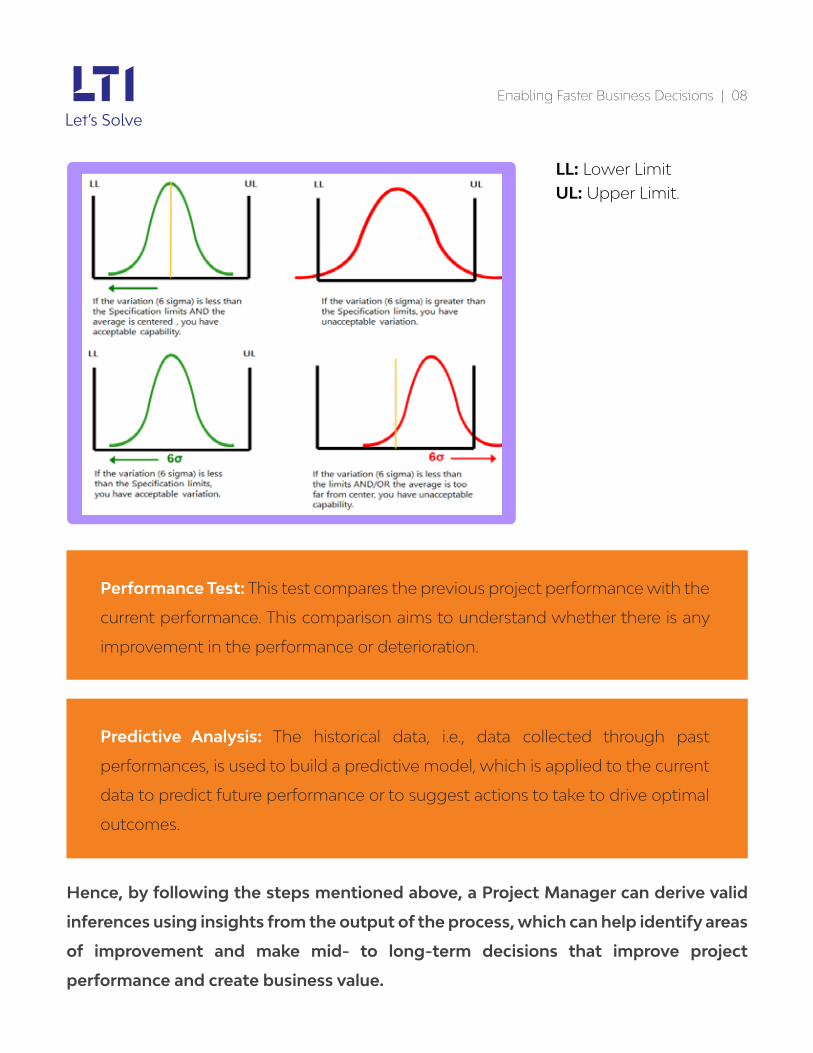
Capability Test: It helps assess whether a process is statistically able to meet a set
of specifications. If the process is stable and all the data points are well within the
specification limit, then the process is capable.
As per the Six Sigma Institute,
Process Sigma is a measurement yardstick to evaluate the output of a process against the
set performance standard. The higher the Process Sigma, the better is the process
capability.
Enabling Faster Business Decisions | 08
LL: Lower Limit UL: Upper Limit.
Performance Test: This test compares the previous project performance with the
current performance. This comparison aims to understand whether there is any
improvement in the performance or deterioration.
Predictive Analysis: The historical data, i.e., data collected through past
performances, is used to build a predictive model, which is applied to the current
data to predict future performance or to suggest actions to take to drive optimal
outcomes.
Hence, by following the steps mentioned above, a Project Manager can derive valid
inferences using insights from the output of the process, which can help identify areas
of improvement and make mid- to long-term decisions that improve project
performance and create business value.
Enabling Faster Business Decisions | 09
Monito�ng and sustaining projectperformance:
For a project to sustain its performance, we believe it needs to establish some "baseline"
against which to monitor efforts during the project's duration. The purpose of monitoring
is to recognize the long-term trends in performance, deducing where we will end up
staying at the present performance level or how long it will take for us to reach there.
Monitoring calls for baselining or benchmarking the data of a project.
A baseline is a fixed reference point that standardizes a project's performance at any given
point of time to measure and compare the project's progress against that reference point.
That helps to improve processes by easily smashing bottlenecks, spotting potential
problems, and identifying improvement areas.
A baseline serves as the basis for further development of the project. For baselining or
benchmarking the data, there are various tools available in the market, which are
menu-driven and code-driven. To conduct a benchmark analysis using such tools, we
should keep the following in mind:
The user is trained in in statistics and has programming skills or statistical tools to
perform and infer the analysis. That implies there is a dependency on statistical subject
matter experts.
Tools come with high license costs leading to limited licenses at the organization level,
thereby limiting usage.
Statistical analysis is an iterative process, and when done, using tools will require a lot of
effort.
Managers will spend significant effort on complex baseline steps.
There can be several data errors, and there will be a requirement of considerable manual
effort for data consolidation.
Unless everyone gains statistical skills, a bottom-up approach is not achievable.
These pointers above delay the entire benchmark analysis process or may act as hurdles in
analyzing the project performance. Now let's talk about the next possibility.
In our opinion, we can build an automated tool where the user has to provide raw data and
go through a few steps to categorize the data (e.g., divide data depending on the phase,
period, technology, target, lower limit, upper limit, etc.). Next, in just one click, the user can
generate graphs, statistical insights, and visual features to understand the project
performance. That would help in deriving rational inferences and further discover
underlying patterns and predict project performance.
As stated in 'The Age Of Analytics: Competing In A Data-Driven World' report by Mckinsey
& Company:
Enabling Faster Business Decisions | 10
What if we automate the en�re baseliningprocess with predic�ve analysis?
Analytics capabilities are already leading to new business models and reshaping industry competition. These capabilities have become a differentiating factor in industry competition, as leading players use data and analytics to grow revenue, to enter or even create new markets, to change the nature of their relationship with customers, and to increase organizational efficiencies. Organizations that are lagging will need to adapt quickly before the gap grows wider.
Conclusion
Enabling Faster Business Decisions | 11
Gone are those days when managers relied on intuition, their experience in similar
circumstances, or others' advice to make big decisions. Today, backing every business
decision requires reliable and accurate empirical data. That is where statistical analysis
plays a crucial role in running businesses effectively and bolstering management
capabilities. It can help improve any project's performance or find out the optimum
performance capacity, enable efficient management of work and employee performance,
limit the wastage of resources, and more. And automating statistical analysis will facilitate
a robust bottom-up approach for decision making, which is the best way to accelerate an
organization's growth strategy.
Together, the high maturity processes deliver improved business capabilities, helping
enterprises achieve their quantitative objectives for quality and process performance
and placing them in the catbird seat.
References:Mckinsey & Company (2016) THE AGE OF ANALYTICS: COMPETING IN A DATA-DRIVEN
WORLD, McKinsey Global Institute: Available at:
https://www.mckinsey.com/~/media/McKinsey/Industries/Public%20and%20Social%20
Sector/Our%20Insights/The%20age%20of%20analytics%20Competing%20in%20a%20d
ata%20driven%20world/MGI-The-Age-of-Analytics-Full-report.pdf
Six Sigma DMAIC Process - Measure Phase - Process Capability, Available at:
https://www.sixsigma-institute.org/Six_Sigma_DMAIC_Process_Measure_Phase_Proce
ss_Capability.php
01
02
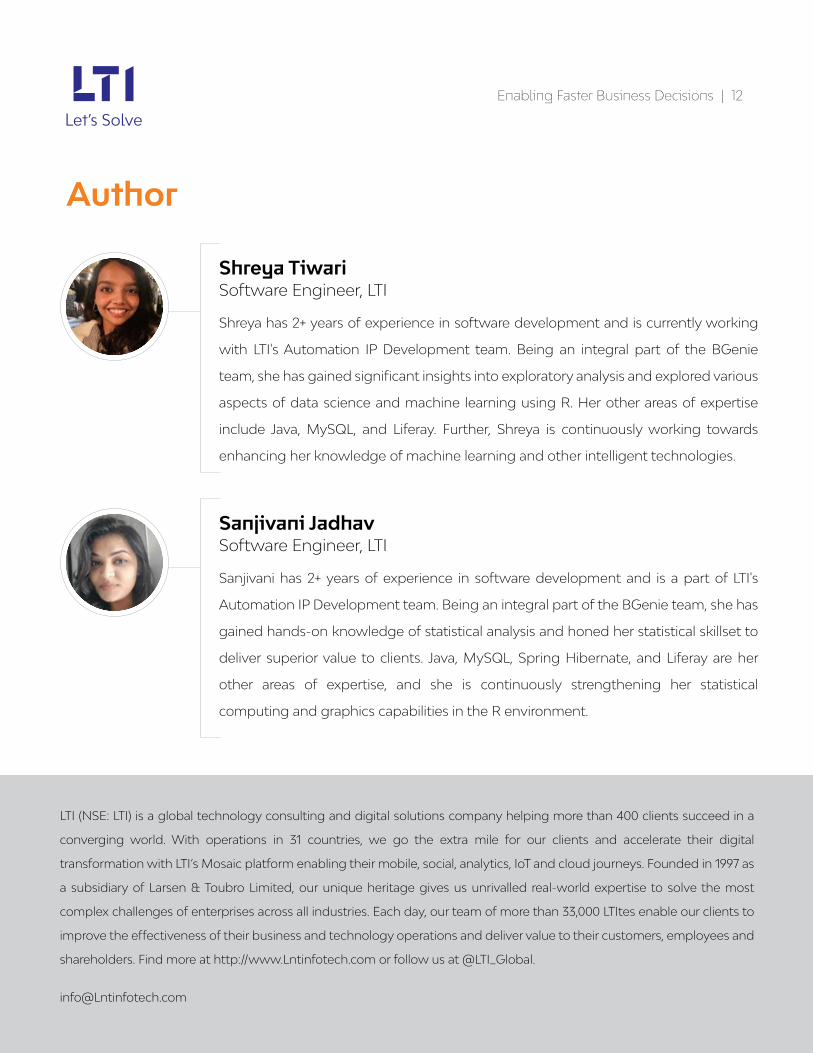
Author
Enabling Faster Business Decisions | 12
Shreya Tiwa�Software Engineer, LTI
Shreya has 2+ years of experience in software development and is currently working
with LTI's Automation IP Development team. Being an integral part of the BGenie
team, she has gained significant insights into exploratory analysis and explored various
aspects of data science and machine learning using R. Her other areas of expertise
include Java, MySQL, and Liferay. Further, Shreya is continuously working towards
enhancing her knowledge of machine learning and other intelligent technologies.
Sanjivani JadhavSoftware Engineer, LTI
Sanjivani has 2+ years of experience in software development and is a part of LTI's
Automation IP Development team. Being an integral part of the BGenie team, she has
gained hands-on knowledge of statistical analysis and honed her statistical skillset to
deliver superior value to clients. Java, MySQL, Spring Hibernate, and Liferay are her
other areas of expertise, and she is continuously strengthening her statistical
computing and graphics capabilities in the R environment.
LTI (NSE: LTI) is a global technology consulting and digital solutions company helping more than 400 clients succeed in a
converging world. With operations in 31 countries, we go the extra mile for our clients and accelerate their digital
transformation with LTI’s Mosaic platform enabling their mobile, social, analytics, IoT and cloud journeys. Founded in 1997 as
a subsidiary of Larsen & Toubro Limited, our unique heritage gives us unrivalled real-world expertise to solve the most
complex challenges of enterprises across all industries. Each day, our team of more than 33,000 LTItes enable our clients to
improve the effectiveness of their business and technology operations and deliver value to their customers, employees and
shareholders. Find more at http://www.Lntinfotech.com or follow us at @LTI_Global.


