73
ENBRIDGE INC. CONSOLIDATED FINANCIAL STATEMENTS December 31, 2015
ENBRIDGE INC.
CONSOLIDATED FINANCIAL STATEMENTS
December 31, 2015
1
MANAGEMENT'S REPORT
To the Shareholders of Enbridge Inc.
Financial Reporting
Management of Enbridge Inc. (the Company) is responsible for the accompanying consolidated financial statements and all related financial information contained in the annual report, including Management’s Discussion and Analysis. The consolidated financial statements have been prepared in accordance with accounting principles generally accepted in the United States of America (U.S. GAAP) and necessarily include amounts that reflect management's judgment and best estimates. The Board of Directors (the Board) and its committees are responsible for all aspects related to governance of the Company. The Audit, Finance & Risk Committee (the AF&RC) of the Board, composed of directors who are unrelated and independent, has a specific responsibility to oversee management’s efforts to fulfill its responsibilities for financial reporting and internal controls related thereto. The AF&RC meets with management, internal auditors and independent auditors to review the consolidated financial statements and the internal controls as they relate to financial reporting. The AF&RC reports its findings to the Board for its consideration in approving the consolidated financial statements for issuance to the shareholders. The internal auditors and independent auditors have unrestricted access to the AF&RC. Internal Control over Financial Reporting Management is also responsible for establishing and maintaining adequate internal control over financial reporting. The Company’s internal control over financial reporting includes policies and procedures to facilitate the preparation of relevant, reliable and timely information, to prepare consolidated financial statements for external reporting purposes in accordance with U.S. GAAP and provide reasonable assurance that assets are safeguarded. Management assessed the effectiveness of the Company’s internal control over financial reporting as at December 31, 2015, based on the framework established in Internal Control – Integrated Framework (2013) issued by the Committee of Sponsoring Organizations of the Treadway Commission. Based on this assessment, management concluded that the Company maintained effective internal control over financial reporting as at December 31, 2015. PricewaterhouseCoopers LLP, independent auditors appointed by the shareholders of the Company, have conducted an audit of the consolidated financial statements of the Company and its internal control over financial reporting in accordance with Canadian generally accepted auditing standards and the standards of the Public Company Accounting Oversight Board (United States) and have issued an unqualified audit report, which is accompanying the consolidated financial statements. “signed” “signed” _______________________________ _______________________________ Al Monaco John K. Whelen President & Chief Executive Officer Executive Vice President &
Chief Financial Officer
February 19, 2016
2
Independent Auditor’s Report To the Shareholders of Enbridge Inc. We have completed integrated audits of Enbridge Inc.’s 2015, 2014 and 2013 consolidated financial statements and its internal control over financial reporting as at December 31, 2015. Our opinions, based on our audits are presented below. Report on the consolidated financial statements We have audited the accompanying consolidated financial statements of Enbridge Inc., which comprise the consolidated statements of financial position as at December 31, 2015 and December 31, 2014 and the consolidated statements of earnings, comprehensive income, changes in equity and cash flows for each of the three years in the period ended December 31, 2015, and the related notes, which comprise a summary of significant accounting policies and other explanatory information. Management’s responsibility for the consolidated financial statements Management is responsible for the preparation and fair presentation of these consolidated financial statements in accordance with accounting principles generally accepting in the United States of America and for such internal control as management determines is necessary to enable the preparation of consolidated financial statements that are free from material misstatement, whether due to fraud or error. Auditor’s responsibility Our responsibility is to express an opinion on these consolidated financial statements based on our audits. We conducted our audits in accordance with Canadian generally accepted auditing standards and the standards of the Public Company Accounting Oversight Board (United States). Those standards require that we plan and perform the audit to obtain reasonable assurance about whether the consolidated financial statements are free from material misstatement. Canadian generally accepted auditing standards also require that we comply with ethical requirements. An audit involves performing procedures to obtain audit evidence, on a test basis, about the amounts and disclosures in the consolidated financial statements. The procedures selected depend on the auditor’s judgment, including the assessment of the risks of material misstatement of the consolidated financial statements, whether due to fraud or error. In making those risk assessments, the auditor considers internal control relevant to the company’s preparation and fair presentation of the consolidated financial statements in order to design audit procedures that are appropriate in the circumstances. An audit also includes evaluating the appropriateness of accounting principles and policies used and the reasonableness of accounting estimates made by management, as well as evaluating the overall presentation of the consolidated financial statements. We believe that the audit evidence we have obtained in our audits is sufficient and appropriate to provide a basis for our audit opinion on the consolidated financial statements.
3
Opinion In our opinion, the consolidated financial statements present fairly, in all material respects, the financial position of Enbridge Inc. as at December 31 2015 and December 31, 2014 and the results of its operations and its cash flows for each of the three years in the period ended December 31, 2015 in accordance with accounting principles generally accepted in the United States of America. Report on internal control over financial reporting We have also audited Enbridge Inc.’s internal control over financial reporting as at December 31, 2015, based on criteria established in Internal Control - Integrated Framework (2013), issued by the Committee of Sponsoring Organizations of the Treadway Commission (COSO). Management’s responsibility for internal control over financial reporting Management is responsible for maintaining effective internal control over financial reporting and for its assessment of the effectiveness of internal control over financial reporting included in the accompanying management’s report on internal control over financial reporting. Auditor’s responsibility Our responsibility is to express an opinion on the company’s internal control over financial reporting based on our audit. We conducted our audit of internal control over financial reporting in accordance with the standards of the Public Company Accounting Oversight Board (United States). Those standards require that we plan and perform the audit to obtain reasonable assurance about whether effective internal control over financial reporting was maintained in all material respects. An audit of internal control over financial reporting includes obtaining an understanding of internal control over financial reporting, assessing the risk that a material weakness exists, testing and evaluating the design and operating effectiveness of internal control, based on the assessed risk, and performing such other procedures as we consider necessary in the circumstances. We believe that our audit provides a reasonable basis for our audit opinion on the company’s internal control over financial reporting. Definition of internal control over financial reporting A company’s internal control over financial reporting is a process designed to provide reasonable assurance regarding the reliability of financial reporting and the preparation of financial statements for external purposes in accordance with generally accepted accounting principles. A company’s internal control over financial reporting includes those policies and procedures that: (i) pertain to the maintenance of records that, in reasonable detail, accurately and fairly reflect the transactions and dispositions of the assets of the company; (ii) provide reasonable assurance that transactions are recorded as necessary to permit preparation of financial statements in accordance with generally accepted accounting principles, and that receipts and expenditures of the company are being made only in accordance with authorizations of management and directors of the company; and (iii) provide reasonable assurance regarding prevention or timely detection of unauthorized acquisition, use, or disposition of the company’s assets that could have a material effect on the financial statements.

4
Inherent limitations Because of its inherent limitations, internal control over financial reporting may not prevent or detect misstatements. Also, projections of any evaluation of effectiveness to future periods are subject to the risk that controls may become inadequate because of changes in conditions or that the degree of compliance with the policies or procedures may deteriorate.
Opinion In our opinion, Enbridge Inc. maintained, in all material respects, effective internal control over financial reporting as at December 31, 2015, based on criteria established in Internal Control - Integrated Framework (2013) issued by COSO.
Chartered Professional Accountants Calgary, Alberta February 19, 2016
5
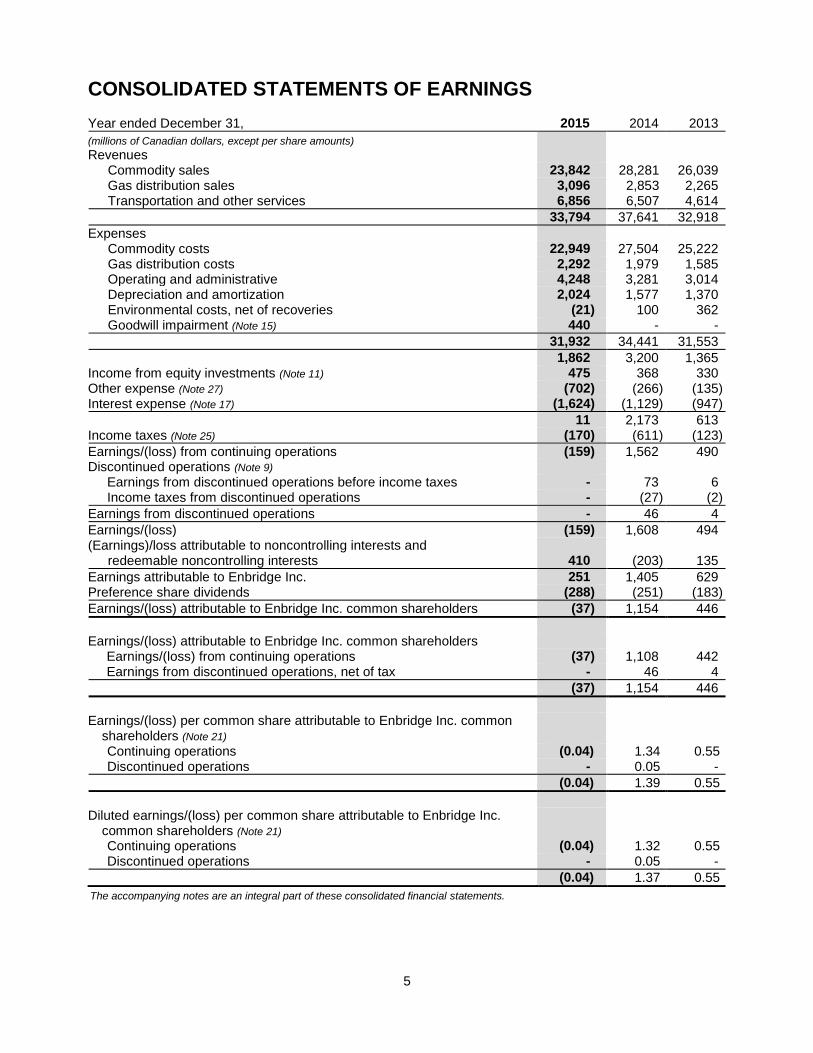
CONSOLIDATED STATEMENTS OF EARNINGS Year ended December 31, 2015 2014 2013
(millions of Canadian dollars, except per share amounts) Revenues
Commodity sales 23,842 28,281 26,039 Gas distribution sales 3,096 2,853 2,265 Transportation and other services 6,856 6,507 4,614
33,794 37,641 32,918
Expenses Commodity costs 22,949 27,504 25,222 Gas distribution costs 2,292 1,979 1,585 Operating and administrative 4,248 3,281 3,014 Depreciation and amortization 2,024 1,577 1,370 Environmental costs, net of recoveries (21) 100 362 Goodwill impairment (Note 15) 440 - -
31,932 34,441 31,553
1,862 3,200 1,365 Income from equity investments (Note 11) 475 368 330 Other expense (Note 27) (702) (266) (135) Interest expense (Note 17) (1,624) (1,129) (947)
11 2,173 613 Income taxes (Note 25) (170) (611) (123)
Earnings/(loss) from continuing operations (159) 1,562 490 Discontinued operations (Note 9)
Earnings from discontinued operations before income taxes - 73 6 Income taxes from discontinued operations - (27) (2)
Earnings from discontinued operations - 46 4
Earnings/(loss) (159) 1,608 494 (Earnings)/loss attributable to noncontrolling interests and
redeemable noncontrolling interests 410 (203)
135
Earnings attributable to Enbridge Inc. 251 1,405 629 Preference share dividends (288) (251) (183)
Earnings/(loss) attributable to Enbridge Inc. common shareholders (37) 1,154 446
Earnings/(loss) attributable to Enbridge Inc. common shareholders
Earnings/(loss) from continuing operations (37) 1,108 442 Earnings from discontinued operations, net of tax - 46 4
(37) 1,154 446
Earnings/(loss) per common share attributable to Enbridge Inc. common
shareholders (Note 21) Continuing operations (0.04) 1.34 0.55 Discontinued operations - 0.05 -
(0.04) 1.39 0.55
Diluted earnings/(loss) per common share attributable to Enbridge Inc.
common shareholders (Note 21) Continuing operations (0.04) 1.32 0.55 Discontinued operations - 0.05 -
(0.04) 1.37 0.55
The accompanying notes are an integral part of these consolidated financial statements.
6
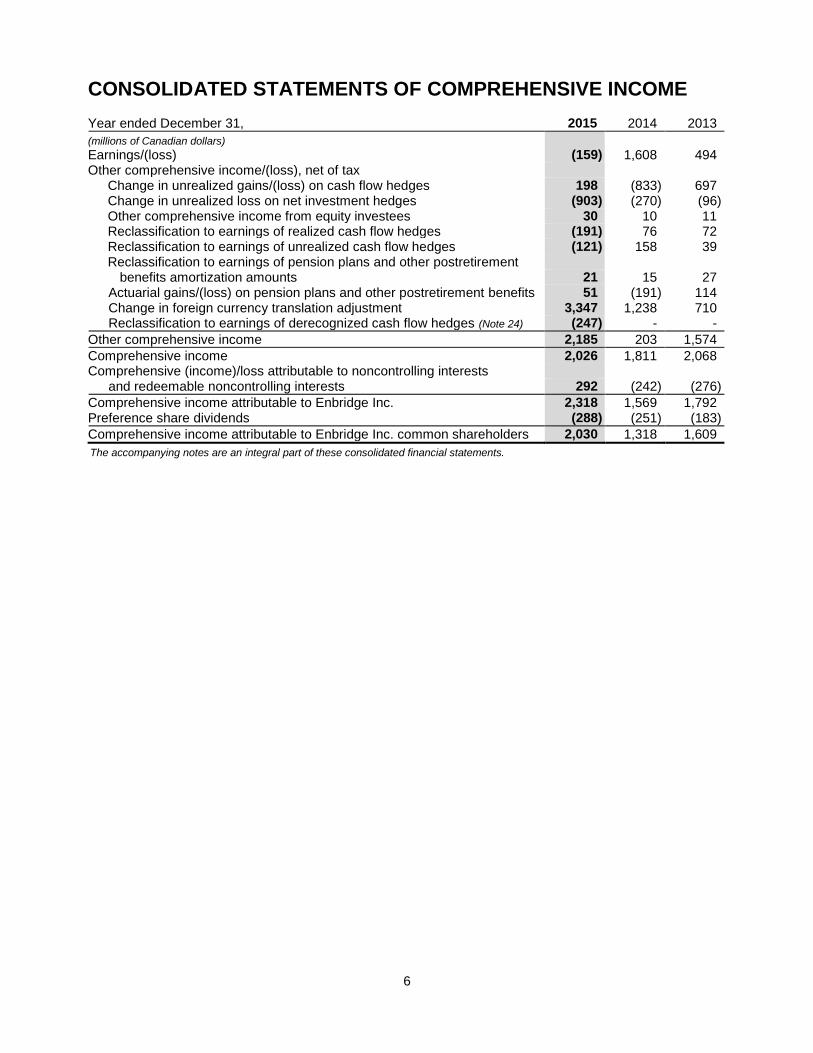
CONSOLIDATED STATEMENTS OF COMPREHENSIVE INCOME Year ended December 31, 2015 2014 2013
(millions of Canadian dollars) Earnings/(loss) (159) 1,608 494 Other comprehensive income/(loss), net of tax
Change in unrealized gains/(loss) on cash flow hedges 198 (833) 697 Change in unrealized loss on net investment hedges (903) (270) (96) Other comprehensive income from equity investees 30 10 11 Reclassification to earnings of realized cash flow hedges (191) 76 72 Reclassification to earnings of unrealized cash flow hedges (121) 158 39 Reclassification to earnings of pension plans and other postretirement
benefits amortization amounts 21 15 27 Actuarial gains/(loss) on pension plans and other postretirement benefits 51 (191) 114 Change in foreign currency translation adjustment 3,347 1,238 710 Reclassification to earnings of derecognized cash flow hedges (Note 24) (247) - -
Other comprehensive income 2,185 203 1,574
Comprehensive income 2,026 1,811 2,068 Comprehensive (income)/loss attributable to noncontrolling interests
and redeemable noncontrolling interests 292 (242) (276)
Comprehensive income attributable to Enbridge Inc. 2,318 1,569 1,792 Preference share dividends (288) (251) (183)
Comprehensive income attributable to Enbridge Inc. common shareholders 2,030 1,318 1,609
The accompanying notes are an integral part of these consolidated financial statements.
7
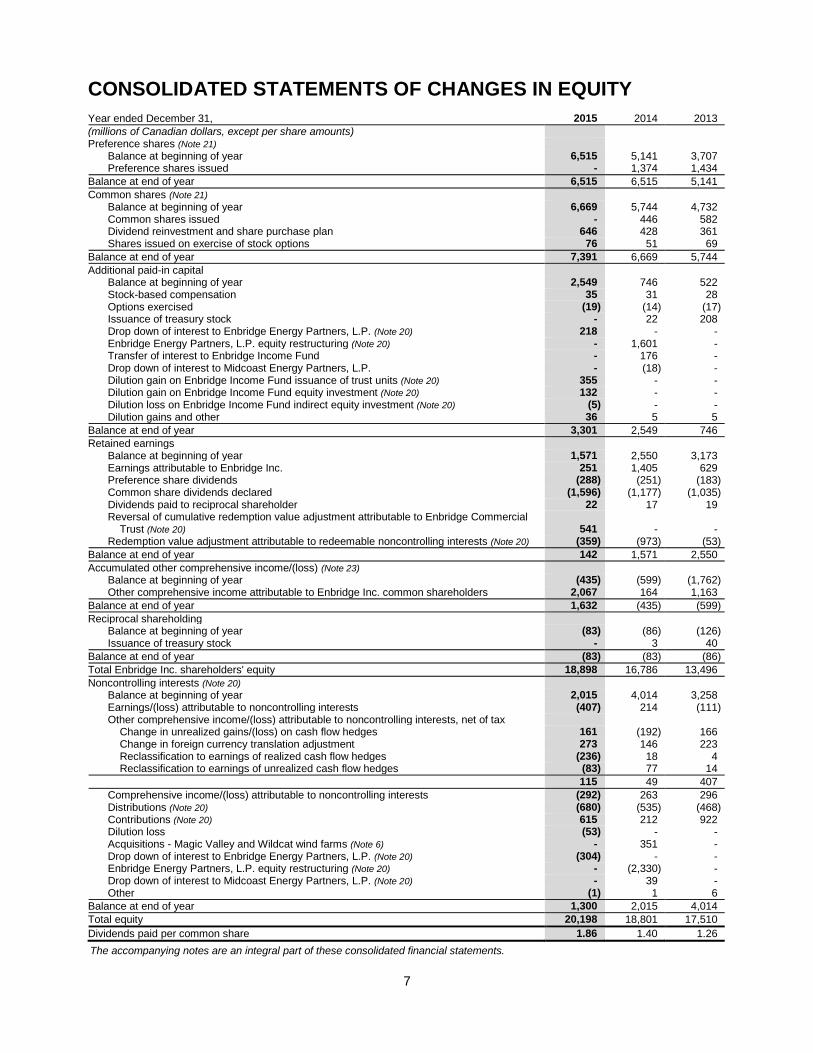
CONSOLIDATED STATEMENTS OF CHANGES IN EQUITY
Year ended December 31, 2015 2014 2013
(millions of Canadian dollars, except per share amounts) Preference shares (Note 21)
Balance at beginning of year 6,515 5,141 3,707 Preference shares issued - 1,374 1,434
Balance at end of year 6,515 6,515 5,141
Common shares (Note 21) Balance at beginning of year 6,669 5,744 4,732 Common shares issued - 446 582 Dividend reinvestment and share purchase plan 646 428 361 Shares issued on exercise of stock options 76 51 69
Balance at end of year 7,391 6,669 5,744
Additional paid-in capital Balance at beginning of year 2,549 746 522 Stock-based compensation 35 31 28 Options exercised (19) (14) (17) Issuance of treasury stock - 22 208 Drop down of interest to Enbridge Energy Partners, L.P. (Note 20) 218 - - Enbridge Energy Partners, L.P. equity restructuring (Note 20) - 1,601 - Transfer of interest to Enbridge Income Fund - 176 - Drop down of interest to Midcoast Energy Partners, L.P. - (18) - Dilution gain on Enbridge Income Fund issuance of trust units (Note 20) 355 - - Dilution gain on Enbridge Income Fund equity investment (Note 20) 132 - - Dilution loss on Enbridge Income Fund indirect equity investment (Note 20) (5) - - Dilution gains and other 36 5 5
Balance at end of year 3,301 2,549 746
Retained earnings Balance at beginning of year 1,571 2,550 3,173 Earnings attributable to Enbridge Inc. 251 1,405 629 Preference share dividends (288) (251) (183) Common share dividends declared (1,596) (1,177) (1,035) Dividends paid to reciprocal shareholder 22 17 19 Reversal of cumulative redemption value adjustment attributable to Enbridge Commercial
Trust (Note 20) 541 - - Redemption value adjustment attributable to redeemable noncontrolling interests (Note 20) (359) (973) (53)
Balance at end of year 142 1,571 2,550
Accumulated other comprehensive income/(loss) (Note 23) Balance at beginning of year (435) (599) (1,762) Other comprehensive income attributable to Enbridge Inc. common shareholders 2,067 164 1,163
Balance at end of year 1,632 (435) (599)
Reciprocal shareholding Balance at beginning of year (83) (86) (126) Issuance of treasury stock - 3 40
Balance at end of year (83) (83) (86)
Total Enbridge Inc. shareholders' equity 18,898 16,786 13,496
Noncontrolling interests (Note 20) Balance at beginning of year 2,015 4,014 3,258 Earnings/(loss) attributable to noncontrolling interests (407) 214 (111) Other comprehensive income/(loss) attributable to noncontrolling interests, net of tax
Change in unrealized gains/(loss) on cash flow hedges 161 (192) 166 Change in foreign currency translation adjustment 273 146 223 Reclassification to earnings of realized cash flow hedges (236) 18 4 Reclassification to earnings of unrealized cash flow hedges (83) 77 14
115 49 407
Comprehensive income/(loss) attributable to noncontrolling interests (292) 263 296 Distributions (Note 20) (680) (535) (468) Contributions (Note 20) 615 212 922 Dilution loss (53) - - Acquisitions - Magic Valley and Wildcat wind farms (Note 6) - 351 - Drop down of interest to Enbridge Energy Partners, L.P. (Note 20) (304) - - Enbridge Energy Partners, L.P. equity restructuring (Note 20) - (2,330) - Drop down of interest to Midcoast Energy Partners, L.P. (Note 20) - 39 - Other (1) 1 6
Balance at end of year 1,300 2,015 4,014
Total equity 20,198 18,801 17,510
Dividends paid per common share 1.86 1.40 1.26
The accompanying notes are an integral part of these consolidated financial statements.
8
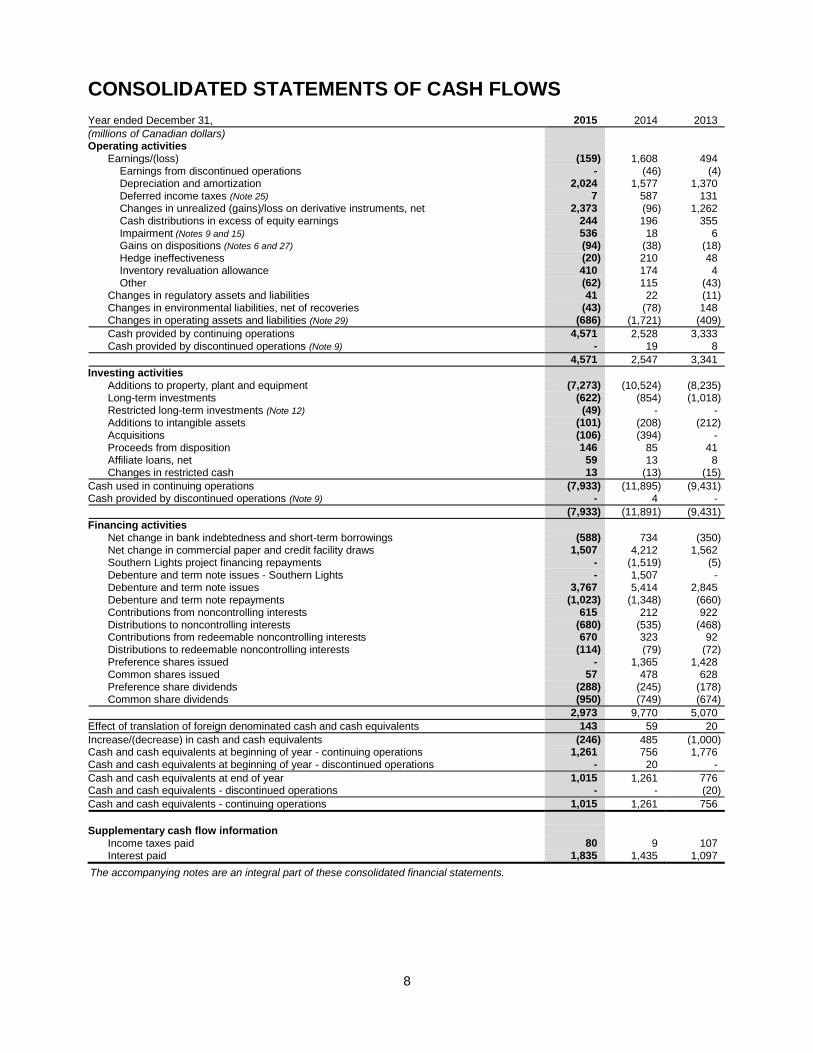
CONSOLIDATED STATEMENTS OF CASH FLOWS
Year ended December 31, 2015 2014 2013
(millions of Canadian dollars) Operating activities
Earnings/(loss) (159) 1,608 494 Earnings from discontinued operations - (46) (4) Depreciation and amortization 2,024 1,577 1,370 Deferred income taxes (Note 25) 7 587 131 Changes in unrealized (gains)/loss on derivative instruments, net 2,373 (96) 1,262 Cash distributions in excess of equity earnings 244 196 355 Impairment (Notes 9 and 15) 536 18 6 Gains on dispositions (Notes 6 and 27) (94) (38) (18) Hedge ineffectiveness (20) 210 48 Inventory revaluation allowance 410 174 4 Other (62) 115 (43)
Changes in regulatory assets and liabilities 41 22 (11) Changes in environmental liabilities, net of recoveries (43) (78) 148 Changes in operating assets and liabilities (Note 29) (686) (1,721) (409)
Cash provided by continuing operations 4,571 2,528 3,333 Cash provided by discontinued operations (Note 9) - 19 8
4,571 2,547 3,341
Investing activities Additions to property, plant and equipment (7,273) (10,524) (8,235) Long-term investments (622) (854) (1,018) Restricted long-term investments (Note 12) (49) - - Additions to intangible assets (101) (208) (212) Acquisitions (106) (394) - Proceeds from disposition 146 85 41 Affiliate loans, net 59 13 8 Changes in restricted cash 13 (13) (15)
Cash used in continuing operations (7,933) (11,895) (9,431) Cash provided by discontinued operations (Note 9) - 4 -
(7,933) (11,891) (9,431)
Financing activities Net change in bank indebtedness and short-term borrowings (588) 734 (350) Net change in commercial paper and credit facility draws 1,507 4,212 1,562 Southern Lights project financing repayments - (1,519) (5) Debenture and term note issues - Southern Lights - 1,507 - Debenture and term note issues 3,767 5,414 2,845 Debenture and term note repayments (1,023) (1,348) (660) Contributions from noncontrolling interests 615 212 922 Distributions to noncontrolling interests (680) (535) (468) Contributions from redeemable noncontrolling interests 670 323 92 Distributions to redeemable noncontrolling interests (114) (79) (72) Preference shares issued - 1,365 1,428 Common shares issued 57 478 628 Preference share dividends (288) (245) (178) Common share dividends (950) (749) (674)
2,973 9,770 5,070
Effect of translation of foreign denominated cash and cash equivalents 143 59 20
Increase/(decrease) in cash and cash equivalents (246) 485 (1,000) Cash and cash equivalents at beginning of year - continuing operations 1,261 756 1,776 Cash and cash equivalents at beginning of year - discontinued operations - 20 -
Cash and cash equivalents at end of year 1,015 1,261 776 Cash and cash equivalents - discontinued operations - - (20)
Cash and cash equivalents - continuing operations 1,015 1,261 756
Supplementary cash flow information
Income taxes paid 80 9 107 Interest paid 1,835 1,435 1,097
The accompanying notes are an integral part of these consolidated financial statements.
9
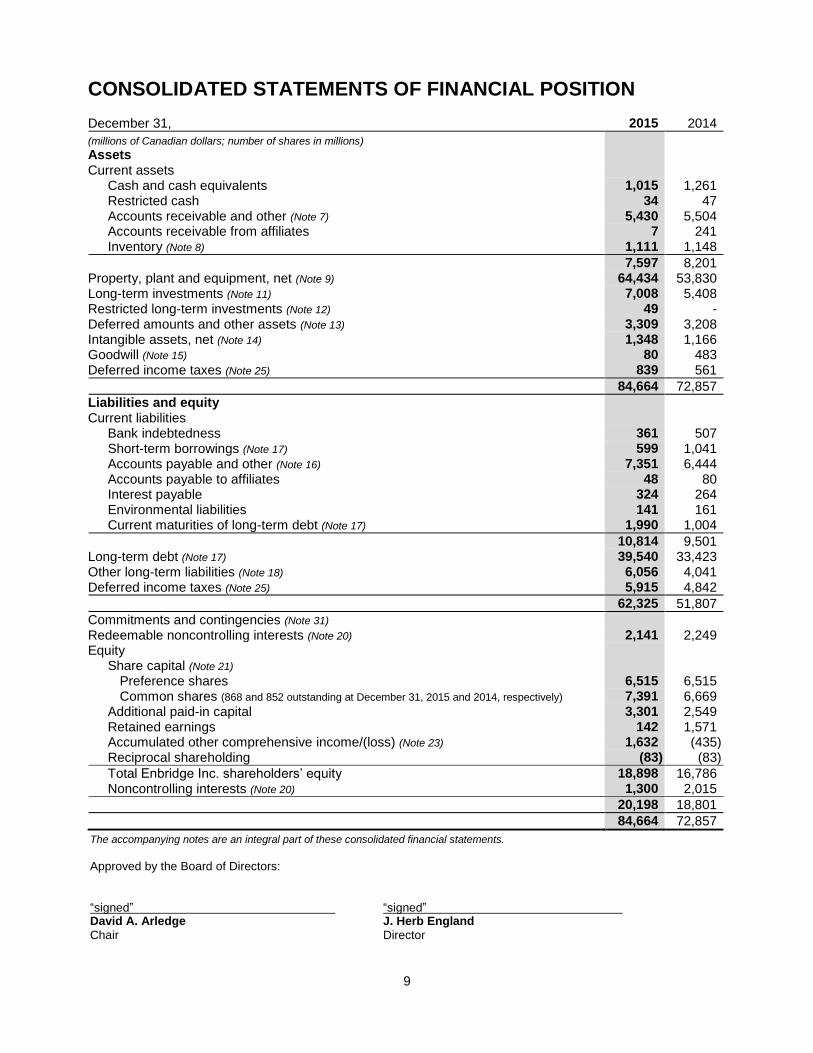
CONSOLIDATED STATEMENTS OF FINANCIAL POSITION December 31, 2015 2014
(millions of Canadian dollars; number of shares in millions)
Assets Current assets
Cash and cash equivalents 1,015 1,261 Restricted cash 34 47 Accounts receivable and other (Note 7) 5,430 5,504 Accounts receivable from affiliates 7 241 Inventory (Note 8) 1,111 1,148
7,597 8,201 Property, plant and equipment, net (Note 9) 64,434 53,830 Long-term investments (Note 11) 7,008 5,408 Restricted long-term investments (Note 12) 49 - Deferred amounts and other assets (Note 13) 3,309 3,208 Intangible assets, net (Note 14) 1,348 1,166 Goodwill (Note 15) 80 483 Deferred income taxes (Note 25) 839 561
84,664 72,857
Liabilities and equity Current liabilities
Bank indebtedness 361 507 Short-term borrowings (Note 17) 599 1,041 Accounts payable and other (Note 16) 7,351 6,444 Accounts payable to affiliates 48 80 Interest payable 324 264 Environmental liabilities 141 161 Current maturities of long-term debt (Note 17) 1,990 1,004
10,814 9,501 Long-term debt (Note 17) 39,540 33,423 Other long-term liabilities (Note 18) 6,056 4,041 Deferred income taxes (Note 25) 5,915 4,842
62,325 51,807
Commitments and contingencies (Note 31) Redeemable noncontrolling interests (Note 20) 2,141 2,249 Equity
Share capital (Note 21) Preference shares 6,515 6,515 Common shares (868 and 852 outstanding at December 31, 2015 and 2014, respectively) 7,391 6,669
Additional paid-in capital 3,301 2,549 Retained earnings 142 1,571 Accumulated other comprehensive income/(loss) (Note 23) 1,632 (435) Reciprocal shareholding (83) (83)
Total Enbridge Inc. shareholders’ equity 18,898 16,786 Noncontrolling interests (Note 20) 1,300 2,015
20,198 18,801
84,664 72,857
The accompanying notes are an integral part of these consolidated financial statements.
Approved by the Board of Directors: “signed” “signed” David A. Arledge J. Herb England
Chair Director
10
NOTES TO THE CONSOLIDATED FINANCIAL STATEMENTS
1. GENERAL BUSINESS DESCRIPTION
Enbridge Inc. (Enbridge or the Company) is a publicly traded energy transportation and distribution company. Enbridge conducts its business through five business segments: Liquids Pipelines; Gas Distribution; Gas Pipelines, Processing and Energy Services; Sponsored Investments and Corporate. These operating segments are strategic business units established by senior management to facilitate the achievement of the Company’s long-term objectives, to aid in resource allocation decisions and to assess operational performance. Effective September 1, 2015, under an agreement with Enbridge Income Fund (the Fund) and Enbridge Income Fund Holdings Inc. (ENF), Enbridge transferred its Canadian Liquids Pipelines business, held by Enbridge Pipelines Inc. (EPI) and Enbridge Pipelines (Athabasca) Inc. (EPAI), and certain Canadian renewable energy assets to the Fund Group (comprising the Fund, Enbridge Commercial Trust (ECT), Enbridge Income Partners LP (EIPLP) and the subsidiaries of EIPLP) for consideration valued at $30.4 billion plus incentive distribution and performance rights (the Canadian Restructuring Plan). The consideration that Enbridge received included $18.7 billion of units in the Fund Group, comprised of $3 billion of Fund units and $15.7 billion of equity units of EIPLP, in which the Fund has an interest. The Fund Group also assumed debt of EPI and EPAI of approximately $11.7 billion. Upon closing of the transaction, Enbridge’s overall economic interest in the Fund Group increased to 91.9% (overall economic interest prior to the transfer was 66.4%). Also effective September 1, 2015, the transferred businesses and assets noted above are reported under the Sponsored Investments segment as further described below. LIQUIDS PIPELINES Until August 31, 2015, Liquids Pipelines consisted of common carrier and contract crude oil, natural gas liquids (NGL) and refined products pipelines and terminals in Canada and the United States, including Canadian Mainline, Regional Oil Sands System, Seaway Crude Pipeline System (Seaway Pipeline), Flanagan South Pipeline, Southern Lights Pipeline, Spearhead Pipeline and Feeder Pipelines and Other. Effective September 1, 2015, under the Canadian Restructuring Plan described above, Enbridge transferred to the Fund Group the Canadian Mainline, Regional Oil Sands System, the Canadian portion of the Southern Lights Pipeline (Southern Lights Canada) and certain residual rights and/or obligations relating to terminal and storage assets. These transferred assets are reported under the Sponsored Investments segment from the date of transfer. GAS DISTRIBUTION Gas Distribution consists of the Company’s natural gas utility operations, the core of which is Enbridge Gas Distribution Inc. (EGD), which serves residential, commercial and industrial customers, primarily in central and eastern Ontario as well as northern New York State. This business segment also includes natural gas distribution activities in Quebec and New Brunswick. GAS PIPELINES, PROCESSING AND ENERGY SERVICES Gas Pipelines, Processing and Energy Services consists of investments in natural gas pipelines, gathering and processing facilities and the Company’s energy services businesses, along with renewable energy and transmission facilities. Effective September 1, 2015, under the Canadian Restructuring Plan described above, Enbridge transferred to the Fund Group certain Canadian renewable energy assets which are reported under the Sponsored Investments segment from the date of transfer. Investments in natural gas pipelines include the Company’s interests in the Vector Pipeline (Vector) and transmission and gathering pipelines in the Gulf of Mexico. Investments in natural gas processing include the Company’s interest in Aux Sable, a natural gas extraction and fractionation business located near the terminus of the Alliance Pipeline and Canadian Midstream assets located in northeast British Columbia and northwest Alberta. The energy services businesses undertake physical commodity marketing activity and logistical services, oversee refinery supply services and manage the Company’s volume commitments on Alliance Pipeline, Vector and other pipeline systems.

11
SPONSORED INVESTMENTS Sponsored Investments, as at December 31, 2015, include the Company’s overall 89.2% (2014 - 66.4%) economic interest in the Fund Group. Also within Sponsored Investments is the Company’s 35.7% (2014 - 33.7%) economic interest in Enbridge Energy Partners, L.P. (EEP) and Enbridge’s interests in both the Eastern Access and Lakehead System Mainline Expansion projects held through Enbridge Energy, Limited Partnership. Enbridge, through its subsidiaries, manages the day-to-day operations of and develops and assesses opportunities for each of these investments, including both organic growth and acquisition opportunities. As a result of the Canadian Restructuring Plan, as discussed above, effective September 1, 2015, the Fund Group’s primary operations include its liquids pipelines business, which includes the Canadian Mainline and Regional Oil Sands System, its renewable power generation assets and a natural gas transmission business through its 50% interest in Alliance Pipeline. EEP transports crude oil and other liquid hydrocarbons through common carrier and feeder pipelines, including the Lakehead Pipeline System (Lakehead System), which is the United States portion of the Enbridge mainline system, and transports, gathers, processes and markets natural gas and NGL. CORPORATE Corporate consists of the Company’s investment in Noverco Inc. (Noverco), new business development activities, general corporate investments and financing costs not allocated to the business segments.
2. SUMMARY OF SIGNIFICANT ACCOUNTING POLICIES These consolidated financial statements are prepared in accordance with generally accepted accounting principles in the United States of America (U.S. GAAP). Amounts are stated in Canadian dollars unless otherwise noted. As a Securities and Exchange Commission registrant, the Company is permitted to use U.S. GAAP for purposes of meeting both its Canadian and United States continuous disclosure requirements. BASIS OF PRESENTATION AND USE OF ESTIMATES
The preparation of financial statements in conformity with U.S. GAAP requires management to make estimates and assumptions that affect the reported amounts of assets, liabilities, revenues and expenses, as well as the disclosure of contingent assets and liabilities in the consolidated financial statements. Significant estimates and assumptions used in the preparation of the consolidated financial statements include, but are not limited to: carrying values of regulatory assets and liabilities (Note 5); unbilled revenues (Note 7); allowance for doubtful accounts (Note 7); depreciation rates and carrying value of property, plant and equipment (Note 9); amortization rates of intangible assets (Note 14); measurement of goodwill (Note 15); fair value of asset retirement obligations (ARO) (Note 19); valuation of stock-based compensation (Note 22); fair value of financial instruments (Note 24); provisions for income taxes (Note 25); assumptions used to measure retirement and other postretirement benefit obligations (OPEB) (Note 26); commitments and contingencies (Note 31); and estimates of losses related to environmental remediation obligations (Note 31). Actual results could differ from these estimates. PRINCIPLES OF CONSOLIDATION The consolidated financial statements include the accounts of Enbridge, its subsidiaries and variable interest entities (VIEs) for which the Company is the primary beneficiary. Upon inception of a contractual agreement, the Company performs an assessment to determine whether the arrangement contains a variable interest in a legal entity and whether that legal entity is a VIE. Where the Company concludes it is the primary beneficiary of a VIE, the Company will consolidate the accounts of that entity. The consolidated financial statements also include the accounts of any limited partnerships where the Company represents the general partner and, based on all facts and circumstances, controls such limited partnerships, unless the limited partner has substantive participating rights or substantive kick-out rights. For certain investments where the Company retains an undivided interest in assets and liabilities, Enbridge records its proportionate share of assets, liabilities, revenues and expenses.
12
All significant intercompany accounts and transactions are eliminated upon consolidation. Ownership interests in subsidiaries represented by other parties that do not control the entity are presented in the consolidated financial statements as activities and balances attributable to noncontrolling interests and redeemable noncontrolling interests. Investments and entities over which the Company exercises significant influence are accounted for using the equity method. As a result of the Canadian Restructuring Plan, ECT, a subsidiary of the Company, determines its equity investment earnings from EIPLP using the Hypothetical Liquidation at Book Value (HLBV) method. ECT applies the HLBV method to its equity method investments where cash distributions, including both preference and residual distributions, are not based on the investor’s ownership percentages. Under the HLBV method, a calculation is prepared at each balance sheet date to determine the amount that ECT would receive if EIPLP were to liquidate all of its assets, as valued in accordance with U.S. GAAP, and distribute that cash to the investors. The difference between the calculated liquidation distribution amounts at the beginning and the end of the reporting period, after adjusting for capital contributions and distributions, is ECT’s share of the earnings or losses from the equity investment for the period. While ECT and EIPLP are both consolidated in these financial statements, the use of the HLBV method by ECT impacts the earnings attributable to redeemable noncontrolling interests reported on Enbridge’s Consolidated Statements of Earnings. The Company continues to recognize Redeemable noncontrolling interests on the Consolidated Statements of Financial Position at the maximum redemption value of the trust units held by third parties, which references the market price of ENF common shares. REGULATION Certain of the Company’s businesses are subject to regulation by various authorities including, but not limited to, the National Energy Board (NEB), the Federal Energy Regulatory Commission (FERC), the Alberta Energy Regulator, the New Brunswick Energy and Utilities Board (EUB) and the Ontario Energy Board (OEB). Regulatory bodies exercise statutory authority over matters such as construction, rates and ratemaking and agreements with customers. To recognize the economic effects of the actions of the regulator, the timing of recognition of certain revenues and expenses in these operations may differ from that otherwise expected under U.S. GAAP for non rate-regulated entities. Regulatory assets represent amounts that are expected to be recovered from customers in future periods through rates. Regulatory liabilities represent amounts that are expected to be refunded to customers in future periods through rates or expected to be paid to cover future abandonment costs in relation to the NEB’s Land Matters Consultation Initiative (LMCI). Long-term regulatory assets are recorded in Deferred amounts and other assets and current regulatory assets are recorded in Accounts receivable and other. Long-term regulatory liabilities are included in Other long-term liabilities and current regulatory liabilities are recorded in Accounts payable and other. Regulatory assets are assessed for impairment if the Company identifies an event indicative of possible impairment. The recognition of regulatory assets and liabilities is based on the actions, or expected future actions, of the regulator. To the extent that the regulator’s actions differ from the Company’s expectations, the timing and amount of recovery or settlement of regulatory balances could differ significantly from those recorded. In the absence of rate regulation, the Company would generally not recognize regulatory assets or liabilities and the earnings impact would be recorded in the period the expenses are incurred or revenues are earned. A regulatory asset or liability is recognized in respect of deferred income taxes when it is expected the amounts will be recovered or settled through future regulator-approved rates. Allowance for funds used during construction (AFUDC) is included in the cost of property, plant and equipment and is depreciated over future periods as part of the total cost of the related asset. AFUDC includes both an interest component and, if approved by the regulator, a cost of equity component, which are both capitalized based on rates set out in a regulatory agreement. In the absence of rate regulation, the Company would capitalize interest using a capitalization rate based on its cost of borrowing, whereas the capitalized equity component, the corresponding earnings during the construction phase and the subsequent depreciation would not be recognized.
13
For certain regulated operations to which U.S. GAAP guidance for phase-in plans applies, negotiated depreciation rates recovered in transportation tolls may be less than the depreciation expense calculated in accordance with U.S. GAAP in early years of long-term contracts but recovered in future periods when tolls exceed depreciation. Depreciation expense on such assets is recorded in accordance with U.S. GAAP and no deferred regulatory asset is recorded (Note 5). With the approval of the regulator, EGD and certain distribution operations capitalize a percentage of specified operating costs. These operations are authorized to charge depreciation and earn a return on the net book value of such capitalized costs in future years. To the extent that the regulator’s actions differ from the Company’s expectations, the timing and amount of recovery or settlement of capitalized costs could differ significantly from those recorded. In the absence of rate regulation, a portion of such costs may be charged to current period earnings. REVENUE RECOGNITION For businesses that are not rate-regulated, revenues are recorded when products have been delivered or services have been performed, the amount of revenue can be reliably measured and collectability is reasonably assured. Customer credit worthiness is assessed prior to agreement signing, as well as throughout the contract duration. Certain revenues from liquids and gas pipeline businesses are recognized under the terms of committed delivery contracts rather than the cash tolls received. Long-term take-or-pay contracts, under which shippers are obligated to pay fixed amounts rateably over the contract period regardless of volumes shipped, may contain make-up rights. Make-up rights are earned by shippers when minimum volume commitments are not utilized during the period but under certain circumstances can be used to offset overages in future periods, subject to expiry periods. The Company recognizes revenues associated with make-up rights at the earlier of when the make-up volume is shipped, the make-up right expires or when it is determined that the likelihood that the shipper will utilize the make-up right is remote. Certain offshore pipeline transportation contracts require the Company to provide transportation services for the life of the underlying producing fields. Under these arrangements, shippers pay the Company a fixed monthly toll for a defined period of time which may be shorter than the estimated reserve life of the underlying producing fields, resulting in a contract period which extends past the period of cash collection. Fixed monthly toll revenues are recognized rateably over the committed volume made available to shippers throughout the contract period, regardless of when cash is received. For rate-regulated businesses, revenues are recognized in a manner that is consistent with the underlying agreements as approved by the regulators. Since July 1, 2011 onward, Canadian Mainline (excluding Lines 8 and 9) earnings are governed by the Competitive Toll Settlement (CTS), under which revenues are recorded when services are performed. Effective on that date, the Company prospectively discontinued the application of rate-regulated accounting for those assets with the exception of flow-through income taxes covered by a specific rate order. For natural gas utility rate-regulated operations in Gas Distribution, revenues are recognized in a manner consistent with the underlying rate-setting mechanism as mandated by the regulator. Natural gas utilities revenues are recorded on the basis of regular meter readings and estimates of customer usage from the last meter reading to the end of the reporting period. Estimates are based on historical consumption patterns and heating degree days experienced. Heating degree days is a measure of coldness that is indicative of volumetric requirements for natural gas utilized for heating purposes in the Company’s distribution franchise area. For natural gas and marketing businesses, an estimate of revenues and commodity costs for the month of December is included in the Consolidated Statements of Earnings for each year based on the best available volume and price data for the commodity delivered and received.

14
DERIVATIVE INSTRUMENTS AND HEDGING Non-qualifying Derivatives Non-qualifying derivative instruments are used primarily to economically hedge foreign exchange, interest rate and commodity price earnings exposure. Non-qualifying derivatives are measured at fair value with changes in fair value recognized in earnings in Transportation and other services revenues, Commodity costs, Operating and administrative expense, Other income/(expense) and Interest expense. Derivatives in Qualifying Hedging Relationships The Company uses derivative financial instruments to manage its exposure to changes in commodity prices, foreign exchange rates, interest rates and certain compensation tied to its share price. Hedge accounting is optional and requires the Company to document the hedging relationship and test the hedging item’s effectiveness in offsetting changes in fair values or cash flows of the underlying hedged item on an ongoing basis. The Company presents the earnings effects of hedging items with the hedged transaction. Derivatives in qualifying hedging relationships are categorized as cash flow hedges, fair value hedges and net investment hedges. Cash Flow Hedges The Company uses cash flow hedges to manage its exposure to changes in commodity prices, foreign exchange rates, interest rates and certain compensation tied to its share price. The effective portion of the change in the fair value of a cash flow hedging instrument is recorded in Other comprehensive income/(loss) (OCI) and is reclassified to earnings when the hedged item impacts earnings. Any hedge ineffectiveness is recorded in current period earnings. If a derivative instrument designated as a cash flow hedge ceases to be effective or is terminated, hedge accounting is discontinued and the gain or loss at that date is deferred in OCI and recognized concurrently with the related transaction. If a hedged anticipated transaction is no longer probable, the gain or loss is recognized immediately in earnings. Subsequent gains and losses from derivative instruments for which hedge accounting has been discontinued are recognized in earnings in the period in which they occur. Fair Value Hedges The Company may use fair value hedges to hedge the fair value of debt instruments or commodity positions. The change in the fair value of the hedging instrument is recorded in earnings with changes in the fair value of the hedged asset or liability that is designated as part of the hedging relationship. If a fair value hedge is discontinued or ceases to be effective, the hedged asset or liability, otherwise required to be carried at cost or amortized cost, ceases to be remeasured at fair value and the cumulative fair value adjustment to the carrying value of the hedged item is recognized in earnings over the remaining life of the hedged item. Net Investment Hedges Gains and losses arising from translation of net investment in foreign operations from their functional currencies to the Company’s Canadian dollar presentation currency are included in cumulative translation adjustments (CTA). The Company designates foreign currency derivatives and United States dollar denominated debt as hedges of net investments in United States dollar denominated foreign operations. As a result, the effective portion of the change in the fair value of the foreign currency derivatives as well as the translation of United States dollar denominated debt are reflected in OCI and any ineffectiveness is reflected in current period earnings. Amounts recognized previously in Accumulated other comprehensive income/(loss) (AOCI) are reclassified to earnings when there is a reduction of the hedged net investment resulting from disposal of a foreign operation. Classification of Derivatives The Company recognizes the fair market value of derivative instruments on the Consolidated Statements of Financial Position as current and long-term assets or liabilities depending on the timing of the settlements and the resulting cash flows associated with the instruments. Fair value amounts related to cash flows occurring beyond one year are classified as non-current. Cash inflows and outflows related to derivative instruments are classified as Operating activities on the Consolidated Statements of Cash Flows.
15
Balance Sheet Offset Assets and liabilities arising from derivative instruments may be offset in the Consolidated Statements of Financial Position when the Company has the legal right and intention to settle them on a net basis. Transaction Costs Transaction costs are incremental costs directly related to the acquisition of a financial asset or the issuance of a financial liability. The Company incurs transaction costs primarily from the issuance of debt and classifies these costs as Deferred amounts and other assets. These costs are amortized using the effective interest rate method over the life of the related debt instrument. EQUITY INVESTMENTS Equity investments over which the Company exercises significant influence, but does not have controlling financial interests, are accounted for using the equity method. Equity investments are initially measured at cost and are adjusted for the Company’s proportionate share of undistributed equity earnings or loss. Equity investments are increased for contributions made to and decreased for distributions received from the investees. To the extent an equity investee undertakes activities necessary to commence its planned principal operations, the Company capitalizes interest costs associated with its investment during such period. RESTRICTED LONG-TERM INVESTMENTS Long-term investments that are restricted as to withdrawal or usage, for the purposes of the NEB’s LMCI, are presented as Restricted long-term investments on the Consolidated Statements of Financial Position. OTHER INVESTMENTS Generally, the Company classifies equity investments in entities over which it does not exercise significant influence and that do not trade on an actively quoted market as other investments carried at cost. Financial assets in this category are initially recorded at fair value with no subsequent re-measurement. Any investments which do trade on an active market are classified as available for sale investments measured at fair value through OCI. Dividends received from investments carried at cost are recognized in earnings when the right to receive payment is established. NONCONTROLLING INTERESTS Noncontrolling interests represent ownership interests attributable to third parties in certain consolidated subsidiaries, limited partnerships and VIEs. The portion of equity not owned by the Company in such entities is reflected as noncontrolling interests within the equity section of the Consolidated Statements of Financial Position and, in the case of redeemable noncontrolling interests, within the mezzanine section of the Consolidated Statements of Financial Position between long-term liabilities and equity. The Fund’s noncontrolling interest holders have the option to redeem the Fund trust units for cash, subject to certain limitations. Redeemable noncontrolling interests are recognized at the maximum redemption value of the trust units held by third parties, which references the market price of ENF common shares. On a quarterly basis, changes in estimated redemption values are reflected as a charge or credit to retained earnings. The use of the HLBV method by ECT impacts the earnings attributable to redeemable noncontrolling interests reported on Enbridge’s Consolidated Statements of Earnings. INCOME TAXES The liability method of accounting for income taxes is followed. Deferred income tax assets and liabilities are recorded based on temporary differences between the tax bases of assets and liabilities and their carrying values for accounting purposes. Deferred income tax assets and liabilities are measured using the tax rate that is expected to apply when the temporary differences reverse. For the Company’s regulated operations, a deferred income tax liability is recognized with a corresponding regulatory asset to the extent taxes can be recovered through rates. Any interest and/or penalty incurred related to tax is reflected in Income taxes.

16
FOREIGN CURRENCY TRANSACTIONS AND TRANSLATION
Foreign currency transactions are those transactions whose terms are denominated in a currency other
than the currency of the primary economic environment in which the Company or a reporting subsidiary
operates, referred to as the functional currency. Transactions denominated in foreign currencies are translated into the functional currency using the exchange rate prevailing at the date of transaction.
Monetary assets and liabilities denominated in foreign currencies are translated to the functional currency
using the rate of exchange in effect at the balance sheet date. Exchange gains and losses resulting from
translation of monetary assets and liabilities are included in the Consolidated Statements of Earnings in
the period in which they arise.
Gains and losses arising from translation of foreign operations’ functional currencies to the Company’s
Canadian dollar presentation currency are included in the CTA component of AOCI and are recognized in
earnings upon sale of the foreign operation. Asset and liability accounts are translated at the exchange
rates in effect on the balance sheet date, while revenues and expenses are translated using monthly
average exchange rates. CASH AND CASH EQUIVALENTS Cash and cash equivalents include short-term investments with a term to maturity of three months or less when purchased. RESTRICTED CASH Cash and cash equivalents that are restricted as to withdrawal or usage, in accordance with specific commercial arrangements, are presented as Restricted cash on the Consolidated Statements of Financial Position. LOANS AND RECEIVABLES Affiliate long-term notes receivable are measured at amortized cost using the effective interest rate method, net of any impairment losses recognized. Accounts receivable and other are measured at cost. ALLOWANCE FOR DOUBTFUL ACCOUNTS Allowance for doubtful accounts is determined based on collection history. When the Company has determined that further collection efforts are unlikely to be successful, amounts charged to the allowance for doubtful accounts are applied against the impaired accounts receivable. INVENTORY Inventory is comprised of natural gas in storage held in EGD and crude oil and natural gas held primarily by energy services businesses in the Gas Pipelines, Processing and Energy Services and Sponsored Investments segments. Natural gas in storage in EGD is recorded at the quarterly prices approved by the OEB in the determination of distribution rates. The actual price of gas purchased may differ from the OEB approved price. The difference between the approved price and the actual cost of the gas purchased is deferred as a liability for future refund or as an asset for collection as approved by the OEB. Other commodities inventory is recorded at the lower of cost, as determined on a weighted average basis, or market value. Upon disposition, other commodities inventory is recorded to Commodity costs on the Consolidated Statements of Earnings at the weighted average cost of inventory, including any adjustments recorded to reduce inventory to market value. PROPERTY, PLANT AND EQUIPMENT Property, plant and equipment is recorded at historical cost. Expenditures for construction, expansion, major renewals and betterments are capitalized. Maintenance and repair costs are expensed as incurred. Expenditures for project development are capitalized if they are expected to have future benefit. The Company capitalizes interest incurred during construction for non rate-regulated assets. For rate-regulated assets, AFUDC is included in the cost of property, plant and equipment and is depreciated over future periods as part of the total cost of the related asset. AFUDC includes both an interest component and, if approved by the regulator, a cost of equity component.
17
Two primary methods of depreciation are utilized. For distinct assets, depreciation is generally provided on a straight-line basis over the estimated useful lives of the assets commencing when the asset is placed in service. For largely homogeneous groups of assets with comparable useful lives, the pool method of accounting for property, plant and equipment is followed whereby similar assets are grouped and depreciated as a pool. When group assets are retired or otherwise disposed of, gains and losses are not reflected in earnings but are booked as an adjustment to accumulated depreciation. DEFERRED AMOUNTS AND OTHER ASSETS Deferred amounts and other assets primarily include: costs which regulatory authorities have permitted, or are expected to permit, to be recovered through future rates including deferred income taxes; contractual receivables under the terms of long-term delivery contracts; derivative financial instruments; and deferred financing costs. Deferred financing costs are amortized using the effective interest method over the term of the related debt and are recorded in Interest expense. INTANGIBLE ASSETS Intangible assets consist primarily of certain software costs, natural gas supply opportunities, acquired power purchase agreements, land leases and permits. The Company capitalizes costs incurred during the application development stage of internal use software projects. Natural gas supply opportunities are growth opportunities, identified upon acquisition, present in gas producing zones where certain of EEP’s gas systems are located. Intangible assets are amortized on a straight-line basis over their expected lives, commencing when the asset is available for use. GOODWILL Goodwill represents the excess of the purchase price over the fair value of net identifiable assets on acquisition of a business. The carrying value of goodwill, which is not amortized, is assessed for impairment annually, or more frequently if events or changes in circumstances arise that suggest the carrying value of goodwill may be impaired. For the purposes of impairment testing, reporting units are identified as business operations within an operating segment. The Company has the option to first assess qualitative factors to determine whether it is necessary to perform the two-step goodwill impairment test. If the two-step goodwill impairment test is performed, the first step involves determining the fair value of the Company’s reporting units inclusive of goodwill and comparing those values to the carrying value of each reporting unit. If the carrying value of a reporting unit, including allocated goodwill, exceeds its fair value, goodwill impairment is measured as the excess of the carrying amount of the reporting unit’s allocated goodwill over the implied fair value of the goodwill based on the fair value of the reporting unit’s assets and liabilities. IMPAIRMENT The Company reviews the carrying values of its long-lived assets as events or changes in circumstances warrant. If it is determined that the carrying value of an asset exceeds the undiscounted cash flows expected from the asset, the asset is written down to fair value. With respect to investments in debt and equity securities, the Company assesses at each balance sheet date whether there is objective evidence that a financial asset is impaired by completing a quantitative or qualitative analysis of factors impacting the investment. If there is determined to be objective evidence of impairment, the Company internally values the expected discounted cash flows using observable market inputs and determines whether the decline below carrying value is other than temporary. If the decline is determined to be other than temporary, an impairment charge is recorded in earnings with an offsetting reduction to the carrying value of the asset. With respect to other financial assets, the Company assesses the assets for impairment when it no longer has reasonable assurance of timely collection. If evidence of impairment is noted, the Company reduces the value of the financial asset to its estimated realizable amount, determined using discounted expected future cash flows.
18
ASSET RETIREMENT OBLIGATIONS ARO associated with the retirement of long-lived assets are measured at fair value and recognized as Accounts payable and other or Other long-term liabilities in the period in which they can be reasonably determined. The fair value approximates the cost a third party would charge to perform the tasks necessary to retire such assets and is recognized at the present value of expected future cash flows. ARO are added to the carrying value of the associated asset and depreciated over the asset’s useful life. The corresponding liability is accreted over time through charges to earnings and is reduced by actual costs of decommissioning and reclamation. The Company’s estimates of retirement costs could change as a result of changes in cost estimates and regulatory requirements. For the majority of the Company’s assets, it is not possible to make a reasonable estimate of ARO due to the indeterminate timing and scope of the asset retirements. RETIREMENT AND POSTRETIREMENT BENEFITS The Company maintains pension plans which provide defined benefit and defined contribution pension benefits. Defined benefit pension plan costs are determined using actuarial methods and are funded through contributions determined using the projected benefit method, which incorporates management’s best estimates of future salary levels, other cost escalations, retirement ages of employees and other actuarial factors including discount rates and mortality. In 2014, new mortality tables were issued by the Society of Actuaries in the United States which were further revised in 2015. These tables, along with the Canadian Institute of Actuaries tables that were revised in 2013, were used by the Company for measurement of its benefit obligations of its United States pension plan (the United States Plan) and the Canadian pension plans (the Canadian Plans), respectively. The Company determines discount rates by reference to rates of high-quality long-term corporate bonds with maturities that approximate the timing of future payments the Company anticipates making under each of the respective plans. Pension cost is charged to earnings and includes:
Cost of pension plan benefits provided in exchange for employee services rendered during the year;
Interest cost of pension plan obligations;
Expected return on pension plan assets;
Amortization of the prior service costs and amendments on a straight-line basis over the expected average remaining service period of the active employee group covered by the plans; and
Amortization of cumulative unrecognized net actuarial gains and losses in excess of 10% of the greater of the accrued benefit obligation or the fair value of plan assets, over the expected average remaining service life of the active employee group covered by the plans.
Actuarial gains and losses arise from the difference between the actual and expected rate of return on plan assets for that period or from changes in actuarial assumptions used to determine the accrued benefit obligation, including discount rate, changes in headcount or salary inflation experience. Pension plan assets are measured at fair value. The expected return on pension plan assets is determined using market related values and assumptions on the specific invested asset mix within the pension plans. The market related values reflect estimated return on investments consistent with long-term historical averages for similar assets. For defined contribution plans, contributions made by the Company are expensed in the period in which the contribution occurs. The Company also provides OPEB other than pensions, including group health care and life insurance benefits for eligible retirees, their spouses and qualified dependents. The cost of such benefits is accrued during the years in which employees render service. The overfunded or underfunded status of defined benefit pension and OPEB plans is recognized as Deferred amounts and other assets, Accounts payable and other or Other long-term liabilities, on the Consolidated Statements of Financial Position. A plan’s funded status is measured as the difference between the fair value of plan assets and the plan’s projected benefit obligation. Any unrecognized

19
actuarial gains and losses and prior service costs and credits that arise during the period are recognized as a component of OCI, net of tax. Certain regulated utility operations of the Company record regulatory adjustments to reflect the difference between pension expense and OPEB costs for accounting purposes and the pension expense and OPEB costs for ratemaking purposes. Offsetting regulatory assets or liabilities are recorded to the extent pension expense or OPEB costs are expected to be collected from or refunded to customers, respectively, in future rates. In the absence of rate regulation, regulatory balances would not be recorded and pension and OPEB costs would be charged to earnings and OCI on an accrual basis. STOCK-BASED COMPENSATION Incentive Stock Options (ISO) granted are recorded using the fair value method. Under this method, compensation expense is measured at the grant date based on the fair value of the ISO granted as calculated by the Black-Scholes-Merton model and is recognized on a straight-line basis over the shorter of the vesting period or the period to early retirement eligibility, with a corresponding credit to Additional paid-in capital. Balances in Additional paid-in capital are transferred to Share capital when the options are exercised. Performance stock options (PSO) granted are recorded using the fair value method. Under this method, compensation expense is measured at the grant date based on the fair value of the PSO granted as calculated by the Bloomberg barrier option valuation model and is recognized over the vesting period with a corresponding credit to Additional paid-in capital. The options become exercisable when both performance targets and time vesting requirements have been met. Balances in Additional paid-in capital are transferred to Share capital when the options are exercised. Performance Stock Units (PSU) and Restricted Stock Units (RSU) are cash settled awards for which the related liability is remeasured each reporting period. PSU vest at the completion of a three-year term and RSU vest at the completion of a 35-month term. During the vesting term, compensation expense is recorded based on the number of units outstanding and the current market price of the Company’s shares with an offset to Accounts payable and other or to Other long-term liabilities. The value of the PSU is also dependent on the Company’s performance relative to performance targets set out under the plan. COMMITMENTS, CONTINGENCIES AND ENVIRONMENTAL LIABILITIES The Company expenses or capitalizes, as appropriate, expenditures for ongoing compliance with environmental regulations that relate to past or current operations. The Company expenses costs incurred for remediation of existing environmental contamination caused by past operations that do not benefit future periods by preventing or eliminating future contamination. The Company records liabilities for environmental matters when assessments indicate that remediation efforts are probable and the costs can be reasonably estimated. Estimates of environmental liabilities are based on currently available facts, existing technology and presently enacted laws and regulations taking into consideration the likely effects of inflation and other factors. These amounts also consider prior experience in remediating contaminated sites, other companies’ clean-up experience and data released by government organizations. The Company’s estimates are subject to revision in future periods based on actual costs or new information and are included in Environmental liabilities and Other long-term liabilities in the Consolidated Statements of Financial Position at their undiscounted amounts. There is always a potential of incurring additional costs in connection with environmental liabilities due to variations in any or all of the categories described above, including modified or revised requirements from regulatory agencies, in addition to fines and penalties, as well as expenditures associated with litigation and settlement of claims. The Company evaluates recoveries from insurance coverage separately from the liability and, when recovery is probable, the Company records and reports an asset separately from the associated liability in the Consolidated Statements of Financial Position. Liabilities for other commitments and contingencies are recognized when, after fully analysing available information, the Company determines it is either probable that an asset has been impaired, or that a liability has been incurred, and the amount of impairment or loss can be reasonably estimated. When a range of probable loss can be estimated, the Company recognizes the most likely amount, or if no amount is more likely than another, the minimum of the range of probable loss is accrued. The Company expenses legal costs associated with loss contingencies as such costs are incurred.
20
3. CHANGES IN ACCOUNTING POLICIES ADOPTION OF NEW STANDARDS Extraordinary and Unusual Items Effective January 1, 2015, the Company retrospectively adopted Accounting Standards Update (ASU) 2015-01 which eliminates the concept of extraordinary items from U.S. GAAP. Entities will no longer be required to separately classify and present extraordinary items in the Consolidated Statements of Earnings. There was no material impact to the Company’s consolidated financial statements as a result of adopting this update. Reporting Discontinued Operations and Disclosures of Disposals of Components of an Entity Effective January 1, 2015, the Company prospectively adopted ASU 2014-08 which changes the criteria and disclosures for reporting discontinued operations. The revised criteria will in general, result in fewer transactions being categorized as discontinued operations. There was no material impact to the consolidated financial statements as a result of adopting this update. FUTURE ACCOUNTING POLICY CHANGES Recognition and Measurement of Financial Assets and Liabilities ASU 2016-01 was issued in January 2016 with the intent to address certain aspects of recognition, measurement, presentation, and disclosure of financial assets and liabilities. The amendments revise accounting related to the classification and measurement of investments in equity securities, the presentation of certain fair value changes for financial liabilities measured at fair value, and the disclosure requirements associated with the fair value of financial instruments. The Company is currently assessing the impact of the new standard on its consolidated financial statements. The accounting update is effective for fiscal years beginning after December 15, 2017, and is to be applied by means of a cumulative-effect adjustment to the Statement of Financial Position as of the beginning of the fiscal year of adoption, with amendments related to equity securities without readily determinable fair values to be applied prospectively. Classification of Deferred Taxes on the Statement of Financial Position ASU 2015-17 was issued in November 2015 with the intent to simplify the presentation of deferred income taxes. The amendments require that deferred tax liabilities and assets be classified as noncurrent in a Statement of Financial Position. The accounting update is effective for fiscal years beginning after December 15, 2016 and is to be applied on a prospective or retrospective basis. The Company is currently assessing the impact of the new standard on its consolidated financial statements. Early application is permitted for all entities as of the beginning of an interim or annual reporting period. Effective January 1, 2016, the Company will elect to early adopt ASU 2015-17. Simplifying the Accounting for Measurement-Period Adjustments in Business Combinations ASU 2015-16 was issued in September 2015 with the intent to simplify the accounting for measurement-period adjustments in business combinations. The new standard requires that an acquirer must recognize adjustments to provisional amounts that are identified during the measurement period in the reporting period in which the adjustment amounts are determined. The accounting update is effective for fiscal years beginning after December 15, 2015 and is to be applied on a prospective basis. The adoption of the pronouncement is not anticipated to have a material impact on the Company’s consolidated financial statements. Simplifying the Measurement of Inventory ASU 2015-11 was issued in July 2015 with the intent to simplify the measurement of inventory. The new standard requires inventory to be measured at the lower of cost and net realizable value and is applicable to all inventory, with the exception of inventory measured using last-in, first-out or the retail inventory method. Net realizable value is the estimated selling price in the ordinary course of business, less reasonably predictable costs of completion, disposal and transportation. The Company is currently assessing the impact of the new standard on its consolidated financial statements. The new standard is effective for annual and interim reporting periods beginning after December 15, 2016 and is to be applied on a prospective basis.
21
Measurement Date of Defined Benefit Obligation and Plan Assets ASU 2015-04 was issued in April 2015 with the intent to simplify the fair value measurement of defined benefit plan assets and obligations. For entities with a fiscal year end that does not coincide with a month end, the new standard permits an entity to measure its defined benefit plan assets and obligations using the month end that is closest to the entity’s fiscal year end. In addition, where there are significant events in an interim period that would trigger a re-measurement of the plan assets and obligations, an entity is also permitted to re-measure such assets and obligations using the month end that is closest to the date of the significant event. The accounting update is effective for financial statements issued for fiscal years beginning after December 15, 2015 and is to be applied on a prospective basis. The adoption of the pronouncement is not anticipated to have a material impact on the Company’s consolidated financial statements. Simplifying the Presentation of Debt Issuance Costs ASU 2015-03 was issued in April 2015 with the intent to simplify the presentation of debt issuance costs. The new standard requires a debt issuance cost related to a recognized debt liability to be presented in the Consolidated Statements of Financial Position as a direct deduction from the carrying amount of that debt liability, as consistent with the presentation of debt discounts or premiums. Further, ASU 2015-15 was issued in August 2015 to clarify the presentation and subsequent measurement of debt issuance costs associated with line-of-credit arrangements, whereby an entity may defer debt issuance costs as an asset and subsequently amortize them over the term of the line-of-credit. The accounting updates are effective for financial statements issued for fiscal years beginning after December 15, 2015 on a retrospective basis. The adoption of the pronouncement is not anticipated to have a material impact on the Company’s consolidated financial statements. Amendments to the Consolidation Analysis ASU 2015-02, issued in February 2015, revises the current consolidation guidance which results in a change in the determination of whether an entity consolidates certain types of legal entities. The Company is currently assessing the impact of the new standard on its consolidated financial statements. The new standard is effective for annual and interim reporting periods beginning after December 15, 2015 and may be applied on a full or modified retrospective basis. Hybrid Financial Instruments Issued in the Form of a Share ASU 2014-16 was issued in November 2014 with the intent to eliminate the use of different methods in practice in the accounting for hybrid financial instruments issued in the form of a share. The new standard clarifies the evaluation of the economic characteristics and risks of a host contract in these hybrid financial instruments. The Company does not expect the adoption of ASU 2014-16 to have a material impact on its consolidated financial statements. This accounting update is effective for annual and interim periods beginning after December 15, 2015 and is to be applied on a modified retrospective basis. Development Stage Entities ASU 2014-10, issued in June 2014, amended the consolidation guidance to eliminate the development stage entity relief when applying the VIE model and evaluating the sufficiency of equity at risk. The Company is currently evaluating the impact of the amendment to the consolidation guidance, which is effective for annual reporting periods beginning after December 15, 2015. The new standard requires these amendments be applied retrospectively. Revenue from Contracts with Customers ASU 2014-09 was issued in May 2014 with the intent of significantly enhancing comparability of revenue recognition practices across entities and industries. The new standard provides a single principles-based, five-step model to be applied to all contracts with customers and introduces new, increased disclosure requirements. The Company is currently assessing the impact of the new standard on its consolidated financial statements. In July 2015, the effective date of the new standard was delayed by one year and the new standard is now effective for annual and interim periods beginning on or after December 15, 2017 and may be applied on either a full or modified retrospective basis.
22
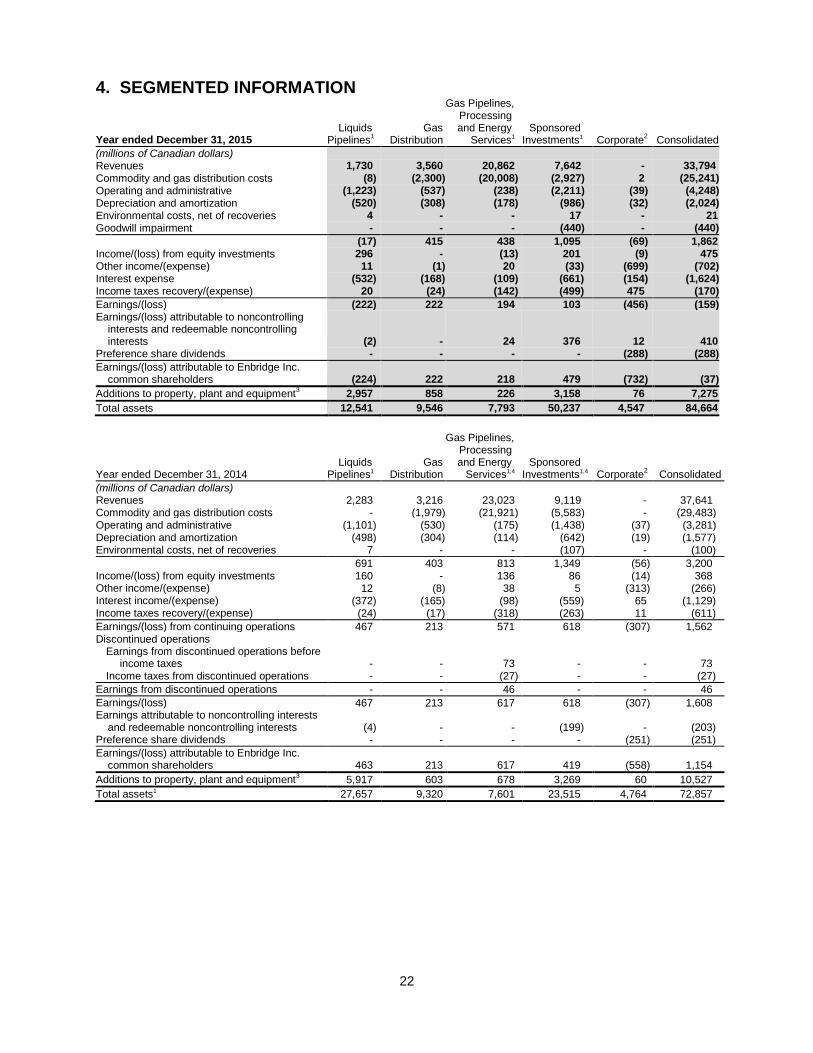
4. SEGMENTED INFORMATION
Year ended December 31, 2015 Liquids Pipelines
1 Gas Distribution
Gas Pipelines, Processing and Energy Services1
Sponsored Investments1 Corporate
2 Consolidated
(millions of Canadian dollars) Revenues 1,730 3,560 20,862 7,642 - 33,794
Commodity and gas distribution costs (8) (2,300) (20,008) (2,927) 2 (25,241)
Operating and administrative (1,223) (537) (238) (2,211) (39) (4,248)
Depreciation and amortization (520) (308) (178) (986) (32) (2,024)
Environmental costs, net of recoveries 4 - - 17 - 21
Goodwill impairment - - - (440) - (440)
(17) 415 438 1,095 (69) 1,862
Income/(loss) from equity investments 296 - (13) 201 (9) 475 Other income/(expense) 11 (1) 20 (33) (699) (702) Interest expense (532) (168) (109) (661) (154) (1,624) Income taxes recovery/(expense) 20 (24) (142) (499) 475 (170)
Earnings/(loss) (222) 222 194 103 (456) (159) Earnings/(loss) attributable to noncontrolling
interests and redeemable noncontrolling interests (2) - 24 376 12 410
Preference share dividends - - - - (288) (288)
Earnings/(loss) attributable to Enbridge Inc. common shareholders (224) 222 218 479 (732) (37)
Additions to property, plant and equipment3
2,957 858 226 3,158 76 7,275
Total assets 12,541 9,546 7,793 50,237 4,547 84,664
Year ended December 31, 2014 Liquids Pipelines1
Gas Distribution
Gas Pipelines, Processing and Energy Services1,4
Sponsored Investments1,4 Corporate
2 Consolidated
(millions of Canadian dollars) Revenues 2,283 3,216 23,023 9,119 - 37,641 Commodity and gas distribution costs - (1,979) (21,921) (5,583) - (29,483) Operating and administrative (1,101) (530) (175) (1,438) (37) (3,281) Depreciation and amortization (498) (304) (114) (642) (19) (1,577) Environmental costs, net of recoveries 7 - - (107) - (100)
691 403 813 1,349 (56) 3,200 Income/(loss) from equity investments 160 - 136 86 (14) 368 Other income/(expense) 12 (8) 38 5 (313) (266) Interest income/(expense) (372) (165) (98) (559) 65 (1,129) Income taxes recovery/(expense) (24) (17) (318) (263) 11 (611)
Earnings/(loss) from continuing operations 467 213 571 618 (307) 1,562 Discontinued operations
Earnings from discontinued operations before income taxes - - 73 - - 73
Income taxes from discontinued operations - - (27) - - (27)
Earnings from discontinued operations - - 46 - - 46
Earnings/(loss) 467 213 617 618 (307) 1,608 Earnings attributable to noncontrolling interests
and redeemable noncontrolling interests (4) - - (199) - (203) Preference share dividends - - - - (251) (251)
Earnings/(loss) attributable to Enbridge Inc. common shareholders 463 213 617 419 (558) 1,154
Additions to property, plant and equipment3
5,917 603 678 3,269 60 10,527
Total assets1 27,657 9,320 7,601 23,515 4,764 72,857
23
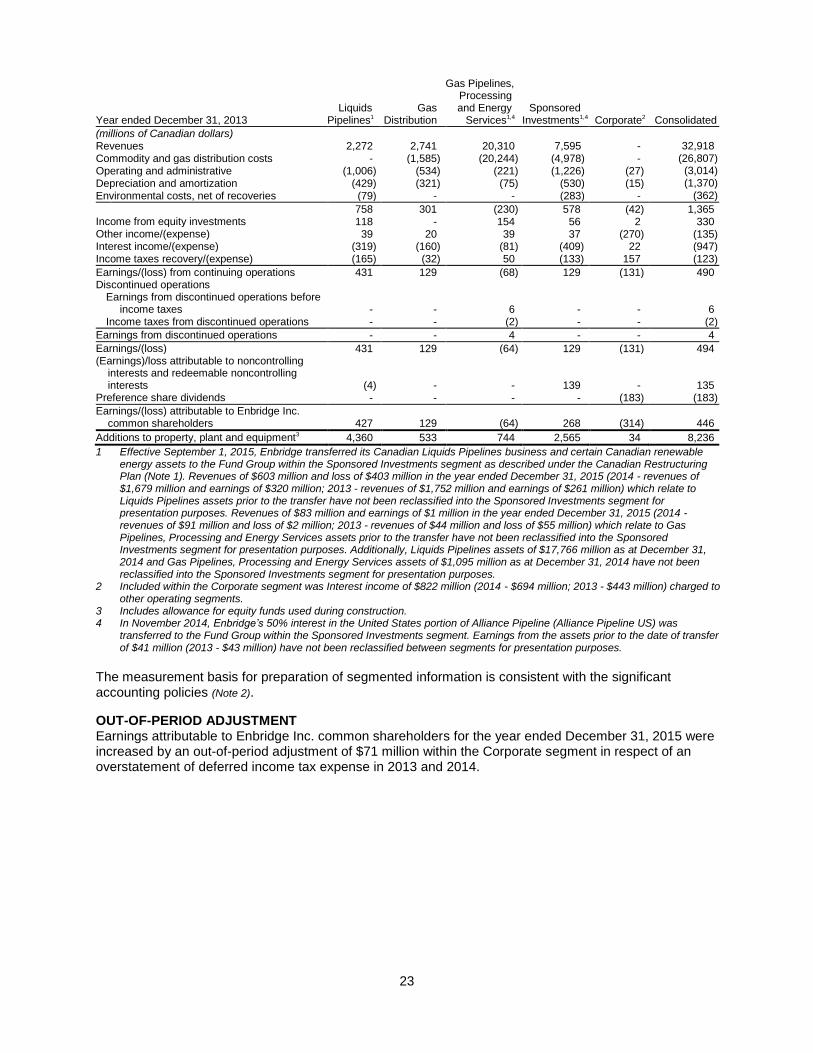
Year ended December 31, 2013 Liquids Pipelines1
Gas Distribution
Gas Pipelines, Processing and Energy Services1,4
Sponsored Investments1,4 Corporate2 Consolidated
(millions of Canadian dollars) Revenues 2,272 2,741 20,310 7,595 - 32,918
Commodity and gas distribution costs - (1,585) (20,244) (4,978) - (26,807)
Operating and administrative (1,006) (534) (221) (1,226) (27) (3,014)
Depreciation and amortization (429) (321) (75) (530) (15) (1,370)
Environmental costs, net of recoveries (79) - - (283) - (362)
758 301 (230) 578 (42) 1,365 Income from equity investments 118 - 154 56 2 330 Other income/(expense) 39 20 39 37 (270) (135) Interest income/(expense) (319) (160) (81) (409) 22 (947) Income taxes recovery/(expense) (165) (32) 50 (133) 157 (123)
Earnings/(loss) from continuing operations 431 129 (68) 129 (131) 490 Discontinued operations
Earnings from discontinued operations before income taxes - - 6 - - 6
Income taxes from discontinued operations - - (2) - - (2)
Earnings from discontinued operations - - 4 - - 4
Earnings/(loss) 431 129 (64) 129 (131) 494 (Earnings)/loss attributable to noncontrolling
interests and redeemable noncontrolling interests (4) - - 139 - 135
Preference share dividends - - - - (183) (183)
Earnings/(loss) attributable to Enbridge Inc. common shareholders 427 129 (64) 268 (314) 446
Additions to property, plant and equipment3 4,360 533 744 2,565 34 8,236
1 Effective September 1, 2015, Enbridge transferred its Canadian Liquids Pipelines business and certain Canadian renewable energy assets to the Fund Group within the Sponsored Investments segment as described under the Canadian Restructuring Plan (Note 1). Revenues of $603 million and loss of $403 million in the year ended December 31, 2015 (2014 - revenues of $1,679 million and earnings of $320 million; 2013 - revenues of $1,752 million and earnings of $261 million) which relate to Liquids Pipelines assets prior to the transfer have not been reclassified into the Sponsored Investments segment for presentation purposes. Revenues of $83 million and earnings of $1 million in the year ended December 31, 2015 (2014 - revenues of $91 million and loss of $2 million; 2013 - revenues of $44 million and loss of $55 million) which relate to Gas Pipelines, Processing and Energy Services assets prior to the transfer have not been reclassified into the Sponsored Investments segment for presentation purposes. Additionally, Liquids Pipelines assets of $17,766 million as at December 31, 2014 and Gas Pipelines, Processing and Energy Services assets of $1,095 million as at December 31, 2014 have not been reclassified into the Sponsored Investments segment for presentation purposes.
2 Included within the Corporate segment was Interest income of $822 million (2014 - $694 million; 2013 - $443 million) charged to other operating segments.
3 Includes allowance for equity funds used during construction. 4 In November 2014, Enbridge’s 50% interest in the United States portion of Alliance Pipeline (Alliance Pipeline US) was
transferred to the Fund Group within the Sponsored Investments segment. Earnings from the assets prior to the date of transfer of $41 million (2013 - $43 million) have not been reclassified between segments for presentation purposes.
The measurement basis for preparation of segmented information is consistent with the significant accounting policies (Note 2).
OUT-OF-PERIOD ADJUSTMENT Earnings attributable to Enbridge Inc. common shareholders for the year ended December 31, 2015 were increased by an out-of-period adjustment of $71 million within the Corporate segment in respect of an overstatement of deferred income tax expense in 2013 and 2014.
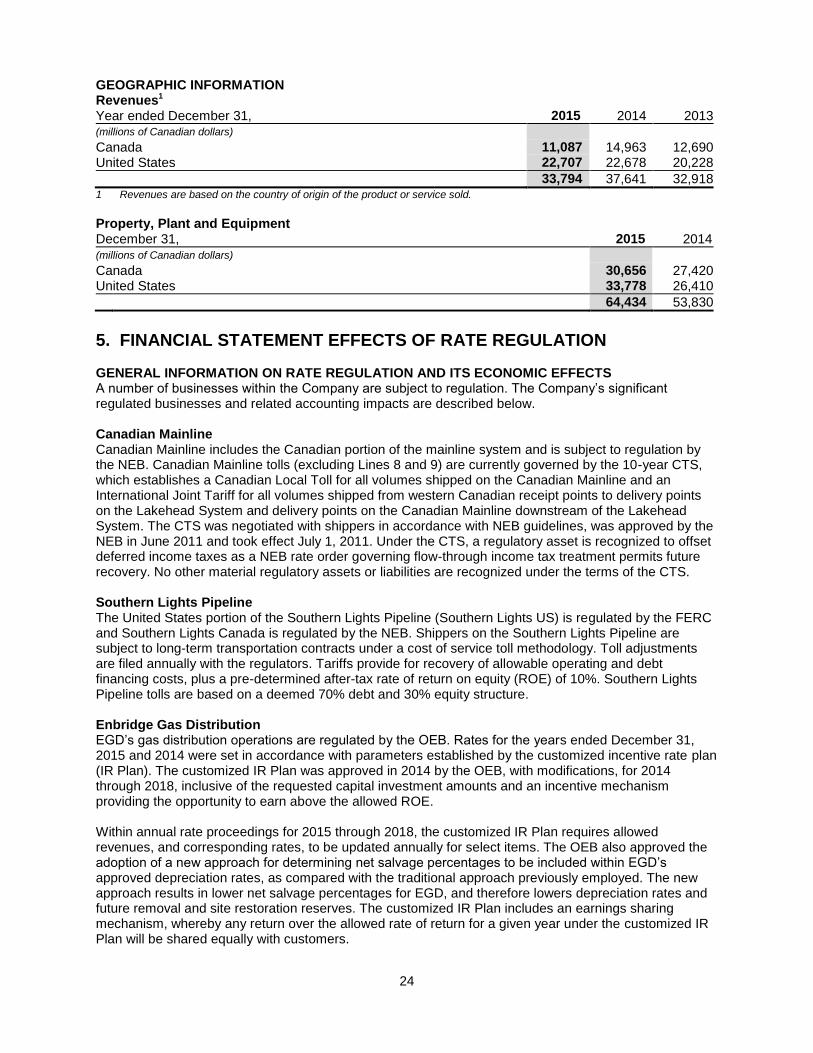
24
GEOGRAPHIC INFORMATION Revenues1
Year ended December 31,
2015 2014 2013
(millions of Canadian dollars)
Canada 11,087 14,963 12,690 United States
22,707 22,678 20,228
33,794 37,641 32,918 1 Revenues are based on the country of origin of the product or service sold.
Property, Plant and Equipment December 31,
2015 2014
(millions of Canadian dollars)
Canada 30,656 27,420
United States 33,778 26,410
64,434 53,830
5. FINANCIAL STATEMENT EFFECTS OF RATE REGULATION GENERAL INFORMATION ON RATE REGULATION AND ITS ECONOMIC EFFECTS A number of businesses within the Company are subject to regulation. The Company’s significant regulated businesses and related accounting impacts are described below. Canadian Mainline Canadian Mainline includes the Canadian portion of the mainline system and is subject to regulation by the NEB. Canadian Mainline tolls (excluding Lines 8 and 9) are currently governed by the 10-year CTS, which establishes a Canadian Local Toll for all volumes shipped on the Canadian Mainline and an International Joint Tariff for all volumes shipped from western Canadian receipt points to delivery points on the Lakehead System and delivery points on the Canadian Mainline downstream of the Lakehead System. The CTS was negotiated with shippers in accordance with NEB guidelines, was approved by the NEB in June 2011 and took effect July 1, 2011. Under the CTS, a regulatory asset is recognized to offset deferred income taxes as a NEB rate order governing flow-through income tax treatment permits future recovery. No other material regulatory assets or liabilities are recognized under the terms of the CTS. Southern Lights Pipeline The United States portion of the Southern Lights Pipeline (Southern Lights US) is regulated by the FERC and Southern Lights Canada is regulated by the NEB. Shippers on the Southern Lights Pipeline are subject to long-term transportation contracts under a cost of service toll methodology. Toll adjustments are filed annually with the regulators. Tariffs provide for recovery of allowable operating and debt financing costs, plus a pre-determined after-tax rate of return on equity (ROE) of 10%. Southern Lights Pipeline tolls are based on a deemed 70% debt and 30% equity structure. Enbridge Gas Distribution EGD’s gas distribution operations are regulated by the OEB. Rates for the years ended December 31, 2015 and 2014 were set in accordance with parameters established by the customized incentive rate plan (IR Plan). The customized IR Plan was approved in 2014 by the OEB, with modifications, for 2014 through 2018, inclusive of the requested capital investment amounts and an incentive mechanism providing the opportunity to earn above the allowed ROE. Within annual rate proceedings for 2015 through 2018, the customized IR Plan requires allowed revenues, and corresponding rates, to be updated annually for select items. The OEB also approved the adoption of a new approach for determining net salvage percentages to be included within EGD’s approved depreciation rates, as compared with the traditional approach previously employed. The new approach results in lower net salvage percentages for EGD, and therefore lowers depreciation rates and future removal and site restoration reserves. The customized IR Plan includes an earnings sharing mechanism, whereby any return over the allowed rate of return for a given year under the customized IR Plan will be shared equally with customers.
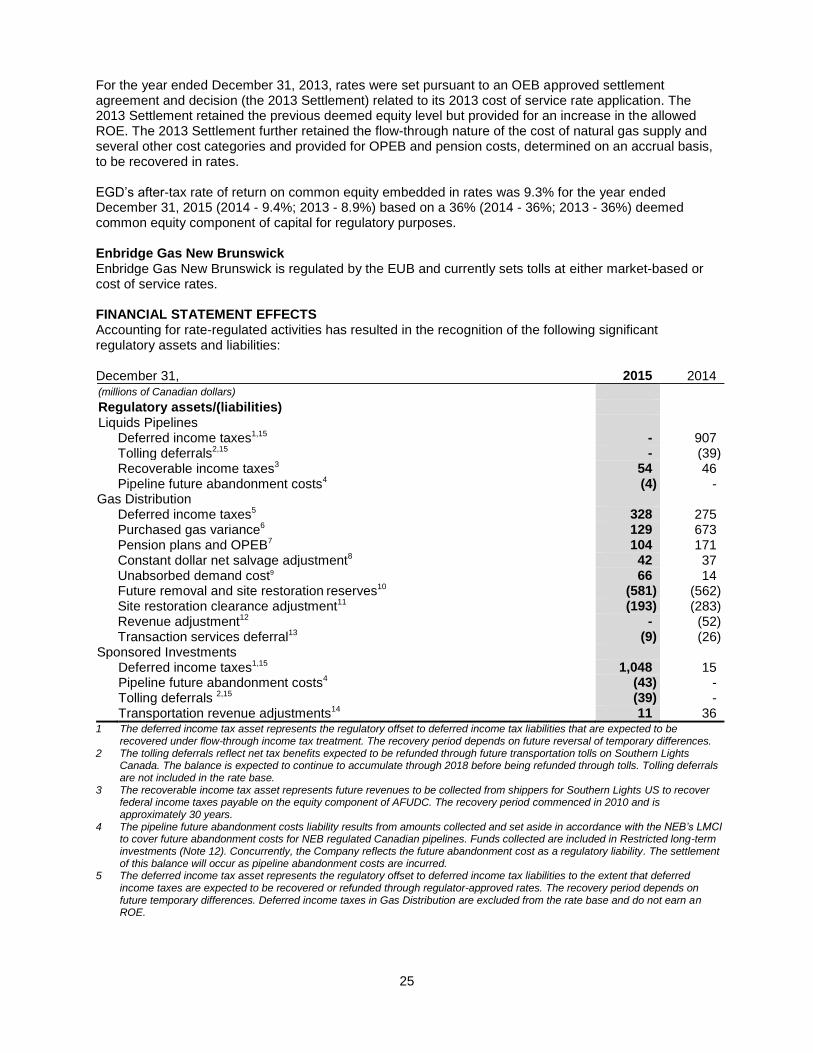
25
For the year ended December 31, 2013, rates were set pursuant to an OEB approved settlement agreement and decision (the 2013 Settlement) related to its 2013 cost of service rate application. The 2013 Settlement retained the previous deemed equity level but provided for an increase in the allowed ROE. The 2013 Settlement further retained the flow-through nature of the cost of natural gas supply and several other cost categories and provided for OPEB and pension costs, determined on an accrual basis, to be recovered in rates. EGD’s after-tax rate of return on common equity embedded in rates was 9.3% for the year ended December 31, 2015 (2014 - 9.4%; 2013 - 8.9%) based on a 36% (2014 - 36%; 2013 - 36%) deemed common equity component of capital for regulatory purposes. Enbridge Gas New Brunswick Enbridge Gas New Brunswick is regulated by the EUB and currently sets tolls at either market-based or cost of service rates. FINANCIAL STATEMENT EFFECTS Accounting for rate-regulated activities has resulted in the recognition of the following significant regulatory assets and liabilities: December 31,
2015 2014
(millions of Canadian dollars)
Regulatory assets/(liabilities)
Liquids Pipelines
Deferred income taxes1,15 - 907 Tolling deferrals2,15
- (39) Recoverable income taxes3
54 46 Pipeline future abandonment costs4 (4) -
Gas Distribution
Deferred income taxes5
328 275 Purchased gas variance6
129 673 Pension plans and OPEB7
104 171 Constant dollar net salvage adjustment8
42 37 Unabsorbed demand cost9 66 14
Future removal and site restoration reserves10 (581) (562)
Site restoration clearance adjustment11 (193) (283)
Revenue adjustment12 - (52)
Transaction services deferral13 (9) (26)
Sponsored Investments
Deferred income taxes1,15 1,048 15 Pipeline future abandonment costs4 (43) - Tolling deferrals 2,15 (39) - Transportation revenue adjustments14 11 36
1 The deferred income tax asset represents the regulatory offset to deferred income tax liabilities that are expected to be recovered under flow-through income tax treatment. The recovery period depends on future reversal of temporary differences.
2 The tolling deferrals reflect net tax benefits expected to be refunded through future transportation tolls on Southern Lights Canada. The balance is expected to continue to accumulate through 2018 before being refunded through tolls. Tolling deferrals are not included in the rate base.
3 The recoverable income tax asset represents future revenues to be collected from shippers for Southern Lights US to recover federal income taxes payable on the equity component of AFUDC. The recovery period commenced in 2010 and is approximately 30 years.
4 The pipeline future abandonment costs liability results from amounts collected and set aside in accordance with the NEB’s LMCI to cover future abandonment costs for NEB regulated Canadian pipelines. Funds collected are included in Restricted long-term investments (Note 12). Concurrently, the Company reflects the future abandonment cost as a regulatory liability. The settlement of this balance will occur as pipeline abandonment costs are incurred.
5 The deferred income tax asset represents the regulatory offset to deferred income tax liabilities to the extent that deferred income taxes are expected to be recovered or refunded through regulator-approved rates. The recovery period depends on future temporary differences. Deferred income taxes in Gas Distribution are excluded from the rate base and do not earn an ROE.

26
6 The purchased gas variance (PGVA) balance represents the difference between the actual cost and the approved cost of natural gas reflected in rates. EGD has been granted OEB approval to refund this balance to, or to collect this balance from, customers on a rolling 12 month basis via the Quarterly Rate Adjustment Mechanism process. In May 2014, the OEB issued a decision allowing a portion of the PGVA as at June 30, 2014 to be recovered over a 24-month period from July 1, 2014 to June 30, 2016.
7 The pension plans and OPEB balances represent the regulatory offset to pension plan and OPEB obligations to the extent the amounts are expected to be collected from customers in future rates. An OPEB balance of $89 million is being collected over a 20-year period that commenced in 2013. The balance at December 31, 2015 was $75 million (2014 - $84 million). The settlement period for the pension regulatory asset is not determinable. The balances are excluded from the rate base and do not earn an ROE.
8 The constant dollar net salvage adjustment represents the cumulative variance between the amount proposed for clearance and the actual amount cleared, relating specifically to the Site restoration adjustment. Any residual balance at the end of 2018 will be cleared in a post 2018 true up.
9 The unabsorbed demand cost deferral represents the actual cost consequences of unutilized transportation capacity contracted by EGD to meet increased requirements resulting from the Peak Gas Design Day Criteria (PGDDC). EGD updated its PGDDC in 2013 and 2014 and the impact of this update was phased in equally over the two years.
10 The future removal and site restoration reserves balance results from amounts collected from customers by certain businesses, with the approval of the regulator, to fund future costs for removal and site restoration relating to property, plant and equipment. These costs are collected as part of depreciation charged on property, plant and equipment. The balance represents the amount that has been collected from customers, net of actual costs expended on removal and site restoration. The settlement of this balance will occur as future removal and site restoration costs are incurred.
11 The site restoration clearance adjustment represents the amount determined by the OEB of previously collected costs for future removal and site restoration that is considered to be in excess of future requirements and will be refunded to customers over the term of the customized IR Plan. This was a result of the OEB’s approval of the adoption of a new approach for determining net salvage percentages. The new approach resulted in lower depreciation rates and lower future removal and site restoration reserves.
12 The revenue adjustment represents the revenue variance between interim rates, which were in place from January 1, 2014 to September 30, 2014, and the final OEB approved 2014 rates, which were implemented on October 1, 2014, but effective January 1, 2014. The revenue adjustment balance is the 2014 OEB approved revenue adjustment amount that was refunded to customers in January 2015.
13 The transaction services deferral represents the customer portion of additional earnings generated from optimization of storage and pipeline capacity. The balance is expected to be refunded to customers in the following year.
14 The transportation revenue adjustments are the cumulative differences between actual expenses incurred and estimated expenses included in transportation tolls. Transportation revenue adjustments are not included in the rate base. The recovery period is approximately five years, commencing with tolls filed and in effect on January 1, 2015, and dependent on shipper throughput levels.
15 Effective September 1, 2015, Enbridge transferred its Canadian Liquids Pipelines business and certain Canadian renewable energy assets to the Fund Group within the Sponsored Investments segment as described under the Canadian Restructuring Plan (Note 1). Liquids Pipelines regulatory assets of $907 million and regulatory liabilities of $39 million as at December 31, 2014 have not been reclassified into the Sponsored Investments segment for presentation purposes.
OTHER ITEMS AFFECTED BY RATE REGULATION Allowance for Funds Used During Construction and Other Capitalized Costs Under the pool method prescribed by certain regulators, it is not possible to identify the carrying value of the equity component of AFUDC or its effect on depreciation. Similarly, gains and losses on the retirement of certain specific fixed assets in any given year cannot be identified or quantified. Operating Cost Capitalization With the approval of regulators, certain operations capitalize a percentage of specified operating costs. These operations are authorized to charge depreciation and earn a return on the net book value of such capitalized costs in future years. In the absence of rate regulation, a portion of such operating costs would be charged to earnings in the year incurred. EGD entered into a consulting contract relating to asset management initiatives. The majority of the costs, primarily consulting fees, are being capitalized to gas mains in accordance with regulatory approval. At December 31, 2015, cumulative costs relating to this consulting contract of $179 million (2014 - $166 million) were included in Property, plant and equipment and are being depreciated over the average service life of 25 years. In the absence of rate regulation, some of these costs would be charged to earnings in the year incurred.
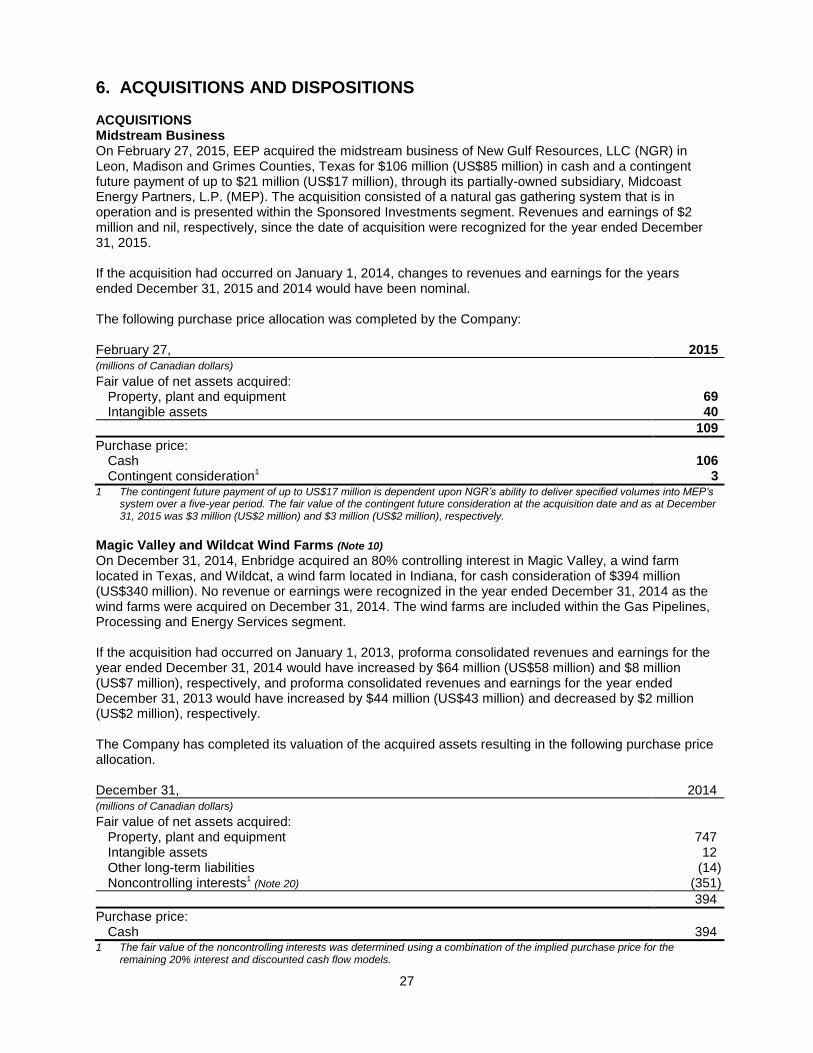
27
6. ACQUISITIONS AND DISPOSITIONS ACQUISITIONS Midstream Business On February 27, 2015, EEP acquired the midstream business of New Gulf Resources, LLC (NGR) in Leon, Madison and Grimes Counties, Texas for $106 million (US$85 million) in cash and a contingent future payment of up to $21 million (US$17 million), through its partially-owned subsidiary, Midcoast Energy Partners, L.P. (MEP). The acquisition consisted of a natural gas gathering system that is in operation and is presented within the Sponsored Investments segment. Revenues and earnings of $2 million and nil, respectively, since the date of acquisition were recognized for the year ended December 31, 2015. If the acquisition had occurred on January 1, 2014, changes to revenues and earnings for the years ended December 31, 2015 and 2014 would have been nominal. The following purchase price allocation was completed by the Company: February 27, 2015 (millions of Canadian dollars) Fair value of net assets acquired:
Property, plant and equipment 69 Intangible assets 40
109
Purchase price: Cash 106 Contingent consideration1 3
1 The contingent future payment of up to US$17 million is dependent upon NGR’s ability to deliver specified volumes into MEP’s system over a five-year period. The fair value of the contingent future consideration at the acquisition date and as at December 31, 2015 was $3 million (US$2 million) and $3 million (US$2 million), respectively.
Magic Valley and Wildcat Wind Farms (Note 10) On December 31, 2014, Enbridge acquired an 80% controlling interest in Magic Valley, a wind farm located in Texas, and Wildcat, a wind farm located in Indiana, for cash consideration of $394 million (US$340 million). No revenue or earnings were recognized in the year ended December 31, 2014 as the wind farms were acquired on December 31, 2014. The wind farms are included within the Gas Pipelines, Processing and Energy Services segment. If the acquisition had occurred on January 1, 2013, proforma consolidated revenues and earnings for the year ended December 31, 2014 would have increased by $64 million (US$58 million) and $8 million (US$7 million), respectively, and proforma consolidated revenues and earnings for the year ended December 31, 2013 would have increased by $44 million (US$43 million) and decreased by $2 million (US$2 million), respectively. The Company has completed its valuation of the acquired assets resulting in the following purchase price allocation. December 31, 2014 (millions of Canadian dollars) Fair value of net assets acquired:
Property, plant and equipment 747 Intangible assets 12 Other long-term liabilities (14) Noncontrolling interests1
(Note 20) (351)
394
Purchase price: Cash 394
1 The fair value of the noncontrolling interests was determined using a combination of the implied purchase price for the remaining 20% interest and discounted cash flow models.
28
OTHER ACQUISITIONS In November 2015, the Company acquired a 100% interest in the 103-megawatt (MW) New Creek Wind Project (New Creek) for cash consideration of $48 million (US$36 million), with $35 million (US$26 million) of the purchase price allocated to Property, plant and equipment and the remainder allocated to Intangible assets. New Creek is targeted to be in service in December 2016. In December 2014, the Company acquired an incremental 30% interest in the Massif du Sud Wind Project (Massif du Sud) for cash consideration of $102 million, bringing its total interest in the wind project to 80%. The Company acquired its original 50% interest in Massif du Sud in December 2012. The Company’s interest in Massif du Sud represents an undivided interest, with $97 million of the incremental purchase allocated to Property, plant and equipment and the remainder allocated to Intangible assets. Massif du Sud is operational. In October 2014, the Company acquired an incremental 17.5% interest in the Lac Alfred Wind Project (Lac Alfred) for cash consideration of $121 million, bringing its total interest in the wind project to 67.5%. The Company acquired its original 50% interest in Lac Alfred in December 2011. The Company’s interest in Lac Alfred represents an undivided interest, with $115 million of the incremental purchase allocated to Property, plant and equipment and the remainder allocated to Intangible assets. Lac Alfred is operational. In July 2013, the Company acquired a 50% undivided interest in the Saint Robert Bellarmin Wind Project (Saint Robert) for a purchase price of $106 million, of which $100 million was allocated to Property, plant and equipment, with the remainder allocated to Intangible assets. Saint Robert is operational. The Massif du Sud, Lac Alfred and Saint Robert wind projects were presented within the Gas Pipelines, Processing and Energy Services segment until August 31, 2015. Effective September 1, 2015, under the Canadian Restructuring Plan (Note 1), Enbridge transferred these wind projects to the Fund Group. These wind assets are reported within the Sponsored Investments segment from the date of the transfer. OTHER DISPOSITIONS In August 2015, the Company sold its 77.8% controlling interest in the Frontier Pipeline Company, which holds pipeline assets located in the midwest United States, to unrelated parties for gross proceeds of $112 million (US$85 million). A gain of $70 million (US$53 million) was presented within Other expense on the Consolidated Statements of Earnings. These amounts are included within the Liquids Pipelines segment. In May 2015, the Fund sold certain of its crude oil pipeline system assets to an unrelated party for gross proceeds of $26 million. A gain of $22 million was presented within Other expense on the Consolidated Statements of Earnings. In November 2014, the Company sold one of its non-core assets within Enbridge Offshore Pipelines (Offshore), which include pipeline facilities located in Louisiana, to an unrelated party for $7 million (US$7 million). A gain of $22 million (US$19 million) was presented within Other expense on the Consolidated Statements of Earnings. In July 2014, the Company sold a 35% equity interest in the Southern Access Extension Project, a pipeline project then under construction, to an unrelated party for gross proceeds of $73 million (US$68 million). As the fair value of the consideration received equalled the carrying value of the asset sold, no gain or loss was recognized on the sale (Note 11). In March 2014, the Company sold an Alternative and Emerging Technologies investment within the Corporate segment to an unrelated party for $19 million. A gain of $16 million was presented within Other expense on the Consolidated Statements of Earnings. In November 2013, EEP sold one of its non-core liquids assets, a storage facility in Kansas, to an unrelated party for $41 million (US$40 million). A gain of $18 million (US$17 million) was presented within Other expense on the Consolidated Statements of Earnings.
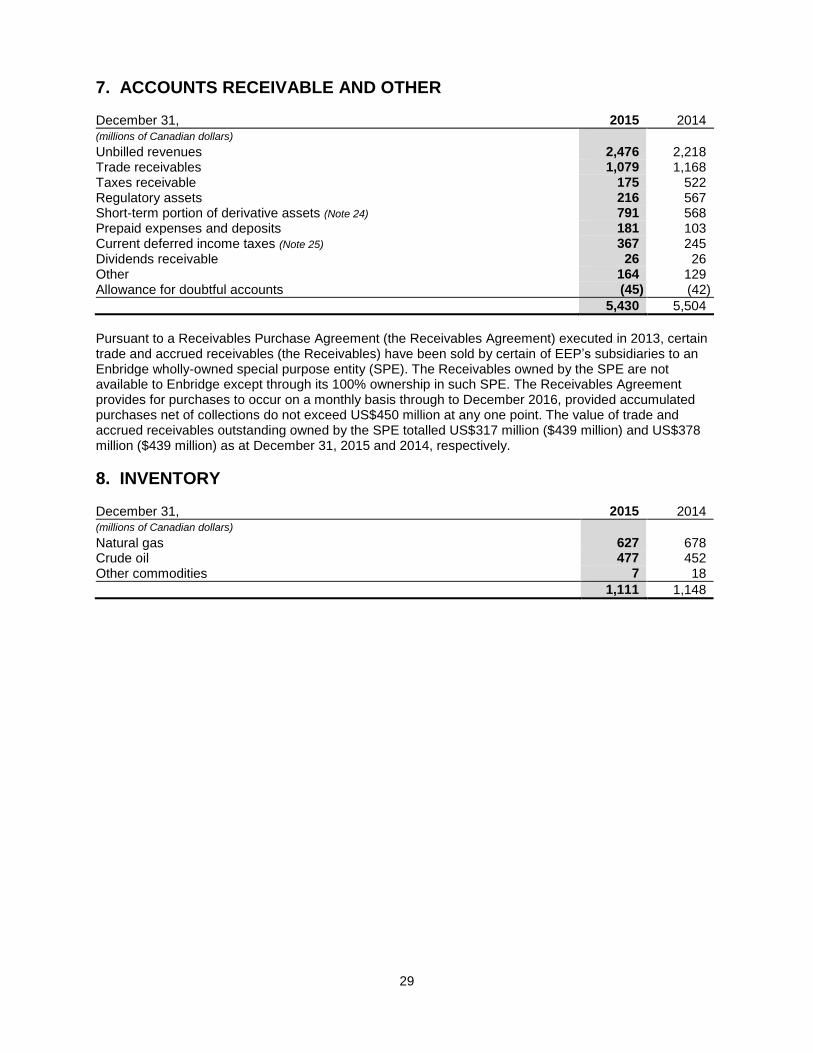
29
7. ACCOUNTS RECEIVABLE AND OTHER December 31, 2015 2014 (millions of Canadian dollars) Unbilled revenues 2,476 2,218 Trade receivables 1,079 1,168 Taxes receivable 175 522 Regulatory assets 216 567 Short-term portion of derivative assets (Note 24) 791 568 Prepaid expenses and deposits 181 103 Current deferred income taxes (Note 25) 367 245 Dividends receivable 26 26 Other 164 129 Allowance for doubtful accounts (45) (42)
5,430 5,504
Pursuant to a Receivables Purchase Agreement (the Receivables Agreement) executed in 2013, certain trade and accrued receivables (the Receivables) have been sold by certain of EEP’s subsidiaries to an Enbridge wholly-owned special purpose entity (SPE). The Receivables owned by the SPE are not available to Enbridge except through its 100% ownership in such SPE. The Receivables Agreement provides for purchases to occur on a monthly basis through to December 2016, provided accumulated purchases net of collections do not exceed US$450 million at any one point. The value of trade and accrued receivables outstanding owned by the SPE totalled US$317 million ($439 million) and US$378 million ($439 million) as at December 31, 2015 and 2014, respectively.
8. INVENTORY December 31, 2015 2014 (millions of Canadian dollars) Natural gas 627 678 Crude oil 477 452 Other commodities 7 18
1,111 1,148

30
9. PROPERTY, PLANT AND EQUIPMENT Weighted Average
December 31, Depreciation Rate 2015 2014
(millions of Canadian dollars) Liquids Pipelines1,2 Pipeline 2.9% 6,356 12,515 Pumping equipment, buildings, tanks and other
3.8% 1,464 7,715
Land and right-of-way 1.9% 228 520 Under construction - 754 5,578
8,802 26,328 Accumulated depreciation (1,200) (4,312)
7,602 22,016
Gas Distribution Gas mains, services and other 3.0% 8,819 8,427 Land and right-of-way 1.0% 85 84 Under construction - 902 352
9,806 8,863 Accumulated depreciation (2,379) (2,256)
7,427 6,607
Gas Pipelines, Processing and Energy Services1 Pipeline 4.2% 777 633 Wind turbines, solar panels and other
4.7% 2,162 2,371
Power transmission
1.8% 387 397 Canadian Midstream gas gathering and processing 2.9% 789 778 Land and right-of-way 3.2% 58 28 Under construction
- 933 1,172
5,106 5,379 Accumulated depreciation (643) (454)
4,463 4,925
Sponsored Investments1 Pipeline 2.6% 27,317 11,564 Pumping equipment, buildings, tanks and other
3.1% 17,008 7,806
Wind turbines, solar panels and other
4.0% 2,582 1,549 Land and right-of-way 2.5% 1,660 1,040 Under construction - 5,330 2,126
53,897 24,085 Accumulated depreciation (9,087) (3,903)
44,810 20,182
Corporate Other
6.8% 184 80
Under construction - 5 69
189 149 Accumulated depreciation (57) (49)
132 100
64,434 53,830 1 Effective September 1, 2015, Enbridge transferred its Canadian Liquids Pipelines business and certain Canadian renewable
energy assets to the Fund Group within the Sponsored Investments segment as described under the Canadian Restructuring Plan (Note 1). Liquids Pipelines Property, plant and equipment of $15,635 million and Gas Pipelines, Processing and Energy Services Property, plant and equipment of $995 million as at December 31, 2014 have not been reclassified into the Sponsored Investments segment for presentation purposes.
2 In July 2014, $62 million of Property, plant and equipment was disposed as part of the sale of a 35% equity interest in the Southern Access Extension Project. The remaining balance of $136 million in Property, plant and equipment was reclassified to Long-term investments (Note 11).
Depreciation expense for the year ended December 31, 2015 was $1,852 million (2014 - $1,461 million; 2013 - $1,282 million).
31
SPONSORED INVESTMENTS Impairment The Company recorded impairment charges of $96 million, of which $80 million related to EEP’s Berthold rail facility due to contracts that have not been renewed beyond 2016. The remaining $16 million in impairment charges relate to EEP’s non-core Louisiana propylene pipeline asset following finalization of a contract restructuring with the primary customer. The impairment charges were based on the amount by which the carrying values of the assets exceeded fair value, determined using expected discounted future cash flows, and were presented within Operating and administrative expense on the Consolidated Statements of Earnings. DISCONTINUED OPERATIONS In March 2014, the Company completed the sale of certain of its Offshore assets located within the Stingray corridor to an unrelated third party for cash proceeds of $11 million (US$10 million), subject to working capital adjustments. The gain of $70 million (US$63 million), which resulted from the cash proceeds and the disposition of net liabilities held for sale of $59 million (US$53 million), is presented as Earnings from discontinued operations. The results of operations, including revenues of $4 million and $26 million and related cash flows, have also been presented as discontinued operations for the years ended December 31, 2014 and 2013, respectively. These amounts are included within the Gas Pipelines, Processing and Energy Services segment.
10. VARIABLE INTEREST ENTITIES The Company is required to consolidate a VIE in which the Company is the primary beneficiary. The primary beneficiary has both the power to direct the activities of the VIE that most significantly impact the entity’s economic performance and the obligation to absorb losses or the right to receive benefits from the VIE that could potentially be significant to the VIE. The Company assesses all aspects of its interest in the entity and uses its judgment when determining if the Company is the primary beneficiary. Other qualitative factors that are considered include decision-making responsibilities, the VIE capital structure, risk and rewards sharing, contractual agreements with the VIE, voting rights and level of involvement of other parties. A reassessment of the primary beneficiary conclusion is conducted when there are changes in the facts and circumstances related to a VIE. GAS PIPELINES, PROCESSING AND ENERGY SERVICES Magicat Holdco LLC Through its 80% controlling interest in Magicat Holdco LLC acquired on December 31, 2014, the Company is the primary beneficiary of the Magic Valley and Wildcat wind farms (Note 6). These wind farms are partially financed by tax equity investors and are considered VIEs by virtue of the Company’s voting rights, its power to direct the activities that most significantly impact the economic performance of the wind farms and the obligation to absorb losses. As at December 31, 2015, the Company’s investment in the Magic Valley and Wildcat wind farms was $394 million (2014 - $394 million). Keechi Holdings L.L.C. The Company initiated construction of the Keechi Wind Project on January 6, 2014. In January 2015, the tax equity investor financed 65% of the project and the wind farm was considered a VIE by virtue of the Company’s voting rights, its power to direct the activities that most significantly impact the economic performance of the wind farm and its obligation to absorb losses. Through its position as a managing member and having substantive participation rights in Keechi Wind, LLC the Company is considered the primary beneficiary of the Keechi Wind Project in Texas. As at December 31, 2015, the Company has contributed $204 million (2014 - $168 million) to Keechi Holdings L.L.C.
32
At December 31, 2015, the Company’s consolidated balance sheet includes total assets of $1,147 million (2014 - $970 million) and total liabilities of $49 million (2014 - $44 million) related to the Magic Valley and Wildcat wind farms and the Keechi Creek Wind Project. The assets of these VIEs can only be used to settle their obligations. Enbridge does not have an obligation to provide financial support to these VIEs other than an indirect obligation, as prescribed by the terms of certain indemnities and guarantees, to pay the liabilities of the wind farms in the event of a default. The tax equity investors of these VIEs have priority in the allocation of distributions and tax deductions and credits generated by the project until it achieves a specified return. The Company has an option to purchase the tax equity investors’ interest in the project after it has achieved its target return at the greater of fair market value or an amount that would provide the tax equity investors with an internal rate of return specified in the agreements. SPONSORED INVESTMENTS Enbridge Income Fund The Fund is an unincorporated open-ended trust established by a trust indenture under the laws of the Province of Alberta and is considered a VIE by virtue of its capital structure. The Company is the primary beneficiary of the Fund through its combined 89.2% (2014 - 66.4%; 2013 - 67.3%) economic interest held indirectly through a common investment in ENF, a direct common interest in the Fund, a preferred unit investment in ECT, a direct common interest in Enbridge Income Partners GP Inc. and a direct common interest in EIPLP. At December 31, 2015, the Company’s direct common interest in the Fund was 49.2% (2014 - 11.9%; 2013 - 15.5%). As a result of the Canadian Restructuring Plan (Note 1), the Company received ordinary trust units of the Fund and common equity units in EIPLP as part of the consideration, increasing the Company’s economic interest in the Fund Group, as well as its direct common unit interest in the Fund. Enbridge also serves in the capacity of Manager of ENF and the Fund Group. As at December 31, 2015, the Company’s consolidated balance sheet includes total assets of $113 million (2014 - $4,085 million) and total liabilities of $2,601 million (2014 - $3,213 million) related to the Fund. Certain of the Company’s subsidiaries provide unconditional guarantees of the Fund’s debt of $2,404 million (2014 - $2,544 million); however, the creditors of the Fund have no recourse to the general credit of the Company. Enbridge Commercial Trust As a result of the Canadian Restructuring Plan (Note 1), on September 1, 2015, ECT, previously a direct subsidiary of the Fund and consolidated by the Fund, amended its trust indenture to enable Enbridge to appoint the majority of the Trustees to ECT’s Board of Trustees resulting in the lack of decision making ability for the holders of the common trust units of ECT. As a result, ECT is considered to be a VIE and although Enbridge does not have a common equity interest in ECT, the Company is considered to be the primary beneficiary of ECT. Enbridge also serves in the capacity of Manager of ECT, as part of the Fund Group. At December 31, 2015, the Company’s consolidated balance sheet did not include any significant assets or liabilities related to ECT.

33
11. LONG-TERM INVESTMENTS Ownership December 31, Interest 2015 2014 (millions of Canadian dollars) EQUITY INVESTMENTS
Liquids Pipelines Seaway Pipeline 50.0% 3,251 2,782 Southern Access Extension 65.0% 713 263 Other 30.0% - 75.0% 95 65
Gas Pipelines, Processing and Energy Services Aux Sable 42.7% - 50.0% 344 311 Vector Pipeline 60.0% 159 141 Offshore - various joint ventures 22.0% - 74.3% 479 429 Rampion offshore wind project1 24.9% 201 - Other 33.3% - 70.0% 13 12
Sponsored Investments Texas Express Pipeline 35.0% 515 442 Alliance Pipeline Canada and US2 50.0% 436 374 Other 50.0% 54 67
Corporate Noverco Common Shares 38.9% - - Enbridge Rail (Philadelphia) L.L.C. 75.0% 142 - Other 19.0% - 49.99% 57 45
OTHER LONG-TERM INVESTMENTS Corporate
Noverco Preferred Shares 359 323 Enbridge Insurance (Barbados Oil) Limited 35 23 Enbridge (U.S.) Inc. 35 29 Other 120 102
7,008 5,408 1 On November 4, 2015, Enbridge acquired a 24.9% equity interest in Rampion Offshore Wind Limited. 2 In November 2014, Enbridge’s interest in Alliance Pipeline US was transferred to the Fund Group. As a result, $203 million of
Long-term investments as at December 31, 2014 were reclassified from Gas Pipelines, Processing and Energy Services to Sponsored Investments.
Equity investments include the unamortized excess of the purchase price over the underlying net book value of the investees’ assets at the purchase date, which is comprised of $885 million (2014 - $742 million) in Goodwill and $568 million (2014 - $494 million) in amortizable assets. For the year ended December 31, 2015, dividends received from equity investments was $719 million (2014 - $564 million; 2013 - $685 million). Summarized combined financial information of the Company’s interest in unconsolidated equity investments is as follows: Year ended December 31, 2015 2014 2013 (millions of Canadian dollars) Revenues 1,557 1,790 1,212 Commodity costs (369) (661) (371) Operating and administrative expense (376) (444) (266) Depreciation and amortization (274) (232) (175) Other income/(expense) 4 (1) 4 Interest expense (67) (84) (74)
Earnings before income taxes 475 368 330
34
December 31, 2015 2014
(millions of Canadian dollars) Current assets 389 472 Property, plant and equipment, net 6,602 5,214 Deferred amounts and other assets 40 34 Intangible assets, net 64 77 Goodwill 885 742 Current liabilities (500) (712) Long-term debt (854) (811) Other long-term liabilities (167) (85)
Net assets 6,459 4,931
Alliance Pipeline System Certain assets of the Alliance Pipeline System (Alliance System) are pledged as collateral to Alliance System lenders. Southern Access Extension Project On July 1, 2014, under an agreement with an unrelated third party, the Company sold a 35% equity interest in the Southern Access Extension Project (the Project). Prior to this sale, the subsidiary executing the Project was wholly-owned and consolidated within the Liquids Pipelines segment. The Company concluded that under the agreement, the purchaser of the 35% equity interest is entitled to substantive participating rights; however, the Company continues to exercise significant influence. As a result, effective July 1, 2014, the Company discontinued consolidation of the Project and recognized its remaining 65% equity interest as a long-term equity investment within the Liquids Pipelines segment. Noverco As at December 31, 2015, Enbridge owned an equity interest in Noverco through ownership of 38.9% (2014 - 38.9%) of its common shares and an investment in preferred shares. The preferred shares are entitled to a cumulative preferred dividend based on the average yield of Government of Canada bonds maturing in 10 years plus a range of 4.3% to 4.4%. As at December 31, 2015, Noverco owned an approximate 3.6% (2014 - 3.6%; 2013 - 3.9%) reciprocal shareholding in common shares of Enbridge. Through secondary offerings, Noverco sold 15 million common shares in 2013 and a further 1.3 million common shares in 2014. The transactions were recognized as issuances of treasury stock on the Consolidated Statements of Changes in Equity. As a result of Noverco’s reciprocal shareholding in Enbridge common shares, the Company has an indirect pro-rata interest of 1.4% (2014 - 1.4%; 2013 - 1.5%) in its own shares. Both the equity investment in Noverco and shareholders’ equity have been reduced by the reciprocal shareholding of $83 million at December 31, 2015 (2014 - $83 million; 2013 - $86 million). Noverco records dividends paid by the Company as dividend income and the Company eliminates these dividends from its equity earnings of Noverco. The Company records its pro-rata share of dividends paid by the Company to Noverco as a reduction of dividends paid and an increase in the Company’s investment in Noverco. Rampion Offshore Wind Project In November 2015, Enbridge announced the acquisition of a 24.9% interest in the 400 MW Rampion Offshore Wind Project (the Rampion project) in the United Kingdom (UK), located 13 kilometres (8 miles) off the UK Sussex coast at its nearest point. The Company’s total investment in the project through construction is expected to be approximately $750 million (£370 million). The Rampion project was developed and is being constructed by E.ON Climate & Renewables UK Limited, a subsidiary of E.ON SE (E.ON). Construction of the wind farm began in September 2015 and it is expected to be fully operational in 2018. The Rampion project is backed by revenues from the UK’s fixed price Renewable Obligation certificates program and a 15-year power purchase agreement. Under the terms of the purchase agreement, Enbridge became one of the three shareholders in Rampion Offshore Wind Limited which owns the Rampion project with the UK Green Investment Bank plc holding a 25% interest and E.ON retaining the balance of 50.1% interest. Enbridge’s portion of the costs incurred to date is approximately $201 million (£96.9 million) presented in Long-term investments.
35
12. RESTRICTED LONG-TERM INVESTMENTS
Effective January 1, 2015, the Company began collecting and setting aside funds to cover future pipeline abandonment costs for all NEB regulated pipelines as a result of the NEB’s regulatory requirements under LMCI. The funds collected are held in trusts in accordance with the NEB decision. The funds collected from shippers are reported within Transportation and other services revenues on the Consolidated Statements of Earnings and Restricted long-term investments on the Consolidated Statements of Financial Position. Concurrently, the Company reflects the future abandonment cost as an increase to Operating and administrative expense on the Consolidated Statements of Earnings and Other long-term liabilities on the Consolidated Statements of Financial Position. As at December 31, 2015, the Company had restricted long-term investments held in trust, invested in Canadian Treasury bonds, and are classified as held for sale and carried at fair value of $49 million (2014 - nil). As at December 31, 2015, the Company had estimated future abandonment costs of $48 million (2014 - nil) and restricted cash of nil (2014 - nil) related to LMCI.
13. DEFERRED AMOUNTS AND OTHER ASSETS
December 31, 2015 2014
(millions of Canadian dollars) Regulatory assets (Note 5) 1,662 1,752 Long-term portion of derivative assets (Note 24) 373 199 Affiliate long-term notes receivable (Note 30) 152 183 Contractual receivables 432 382 Deferred financing costs 200 166 Other 490 526
3,309 3,208
As at December 31, 2015, deferred amounts of $406 million (2014 - $366 million) were subject to amortization and are presented net of accumulated amortization of $193 million (2014 - $189 million). Amortization expense for the year ended December 31, 2015 was $55 million (2014 - $38 million; 2013 - $34 million).
14. INTANGIBLE ASSETS
Weighted Average Accumulated December 31, 2015 Amortization Rate Cost Amortization Net
(millions of Canadian dollars) Software 11.6% 1,295 516 779 Natural gas supply opportunities 4.0% 484 122 362 Power purchase agreements 3.8% 94 11 83 Land leases, permits and other 4.2% 163 39 124
2,036 688 1,348
Weighted Average Accumulated December 31, 2014 Amortization Rate Cost Amortization Net
(millions of Canadian dollars) Software 12.9% 1,049 337 712 Natural gas supply opportunities 3.7% 340 83 257 Power purchase agreements 3.4% 113 11 102 Land leases, permits and other 4.0% 124 29 95
1,626 460 1,166
Total amortization expense for intangible assets was $158 million (2014 - $106 million; 2013 - $82 million) for the year ended December 31, 2015. The Company expects amortization expense for intangible assets for the years ending December 31, 2016 through 2020 of $180 million, $160 million, $144 million, $130 million and $117 million, respectively.
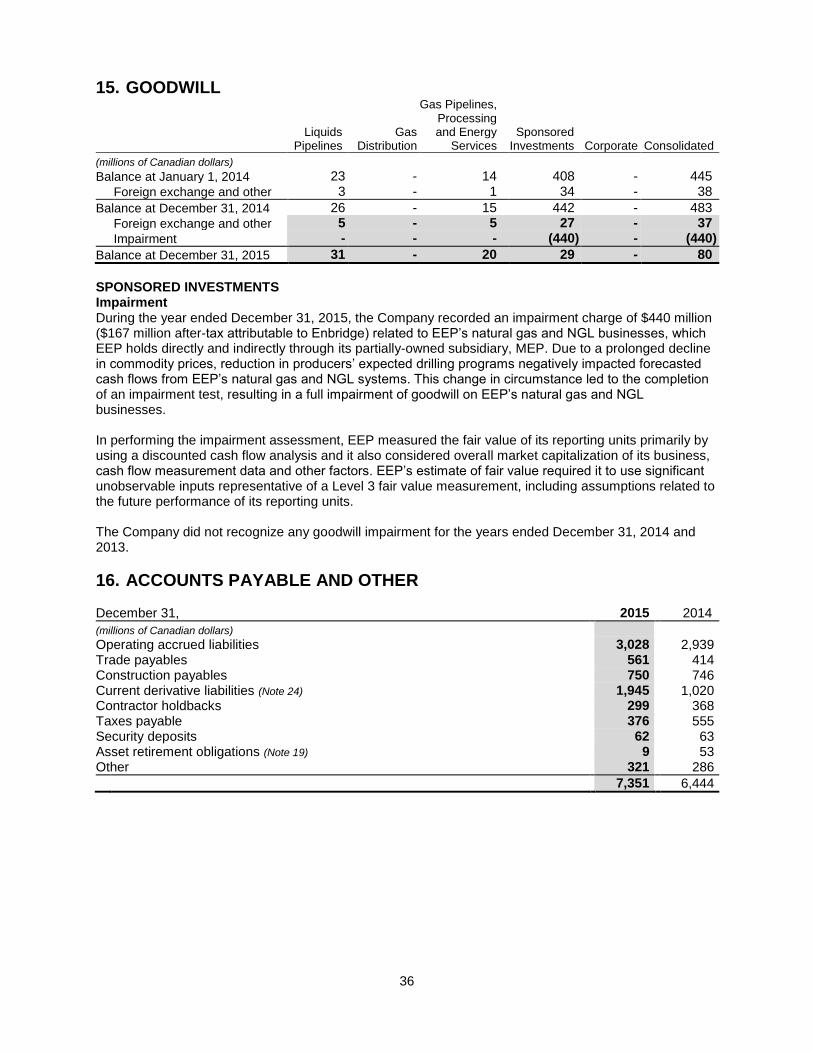
36
15. GOODWILL
Liquids
Pipelines Gas
Distribution
Gas Pipelines, Processing and Energy
Services Sponsored
Investments Corporate Consolidated
(millions of Canadian dollars)
Balance at January 1, 2014 23 - 14 408 - 445
Foreign exchange and other 3 - 1 34 - 38
Balance at December 31, 2014 26 - 15 442 - 483
Foreign exchange and other 5 - 5 27 - 37
Impairment - - - (440) - (440)
Balance at December 31, 2015 31 - 20 29 - 80
SPONSORED INVESTMENTS Impairment During the year ended December 31, 2015, the Company recorded an impairment charge of $440 million ($167 million after-tax attributable to Enbridge) related to EEP’s natural gas and NGL businesses, which EEP holds directly and indirectly through its partially-owned subsidiary, MEP. Due to a prolonged decline in commodity prices, reduction in producers’ expected drilling programs negatively impacted forecasted cash flows from EEP’s natural gas and NGL systems. This change in circumstance led to the completion of an impairment test, resulting in a full impairment of goodwill on EEP’s natural gas and NGL businesses. In performing the impairment assessment, EEP measured the fair value of its reporting units primarily by using a discounted cash flow analysis and it also considered overall market capitalization of its business, cash flow measurement data and other factors. EEP’s estimate of fair value required it to use significant unobservable inputs representative of a Level 3 fair value measurement, including assumptions related to the future performance of its reporting units. The Company did not recognize any goodwill impairment for the years ended December 31, 2014 and 2013.
16. ACCOUNTS PAYABLE AND OTHER December 31, 2015 2014
(millions of Canadian dollars) Operating accrued liabilities 3,028 2,939 Trade payables 561 414 Construction payables 750 746 Current derivative liabilities (Note 24) 1,945 1,020 Contractor holdbacks 299 368 Taxes payable 376 555 Security deposits 62 63 Asset retirement obligations (Note 19) 9 53 Other 321 286
7,351 6,444
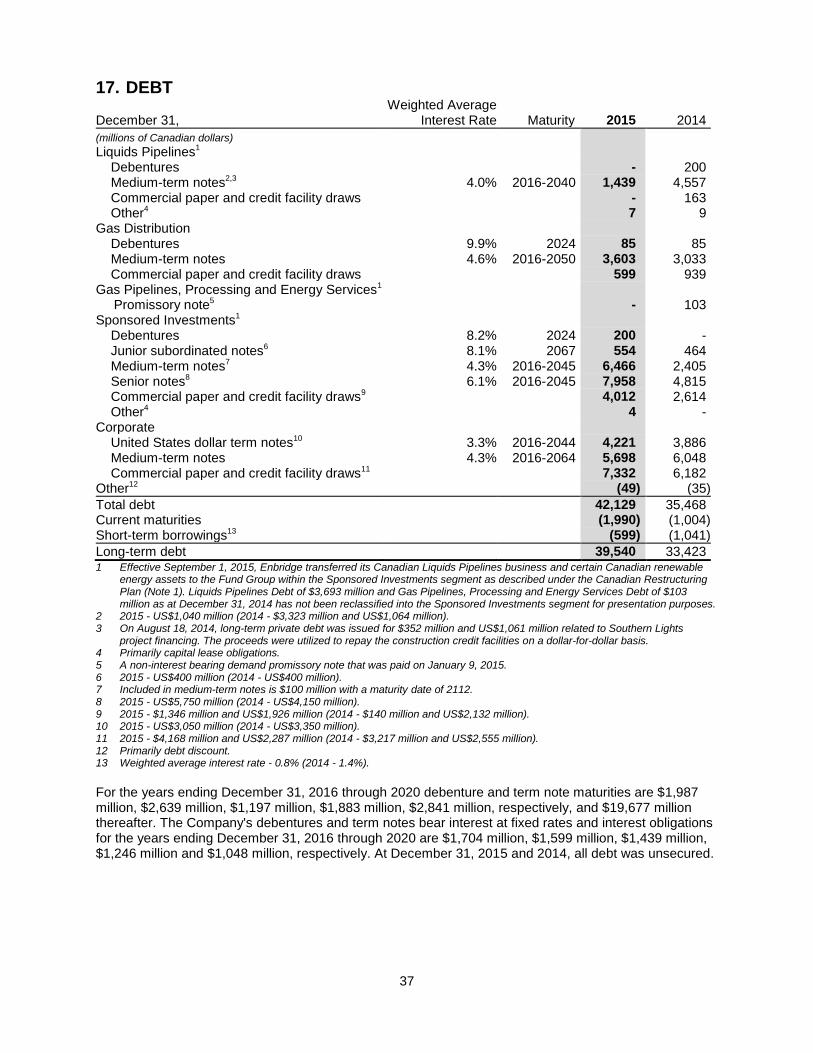
37
17. DEBT Weighted Average December 31, Interest Rate
Maturity 2015 2014
(millions of Canadian dollars)
Liquids Pipelines1
Debentures - 200
Medium-term notes2,3 4.0% 2016-2040 1,439 4,557 Commercial paper and credit facility draws - 163 Other4 7 9 Gas Distribution Debentures 9.9% 2024 85 85 Medium-term notes
4.6% 2016-2050 3,603 3,033
Commercial paper and credit facility draws 599 939
Gas Pipelines, Processing and Energy Services1 Promissory note5 - 103
Sponsored Investments1 Debentures 8.2% 2024 200 - Junior subordinated notes6 8.1% 2067 554 464 Medium-term notes7 4.3% 2016-2045 6,466 2,405 Senior notes8 6.1% 2016-2045 7,958 4,815 Commercial paper and credit facility draws9 4,012 2,614 Other4 4 -
Corporate
United States dollar term notes10 3.3% 2016-2044 4,221 3,886 Medium-term notes
4.3% 2016-2064 5,698 6,048
Commercial paper and credit facility draws11 7,332 6,182 Other12
(49) (35)
Total debt
42,129 35,468
Current maturities
(1,990) (1,004)
Short-term borrowings13 (599) (1,041)
Long-term debt
39,540 33,423
1 Effective September 1, 2015, Enbridge transferred its Canadian Liquids Pipelines business and certain Canadian renewable energy assets to the Fund Group within the Sponsored Investments segment as described under the Canadian Restructuring Plan (Note 1). Liquids Pipelines Debt of $3,693 million and Gas Pipelines, Processing and Energy Services Debt of $103 million as at December 31, 2014 has not been reclassified into the Sponsored Investments segment for presentation purposes.
2 2015 - US$1,040 million (2014 - $3,323 million and US$1,064 million). 3 On August 18, 2014, long-term private debt was issued for $352 million and US$1,061 million related to Southern Lights
project financing. The proceeds were utilized to repay the construction credit facilities on a dollar-for-dollar basis. 4 Primarily capital lease obligations. 5 A non-interest bearing demand promissory note that was paid on January 9, 2015. 6 2015 - US$400 million (2014 - US$400 million). 7 Included in medium-term notes is $100 million with a maturity date of 2112. 8 2015 - US$5,750 million (2014 - US$4,150 million). 9 2015 - $1,346 million and US$1,926 million (2014 - $140 million and US$2,132 million). 10 2015 - US$3,050 million (2014 - US$3,350 million). 11 2015 - $4,168 million and US$2,287 million (2014 - $3,217 million and US$2,555 million). 12 Primarily debt discount. 13 Weighted average interest rate - 0.8% (2014 - 1.4%).
For the years ending December 31, 2016 through 2020 debenture and term note maturities are $1,987 million, $2,639 million, $1,197 million, $1,883 million, $2,841 million, respectively, and $19,677 million thereafter. The Company's debentures and term notes bear interest at fixed rates and interest obligations for the years ending December 31, 2016 through 2020 are $1,704 million, $1,599 million, $1,439 million, $1,246 million and $1,048 million, respectively. At December 31, 2015 and 2014, all debt was unsecured.
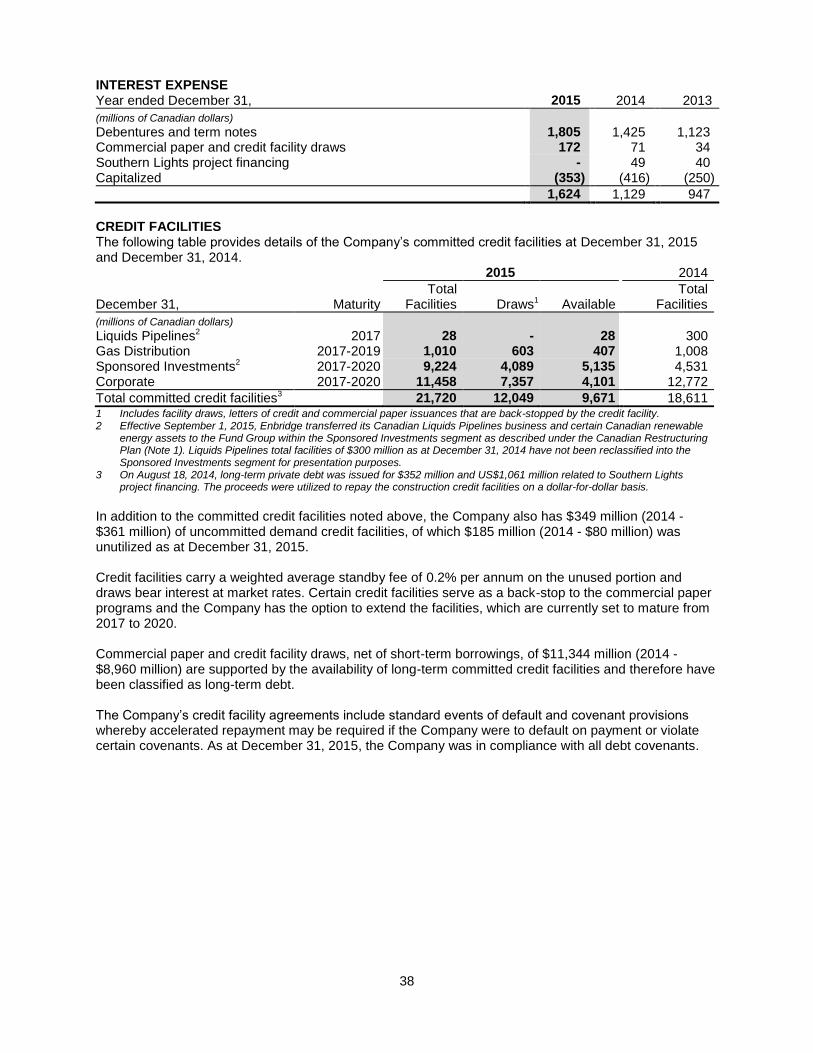
38
INTEREST EXPENSE Year ended December 31, 2015 2014 2013
(millions of Canadian dollars) Debentures and term notes 1,805 1,425 1,123 Commercial paper and credit facility draws 172 71 34 Southern Lights project financing - 49 40 Capitalized (353) (416) (250)
1,624 1,129 947
CREDIT FACILITIES The following table provides details of the Company’s committed credit facilities at December 31, 2015 and December 31, 2014. 2015 2014
December 31, Maturity Total
Facilities Draws1 Available
Total Facilities
(millions of Canadian dollars)
Liquids Pipelines2 2017 28 - 28 300
Gas Distribution
2017-2019 1,010 603 407 1,008 Sponsored Investments2
2017-2020 9,224 4,089 5,135 4,531 Corporate
2017-2020 11,458 7,357 4,101 12,772
Total committed credit facilities3 21,720 12,049 9,671 18,611
1 Includes facility draws, letters of credit and commercial paper issuances that are back-stopped by the credit facility. 2 Effective September 1, 2015, Enbridge transferred its Canadian Liquids Pipelines business and certain Canadian renewable
energy assets to the Fund Group within the Sponsored Investments segment as described under the Canadian Restructuring Plan (Note 1). Liquids Pipelines total facilities of $300 million as at December 31, 2014 have not been reclassified into the Sponsored Investments segment for presentation purposes.
3 On August 18, 2014, long-term private debt was issued for $352 million and US$1,061 million related to Southern Lights project financing. The proceeds were utilized to repay the construction credit facilities on a dollar-for-dollar basis.
In addition to the committed credit facilities noted above, the Company also has $349 million (2014 - $361 million) of uncommitted demand credit facilities, of which $185 million (2014 - $80 million) was unutilized as at December 31, 2015. Credit facilities carry a weighted average standby fee of 0.2% per annum on the unused portion and draws bear interest at market rates. Certain credit facilities serve as a back-stop to the commercial paper programs and the Company has the option to extend the facilities, which are currently set to mature from 2017 to 2020. Commercial paper and credit facility draws, net of short-term borrowings, of $11,344 million (2014 - $8,960 million) are supported by the availability of long-term committed credit facilities and therefore have been classified as long-term debt. The Company’s credit facility agreements include standard events of default and covenant provisions whereby accelerated repayment may be required if the Company were to default on payment or violate certain covenants. As at December 31, 2015, the Company was in compliance with all debt covenants.
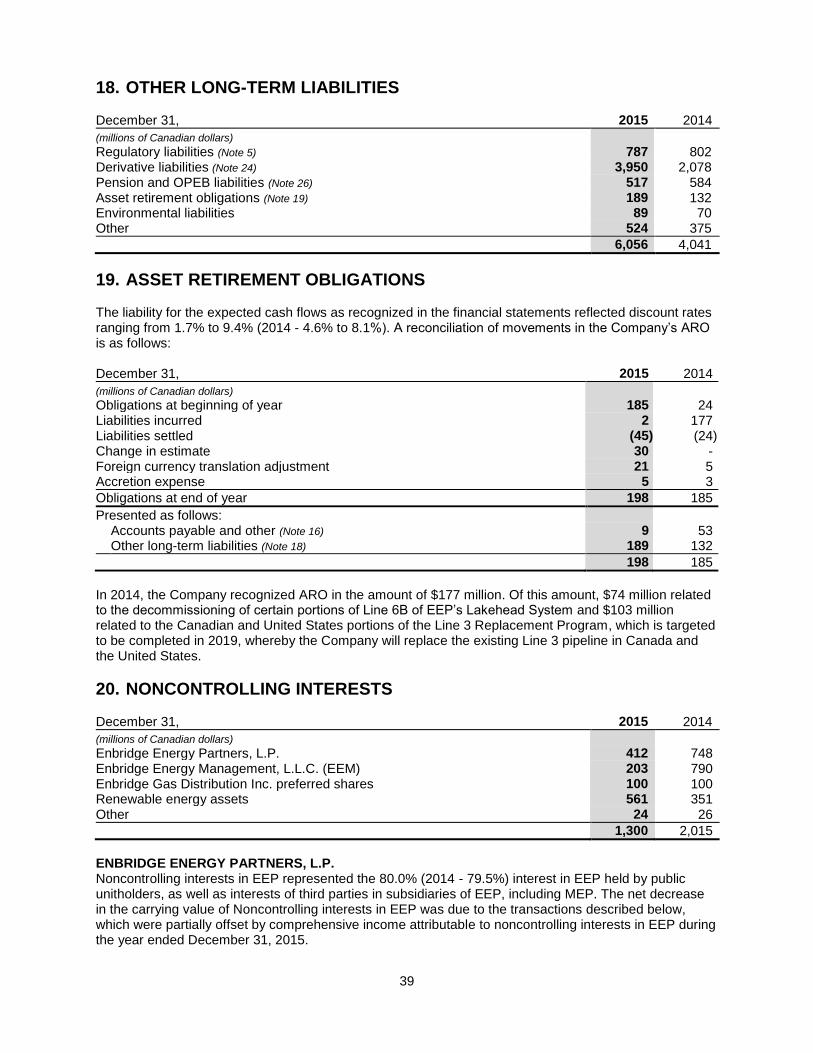
39
18. OTHER LONG-TERM LIABILITIES
December 31, 2015 2014
(millions of Canadian dollars) Regulatory liabilities (Note 5) 787 802 Derivative liabilities (Note 24) 3,950 2,078 Pension and OPEB liabilities (Note 26) 517 584 Asset retirement obligations (Note 19) 189 132 Environmental liabilities 89 70 Other 524 375
6,056 4,041
19. ASSET RETIREMENT OBLIGATIONS The liability for the expected cash flows as recognized in the financial statements reflected discount rates ranging from 1.7% to 9.4% (2014 - 4.6% to 8.1%). A reconciliation of movements in the Company’s ARO is as follows: December 31, 2015 2014
(millions of Canadian dollars) Obligations at beginning of year 185 24 Liabilities incurred 2 177 Liabilities settled (45) (24) Change in estimate 30 - Foreign currency translation adjustment 21 5 Accretion expense 5 3
Obligations at end of year
198 185
Presented as follows: Accounts payable and other (Note 16) 9 53 Other long-term liabilities (Note 18) 189 132
198 185
In 2014, the Company recognized ARO in the amount of $177 million. Of this amount, $74 million related to the decommissioning of certain portions of Line 6B of EEP’s Lakehead System and $103 million related to the Canadian and United States portions of the Line 3 Replacement Program, which is targeted to be completed in 2019, whereby the Company will replace the existing Line 3 pipeline in Canada and the United States.
20. NONCONTROLLING INTERESTS
December 31, 2015 2014
(millions of Canadian dollars) Enbridge Energy Partners, L.P. 412 748 Enbridge Energy Management, L.L.C. (EEM) 203 790 Enbridge Gas Distribution Inc. preferred shares 100 100 Renewable energy assets 561 351 Other 24 26
1,300 2,015
ENBRIDGE ENERGY PARTNERS, L.P. Noncontrolling interests in EEP represented the 80.0% (2014 - 79.5%) interest in EEP held by public unitholders, as well as interests of third parties in subsidiaries of EEP, including MEP. The net decrease in the carrying value of Noncontrolling interests in EEP was due to the transactions described below, which were partially offset by comprehensive income attributable to noncontrolling interests in EEP during the year ended December 31, 2015.
40
On January 2, 2015, Enbridge transferred its 66.7% interest in the United States segment of the Alberta Clipper pipeline, held through a wholly-owned Enbridge subsidiary in the United States, to EEP for aggregate consideration of $1.1 billion (US$1 billion), consisting of approximately $814 million (US$694 million) of Class E equity units issued to Enbridge by EEP and the repayment of approximately $359 million (US$306 million) of indebtedness owed to Enbridge. Prior to the transfer, EEP owned the remaining 33.3% interest in the United States segment of the Alberta Clipper pipeline. The Class E units issued to Enbridge are entitled to the same distributions as the Class A units held by the public and are convertible into Class A units on a one-for-one basis at Enbridge's option. The transaction applies to all distributions declared subsequent to the transfer. The Class E units are redeemable at EEP's option after 30 years, if not converted by Enbridge prior to that time. The units have a liquidation preference equal to their notional value at December 23, 2014 of US$38.31 per unit, which was determined based on the trailing five-day volume-weighted average price of EEP's Class A common units. EEP recorded the Class E units at fair value. As a result, the Company recorded a decrease in Noncontrolling interests of $304 million and increases in Additional paid-in capital and Deferred income tax liabilities of $218 million and $86 million, respectively. On March 13, 2015, EEP completed a listed share issuance. The Company participated only to the extent to maintain its 2% General Partner (GP) interest. The listed share issuance resulted in contributions of $366 million (US$289 million) from noncontrolling interest holders. Enbridge’s noncontrolling interests in EEP increased from 79.5% to 80.0% as a result of the listed share issuance. During the year ended December 31, 2015, EEP distributed $630 million (2014 - $504 million; 2013 - $463 million) to its noncontrolling interest holders in line with EEP’s objective to make quarterly distributions in an amount equal to its available cash, as defined in its partnership agreement and as approved by EEP’s Board of Directors. Effective July 1, 2014, Enbridge Energy Company, Inc., a wholly-owned subsidiary of Enbridge and the GP of EEP, entered into an equity restructuring transaction in which the Company irrevocably waived its right to receive cash distributions and allocations in excess of 2% in respect of its GP interest in the existing incentive distribution rights (IDR) in exchange for the issuance of (i) 66.1 million units of a new class of EEP units designated as Class D Units, and (ii) 1,000 units of a new class of EEP units designated as Incentive Distribution Units (IDU). The Class D Units entitle the Company to receive quarterly distributions equal to the distribution paid on EEP’s common units. This restructuring decreases the Company’s share of incremental cash distributions from 48% of all distributions in excess of US$0.495 per unit per quarter down to 23% of all distributions in excess of EEP’s current quarterly distribution of US$0.5435 per unit per quarter. The transaction applies to all distributions declared subsequent to the effective date. EEP recorded the Class D Units and IDU at fair value, which resulted in a reduction to the carrying amounts of the GP and limited partner capital accounts on a pro-rata basis. As a result, the Company recorded a decrease in Noncontrolling interests of $2,363 million inclusive of CTA and increases in Additional paid-in capital and Deferred income tax liabilities of $1,601 million and $762 million, respectively. In May 2013, EEP formed MEP as its wholly-owned subsidiary. Subsequently, on November 13, 2013, MEP completed its initial public offering of 18.5 million Class A common units representing limited partner interests and subsequently issued an additional 2.8 million Class A common units pursuant to an underwriters’ over-allotment option. MEP received proceeds of approximately $372 million (US$355 million). Upon finalization of the offering, MEP’s initial assets consisted of an approximate 39% ownership interest in EEP’s natural gas and NGL midstream business. EEP retained a 2% GP interest, an approximate 52% limited partner interest and all IDR in MEP, in addition to its 61% direct interest in the natural gas and NGL midstream assets. On July 1, 2014, EEP completed the sale of an additional 12.6% limited partnership interest in its natural gas and NGL midstream business to MEP for cash proceeds of $376 million (US$350 million). Upon finalization of this transaction, EEP continued to retain a 2% GP interest, an approximate 52% limited partner interest and all IDR in MEP. However, EEP’s direct interest in entities or partnerships holding the natural gas and NGL midstream operations reduced from 61% to 48%, with the remaining ownership held by MEP.
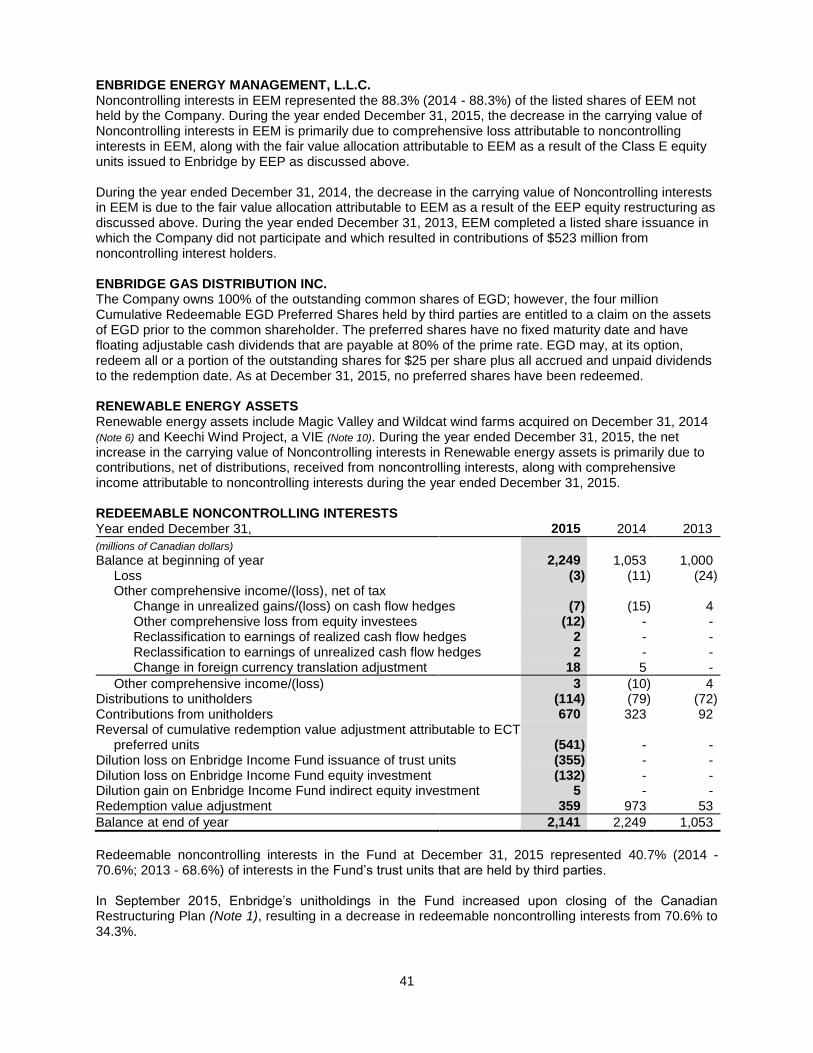
41
ENBRIDGE ENERGY MANAGEMENT, L.L.C. Noncontrolling interests in EEM represented the 88.3% (2014 - 88.3%) of the listed shares of EEM not held by the Company. During the year ended December 31, 2015, the decrease in the carrying value of Noncontrolling interests in EEM is primarily due to comprehensive loss attributable to noncontrolling interests in EEM, along with the fair value allocation attributable to EEM as a result of the Class E equity units issued to Enbridge by EEP as discussed above. During the year ended December 31, 2014, the decrease in the carrying value of Noncontrolling interests in EEM is due to the fair value allocation attributable to EEM as a result of the EEP equity restructuring as discussed above. During the year ended December 31, 2013, EEM completed a listed share issuance in which the Company did not participate and which resulted in contributions of $523 million from noncontrolling interest holders. ENBRIDGE GAS DISTRIBUTION INC. The Company owns 100% of the outstanding common shares of EGD; however, the four million Cumulative Redeemable EGD Preferred Shares held by third parties are entitled to a claim on the assets of EGD prior to the common shareholder. The preferred shares have no fixed maturity date and have floating adjustable cash dividends that are payable at 80% of the prime rate. EGD may, at its option, redeem all or a portion of the outstanding shares for $25 per share plus all accrued and unpaid dividends to the redemption date. As at December 31, 2015, no preferred shares have been redeemed. RENEWABLE ENERGY ASSETS Renewable energy assets include Magic Valley and Wildcat wind farms acquired on December 31, 2014 (Note 6) and Keechi Wind Project, a VIE (Note 10). During the year ended December 31, 2015, the net increase in the carrying value of Noncontrolling interests in Renewable energy assets is primarily due to contributions, net of distributions, received from noncontrolling interests, along with comprehensive income attributable to noncontrolling interests during the year ended December 31, 2015. REDEEMABLE NONCONTROLLING INTERESTS Year ended December 31, 2015 2014 2013
(millions of Canadian dollars)
Balance at beginning of year 2,249 1,053 1,000 Loss (3) (11) (24) Other comprehensive income/(loss), net of tax
Change in unrealized gains/(loss) on cash flow hedges (7) (15) 4 Other comprehensive loss from equity investees (12) - - Reclassification to earnings of realized cash flow hedges 2 - - Reclassification to earnings of unrealized cash flow hedges 2 - - Change in foreign currency translation adjustment 18 5 -
Other comprehensive income/(loss) 3 (10) 4 Distributions to unitholders (114) (79) (72) Contributions from unitholders 670 323 92 Reversal of cumulative redemption value adjustment attributable to ECT
preferred units (541) - - Dilution loss on Enbridge Income Fund issuance of trust units (355) - - Dilution loss on Enbridge Income Fund equity investment (132) - - Dilution gain on Enbridge Income Fund indirect equity investment 5 - - Redemption value adjustment 359 973 53
Balance at end of year 2,141 2,249 1,053
Redeemable noncontrolling interests in the Fund at December 31, 2015 represented 40.7% (2014 - 70.6%; 2013 - 68.6%) of interests in the Fund’s trust units that are held by third parties. In September 2015, Enbridge’s unitholdings in the Fund increased upon closing of the Canadian Restructuring Plan (Note 1), resulting in a decrease in redeemable noncontrolling interests from 70.6% to 34.3%.
42
Upon closing of the Canadian Restructuring Plan, ECT, an equity investment of the Fund, reclassified its Preferred Units from mezzanine equity to liabilities. Accordingly, ECT reduced the recorded redemption value of its Preferred Units to their aggregate par value, resulting in an increase to the Fund’s equity investment in ECT. This resulted in an adjustment to redeemable noncontrolling interests of approximately $541 million. Upon closing of the Canadian Restructuring Plan, EIPLP, an indirect equity investment of the Fund, issues Temporary Performance Distribution Rights (TPDR) to Enbridge each month in the form of Class D units of EIPLP. The Class D unitholders receive a distribution each month equal to the per unit amount paid on Class C units of EIPLP, but to be paid in kind in additional Class D units. The issuances of TPDR and additional Class D units result in a dilution gain for the Fund’s indirect equity investment in EIPLP. A dilution gain for redeemable noncontrolling interests of $5 million was recorded for the year ended December 31, 2015. In November 2015, ENF completed a bought deal public offering of common shares for approximately $700 million and issued additional common shares to Enbridge for approximately $174 million in order for Enbridge to maintain its 19.9% in ENF. ENF used the aggregate proceeds of $874 million to subscribe for additional trust units of the Fund. Enbridge did not participate in this offering, resulting in an increase in redeemable noncontrolling interests from 34.3% to 40.7%. This resulted in contributions of $670 million, net of share issue costs, from redeemable noncontrolling interest holders and a dilution loss for redeemable noncontrolling interests of $355 million for the year ended December 31, 2015. In November 2015, the Fund used the aggregate proceeds of $874 million from the issuance of trust units to ENF to purchase additional common units of ECT, and ECT used the aggregate proceeds of $874 million to purchase additional Class A units of EIPLP, resulting in a dilution loss for ECT. This dilution loss resulted in a dilution loss for Fund’s equity investment in ECT and a dilution loss for redeemable noncontrolling interests of $132 million for the year ended December 31, 2015. In November 2014, the Fund Group acquired Enbridge’s 50% interest in Alliance Pipeline US and subscribed for and purchased Class A units of Enbridge’s subsidiaries that indirectly own the Canadian and United States segments of the Southern Lights Pipeline for a total consideration of approximately $1.8 billion, including $421 million in cash, $878 million in the form of a long-term note payable by the Fund, bearing interest of 5.5% per annum and was fully repaid at December 31, 2015, and $461 million in the form of preferred units of ECT, which at the time of the transfer was a subsidiary of the Fund. To fund the cash component of the consideration, the Fund issued approximately $421 million of trust units to ENF. To purchase the trust units from the Fund, ENF completed a bought deal public offering of common shares for approximately $337 million and issued additional common shares to Enbridge for approximately $84 million in order for Enbridge to maintain its 19.9% interest in ENF. As a result of the transfer, redeemable noncontrolling interests in the Fund increased from 68.6% to 70.6% and contributions of $323 million, net of share issue costs, were received from redeemable noncontrolling interest holders. During the year ended December 31, 2013, the Fund completed a unit issuance in which the Company did not participate, resulting in an increase in the redeemable noncontrolling interests from 67.7% to 68.6%. This resulted in contributions of $92 million from redeemable noncontrolling interest holders. Distributions to noncontrolling unitholders were made on a monthly basis for the years ended December 31, 2015, 2014 and 2013 in line with the Fund’s objective of distributing a high proportion of its cash available for distribution, as approved by its Board of Trustees.
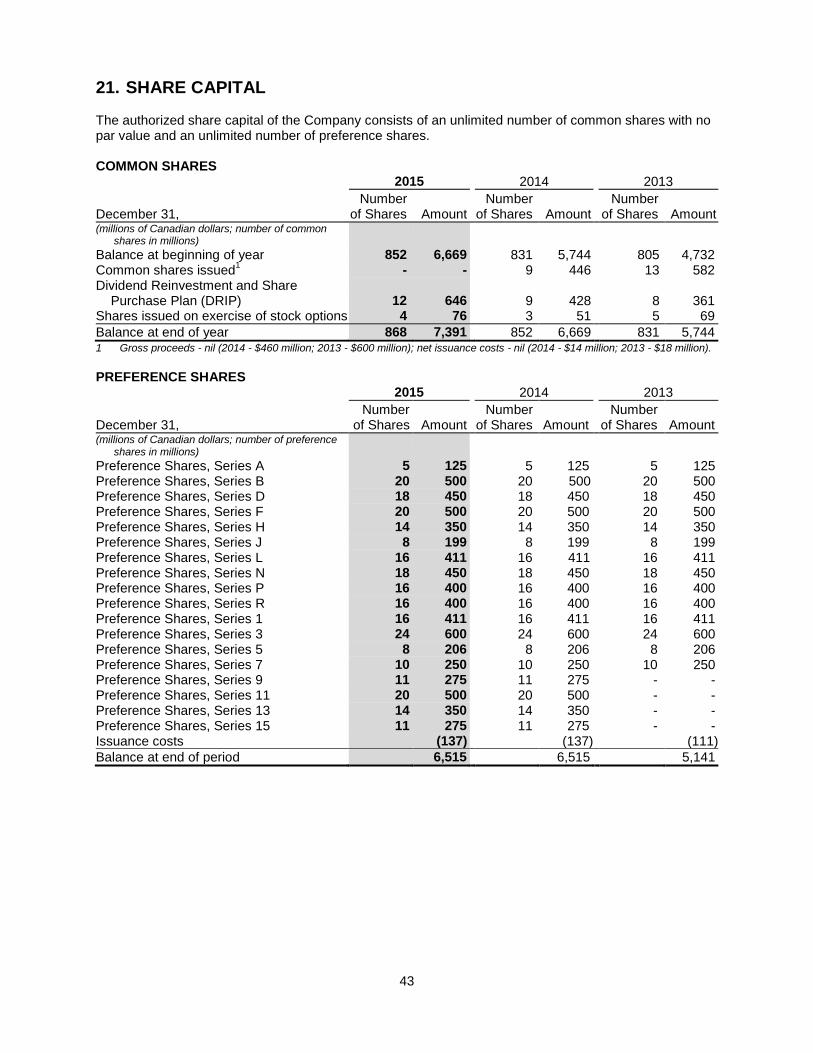
43
21. SHARE CAPITAL
The authorized share capital of the Company consists of an unlimited number of common shares with no par value and an unlimited number of preference shares. COMMON SHARES 2015 2014 2013
Number of Shares Amount
Number of Shares Amount
Number of Shares Amount December 31,
(millions of Canadian dollars; number of common shares in millions)
Balance at beginning of year 852 6,669 831 5,744 805 4,732 Common shares issued
1 - - 9 446 13 582
Dividend Reinvestment and Share Purchase Plan (DRIP) 12 646 9 428 8 361 Shares issued on exercise of stock options 4 76 3 51 5 69
Balance at end of year 868 7,391 852 6,669 831 5,744 1 Gross proceeds - nil (2014 - $460 million; 2013 - $600 million); net issuance costs - nil (2014 - $14 million; 2013 - $18 million).
PREFERENCE SHARES 2015 2014 2013
Number of Shares Amount
Number of Shares Amount
Number of Shares Amount December 31,
(millions of Canadian dollars; number of preference shares in millions)
Preference Shares, Series A 5 125 5 125 5 125 Preference Shares, Series B 20 500 20 500 20 500 Preference Shares, Series D 18 450 18 450 18 450 Preference Shares, Series F 20 500 20 500 20 500 Preference Shares, Series H
14 350 14 350 14 350
Preference Shares, Series J 8 199 8 199 8 199 Preference Shares, Series L 16 411 16 411 16 411 Preference Shares, Series N 18 450 18 450 18 450 Preference Shares, Series P 16 400 16 400 16 400 Preference Shares, Series R 16 400 16 400 16 400 Preference Shares, Series 1 16 411 16 411 16 411 Preference Shares, Series 3 24 600 24 600 24 600 Preference Shares, Series 5 8 206 8 206 8 206 Preference Shares, Series 7 10 250 10 250 10 250 Preference Shares, Series 9 11 275 11 275 - - Preference Shares, Series 11 20 500 20 500 - - Preference Shares, Series 13 14 350 14 350 - - Preference Shares, Series 15 11 275 11 275 - - Issuance costs (137) (137) (111)
Balance at end of period 6,515 6,515 5,141
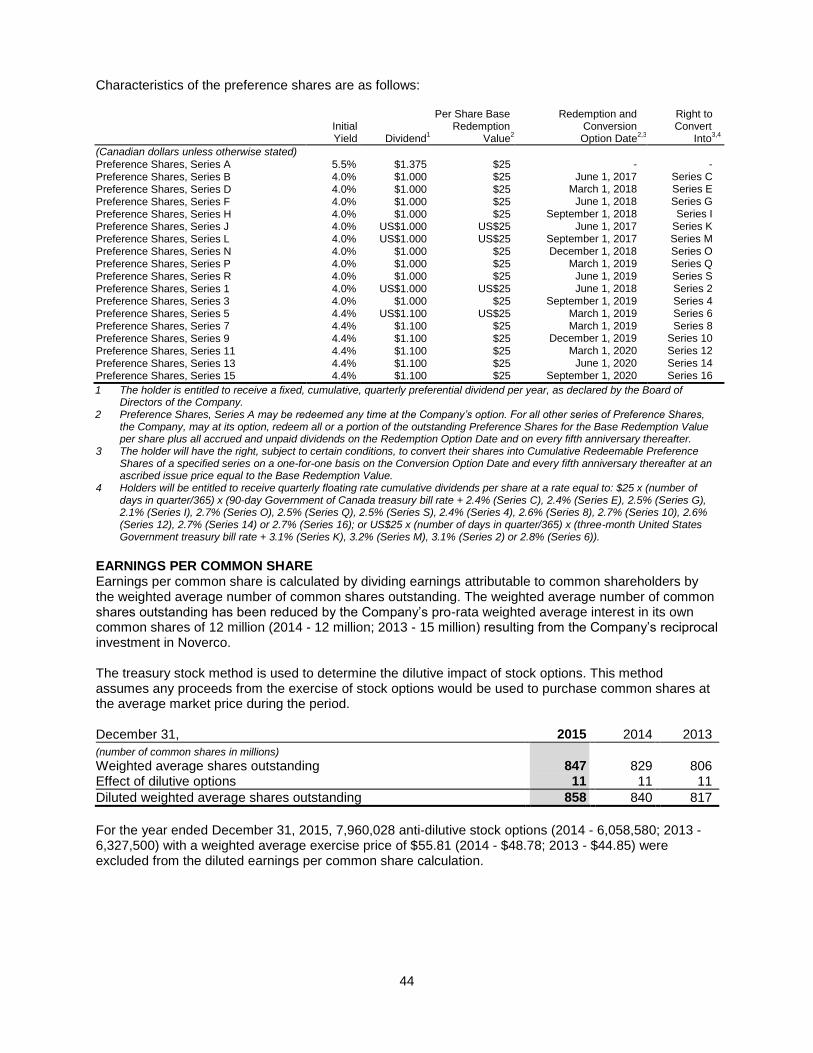
44
Characteristics of the preference shares are as follows:
Initial Yield
Dividend1
Per Share Base Redemption
Value2
Redemption and Conversion Option Date
2,3
Right to Convert
Into3,4
(Canadian dollars unless otherwise stated) Preference Shares, Series A 5.5% $1.375 $25 - -
Preference Shares, Series B 4.0% $1.000 $25 June 1, 2017 Series C
Preference Shares, Series D 4.0% $1.000 $25 March 1, 2018 Series E
Preference Shares, Series F 4.0% $1.000 $25 June 1, 2018 Series G
Preference Shares, Series H 4.0% $1.000 $25 September 1, 2018 Series I
Preference Shares, Series J
4.0% US$1.000 US$25 June 1, 2017 Series K
Preference Shares, Series L
4.0% US$1.000 US$25 September 1, 2017 Series M
Preference Shares, Series N
4.0% $1.000 $25 December 1, 2018 Series O
Preference Shares, Series P 4.0% $1.000 $25 March 1, 2019 Series Q
Preference Shares, Series R 4.0% $1.000 $25 June 1, 2019 Series S
Preference Shares, Series 1
4.0% US$1.000 US$25 June 1, 2018 Series 2
Preference Shares, Series 3
4.0% $1.000 $25 September 1, 2019 Series 4
Preference Shares, Series 5 4.4% US$1.100 US$25 March 1, 2019 Series 6
Preference Shares, Series 7 4.4% $1.100 $25 March 1, 2019 Series 8
Preference Shares, Series 9
4.4% $1.100 $25 December 1, 2019 Series 10
Preference Shares, Series 11
4.4% $1.100 $25 March 1, 2020 Series 12
Preference Shares, Series 13 4.4% $1.100 $25 June 1, 2020 Series 14
Preference Shares, Series 15 4.4% $1.100 $25 September 1, 2020 Series 16
1 The holder is entitled to receive a fixed, cumulative, quarterly preferential dividend per year, as declared by the Board of Directors of the Company.
2 Preference Shares, Series A may be redeemed any time at the Company’s option. For all other series of Preference Shares, the Company, may at its option, redeem all or a portion of the outstanding Preference Shares for the Base Redemption Value per share plus all accrued and unpaid dividends on the Redemption Option Date and on every fifth anniversary thereafter.
3 The holder will have the right, subject to certain conditions, to convert their shares into Cumulative Redeemable Preference Shares of a specified series on a one-for-one basis on the Conversion Option Date and every fifth anniversary thereafter at an ascribed issue price equal to the Base Redemption Value.
4 Holders will be entitled to receive quarterly floating rate cumulative dividends per share at a rate equal to: $25 x (number of days in quarter/365) x (90-day Government of Canada treasury bill rate + 2.4% (Series C), 2.4% (Series E), 2.5% (Series G), 2.1% (Series I), 2.7% (Series O), 2.5% (Series Q), 2.5% (Series S), 2.4% (Series 4), 2.6% (Series 8), 2.7% (Series 10), 2.6% (Series 12), 2.7% (Series 14) or 2.7% (Series 16); or US$25 x (number of days in quarter/365) x (three-month United States Government treasury bill rate + 3.1% (Series K), 3.2% (Series M), 3.1% (Series 2) or 2.8% (Series 6)).
EARNINGS PER COMMON SHARE Earnings per common share is calculated by dividing earnings attributable to common shareholders by the weighted average number of common shares outstanding. The weighted average number of common shares outstanding has been reduced by the Company’s pro-rata weighted average interest in its own common shares of 12 million (2014 - 12 million; 2013 - 15 million) resulting from the Company’s reciprocal investment in Noverco. The treasury stock method is used to determine the dilutive impact of stock options. This method assumes any proceeds from the exercise of stock options would be used to purchase common shares at the average market price during the period. December 31, 2015 2014 2013
(number of common shares in millions)
Weighted average shares outstanding 847 829 806 Effect of dilutive options 11 11 11
Diluted weighted average shares outstanding 858 840 817
For the year ended December 31, 2015, 7,960,028 anti-dilutive stock options (2014 - 6,058,580; 2013 - 6,327,500) with a weighted average exercise price of $55.81 (2014 - $48.78; 2013 - $44.85) were excluded from the diluted earnings per common share calculation.
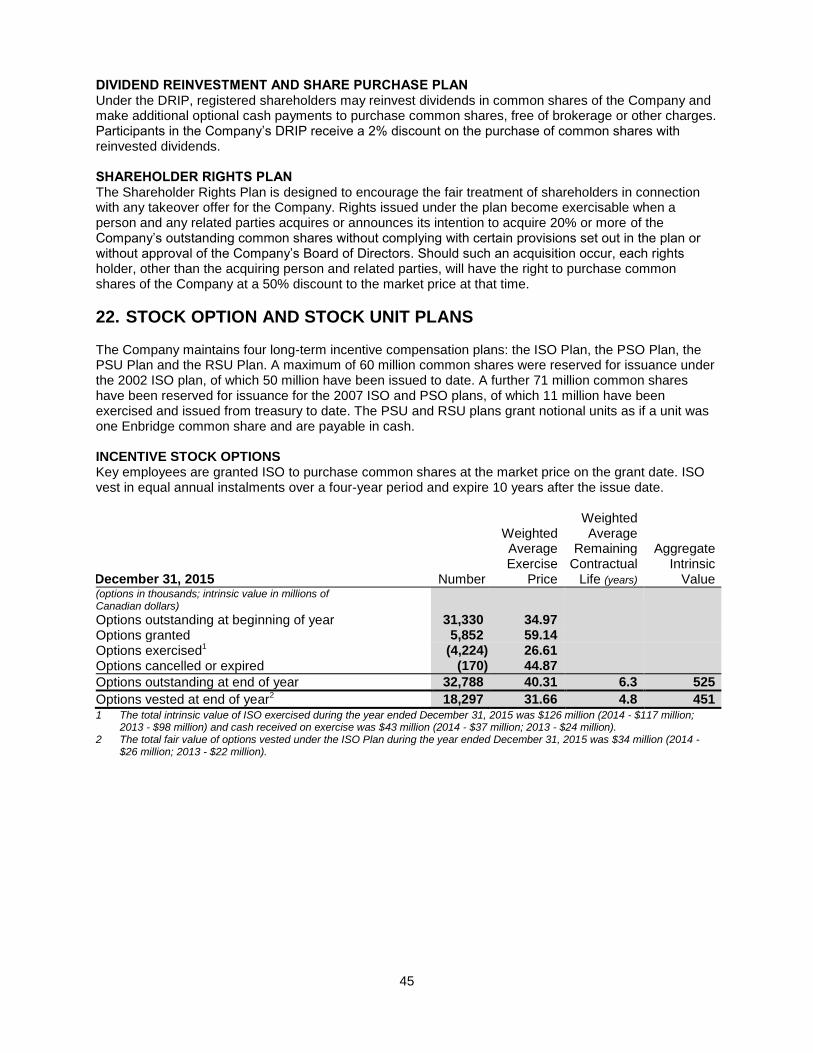
45
DIVIDEND REINVESTMENT AND SHARE PURCHASE PLAN Under the DRIP, registered shareholders may reinvest dividends in common shares of the Company and make additional optional cash payments to purchase common shares, free of brokerage or other charges. Participants in the Company’s DRIP receive a 2% discount on the purchase of common shares with reinvested dividends. SHAREHOLDER RIGHTS PLAN The Shareholder Rights Plan is designed to encourage the fair treatment of shareholders in connection with any takeover offer for the Company. Rights issued under the plan become exercisable when a person and any related parties acquires or announces its intention to acquire 20% or more of the Company’s outstanding common shares without complying with certain provisions set out in the plan or without approval of the Company’s Board of Directors. Should such an acquisition occur, each rights holder, other than the acquiring person and related parties, will have the right to purchase common shares of the Company at a 50% discount to the market price at that time.
22. STOCK OPTION AND STOCK UNIT PLANS The Company maintains four long-term incentive compensation plans: the ISO Plan, the PSO Plan, the PSU Plan and the RSU Plan. A maximum of 60 million common shares were reserved for issuance under the 2002 ISO plan, of which 50 million have been issued to date. A further 71 million common shares have been reserved for issuance for the 2007 ISO and PSO plans, of which 11 million have been exercised and issued from treasury to date. The PSU and RSU plans grant notional units as if a unit was one Enbridge common share and are payable in cash. INCENTIVE STOCK OPTIONS Key employees are granted ISO to purchase common shares at the market price on the grant date. ISO vest in equal annual instalments over a four-year period and expire 10 years after the issue date.
December 31, 2015 Number
Weighted Average Exercise
Price
Weighted Average
Remaining Contractual
Life (years)
Aggregate Intrinsic
Value (options in thousands; intrinsic value in millions of Canadian dollars) Options outstanding at beginning of year 31,330 34.97
Options granted
5,852 59.14
Options exercised1 (4,224) 26.61
Options cancelled or expired (170) 44.87
Options outstanding at end of year 32,788 40.31 6.3 525
Options vested at end of year2 18,297 31.66 4.8 451 1 The total intrinsic value of ISO exercised during the year ended December 31, 2015 was $126 million (2014 - $117 million;
2013 - $98 million) and cash received on exercise was $43 million (2014 - $37 million; 2013 - $24 million). 2 The total fair value of options vested under the ISO Plan during the year ended December 31, 2015 was $34 million (2014 -
$26 million; 2013 - $22 million).
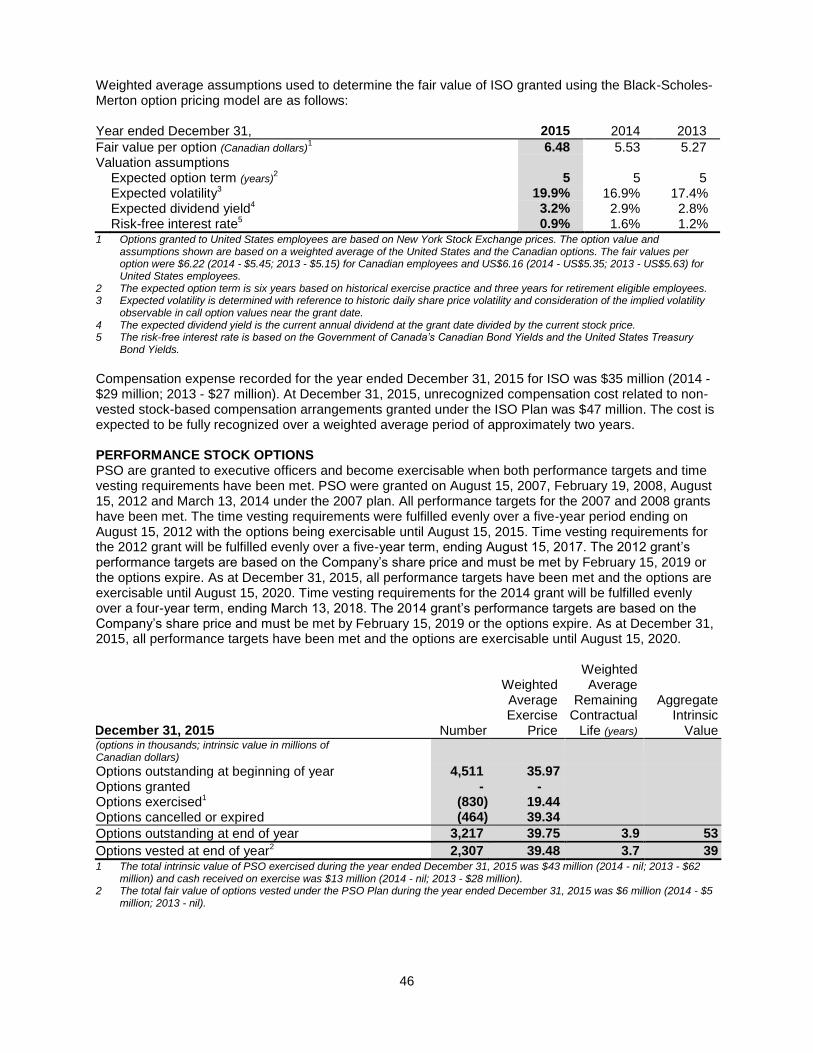
46
Weighted average assumptions used to determine the fair value of ISO granted using the Black-Scholes-Merton option pricing model are as follows: Year ended December 31, 2015 2014 2013
Fair value per option (Canadian dollars)1 6.48 5.53 5.27
Valuation assumptions Expected option term (years)
2 5 5 5 Expected volatility3 19.9% 16.9% 17.4% Expected dividend yield4 3.2% 2.9% 2.8% Risk-free interest rate5 0.9% 1.6% 1.2% 1 Options granted to United States employees are based on New York Stock Exchange prices. The option value and
assumptions shown are based on a weighted average of the United States and the Canadian options. The fair values per option were $6.22 (2014 - $5.45; 2013 - $5.15) for Canadian employees and US$6.16 (2014 - US$5.35; 2013 - US$5.63) for United States employees.
2 The expected option term is six years based on historical exercise practice and three years for retirement eligible employees. 3 Expected volatility is determined with reference to historic daily share price volatility and consideration of the implied volatility
observable in call option values near the grant date. 4 The expected dividend yield is the current annual dividend at the grant date divided by the current stock price. 5 The risk-free interest rate is based on the Government of Canada’s Canadian Bond Yields and the United States Treasury
Bond Yields.
Compensation expense recorded for the year ended December 31, 2015 for ISO was $35 million (2014 - $29 million; 2013 - $27 million). At December 31, 2015, unrecognized compensation cost related to non-vested stock-based compensation arrangements granted under the ISO Plan was $47 million. The cost is expected to be fully recognized over a weighted average period of approximately two years. PERFORMANCE STOCK OPTIONS PSO are granted to executive officers and become exercisable when both performance targets and time vesting requirements have been met. PSO were granted on August 15, 2007, February 19, 2008, August 15, 2012 and March 13, 2014 under the 2007 plan. All performance targets for the 2007 and 2008 grants have been met. The time vesting requirements were fulfilled evenly over a five-year period ending on August 15, 2012 with the options being exercisable until August 15, 2015. Time vesting requirements for the 2012 grant will be fulfilled evenly over a five-year term, ending August 15, 2017. The 2012 grant’s performance targets are based on the Company’s share price and must be met by February 15, 2019 or the options expire. As at December 31, 2015, all performance targets have been met and the options are exercisable until August 15, 2020. Time vesting requirements for the 2014 grant will be fulfilled evenly over a four-year term, ending March 13, 2018. The 2014 grant’s performance targets are based on the Company’s share price and must be met by February 15, 2019 or the options expire. As at December 31, 2015, all performance targets have been met and the options are exercisable until August 15, 2020.
December 31, 2015 Number
Weighted Average Exercise
Price
Weighted Average
Remaining Contractual
Life (years)
Aggregate Intrinsic
Value (options in thousands; intrinsic value in millions of Canadian dollars) Options outstanding at beginning of year 4,511 35.97
Options granted - -
Options exercised1 (830) 19.44
Options cancelled or expired (464) 39.34
Options outstanding at end of year 3,217 39.75 3.9 53
Options vested at end of year2 2,307 39.48 3.7 39 1 The total intrinsic value of PSO exercised during the year ended December 31, 2015 was $43 million (2014 - nil; 2013 - $62
million) and cash received on exercise was $13 million (2014 - nil; 2013 - $28 million). 2 The total fair value of options vested under the PSO Plan during the year ended December 31, 2015 was $6 million (2014 - $5
million; 2013 - nil).
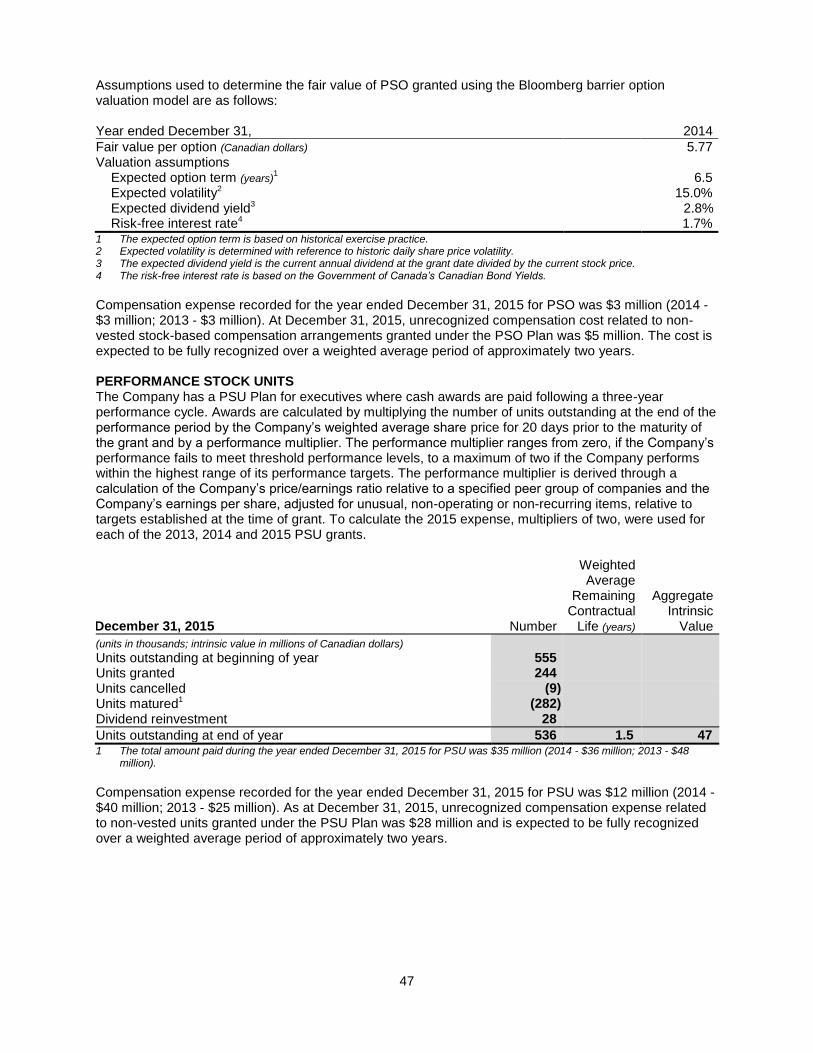
47
Assumptions used to determine the fair value of PSO granted using the Bloomberg barrier option valuation model are as follows: Year ended December 31, 2014
Fair value per option (Canadian dollars) 5.77 Valuation assumptions Expected option term (years)
1 6.5 Expected volatility2 15.0% Expected dividend yield3 2.8% Risk-free interest rate4 1.7% 1 The expected option term is based on historical exercise practice. 2 Expected volatility is determined with reference to historic daily share price volatility. 3 The expected dividend yield is the current annual dividend at the grant date divided by the current stock price. 4 The risk-free interest rate is based on the Government of Canada’s Canadian Bond Yields.
Compensation expense recorded for the year ended December 31, 2015 for PSO was $3 million (2014 - $3 million; 2013 - $3 million). At December 31, 2015, unrecognized compensation cost related to non-vested stock-based compensation arrangements granted under the PSO Plan was $5 million. The cost is expected to be fully recognized over a weighted average period of approximately two years. PERFORMANCE STOCK UNITS The Company has a PSU Plan for executives where cash awards are paid following a three-year performance cycle. Awards are calculated by multiplying the number of units outstanding at the end of the performance period by the Company’s weighted average share price for 20 days prior to the maturity of the grant and by a performance multiplier. The performance multiplier ranges from zero, if the Company’s performance fails to meet threshold performance levels, to a maximum of two if the Company performs within the highest range of its performance targets. The performance multiplier is derived through a calculation of the Company’s price/earnings ratio relative to a specified peer group of companies and the Company’s earnings per share, adjusted for unusual, non-operating or non-recurring items, relative to targets established at the time of grant. To calculate the 2015 expense, multipliers of two, were used for each of the 2013, 2014 and 2015 PSU grants.
December 31, 2015 Number
Weighted Average
Remaining Contractual
Life (years)
Aggregate Intrinsic
Value
(units in thousands; intrinsic value in millions of Canadian dollars) Units outstanding at beginning of year 555
Units granted
244
Units cancelled (9)
Units matured1 (282)
Dividend reinvestment 28
Units outstanding at end of year 536 1.5 47 1 The total amount paid during the year ended December 31, 2015 for PSU was $35 million (2014 - $36 million; 2013 - $48
million).
Compensation expense recorded for the year ended December 31, 2015 for PSU was $12 million (2014 - $40 million; 2013 - $25 million). As at December 31, 2015, unrecognized compensation expense related to non-vested units granted under the PSU Plan was $28 million and is expected to be fully recognized over a weighted average period of approximately two years.
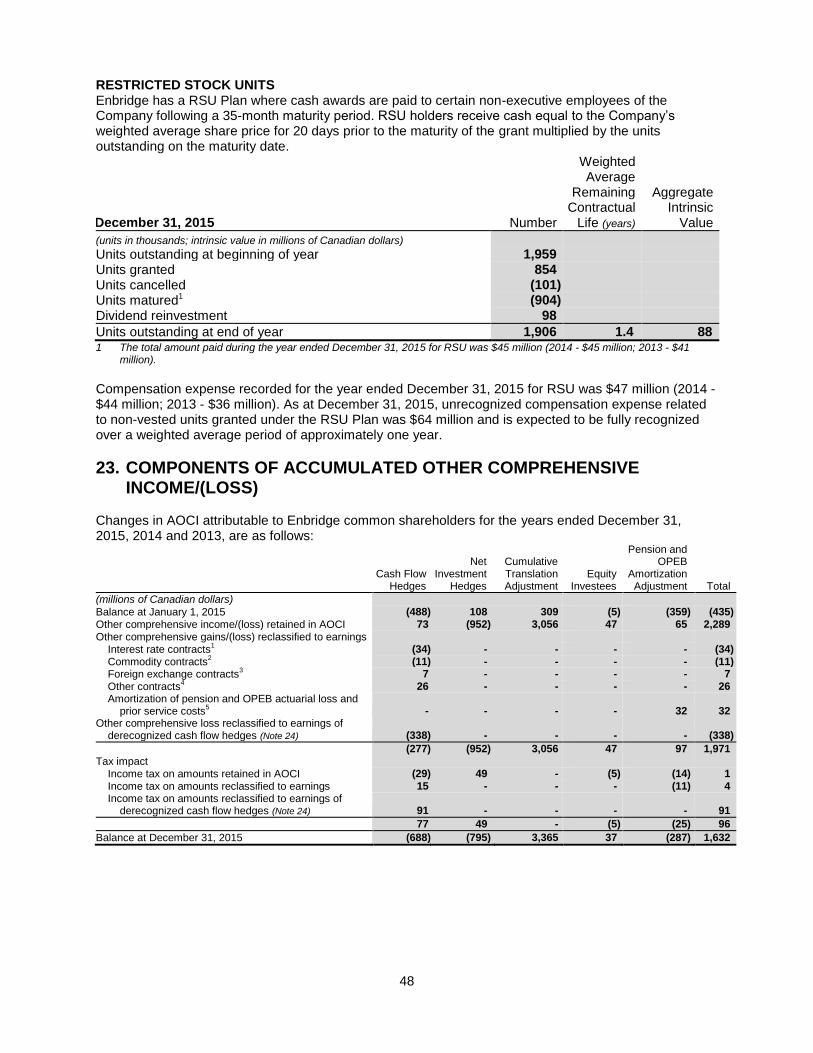
48
RESTRICTED STOCK UNITS Enbridge has a RSU Plan where cash awards are paid to certain non-executive employees of the Company following a 35-month maturity period. RSU holders receive cash equal to the Company’s weighted average share price for 20 days prior to the maturity of the grant multiplied by the units outstanding on the maturity date.
December 31, 2015 Number
Weighted Average
Remaining Contractual
Life (years)
Aggregate Intrinsic
Value
(units in thousands; intrinsic value in millions of Canadian dollars) Units outstanding at beginning of year 1,959
Units granted
854
Units cancelled (101)
Units matured1 (904)
Dividend reinvestment 98
Units outstanding at end of year 1,906 1.4 88 1 The total amount paid during the year ended December 31, 2015 for RSU was $45 million (2014 - $45 million; 2013 - $41
million).
Compensation expense recorded for the year ended December 31, 2015 for RSU was $47 million (2014 - $44 million; 2013 - $36 million). As at December 31, 2015, unrecognized compensation expense related to non-vested units granted under the RSU Plan was $64 million and is expected to be fully recognized over a weighted average period of approximately one year.
23. COMPONENTS OF ACCUMULATED OTHER COMPREHENSIVE INCOME/(LOSS)
Changes in AOCI attributable to Enbridge common shareholders for the years ended December 31, 2015, 2014 and 2013, are as follows:
Cash Flow Hedges
Net Investment
Hedges
Cumulative Translation Adjustment
Equity Investees
Pension and OPEB
Amortization Adjustment Total
(millions of Canadian dollars)
Balance at January 1, 2015 (488) 108 309 (5) (359) (435)
Other comprehensive income/(loss) retained in AOCI 73 (952) 3,056 47 65 2,289
Other comprehensive gains/(loss) reclassified to earnings
Interest rate contracts1
(34) - - - - (34)
Commodity contracts2
(11) - - - - (11) Foreign exchange contracts
3 7 - - - - 7
Other contracts4
26 - - - - 26 Amortization of pension and OPEB actuarial loss and
prior service costs5 - - - - 32 32
Other comprehensive loss reclassified to earnings of derecognized cash flow hedges (Note 24) (338) - - - - (338)
(277) (952) 3,056 47 97 1,971
Tax impact
Income tax on amounts retained in AOCI
(29) 49 - (5) (14) 1
Income tax on amounts reclassified to earnings
15 - - - (11) 4 Income tax on amounts reclassified to earnings of
derecognized cash flow hedges (Note 24)
91 - - - - 91
77 49 - (5) (25) 96
Balance at December 31, 2015 (688) (795) 3,365 37 (287) 1,632
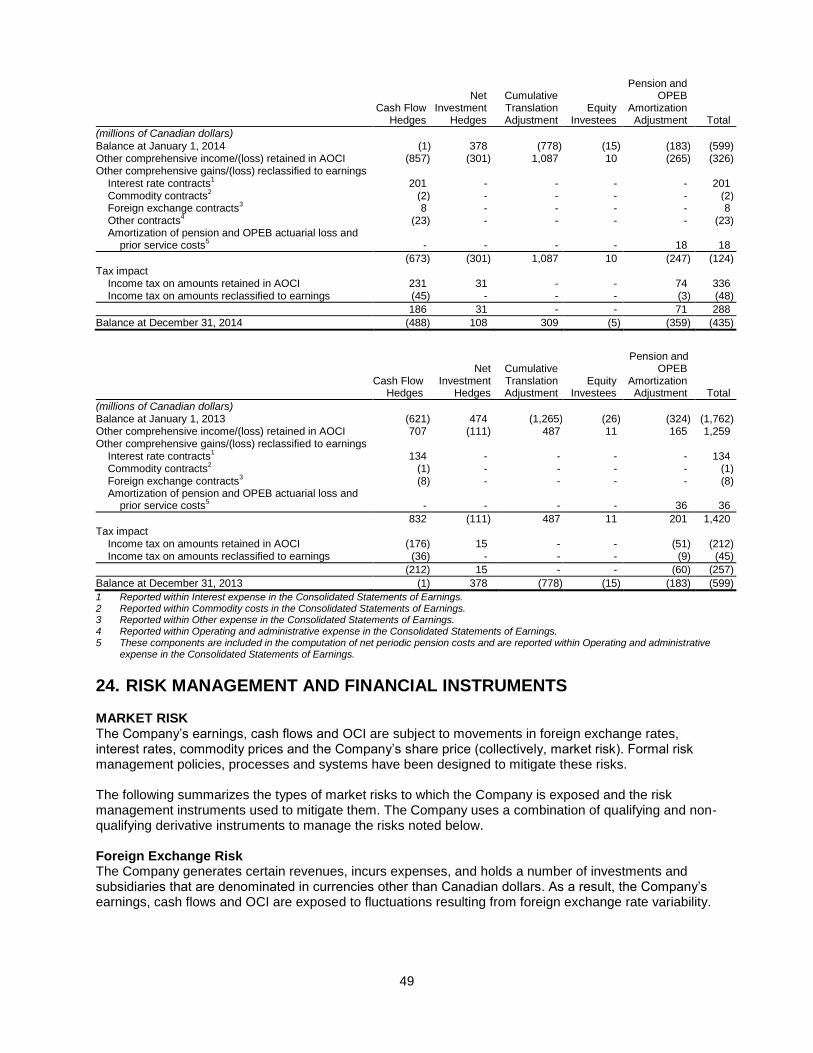
49
Cash Flow Hedges
Net Investment
Hedges
Cumulative Translation Adjustment
Equity Investees
Pension and OPEB
Amortization Adjustment Total
(millions of Canadian dollars)
Balance at January 1, 2014 (1) 378 (778) (15) (183) (599) Other comprehensive income/(loss) retained in AOCI (857) (301) 1,087 10 (265) (326) Other comprehensive gains/(loss) reclassified to earnings
Interest rate contracts1
201 - - - - 201 Commodity contracts
2 (2) - - - - (2)
Foreign exchange contracts3 8 - - - - 8
Other contracts4
(23) - - - - (23) Amortization of pension and OPEB actuarial loss and
prior service costs5 - - - - 18 18
(673) (301) 1,087 10 (247) (124) Tax impact
Income tax on amounts retained in AOCI
231 31 - - 74 336 Income tax on amounts reclassified to earnings
(45) - - - (3) (48)
186 31 - - 71 288
Balance at December 31, 2014 (488) 108 309 (5) (359) (435)
Cash Flow Hedges
Net Investment
Hedges
Cumulative Translation Adjustment
Equity Investees
Pension and OPEB
Amortization Adjustment Total
(millions of Canadian dollars)
Balance at January 1, 2013 (621) 474 (1,265) (26) (324) (1,762) Other comprehensive income/(loss) retained in AOCI 707 (111) 487 11 165 1,259 Other comprehensive gains/(loss) reclassified to earnings
Interest rate contracts1
134 - - - - 134 Commodity contracts
2 (1) - - - - (1)
Foreign exchange contracts3 (8) - - - - (8)
Amortization of pension and OPEB actuarial loss and prior service costs
5 - - - - 36 36
832 (111) 487 11 201 1,420 Tax impact
Income tax on amounts retained in AOCI
(176) 15 - - (51) (212) Income tax on amounts reclassified to earnings
(36) - - - (9) (45)
(212) 15 - - (60) (257)
Balance at December 31, 2013 (1) 378 (778) (15) (183) (599)
1 Reported within Interest expense in the Consolidated Statements of Earnings. 2 Reported within Commodity costs in the Consolidated Statements of Earnings. 3 Reported within Other expense in the Consolidated Statements of Earnings. 4 Reported within Operating and administrative expense in the Consolidated Statements of Earnings. 5 These components are included in the computation of net periodic pension costs and are reported within Operating and administrative
expense in the Consolidated Statements of Earnings.
24. RISK MANAGEMENT AND FINANCIAL INSTRUMENTS MARKET RISK The Company’s earnings, cash flows and OCI are subject to movements in foreign exchange rates, interest rates, commodity prices and the Company’s share price (collectively, market risk). Formal risk management policies, processes and systems have been designed to mitigate these risks. The following summarizes the types of market risks to which the Company is exposed and the risk management instruments used to mitigate them. The Company uses a combination of qualifying and non-qualifying derivative instruments to manage the risks noted below. Foreign Exchange Risk The Company generates certain revenues, incurs expenses, and holds a number of investments and subsidiaries that are denominated in currencies other than Canadian dollars. As a result, the Company’s earnings, cash flows and OCI are exposed to fluctuations resulting from foreign exchange rate variability.
50
The Company has implemented a policy whereby, at a minimum, it hedges a level of foreign currency denominated earnings exposures over a five year forecast horizon. A combination of qualifying and non-qualifying derivative instruments is used to hedge anticipated foreign currency denominated revenues and expenses, and to manage variability in cash flows. The Company hedges certain net investments in United States dollar denominated investments and subsidiaries using foreign currency derivatives and United States dollar denominated debt. Interest Rate Risk The Company’s earnings and cash flows are exposed to short term interest rate variability due to the regular repricing of its variable rate debt, primarily commercial paper. Pay fixed-receive floating interest rate swaps and options are used to hedge against the effect of future interest rate movements. The Company has implemented a program to significantly mitigate the impact of short-term interest rate volatility on interest expense through 2019 via execution of floating to fixed interest rate swaps with an average swap rate of 2.0%. The Company’s earnings and cash flows are also exposed to variability in longer term interest rates ahead of anticipated fixed rate debt issuances. Forward starting interest rate swaps are used to hedge against the effect of future interest rate movements. The Company has implemented a program to significantly mitigate its exposure to long-term interest rate variability on select forecast term debt issuances through 2019 via execution of floating to fixed interest rate swaps with an average swap rate of 3.4%. The Company also monitors its debt portfolio mix of fixed and variable rate debt instruments to maintain a consolidated portfolio of debt within its Board of Directors approved policy limit of a maximum of 25% floating rate debt as a percentage of total debt outstanding. The Company uses primarily qualifying derivative instruments to manage interest rate risk. Commodity Price Risk The Company’s earnings and cash flows are exposed to changes in commodity prices as a result of its ownership interests in certain assets and investments, as well as through the activities of its energy services subsidiaries. These commodities include natural gas, crude oil, power and NGL. The Company employs financial derivative instruments to fix a portion of the variable price exposures that arise from physical transactions involving these commodities. The Company uses primarily non-qualifying derivative instruments to manage commodity price risk. Equity Price Risk Equity price risk is the risk of earnings fluctuations due to changes in the Company’s share price. The Company has exposure to its own common share price through the issuance of various forms of stock-based compensation, which affect earnings through revaluation of the outstanding units every period. The Company uses equity derivatives to manage the earnings volatility derived from one form of stock-based compensation, RSU. The Company uses a combination of qualifying and non-qualifying derivative instruments to manage equity price risk. TOTAL DERIVATIVE INSTRUMENTS The following table summarizes the Consolidated Statements of Financial Position location and carrying value of the Company’s derivative instruments. The Company did not have any outstanding fair value hedges as at December 31, 2015 or 2014. The Company generally has a policy of entering into individual International Swaps and Derivatives Association, Inc. (ISDA) agreements, or other similar derivative agreements, with the majority of its derivative counterparties. These agreements provide for the net settlement of derivative instruments outstanding with specific counterparties in the event of bankruptcy or other significant credit event, and would reduce the Company’s credit risk exposure on derivative asset positions outstanding with the counterparties in these particular circumstances. The following table also summarizes the maximum potential settlement amount in the event of these specific circumstances. All amounts are presented gross in the Consolidated Statements of Financial Position.
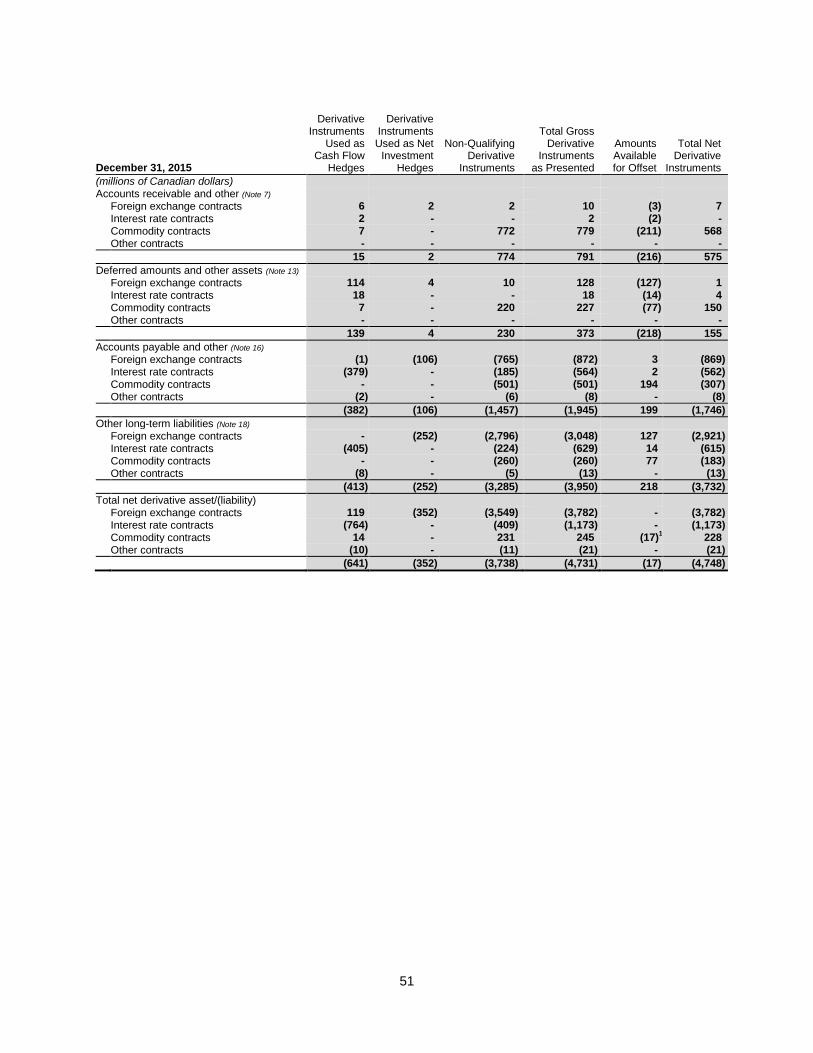
51
Derivative Instruments
Used as Cash Flow
Hedges
Derivative Instruments Used as Net
Investment Hedges
Non-Qualifying Derivative
Instruments
Total Gross Derivative
Instruments as Presented
Amounts Available for Offset
Total Net Derivative
Instruments December 31, 2015
(millions of Canadian dollars)
Accounts receivable and other (Note 7)
Foreign exchange contracts 6 2 2 10 (3) 7 Interest rate contracts 2 - - 2 (2) - Commodity contracts 7 - 772 779 (211) 568 Other contracts - - - - - -
15 2 774 791 (216) 575
Deferred amounts and other assets (Note 13) Foreign exchange contracts 114 4 10 128 (127) 1 Interest rate contracts 18 - - 18 (14) 4 Commodity contracts 7 - 220 227 (77) 150
Other contracts - - - - - -
139 4 230 373 (218) 155
Accounts payable and other (Note 16) Foreign exchange contracts (1) (106) (765) (872) 3 (869) Interest rate contracts (379) - (185) (564) 2 (562) Commodity contracts - - (501) (501) 194 (307) Other contracts (2) - (6) (8) - (8)
(382) (106) (1,457) (1,945) 199 (1,746)
Other long-term liabilities (Note 18) Foreign exchange contracts - (252) (2,796) (3,048) 127 (2,921) Interest rate contracts (405) - (224) (629) 14 (615) Commodity contracts - - (260) (260) 77 (183) Other contracts (8) - (5) (13) - (13)
(413) (252) (3,285) (3,950) 218 (3,732)
Total net derivative asset/(liability) Foreign exchange contracts 119 (352) (3,549) (3,782) - (3,782) Interest rate contracts (764) - (409) (1,173) - (1,173) Commodity contracts 14 - 231 245 (17)
1 228
Other contracts (10) - (11) (21) - (21)
(641) (352) (3,738) (4,731) (17) (4,748)
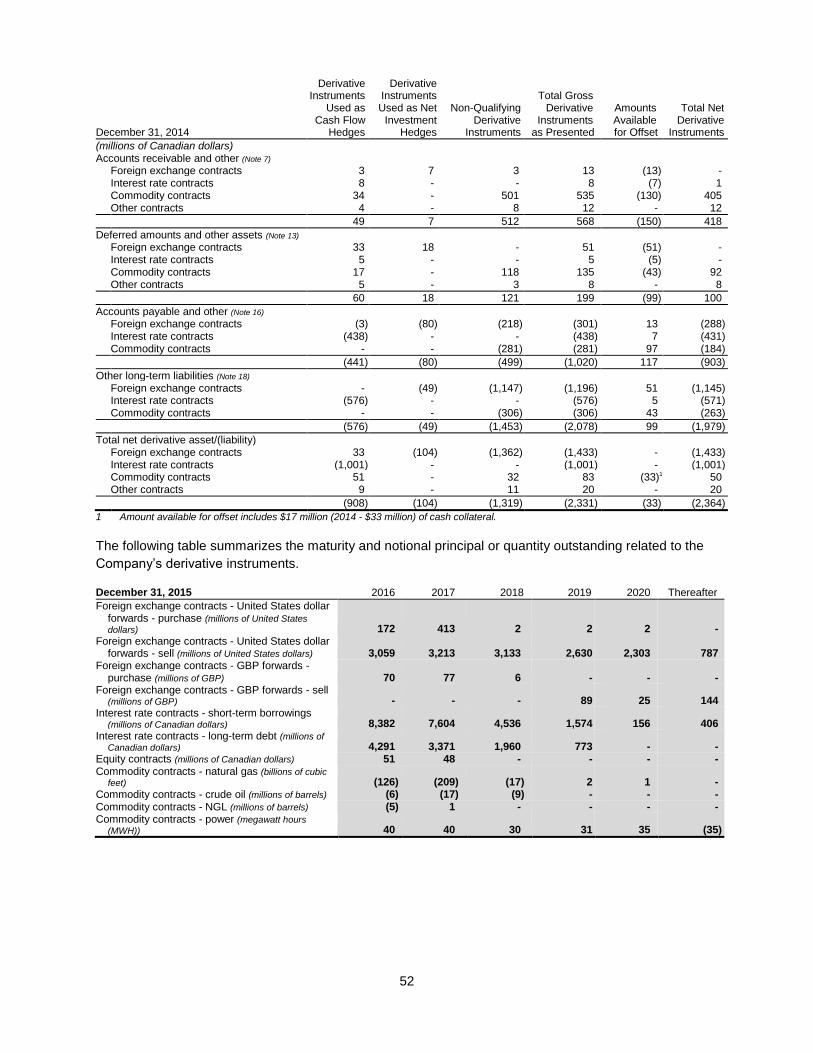
52
December 31, 2014
Derivative Instruments
Used as Cash Flow
Hedges
Derivative Instruments Used as Net
Investment Hedges
Non-Qualifying Derivative
Instruments
Total Gross Derivative
Instruments as Presented
Amounts Available for Offset
Total Net Derivative
Instruments
(millions of Canadian dollars) Accounts receivable and other (Note 7) Foreign exchange contracts 3 7 3 13 (13) - Interest rate contracts 8 - - 8 (7) 1 Commodity contracts 34 - 501 535 (130) 405 Other contracts 4 - 8 12 - 12
49 7 512 568 (150) 418
Deferred amounts and other assets (Note 13) Foreign exchange contracts 33 18 - 51 (51) - Interest rate contracts 5 - - 5 (5) - Commodity contracts 17 - 118 135 (43) 92 Other contracts 5 - 3 8 - 8
60 18 121 199 (99) 100
Accounts payable and other (Note 16) Foreign exchange contracts (3) (80) (218) (301) 13 (288) Interest rate contracts (438) - - (438) 7 (431) Commodity contracts - - (281) (281) 97 (184)
(441) (80) (499) (1,020) 117 (903)
Other long-term liabilities (Note 18) Foreign exchange contracts - (49) (1,147) (1,196) 51 (1,145) Interest rate contracts (576) - - (576) 5 (571) Commodity contracts - - (306) (306) 43 (263)
(576) (49) (1,453) (2,078) 99 (1,979)
Total net derivative asset/(liability) Foreign exchange contracts 33 (104) (1,362) (1,433) - (1,433) Interest rate contracts (1,001) - - (1,001) - (1,001) Commodity contracts 51 - 32 83 (33)1 50 Other contracts 9 - 11 20 - 20
(908) (104) (1,319) (2,331) (33) (2,364)
1 Amount available for offset includes $17 million (2014 - $33 million) of cash collateral.
The following table summarizes the maturity and notional principal or quantity outstanding related to the
Company’s derivative instruments.
December 31, 2015 2016 2017 2018 2019 2020 Thereafter
Foreign exchange contracts - United States dollar forwards - purchase (millions of United States
dollars) 172 413 2 2 2 - Foreign exchange contracts - United States dollar
forwards - sell (millions of United States dollars) 3,059 3,213 3,133 2,630 2,303 787 Foreign exchange contracts - GBP forwards -
purchase (millions of GBP) 70 77 6 - - - Foreign exchange contracts - GBP forwards - sell
(millions of GBP) - - - 89 25 144 Interest rate contracts - short-term borrowings
(millions of Canadian dollars) 8,382 7,604 4,536 1,574 156 406 Interest rate contracts - long-term debt (millions of
Canadian dollars) 4,291 3,371 1,960 773 - - Equity contracts (millions of Canadian dollars) 51 48 - - - - Commodity contracts - natural gas (billions of cubic
feet) (126) (209) (17) 2 1 - Commodity contracts - crude oil (millions of barrels) (6) (17) (9) - - - Commodity contracts - NGL (millions of barrels) (5) 1 - - - - Commodity contracts - power (megawatt hours
(MWH)) 40 40 30 31 35 (35)
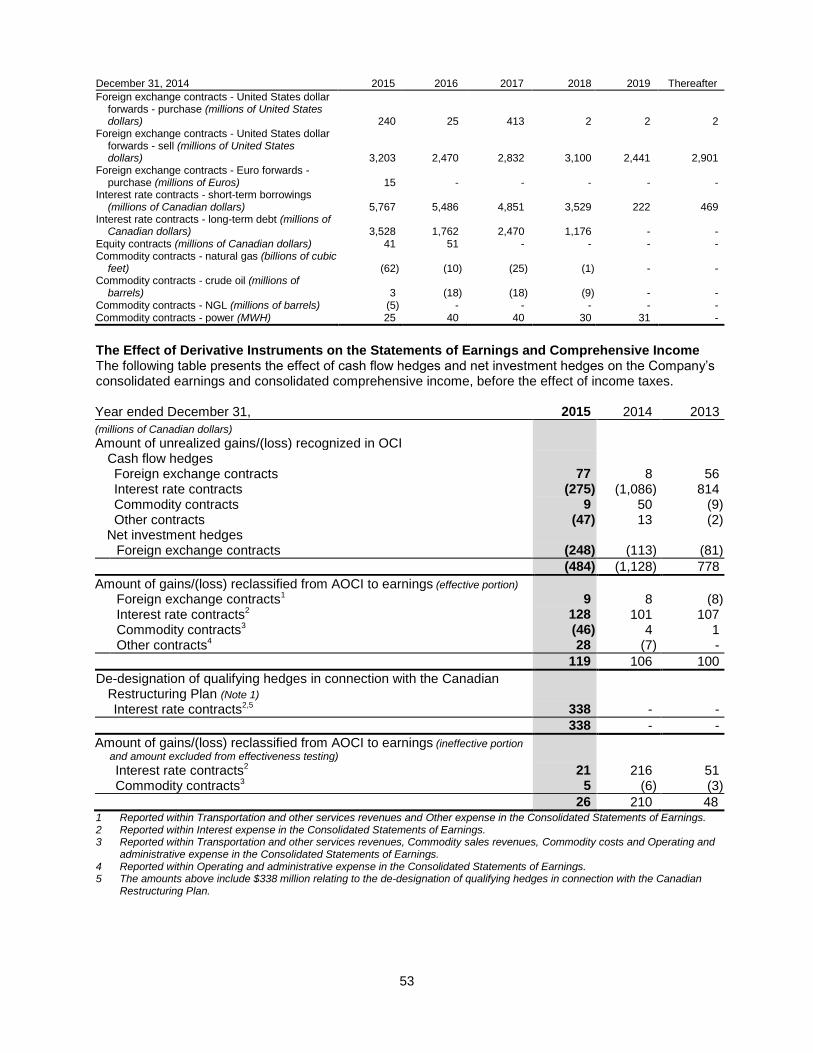
53
December 31, 2014 2015 2016 2017 2018 2019 Thereafter
Foreign exchange contracts - United States dollar forwards - purchase (millions of United States dollars) 240 25 413 2 2 2
Foreign exchange contracts - United States dollar forwards - sell (millions of United States dollars) 3,203 2,470 2,832 3,100 2,441 2,901
Foreign exchange contracts - Euro forwards - purchase (millions of Euros) 15 - - - - -
Interest rate contracts - short-term borrowings (millions of Canadian dollars) 5,767 5,486 4,851 3,529 222 469
Interest rate contracts - long-term debt (millions of Canadian dollars) 3,528 1,762 2,470 1,176 - -
Equity contracts (millions of Canadian dollars) 41 51 - - - - Commodity contracts - natural gas (billions of cubic
feet) (62) (10) (25) (1) - - Commodity contracts - crude oil (millions of
barrels) 3 (18) (18) (9) - - Commodity contracts - NGL (millions of barrels) (5) - - - - - Commodity contracts - power (MWH) 25 40 40 30 31 -
The Effect of Derivative Instruments on the Statements of Earnings and Comprehensive Income The following table presents the effect of cash flow hedges and net investment hedges on the Company’s consolidated earnings and consolidated comprehensive income, before the effect of income taxes. Year ended December 31, 2015 2014 2013
(millions of Canadian dollars) Amount of unrealized gains/(loss) recognized in OCI
Cash flow hedges Foreign exchange contracts 77 8 56 Interest rate contracts (275) (1,086) 814 Commodity contracts 9 50 (9) Other contracts
(47) 13 (2)
Net investment hedges Foreign exchange contracts
(248) (113) (81)
(484) (1,128) 778
Amount of gains/(loss) reclassified from AOCI to earnings (effective portion)
Foreign exchange contracts1 9 8 (8)
Interest rate contracts2 128 101 107 Commodity contracts3 (46) 4 1 Other contracts4
28 (7) -
119 106 100
De-designation of qualifying hedges in connection with the Canadian Restructuring Plan (Note 1) Interest rate contracts2,5 338 - -
338 - -
Amount of gains/(loss) reclassified from AOCI to earnings (ineffective portion
and amount excluded from effectiveness testing) Interest rate contracts2 21 216 51 Commodity contracts3 5 (6) (3)
26 210 48 1 Reported within Transportation and other services revenues and Other expense in the Consolidated Statements of Earnings. 2 Reported within Interest expense in the Consolidated Statements of Earnings. 3 Reported within Transportation and other services revenues, Commodity sales revenues, Commodity costs and Operating and
administrative expense in the Consolidated Statements of Earnings. 4 Reported within Operating and administrative expense in the Consolidated Statements of Earnings. 5 The amounts above include $338 million relating to the de-designation of qualifying hedges in connection with the Canadian
Restructuring Plan.
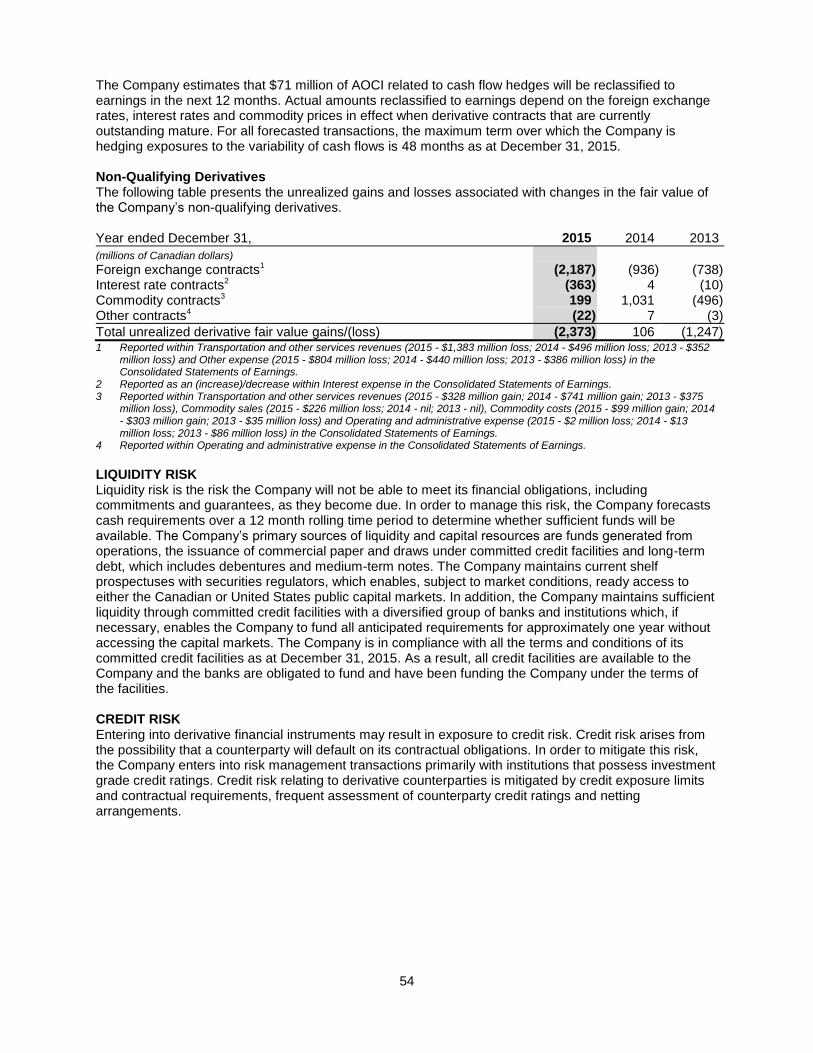
54
The Company estimates that $71 million of AOCI related to cash flow hedges will be reclassified to earnings in the next 12 months. Actual amounts reclassified to earnings depend on the foreign exchange rates, interest rates and commodity prices in effect when derivative contracts that are currently outstanding mature. For all forecasted transactions, the maximum term over which the Company is hedging exposures to the variability of cash flows is 48 months as at December 31, 2015. Non-Qualifying Derivatives The following table presents the unrealized gains and losses associated with changes in the fair value of the Company’s non-qualifying derivatives. Year ended December 31, 2015 2014 2013
(millions of Canadian dollars)
Foreign exchange contracts1 (2,187) (936) (738)
Interest rate contracts2 (363) 4 (10)
Commodity contracts3 199 1,031 (496) Other contracts4 (22) 7 (3)
Total unrealized derivative fair value gains/(loss) (2,373) 106 (1,247)
1 Reported within Transportation and other services revenues (2015 - $1,383 million loss; 2014 - $496 million loss; 2013 - $352 million loss) and Other expense (2015 - $804 million loss; 2014 - $440 million loss; 2013 - $386 million loss) in the Consolidated Statements of Earnings.
2 Reported as an (increase)/decrease within Interest expense in the Consolidated Statements of Earnings. 3 Reported within Transportation and other services revenues (2015 - $328 million gain; 2014 - $741 million gain; 2013 - $375
million loss), Commodity sales (2015 - $226 million loss; 2014 - nil; 2013 - nil), Commodity costs (2015 - $99 million gain; 2014 - $303 million gain; 2013 - $35 million loss) and Operating and administrative expense (2015 - $2 million loss; 2014 - $13 million loss; 2013 - $86 million loss) in the Consolidated Statements of Earnings.
4 Reported within Operating and administrative expense in the Consolidated Statements of Earnings.
LIQUIDITY RISK Liquidity risk is the risk the Company will not be able to meet its financial obligations, including commitments and guarantees, as they become due. In order to manage this risk, the Company forecasts cash requirements over a 12 month rolling time period to determine whether sufficient funds will be available. The Company’s primary sources of liquidity and capital resources are funds generated from operations, the issuance of commercial paper and draws under committed credit facilities and long-term debt, which includes debentures and medium-term notes. The Company maintains current shelf prospectuses with securities regulators, which enables, subject to market conditions, ready access to either the Canadian or United States public capital markets. In addition, the Company maintains sufficient liquidity through committed credit facilities with a diversified group of banks and institutions which, if necessary, enables the Company to fund all anticipated requirements for approximately one year without accessing the capital markets. The Company is in compliance with all the terms and conditions of its committed credit facilities as at December 31, 2015. As a result, all credit facilities are available to the Company and the banks are obligated to fund and have been funding the Company under the terms of the facilities. CREDIT RISK Entering into derivative financial instruments may result in exposure to credit risk. Credit risk arises from the possibility that a counterparty will default on its contractual obligations. In order to mitigate this risk, the Company enters into risk management transactions primarily with institutions that possess investment grade credit ratings. Credit risk relating to derivative counterparties is mitigated by credit exposure limits and contractual requirements, frequent assessment of counterparty credit ratings and netting arrangements.

55
The Company had group credit concentrations and maximum credit exposure, with respect to derivative instruments, in the following counterparty segments: December 31, 2015 2014
(millions of Canadian dollars) Canadian financial institutions 47 58 United States financial institutions 450 240 European financial institutions 95 73 Asian financial institutions 4 - Other1 213 310
809 681 1 Other is comprised of commodity clearing house and physical natural gas and crude oil counterparties.
As at December 31, 2015, the Company had provided letters of credit totalling $166 million in lieu of providing cash collateral to its counterparties pursuant to the terms of the relevant ISDA agreements. The Company held $17 million of cash collateral on derivative asset exposures at December 31, 2015 and $33 million of cash collateral at December 31, 2014. Gross derivative balances have been presented without the effects of collateral posted. Derivative assets are adjusted for non-performance risk of the Company’s counterparties using their credit default swap spread rates, and are reflected at fair value. For derivative liabilities, the Company’s non-performance risk is considered in the valuation. Credit risk also arises from trade and other long-term receivables, and is mitigated through credit exposure limits and contractual requirements, assessment of credit ratings and netting arrangements. Within Gas Distribution, credit risk is mitigated by the large and diversified customer base and the ability to recover an estimate for doubtful accounts through the ratemaking process. The Company actively monitors the financial strength of large industrial customers and, in select cases, has obtained additional security to minimize the risk of default on receivables. Generally, the Company classifies and provides for receivables older than 30 days as past due. The maximum exposure to credit risk related to non-derivative financial assets is their carrying value. FAIR VALUE MEASUREMENTS The Company’s financial assets and liabilities measured at fair value on a recurring basis include derivative instruments. The Company also discloses the fair value of other financial instruments not measured at fair value. The fair value of financial instruments reflects the Company’s best estimates of market value based on generally accepted valuation techniques or models and are supported by observable market prices and rates. When such values are not available, the Company uses discounted cash flow analysis from applicable yield curves based on observable market inputs to estimate fair value. FAIR VALUE OF FINANCIAL INSTRUMENTS The Company categorizes its derivative instruments measured at fair value into one of three different levels depending on the observability of the inputs employed in the measurement. Level 1 Level 1 includes derivatives measured at fair value based on unadjusted quoted prices for identical assets and liabilities in active markets that are accessible at the measurement date. An active market for a derivative is considered to be a market where transactions occur with sufficient frequency and volume to provide pricing information on an ongoing basis. The Company’s Level 1 instruments consist primarily of exchange-traded derivatives used to mitigate the risk of crude oil price fluctuations.

56
Level 2 Level 2 includes derivative valuations determined using directly or indirectly observable inputs other than quoted prices included within Level 1. Derivatives in this category are valued using models or other industry standard valuation techniques derived from observable market data. Such valuation techniques include inputs such as quoted forward prices, time value, volatility factors and broker quotes that can be observed or corroborated in the market for the entire duration of the derivative. Derivatives valued using Level 2 inputs include non-exchange traded derivatives such as over-the-counter foreign exchange forward and cross currency swap contracts, interest rate swaps, physical forward commodity contracts, as well as commodity swaps and options for which observable inputs can be obtained. The Company has also categorized the fair value of its held to maturity preferred share investment and long-term debt as Level 2. The fair value of the Company’s held to maturity preferred share investment is primarily based on the yield of certain Government of Canada bonds. The fair value of the Company’s long-term debt is based on quoted market prices for instruments of similar yield, credit risk and tenor. Level 3 Level 3 includes derivative valuations based on inputs which are less observable, unavailable or where the observable data does not support a significant portion of the derivatives’ fair value. Generally, Level 3 derivatives are longer dated transactions, occur in less active markets, occur at locations where pricing information is not available or have no binding broker quote to support Level 2 classification. The Company has developed methodologies, benchmarked against industry standards, to determine fair value for these derivatives based on extrapolation of observable future prices and rates. Derivatives valued using Level 3 inputs primarily include long-dated derivative power contracts and NGL and natural gas contracts, basis swaps, commodity swaps, power and energy swaps, as well as options. The Company does not have any other financial instruments categorized in Level 3. The Company uses the most observable inputs available to estimate the fair value of its derivatives. When possible, the Company estimates the fair value of its derivatives based on quoted market prices. If quoted market prices are not available, the Company uses estimates from third party brokers. For non-exchange traded derivatives classified in Levels 2 and 3, the Company uses standard valuation techniques to calculate the estimated fair value. These methods include discounted cash flows for forwards and swaps and Black-Scholes-Merton pricing models for options. Depending on the type of derivative and nature of the underlying risk, the Company uses observable market prices (interest, foreign exchange, commodity and share price) and volatility as primary inputs to these valuation techniques. Finally, the Company considers its own credit default swap spread as well as the credit default swap spreads associated with its counterparties in its estimation of fair value.
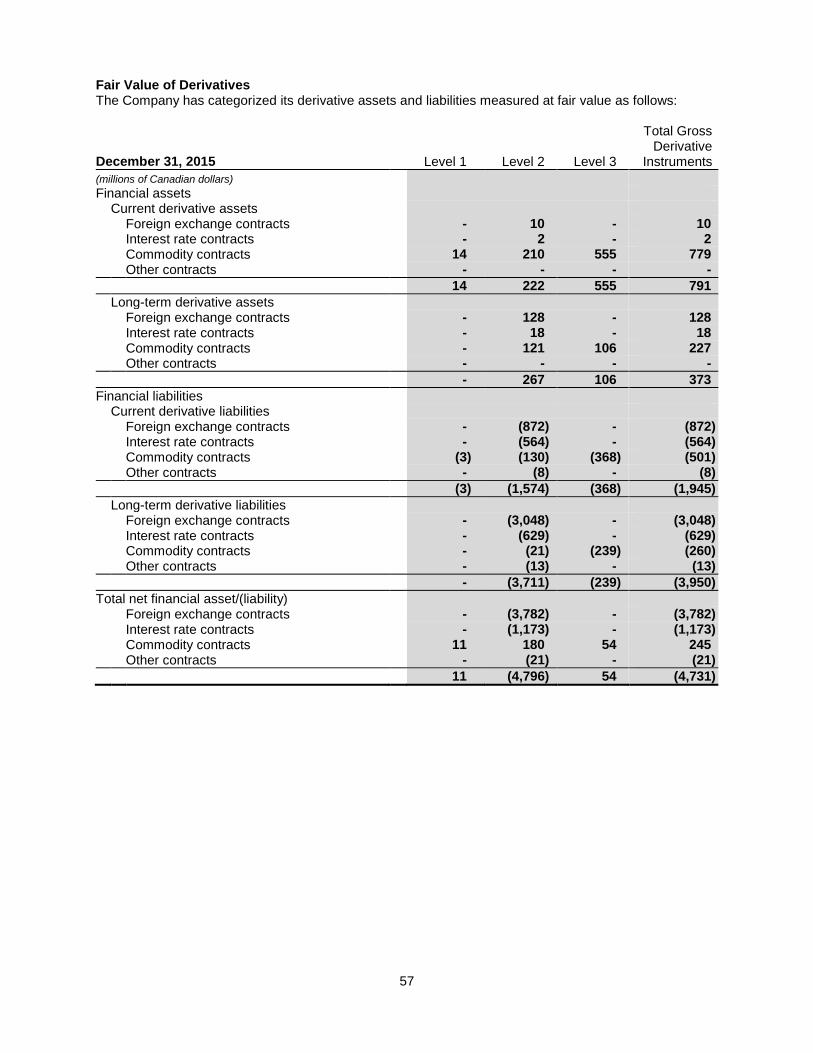
57
Fair Value of Derivatives The Company has categorized its derivative assets and liabilities measured at fair value as follows:
December 31, 2015 Level 1 Level 2 Level 3
Total Gross Derivative
Instruments
(millions of Canadian dollars) Financial assets Current derivative assets Foreign exchange contracts - 10 - 10 Interest rate contracts - 2 - 2 Commodity contracts 14 210 555 779 Other contracts - - - -
14 222 555 791
Long-term derivative assets Foreign exchange contracts - 128 - 128 Interest rate contracts - 18 - 18 Commodity contracts - 121 106 227 Other contracts - - - -
- 267 106 373
Financial liabilities Current derivative liabilities Foreign exchange contracts - (872) - (872) Interest rate contracts - (564) - (564) Commodity contracts (3) (130) (368) (501) Other contracts - (8) - (8)
(3) (1,574) (368) (1,945)
Long-term derivative liabilities Foreign exchange contracts - (3,048) - (3,048) Interest rate contracts - (629) - (629) Commodity contracts - (21) (239) (260) Other contracts - (13) - (13)
- (3,711) (239) (3,950)
Total net financial asset/(liability) Foreign exchange contracts - (3,782) - (3,782) Interest rate contracts - (1,173) - (1,173) Commodity contracts 11 180 54 245 Other contracts - (21) - (21)
11 (4,796) 54 (4,731)
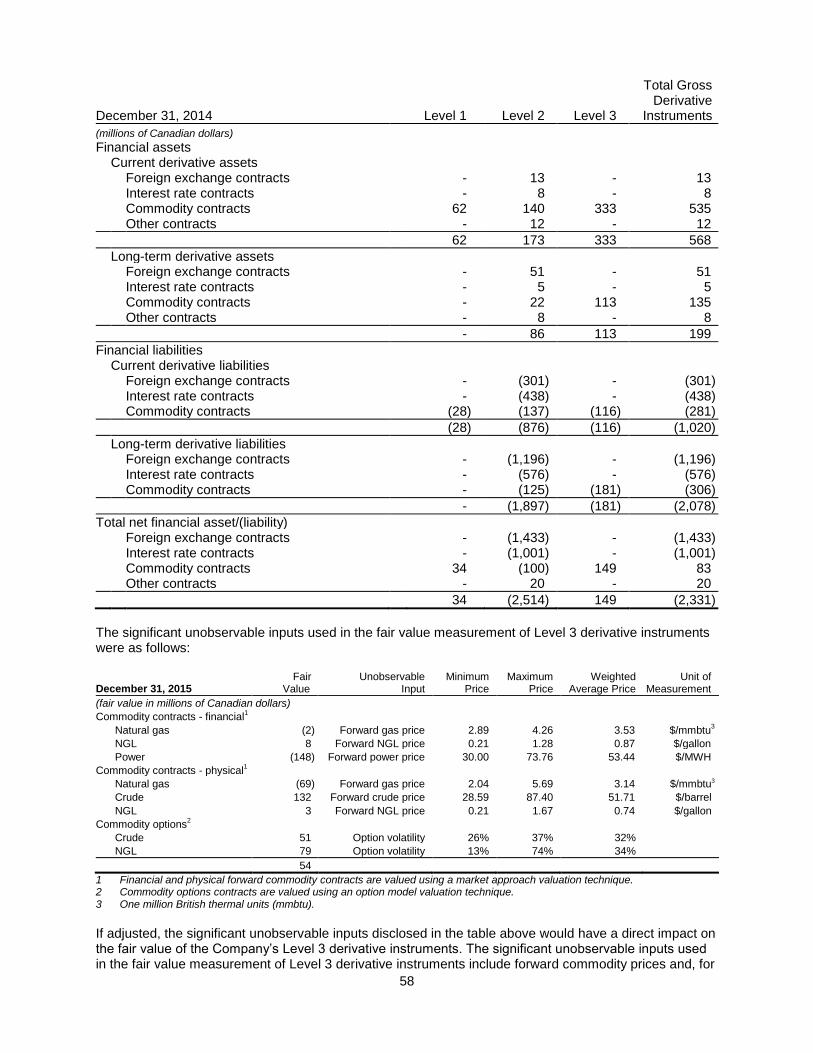
58
December 31, 2014 Level 1 Level 2 Level 3
Total Gross Derivative
Instruments
(millions of Canadian dollars) Financial assets Current derivative assets Foreign exchange contracts - 13 - 13 Interest rate contracts - 8 - 8 Commodity contracts 62 140 333 535 Other contracts - 12 - 12
62 173 333 568
Long-term derivative assets Foreign exchange contracts - 51 - 51 Interest rate contracts - 5 - 5 Commodity contracts - 22 113 135 Other contracts - 8 - 8
- 86 113 199
Financial liabilities Current derivative liabilities Foreign exchange contracts - (301) - (301) Interest rate contracts - (438) - (438) Commodity contracts (28) (137) (116) (281)
(28) (876) (116) (1,020)
Long-term derivative liabilities Foreign exchange contracts - (1,196) - (1,196) Interest rate contracts - (576) - (576) Commodity contracts - (125) (181) (306)
- (1,897) (181) (2,078)
Total net financial asset/(liability) Foreign exchange contracts - (1,433) - (1,433) Interest rate contracts - (1,001) - (1,001) Commodity contracts 34 (100) 149 83 Other contracts - 20 - 20
34 (2,514) 149 (2,331)
The significant unobservable inputs used in the fair value measurement of Level 3 derivative instruments were as follows:
December 31, 2015 Fair
Value Unobservable
Input Minimum
Price Maximum
Price Weighted
Average Price Unit of
Measurement
(fair value in millions of Canadian dollars)
Commodity contracts - financial1
Natural gas (2) Forward gas price 2.89 4.26 3.53 $/mmbtu3
NGL 8 Forward NGL price 0.21 1.28 0.87 $/gallon
Power (148) Forward power price 30.00 73.76 53.44 $/MWH
Commodity contracts - physical1
Natural gas (69) Forward gas price 2.04 5.69 3.14 $/mmbtu3
Crude 132 Forward crude price 28.59 87.40 51.71 $/barrel
NGL 3 Forward NGL price 0.21 1.67 0.74 $/gallon
Commodity options2
Crude 51 Option volatility 26% 37% 32%
NGL 79 Option volatility 13% 74% 34%
54
1 Financial and physical forward commodity contracts are valued using a market approach valuation technique. 2 Commodity options contracts are valued using an option model valuation technique. 3 One million British thermal units (mmbtu).
If adjusted, the significant unobservable inputs disclosed in the table above would have a direct impact on the fair value of the Company’s Level 3 derivative instruments. The significant unobservable inputs used in the fair value measurement of Level 3 derivative instruments include forward commodity prices and, for
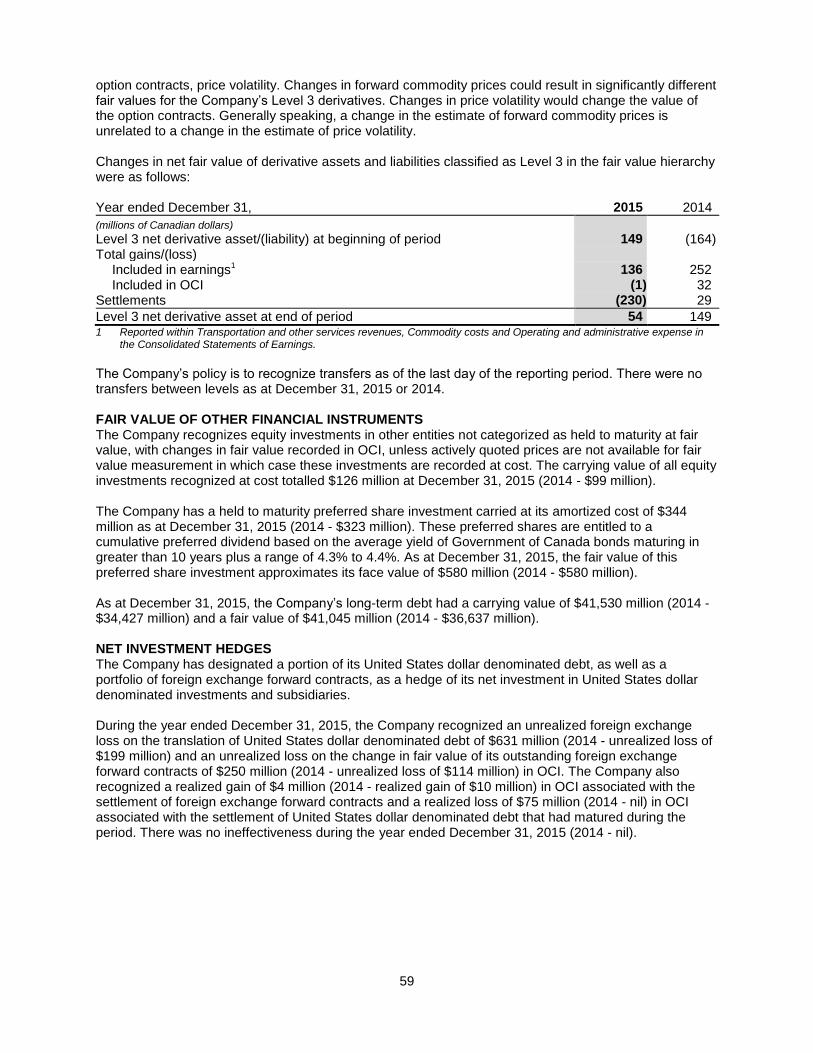
59
option contracts, price volatility. Changes in forward commodity prices could result in significantly different fair values for the Company’s Level 3 derivatives. Changes in price volatility would change the value of the option contracts. Generally speaking, a change in the estimate of forward commodity prices is unrelated to a change in the estimate of price volatility. Changes in net fair value of derivative assets and liabilities classified as Level 3 in the fair value hierarchy were as follows: Year ended December 31, 2015 2014
(millions of Canadian dollars)
Level 3 net derivative asset/(liability) at beginning of period 149 (164) Total gains/(loss)
Included in earnings1 136 252 Included in OCI
(1) 32
Settlements (230) 29
Level 3 net derivative asset at end of period 54 149 1 Reported within Transportation and other services revenues, Commodity costs and Operating and administrative expense in
the Consolidated Statements of Earnings.
The Company’s policy is to recognize transfers as of the last day of the reporting period. There were no transfers between levels as at December 31, 2015 or 2014. FAIR VALUE OF OTHER FINANCIAL INSTRUMENTS The Company recognizes equity investments in other entities not categorized as held to maturity at fair value, with changes in fair value recorded in OCI, unless actively quoted prices are not available for fair value measurement in which case these investments are recorded at cost. The carrying value of all equity investments recognized at cost totalled $126 million at December 31, 2015 (2014 - $99 million). The Company has a held to maturity preferred share investment carried at its amortized cost of $344 million as at December 31, 2015 (2014 - $323 million). These preferred shares are entitled to a cumulative preferred dividend based on the average yield of Government of Canada bonds maturing in greater than 10 years plus a range of 4.3% to 4.4%. As at December 31, 2015, the fair value of this preferred share investment approximates its face value of $580 million (2014 - $580 million). As at December 31, 2015, the Company’s long-term debt had a carrying value of $41,530 million (2014 - $34,427 million) and a fair value of $41,045 million (2014 - $36,637 million). NET INVESTMENT HEDGES The Company has designated a portion of its United States dollar denominated debt, as well as a portfolio of foreign exchange forward contracts, as a hedge of its net investment in United States dollar denominated investments and subsidiaries. During the year ended December 31, 2015, the Company recognized an unrealized foreign exchange loss on the translation of United States dollar denominated debt of $631 million (2014 - unrealized loss of $199 million) and an unrealized loss on the change in fair value of its outstanding foreign exchange forward contracts of $250 million (2014 - unrealized loss of $114 million) in OCI. The Company also recognized a realized gain of $4 million (2014 - realized gain of $10 million) in OCI associated with the settlement of foreign exchange forward contracts and a realized loss of $75 million (2014 - nil) in OCI associated with the settlement of United States dollar denominated debt that had matured during the period. There was no ineffectiveness during the year ended December 31, 2015 (2014 - nil).
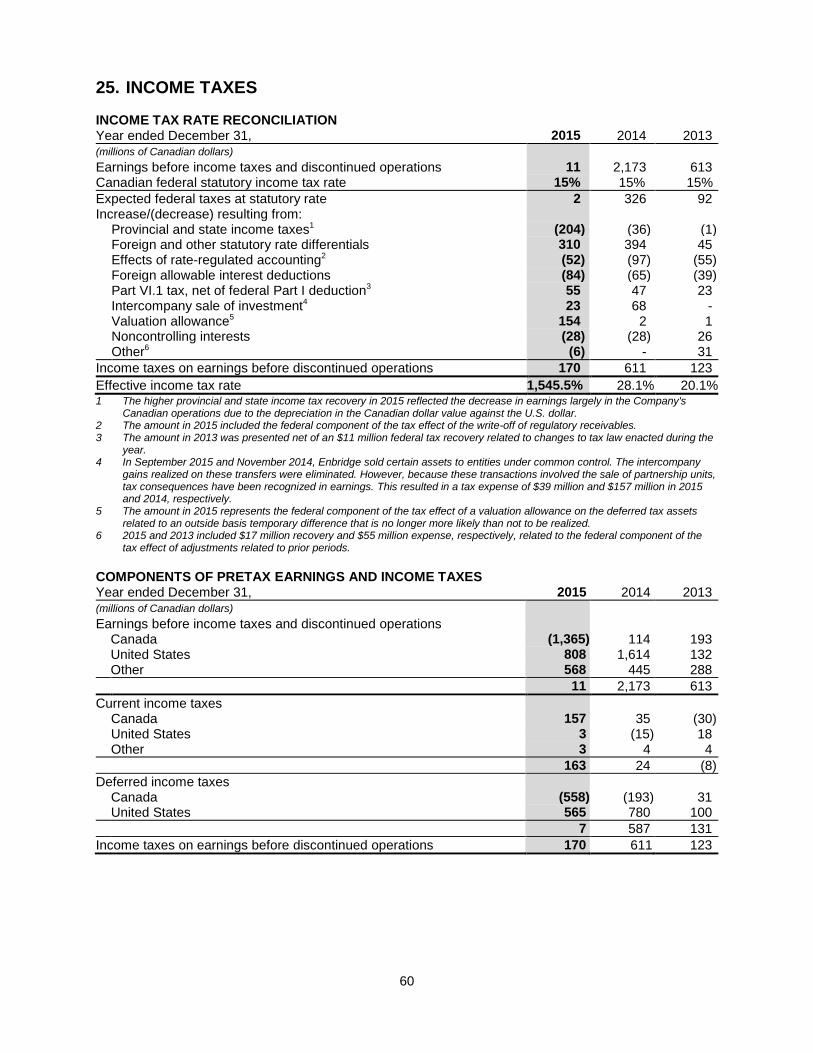
60
25. INCOME TAXES INCOME TAX RATE RECONCILIATION Year ended December 31, 2015 2014 2013 (millions of Canadian dollars) Earnings before income taxes and discontinued operations 11 2,173 613 Canadian federal statutory income tax rate 15% 15% 15%
Expected federal taxes at statutory rate 2 326 92 Increase/(decrease) resulting from: Provincial and state income taxes1 (204) (36) (1) Foreign and other statutory rate differentials 310 394 45 Effects of rate-regulated accounting2 (52) (97) (55) Foreign allowable interest deductions (84) (65) (39) Part VI.1 tax, net of federal Part I deduction3 55 47 23 Intercompany sale of investment4 23 68 - Valuation allowance5 154 2 1 Noncontrolling interests (28) (28) 26 Other6 (6) - 31
Income taxes on earnings before discontinued operations 170 611 123
Effective income tax rate 1,545.5% 28.1% 20.1% 1 The higher provincial and state income tax recovery in 2015 reflected the decrease in earnings largely in the Company's
Canadian operations due to the depreciation in the Canadian dollar value against the U.S. dollar. 2 The amount in 2015 included the federal component of the tax effect of the write-off of regulatory receivables. 3 The amount in 2013 was presented net of an $11 million federal tax recovery related to changes to tax law enacted during the
year. 4 In September 2015 and November 2014, Enbridge sold certain assets to entities under common control. The intercompany
gains realized on these transfers were eliminated. However, because these transactions involved the sale of partnership units, tax consequences have been recognized in earnings. This resulted in a tax expense of $39 million and $157 million in 2015 and 2014, respectively.
5 The amount in 2015 represents the federal component of the tax effect of a valuation allowance on the deferred tax assets related to an outside basis temporary difference that is no longer more likely than not to be realized.
6 2015 and 2013 included $17 million recovery and $55 million expense, respectively, related to the federal component of the tax effect of adjustments related to prior periods.
COMPONENTS OF PRETAX EARNINGS AND INCOME TAXES Year ended December 31, 2015 2014 2013 (millions of Canadian dollars) Earnings before income taxes and discontinued operations Canada (1,365) 114 193 United States 808 1,614 132 Other 568 445 288
11 2,173 613
Current income taxes Canada 157 35 (30) United States 3 (15) 18 Other 3 4 4
163 24 (8)
Deferred income taxes Canada (558) (193) 31 United States 565 780 100
7 587 131
Income taxes on earnings before discontinued operations 170 611 123
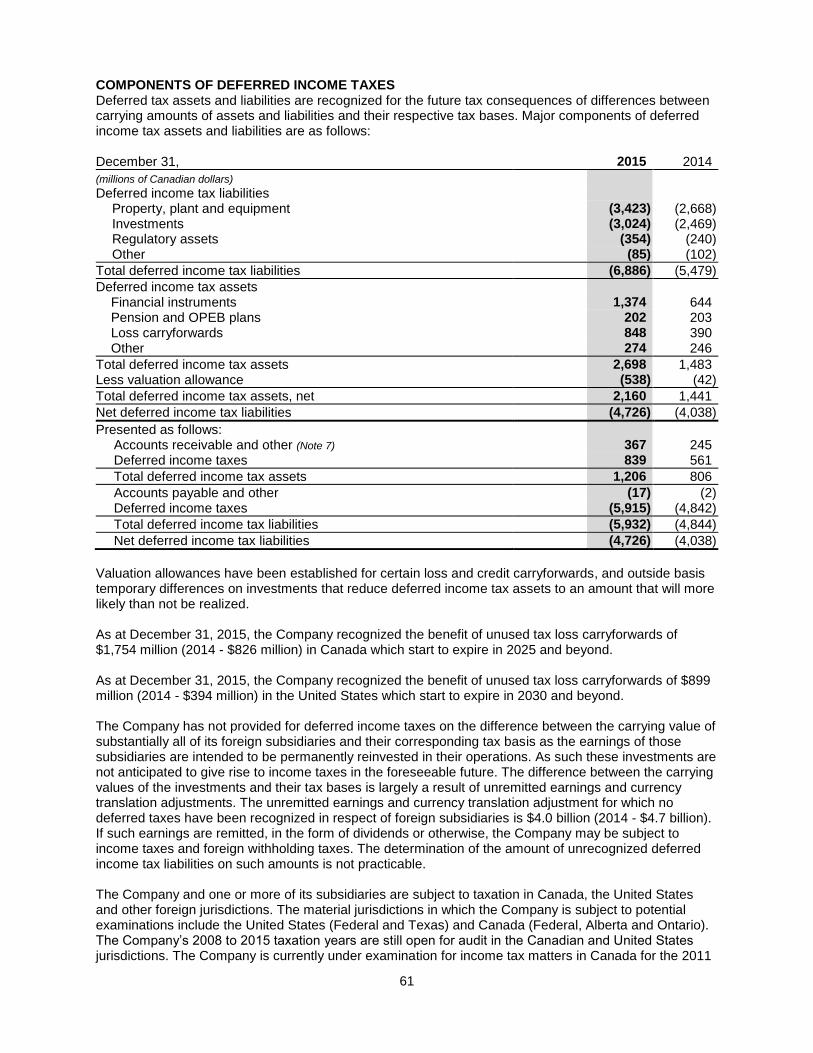
61
COMPONENTS OF DEFERRED INCOME TAXES Deferred tax assets and liabilities are recognized for the future tax consequences of differences between carrying amounts of assets and liabilities and their respective tax bases. Major components of deferred income tax assets and liabilities are as follows: December 31, 2015 2014
(millions of Canadian dollars) Deferred income tax liabilities Property, plant and equipment (3,423) (2,668) Investments (3,024) (2,469) Regulatory assets (354) (240) Other (85) (102)
Total deferred income tax liabilities (6,886) (5,479)
Deferred income tax assets Financial instruments 1,374 644 Pension and OPEB plans 202 203 Loss carryforwards 848 390 Other 274 246
Total deferred income tax assets 2,698 1,483 Less valuation allowance (538) (42)
Total deferred income tax assets, net 2,160 1,441
Net deferred income tax liabilities (4,726) (4,038)
Presented as follows: Accounts receivable and other (Note 7) 367 245 Deferred income taxes 839 561
Total deferred income tax assets 1,206 806
Accounts payable and other (17) (2) Deferred income taxes (5,915) (4,842)
Total deferred income tax liabilities (5,932) (4,844)
Net deferred income tax liabilities (4,726) (4,038)
Valuation allowances have been established for certain loss and credit carryforwards, and outside basis temporary differences on investments that reduce deferred income tax assets to an amount that will more likely than not be realized. As at December 31, 2015, the Company recognized the benefit of unused tax loss carryforwards of $1,754 million (2014 - $826 million) in Canada which start to expire in 2025 and beyond. As at December 31, 2015, the Company recognized the benefit of unused tax loss carryforwards of $899 million (2014 - $394 million) in the United States which start to expire in 2030 and beyond. The Company has not provided for deferred income taxes on the difference between the carrying value of substantially all of its foreign subsidiaries and their corresponding tax basis as the earnings of those subsidiaries are intended to be permanently reinvested in their operations. As such these investments are not anticipated to give rise to income taxes in the foreseeable future. The difference between the carrying values of the investments and their tax bases is largely a result of unremitted earnings and currency translation adjustments. The unremitted earnings and currency translation adjustment for which no deferred taxes have been recognized in respect of foreign subsidiaries is $4.0 billion (2014 - $4.7 billion). If such earnings are remitted, in the form of dividends or otherwise, the Company may be subject to income taxes and foreign withholding taxes. The determination of the amount of unrecognized deferred income tax liabilities on such amounts is not practicable. The Company and one or more of its subsidiaries are subject to taxation in Canada, the United States and other foreign jurisdictions. The material jurisdictions in which the Company is subject to potential examinations include the United States (Federal and Texas) and Canada (Federal, Alberta and Ontario). The Company’s 2008 to 2015 taxation years are still open for audit in the Canadian and United States jurisdictions. The Company is currently under examination for income tax matters in Canada for the 2011
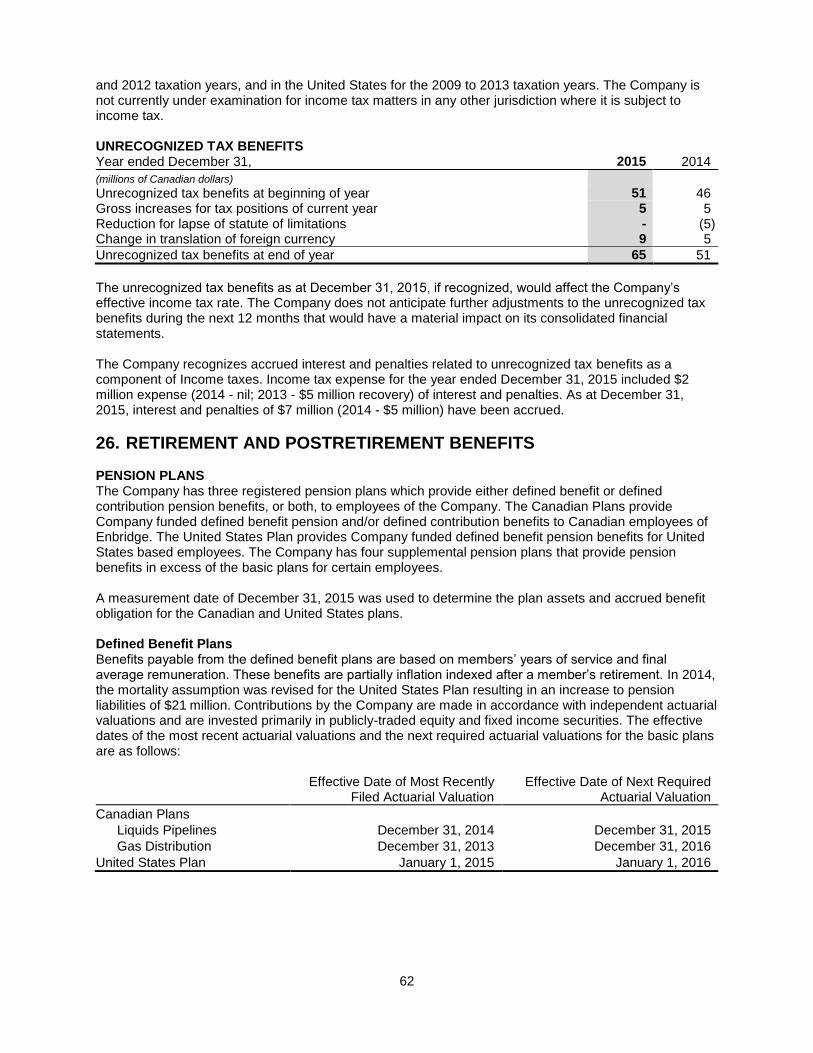
62
and 2012 taxation years, and in the United States for the 2009 to 2013 taxation years. The Company is not currently under examination for income tax matters in any other jurisdiction where it is subject to income tax. UNRECOGNIZED TAX BENEFITS Year ended December 31, 2015 2014
(millions of Canadian dollars) Unrecognized tax benefits at beginning of year 51 46 Gross increases for tax positions of current year 5 5 Reduction for lapse of statute of limitations - (5) Change in translation of foreign currency 9 5
Unrecognized tax benefits at end of year 65 51
The unrecognized tax benefits as at December 31, 2015, if recognized, would affect the Company’s effective income tax rate. The Company does not anticipate further adjustments to the unrecognized tax benefits during the next 12 months that would have a material impact on its consolidated financial statements. The Company recognizes accrued interest and penalties related to unrecognized tax benefits as a component of Income taxes. Income tax expense for the year ended December 31, 2015 included $2 million expense (2014 - nil; 2013 - $5 million recovery) of interest and penalties. As at December 31, 2015, interest and penalties of $7 million (2014 - $5 million) have been accrued.
26. RETIREMENT AND POSTRETIREMENT BENEFITS PENSION PLANS The Company has three registered pension plans which provide either defined benefit or defined contribution pension benefits, or both, to employees of the Company. The Canadian Plans provide Company funded defined benefit pension and/or defined contribution benefits to Canadian employees of Enbridge. The United States Plan provides Company funded defined benefit pension benefits for United States based employees. The Company has four supplemental pension plans that provide pension benefits in excess of the basic plans for certain employees. A measurement date of December 31, 2015 was used to determine the plan assets and accrued benefit obligation for the Canadian and United States plans. Defined Benefit Plans Benefits payable from the defined benefit plans are based on members’ years of service and final average remuneration. These benefits are partially inflation indexed after a member’s retirement. In 2014, the mortality assumption was revised for the United States Plan resulting in an increase to pension liabilities of $21 million. Contributions by the Company are made in accordance with independent actuarial valuations and are invested primarily in publicly-traded equity and fixed income securities. The effective dates of the most recent actuarial valuations and the next required actuarial valuations for the basic plans are as follows: Effective Date of Most Recently
Filed Actuarial Valuation Effective Date of Next Required
Actuarial Valuation
Canadian Plans
Liquids Pipelines December 31, 2014 December 31, 2015
Gas Distribution December 31, 2013 December 31, 2016
United States Plan January 1, 2015 January 1, 2016
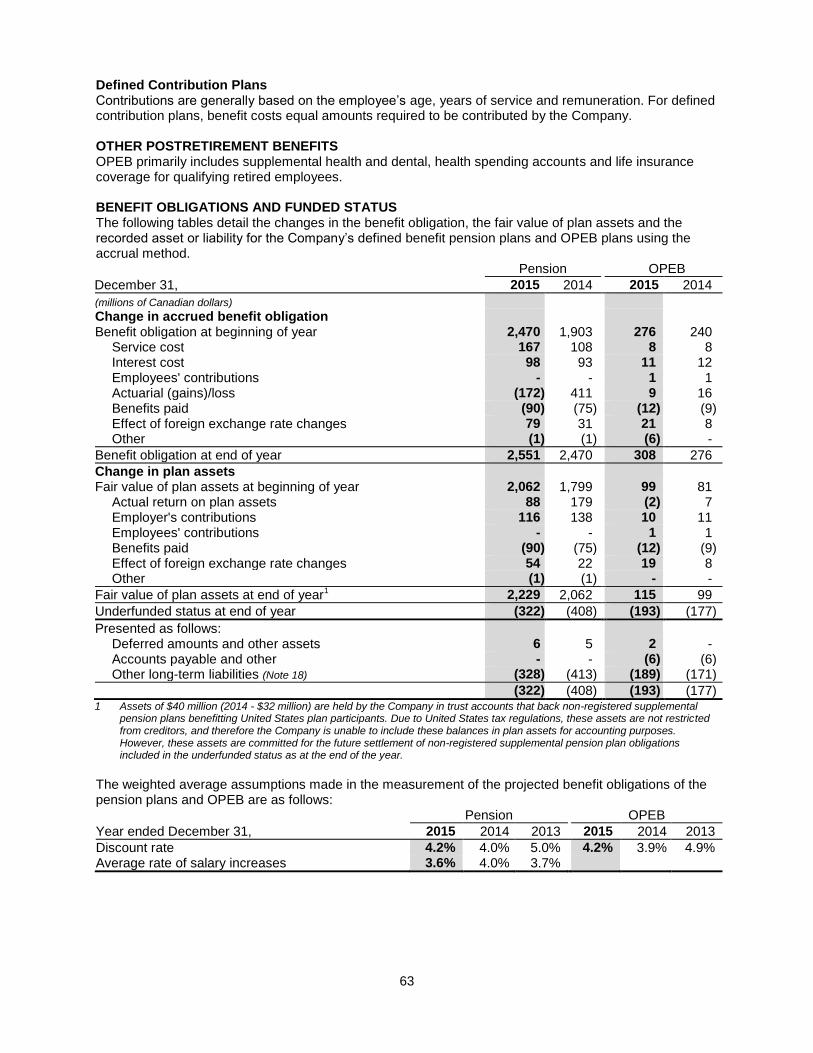
63
Defined Contribution Plans Contributions are generally based on the employee’s age, years of service and remuneration. For defined contribution plans, benefit costs equal amounts required to be contributed by the Company. OTHER POSTRETIREMENT BENEFITS OPEB primarily includes supplemental health and dental, health spending accounts and life insurance coverage for qualifying retired employees. BENEFIT OBLIGATIONS AND FUNDED STATUS The following tables detail the changes in the benefit obligation, the fair value of plan assets and the recorded asset or liability for the Company’s defined benefit pension plans and OPEB plans using the accrual method.
December 31,
Pension OPEB
2015 2014 2015 2014
(millions of Canadian dollars) Change in accrued benefit obligation Benefit obligation at beginning of year 2,470 1,903 276 240 Service cost 167 108 8 8 Interest cost 98 93 11 12 Employees' contributions - - 1 1 Actuarial (gains)/loss (172) 411 9 16 Benefits paid (90) (75) (12) (9) Effect of foreign exchange rate changes 79 31 21 8 Other (1) (1) (6) -
Benefit obligation at end of year 2,551 2,470 308 276
Change in plan assets Fair value of plan assets at beginning of year 2,062 1,799 99 81 Actual return on plan assets 88 179 (2) 7 Employer's contributions 116 138 10 11 Employees' contributions - - 1 1 Benefits paid (90) (75) (12) (9) Effect of foreign exchange rate changes 54 22 19 8 Other (1) (1) - -
Fair value of plan assets at end of year1 2,229 2,062 115 99
Underfunded status at end of year (322) (408) (193) (177)
Presented as follows: Deferred amounts and other assets 6 5 2 - Accounts payable and other - - (6) (6) Other long-term liabilities (Note 18) (328) (413) (189) (171)
(322) (408) (193) (177) 1 Assets of $40 million (2014 - $32 million) are held by the Company in trust accounts that back non-registered supplemental
pension plans benefitting United States plan participants. Due to United States tax regulations, these assets are not restricted from creditors, and therefore the Company is unable to include these balances in plan assets for accounting purposes. However, these assets are committed for the future settlement of non-registered supplemental pension plan obligations included in the underfunded status as at the end of the year.
The weighted average assumptions made in the measurement of the projected benefit obligations of the pension plans and OPEB are as follows: Pension OPEB
Year ended December 31, 2015 2014 2013 2015 2014 2013
Discount rate 4.2% 4.0% 5.0% 4.2% 3.9% 4.9% Average rate of salary increases 3.6% 4.0% 3.7%
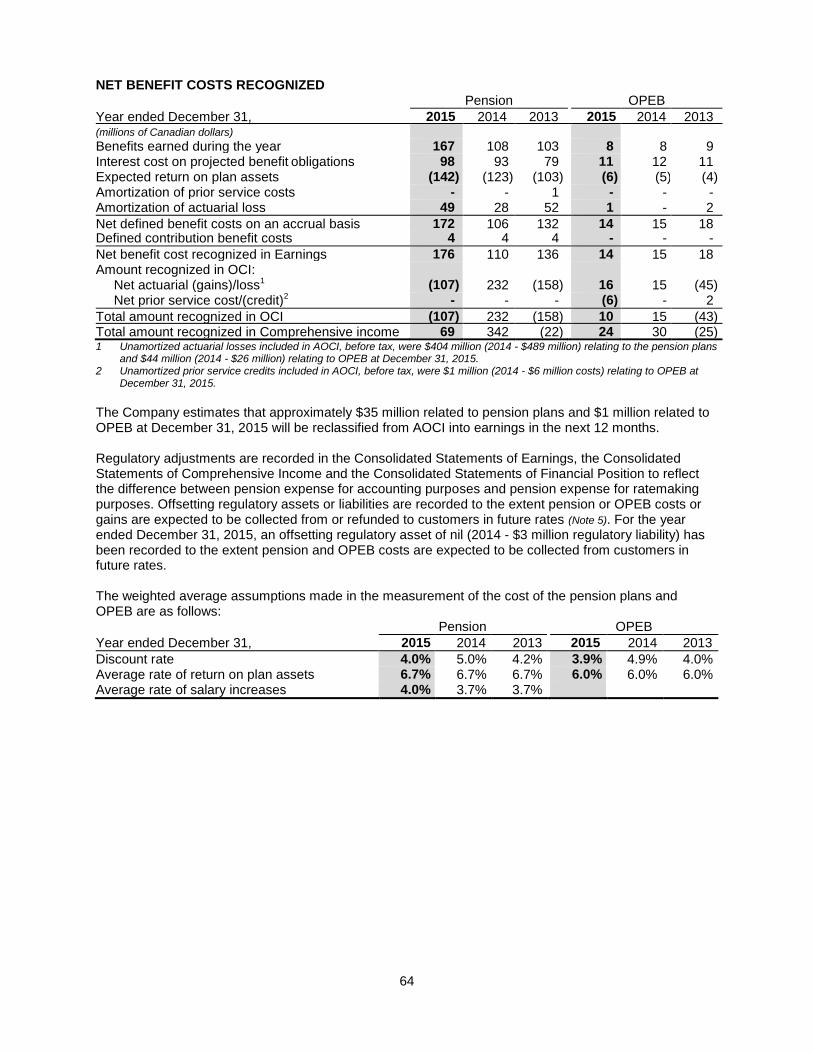
64
NET BENEFIT COSTS RECOGNIZED Pension OPEB
Year ended December 31, 2015 2014 2013 2015 2014 2013
(millions of Canadian dollars)
Benefits earned during the year 167 108 103 8 8 9
Interest cost on projected benefit obligations 98 93 79 11 12 11
Expected return on plan assets (142) (123) (103) (6) (5) (4)
Amortization of prior service costs - - 1 - - -
Amortization of actuarial loss 49 28 52 1 - 2
Net defined benefit costs on an accrual basis 172 106 132 14 15 18 Defined contribution benefit costs
4 4 4 - - -
Net benefit cost recognized in Earnings 176 110 136 14 15 18
Amount recognized in OCI: Net actuarial (gains)/loss1 (107) 232 (158) 16 15 (45) Net prior service cost/(credit)2 - - - (6) - 2
Total amount recognized in OCI (107) 232 (158) 10 15 (43) Total amount recognized in Comprehensive income 69 342 (22) 24 30 (25) 1 Unamortized actuarial losses included in AOCI, before tax, were $404 million (2014 - $489 million) relating to the pension plans
and $44 million (2014 - $26 million) relating to OPEB at December 31, 2015. 2 Unamortized prior service credits included in AOCI, before tax, were $1 million (2014 - $6 million costs) relating to OPEB at
December 31, 2015.
The Company estimates that approximately $35 million related to pension plans and $1 million related to OPEB at December 31, 2015 will be reclassified from AOCI into earnings in the next 12 months. Regulatory adjustments are recorded in the Consolidated Statements of Earnings, the Consolidated Statements of Comprehensive Income and the Consolidated Statements of Financial Position to reflect the difference between pension expense for accounting purposes and pension expense for ratemaking purposes. Offsetting regulatory assets or liabilities are recorded to the extent pension or OPEB costs or gains are expected to be collected from or refunded to customers in future rates (Note 5). For the year ended December 31, 2015, an offsetting regulatory asset of nil (2014 - $3 million regulatory liability) has been recorded to the extent pension and OPEB costs are expected to be collected from customers in future rates. The weighted average assumptions made in the measurement of the cost of the pension plans and OPEB are as follows: Pension OPEB
Year ended December 31, 2015 2014 2013 2015 2014 2013
Discount rate 4.0% 5.0% 4.2% 3.9% 4.9% 4.0%
Average rate of return on plan assets 6.7% 6.7% 6.7% 6.0% 6.0% 6.0% Average rate of salary increases
4.0% 3.7% 3.7%

65
MEDICAL COST TRENDS The assumed rates for the next year used to measure the expected cost of benefits are as follows:
Medical Cost Trend Rate Assumption
for Next Fiscal Year
Ultimate Medical Cost Trend Rate
Assumption
Year in which Ultimate Medical Cost Trend Rate Assumption is Achieved
Canadian Plans Drugs 6.7% 4.4% 2034 Other medical 4.5% - - United States Plan 7.0% 4.5% 2037
A 1% increase in the assumed medical care trend rate would result in an increase of $37 million in the benefit obligation and an increase of $2 million in benefit and interest costs. A 1% decrease in the assumed medical care trend rate would result in a decrease of $31 million in the benefit obligation and a decrease of $2 million in benefit and interest costs. PLAN ASSETS The Company manages the investment risk of its pension funds by setting a long-term asset mix policy for each plan after consideration of: (i) the nature of pension plan liabilities; (ii) the investment horizon of the plan; (iii) the going concern and solvency funded status and cash flow requirements of the plan; (iv) the operating environment and financial situation of the Company and its ability to withstand fluctuations in pension contributions; and (v) the future economic and capital markets outlook with respect to investment returns, volatility of returns and correlation between assets. The overall expected rate of return is based on the asset allocation targets with estimates for returns on equity and debt securities based on long-term expectations. Expected Rate of Return on Plan Assets Pension OPEB
Year ended December 31, 2015 2014 2015 2014
Canadian Plans 6.7% 6.7% United States Plan 7.2% 7.2% 6.0% 6.0%
Target Mix for Plan Assets Canadian Plans
Liquids Pipelines
Plan Gas Distribution
Plan United States
Plan
Equity securities 62.5% 53.5% 62.5% Fixed income securities 30.0% 40.0% 30.0% Other 7.5% 6.5% 7.5%
Major Categories of Plan Assets Plan assets are invested primarily in readily marketable investments with constraints on the credit quality of fixed income securities. As at December 31, 2015, the pension assets were invested 56.4% (2014 - 57.0%) in equity securities, 31.4% (2014 - 32.2%) in fixed income securities and 12.2% (2014 - 10.8%) in other. The OPEB assets were invested 59.1% (2014 - 58.8%) in equity securities, 40.0% (2014 - 40.2%) in fixed income securities and 0.9% (2014 - 1.0%) in other.
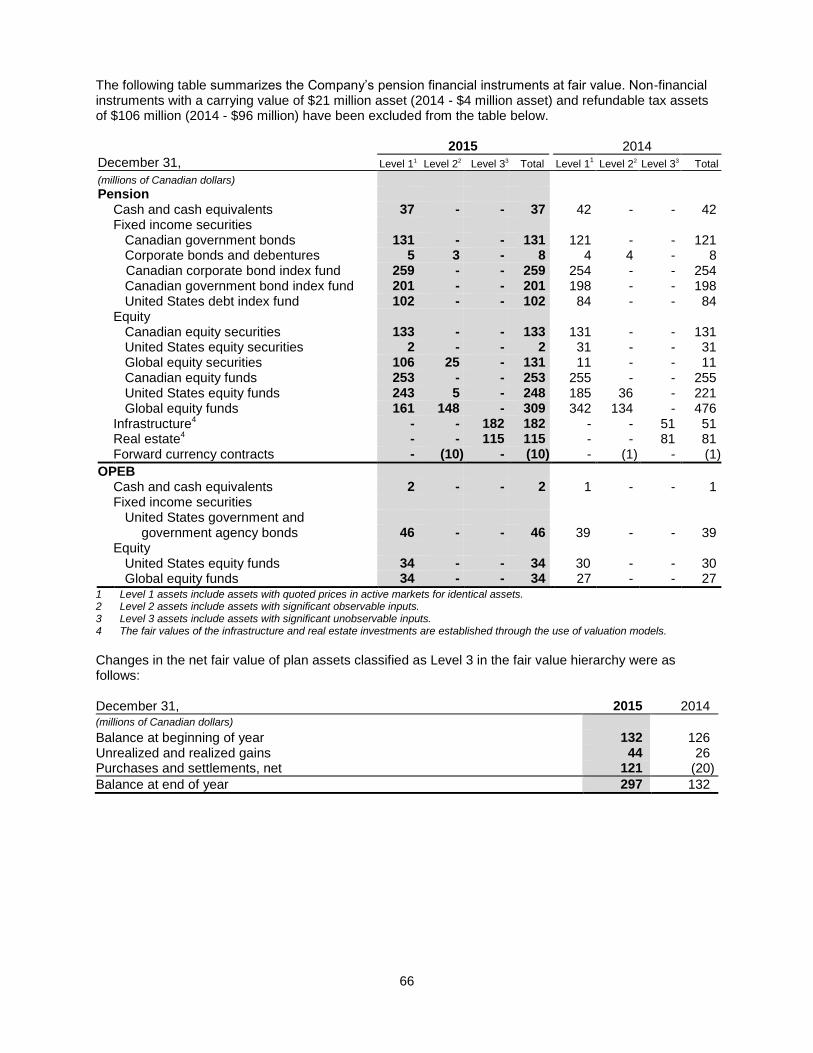
66
The following table summarizes the Company’s pension financial instruments at fair value. Non-financial instruments with a carrying value of $21 million asset (2014 - $4 million asset) and refundable tax assets of $106 million (2014 - $96 million) have been excluded from the table below. 2015 2014
December 31, Level 11
Level 22 Level 33
Total Level 11
Level 22 Level 33
Total
(millions of Canadian dollars)
Pension
Cash and cash equivalents 37 - - 37 42 - - 42
Fixed income securities
Canadian government bonds 131 - - 131 121 - - 121 Corporate bonds and debentures 5 3 - 8 4 4 - 8
Canadian corporate bond index fund 259 - - 259 254 - - 254
Canadian government bond index fund 201 - - 201 198 - - 198 United States debt index fund 102 - - 102 84 - - 84
Equity
Canadian equity securities 133 - - 133 131 - - 131
United States equity securities 2 - - 2 31 - - 31 Global equity securities 106 25 - 131 11 - - 11
Canadian equity funds 253 - - 253 255 - - 255
United States equity funds 243 5 - 248 185 36 - 221 Global equity funds 161 148 - 309 342 134 - 476
Infrastructure4 - - 182 182 - - 51 51
Real estate4 - - 115 115 - - 81 81 Forward currency contracts - (10) - (10) - (1) - (1)
OPEB
Cash and cash equivalents 2 - - 2 1 - - 1
Fixed income securities
United States government and government agency bonds 46 - - 46 39 - - 39
Equity
United States equity funds 34 - - 34 30 - - 30 Global equity funds 34 - - 34 27 - - 27 1 Level 1 assets include assets with quoted prices in active markets for identical assets.
2 Level 2 assets include assets with significant observable inputs.
3 Level 3 assets include assets with significant unobservable inputs.
4 The fair values of the infrastructure and real estate investments are established through the use of valuation models.
Changes in the net fair value of plan assets classified as Level 3 in the fair value hierarchy were as follows: December 31, 2015 2014 (millions of Canadian dollars) Balance at beginning of year 132 126 Unrealized and realized gains 44 26 Purchases and settlements, net 121 (20)
Balance at end of year 297 132
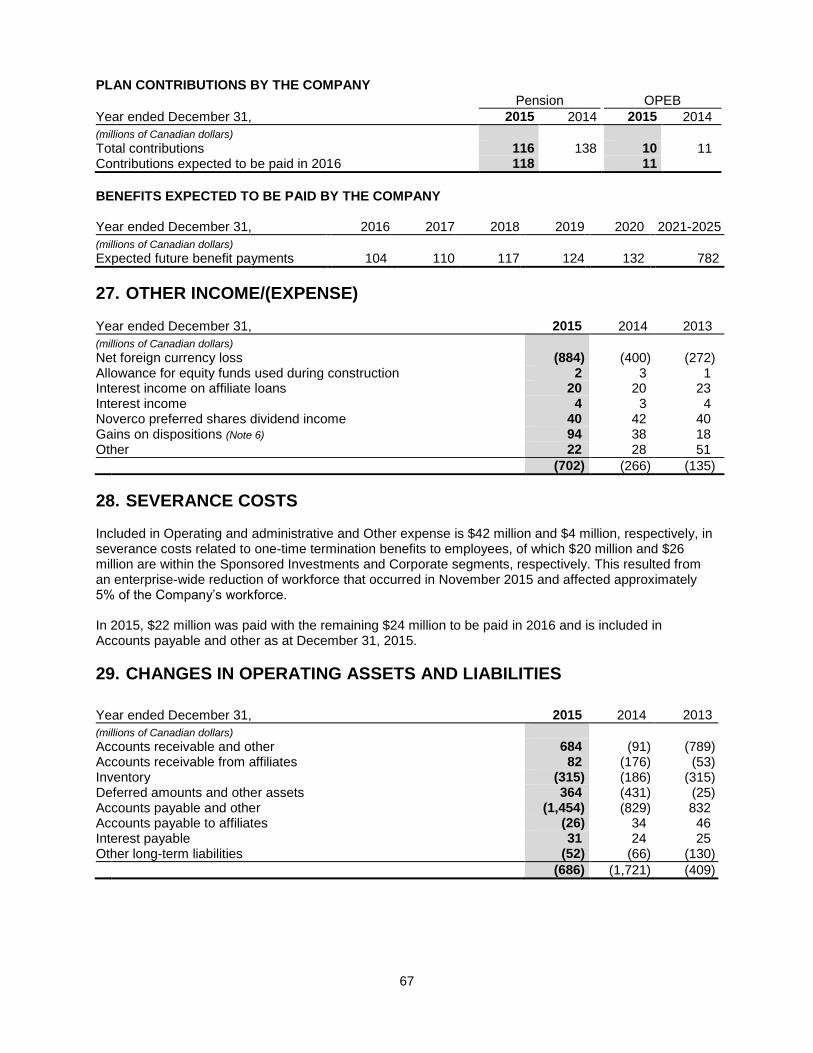
67
PLAN CONTRIBUTIONS BY THE COMPANY Pension OPEB
Year ended December 31, 2015 2014 2015 2014
(millions of Canadian dollars) Total contributions 116 138 10 11 Contributions expected to be paid in 2016 118 11
BENEFITS EXPECTED TO BE PAID BY THE COMPANY Year ended December 31, 2016 2017 2018 2019 2020 2021-2025
(millions of Canadian dollars) Expected future benefit payments 104 110 117 124 132 782
27. OTHER INCOME/(EXPENSE) Year ended December 31, 2015 2014 2013
(millions of Canadian dollars) Net foreign currency loss (884) (400) (272) Allowance for equity funds used during construction 2 3 1 Interest income on affiliate loans 20 20 23 Interest income 4 3 4 Noverco preferred shares dividend income 40 42 40 Gains on dispositions (Note 6) 94 38 18 Other 22 28 51
(702) (266) (135)
28. SEVERANCE COSTS Included in Operating and administrative and Other expense is $42 million and $4 million, respectively, in severance costs related to one-time termination benefits to employees, of which $20 million and $26 million are within the Sponsored Investments and Corporate segments, respectively. This resulted from an enterprise-wide reduction of workforce that occurred in November 2015 and affected approximately 5% of the Company’s workforce. In 2015, $22 million was paid with the remaining $24 million to be paid in 2016 and is included in Accounts payable and other as at December 31, 2015.
29. CHANGES IN OPERATING ASSETS AND LIABILITIES
Year ended December 31, 2015 2014 2013
(millions of Canadian dollars) Accounts receivable and other 684 (91) (789) Accounts receivable from affiliates 82 (176) (53) Inventory (315) (186) (315) Deferred amounts and other assets 364 (431) (25) Accounts payable and other (1,454) (829) 832 Accounts payable to affiliates (26) 34 46 Interest payable 31 24 25 Other long-term liabilities (52) (66) (130)
(686) (1,721) (409)
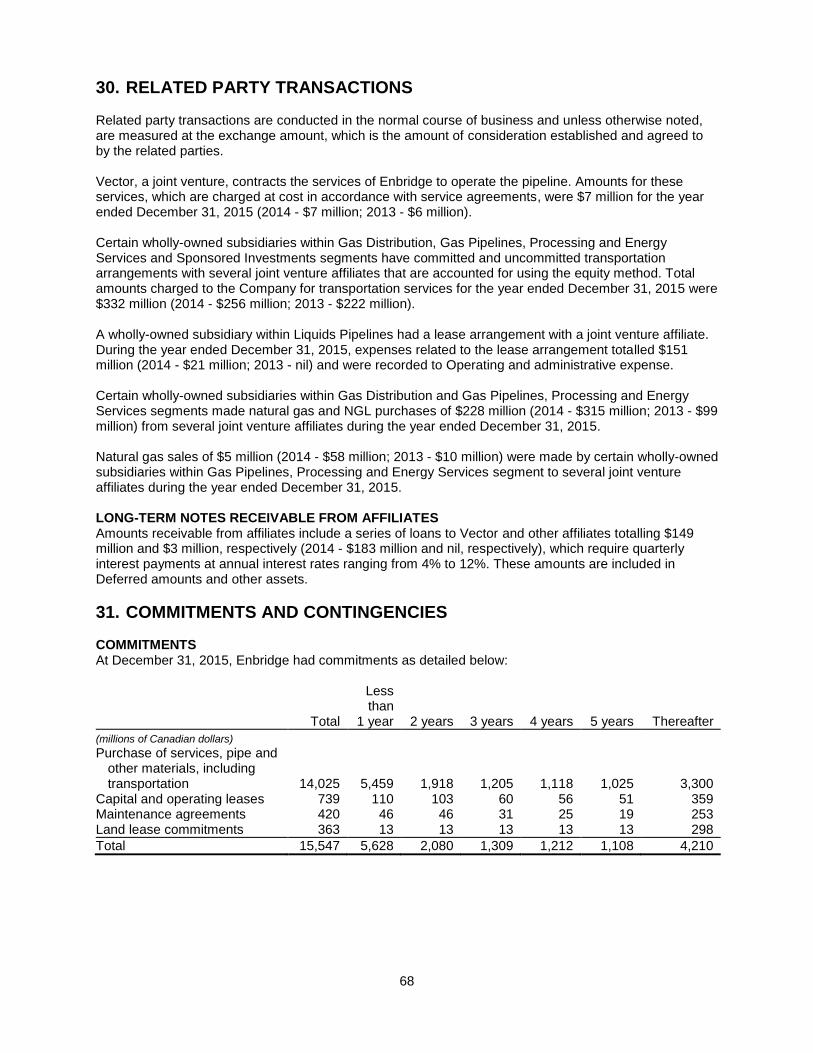
68
30. RELATED PARTY TRANSACTIONS Related party transactions are conducted in the normal course of business and unless otherwise noted, are measured at the exchange amount, which is the amount of consideration established and agreed to by the related parties. Vector, a joint venture, contracts the services of Enbridge to operate the pipeline. Amounts for these services, which are charged at cost in accordance with service agreements, were $7 million for the year ended December 31, 2015 (2014 - $7 million; 2013 - $6 million). Certain wholly-owned subsidiaries within Gas Distribution, Gas Pipelines, Processing and Energy Services and Sponsored Investments segments have committed and uncommitted transportation arrangements with several joint venture affiliates that are accounted for using the equity method. Total amounts charged to the Company for transportation services for the year ended December 31, 2015 were $332 million (2014 - $256 million; 2013 - $222 million). A wholly-owned subsidiary within Liquids Pipelines had a lease arrangement with a joint venture affiliate. During the year ended December 31, 2015, expenses related to the lease arrangement totalled $151 million (2014 - $21 million; 2013 - nil) and were recorded to Operating and administrative expense. Certain wholly-owned subsidiaries within Gas Distribution and Gas Pipelines, Processing and Energy Services segments made natural gas and NGL purchases of $228 million (2014 - $315 million; 2013 - $99 million) from several joint venture affiliates during the year ended December 31, 2015. Natural gas sales of $5 million (2014 - $58 million; 2013 - $10 million) were made by certain wholly-owned subsidiaries within Gas Pipelines, Processing and Energy Services segment to several joint venture affiliates during the year ended December 31, 2015. LONG-TERM NOTES RECEIVABLE FROM AFFILIATES Amounts receivable from affiliates include a series of loans to Vector and other affiliates totalling $149 million and $3 million, respectively (2014 - $183 million and nil, respectively), which require quarterly interest payments at annual interest rates ranging from 4% to 12%. These amounts are included in Deferred amounts and other assets.
31. COMMITMENTS AND CONTINGENCIES COMMITMENTS At December 31, 2015, Enbridge had commitments as detailed below:
Total
Less than
1 year 2 years 3 years 4 years 5 years Thereafter
(millions of Canadian dollars) Purchase of services, pipe and
other materials, including transportation 14,025 5,459 1,918 1,205 1,118 1,025 3,300
Capital and operating leases 739 110 103 60 56 51 359 Maintenance agreements 420 46 46 31 25 19 253 Land lease commitments 363 13 13 13 13 13 298
Total 15,547 5,628 2,080 1,309 1,212 1,108 4,210
69
ENBRIDGE ENERGY PARTNERS, L.P. As at December 31, 2015, Enbridge holds an approximate 35.7% (2014 - 33.7%; 2013 - 20.6%) combined direct and indirect economic interest in EEP, which is consolidated with noncontrolling interests within the Sponsored Investments segment. Lakehead System Lines 6A and 6B Crude Oil Releases Line 6B Crude Oil Release On July 26, 2010, a release of crude oil on Line 6B of EEP’s Lakehead System was reported near Marshall, Michigan. EEP estimates that approximately 20,000 barrels of crude oil were leaked at the site, a portion of which reached the Kalamazoo River via Talmadge Creek, a waterway that feeds the Kalamazoo River. The released crude oil affected approximately 61 kilometres (38 miles) of shoreline along the Talmadge Creek and Kalamazoo River waterways, including residential areas, businesses, farmland and marshland between Marshall and downstream of Battle Creek, Michigan. EEP continues to perform necessary remediation, restoration and monitoring of the areas affected by the Line 6B crude oil release. All the initiatives EEP is undertaking in the monitoring and restoration phase are intended to restore the crude oil release area to the satisfaction of the appropriate regulatory authorities. On March 14, 2013, EEP received an order from the United States Environmental Protection Agency (EPA) (the EPA Order) which required additional containment and active recovery of submerged oil relating to the Line 6B crude oil release. In February 2015, the EPA acknowledged EEP’s completion of the EPA Order. In November 2014, regulatory authority was transferred from the EPA to the Michigan Department of Environmental Quality (MDEQ). The MDEQ has oversight over the submerged oil reassessment, sheen management and sediment trap monitoring and maintenance activities through a Kalamazoo River Residual Oil Monitoring and Maintenance Work Plan. In May 2015, EEP reached a settlement with the MDEQ and the Michigan Attorney General's offices regarding the Line 6B crude oil release. As stipulated in the settlement, EEP agrees to: (1) provide at least 300 acres of wetland through restoration, creation, or banked wetland credits, to remain as wetland in perpetuity; (2) pay US$5 million as mitigation for impacts to the banks, bottomlands, and flow of Talmadge Creek and the Kalamazoo River for the purpose of enhancing the Kalamazoo River watershed and restoring stream flows in the River; (3) continue to reimburse the State of Michigan for costs arising from oversight of EEP activities since the release; and (4) continue monitoring, restoration and invasive species control within state-regulated wetlands affected by the release and associated response activities. The timing of these activities is based upon the work plans approved by the State of Michigan. As at December 31, 2015, EEP’s total cost estimate for the Line 6B crude oil release was US$1.2 billion ($193 million after-tax attributable to Enbridge), which is unchanged since December 31, 2014. As at December 31, 2014, the total cost estimate for the Line 6B crude oil release increased by US$86 million as compared to December 31, 2013. The total cost increase of US$86 million during the year ended December 31, 2014, was primarily related to the MDEQ approved Schedule of Work, completion of the dredge activities near Ceresco and Morrow Lake and estimated civil penalties under the Clean Water Act of the United States (Clean Water Act), as described below under Legal and Regulatory Proceedings. Expected losses associated with the Line 6B crude oil release included those costs that were considered probable and that could be reasonably estimated at December 31, 2015. Despite the efforts EEP has made to ensure the reasonableness of its estimates, there continues to be the potential for EEP to incur additional costs in connection with this crude oil release due to variations in any or all of the cost categories, including modified or revised requirements from regulatory agencies, in addition to fines and penalties and expenditures associated with litigation and settlement of claims. Line 6A Crude Oil Release A release of crude oil from Line 6A of EEP’s Lakehead System was reported in an industrial area of Romeoville, Illinois on September 9, 2010. EEP estimates that approximately 9,000 barrels of crude oil were released, of which approximately 1,400 barrels were removed from the pipeline as part of the repair. Some of the released crude oil went onto a roadway, into a storm sewer, a waste water treatment facility and then into a nearby retention pond. All but a small amount of the crude oil was recovered. EEP completed excavation and replacement of the pipeline segment and returned it to service on September 17, 2010.
70
EEP has completed the cleanup, remediation and restoration of the areas affected by the release. On October 21, 2013, the National Transportation Safety Board publicly posted their final report related to the Line 6A crude oil release which states the probable cause of the crude oil release was erosion caused by a leaking water pipe resulting from an improperly installed third-party water service line below EEP’s oil pipeline. The total estimated cost for the Line 6A crude oil release was approximately US$51 million ($7 million after-tax attributable to Enbridge) before insurance recoveries and excluding fines and penalties. These costs included emergency response, environmental remediation and cleanup activities with the crude oil release. As at December 31, 2015, EEP has no remaining estimated liability. Insurance EEP is included in the comprehensive insurance program that is maintained by Enbridge for its subsidiaries and affiliates which renews throughout the year. On May 1 of each year, the insurance program is renewed and includes commercial liability insurance coverage that is consistent with coverage considered customary for its industry and includes coverage for environmental incidents excluding costs for fines and penalties. A majority of the costs incurred in connection with the crude oil release for Line 6B are covered by Enbridge’s comprehensive insurance policy that expired on April 30, 2011, which had an aggregate limit of US$650 million for pollution liability for Enbridge and its affiliates. Including EEP’s remediation spending through December 31, 2015, costs related to Line 6B exceeded the limits of the coverage available under this insurance policy. Additionally, fines and penalties would not be covered under the existing insurance policy. As at December 31, 2015, EEP has recorded total insurance recoveries of US$547 million ($80 million after-tax attributable to Enbridge) for the Line 6B crude oil release out of the US$650 million aggregate limit. EEP will record receivables for additional amounts it claims for recovery pursuant to its insurance policies during the period it deems recovery to be probable. In March 2013, EEP and Enbridge filed a lawsuit against the insurer who is disputing recovery eligibility for Line 6B costs. In March 2015, Enbridge reached an agreement with that insurer to submit the claim to binding arbitration which is not scheduled to occur until the fourth quarter of 2016. While the Company believes that those costs are eligible for recovery, there can be no assurance that it will prevail in the arbitration. Enbridge renewed its comprehensive property and liability insurance programs under which the Company is insured through April 30, 2016 with a liability program aggregate limit of US$860 million, which includes sudden and accidental pollution liability. In the unlikely event multiple insurable incidents which in aggregate exceed coverage limits occur within the same insurance period, the total insurance coverage will be allocated among Enbridge entities on an equitable basis based on an insurance allocation agreement among Enbridge and its subsidiaries. Legal and Regulatory Proceedings A number of United States governmental agencies and regulators have initiated investigations into the Line 6B crude oil release. Five actions or claims are pending against Enbridge, EEP or their affiliates in United States federal and state courts in connection with the Line 6B crude oil release. Based on the current status of these cases, the Company does not expect the outcome of these actions to be material to its results of operations or financial condition. As at December 31, 2015, included in EEP’s estimated costs related to the Line 6B crude oil release is US$44 million in fines and penalties. Of this amount, US$40 million relates to civil penalties under the Clean Water Act. While no final fine or penalty has been assessed or agreed to date, EEP believes that, based on the best information available at this time, the US$40 million represents an estimate of the minimum amount which may be assessed, excluding costs of injunctive relief that may be agreed to with the relevant governmental agencies. Given the complexity of settlement negotiations, which EEP expects will continue, and the limited information available to assess the matter, EEP is unable to reasonably estimate the final penalty which might be incurred or to reasonably estimate a range of outcomes at this time. Injunctive relief is likely to include further measures directed toward enhancing spill prevention, leak detection and emergency response to environmental events. The cost of compliance with such measures,
71
when combined with any fine or penalty, could be material. EEP has entered into a tolling agreement with the applicable governmental agencies and discussions with these governmental agencies regarding fines, penalties and injunctive relief are ongoing. In June 2015, Enbridge reached a separate agreement with the United States (Federal Natural Resources Damages Trustees), State of Michigan (State Natural Resources Damages Trustees), Match-E-Be-Nash-She-Wish Band of the Potawatomi Indians and the Nottawaseppi Huron Band of the Potawatomi Indians, and paid approximately US$4 million that was accrued to cover a variety of projects, including the restoration of 175 acres of oak savanna in Fort Custer State Recreation Area and wild rice beds along the Kalamazoo River. One claim related to the Line 6A crude oil release has been filed against Enbridge, EEP or their affiliates by the State of Illinois in the Illinois state court in connection with this crude oil release. On February 20, 2015, EEP agreed to a consent order releasing it from any claims, liability, or penalties. Lakehead System Line 14 Crude Oil Release On July 27, 2012, a release of crude oil was detected on Line 14 of EEP’s Lakehead System near Grand Marsh, Wisconsin. The estimated volume of oil released was approximately 1,700 barrels. EEP received a Corrective Action Order (CAO) from the Pipeline and Hazardous Materials Safety Administration (PHMSA) on July 30, 2012, followed by an amended CAO on August 1, 2012. Upon restart of Line 14 on August 7, 2012, PHMSA restricted the operating pressure to 80% of the pressure in place at the time immediately prior to the incident. During the fourth quarter of 2013, EEP received approval from the PHMSA to remove the pressure restrictions and to return to normal operating pressures for a period of 12 months. In December 2014, the PHMSA again considered the status of the pipeline in light of information they acquired throughout 2014. On December 9, 2014, EEP received a letter from the PHMSA approving its request to continue the normal operation of Line 14 without pressure restrictions. EEP has no remaining estimated liability for this release. AUX SABLE Notice of Violation In September 2014, Aux Sable US received a Notice and Finding of Violation (NFOV) from the EPA for alleged violations of the Clean Air Act related to the Leak Detection and Repair program, and related provisions of the Clean Air Act permit for Aux Sable’s Channahon, Illinois facility. As part of the ongoing process of responding to the September 2014 NFOV, Aux Sable discovered what it believes to be an exceedance of currently permitted limits for Volatile Organic Material. Aux Sable received a second NFOV from the EPA in April 2015 in connection with this potential exceedance. Aux Sable is engaged in discussions with the EPA to evaluate the potential impact and ultimate resolution of these issues. At this time, the Company is unable to reasonably estimate the financial impact. TAX MATTERS Enbridge and its subsidiaries maintain tax liabilities related to uncertain tax positions. While fully supportable in the Company’s view, these tax positions, if challenged by tax authorities, may not be fully sustained on review. OTHER LITIGATION The Company and its subsidiaries are subject to various other legal and regulatory actions and proceedings which arise in the normal course of business, including interventions in regulatory proceedings and challenges to regulatory approvals and permits by special interest groups. While the final outcome of such actions and proceedings cannot be predicted with certainty, Management believes that the resolution of such actions and proceedings will not have a material impact on the Company's consolidated financial position or results of operations.
72
32. GUARANTEES The Company has agreed to indemnify EEP from and against substantially all liabilities, including liabilities relating to environmental matters, arising from operations prior to the transfer of its pipeline operations to EEP in 1991. This indemnification does not apply to amounts that EEP would be able to recover in its tariff rates if not recovered through insurance or to any liabilities relating to a change in laws after December 27, 1991. The Company has also agreed to indemnify EEM for any tax liability related to EEM’s formation, management of EEP and ownership of i-units of EEP. The Company has not made any significant payment under these tax indemnifications. The Company does not believe there is a material exposure at this time. The Company has also agreed to indemnify the Fund Group for certain liabilities relating to environmental matters arising from operations prior to the transfer of certain assets and interests to the Fund Group in 2012 and prior to the transfer of certain assets and interests to the Fund Group as part of the Canadian Restructuring Plan. The Company has also agreed to pay defined payments to the Fund Group on their investment in Southern Lights in the event shippers do not elect to extend their current contracts post June 2025. Following the completion of the Canadian Restructuring Plan, EIPLP indirectly owns all of the Class B Units of Southern Lights Canada, together with the Class A Units it already owned. As a result EIPLP holds all the ownership, economic interests and voting rights, direct and indirect, in Southern Lights Canada. The Enbridge guarantee provided in respect of distributions on the Class A Units of Southern Lights Canada was released upon closing of the Canadian Restructuring Plan. In the normal course of conducting business, the Company enters into agreements which indemnify third parties and affiliates. Examples include indemnifying counterparties pursuant to sale agreements for assets or businesses in matters such as breaches of representations, warranties or covenants, loss or damages to property, environmental liabilities, changes in laws, valuation differences, litigation and contingent liabilities. The Company may indemnify the purchaser for certain tax liabilities incurred while the Company owned the assets or for a misrepresentation related to taxes that result in a loss to the purchaser. Similarly, the Company may indemnify the purchaser of assets for certain tax liabilities related to those assets. The Company cannot reasonably estimate the maximum potential amounts that could become payable to third parties and affiliates under these agreements; however, historically, the Company has not made any significant payments under indemnification provisions. While these agreements may specify a maximum potential exposure, or a specified duration to the indemnification obligation, there are circumstances where the amount and duration are unlimited. The indemnifications and guarantees have not had, and are not reasonably likely to have, a material effect on the Company’s financial condition, changes in financial condition, earnings, liquidity, capital expenditures or capital resources.
33. SUBSEQUENT EVENT On January 7, 2016, the Company signed an asset purchase and sale agreement to acquire 100% interest in the Tupper Main and Tupper West gas plants and associated pipelines for approximately $538 million. The purchase price will initially be funded from available sources of liquidity. The acquired assets are located near Dawson Creek, British Columbia with an aggregate processing capacity of 320 million cubic feet per day of raw gas from the Dawson Creek area Montney field. The purchase is expected to close in the second quarter of 2016.


