40
CORPORATE PRESENTATION June 2018
| Date post: | 28-Apr-2018 |
| Category: |
Documents |
| Upload: | truonghanh |
| View: | 220 times |
| Download: | 4 times |
CORPORATE PRESENTATION
June 2018

1
1
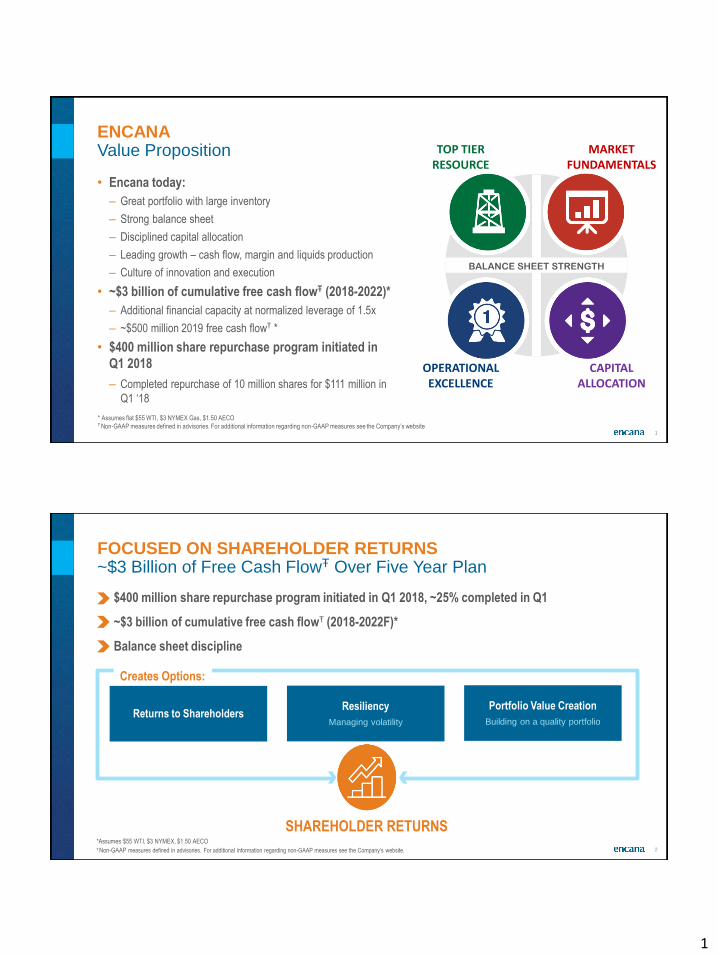
• Encana today:
– Great portfolio with large inventory
– Strong balance sheet
– Disciplined capital allocation
– Leading growth – cash flow, margin and liquids production
– Culture of innovation and execution
• ~$3 billion of cumulative free cash flowŦ (2018-2022)*
– Additional financial capacity at normalized leverage of 1.5x
– ~$500 million 2019 free cash flowŦ *
• $400 million share repurchase program initiated in
Q1 2018
– Completed repurchase of 10 million shares for $111 million in
Q1 ‘18
ENCANAValue Proposition TOP TIER
RESOURCE
OPERATIONALEXCELLENCE
BALANCE SHEET STRENGTH
MARKETFUNDAMENTALS
CAPITALALLOCATION
* Assumes flat $55 WTI, $3 NYMEX Gas, $1.50 AECOŦ Non-GAAP measures defined in advisories. For additional information regarding non-GAAP measures see the Company’s website
2
FOCUSED ON SHAREHOLDER RETURNS~$3 Billion of Free Cash FlowŦ Over Five Year Plan
*Assumes $55 WTI, $3 NYMEX, $1.50 AECO
$400 million share repurchase program initiated in Q1 2018, ~25% completed in Q1
~$3 billion of cumulative free cash flowŦ (2018-2022F)*
Balance sheet discipline
Creates Options:
SHAREHOLDER RETURNS
Returns to ShareholdersResiliency
Managing volatility
Portfolio Value Creation
Building on a quality portfolio
Ŧ Non-GAAP measures defined in advisories. For additional information regarding non-GAAP measures see the Company’s website.

2
3
FOCUS ON QUALITY CORPORATE RETURNSOur Business Works Today
Assumes flat $55/bbl WTI oil price, flat $3/MMBtu NYMEX natural gas price.Ŧ Non-GAAP measures defined in advisories. For additional information regarding non-GAAP measures see the Company’s website.
• World class portfolio of assets
• Execution excellence
• Market fundamentals
• Disciplined capital allocation
• Unconventionals are all we do
• Track record of delivery
• Culture of innovation both technical and commercial
• Leader in industrial scale development
• Integrated supply chain management
• Managing risk
Return on Capital EmployedŦ grows
over the 5 year plan~25% Cash FlowŦ CAGR
2018F – 2022F~$3.0 Billion Free Cash FlowŦ
2018F – 2022F
Strategy Execution
4
• Updated 5 year plan is better across the board
― Maintaining efficiencies in a busier industry
― Exit-to-exit production growth well ahead of plan
― Major facility milestones achieved in Q4 2017 ahead of
schedule & under budget
• Innovation & discipline delivering value
― Expanding margins
― Enhancing productivity & capital efficiency
― Balance sheet is very strong
• Well positioned for 2018 & beyond
― 2018 growth within cash flowŦ
― Generating strong free cash flowŦ from 2019 onward
― Leading corporate return generation
AN OPERATOR INVESTORS CAN COUNT ONIncreasing Value & Resiliency
2017-2022F Cash FlowŦ ~25% CAGR
-
1,000
2,000
3,000
2017 2018F 2019F 2020F 2021F 2022F
($M
M)
Capital Cumulative Free Cash Flow
~$3.0B of Cumulative Free Cash FlowŦ
0
1,000
2,000
3,000
4,000
5,000
2017 2018F 2019F 2020F 2021F 2022F
Cash From Operating Activities NCWC & Other Cash Flow (Non-GAAP)
($M
M)
Assumes flat $55/bbl WTI oil price, flat $3/MMBtu NYMEX natural gas price.Ŧ Non-GAAP measures defined in advisories. For additional information regarding non-GAAP measures see the Company’s website.
3
5
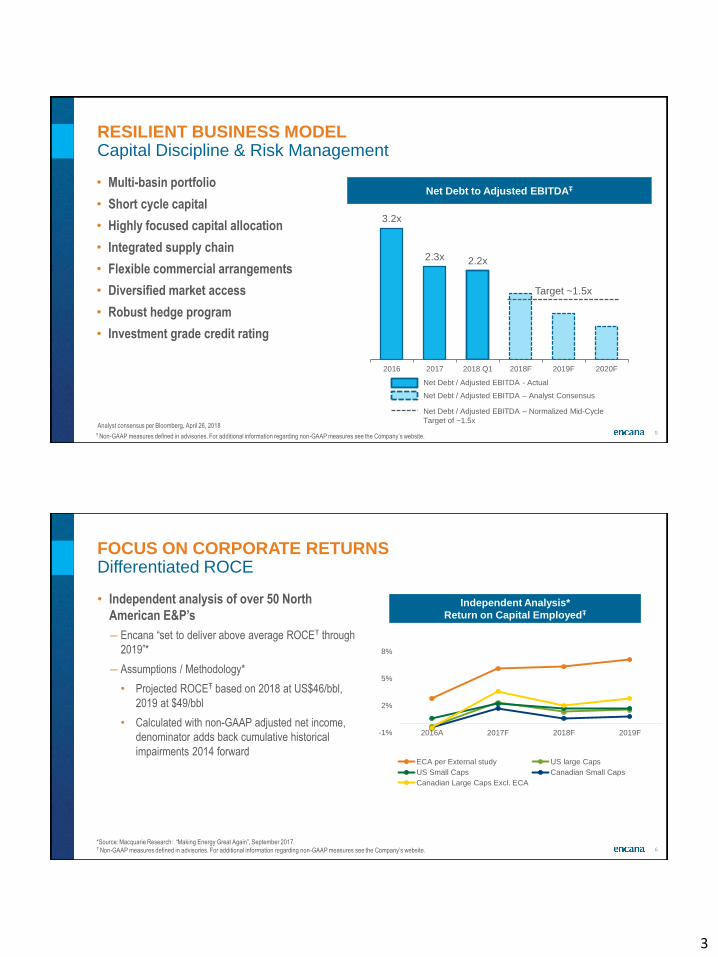
• Multi-basin portfolio
• Short cycle capital
• Highly focused capital allocation
• Integrated supply chain
• Flexible commercial arrangements
• Diversified market access
• Robust hedge program
• Investment grade credit rating
RESILIENT BUSINESS MODELCapital Discipline & Risk Management
Net Debt to Adjusted EBITDAŦ
Ŧ Non-GAAP measures defined in advisories. For additional information regarding non-GAAP measures see the Company’s website.
3.2x
2.3x 2.2x
2016 2017 2018 Q1 2018F 2019F 2020F
Net Debt / Adjusted EBITDA - Actual
Net Debt / Adjusted EBITDA – Analyst Consensus
Net Debt / Adjusted EBITDA – Normalized Mid-Cycle
Target of ~1.5x
Target ~1.5x
Analyst consensus per Bloomberg, April 26, 2018
6
-1%
2%
5%
8%
2016A 2017F 2018F 2019F
ECA per External study US large Caps
US Small Caps Canadian Small Caps
Canadian Large Caps Excl. ECA
• Independent analysis of over 50 North
American E&P’s
― Encana “set to deliver above average ROCEŦ through
2019”*
― Assumptions / Methodology*
• Projected ROCEŦ based on 2018 at US$46/bbl,
2019 at $49/bbl
• Calculated with non-GAAP adjusted net income,
denominator adds back cumulative historical
impairments 2014 forward
FOCUS ON CORPORATE RETURNSDifferentiated ROCE
Independent Analysis*
Return on Capital EmployedŦ
*Source: Macquarie Research: “Making Energy Great Again”, September 2017.Ŧ Non-GAAP measures defined in advisories. For additional information regarding non-GAAP measures see the Company’s website.
4
7
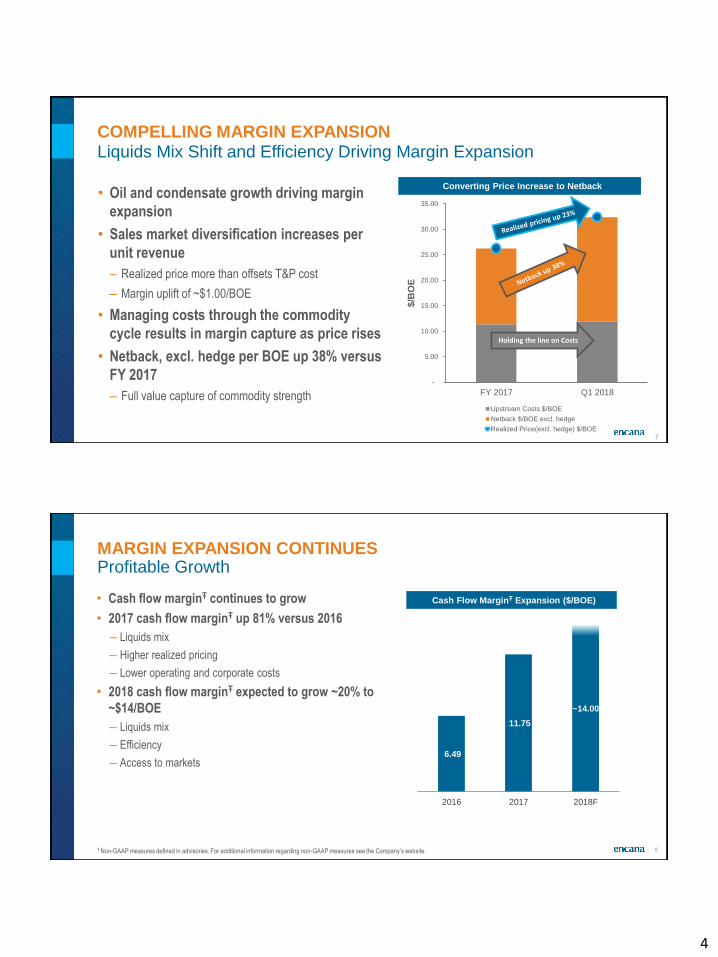
COMPELLING MARGIN EXPANSIONLiquids Mix Shift and Efficiency Driving Margin Expansion
• Oil and condensate growth driving margin
expansion
• Sales market diversification increases per
unit revenue
– Realized price more than offsets T&P cost
– Margin uplift of ~$1.00/BOE
• Managing costs through the commodity
cycle results in margin capture as price rises
• Netback, excl. hedge per BOE up 38% versus
FY 2017
– Full value capture of commodity strength
-
5.00
10.00
15.00
20.00
25.00
30.00
35.00
FY 2017 Q1 2018
$/B
OE
Upstream Costs $/BOE
Netback $/BOE excl. hedge
Realized Price(excl. hedge) $/BOE
Converting Price Increase to Netback
Holding the line on Costs
8
• Cash flow marginŦ continues to grow
• 2017 cash flow marginŦ up 81% versus 2016
― Liquids mix
― Higher realized pricing
― Lower operating and corporate costs
• 2018 cash flow marginŦ expected to grow ~20% to
~$14/BOE
― Liquids mix
― Efficiency
― Access to markets
MARGIN EXPANSION CONTINUESProfitable Growth
6.49
11.75
~14.00
2016 2017 2018F
Cash Flow MarginŦ Expansion ($/BOE)
Ŧ Non-GAAP measures defined in advisories. For additional information regarding non-GAAP measures see the Company’s website.
5
9
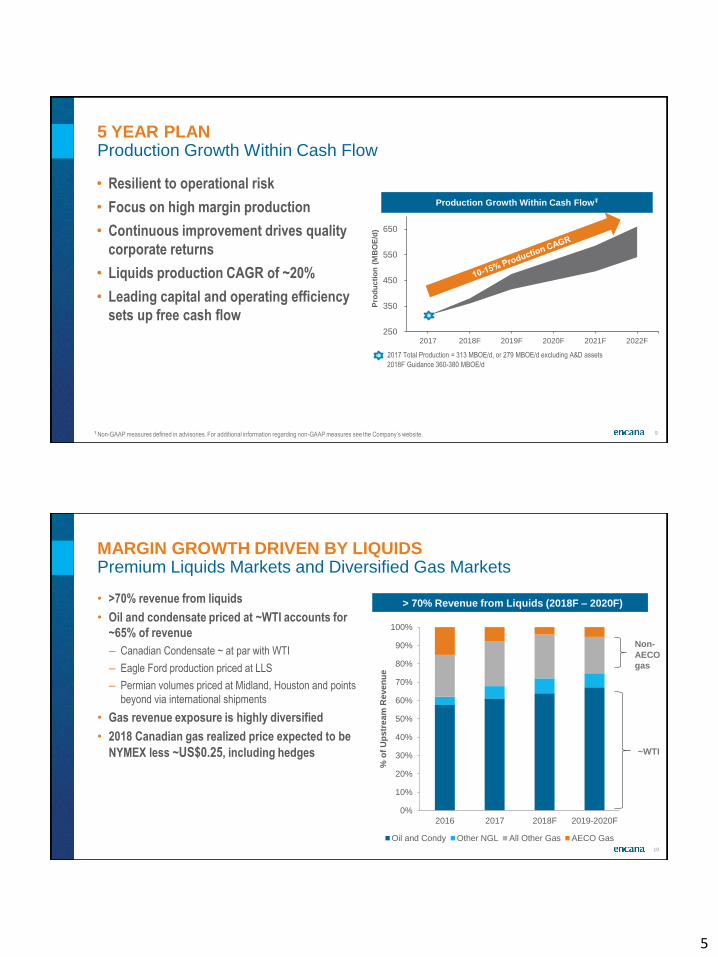
• Resilient to operational risk
• Focus on high margin production
• Continuous improvement drives quality
corporate returns
• Liquids production CAGR of ~20%
• Leading capital and operating efficiency
sets up free cash flow
5 YEAR PLANProduction Growth Within Cash Flow
Pro
du
cti
on
(M
BO
E/d
)
Production Growth Within Cash FlowŦ
Ŧ Non-GAAP measures defined in advisories. For additional information regarding non-GAAP measures see the Company’s website.
250
350
450
550
650
2017 2018F 2019F 2020F 2021F 2022F
2018F Guidance 360-380 MBOE/d
2017 Total Production = 313 MBOE/d, or 279 MBOE/d excluding A&D assets
10
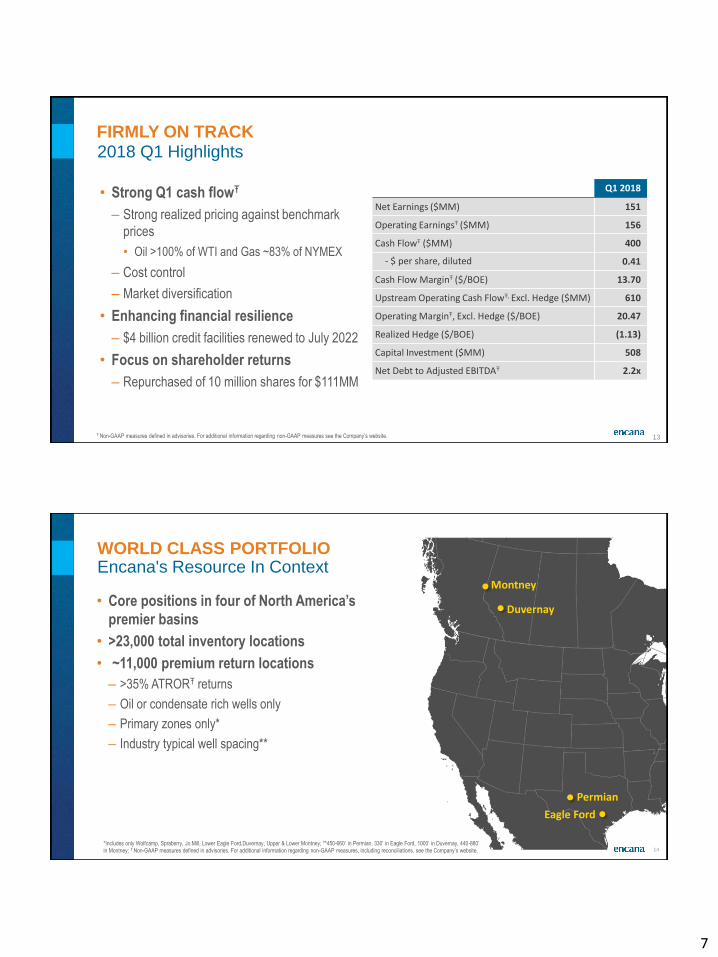
0%
10%
20%
30%
40%
50%
60%
70%
80%
90%
100%
2016 2017 2018F 2019-2020F
% o
f U
pstr
eam
Reven
ue
Oil and Condy Other NGL All Other Gas AECO Gas
• >70% revenue from liquids
• Oil and condensate priced at ~WTI accounts for
~65% of revenue
– Canadian Condensate ~ at par with WTI
– Eagle Ford production priced at LLS
– Permian volumes priced at Midland, Houston and points
beyond via international shipments
• Gas revenue exposure is highly diversified
• 2018 Canadian gas realized price expected to be
NYMEX less ~US$0.25, including hedges
MARGIN GROWTH DRIVEN BY LIQUIDSPremium Liquids Markets and Diversified Gas Markets
> 70% Revenue from Liquids (2018F – 2020F)
~WTI
Non-
AECO
gas

6
11
• Capital balanced with expected cash flowŦ
• Total production is 95% from core assets
– Annual production growth of >30% excluding dispositions
• Q4 core asset production to average 400 – 425
MBOE/d (30-37% growth from Q4/17)
• Continued margin expansion driven by liquids
growth
– 55–65 Mbbls/d of liquids in the Montney expected in Q4
• Operating and G&A costs lower
– Benefit of focus on efficiency and scale
• Market diversification benefits
– Margin increase of ~$0.50-$0.75/BOE above additional T&P
cost to access premium markets
2018 GUIDANCECash FlowŦ and Production Growing >30%
2018F Guidance
Capital Investment ($ billion) 1.8 – 1.9
Total Liquids (Mbbls/d) 165 – 175
Natural Gas (MMcf/d) 1,150 – 1,250
Total Production (MBOE/d) 360 – 380
Upstream Operating Expense ($/BOE)* 3.00 – 3.30
Transportation & Processing ($/BOE) 7.40 – 7.75
Administrative Expense ($/BOE)* 1.25 – 1.50
Production, Mineral & Other Taxes
% of Revenue**3.25 – 3.75%
*Excludes long-term incentives;
** Upstream revenue excluding risk management activitiesŦ Non-GAAP measures defined in advisories. For additional information regarding non-GAAP measures, including reconciliations, see the Company’s website.
12
CONFIDENT IN 2018 EXECUTIONPlan To Deliver >30% Production Growth* Within Cash FlowŦ
0
50
100
150
200
250
300
350
400
450
2H 2016 1H 2017 2H 2017 1H 2018F 2H 2018F
MB
OE
/d
>20% Production Growth in 2nd Half 2018
Total Production for 2016 & 2017 excludes production from assets sold in 2016 & 2017
Ŧ Non-GAAP measures defined in advisories. For additional information regarding non-GAAP measures see the Company’s website
* Adjusted for 2017 dispositions
.
• >30% annual production growth* within cash flowŦ
• Capital program front end loaded
– Restarted Duvernay drilling in January
– Ramped up Eagle Ford drilling in Q1
– Montney activity higher in Q1 and Q2 as part of liquids growth
plan, preparing to fill liquids hubs
• Production growth weighted towards second half of
2018
– Two Montney liquids hubs come on line in Q4
– >20% production growth second half of 2018 versus first half of
2018
• Efficiency & innovation offsetting service cost inflation
7
13
FIRMLY ON TRACK2018 Q1 Highlights
• Strong Q1 cash flowŦ
– Strong realized pricing against benchmark
prices
• Oil >100% of WTI and Gas ~83% of NYMEX
– Cost control
– Market diversification
• Enhancing financial resilience
– $4 billion credit facilities renewed to July 2022
• Focus on shareholder returns
– Repurchased of 10 million shares for $111MM
Q1 2018
Net Earnings ($MM) 151
Operating EarningsŦ ($MM) 156
Cash FlowŦ ($MM) 400
- $ per share, diluted 0.41
Cash Flow MarginŦ ($/BOE) 13.70
Upstream Operating Cash FlowŦ, Excl. Hedge ($MM) 610
Operating MarginŦ, Excl. Hedge ($/BOE) 20.47
Realized Hedge ($/BOE) (1.13)
Capital Investment ($MM) 508
Net Debt to Adjusted EBITDAŦ 2.2x
Ŧ Non-GAAP measures defined in advisories. For additional information regarding non-GAAP measures see the Company’s website.
14
• Core positions in four of North America’s
premier basins
• >23,000 total inventory locations
• ~11,000 premium return locations
– >35% ATRORŦ returns
– Oil or condensate rich wells only
– Primary zones only*
– Industry typical well spacing**
Encana's Resource In Context
Eagle Ford
Permian
Montney
Duvernay
*Includes only Wolfcamp, Spraberry, Jo Mill, Lower Eagle Ford,Duvernay, Upper & Lower Montney; **450-660’ in Permian, 330’ in Eagle Ford, 1000’ in Duvernay, 440-880’
in Montney; Ŧ Non-GAAP measures defined in advisories. For additional information regarding non-GAAP measures, including reconciliations, see the Company’s website.
WORLD CLASS PORTFOLIO
8
15
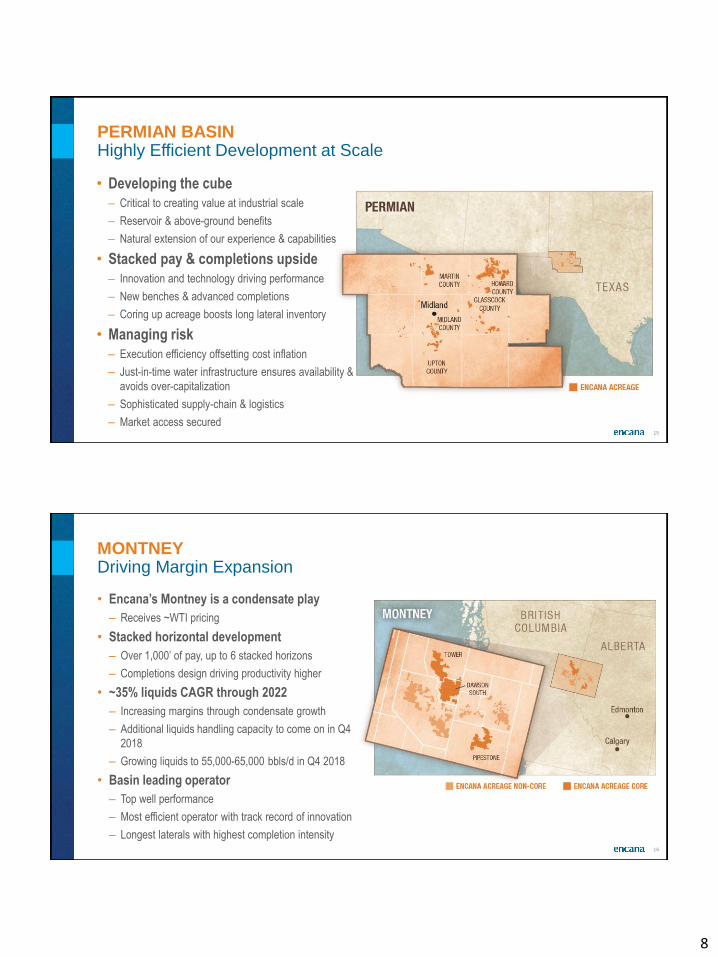
• Developing the cube
– Critical to creating value at industrial scale
– Reservoir & above-ground benefits
– Natural extension of our experience & capabilities
• Stacked pay & completions upside
– Innovation and technology driving performance
– New benches & advanced completions
– Coring up acreage boosts long lateral inventory
• Managing risk
– Execution efficiency offsetting cost inflation
– Just-in-time water infrastructure ensures availability &
avoids over-capitalization
– Sophisticated supply-chain & logistics
– Market access secured
PERMIAN BASINHighly Efficient Development at Scale
16
• Encana’s Montney is a condensate play
– Receives ~WTI pricing
• Stacked horizontal development
– Over 1,000’ of pay, up to 6 stacked horizons
– Completions design driving productivity higher
• ~35% liquids CAGR through 2022
– Increasing margins through condensate growth
– Additional liquids handling capacity to come on in Q4
2018
– Growing liquids to 55,000-65,000 bbls/d in Q4 2018
• Basin leading operator
– Top well performance
– Most efficient operator with track record of innovation
– Longest laterals with highest completion intensity
MONTNEYDriving Margin Expansion

9
17
• Largely contiguous position in the Karnes
Trough
– Most active and profitable trend in the Eagle Ford
• Completion innovations leading to better wells
• Stacked pay, infill spacing, Austin Chalk offer
additional upside
• High value, high rate wells
– >80% of production is high value liquids
– Oil receives LLS pricing
EAGLE FORDTechnical Innovation Unlocking Value
18
• Large contiguous land base within
condensate window
– WTI pricing for condensate
– Significant future growth opportunity
• Highly efficient operating performance
– Multi-well pads and integrated infrastructure
significantly reduce cost structures
– Consistently delivering industry leading well
performance
• Takeaway solution in place
– Rich Gas Premium agreement with Aux Sable, gas
transport on Alliance
– Condensate transport on Pembina’s Peace Pipeline
DUVERNAYIndustry Leading Well Performance

10
19
TECHNOLOGY & INNOVATION LEADERSHIP AT ENCANAA Competitive Advantage
Drilling & Completions
• Proprietary in-house well
design
• Integrated team with
on-the-fly modeling
capabilities
• Advanced completions
• Fibre-optic real-time
pressure/completions
design analytics
Production Operations
• Real-time production data
capture & analysis
• Automation enables highly
efficient growth
• Remote surveillance and
control boosts well and
facility up-time
Commercial Arrangements
• Creating optionality and
managing risk
• Disrupting the
commercial status quo
Culture of Innovation Structured and driven to
business outcomes
Real time knowledge sharing
across portfolio
Analytics linked with deep
understanding of first principles
Subsurface
• Geo-cellular reservoir
modeling to identify the
best rocks
• Leveraging massive
proprietary analytics
dataset (core, logs,
seismic, micro-seismic,
fracture diagnostics,
production)
20
• Chiefs organizational structure
– Promotes rapid transfer of technology between plays
– Rapidly translated success in tight cluster design from Eagle Ford to
other plays
• Scaling to cube development model
– Applying advanced completions at tighter well densities
• Well results keep getting better
• Deliberate and disciplined approach driving incremental
value
– Data-driven innovation linked with first principles
– Short cycle times facilitate rapid implementation, learning and
refinement
INNOVATION IN OPERATIONSDriven By Culture
Conceptual Advanced
Completions Design
Advanced
Completions
Tightening
clusters
maximizes
fracture
complexity
11
21
• Advanced completion design is focused on creating
better wells for lower costs
• Applying completions intensity thoughtfully
– Tight clusters and optimized hydraulics maximize fracture surface
area
– Clean fluids improve fracture conductivity
– Fine grain proppant maximizes complexity
• Culture of innovation and company-wide knowledge
sharing
– Structured and driven to business outcomes
– Real time knowledge sharing
– Analytics linked to deep understanding of first principles
• Realizing 25%+ improvement in IP180
INNOVATION IN ACTIONEvolution in Completion Design Fueling Growth
Eagle Ford Innovations Doubling Productivity
Permian High Intensity Design Keeps Frac Energy Closer
High Intensity Design Base Design
0
50
100
150
200
250
0 30 60 90 120 150 180
Cu
mu
lati
ve P
rod
ucti
on
(M
BO
E)*
Days
2015
2016
2017
*Well results normalized to 5000’ lateral.
22
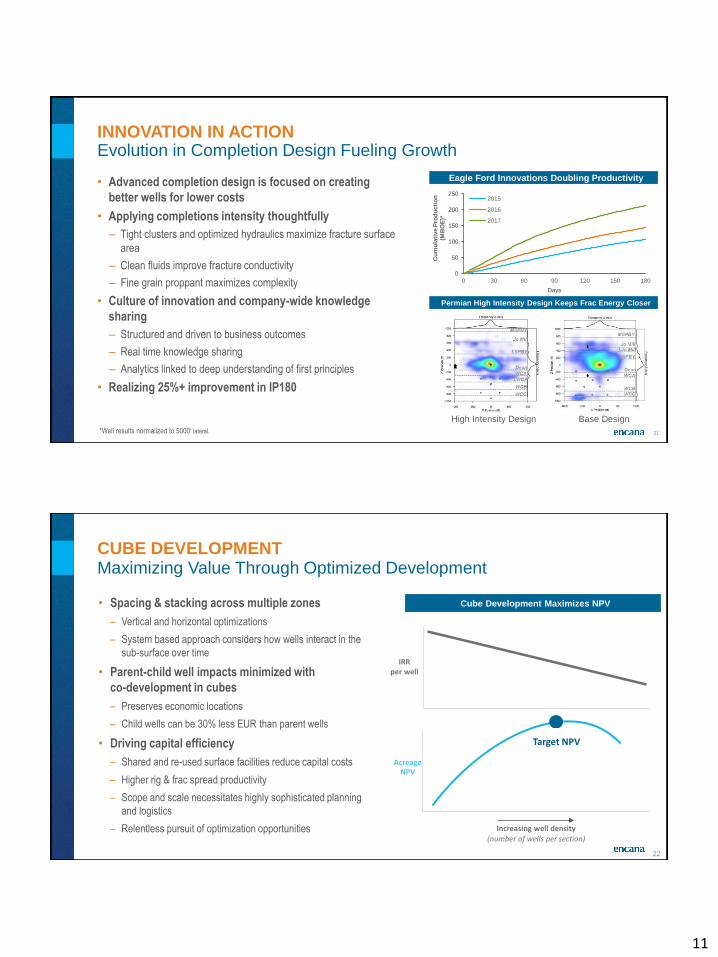
• Spacing & stacking across multiple zones
– Vertical and horizontal optimizations
– System based approach considers how wells interact in the
sub-surface over time
• Parent-child well impacts minimized with
co-development in cubes
– Preserves economic locations
– Child wells can be 30% less EUR than parent wells
• Driving capital efficiency
– Shared and re-used surface facilities reduce capital costs
– Higher rig & frac spread productivity
– Scope and scale necessitates highly sophisticated planning
and logistics
– Relentless pursuit of optimization opportunities
CUBE DEVELOPMENTMaximizing Value Through Optimized Development
Cube Development Maximizes NPV
Increasing well density
(number of wells per section)
IRR per well
Acreage NPV
Target NPV

12
23
• Higher recovery from stacked pay reservoirs
– Generating effective draw down within cube
• Highly efficient, agile development
– Higher utilization of services & infrastructure
– Rapid cycle times
– Accelerated learnings
• Cube development approach in 2018
– Data driven innovation
– Testing new benches
– Spacing & stacking trials
– Incorporating advanced completion designs
– Evaluating emerging technologies
CUBE DEVELOPMENTImproved Resource Recovery & Efficiency
Cube Development Maximizing Recovery from the Stack
24
• Fully offsetting service cost inflation with sourcing and
efficiency improvements
– Seamless linkage between supply chain and operations
• Actively managing the supply chain
– Self-sourcing commodities (sand, water, OCTG)
– Driving efficiencies with vendors
• Security of supply with commercial flexibility
– Rigs, pressure pumping and D&C services secured
• Challenging industry norms
– Logistics and local mines will drive sand costs lower
– Recycling water, optimizing trucking and fuel
– Increasing pump time per day
COMMERCIAL INNOVATIONDelivering Value in any Environment
ECA 2018 D&C Cost Breakdown
D&C Key Component Cost Breakdown
• 20-30% sand & water
• 10-15% pressure pumping
• 10-15% D&C services
• 6-8% casing
• 5-8% drilling rig
• 4-7% cement and mud
~35% of well cost is drilling
~65% of well cost is completions

13
MIDSTREAM AND MARKETING
26
• Ensuring market access
– Manage flow assurance through flexible and reliable midstream arrangements
– Maintain diversified physical sales portfolio
• Maximizing price realizations
– Netback optimization, active management of sales portfolio
– Financial price risk mitigation (active basis and benchmark price hedge programs)
• Supporting strategy execution
– De-risks growth plan
– Minimize commitments and maximize flexibility
– Reduces cash flow volatility and manages balance sheet risk
EXPANDING MARGINS & DE-RISKING GROWTHMidstream & Marketing Focus
14
27
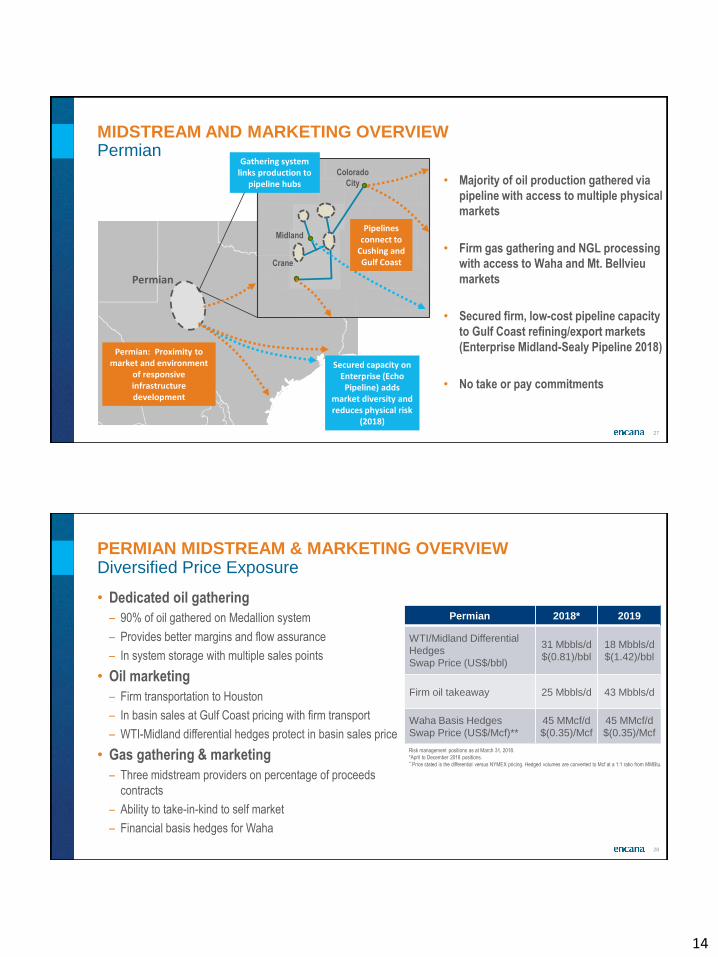
MIDSTREAM AND MARKETING OVERVIEWPermian
Gathering system links production to
pipeline hubs
Permian
• Majority of oil production gathered via
pipeline with access to multiple physical
markets
• Firm gas gathering and NGL processing
with access to Waha and Mt. Bellvieu
markets
• Secured firm, low-cost pipeline capacity
to Gulf Coast refining/export markets
(Enterprise Midland-Sealy Pipeline 2018)
• No take or pay commitments
Colorado
City
Midland
Crane
Pipelines connect to
Cushing and Gulf Coast
Permian: Proximity to market and environment
of responsive infrastructure development
Secured capacity on Enterprise (Echo
Pipeline) adds market diversity and reduces physical risk
(2018)
28
PERMIAN MIDSTREAM & MARKETING OVERVIEWDiversified Price Exposure
• Dedicated oil gathering
– 90% of oil gathered on Medallion system
– Provides better margins and flow assurance
– In system storage with multiple sales points
• Oil marketing
– Firm transportation to Houston
– In basin sales at Gulf Coast pricing with firm transport
– WTI-Midland differential hedges protect in basin sales price
• Gas gathering & marketing
– Three midstream providers on percentage of proceeds
contracts
– Ability to take-in-kind to self market
– Financial basis hedges for Waha
Permian 2018* 2019
WTI/Midland Differential
Hedges
Swap Price (US$/bbl)
31 Mbbls/d
$(0.81)/bbl
18 Mbbls/d
$(1.42)/bbl
Firm oil takeaway 25 Mbbls/d 43 Mbbls/d
Waha Basis Hedges
Swap Price (US$/Mcf)**
45 MMcf/d
$(0.35)/Mcf
45 MMcf/d
$(0.35)/Mcf
Risk management positions as at March 31, 2018.
*April to December 2018 positions. ** Price stated is the differential versus NYMEX pricing. Hedged volumes are converted to Mcf at a 1:1 ratio from MMBtu.

15
29
PERMIAN MARKET DIVERSIFICATIONMaximizing Realized Price & Minimizing Basis Risk
Permian Oil Volumes
Firm Oil
Takeaway
WTI/Midland
Differential
Hedges
• Permian realized oil price of $63.27/bbl in Q1
– 101% of WTI benchmark price
• Limited Midland differential exposure for 2018
and 2019
– Fully protected for 2018
– >90% protected for 2019
• Access to Gulf Coast and financial hedges
maximizes margins on growing volumes
30
DIVERSIFIED MARKET EXPOSURE IN WESTERN CANADAPortfolio Approach to Price Risk Management
To US NorthwestTo Dawn
To Chicago
Condensate
Imports
• ~500MMcf/d AECO basis hedged at
($0.88/Mcf) to Henry Hub
• ~500 MMcf/d firm transportation out of
the basin
• 100% firm capacity secured on NGTL for
expected production growth – limited
curtailment risk
• Condensate sold into local market at
~WTI prices
Natural Gas Export Pipeline
Condensate Import Pipeline
100% firm
capacity on
Nova Gas
Transmission
System
(NGTL)
Condensate
sold into
premium
local
market
16
31
• Western Canada
– Realized price including hedge expected to be ~$0.25 below NYMEX in 2018
– AECO US$0.25 fluctuation equals less than US$15MM cash flow in 2018 after hedge
BASIS RISK MANAGEMENT PROGRAMMarket Access & Price Risk Management
Western Canada 2018 * 2019 - 2020
AECO Basis Hedges
Swap Price US$/Mcf**475 MMcf/d
$(0.87)/Mcf
500 MMcf/d
$(0.88)/Mcf
Transport to Dawn 316 MMcf/d 316 MMcf/d
Transport to Sumas/Malin 136 MMcf/d 134 MMcf/d
Transport to Chicago 52 MMcf/d 100 MMcf/d
Risk management positions as at March 31, 2018. * May to December 2018 positions. ** Price stated is the
differential versus NYMEX pricing. Hedged and transport volumes are converted to Mcf at a 1:1 ratio from MMBtu.
32
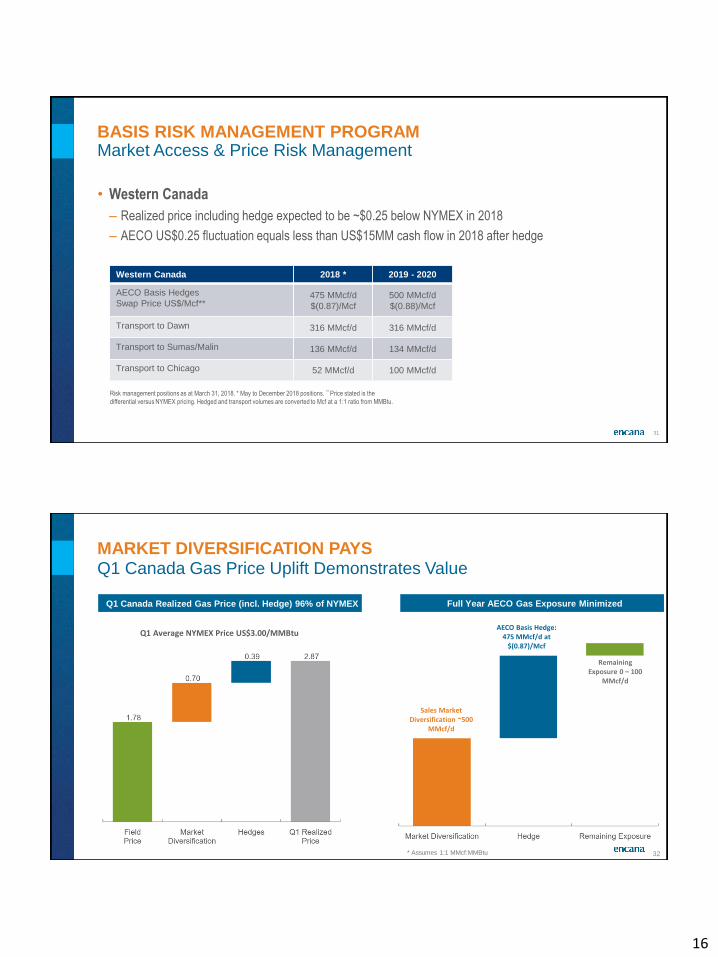
MARKET DIVERSIFICATION PAYSQ1 Canada Gas Price Uplift Demonstrates Value
Q1 Canada Realized Gas Price (incl. Hedge) 96% of NYMEX
Q1 Average NYMEX Price US$3.00/MMBtu
Full Year AECO Gas Exposure Minimized
Sales Market Diversification ~500
MMcf/d
AECO Basis Hedge: 475 MMcf/d at
$(0.87)/Mcf
Remaining Exposure 0 – 100
MMcf/d
* Assumes 1:1 MMcf:MMBtu
17
33
• 2018 balance of year price sensitivity to a $5
increase to WTI is about $35 million to cash
flow
• 2018 balance of year price sensitivity to a $0.25
increase to NYMEX gas is about $20 million to
cash flow
• F/X Risk is managed via US Dollar
denominated currency swaps:
– $700 million notional U.S. dollar denominated currency
swaps at an average exchange rate of US$ 0.7604 to
C$1, which mature monthly throughout 2018.
– $0.01 Change to F/X (eg. 0.80 to 0.79) has annual
impact of less than $10 million to cash flow
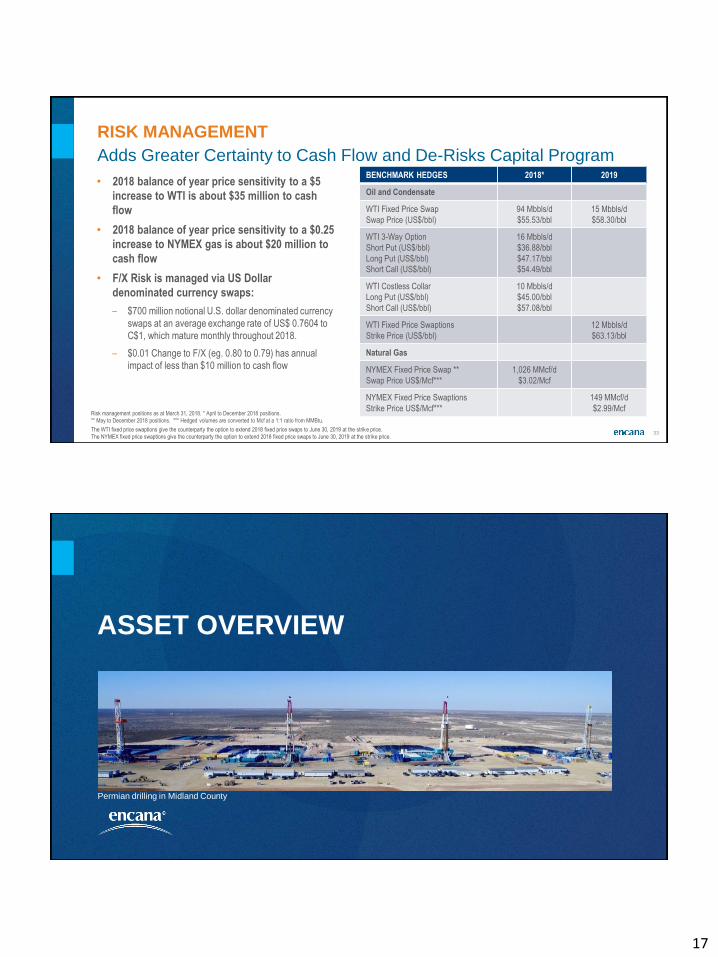
RISK MANAGEMENT
Adds Greater Certainty to Cash Flow and De-Risks Capital Program
$(0.88)/Mcf±
BENCHMARK HEDGES 2018* 2019
Oil and Condensate
WTI Fixed Price Swap
Swap Price (US$/bbl)
94 Mbbls/d
$55.53/bbl
15 Mbbls/d
$58.30/bbl
WTI 3-Way Option
Short Put (US$/bbl)
Long Put (US$/bbl)
Short Call (US$/bbl)
16 Mbbls/d
$36.88/bbl
$47.17/bbl
$54.49/bbl
WTI Costless Collar
Long Put (US$/bbl)
Short Call (US$/bbl)
10 Mbbls/d
$45.00/bbl
$57.08/bbl
WTI Fixed Price Swaptions
Strike Price (US$/bbl)
12 Mbbls/d
$63.13/bbl
Natural Gas
NYMEX Fixed Price Swap **
Swap Price US$/Mcf***
1,026 MMcf/d
$3.02/Mcf
NYMEX Fixed Price Swaptions
Strike Price US$/Mcf***
149 MMcf/d
$2.99/McfRisk management positions as at March 31, 2018. * April to December 2018 positions.
** May to December 2018 positions. *** Hedged volumes are converted to Mcf at a 1:1 ratio from MMBtu.
The WTI fixed price swaptions give the counterparty the option to extend 2018 fixed price swaps to June 30, 2019 at the strike price.
The NYMEX fixed price swaptions give the counterparty the option to extend 2018 fixed price swaps to June 30, 2019 at the strike price.
ASSET OVERVIEW
Permian drilling in Midland County
18
35
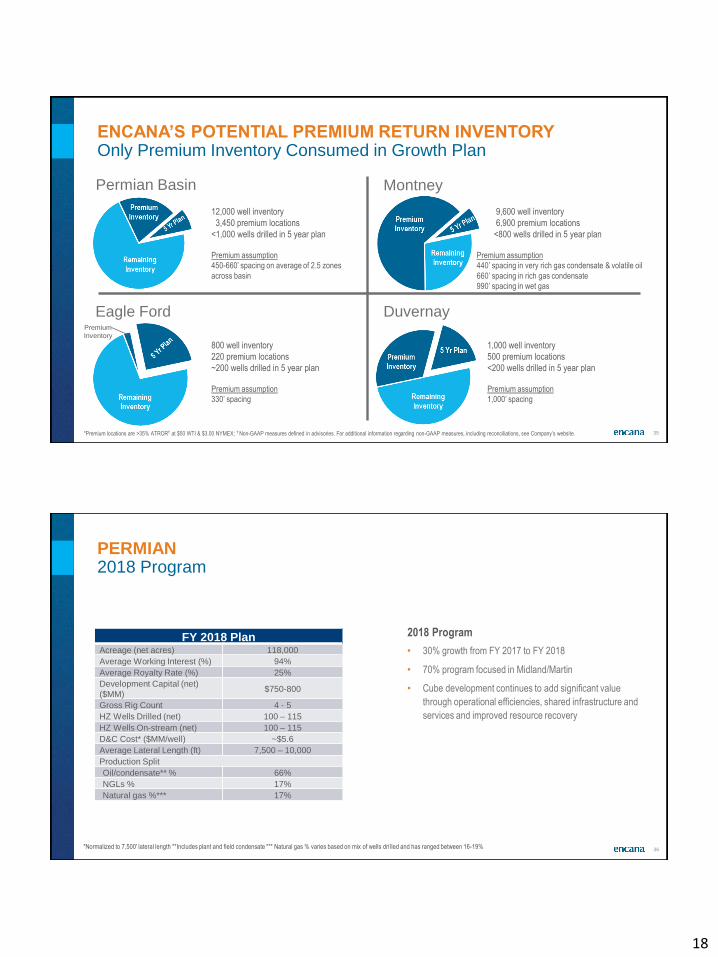
ENCANA’S POTENTIAL PREMIUM RETURN INVENTORYOnly Premium Inventory Consumed in Growth Plan
Permian Basin Montney
DuvernayEagle Ford
12,000 well inventory
3,450 premium locations
<1,000 wells drilled in 5 year plan
Premium assumption
450-660’ spacing on average of 2.5 zones
across basin
*Premium locations are >35% ATRORŦ at $50 WTI & $3.00 NYMEX; Ŧ Non-GAAP measures defined in advisories. For additional information regarding non-GAAP measures, including reconciliations, see Company’s website.
9,600 well inventory
6,900 premium locations
<800 wells drilled in 5 year plan
Premium assumption
440’ spacing in very rich gas condensate & volatile oil
660’ spacing in rich gas condensate
990’ spacing in wet gas
1,000 well inventory
500 premium locations
<200 wells drilled in 5 year plan
Premium assumption
1,000’ spacing
800 well inventory
220 premium locations
~200 wells drilled in 5 year plan
Premium assumption
330’ spacing
Remaining Inventory
Premium Inventory
Premium
Inventory
36
PERMIAN2018 Program
FY 2018 PlanAcreage (net acres) 118,000
Average Working Interest (%) 94%
Average Royalty Rate (%) 25%
Development Capital (net)
($MM)$750-800
Gross Rig Count 4 - 5
HZ Wells Drilled (net) 100 – 115
HZ Wells On-stream (net) 100 – 115
D&C Cost* ($MM/well) ~$5.6
Average Lateral Length (ft) 7,500 – 10,000
Production Split
Oil/condensate** % 66%
NGLs % 17%
Natural gas %*** 17%
*Normalized to 7,500' lateral length **Includes plant and field condensate *** Natural gas % varies based on mix of wells dri lled and has ranged between 16-19%
2018 Program
• 30% growth from FY 2017 to FY 2018
• 70% program focused in Midland/Martin
• Cube development continues to add significant value
through operational efficiencies, shared infrastructure and
services and improved resource recovery
19
37
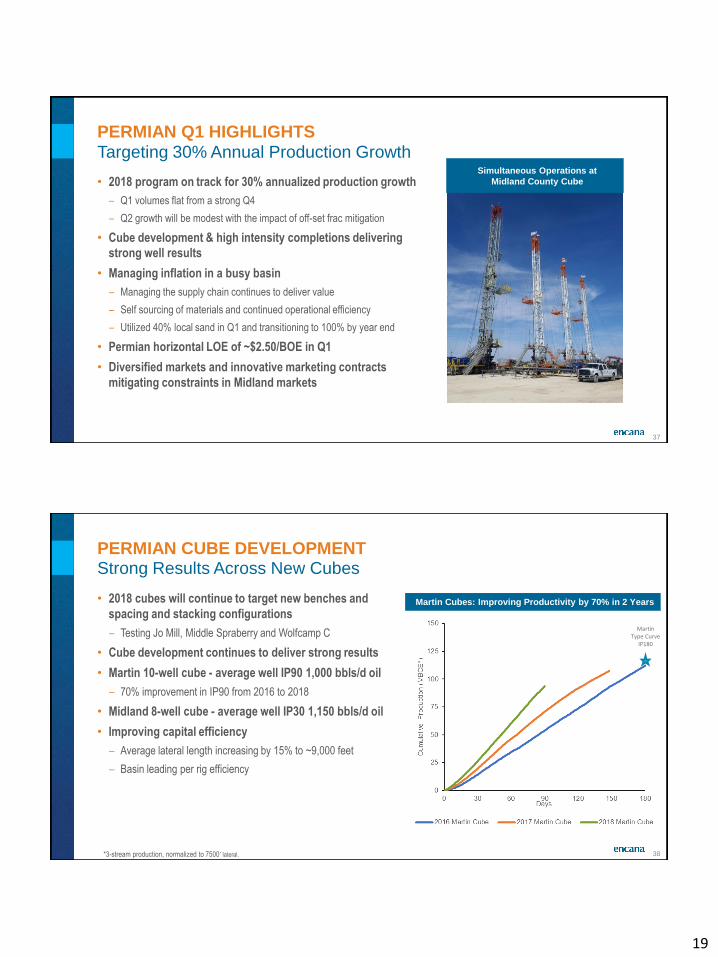
PERMIAN Q1 HIGHLIGHTS
Targeting 30% Annual Production Growth
• 2018 program on track for 30% annualized production growth
– Q1 volumes flat from a strong Q4
– Q2 growth will be modest with the impact of off-set frac mitigation
• Cube development & high intensity completions delivering
strong well results
• Managing inflation in a busy basin
– Managing the supply chain continues to deliver value
– Self sourcing of materials and continued operational efficiency
– Utilized 40% local sand in Q1 and transitioning to 100% by year end
• Permian horizontal LOE of ~$2.50/BOE in Q1
• Diversified markets and innovative marketing contracts
mitigating constraints in Midland markets
Simultaneous Operations at
Midland County Cube
38
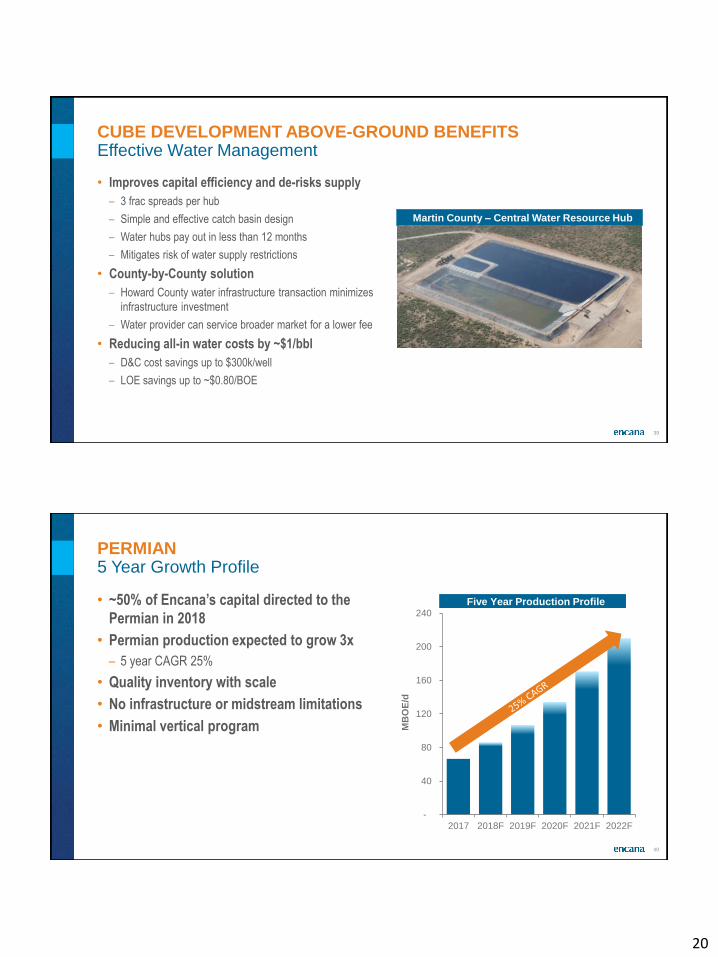
PERMIAN CUBE DEVELOPMENTStrong Results Across New Cubes
Martin Cubes: Improving Productivity by 70% in 2 Years
*3-stream production, normalized to 7500’ lateral.
• 2018 cubes will continue to target new benches and
spacing and stacking configurations
– Testing Jo Mill, Middle Spraberry and Wolfcamp C
• Cube development continues to deliver strong results
• Martin 10-well cube - average well IP90 1,000 bbls/d oil
– 70% improvement in IP90 from 2016 to 2018
• Midland 8-well cube - average well IP30 1,150 bbls/d oil
• Improving capital efficiency
– Average lateral length increasing by 15% to ~9,000 feet
– Basin leading per rig efficiency
Martin Type Curve
IP180
20
39
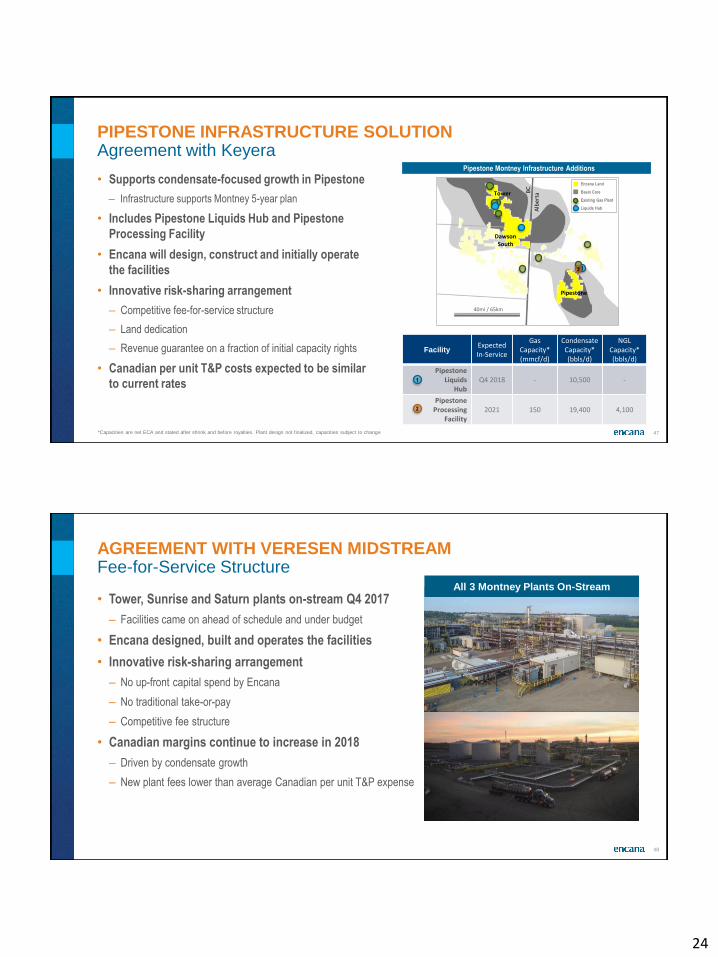
• Improves capital efficiency and de-risks supply
– 3 frac spreads per hub
– Simple and effective catch basin design
– Water hubs pay out in less than 12 months
– Mitigates risk of water supply restrictions
• County-by-County solution
– Howard County water infrastructure transaction minimizes
infrastructure investment
– Water provider can service broader market for a lower fee
• Reducing all-in water costs by ~$1/bbl
– D&C cost savings up to $300k/well
– LOE savings up to ~$0.80/BOE
CUBE DEVELOPMENT ABOVE-GROUND BENEFITSEffective Water Management
Martin County – Central Water Resource Hub
40
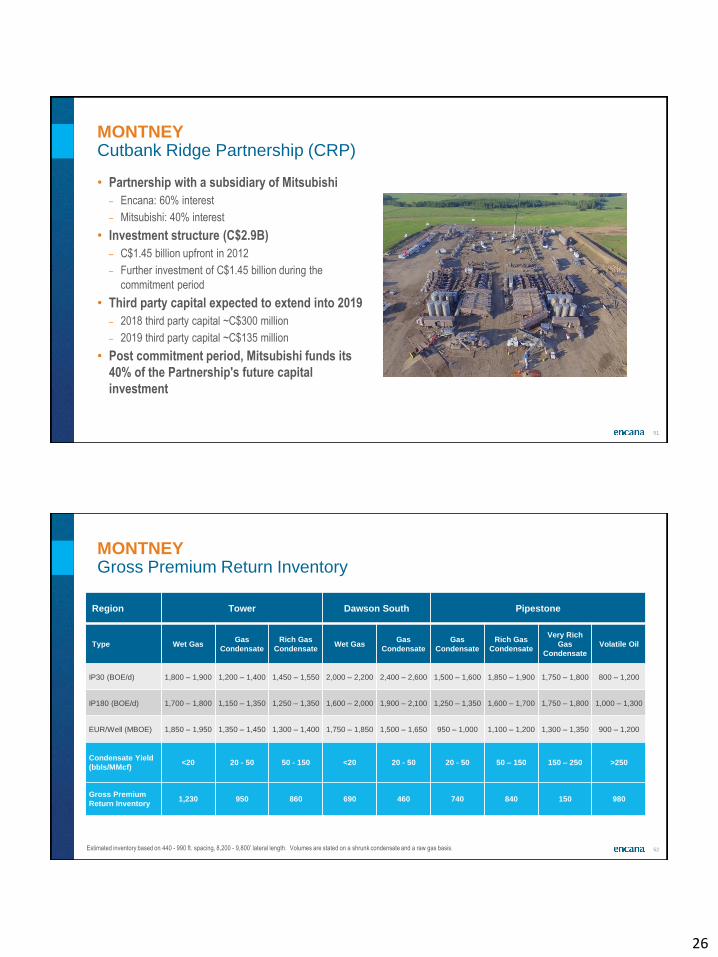
-
40
80
120
160
200
240
2017 2018F 2019F 2020F 2021F 2022F
MB
OE
/d
PERMIAN5 Year Growth Profile
• ~50% of Encana’s capital directed to the
Permian in 2018
• Permian production expected to grow 3x
– 5 year CAGR 25%
• Quality inventory with scale
• No infrastructure or midstream limitations
• Minimal vertical program
Five Year Production Profile

21
41
PERMIAN RESERVOIRMassive Potential with Stacked Benches
Zone MartinMidland/
UptonGlasscock Howard
Clear Fork ✓ ✓
M. SPBY ✓ ✓
Jo Mill ✓ ✓
L. SPBY ✓ ✓ ✓ ✓
L. SPBY- 2nd✓ ✓ ✓ ✓
WCMP A ✓ ✓ ✓ ✓
WCMP A- 2nd✓ ✓
WCMP B ✓ ✓ ✓
WCMP C ✓ ✓
WCMP D / Cline ✓ ✓ ✓ ✓
Deep Targets ✓ ✓ Total
Total Inventory 2,200 5,200 1,300 3,600 ~12,000
Premium 750 1,450 350 900 3,450
42
PREMIUM INCREASE OUTPACING DRILLINGGross Premium Return Inventory
CountyMidland/
UptonMartin Howard Glasscock
IP30 (BOE/d) 985 950 825 800
IP180 (BOE/d) 700 650 600 550
EUR/Well (Mbbls) 610 675 550 530
EUR/Well (MBOE) 1,020 1,000 875 765
GOR (scf/bbl) 2,800 2,000 2,450 1,960
Gross Premium Return
Inventory1,450 750 900 350
Estimated inventory based on 450-660 ft spacing, 7,500’ lateral length, Permian type curves are stated on a three stream basis.

22
43
MONTNEY2018 Program
FY 2018 Plan
Acreage (net acres) 379,000
British Columbia (CRP) 289,000
Alberta (Pipestone) 90,000
Working Interest (%) 63% (includes Pipestone)
Average Royalty Rate (%) 5 – 10%
Development Capital (net) $MM $400 – $450
Gross Rig Count (average) 8
Net Wells Drilled (CRP) 85 – 95
Net Wells Drilled (Pipestone) 25 – 30
Net Wells On-stream (CRP) 110 – 120
Net Wells On-stream (Pipestone) 22 – 25
D&C Cost* ($MM/well) $3.1 - $5.1
Average Lateral Length (ft) 7,200 - 9,000
Production Split
Oil/condensate** % 16%
NGLs (C2 – C4) % 6%
Natural gas % 78%
*Normalized to 7,200’ lateral length for CRP and 9,000' lateral length for Pipestone **Includes plant and field condensate
2018 Program
• 2018 significant production growth while generating free
cash flow
• Targeting Q4 2018 liquids production of 55-65Mbbls/d –
double Q4 2017 rates
• Tower and Pipestone Liquids hubs on track
• Improved liquids mix and efficient operations at scale driving
margin expansion
• Drilling activity weighted to first half of year
– Expect rig count to drop to ~half by YE
44
MONTNEY Q1 HIGHLIGHTSSet Up To Execute Liquids Growth Plan
• Montney liquids set to double again by Q4 2018
– Growth weighted to second half of 2018 – new liquids hubs
– Sexsmith Plant turn-around planned for Q2
• Impressive condensate yields on new Cubes
• Infrastructure solution in place
– New plants running well – over 98% runtime in Q1
– Pipestone Keyera agreement for Pipestone Liquids Hub in
2018 and Pipestone Gas Plant in 2021
– New Tower Liquids Hub on track
• New Pipestone well design driving pace-setter drilling
performance0
10
20
30
40
50
60
70
Q3 2017 Q4 2017 Q1 2018 Q22018F
Q32018F
Q42018F
Liq
uid
s (
Mbbls
/d)
Montney Growth on Track

23
45
MONTNEY CUBE DEVELOPMENTStrong Condensate Production Driving High Margins
• Cube development delivering strong operational
efficiencies
• 5 cubes on-stream in Tower in Q1 with 6-14 wells/cube
– Average initial CGR of 100 bbls/mmcf, ranging from
20-250+ bbls/mmcf
– 5-cube average well IP30 of ~300 bbls/d of condensate
– At $50 WTI and $1.50 AECO these wells deliver returns of
80% - 140%, excluding third party capital
• Encouraging initial results from high intensity
completions
– Testing as tight as 10 foot cluster spacing
Strong Condensate Production from Tower Cubes
0
50
100
150
200
250
300
350
400
450
500
Cube 1 Cube 2 Cube 3 Cube 4 Cube 5IP
30
Co
nd
en
sa
te S
ale
s (
bb
ls/d
)
Cube Average IP30 Condensate Tower 5-Cube Average
46
• Montney growth has been self-funded
• Transition to liquids and increase in scale driving
margin expansion
• 2018 significant production growth while generating
free cash flowŦ
• Additional growth in free cashŦ expected in 2019
• Competes with the best plays in North America
MONTNEY CASH FLOW GROWTH High Quality Condensate Play
-
200
400
600
800
1,000
1,200
1,400
2017 2018F 2019F
($M
M)
Capital Upstream Operating CF
Montney Free Operating Cash FlowŦ in 2018 & 2019
Liquids-Rich
MontneyPermian
D&C Cost ($MM) 4.0–5.5 5.6
Oil/C5 IP180 (bbls/d) 250-800 500
Royalty Rate 5-10% 25%
Ŧ Non-GAAP measures defined in advisories. For additional information regarding non-GAAP measures see the Company’s website.
24
47
• Supports condensate-focused growth in Pipestone
– Infrastructure supports Montney 5-year plan
• Includes Pipestone Liquids Hub and Pipestone
Processing Facility
• Encana will design, construct and initially operate
the facilities
• Innovative risk-sharing arrangement
– Competitive fee-for-service structure
– Land dedication
– Revenue guarantee on a fraction of initial capacity rights
• Canadian per unit T&P costs expected to be similar
to current rates
PIPESTONE INFRASTRUCTURE SOLUTIONAgreement with Keyera
*Capacities are net ECA and stated after shrink and before royalties. Plant design not finalized, capacities subject to change
FacilityExpectedIn-Service
GasCapacity* (mmcf/d)
Condensate Capacity* (bbls/d)
NGL Capacity* (bbls/d)
PipestoneLiquids
HubQ4 2018 - 10,500 -
PipestoneProcessing
Facility2021 150 19,400 4,1002
1
Pipestone Montney Infrastructure Additions
40mi / 65km
Pipestone
BC
Alb
erta
12
Dawson South
Tower
Encana Land
Basin Core
Existing Gas Plant
Liquids Hub
48
• Tower, Sunrise and Saturn plants on-stream Q4 2017
– Facilities came on ahead of schedule and under budget
• Encana designed, built and operates the facilities
• Innovative risk-sharing arrangement
– No up-front capital spend by Encana
– No traditional take-or-pay
– Competitive fee structure
• Canadian margins continue to increase in 2018
– Driven by condensate growth
– New plant fees lower than average Canadian per unit T&P expense
AGREEMENT WITH VERESEN MIDSTREAM Fee-for-Service Structure
All 3 Montney Plants On-Stream

25
49
Commissioning of Tower, Sunrise and Saturn in 2017 added approximately 450 MMcf/d of gas,
19 Mbbls/d of condensate, and 10 Mbbls/d of NGL to existing capacity
MONTNEY INFRASTRUCTURE PLANLiquids Handling Capacity Supports Growth & Flexibility
*Condensate capacity includes field & plant condensate. Capacities are net ECA, and stated after shrink and before royalties.
**Pipestone facilities part of the recently announced Keyera Partnership agreement.
Net Encana Capacity
Icon NameAnticipated
TimingGas*
(MMcf/d)Condensate*
(bbls/d)NGLs*
(bbls/d)
Existing Facilities 1,150 42,000 15,500
Tower NCLH Q4 2018 0 9,000 0
Pipestone Liquids
Hub**Q4 2018 0 10,500 0
Total Net Capacity Year End 2018 1,150 61,500 15,500
Pipestone
Processing
Facility**2021 150 17,000 4,100
40mi / 65km
Dawson South
Pipestone
Tower
BC
Alb
erta
1
Key Montney Infrastructure Additions
2
1
2
3 3
50
-
500
1,000
1,500
2017 2018F 2019F 2020F 2021F 2022F
MM
cf/
d
ENCANA MONTNEY5 Year Growth Profile
• Development focused in condensate rich areas
• 2018 program to fill new liquids capacity
‒ Additional capacity comes online late 2018
• Operating margin expected to increase >40% by
2022
• Liquids production of 55-65 Mbbls/d Q4 2018
• Expect liquids production of >70 Mbbls/d by 2019
‒ Liquid weighting grows to >25% of total by 2019
• Liquids handling expansions support growth
plans
-
30
60
90
2017 2018F 2019F 2020F 2021F 2022F
Mb
bls
/d
Gas Growth Profile
Liquids Growth Profile
Volumes quoted are net to Encana.
26
51
• Partnership with a subsidiary of Mitsubishi
– Encana: 60% interest
– Mitsubishi: 40% interest
• Investment structure (C$2.9B)
– C$1.45 billion upfront in 2012
– Further investment of C$1.45 billion during the
commitment period
• Third party capital expected to extend into 2019
– 2018 third party capital ~C$300 million
– 2019 third party capital ~C$135 million
• Post commitment period, Mitsubishi funds its
40% of the Partnership's future capital
investment
MONTNEYCutbank Ridge Partnership (CRP)
52
Region Tower Dawson South Pipestone
Type Wet GasGas
Condensate
Rich Gas
CondensateWet Gas
Gas
Condensate
Gas
Condensate
Rich Gas
Condensate
Very Rich
Gas
Condensate
Volatile Oil
IP30 (BOE/d) 1,800 – 1,900 1,200 – 1,400 1,450 – 1,550 2,000 – 2,200 2,400 – 2,600 1,500 – 1,600 1,850 – 1,900 1,750 – 1,800 800 – 1,200
IP180 (BOE/d) 1,700 – 1,800 1,150 – 1,350 1,250 – 1,350 1,600 – 2,000 1,900 – 2,100 1,250 – 1,350 1,600 – 1,700 1,750 – 1,800 1,000 – 1,300
EUR/Well (MBOE) 1,850 – 1,950 1,350 – 1,450 1,300 – 1,400 1,750 – 1,850 1,500 – 1,650 950 – 1,000 1,100 – 1,200 1,300 – 1,350 900 – 1,200
Condensate Yield
(bbls/MMcf)<20 20 - 50 50 - 150 <20 20 - 50 20 - 50 50 – 150 150 – 250 >250
Gross Premium
Return Inventory1,230 950 860 690 460 740 840 150 980
MONTNEYGross Premium Return Inventory
Estimated inventory based on 440 - 990 ft. spacing, 8,200 - 9,800’ lateral length. Volumes are stated on a shrunk condensate and a raw gas basis.
27
53
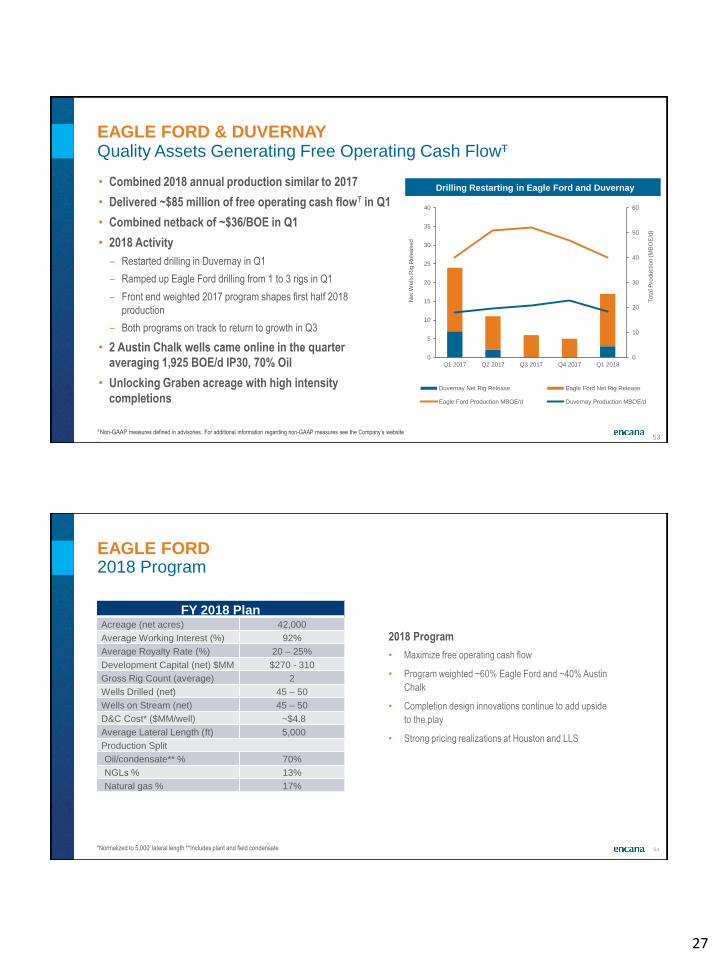
EAGLE FORD & DUVERNAY Quality Assets Generating Free Operating Cash FlowŦ
• Combined 2018 annual production similar to 2017
• Delivered ~$85 million of free operating cash flowŦ in Q1
• Combined netback of ~$36/BOE in Q1
• 2018 Activity
– Restarted drilling in Duvernay in Q1
– Ramped up Eagle Ford drilling from 1 to 3 rigs in Q1
– Front end weighted 2017 program shapes first half 2018
production
– Both programs on track to return to growth in Q3
• 2 Austin Chalk wells came online in the quarter
averaging 1,925 BOE/d IP30, 70% Oil
• Unlocking Graben acreage with high intensity
completions
0
10
20
30
40
50
60
0
5
10
15
20
25
30
35
40
Q1 2017 Q2 2017 Q3 2017 Q4 2017 Q1 2018
Tota
l P
roduction (M
BO
E/d
)
Net
Wells R
ig R
ele
ased
Duvernay Net Rig Release Eagle Ford Net Rig Release
Eagle Ford Production MBOE/d Duvernay Production MBOE/d
Drilling Restarting in Eagle Ford and Duvernay
Ŧ Non-GAAP measures defined in advisories. For additional information regarding non-GAAP measures see the Company’s website
.
54
EAGLE FORD 2018 Program
FY 2018 PlanAcreage (net acres) 42,000
Average Working Interest (%) 92%
Average Royalty Rate (%) 20 – 25%
Development Capital (net) $MM $270 - 310
Gross Rig Count (average) 2
Wells Drilled (net) 45 – 50
Wells on Stream (net) 45 – 50
D&C Cost* ($MM/well) ~$4.8
Average Lateral Length (ft) 5,000
Production Split
Oil/condensate** % 70%
NGLs % 13%
Natural gas % 17%
*Normalized to 5,000' lateral length **Includes plant and field condensate
2018 Program
• Maximize free operating cash flow
• Program weighted ~60% Eagle Ford and ~40% Austin
Chalk
• Completion design innovations continue to add upside
to the play
• Strong pricing realizations at Houston and LLS

28
55
MIDSTREAM AND MARKETING OVERVIEWEagle Ford
• Firm gas gathering and NGL processing
aligned with asset development program
• Infield gathering and extensive market
assets in place to ensure flow and
downstream connectivity
• Diverse physical marketing portfolio with
access to Gulf Coast refining markets
• Proximity to market minimizes
transportation cost and related
commitments while maximizing margins
Houston
Corpus Christi
Three Rivers
Close proximity to market and
well-developed infrastructure
Eagle Ford
56
Type Curve Eagle Ford Austin Chalk
IP30 (BOE/d) 1200 1400
IP180 (BOE/d) 950 1040
EUR/Well (Mbbls) 490 590
EUR/Well (MBOE) 650 770
GOR (scf/bbl) 2,000 1,500
Gross Premium Return
Inventory155 65
EAGLE FORDGross Premium Return Inventory
• 220 premium return
inventory locations
• Testing additional
opportunity in both the
Graben area of the Eagle
Ford and in the Austin Chalk
Estimated Eagle Ford inventory based on 330 ft spacing, 5,000’ lateral length. Type curves are stated on a three stream basis.

29
57
DUVERNAY2018 Program
FY 2018 PlanSimonette Acreage (net acres) 91,000
Average Working Interest (%) 50%
Average Royalty Rate (%) 5 – 10%
Development Capital (net) $MM $100 – 130
Gross Rig Count (average) 1
Wells Drilled (net) 7 – 9
Wells on Stream (net) 7 – 9
D&C Cost* ($MM/well) ~$9.7
Average Lateral Length (ft) 9,000
Production Split
Oil/condensate** % 40%
NGLs (C2 – C4) % 8%
Natural gas % 52%
*Normalized to 9,000' lateral length **Includes plant and field condensate.
2018 Program
• Maximize free operating cash flow
• Strong margin driven by ~50% liquids and ~WTI
realizations for condensate
• Advanced completions contributing to 25% productivity
improvement
• Activity weighted to first half of 2018
58
MIDSTREAM AND MARKETING OVERVIEWDuvernay
• Condensate sales via pipeline to premium
Edmonton market center
• Firm market access aligned with
development program
• Achieved liquids price upgrade while
minimizing midstream capex via Alliance
pipeline
• Diversified pricing exposure for liquids and
natural gas in Chicago market
Duvernay
Alliance Pipeline to U.S. Midwest
(Chicago)
Condensate to Edmonton market
center
30
59
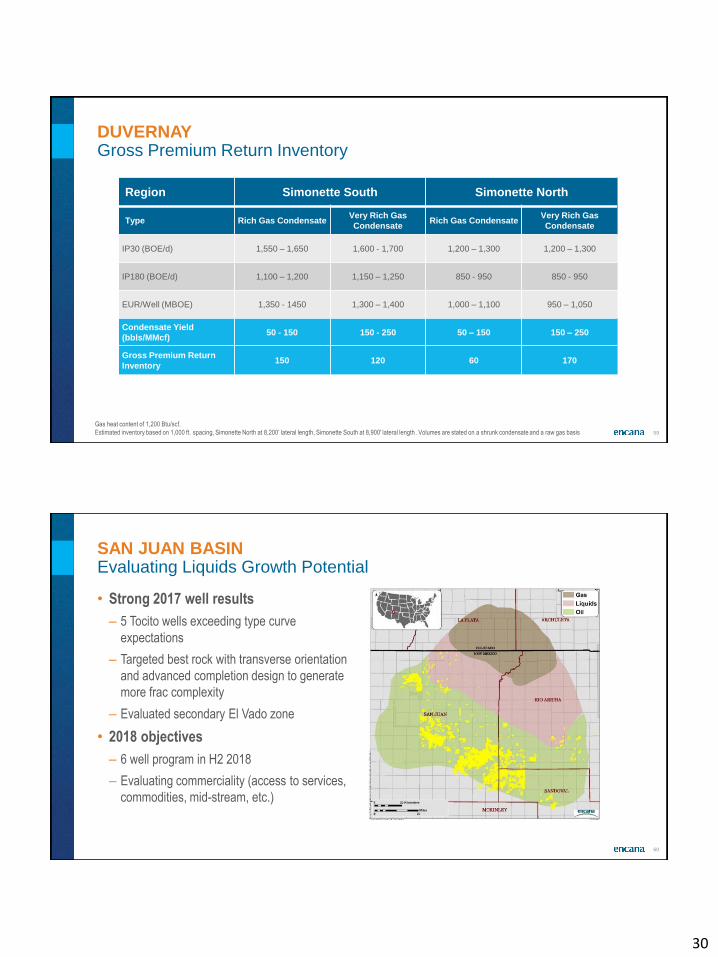
DUVERNAYGross Premium Return Inventory
Region Simonette South Simonette North
Type Rich Gas CondensateVery Rich Gas
CondensateRich Gas Condensate
Very Rich Gas
Condensate
IP30 (BOE/d) 1,550 – 1,650 1,600 - 1,700 1,200 – 1,300 1,200 – 1,300
IP180 (BOE/d) 1,100 – 1,200 1,150 – 1,250 850 - 950 850 - 950
EUR/Well (MBOE) 1,350 - 1450 1,300 – 1,400 1,000 – 1,100 950 – 1,050
Condensate Yield
(bbls/MMcf)50 - 150 150 - 250 50 – 150 150 – 250
Gross Premium Return
Inventory150 120 60 170
Gas heat content of 1,200 Btu/scf.
Estimated inventory based on 1,000 ft. spacing, Simonette North at 8,200’ lateral length, Simonette South at 8,900' lateral length . Volumes are stated on a shrunk condensate and a raw gas basis
60
SAN JUAN BASINEvaluating Liquids Growth Potential
• Strong 2017 well results
– 5 Tocito wells exceeding type curve
expectations
– Targeted best rock with transverse orientation
and advanced completion design to generate
more frac complexity
– Evaluated secondary El Vado zone
• 2018 objectives
– 6 well program in H2 2018
– Evaluating commerciality (access to services,
commodities, mid-stream, etc.)

31
SUPPLEMENTAL
62
• Benefit of scale driving lower per unit BOE costs
– Reducing costs & growing production volumes
• Interest on debt expected to be ~$70MM/quarter
– Consolidated interest expense $90-$95MM/quarter
• Administrative expense, ex. LTI’s, expected to be
~$45MM/quarter for 2018
• Market optimization segment includes T&P costs
of $30-$35MM/quarter for 2018
– Segment operating loss expected to be ~$15MM/quarter
• Combined corporate costs impacting cash flow are
~$120MM/quarter, excluding cash impact of long-
term incentives
– Long term incentive cash costs typically vest in first quarter,
primarily 3 year vesting cycle
MAXIMIZING MARGINCost Control of Corporate Items Enhances Per Unit Margin
-
1.00
2.00
3.00
4.00
5.00
6.00
-
100
200
300
400
500
600
700
2017 2018F
$/B
OE
$M
M
Interest Expense G&A Excluding LTI
Market Optimization Combined Cost $/BOE
Corporate Items Cost Control

32
63
PRODUCT VALUE CHAINProjected Composition of Total Production Excluding Hedge
*2018F based on company guidance as at February 15, 2018, excluding impact of hedges; production ranges are not additive; **I ncludes plant condensate
Canada US
2018F*
(Mbbls/d)
2018F Pricing
(%WTI)
2018F*
(Mbbls/d)
2018F Pricing
(%WTI)
Oil 0 – 1 93% 87 – 90 97%
Condensate** 38 – 40 93% 3 – 4 87%
Butane 6 – 8 60% 4 – 5 52%
Propane 7 – 9 31% 8 – 9 44%
Ethane 0 – 1 20% 9 – 10 10%
Canada US
2018F*
(MMcf/d)
2018F Pricing
(%NYMEX)
2018F*
(MMcf/d)
2018F Pricing
(%NYMEX)
Natural Gas 1,000 – 1,100 70% 140 – 160 75%
64
WESTERN CANADIAN CONDENSATE FUNDAMENTALSPremium Condensate Market
Source: RBC Capital Markets and Government Data
Condensate demand in
western Canada is
expected to outstrip
domestic supply –
with imports bridging
the gap
33
65
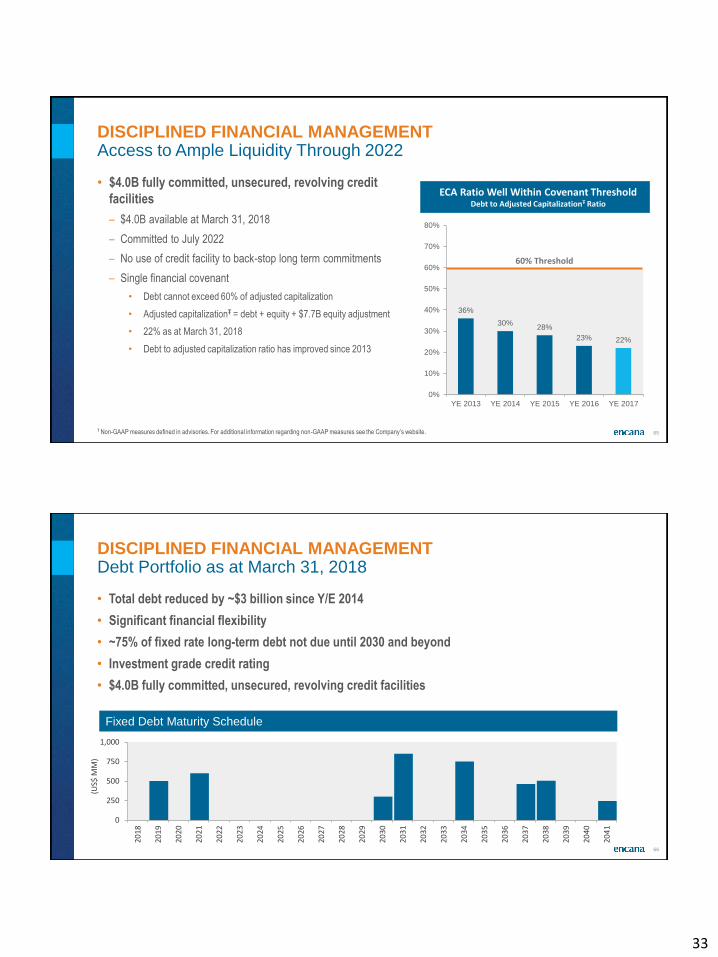
36%
30%28%
23% 22%
0%
10%
20%
30%
40%
50%
60%
70%
80%
YE 2013 YE 2014 YE 2015 YE 2016 YE 2017
• $4.0B fully committed, unsecured, revolving credit
facilities
– $4.0B available at March 31, 2018
– Committed to July 2022
– No use of credit facility to back-stop long term commitments
– Single financial covenant
• Debt cannot exceed 60% of adjusted capitalization
• Adjusted capitalizationŦ = debt + equity + $7.7B equity adjustment
• 22% as at March 31, 2018
• Debt to adjusted capitalization ratio has improved since 2013
DISCIPLINED FINANCIAL MANAGEMENTAccess to Ample Liquidity Through 2022
ECA Ratio Well Within Covenant ThresholdDebt to Adjusted CapitalizationŦ Ratio
60% Threshold
Ŧ Non-GAAP measures defined in advisories. For additional information regarding non-GAAP measures see the Company’s website.
66
• Total debt reduced by ~$3 billion since Y/E 2014
• Significant financial flexibility
• ~75% of fixed rate long-term debt not due until 2030 and beyond
• Investment grade credit rating
• $4.0B fully committed, unsecured, revolving credit facilities
DISCIPLINED FINANCIAL MANAGEMENTDebt Portfolio as at March 31, 2018
0
250
500
750
1,000
20
18
20
19
20
20
20
21
20
22
20
23
20
24
20
25
20
26
20
27
20
28
20
29
20
30
20
31
20
32
20
33
20
34
20
35
20
36
20
37
20
38
20
39
20
40
20
41
(US$
MM
)
Fixed Debt Maturity Schedule

34
67
FUTURE ORIENTED INFORMATIONThis presentation contains certain forward-looking statements or information (collectively, “FLS”) within the meaning of applicable securities legislation, including the U.S. Private Securities Litigation Reform Act of 1995. FLS include:
• expectation of meeting or exceeding targets in corporate guidance and five-year plan
• anticipated capital program, including focus of development and allocation thereof, number of wells on
stream, level of capital productivity, expected return and source of funding
• well performance, completions intensity, location of acreage and costs relative to peers and within assets
• anticipated production, including growth from core assets, cash flow, free cash flow, capital coverage,
payout, profit, net present value, rates of return, recovery, return on capital employed, production and
execution efficiency, operating, income and cash flow margin, and margin expansion, including expected timeframes
• number of potential drilling locations (including premium return inventory and ability to add to or consume
such inventory), well spacing, number of wells per pad, decline rate, rig count, rig release metrics, focus and
timing of drilling, anticipated vertical and horizontal drilling, cycle times, commodity composition, gas-oil
ratios and operating performance compared to type curves
• running room and scale of assets, including its competitiveness and pace of growth against peers
• pacesetting metrics being indicative of future well performance and costs, and sustainability thereof
• timing, success and benefits from innovation, cube development approach, advanced completions design,
scale of development, high-intensity completions and precision targeting, and transferability of ideas
• expected transportation and processing capacity, commitments, curtailments and restrictions, including
flexibility of commercial arrangements and costs and timing of certain infrastructure being operational
• anticipated reserves and resources, including product types and stacked resource potential
• anticipated third-party incremental and joint venture carry capital
• ability to manage costs and efficiencies, including drilling and completion, operating, corporate,
transportation and processing, staffing, services and materials secured and supply chain management
• expected net debt, net debt to adjusted EBITDA, target leverage, financial capacity and other debt metrics
• growth in long-term shareholder value, options to maximize shareholder returns and timing thereof
• commodity price outlook • outcomes of risk management program, including exposure to commodity prices and foreign exchange,
amount of hedged production, market access, market diversification strategy and physical sales locations
• management of balance sheet and credit rating, including access to sources of liquidity and available cash
• execution of strategy and future outlook in five-year plan, including expected growth, returns, free cash flow,
projections based on commodity prices and use of cash therefrom
• environmental, health and safety performance
• advantages of Encana’s multi-basin portfolio
• anticipated dividends or changes thereto
• impact of changes in laws and regulations, including recent U.S. tax reform
• anticipated share repurchase program, including amount and number of shares, anticipated timeframe and
benefits of program
Readers are cautioned against unduly relying on FLS which, by their nature, involve numerous assumptions, risks and uncertainties that may cause such statements not to occur, or results to differ materially from those expressed or
implied. These assumptions include: future commodity prices and differentials; foreign exchange rates; ability to access credit facilities and shelf prospectuses; assumptions contained in the Company’s corporate guidance, five-year
plan and as specified herein; data contained in key modeling statistics; availability of attractive hedges and enforceability of risk management program; effectiveness of Encana's drive to productivity and efficiencies; results from
innovations; expectation that counterparties will fulfill their obligations under the gathering, midstream and marketing agreements; access to transportation and processing facilities where Encana operates; assumed tax, royalty and
regulatory regimes; enforceability of transaction agreements; and expectations and projections made in light of, and generally consistent with, Encana's historical experience and its perception of historical trends, including with
respect to the pace of technological development, benefits achieved and general industry expectations. Risks and uncertainties that may affect these business outcomes include: ability to generate sufficient cash flow to meet
obligations; commodity price volatility; ability to secure adequate transportation and potential pipeline curtailments; variability and discretion of Encana's board of directors to declare and pay dividends, if any; variability in the amount,number of shares and timing of purchases, if any, pursuant to the share repurchase program; timing and costs of well, facilities and pipeline construction; business interruption, property and casualty losses or unexpected technical
difficulties, including impact of weather; counterparty and credit risk; impact of a downgrade in credit rating and its impact on access to sources of liquidity; fluctuations in currency and interest rates; risks inherent in Encana's
corporate guidance; failure to achieve cost and efficiency initiatives; risks inherent in marketing operations; risks associated with technology; changes in or interpretation of royalty, tax, environmental, greenhouse gas, carbon,
accounting and other laws or regulations; risks associated with existing and potential lawsuits and regulatory actions made against Encana; impact of disputes arising with its partners, including suspension of certain obligations and
inability to dispose of assets or interests in certain arrangements; Encana's ability to acquire or find additional reserves; imprecision of reserves estimates and estimates of recoverable quantities of liquids and natural gas from plays
and other sources not currently classified as proved, probable or possible reserves or economic contingent resources, including future net revenue estimates; risks associated with past and future acquisitions or divestitures of certain
assets or other transactions or receipt of amounts contemplated under the transaction agreements (such transactions may include third-party capital investments, farm-outs or partnerships, which Encana may refer to from time to
time as “partnerships” or “joint ventures” and the funds received in respect thereof which Encana may refer to from time to time as “proceeds”, “deferred purchase price” and/or “carry capital”, regardless of the legal form) as a result of
various conditions not being met; and other risks and uncertainties impacting Encana's business, as described in its most recent Annual Report on Form 10-K and as described from time to time in Encana’s other periodic filings as
filed on SEDAR and EDGAR.
Although Encana believes the expectations represented by FLS are reasonable, there can be no assurance FLS will prove to be correct. Readers are cautioned that the above assumptions, risks and uncertainties are not exhaustive.
FLS are made as of the date hereof and, except as required by law, Encana undertakes no obligation to update publicly or revise any FLS. The FLS contained herein are expressly qualified by these cautionary statements.
Certain future oriented financial information or financial outlook information is included in this presentation to communicate current expectations as to Encana’s performance. Readers are cautioned that it may not be appropriate for
other purposes. Rates of return for a particular asset or well are on a before-tax basis and are based on specified commodity prices with local pricing offsets, capital costs associated with drilling, completing and equipping a well, field
operating expenses and certain type curve assumptions. Pacesetter well costs for a particular asset are a composite of the best drilling performance and best completions performance wells in the current quarter in such asset and
are presented for comparison purposes. Drilling and completions costs have been normalized as specified in this presentation based on certain lateral lengths for a particular asset. Premium well locations are locations with expected
after tax returns greater than 35% at $50/bbl WTI and $3/MMBtu NYMEX. For convenience, references in this presentation to “Encana”, the “Company”, “we”, “us” and “our” may, where applicable, refer only to or include any relevant
direct and indirect subsidiary corporations and partnerships (“Subsidiaries”) of Encana Corporation, and the assets, activities and initiatives of such Subsidiaries.
68
ADVISORY REGARDING OIL & GAS INFORMATIONAll estimates in this news release are effective as of December 31, 2017, prepared by qualified reserves evaluators in accordance with procedures and standards contained in the Canadian Oil and Gas Evaluation ("COGE") Handbook,
National Instrument 51-101 (NI 51-101) and SEC regulations, as applicable. On August 14, 2017, Encana was granted an exemption by the Canadian Securities Administrators from the requirements under NI 51-101 that each qualified
reserves evaluator or qualified reserves auditor appointed under section 3.2 of NI 51-101 and who execute the report under Item 2 of Section 2 of NI 51-101 be independent of Encana. Notwithstanding this exemption, for year-ended
December 31, 2017, Encana involved independent qualified reserves auditors to audit a portion of the Company’s reserves and economic contingent resources estimates. Detailed Canadian and U.S. protocol disclosure will be contained in
the Form 51-101F1 and Annual Report on Form 10-K, respectively, as described in Note 2. Additional detail regarding Encana's economic contingent resources disclosure will be available in the Supplemental Disclosure Document filed
concurrently with the Form 51-101F1. Information on the forecast prices and costs used in preparing the Canadian protocol estimates will be contained in the Form 51-101F1. For additional information relating to risks associated with the
estimates of reserves and resources, see "Item 1A. Risk Factors" of the Annual Report on Form 10-K.
Reserves are the estimated remaining quantities of oil and natural gas and related substances anticipated to be recoverable from known accumulations, from a given date forward, based on: analysis of drilling, geological, geophysical and
engineering data, the use of established technology, and specified economic conditions, which are generally accepted as being reasonable. Proved reserves are those reserves which can be estimated with a high degree of certainty to be
recoverable. It is likely that the actual remaining quantities recovered will exceed the estimated proved reserves. Probable reserves are those additional reserves that are less certain to be recovered than proved reserves. It is equally likely
that the actual remaining quantities recovered will be greater or less than the sum of the estimated proved plus probable reserves. Contingent resources do not constitute, and should not be confused with, reserves. Contingent resources
are defined as those quantities of petroleum estimated, as of a given date, to be potentially recoverable from known accumulations using established technology or technology under development, but which are not currently considered to
be commercially recoverable due to one or more contingencies. There is uncertainty that it will be commercially viable to produce any portion of the resources. All of the resources classified as contingent are considered to be discovered,
and as such have been assigned a 100% chance of discovery, but have however been risked for the chance of development. The chance of development is defined as the likelihood of a project being commercially viable and development
proceeding in a timely fashion. Determining the chance of development requires taking into consideration each contingency and quantifying the risks into an overall development risk factor at a project level. Contingent resources are defined
as “economic contingent resources” if they are currently economically recoverable and are categorized as economic if those contingent resources have a positive net present value under currently forecasted prices and costs. In examining
economic viability, the same fiscal conditions have been applied as in the estimation of Encana’s reserves. Contingencies include factors such as required corporate or third party (such as joint venture partners) approvals, legal,
environmental, political and regulatory matters or a lack of infrastructure or markets. None of Encana’s estimated contingent resources are subject to technical contingencies.
Encana uses the terms play, resource play, total petroleum initially-in-place (“PIIP”), natural gas-in-place (“NGIP”), and crude oil-in-place (“COIP”). Play encompasses resource plays, geological formations and conventional plays. Resource
play describes an accumulation of hydrocarbons known to exist over a large areal expanse and/or thick vertical section, which when compared to a conventional play, typically has a lower geological and/or commercial development risk and
lower average decline rate. PIIP is defined by the Society of Petroleum Engineers - Petroleum Resources Management System (“SPE-PRMS”) as that quantity of petroleum that is estimated to exist originally in naturally occurring
accumulations. It includes that quantity of petroleum that is estimated, as of a given date, to be contained in known accumulations prior to production plus those estimated quantities in accumulations yet to be discovered (equivalent to “total
resource potential”). NGIP and COIP are defined in the same manner, with the substitution of “natural gas” and “crude oil” where appropriate for the word “petroleum”. As used by Encana, estimated ultimate recovery (“EUR”), which
Encana may refer to as recoverable resource potential, has the meaning set out jointly by the Society of Petroleum Engineers and World Petroleum Congress in the year 2000, being those quantities of petroleum which are estimated, on a
given date, to be potentially recoverable from an accumulation, plus those quantities already produced therefrom.
Encana has provided information with respect to its assets which are “analogous information” as defined in NI 51-101, including estimates of PIIP, NGIP, COIP, EUR and production type curves. This analogous information is presented on
a basin, sub-basin or area basis utilizing data derived from Encana's internal sources, as well as from a variety of publicly available information sources which are predominantly independent in nature. Production type curves are based on a
methodology of analog, empirical and theoretical assessments and workflow with consideration of the specific asset, and as depicted in this presentation, is representative of Encana’s current program, including relative to current
performance, but are not necessarily indicative of ultimate recovery. Some of this data may not have been prepared by qualified reserves evaluators, may have been prepared based on internal estimates, and the preparation of any
estimates may not be in strict accordance with COGEH. Estimates by engineering and geo-technical practitioners may vary and the differences may be significant. Encana believes that the provision of this analogous information is relevant
to Encana's oil and gas activities, given its acreage position and operations (either ongoing or planned) in the areas in question, and such information has been updated as of the date hereof unless otherwise specified. Due to the early life
nature of the various emerging plays discussed in this presentation, PIIP is the most relevant specific assignable category of estimated resources. There is no certainty that any portion of the resources will be discovered. There is no
certainty that it will be commercially viable to produce any portion of the estimated PIIP, NGIP, COIP or EUR. Estimates of drilling locations and premium return well inventory include proved, probable, contingent and unbooked locations.
These estimates are prepared internally based on Encana's prospective acreage and are based on an assumption as to the number of wells that can be drilled per section based on industry practice and internal review. Approximately 40
percent of all locations specified in our core assets are booked as either reserves or resources, as prepared by internal qualified reserves evaluators using forecast prices and costs as of December 31, 2017. Unbooked locations do not
have attributed reserves or resources and have been identified by management as an estimation of Encana's multi-year drilling activities based on evaluation of applicable geologic, seismic, engineering, production and reserves
information. There is no certainty that Encana will drill all unbooked locations and if drilled there is no certainty that such locations will result in additional oil and gas reserves, resources or production. The locations on which Encana will
actually drill wells, including the number and timing thereof is ultimately dependent upon the availability of capital, regulatory and partner approvals, seasonal restrictions, equipment and personnel, oil and natural gas prices, costs, actual
drilling results, additional reservoir information that is obtained, production rate recovery, transportation constraints and other factors. While certain of the unbooked locations have been de-risked by drilling existing wells in relative close
proximity to such locations, many of other unbooked locations are farther away from existing wells where management has less information about the characteristics of the reservoir and therefore there is more uncertainty whether wells will
be drilled in such locations and if drilled there is more uncertainty that such wells will result in additional proved or probable reserves, resources or production.
30-day IP and other short-term rates are not necessarily indicative of long-term performance or of ultimate recovery. The conversion of natural gas volumes to barrels of oil equivalent (“BOE”) is on the basis of six thousand cubic feet to one
barrel. BOE is based on a generic energy equivalency conversion method primarily applicable at the burner tip and does not represent economic value equivalency at the wellhead. Readers are cautioned that BOE may be misleading,
particularly if used in isolation.
35
69
NON-GAAP MEASURESCertain measures in this presentation do not have any standardized meaning as prescribed by U.S. GAAP and, therefore, are considered non-GAAP measures. These measures may not be comparable
to similar measures presented by other companies. These measures have been provided for meaningful comparisons between current results and other periods and should not be viewed as a substitute
for measures reported under U.S. GAAP. For additional information regarding non-GAAP measures, including reconciliations, see the Company’s website and Encana’s most recent Annual Report as filed
on SEDAR and EDGAR. Non-GAAP measures include:
• Non-GAAP Cash Flow, Free Cash Flow and Non-GAAP Cash Flow Margin – Non-GAAP Cash Flow (or Cash Flow) is
defined as cash from (used in) operating activities excluding net change in other assets and liabilities, net change in non-
cash working capital and current tax on sale of assets. Free Cash Flow is Non-GAAP Cash Flow in excess of capital
expenditures, excluding net acquisitions and divestitures. Non-GAAP Cash Flow Margin is Non-GAAP Cash Flow per
BOE of production. Management believes these measures are useful to the company and its investors as a measure of
operating and financial performance across periods and against other companies in the industry, and are an indication of
the company’s ability to generate cash to finance capital programs, to service debt and to meet other financial
obligations. These measures may be used, along with other measures, in the calculation of certain performance targets
for the company’s management and employees.
• Forward looking Non-GAAP Cash Flow, Free Cash Flow and Cash Flow Margin:~$3 Billion Cumulative Free Cash Flow (2018 – 2022)• In total, 2018 through 2022 Cash From Operating Activities is expected to be $13.4B with $500M in net
change in non-cash working capital and net change in other assets and liabilities added back, resulting inestimated cumulative Non-GAAP Cash Flow of $13.9B. Cumulative capital expenditures for 2018 through2022 is expected to be $10.9B, resulting in cumulative Free Cash Flow of $3B.
• Net change in non-cash working capital is assumed to be zero for 2018 through 2022. Net change inother assets and liabilities is assumed to be about $100M per year for 2018 through 2022.
~$14.00/BOE Cash Flow Margin (2018)• 2018 Cash From Operating Activities is expected to be approximately $1.8B with approximately $100M
net change in non-cash working capital and net change in other assets and liabilities added back,resulting in an estimated Non-GAAP Cash Flow of $1.9B. This amount divided by the mid-point of the2018 production guidance of 370 MBOE/d equals the expected Cash Flow Margin of ~$14.00/BOE
~$500 million Free Cash Flow (2019)• 2019 Cash From Operating Activities is expected to be approximately $2.2B with approximately $100M
net change in non-cash working capital and net change in other assets and liabilities added back, resulting in an estimated Non-GAAP Cash Flow of about $2.3B. Capital expenditures are expected to be about 1.8 billion resulting in non-GAAP free cash flow of $500 million
• Net Debt, Adjusted EBITDA and Net Debt to Adjusted EBITDA – Net Debt is defined as long-term debt, including the
current portion, less cash and cash equivalents. Management uses this measure as a substitute for total long-term debt in
certain internal debt metrics as a measure of the company’s ability to service debt obligations and as an indicator of the
company’s overall financial strength. Adjusted EBITDA is defined as trailing 12-month net earnings (loss) before income
taxes, DD&A, impairments, accretion of asset retirement obligation, interest, unrealized gains/losses on risk
management, foreign exchange gains/losses, gains/losses on divestitures and other gains/losses. Net Debt to Adjusted
EBITDA is monitored by management as an indicator of the company’s overall financial strength and as a measure
considered comparable to peers in the industry.
• Corporate Costs – are defined as the summation of administrative expense and interest expense.
• Operating Margin/Operating Cash Flow/Operating Netback – Product revenues less costs associated with delivering
the product to market, including production, mineral and other taxes, transportation and processing and operating
expenses. When presented on a per BOE basis, Operating Margin/Operating Cash Flow/Operating Netback is defined as
indicated divided by average barrels of oil equivalent sales volumes. Operating Margin/Operating Cash Flow/Operating
Netback is used by management as an internal measure of the profitability of a play(s).
• Free Operating Cash Flow – Operating Cash Flow in excess of capital investment, excluding net acquisitions and
divestitures.
• Upstream Operating Cash Flow, excluding Risk Management – Upstream Operating Cash Flow, excluding Risk
Management is a measure that adjusts the Canadian and USA Operations revenues for production, mineral and other
taxes, transportation and processing expense, operating expense and the impacts of realized risk management activities.
Management monitors Upstream Operating Cash Flow, excluding Risk Management as it reflects operating performance
and measures the amount of cash generated from the company’s upstream operations.
• Return on Capital Employed (ROCE) – Adjusted Operating Earnings divided by Capital Employed. Adjusted Operating
Earnings is defined as Non-GAAP Operating Earnings (Loss) plus after-tax interest expense. Capital Employed is defined
as average debt plus average shareholders’ equity.
• Non-GAAP Operating Earnings (Loss) – is defined as Net Earnings (Loss) excluding non-recurring or non-cash items
that management believes reduces the comparability of the company’s financial performance between periods. These
items may include, but are not limited to, unrealized gains/losses on risk management, impairments, restructuring
charges, non-operating foreign exchange gains/losses, gains/losses on divestitures and gains on debt retirement. Income
taxes may include valuation allowances and the provision related to the pre-tax items listed, as well as income taxes
related to divestitures and U.S. tax reform, and adjustments to normalize the effect of income taxes calculated using the
estimated annual effective income tax rate.• Corporate Return – is defined as the After-Tax Rate of Return (ATROR) including the impact of non-well capital costs
and overhead costs, such as administrative and interest expenses.
• After-Tax Rate of Return (ATROR) – is defined as the discount rate at which the net present value of the after-tax cash
flows is equal to zero. Encana uses nine percent as the discount rate for its standard investment decisions, which is
intended to represent the Company’s long term cost of capital. For project evaluation, cost of capital includes land, drilling
and completion costs (D&C), seismic, facilities and gathering. D&C costs include all capital outlay for activities related to
drilling and completing the well in addition to permanent production equipment such as site compressors, separation
equipment and liquid storage tanks.
• Development Capital – Includes drilling, completion and facility costs, but excludes land and lease, seismic, appraisal
and capitalized internal costs. Capitalized internal costs include salaries, benefits and other costs directly identifiable with
acquisition, exploration and development activities.
• Debt to Adjusted Capitalization – Debt to Adjusted Capitalization is a proxy for Encana’s financial covenant under the
Company’s credit facilities which require debt to adjusted capitalization to be less than 60 percent. Adjusted Capitalization
includes debt, total shareholders’ equity and an equity adjustment for cumulative historical ceiling test impairments
recorded as at December 31, 2011 in conjunction with the Company’s January 1, 2012 adoption of U.S. GAAP.

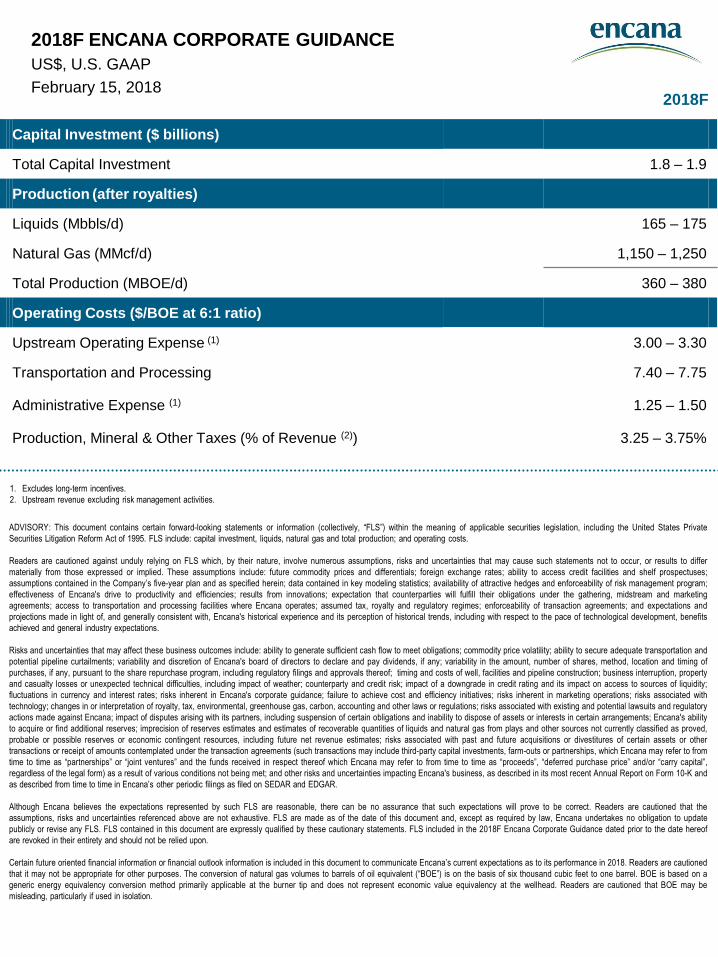
2018F ENCANA CORPORATE GUIDANCE
US$, U.S. GAAP
February 15, 20182018F
Capital Investment ($ billions)
Total Capital Investment 1.8 – 1.9
Production (after royalties)
Liquids (Mbbls/d) 165 – 175
Natural Gas (MMcf/d) 1,150 – 1,250
Total Production (MBOE/d) 360 – 380
Operating Costs ($/BOE at 6:1 ratio)
Upstream Operating Expense (1) 3.00 – 3.30
Transportation and Processing 7.40 – 7.75
Administrative Expense (1) 1.25 – 1.50
Production, Mineral & Other Taxes (% of Revenue (2)) 3.25 – 3.75%
1. Excludes long-term incentives.
2. Upstream revenue excluding risk management activities.
ADVISORY: This document contains certain forward-looking statements or information (collectively, “FLS”) within the meaning of applicable securities legislation, including the United States Private
Securities Litigation Reform Act of 1995. FLS include: capital investment, liquids, natural gas and total production; and operating costs.
Readers are cautioned against unduly relying on FLS which, by their nature, involve numerous assumptions, risks and uncertainties that may cause such statements not to occur, or results to differ
materially from those expressed or implied. These assumptions include: future commodity prices and differentials; foreign exchange rates; ability to access credit facilities and shelf prospectuses;
assumptions contained in the Company’s five-year plan and as specified herein; data contained in key modeling statistics; availability of attractive hedges and enforceability of risk management program;
effectiveness of Encana's drive to productivity and efficiencies; results from innovations; expectation that counterparties will fulfill their obligations under the gathering, midstream and marketing
agreements; access to transportation and processing facilities where Encana operates; assumed tax, royalty and regulatory regimes; enforceability of transaction agreements; and expectations and
projections made in light of, and generally consistent with, Encana's historical experience and its perception of historical trends, including with respect to the pace of technological development, benefits
achieved and general industry expectations.
Risks and uncertainties that may affect these business outcomes include: ability to generate sufficient cash flow to meet obligations; commodity price volatility; ability to secure adequate transportation and
potential pipeline curtailments; variability and discretion of Encana's board of directors to declare and pay dividends, if any; variability in the amount, number of shares, method, location and timing of
purchases, if any, pursuant to the share repurchase program, including regulatory filings and approvals thereof; timing and costs of well, facilities and pipeline construction; business interruption, property
and casualty losses or unexpected technical difficulties, including impact of weather; counterparty and credit risk; impact of a downgrade in credit rating and its impact on access to sources of liquidity;
fluctuations in currency and interest rates; risks inherent in Encana's corporate guidance; failure to achieve cost and efficiency initiatives; risks inherent in marketing operations; risks associated with
technology; changes in or interpretation of royalty, tax, environmental, greenhouse gas, carbon, accounting and other laws or regulations; risks associated with existing and potential lawsuits and regulatory
actions made against Encana; impact of disputes arising with its partners, including suspension of certain obligations and inability to dispose of assets or interests in certain arrangements; Encana's ability
to acquire or find additional reserves; imprecision of reserves estimates and estimates of recoverable quantities of liquids and natural gas from plays and other sources not currently classified as proved,
probable or possible reserves or economic contingent resources, including future net revenue estimates; risks associated with past and future acquisitions or divestitures of certain assets or other
transactions or receipt of amounts contemplated under the transaction agreements (such transactions may include third-party capital investments, farm-outs or partnerships, which Encana may refer to from
time to time as “partnerships” or “joint ventures” and the funds received in respect thereof which Encana may refer to from time to time as “proceeds”, “deferred purchase price” and/or “carry capital”,
regardless of the legal form) as a result of various conditions not being met; and other risks and uncertainties impacting Encana's business, as described in its most recent Annual Report on Form 10-K and
as described from time to time in Encana’s other periodic filings as filed on SEDAR and EDGAR.
Although Encana believes the expectations represented by such FLS are reasonable, there can be no assurance that such expectations will prove to be correct. Readers are cautioned that the
assumptions, risks and uncertainties referenced above are not exhaustive. FLS are made as of the date of this document and, except as required by law, Encana undertakes no obligation to update
publicly or revise any FLS. FLS contained in this document are expressly qualified by these cautionary statements. FLS included in the 2018F Encana Corporate Guidance dated prior to the date hereof
are revoked in their entirety and should not be relied upon.
Certain future oriented financial information or financial outlook information is included in this document to communicate Encana’s current expectations as to its performance in 2018. Readers are cautioned
that it may not be appropriate for other purposes. The conversion of natural gas volumes to barrels of oil equivalent (“BOE”) is on the basis of six thousand cubic feet to one barrel. BOE is based on a
generic energy equivalency conversion method primarily applicable at the burner tip and does not represent economic value equivalency at the wellhead. Readers are cautioned that BOE may be
misleading, particularly if used in isolation.


