118
End of Cycle report 2012

End of Cycle report2012
RosehillNew Barn LaneCheltenhamGL52 3LZ
t: +44 (0) 1242 222 444www.ucas.com

1
End of Cycle report 2012
PUBLISHED BY: UCAS ROSEHILL NEW BARN LANE CHELTENHAM GL52 3LZ
© UCAS 2012
ALL RIGHTS RESERVED.
UCAS IS A REGISTERED TRADE MARK.
UCAS REGISTERED IN ENGLAND NUMBER: 2839815
REGISTERED CHARITY NUMBER (ENGLAND AND WALES): 1024741
REGISTERED CHARITY NUMBER (SCOTLAND): SC038598
PUBLICATION REFERENCE: 12_348
FIND THIS REPORT ON WWW.UCAS.COM

2
End of Cycle report 2012
Dear Colleague,
2012 has been one of the most complex and challenging years for entry to higher education that the sector has ever known. In response to the new funding arrangements and number control policies in different countries within the UK, we have broadened and deepened our analysis to provide the clearest possible picture of the 2012 application cycle.
The analysis in this report builds on our 2012 application demand analysis ‘How have applications for full-time undergraduate higher education in the UK changed in 2012?’ (July 2012), completing the picture of this cycle with outcomes in terms of acceptances for higher education, entry rates, offer making, tuition fees, qualifications and differences by background and sex. We focus on the 18 year old cohort, which is both the largest group within our datasets and provides the clearest signal for understanding the changes in 2012.
The reference tables in Section 3 provide applicant and acceptance data covering all four countries of the UK, broken down by type of institution, type of course, and the nature of applicants in terms of age, sex, ethnic group and background.
Our report provides a timely assessment of the impacts of changes to higher education in 2012 across the UK. To support this, we are making the figures in the graphs available as data files for others to use in their own research.
As ever, we welcome any feedback which will enable our analysis to continue to reflect the needs of the sector.
Please contact [email protected] if you have any queries or suggestions.
Mary Curnock Cook Chief Executive
Section 1 Key findings
Section 2 Analytical overview of the 2012 cycle
Section 3 Reference tables
Section 4 Glossary

3
End of Cycle report 2012
Section 1Key findings

4
End of Cycle report 2012

5
End of Cycle report 2012
Key findings
Fewer applicants in 2012, a small increase in the acceptance rate, a large fall in acceptances Applicant demand for higher education was weaker in 2012, both in terms of applications and acceptances. The acceptance rate increased slightly, but only by a fifth of what was needed to offset the fall in applications, and remained substantially below levels of a few cycles ago. The resulting 27,000 (6 per cent) fall in acceptances was the largest recorded. In addition recent changes in deferral patterns increased the impact experienced by institutions on recruitment for entry in 2012, to a 54,000 (11 per cent) fall.
Recruitment into the 2012-13 academic year decreased substantially in England and Wales The majority of this weakness in demand is associated with applicant to institution flows where tuition fees increased in 2012. There were 51,000 (-13 per cent) fewer acceptances into English institutions in the 2012-13 academic year than in the previous year, and similar proportional falls to institutions in Wales; in both cases mainly resulting from the decrease in acceptances from England.
Fewer offers were made to UK and EU applicants in 2012 and they were concentrated on applicants
with many offers Institutions made fewer offers to UK and EU applicants in 2012. Most applicants make five choices in 2012; fewer offers were made to these applicants, and the offers made were more concentrated on applicants who received many offers (and are less likely to accept a particular offer). This greater concentration may result from a change in institutional offer-making or the relative strength of applicants applying to courses. There were substantial reductions in the number of conditional firm offers held by applicants with five choices in the middle of the cycle. These reductions were reflected in similar reductions at the end of the cycle at a level consistent with the reduced level and pattern of offer-making.
Entry rates for disadvantaged 18 year olds increased in 2012 across the UK The proportion of the population of 18 year olds in disadvantaged areas who were accepted for entry into higher education (‘entry rate’) increased in 2012 in all countries of the UK, reaching new highs in England, Wales and Northern Ireland. This continues a trend of relatively strong proportional increases, that has seen disadvantaged 18 year olds being 40 to 60 per cent more likely to enter higher education in 2012 than they were in 2004. Entry rates for 18 year olds in advantaged areas remain three to four times higher than for those in disadvantaged areas, but do not show a strong growth trend, with levels in 2012 proportionally similar to those throughout the period. In 2012, the entry rate for pupils from English state schools who received free school meals increased to a new high for the period. The entry rate for those who do not receive free school meals decreased. Both rates are close to levels suggested by extrapolations of their trend over recent cycles.
English 18 year old entry rates in 2012 were close to the 2006 to 2010 trend for all backgrounds In 2012, the entry rates of English 18 year olds by background showed a progression both in level (higher for more advantaged) and change (increases for disadvantaged and decreases for advantaged). However, for backgrounds where rates decreased in 2012, there was an above-trend increase in 2011 of similar magnitude related to changes in acceptance and deferred entry rates. The result of these changes is that the entry rate for all backgrounds in 2012 was close to the trend established across the 2006 to 2010 cycles. Cohort measures that cover entry at ages 18 and 19 smooth out the effect of changes in acceptance rates and deferred entry rates; they show that there has been a steady increase in the cohort entry rates for young people of all backgrounds, with the largest increases for the most disadvantaged. For the cohort aged 18 in 2011 (and 19 in 2012) the entry rate increased for those in the more disadvantaged areas and was similar to the previous cohort in other areas.

6
End of Cycle report 2012
In 2012, disadvantaged 18 year olds in England were 10 per cent more likely to enter ‘higher tariff
institutions’ The entry rate of disadvantaged 18 year olds into ‘higher tariff institutions’ has increased in all four countries of the UK; and in England in 2012, a higher proportion of the 18 year old population in disadvantaged areas entered higher tariff institutions than in any other cycle. Within England, the entry rate to higher tariff institutions increased for 18 year olds of all backgrounds, between 10 and 12 per cent proportionally for those from more disadvantaged backgrounds and 6 to 8 per cent for those from more advantaged backgrounds. For all groups this is the largest increase over the period.
Acceptances from Wales increased in 2012, driven by more studying in England The number of acceptances from Wales increased, as did the entry rate of Welsh 18 year olds driven by an 18 per cent increase in the entry rate to English institutions
Acceptances to Scottish institutions increased in 2012, the Scottish entry rate increased, and
acceptance rates of English applicants to Scottish institutions increased Acceptances to institutions in Scotland increased, as did entry rates for Scottish 18 year olds. English applicants to Scottish institutions fell, but acceptances increased as English applicants became 30 per cent more likely to be accepted to a Scottish institution in 2012 than they were in 2011. In 2012, 70 per cent of acceptances at Scottish institutions were from Scotland and 10 per cent were from England.
Acceptances to Northern Ireland institutions increased in 2012 as fewer of their 18 year olds study
elsewhere Acceptances to institutions in Northern Ireland increased as more of their 18 year olds entered those institutions. But entry rates to English institutions decreased by 16 per cent proportionally so that, overall, 18 year olds in Northern Ireland had a lower entry rate than in 2011.
Entry rate for English 18 year olds fell in 2012 but remains higher than all other cycles, save 2011 The proportion of the 18 year old population in England accepted for entry into higher education has been increasing since 2006, but decreased in the 2012 cycle. However, although there was not any above-trend increase in the application rate in 2011 – that would be expected if young people were choosing to apply at age 18 instead of 19 - there was a higher acceptance rate in that cycle. In addition, a greater proportion of those acceptances were for starting courses immediately, that is to the 2011-12 academic year at age 18 rather than deferring to start in the following year. Together these effects gave a substantially above-trend proportion of the 18 year old population who were accepted and started courses in 2011. The entry rate for 18 year olds in 2012 is lower than 2011, but at a level consistent with an extrapolation of the entry rate trend between 2006 and 2010.
English young cohort entry rates increased in 2012 for those aged 18 in 2011 and 19 in 2012, but by less
than over previous cohorts Cohort-based measures report the proportion of a young cohort (those born in the same academic year) who enter higher education by age 19. These measures are therefore unaffected by factors which can alter the balance of entry at aged 18 against entry at aged 19. They show that the entry rate of the English cohort who were age 18 in 2011 (and 19 in 2012 when they would be covered by the new fee arrangements) has increased, but by less than has been typical for recent cohorts. This type of measure for the first cohort to come under the new arrangements age 18 cannot be calculated until the 19 year old acceptances from the 2013 cycle are known. The trends for 18 year old entry rates are the best measure for assessing changes associated with 2012 at this point but it is possible for them to diverge from the cohort measures.
7
End of Cycle report 2012
More 18 year olds entered through preferred choice routes in 2012 and more entered higher tariff
institutions More 18 year olds were accepted in 2012 through routes associated with their preferred choice (their firm choice, or where they choose to adjust to another institution). Fewer 18 year olds were accepted through alternative routes such as the insurance choice or the Clearing process (but for applicants overall, acceptances through the Clearing process reached a new high). The entry rate of English 18 year olds to higher tariff institutions increased markedly in 2012 to reach its highest recorded level.
Young women were a third more likely to enter in 2012 than men, the majority of the fall in entry rate in
2012 was amongst men Amongst UK 18 year olds, women were a third more likely to enter higher education in 2012 than men. In 2012, the entry rate fell for both men and women but the decrease for men was four times greater than for women. Men are more likely to be accepted than women, though the difference reduced in 2012. Women remain more likely to enter higher education than men are to apply.
Average tuition fee of acceptances at English institutions in 2012 was £8,389, half of acceptances were
to £9,000 courses The average tuition fee (before any fee waivers) of UK and EU acceptances at English institutions was £8,389. Average tuition fees for acceptances from England (£8,378) were lower than those from elsewhere in the UK (£8,500-£8,600). The distribution of acceptances by tuition fee was weighted towards higher fee courses with half of acceptances to courses at or very near to £9,000. The average tuition fee of acceptances to higher tariff institutions was £8,981 compared to £7,919 at lower tariff institutions. Acceptances to degree courses were at an average fee of £8,541, higher than those to foundation degrees (£6,660) and HNDs (£6,047).
Pattern of acceptances to courses by 2012 tuition fee not substantially different from acceptances to
courses in earlier cycles; for 18 year olds, from both advantaged and disadvantaged backgrounds, a
small move to courses with higher fees in 2012 The pattern of acceptances from England to English institutions in 2012 did not show a major movement towards or away from courses with higher fees. The average 2012 tuition fee of English 18 year old acceptances was higher in 2012 than the equivalent (from matching the 2012 fee pattern to courses in earlier years) in 2011, but the change is small and typical of the pattern of acceptances a couple of cycles previously. The average 2012 tuition fee of older acceptances was lower in 2012 than the equivalent in 2011, but only to the extent that it is the continuation of an existing trend. For English 18 year olds, acceptances from advantaged backgrounds were, on average, to courses with higher fees in 2012 than those from disadvantaged backgrounds, but this was also the case before the 2012 fee changes. The small increase in average tuition fees in 2012 compared to equivalent values in 2011 (from matching the 2012 fee pattern to courses in earlier years) is common across 18 year olds from advantaged and disadvantaged backgrounds.

8
End of Cycle report 2012
18 year olds most likely to enter holding A levels but acceptances of those holding BTECs continued to
increase in 2012 A levels are the predominant qualification held by those accepted to higher education, especially amongst 18 year olds, but the proportion of the population entering holding A levels fell in 2012. The proportion of the UK 18 year old population entering holding BTECs increased in 2012 and has increased by 80 per cent since 2008. A greater proportion of the population enter holding A levels in advantaged areas compared to disadvantaged areas, whereas the proportion of the population entering holding BTECs is relatively undifferentiated across areas. Entry rates to higher tariff institutions holding A levels are much higher than entry rates to those institutions holding BTECs.
Acceptance rates are associated with qualifications achieved but decreased for higher grades in 2012 The type and grade of qualifications held are associated with acceptance rates. Acceptance rates for those with higher grades decreased in the 2012 cycle, but were similar to levels prior to 2011. Acceptance rates for those with lower grades increased in 2012 but remain below levels seen a few cycles ago. For those holding BTECs, acceptance rates are lower than for those holding A levels, both overall and within higher and lower grade subsets.
Patterns of predicted grades and deferred entry do not show changes that are specific to 2012 The proportion of English 18 year old applicants predicted higher grade profiles increased in 2012 by more than has been typical over recent cycles. However, as a share of the English 18 year old population the increase is similar or lower than it has been in recent cycles. This could reflect a continuation of attainment trends rather than a change in prediction behaviour specific in 2012. The proportion of applicants achieving higher grades decreased for prediction profiles either side of the higher grade boundary and this continues a trend seen in the previous cycle. The proportion of acceptances for deferred entry into the 2013-14 academic year showed no material divergence in behaviour by achieved grade profile.
Unplaced rate fell in 2012, composition of unplaced applicants similar to previous cycles The proportion of applicants who were unplaced continued to fall in the 2012 cycle although it was still larger than was typical a few cycles ago. UK 18 year old applicants share this pattern and amongst this group around 15 to 20 per cent of unplaced applicants actively withdraw from the application process. The proportion of unplaced applicants who withdrew increased slightly in 2012 but remains at a level typical of the 2004 to 2011 period. Withdrawn applicants are on average more highly qualified than other unplaced applicants. This position did not change materially in the 2012 cycle. A sample of both unplaced and placed applicants have become more likely to cite academic reputation as a reason for declining offers, continuing a trend from the 2011 cycle.

9
End of Cycle report 2012
Section 2Analytical overview of the 2012 cycle

10
End of Cycle report 2012
Analytical overview of 2012
13 Introduction
14 How to read this report
15 Applicants
Fewer UK and EU applicants than in recent cycles
16 Acceptances
UK and EU domiciled acceptances fell by 27,000 in the 2012 cycle Acceptances from outside the EU steady in 2012 Substantial decrease in acceptances from England, increase in acceptances from Wales Acceptances through Clearing highest recorded, acceptances through insurance down by a quarter UK 18 year olds - more firm and Adjustment accepts, fewer insurance and Clearing accepts Acceptances at institutions in England and Wales fall to lowest level since 2008 cycle Large falls in UK and EU recruitment to the 2012-13 academic year at English and Welsh institutions
23 Acceptance rates
Acceptance rates continue to increase from 2010 low but remain well below earlier cycles Acceptance rates increased for applicants from the UK, decreased for non-EU, constant for EU Acceptance rates higher for 18 year olds than older applicants
26 Entry rates for 18 and 19 year olds from the UK
Entry rates for 18 year olds decreased in England, increased in Wales and Scotland, and remained steady in Northern Ireland Entry rates for English 19 year olds fell substantially in 2012, Scottish and Welsh entry rates increased 40 per cent of English 18 year olds in 2011 entered by age 19, more than the previous cohort but a smaller increase than seen previously
30 Application, acceptance and entry rates for English 18 year olds
No indication of above-trend application rates for English 18 year olds in 2011 Application rates for English 18 year olds fell in 2012 Increase in acceptance rate in 2011 altered the relationship between application and entry rates Deferred acceptances fell by two thirds in 2011 cycle, altering entry rate by academic year Entry rates and population changes drive recruitment into 2012-13 academic year
35 Applicant and institutional cycle trajectories
Fewer applicants, but progress and timing of cycle similar from the applicant perspective Institutions held fewer firm offers from UK and EU applicants ahead of A level results

11
End of Cycle report 2012
37 Offer making to UK and EU applicants in 2012
Fewer applicants receive offers, but more receive five offers Acceptance rates of applicants vary by number of offers received, acceptance rates low for those with no offers by June Institutions made fewer offers in 2012 and they were more concentrated on applicants with five offers Conversion of an offer to an acceptance is much lower where applicants have many offers Changes in offer patterns consistent with changes in acceptances
42 Scotland in 2012
Acceptance rates of English and Scottish applicants to Scottish institutions increased in 2012 Scottish applicants continue to form large majority of acceptances to Scottish institutions
44 Northern Ireland in 2012
In Northern Ireland entry rates of 18 year olds to home institutions increased and declined elsewhere
45 Wales in 2012
Fall in acceptances at Welsh institutions driven by 17 per cent decrease in English acceptances Entry rate of 18 year olds in Wales to English institutions increased in 2012
48 England in 2012
Average tuition fee for UK and EU acceptances to English institutions in 2012 was £8,389 Half of acceptances were to courses with a tuition fee of £9,000 No substantial change in the pattern of English acceptances by 2012 tuition fee Average tuition fee for English 18 year olds increased in 2012 Changes in average tuition fee in 2012 were similar for acceptances from different backgrounds
52 Qualifications held by applicants
23 per cent of the 18 year old population in UK the accepted holding A levels in 2012, less than in 2011 Five per cent of the 18 year old population accepted holding BTECs, up by 81 per cent on 2008 A levels relatively more widely held amongst acceptances at higher tariff institutions Entry rate holding A levels for older age groups fell in 2012, BTECs remained steady Entry rate for those holding A levels highly differentiated by background Entry rate holding BTECs little different by background and increasing Acceptance rates increased for the three main qualification types held by UK 18 year olds
58 Qualification related outcomes for English applicants
Acceptance rates for ‘AAB+’ English 18 year olds fell in 2012 Acceptance rates for ‘not AAB+’ English 18 year olds were lower than ‘AAB+’ but increased in 2012 English 18 year old entry rate holding ‘AAB+’, fell in 2012 No pattern in divergence in acceptance rates either side of the ‘AAB+’ group Deferred entry rate trends are relatively undifferentiated across qualification groups Proportion of English 18 year old applicants predicted ‘AAB’ increased in 2012 Proportion of English 18 year old population applying in 2012 with predicted higher grades was lower or consistent with recent cycles Attainment relative to predicted grades continued to weaken in 2012

12
End of Cycle report 2012
66 Acceptance and entry rates by background
Acceptance rates increased for disadvantaged 18 year old applicants in 2012 Increase in acceptance rate for disadvantaged driven by those not holding ‘AAB+’ qualifications Entry rates for disadvantaged 18 year olds increased across the UK in 2012 Entry rates for advantaged 18 year olds at similar levels to recent cycles English 18 year olds - entry rates in 2012 consistent with 2006 to 2010 for all groups English 18 year olds - effect of deferred entry changes in 2011 greatest for advantaged groups Cohort young entry rates for those aged 18 in 2011 increased for disadvantaged and were unchanged for advantaged Entry rates to higher tariff institutions for disadvantaged 18 year olds at highs in 2012 Entry rates to higher tariff institution for advantaged areas increased in England and Wales English 18 year olds - entry rates to higher tariff institutions increased markedly in 2012 for all backgrounds Receiving free school meals as a proxy for income background those from state schools in England Acceptance rates for those receiving free school meals increased in 2012 Entry rates increased in 2012 for free school meals population, decreased for others, both rates consistent with recent trends
79 Application, acceptance and entry rates by sex
18 year old women were a third more likely to enter higher education than men in 2012 Entry rates to higher tariff institutions were greater for women than men, both increased in 2012
82 Unplaced applicants
Unplaced rate for UK 18 year olds continues to decrease in 2012 Withdrawn unplaced applicants more highly qualified than other unplaced applicants Proportion of applicants declining offers citing academic reputation continued to increase

13
End of Cycle report 2012
Introduction
The 2012 UCAS application cycle received its first applications in September 2011 and continued until all the data on all application outcomes was finalised in November 2012. The large majority of applications for, and entrants to, full-time undergraduate higher education in the UK are serviced by UCAS and the analysis of the UCAS application cycle gives a correspondingly comprehensive picture of demand for higher education from applicants, how institutions respond to this demand, and the resulting patterns of outcomes in terms of who starts higher education, where that is provided, and the nature of the course undertaken.
Initial demand for higher education, in terms of whether people apply for entry to higher education and the nature of the courses they apply to, can be assessed after the application deadlines early in the cycle. For the 2012 cycle this analysis was reported in UCAS’ report ‘How have applications for full-time undergraduate higher education in the UK changed in 2012?1. These results are not materially altered by the additional applications received since the application deadlines and the analysis of initial demand is therefore not repeated in this report. Instead this End of Cycle report completes the analysis of the 2012 application cycle with an overview of the outcomes, in particular the numbers and nature of those accepted into higher education, and those aspects of the application process, especially the acceptance rate and the qualifications held, that link the pattern of initial demand to these outcomes.
The interpretation of these outcomes can be more complex than that of the analysis of initial demand. Applications can be regarded as a largely unconstrained and independent measure of demand for higher education from applicants. Statistics relating to cycle outcomes, such as the proportion of applicants accepted (the ‘acceptance rate’) and the numbers of acceptances, or the proportion they form of the population, are a product of both what applicants want and what institutions want, together with any parameters relating to the number or type of acceptances that may be set by Government. So it is often more difficult to attribute to a single factor the changes measured in this report, for example distinguishing between changes in applicant or institutional behaviour.
There are three main statistical perspectives in this End of Cycle report, each addressing different sets of questions about outcomes. The first is the statistics for people who have applied (‘applicants’) and for those placed in higher education (‘acceptances’) that describe the overall activities and progress of the 2012 application cycle itself. The second perspective covers the outcomes of the cycle in terms of people entering higher education, with the key statistic being what proportion of the population have been placed in higher education (the ‘entry rate’). Finally, for higher education providers the most important statistics relate to the numbers recruited into a particular academic year. Since the UCAS process can accommodate both ‘immediate’ acceptances (for example those acceptances from the 2012 cycle starting in the 2012-13 academic year); and ‘deferred’ acceptances (for example those from the 2012 cycle starting in the 2013-14 academic year), some of the key statistics for recruitment are reported on the basis of the academic ‘entry year’ rather than the UCAS ‘cycle’ when the acceptance took place.
There have been a number of significant changes to higher education in 2012 including changes to tuition fees, student support arrangements and Government controls on recruitment. These changes have affected different groups of applicants and institutions in different ways and to different degrees. The analysis groups used in this report reflect this. The interpretation of the effect of these changes is often much clearer for 18 year olds than for other age groups because uniquely, this group has not been able to apply to higher education in previous cycles to any material extent. Therefore in this first year of these changes the analysis concentrates on this age group where changes are clearer to interpret. Measures that can give a fuller assessment across a wider age range are introduced but can only become of full value in assessing the 2012 changes with data from subsequent cycles.1 http://www.ucas.com/documents/ucas_how_have_applications_changed_in_2012.pdf

14
End of Cycle report 2012
How to read this report
This End of Cycle report is divided into three sections. The first section summarises the key findings. The second provides an analysis of selected aspects of the 2012 cycle. The third is a series of reference tables.
The second section begins with an overview of the key applicant, acceptance and acceptance rate statistics, covering different applicant domiciles, institution countries and acceptance routes. The outcomes for the population are described through entry rates and, for England, how changes in acceptance rates and deferred entry affect them. The overall trajectory of applicant and offer numbers through the cycle are described, together with an analysis of the pattern of offer making in 2012 and how it relates to the cycle outcomes.
Outcomes that relate to changes to higher education that are specific to the different countries of the UK are investigated country by country, including an analysis of the outcomes of the higher and more variable tuition fee arrangements at English institutions.
Qualifications held by applicants are central in understanding entry to higher education. By drawing upon multiple sources of information about the qualifications held by (and predicted for) applicants, a full picture of the qualifications held by applicants and how they relate to outcomes is reported for the first time. Specific attention is given to outcomes for applicants holding qualifications that fall into different student number control categories under the new qualifications-related student number control arrangements for institutions in England.
Changes in the outcomes for people from advantaged and disadvantaged backgrounds are analysed through acceptance and entry rates by area-based and individual-based measures of background. A similar analysis is reported by sex. Applicants who are left unplaced at the end of the cycle are compared against previous cycles in terms of whether they withdrew from the process, their qualification level and the reasons given for declining offers.
The reference table section provides the core figures behind the cycle, including outcomes by type of institution, and includes comparable figures for seven cycles (2006 to 2012) where this is possible.
A glossary of key terms concludes this report.

15
End of Cycle report 2012
Applicants
Fewer UK and EU applicants than in recent cycles
There were 653,600 applicants to the 2012 cycle. This was 46,500 fewer than in the 2011 cycle, a reduction of 6.6 per cent, and lower than the total in the 2010 cycle. This fall follows increases of around 50,000 per cycle between 2007 and 2010.
The large majority of applicants are domiciled in the UK (544,800, 83 per cent of all applicants in the 2012 cycle). There was a fall of 44,600 (-7.6 per cent) UK domiciled applicants in the 2012 cycle. The last fall in UK domiciled applicants was in the 2006 cycle (12,400, -2.8 per cent). Applicants from the EU also fell in 2012 by 6,100 (-12.4 per cent), the first reduction recorded in this period. Applicants from countries outside of the EU increased in 2012 by 4,200 (+6.8 per cent), more than reversing the fall they showed in the 2011 cycle (Figure 1).
Figure 1 Applicants by domicile
UK
appl
ican
ts
0
100,000
200,000
300,000
400,000
500,000
600,000
700,000
2004
2005
2006
2007
2008
2009
2010
2011
2012
Non
−UK
appl
ican
ts
0
20,000
40,000
60,000
80,000
100,000
120,000
140,000UK
Non−EUOther EU

16
End of Cycle report 2012
Acceptances
There were 464,900 acceptances from the 2012 cycle, 27,100 (-5.5 per cent) fewer than in the 2011 cycle.
UK and EU domiciled acceptances fell by 27,000 in the 2012 cycle
Most acceptances are from the UK, typically between 87 to 89 per cent of the total. In 2012, there were 407,400 UK acceptances from the UK, 23,800 (-5.5 per cent) fewer than in 2011 and the lowest total since 2008.
EU domiciled acceptances form around 4 to 5 per cent of acceptances and have increased each cycle from 15,500 in 2004 to 26,700 in 2011. In 2012, the number of EU domiciled acceptances fell by 3,500 (-13.0 per cent) to 23,200, the lowest total since the 2008 cycle.
Acceptances from outside the EU remained steady in 2012
Around 7 per cent of acceptances are from applicants outside the EU. Their numbers increased between 2007 and 2010 before falling by 3,000 (-8.1 per cent) in 2011. In 2012, there were 34,300 acceptances from outside the EU, a small increase (+200, +0.6 per cent) over the 2011 total and higher than previous cycles except 2010 (Figure 2).
Figure 2 Acceptances by domicile group
UK
acce
ptan
ces
0
100,000
200,000
300,000
400,000
500,000
2004
2005
2006
2007
2008
2009
2010
2011
2012
Non
−UK
acce
ptan
ces
0
20,000
40,000
60,000
80,000
100,000UK
Non−EUOther EU

17
End of Cycle report 2012
Substantial decrease in acceptances from England, increase in acceptances from Wales
Figure 3 shows acceptances by country of domicile within the UK, acceptances from England are shown against their own (left hand side) axis as numbers for this group are higher than those from other countries.
Acceptances from England increased from 277,100 to 368,300 between the 2004 and 2011 cycles, accounting for almost all the increase in UK domiciled acceptances over that period. English domiciled acceptances in the 2012 cycle decreased by 24,400 (-6.6 per cent) to 343,900, a similar level to the 2008 cycle.
Acceptances from Wales were 19,300 in the 2012 cycle, an increase of 1,000 (+5.3 per cent) and the second highest (to the 2009 cycle) level recorded. Acceptances from Northern Ireland fell by 500 (-3.7 per cent) to 13,300. Acceptances from Scotland were 30,900, similar to the 2011 cycle.
Figure 3 Acceptances by UK country of domicile
Engl
and
acce
ptan
ces
0
100,000
200,000
300,000
400,000
2004
2005
2006
2007
2008
2009
2010
2011
2012
Oth
er U
K ac
cept
ance
s
0
20,000
40,000
60,000
80,000England
Northern IrelandScotlandWales

18
End of Cycle report 2012
Acceptances through Clearing highest recorded, acceptances through insurance down by a quarter
There are a number of routes to becoming accepted in the application cycle. Figure 4 shows the number of acceptances by acceptance route using a logarithmic scale so that the proportional changes can be seen clearly across the large differences in the numbers accepted through the different routes. Most acceptances are from the applicant making a ‘firm’ choice of an offer and then satisfying any conditions attached to that offer. In 2012, this acceptance route continued to dominate but the numbers accepted by this route fell by 19,500 (-5.4 per cent) to 341,300. Acceptances through an ‘insurance’ choice (for applicants who do not satisfy their ‘firm’ offer) fell substantially by 10,400 (-25.7 per cent) to 30,000.
Acceptances through the ‘Clearing’ process increased by 4,600 (+8.9 per cent) to 55,700, the highest number of acceptances recorded through this route to date. The ‘Adjustment’ route (where applicants can ‘adjust’ to a place at another institution if they exceed the conditions of their offer) was used by 1,300 acceptances, more than double the number in the previous cycle but still a relatively small share of acceptances.
Figure 4 Acceptances by acceptance route (logarithmic scale)
Acce
ptan
ces
100
500
1,000
5,000 10,000
50,000 100,000
500,000
2004
2005
2006
2007
2008
2009
2010
2011
2012
AdjustmentFirm choiceInsurance choiceExtraClearingOther

19
End of Cycle report 2012
UK 18 year olds - more firm and Adjustment accepts, insurance and Clearing accepts
The profile of acceptance routes varies across age and domicile groups. Figure 5 shows the trends in the number of UK 18 year olds entering higher education by acceptance route. There were 212,900 acceptances for this group in the 2012 cycle, 5,500 (-2.5 per cent) fewer than in the 2011 cycle. Acceptances through the firm choice route dominate (164,600, 77 per cent of all acceptances) and increased in 2012 (+2,300, +1.4 per cent) despite the overall fall in acceptances. The number accepted through Clearing fell (-600, -2.4 per cent) for the first time since 2006. There were substantial falls in acceptances through the insurance choice (-7,700, -28 per cent) and large proportional increases in Adjustment use (+600, +150 per cent) although the number accepted through this route (1,000) remains relatively small.
Figure 5 UK domiciled 18 year old acceptances by acceptance route (logarithmic scale)
Acce
ptan
ces
100
500
1,000
5,000 10,000
50,000 100,000
500,000
2004
2005
2006
2007
2008
2009
2010
2011
2012
AdjustmentFirm choiceInsurance choiceExtraClearingOther

20
End of Cycle report 2012
Acceptances at institutions in England and Wales fell to lowest level since 2008 cycle
Figure 6 shows the number of acceptances by country of institution; since acceptances to English institutions are much larger than to any other country they are shown on a separate axis (left hand side). Most of the increase in acceptances over the period has been to English institutions. In the 2011 cycle, acceptances at these institutions were around a third higher than they were in the 2004 cycle. In 2012, acceptances at English institutions fell by 26,300 (-6.3 per cent) to 388,800, the lowest since the 2008 cycle, but remain around one quarter higher than in the 2004 cycle.
Institutions in Wales had 24,100 acceptances in 2012, a fall of 2,100 (-8.1 per cent) from 2011 and the lowest since the 2008 cycle. Acceptances at institutions in Northern Ireland (10,000; +500; +5.2 per cent) and Scotland (42,000; +800, +1.9 per cent) increased in 2012.
Figure 6 Acceptances by country of institution
Engl
and
acce
ptan
ces
0
70,000
140,000
210,000
280,000
350,000
420,000
2004
2005
2006
2007
2008
2009
2010
2011
2012
Oth
er U
K ac
cept
ance
s
0
20,000
40,000
60,000
80,000
100,000
120,000England
Northern IrelandScotlandWales

21
End of Cycle report 2012
Large falls in UK and EU recruitment to the 2012-13 academic year at English and Welsh institutions
UK and EU acceptances by the academic year of entry, as opposed to the acceptances by UCAS cycle, are important to the funding and number control arrangements for institutions. Figure 7 shows the number of UK and EU domiciled acceptances for academic year of entry by country of institution (with, for example 2012-13 being shown as 2012). There was a large reduction in deferred acceptances in the 2011 cycle, and a return to more typical levels of deferred acceptances in the 2012 cycle. These changes act to deepen the fall in acceptances into the 2012-13 academic year compared to the equivalent cycle comparison. The effects of the changing patterns of deferrals is especially evident for institutions in England and Wales where the 2011-12 academic year total is higher than the 2011 cycle total; and the 2012-13 academic year total is lower than the 2012 cycle total. Compared to 2011-12, acceptances into the 2012-13 academic year fell by 51,200 (-13 per cent) in England and 3,000 (-12 per cent) in Wales. Relative to the 2010-11 academic year, the 2012-13 acceptances were 8 per cent lower for England and 7 per cent lower for Wales.
Another way of grouping institutions is by the average levels of attainment (summarised through UCAS tariff points) of their accepted applicants. Figure 7b shows the number of UK and EU domiciled acceptances by academic year of entry for institution tariff groups. Compared to 2011-12, acceptances into the 2012-13 academic year fell by 7,300 (-7 per cent) at higher tariff institutions; by 15,500 (-11 per cent) at medium tariff institutions and 30,500 (-14 per cent) at lower tariff institutions.

22
End of Cycle report 2012
Engl
and
acce
ptan
ces
0
70,000
140,000
210,000
280,000
350,000
420,000
2004
2005
2006
2007
2008
2009
2010
2011
2012
Oth
er U
K ac
cept
ance
s
0
20,000
40,000
60,000
80,000
100,000
120,000England
Northern IrelandScotlandWales
Figure 7a UK and EU domiciled acceptances for academic year of entry (2012-13 shown as 2012) by country of institution
Figure 7b UK and EU domiciled acceptances for academic year of entry by institution tariff group
Acce
ptan
ces
0
50,000
100,000
150,000
200,000
250,000
2004
2005
2006
2007
2008
2009
2010
2011
2012
Higher tariffMedium tariffLower tariff

23
End of Cycle report 2012
Acceptance rates
The proportion of applicants who have a place at the end of the cycle is termed the acceptance rate. At the national level it reflects the relationship between total applicants and total acceptances, and since the number of acceptances is often subject to number control or physical constraints, it can be broadly interpreted as the ‘difficulty’ of gaining admission to higher education in a particular year. However, becoming accepted requires both that the applicant is made an offer by an institution, and that the applicant accepts the institution’s offer. So changes in the acceptance rate can also reflect differences in applicant choices, or preferences to enter higher education, especially for courses where physical or number control capacity limits have not been met.
Acceptance rates continue to increase from 2010 low but remain well below earlier cycles
Figure 8 shows how the acceptance rate links applicant and acceptance numbers. Overall, the acceptance rate increased in 2012 by less than one percentage point from 70.3 per cent in 2011 to 71.1 per cent in 2012.
However, this increase was not enough to offset the overall fall in applicants so the number of acceptances also fell. The acceptance rate would need to have risen by around 5 percentage points to 75 per cent for acceptance numbers to remain at 2011 levels. Acceptance rates remain around 6 percentage points less than the level seen between the 2006 and 2008 cycles.
Figure 8 Applicants, acceptances and the acceptance rate
Num
ber o
f app
lican
ts/a
ccep
tanc
es
0
200,000
400,000
600,000
800,000
2004
2005
2006
2007
2008
2009
2010
2011
2012
Perc
enta
ge o
f app
lican
ts
65%
70%
75%
80%
85%AcceptancesApplicants
Acceptance rate

24
End of Cycle report 2012
Acceptance rates increased for applicants from the UK, decreased for non-EU, constant for EU
A higher proportion of UK domiciled applicants are accepted than applicants from outside the UK. The acceptance rate for UK domiciled applicants increased from 73.2 per cent in the 2011 cycle to 74.8 per cent in the 2012 cycle so that UK domiciled applicants in 2012 were 2 per cent more likely to be accepted than in the previous cycle. Acceptance rates for this group remain below the 80 to 81 per cent values typical between 2004 and 2008.
The acceptance rate for applicants from outside the EU fell from 55.4 per cent in 2011 to 52.2 per cent in 2012. This follows a similar fall in 2011 and means that non-EU applicants were over 10 per cent less likely to be placed than was typical across the 2004 to 2010 cycles. The acceptance rate for EU applicants in 2012 was 53.8 per cent, similar to recent cycles but below the 60 per cent level that was typical several cycles ago (Figure 9).
Figure 9 Acceptance rates by applicant domicile group
Acce
ptan
ce ra
te
50%
60%
70%
80%
90%
2004
2005
2006
2007
2008
2009
2010
2011
2012
UKOther EUNon−EU

25
End of Cycle report 2012
Acceptance rates higher for 18 year olds than older applicants
Acceptance rates vary by age and country of domicile. Figure 10 shows the trend in acceptance rates for 18 year old applicants by UK country of domicile. Acceptance rates were higher for 18 year olds than for applicants as a whole and, within this group, higher for applicants from England and Wales compared to Scotland and Northern Ireland. The acceptance rates for Scottish and Welsh domiciled applicants, which had been declining since 2009, increased in the 2012 cycle by 1.4 and 3.5 percentage points respectively. In 2012, acceptance rates for 18 year old applicants from England and Northern Ireland were similar to those in 2011 and remain below values typical before 2010.
Figure 10 Acceptance rates for 18 year olds by UK country of domicile
Acce
ptan
ce ra
te
65%
70%
75%
80%
85%
90%
95%
2004
2005
2006
2007
2008
2009
2010
2011
2012
EnglandNorthern IrelandScotlandWales

26
End of Cycle report 2012
Entry rates for 18 and 19 year olds from the UK
Entry rates for 18 year olds decreased in England, increased in Wales and Scotland, and remained
steady in Northern Ireland
Figure 11 shows the proportion of the 18 year old population accepted into higher education through UCAS by country of domicile. These entry rates, called ‘cycle entry rates’ refer to the cycle within which the applicant is accepted and include both acceptances for immediate entry to higher education and those that are deferred until the next academic year. The entry rates use population estimates based on data from ONS and HEFCE.
Figure 12 shows the proportion of 18 year olds who were accepted to start higher education at age 18 by the academic year that they entered higher education (2012-13 shown as 2012). These entry rates, called ‘academic year entry rates’, refer to the academic year within which the applicant was anticipated to start higher education (aged 18).
Entry rates for English 18 year olds, on both measures, increased between 2006 and 2011. The cycle entry rates fell in the 2012 cycle by 0.7 percentage points, whereas the academic year entry rates fell by a larger amount, 2.1 percentage points. The value of both measures in 2012 was above that of all previous years except 2011. How the relationship between these two measures and the application rate for England is affected by both acceptance and deferred rates is set out in a later section (from page 30).
The cycle entry rate for 18 year olds in Wales increased in 2012 by 1.3 percentage points, representing a proportional 5 per cent increase in the entry rate and taking it to a similar level as its high in 2009. Entry rates for 18 year olds in Scotland are lower than for other countries on this measure, since not all higher education provision in colleges is recruited through UCAS. The cycle entry rate for 18 year olds in Scotland also increased, by 0.9 percentage points, taking it to a similar level as its high in 2010. In Northern Ireland, the cycle entry rate decreased slightly, 0.4 percentage points, a small change relative to cycle to cycle changes typical for Northern Ireland.

27
End of Cycle report 2012
Figure 11 Proportion of 18 year olds accepted for entry by cycle and country of domicile
Figure 12 Proportion of 18 year olds accepted for entry by academic year and country of domicile
Entry
rate
(cyc
le)
20%
25%
30%
35%
40%
45%
2004
2005
2006
2007
2008
2009
2010
2011
2012
EnglandNorthern IrelandScotlandWales
Entry
rate
(aca
dem
ic y
ear)
20%
25%
30%
35%
40%
45%
2004
2005
2006
2007
2008
2009
2010
2011
2012
EnglandNorthern IrelandScotlandWales

28
End of Cycle report 2012
Figure 13 Proportion of 19 year olds accepted for entry by academic year and country of domicile
Entry rates for English 19 year olds fell substantially in 2012, Scottish and Welsh entry rates increased
The academic year entry rate of 19 year olds has been generally increasing for all four countries of the UK since 2006. For English 19 year olds, the entry rate fell by 3.2 percentage points in 2012. The entry rate of this group had increased in 2011 by an amount (0.8 percentage points) that was close to the average increase since 2006. However, it is more difficult to interpret entry rates for 19 year olds as they can be influenced by changes in the entry rate for 18 year olds in the previous cycle. For example, the increase in the acceptance rate for 18 year olds in the 2011 cycle is likely to account for around half this fall in the entry rate. The academic year entry rates of 19 year olds in Scotland and Wales increased in 2012 by 0.3 percentage points, a proportional increase in the rate of entry of 3 to 5 per cent. Entry rates for 19 year olds in Northern Ireland fell in 2012 after a larger than usual increase in the 2011 cycle (Figure 13).
Entry
rate
(aca
dem
ic y
ear)
0%
5%
10%
15%
20%
25%
2004
2005
2006
2007
2008
2009
2010
2011
2012
EnglandNorthern IrelandScotlandWales

29
End of Cycle report 2012
40 per cent of English 18 year olds in 2011 entered by age 19, more than the previous cohort but a
smaller increase than seen previously
When looking at either cycle or entry year based entry rates for single age groups, changes in entry year can make the interpretation of whether young people are becoming more or less likely to enter higher education difficult. One measure that is less influenced by changes in age of entry is a cohort-based entry rate that combines entry to higher education at ages 18 and 19. This structure is used, for instance, in HEFCE’s young participation analysis. It has the advantage that it is unaffected by changes in the choice to enter at ages 18 or 19, whether caused by a different year of application or a different pattern of deferred entry. It has the disadvantage that it cannot report on a complete rate for the cohort that was aged 18 in 2012, since they are yet to have exhausted the opportunity to enter at age 19.
Figure 14 shows the proportion of a young cohort, referenced by the year it would be aged 18, that is accepted for entry and would start their course aged either 18 or 19. The proportion of English young people accepted for entry to higher education was broadly unchanged between those cohorts aged 18 in 2005 and 2006 and then increased by between 1.1 to 1.7 percentage points a year to reach 39.5 per cent for the cohort aged 18 in 2010 (and entering in the 2010-11 or 2011-12 academic years). The rate for the cohort aged 18 in 2011 (and entering in the 2011-12 and 2012-13 academic years) is 39.8 per cent, a new high. This is an increase of 0.4 percentage points (around 1 per cent proportionally) from the previous cohort, lower than the annual increases of 1.1 to 1.7 percentage points (3 to 5 per cent proportionally) seen across the 2007 to 2010 cohorts.
The entry rate for the 2011 cohort from Wales increased by 0.8 percentage points to 34.3 per cent, near to the high set by the 2009 cohort. The cohort entry rate for Scotland (lower than on comparable student record measures since not all higher education in Scotland uses UCAS) fell by 0.6 points to 30.8 per cent and that for Northern Ireland fell by 0.5 points to 41.8 per cent. Both remain near the highest values in the period.
Figure 14 Young entry rate (cohort) by country
Entry
rate
(coh
ort)
20%
25%
30%
35%
40%
45%
Year aged 182005 2006 2007 2008 2009 2010 2011 2012
EnglandNorthern IrelandScotlandWales
30
End of Cycle report 2012
Application, acceptance and entry rates for English 18 year olds
Applications and acceptances give information on different aspects of admissions to higher education and reporting them as numbers or rates, or by UCAS cycle or academic year of entry answer different questions about demand and outcomes. These differences are particularly important for understanding admissions against changes in 2012 if the assessment of these changes is to be against the context of recent patterns. This is because some of the key links between demand and outcomes, such as the acceptance and deferred entry rate, have changed in this period.
This section shows how these measures interrelate and fit together for building an understanding of how higher education admissions have changed in 2012. It uses a large group of applicants – English 18 year olds – who have had a change in the arrangements for higher education in 2012 and, since they are applying for the first time, provide a clearer signal of any responses to the new arrangements.
Figure 15 shows the proportion of English 18 year olds who applied to UCAS (the application rate) and the proportion of those who applied that were placed (the acceptance rate). It also shows the product of these two measures (the cycle entry rate), that is the proportion of English 18 year olds who were accepted in that cycle for entry into higher education.
No indication of above-trend application rates for English 18 year olds in 2011
The application rate includes applicants from the entire application cycle but its pattern and interpretation is the same as for the application rate covering just those who had applied by March1. The application rate in 2011 increased by slightly less than had been typical over the previous four cycles. If young people who would normally have applied at age 19 in 2012 chose to apply at age 18 in 2011 instead, then the 18 year old application rate would have been expected to increase by more than would otherwise have been the case. If it is assumed that the trend of increasing application rates since 2006 would have continued in 2011, then the patterns observed suggest that there was no overall bringing forward of application year by this cohort in anticipation of the changes to higher education in 2012.
Application rates for English 18 year olds fell in 2012
The application rate for English 18 year olds in the 2012 cycle fell by 1 percentage point to 34.9 per cent. Since 2006 application rates for 18 year olds have increased by around 1 percentage point a year (2007, +0.8; 2008, +1.2; 2009, +1.5; 2010, +2.2; 2011, +1.3). The application rate in 2012 is 2 percentage points lower (around 5 per cent proportionally) than if this trend had continued with an increase of 1 percentage point. That is, around one in twenty English 18 year olds who would have been expected to apply to higher education in 2012 (if the application rate had increased by one percentage point from 2011) did not do so.
Increase in acceptance rate in 2011 altered the relationship between application and entry rates
The cycle entry rate for English 18 year olds, the proportion of English 18 year olds who are accepted for entry to higher education in each cycle, is broadly similar to the application rate but has some important differences. It is less than the application rate, since not all applicants are accepted. The acceptance rate generally fell in most cycles between 2005 and 2010 with the result that only around half the proportional increase in the application rate was translated into a proportional increase in the cycle entry rate, and the difference between the two measures increased.
1 http://www.ucas.com/documents/ucas_how_have_applications_changed_in_2012.pdf

31
End of Cycle report 2012
In the 2011 cycle, the acceptance rate reversed a recent trend of sharp falls to increase by 2.7 percentage points, the largest increase in the period. This caused the trend for the application and cycle entry rates in 2011 to diverge: they both increased but the application rate by less than the recent trend (proportionally, +3.7 per cent), and the cycle entry rate by more than the recent trend (proportionally, +7.2 per cent). In the 2012 cycle, the acceptance rate increased again but by a smaller amount, half a percentage point, to 82.5 per cent. This is not enough to offset the reduction in the application rate so the cycle entry rate fell by 0.7 percentage points (a 2.4 per cent proportional fall against the 2011 cycle entry rate) to 28.8 per cent.
Figure 15 English 18 year olds – application, acceptance and cycle-based entry rates
Perc
enta
ge o
f app
lican
ts
60%
65%
70%
75%
80%
85%
90%
2004
2005
2006
2007
2008
2009
2010
2011
2012
Perc
enta
ge o
f pop
ulat
ion
20%
25%
30%
35%
40%
45%
50%Acceptance rate
Application rateEntry rate (cycle)
32
End of Cycle report 2012
Deferred acceptances fell by two thirds in 2011 cycle, altering entry rate by academic year
Figure 16 shows the entry rate for English 18 year olds calculated on both a cycle basis and an academic year of entry basis. The cycle entry rate, that is, the number of acceptances recorded for 18 year old English applicants divided by the 18 year old English population, shows an above trend rise in 2011 relating to the reversal of the trend for decreasing acceptance rates.
The academic year entry rate is calculated as the number of acceptances into that academic year divided by the population of that age group in the academic year; this gives a statistic with similar trend properties to higher education participation rates calculated from enrolment based student records.
The cycle and academic year entry rates are not the same since not all acceptances in a UCAS cycle are for higher education starting in the immediately following academic year. The proportion of acceptances in a cycle from English 18 year olds that are for deferred entry into the next academic year (when they would be aged 19) is shown as the deferred rate. Since there are very few acceptances from 17 year old applicants that are for deferred entry when they are aged 18, the difference between the two entry rates for 18 year olds is accounted for (almost) entirely by the proportion of English 18 year old acceptances that are for entry at age 19.
The proportion of accepted 18 year olds who intend to enter higher education when aged 19 fell steadily from 12.2 per cent in the 2004 cycle (1 in 8 acceptances) to 9.1 per cent in the 2010 cycle (1 in 11). In the 2011 cycle, the proportion of deferred acceptances fell by two thirds to 3.0 per cent (this was examined in the 2011 End of Cycle report). In 2012, the deferred rate for this group increased to 7.8 per cent – this is lower than the deferred rates seen prior to 2011 but consistent with the decreasing trend over the period.
These changes in the deferred rate alter the relationship between the cycle and academic year entry rates. With almost all the acceptances in 2011 being for immediate entry, the academic year entry rate increased sharply from 25.0 per cent in 2010 to 28.6 per cent, compared to an increase of 27.5 per cent to 29.5 per cent for the cycle entry rate. English 18 year olds in 2011 were 7.2 per cent more likely to be accepted for entry to higher education than the previous cohort but 14.4 per cent more likely to be starting higher education aged 18 in 2011-12 than the previous year. In 2012, a greater proportion of acceptances were for deferred entry than in 2011, reducing the share starting immediately at age 18 compared to the previous cycle. This had the consequence that whilst the cycle entry rate fell by 0.7 percentage points, the reduction in the academic year entry rate is 2.1 percentage points. In both cases the entry rates for 18 year olds in 2012 were at a level that is not inconsistent with an extrapolation of trends since 2006.

33
End of Cycle report 2012
Figure 16 English 18 year olds - application rates, entry rates by cycle and entry year and the proportion of acceptances that are for deferred entry
Perc
enta
ge o
f pop
ulat
ion
10%
15%
20%
25%
30%
35%
40%
2004
2005
2006
2007
2008
2009
2010
2011
2012
Perc
enta
ge o
f acc
epta
nces
0%
5%
10%
15%
20%
25%
30%Application rateEntry rate (academic year)Entry rate (cycle)
Deferred rate
34
End of Cycle report 2012
Entry rates and population changes drive recruitment into the 2012-13 academic year
Application, acceptance and entry rates measure the behaviour and experience of outcomes for young people. For institutions, the number of students starting in a particular academic year is also important. Since most English 18 year old acceptances are to English institutions, the final link between the entry rate and recruitment at age 18 at English institutions is the change in the size of the English 18 year old population.
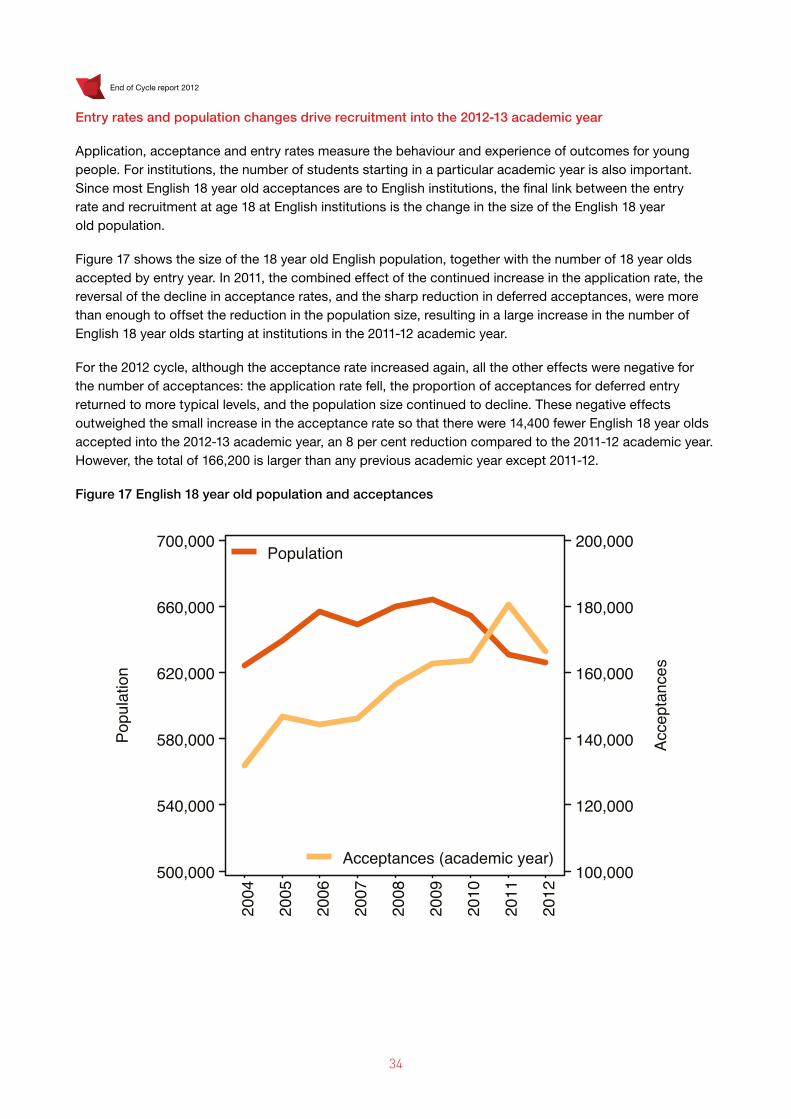
Figure 17 shows the size of the 18 year old English population, together with the number of 18 year olds accepted by entry year. In 2011, the combined effect of the continued increase in the application rate, the reversal of the decline in acceptance rates, and the sharp reduction in deferred acceptances, were more than enough to offset the reduction in the population size, resulting in a large increase in the number of English 18 year olds starting at institutions in the 2011-12 academic year.
For the 2012 cycle, although the acceptance rate increased again, all the other effects were negative for the number of acceptances: the application rate fell, the proportion of acceptances for deferred entry returned to more typical levels, and the population size continued to decline. These negative effects outweighed the small increase in the acceptance rate so that there were 14,400 fewer English 18 year olds accepted into the 2012-13 academic year, an 8 per cent reduction compared to the 2011-12 academic year. However, the total of 166,200 is larger than any previous academic year except 2011-12.
Figure 17 English 18 year old population and acceptances
Popu
latio
n
500,000
540,000
580,000
620,000
660,000
700,000
2004
2005
2006
2007
2008
2009
2010
2011
2012
Acce
ptan
ces
100,000
120,000
140,000
160,000
180,000
200,000Population
Acceptances (academic year)

35
End of Cycle report 2012
Applicant and institutional cycle trajectories
Fewer applicants, but progress and timing of cycle similar from the applicant perspective
Figure 18 shows the progress of the 2012 cycle through the number of applicants in each of three mutually exclusive states: those holding no offers, those holding offers which have not yet been resolved, and those who have been placed into higher education. The lighter lines represent the same statistics for the 2011 cycle. All these trajectory graphs use a small degree of smoothing to remove day of the week and other effects to aid interpretation.
Applicants entered the cycle in 2012 at a similar rate as in the 2011 cycle. The number of applicants with no offers peaked at 480,000 in mid January, around 34,000 lower and a week earlier than in 2011. In early July the number of applicants already accepted, holding offers or without offers were 20 per cent, 5 per cent and 8 per cent lower respectively. The profile of recruitment in the later parts of the cycle was broadly similar though the 2012 cycle ended with lower totals for both acceptances (-5.5 per cent) and unplaced applicants (-9.5 per cent).
Figure 18 Applicants by applicant status through the 2012 and 2011 application cycles
Appl
ican
ts
0
100,000
200,000
300,000
400,000
500,000
600,000
SepOct Nov Dec Jan Feb Mar Apr May
Jun Jul Aug SepOct Nov
1. Accepted (2011) 2. Has Offer (2011) 3. No Offers (2011)4. Accepted (2012) 5. Has Offer (2012) 6. No Offers (2012)

36
End of Cycle report 2012
Institutions held fewer firm offers from UK and EU applicants ahead of A level results
Figure 19 shows the progress of the cycle from another perspective, showing potential recruitment to the 2012-13 academic year from the institution perspective. The graph shows the totals, on a cumulative basis, of offers made to UK and EU applicants where these had the potential to translate to an acceptance into the 2012-13 academic year with no further action by the institution. These categories range from those where there was no doubt over entry (‘secured’) through those holding a conditional firm offer for entry, those holding a conditional insurance offer, to those where an offer had been made but no reply from the applicant had been received.
The number of ‘secured’ acceptances into the 2012-13 academic year started 15,500 lower than in the previous cycle due to the much lower number of deferred acceptances in the 2011 cycle. This reduction persisted and increased to 35,000 by early July (32 per cent lower than for the previous cycle). Offer making proceeded at a similar pace to previous cycles and slightly more offers were made earlier on, leading to the cumulative number of potential acceptances across the different states being roughly equal in February and March. From April onwards, the total number of potential acceptances fell below comparable totals in the previous cycle. By early July, the cumulative number of secured places or conditional firm offers was 13 per cent lower than in the previous cycle and the number of insurance offers held was also lower. These lower totals translated into an eventual reduction of 53,200 (-11.3 per cent) of UK and EU accepted applicants into the 2012-13 academic year compared to the 2011-12 academic year at the end of the cycle.
Figure 19 Cumulative status of offers to UK and EU domiciled applicants for entry into 2012-13 academic year (compared to entry into 2011-12)
Cum
ulat
ive
tota
l of o
ffers
0
200,000
400,000
600,000
800,000
1,000,000
SepOct Nov Dec Jan Feb Mar Apr May
Jun Jul Aug SepOct Nov
1. Offer (2011) 2. Insurance (2011) 3. Firm (2011) 4. Secured (2011)5. Offer (2012) 6. Insurance (2012) 7. Firm (2012) 8. Secured (2012)
Offer status (shown cumulatively on graph)

37
End of Cycle report 2012
Offer making to UK and EU applicants in 2012
Total acceptances in 2012 were 27,100 fewer than in 2011, caused by a fall in UK and EU domiciled acceptances. The dominant acceptance route for this group is through firm or insurance offers in the main UCAS scheme – acceptances through these routes fell by 30,900 for UK and EU acceptances in 2012. This section examines the pattern of offer making by institutions to a large subset of UK and EU domiciled acceptances, those who made five choices, 76 per cent of total UK and EU acceptances.
Fewer applicants received offers, but more received five offers
Figure 20 shows the number of UK and EU applicants who made five choices, split by the number of offers that they had received by June, and Figure 21 shows this as a cumulative distribution. The total number of UK and EU applicants who made five choices fell by 37,800 (-8.7 per cent) in the 2012 cycle and the number of these applicants who received at least one offer fell by 30,700 (-7.9 per cent). The number of applicants who received five offers increased by 9,600 to 102,700, an increase of over 10 per cent, the highest level recorded in the period. The number of applicants who received four, three, two or one offer all decreased by between 8 and 18 per cent, with the largest proportional decreases for applicants receiving one or two offers.
The number of applicants who did not receive any offers increased substantially from 15,900 in the 2008 cycle to 47,900 in the 2011 cycle. In the 2012 cycle this reduced to 40,800, a 15 per cent fall, but this number is higher than in the 2008, 2009 and 2010 cycles.

38
End of Cycle report 2012
Figure 20 UK and EU applicants who made five choices by number of offers received by June
Figure 21 UK and EU applicants who made five choices by number of offers received by June (cumulative distribution)
Num
ber o
f app
lican
ts
0
20,000
40,000
60,000
80,000
100,000
120,000
2008
2009
2010
2011
2012
No offers1 offer
2 offers3 offers4 offers5 offers
Cum
ulat
ive
num
ber o
f app
lican
ts
0
100,000
200,000
300,000
400,000
500,000
2008
2009
2010
2011
2012
All applicants1−5 offers2−5 offers3−5 offers4−5 offers
5 offers

39
End of Cycle report 2012
Acceptance rates of applicants vary by the number of offers received, acceptance rates low for those
with no offers by June
Figure 22 shows the proportion of UK and EU domiciled applicants (who made five choices) who are, by the end of the cycle, split by the number of offers they received by June. In the 2012 cycle these acceptance rates ranged from 90 per cent for those with five offers to 27 per cent for those with no offers by June. The acceptance rates were similar for the 2011 cycle, although the acceptances rates for those with two offers or one offer decreased by 1.1 and 1.5 percentage points respectively. The differentiation in the acceptance rates between those receiving different numbers of offers is substantial for those receiving few or no offers. Those with one offer were (proportionally) 160 per cent more likely to be placed than those with no offers by 30 June, and those with two offers are 15 per cent more likely to be placed than those with one offer.
Figure 22 Acceptance rates of UK and EU applicants who made five choices by number of offers received by June
Acce
ptan
ce ra
te
20%
40%
60%
80%
100%
2008
2009
2010
2011
2012
No offers1 offer
2 offers3 offers4 offers5 offers

40
End of Cycle report 2012
Institutions made fewer offers in 2012 and they were more concentrated on applicants with five offers
Figure 23 also looks at offer making but through the institutional perspective of offers made. The total number of offers made to UK and EU applicants with five choices reduced to 1.22 million in 2012, a decrease of 4 per cent against the offers made in the 2011 cycle, but similar to the number made in the 2010 cycle. The proportional changes in the number of offers made to applicants who received one, two, three or four offers (in total) are the same, necessarily, as in the number of applicants receiving those offers; that is between 8 and 17 per cent, with the largest reductions being in the number of offers made to applicants who received one or two offers.
The number of offers made to applicants who received offers from each of their five choices increased by over 10 per cent to 513,300 in the 2012 cycle, a high for the period and accounting for 42 per cent of all offers made to this group of applicants (up from 37 per cent in the 2011 cycle). Offers which were the sole offer to an applicant decreased by 18 per cent to 45,600 in 2012, where they represented 3.7 per cent of all offers made to applicants.
Figure 23 Cumulative number of offers made to UK and EU domiciled applicants with five choices, by number of offers received
Cum
ulat
ive
num
ber o
f offe
rs
0
200,000
400,000
600,000
800,000
1,000,000
1,200,000
1,400,000
2008
2009
2010
2011
2012
1−5 offers2−5 offers3−5 offers4−5 offers
5 offers

41
End of Cycle report 2012
Conversion of an offer to an acceptance is much lower where applicants have many offers
Figure 24 shows offer-level acceptance rates – that is the institutional perspective on whether an offer they made resulted in a placed applicant. Although the applicant acceptance rate is higher for applicants with a higher number of offers, from the institution’s perspective this is more than offset by the greater choice the applicant has between offers. The offer-level acceptance rate for applicants with five offers was 18 per cent in 2012, the same as the previous cycle. For sole offers to applicants, the offer-level acceptance rate is the same as the applicant acceptant rate, 69.4 per cent in 2012, down from 70.9 per cent in 2011. These rates are relatively stable within each offer number group compared to the differences between the offer number groups.
Figure 24 Offer-level acceptance rate by number of offers received by applicant
Acce
ptan
ces
per o
ffer
0.0
0.2
0.4
0.6
0.8
2008
2009
2010
2011
2012
1 offer2 offers3 offers4 offers5 offers
Changes in offer patterns consistent with changes in acceptances
The overall effect of institutions making a smaller number of offers into a smaller pool of applicants, and the concentration of those offers, is consistent with fewer acceptances at the end of the cycle. Offer-level acceptance rates were relatively stable over the period. If they are assumed to be constant and then applied to the change in the number and profile of offers made in 2012 then a fall of around 26,000 in acceptances would be suggested; similar to the actual change seen in 2012 for this group. Under these assumptions, to obtain the same number of acceptances from the smaller pool of applicants, either more offers would need to be made, or they would need to be less concentrated. In particular, the number of applicants who received no offers by June was higher in 2012 than in the 2008 to 2010 cycles. This group is particularly important as they had a much lower acceptance rate than those who received one offer.

42
End of Cycle report 2012
Scotland in 2012
Acceptance rates of English and Scottish applicants to Scottish institutions increased in 2012
Figure 25 shows, by country of domicile, the proportion of applicants who applied to a Scottish institution who were subsequently placed at a Scottish institution. This (conditional) acceptance rate was much higher for applicants from Scotland than from other countries. In the 2012 cycle, 65.5 per cent of Scottish applicants to Scottish institutions were accepted to a Scottish institution. This is an increase of 1.8 percentage points (2.8 per cent proportionally) compared to the 2011 cycle, but the acceptance rate remains around 5 percentage points below the 71 to 74 per cent values typical prior to the sharp fall in the 2010 cycle.
The acceptance rate for English applicants to Scottish institutions is typically lower, but did increase this cycle. In the 2012 cycle, 15.3 per cent of English applicants to Scottish institutions were accepted to a Scottish institution, making English applicants around 30 per cent more likely to be accepted than they were in the 2011 cycle (11.8 per cent accepted) and taking the rate to a level last seen in 2004.
The acceptance rate for EU applicants to Scottish institutions was 22.7 per cent in the 2012 cycle. This is similar to the 2011 cycle but below the 27 to 28 per cent values seen in the 2008 and 2009 cycles. The acceptance rates of overseas applicants declined by 2.7 percentage points (15 per cent proportionally) to 15.6 per cent, the lowest value in the period.
Figure 25 Proportion of applicants who applied to a Scottish institution who are accepted to a Scottish institution by selected domicile group
Acce
ptan
ce ra
te
0%
10%
20%
30%
40%
50%
60%
70%
80%
2004
2005
2006
2007
2008
2009
2010
2011
2012
EnglandScotlandNon−UK EUNon−EU

43
End of Cycle report 2012
Scottish applicants continue to form large majority of acceptances to Scottish institutions
Scottish domiciled acceptances account for seven out of ten acceptances to Scottish institutions. This proportion decreased from 73 to 68 per cent between the 2004 and 2009 cycles, before increasing sharply to 72 per cent in the 2010 cycle. Since then, the proportion has decreased, falling by 1 percentage point in each year, to 70 per cent in 2012.
The proportion of acceptances from the EU has increased by two thirds from 6.2 per cent in the 2004 cycle to 10.5 per cent in the 2012 cycle. The proportion of acceptances from the EU is similar to that in the 2011 cycle (10.4 per cent).
The proportion of acceptances in 2012 from England was 9.6 per cent compared to 8.0 per cent in 2011. This is a proportional increase of 21 per cent from the 2011 cycle, less than the increase in the acceptance rate reflecting that fewer English applicants applied to Scottish institutions in 2012. The proportion of acceptances from England remains below levels seen prior to the 2010 cycle.
Figure 26 Acceptances to Scottish institutions by domicile of applicant
Dom
icile
d in
Sco
tland
45%
50%
55%
60%
65%
70%
75%
2004
2005
2006
2007
2008
2009
2010
2011
2012
Oth
er d
omic
iles
0%
5%
10%
15%
20%
25%
30%Scotland
EnglandNorthern IrelandWalesNon−UK EUNon−EU

44
End of Cycle report 2012
Northern Ireland in 2012
In Northern Ireland, entry rates of 18 year olds to home institutions increased and declined elsewhere
The entry rates of 18 year olds in Northern Ireland to institutions in Northern Ireland increased from 21.6 per cent in 2011 to 23.2 per cent in 2012, a 7 per cent proportional increase. Although this is the largest increase in the period, it leaves the entry rate at a level typical of the past eight cycles. The entry rate to institutions outside of Northern Ireland fell from 12.5 per cent to 10.5 per cent. This is a 16 per cent proportional reduction compared to the entry rate in 2011, and more than reverses recent increases to take the entry level to the lowest since 2004 (Figure 27).
Figure 27 Entry rates (cycle) for 18 year olds in Northern Ireland
Entry
rate
(cyc
le)
0%
5%
10%
15%
20%
25%
30%
2004
2005
2006
2007
2008
2009
2010
2011
2012
Northern IrelandOther UK

45
End of Cycle report 2012
Wales in 2012
In 2012, the entry rate of Welsh 18 year olds increased, as did the number of acceptances from Wales overall, but the number of acceptances to Welsh institutions fell by 8.1 per cent. These different outcomes can be accounted for by the nature and changes in flows in and out of Wales.
Fall in acceptances at Welsh institutions driven by a 17 per cent decrease in English acceptances
Acceptances to institutions in Wales are predominantly from Wales and England (89 per cent in 2011 and 2012) with roughly equal contributions from both those countries. Figure 28 shows the number of acceptances to Welsh institutions from Wales and from England. Acceptances from Wales increased from 9,900 in 2004 to 14,400 in 2009. Since the 2010 cycle, acceptances from Wales have been around 12,000. In 2012, 11,900 acceptances were from Wales, a slight increase (100) from 2011.
Acceptances to Welsh institutions from England were around 9,000 between 2004 and 2008, before increasing each cycle to reach 11,500 in 2011. In the 2012 cycle, the number of English acceptances decreased by 1,900 (17 per cent) to 9,600. This change was the predominant factor in the 2,100 fall in acceptances to Welsh institutions in 2012.
Figure 28 Acceptances to Welsh institutions by selected domicile of applicant
Num
ber o
f acc
epta
nces
0
3,000
6,000
9,000
12,000
15,000
2004
2005
2006
2007
2008
2009
2010
2011
2012
EnglandWales
46
End of Cycle report 2012
Entry rate of 18 year olds in Wales to English institutions increased in 2012
The application rate of 18 year olds in Wales to institutions in Wales fell in 2012. The application rate to institutions outside of Wales increased, and a greater proportion of 18 year olds in Wales applied to institutions outside of Wales than to institutions within Wales for the first time since 2004. In 2012, the acceptance rate of 18 year old Welsh applicants (who applied to a Welsh institution) to Welsh institutions was around 62 per cent, much higher than the acceptance rate to English institutions for Welsh applicants who applied to an English institution (around 47 per cent). This differential in acceptance rates means that the 18 year old Welsh entry rate to Welsh institutions is higher than that to English institutions, despite the application rates being similar in 2012 (Figure 29).
In 2012, the acceptance rates of Welsh applicants to institutions in Wales are similar to 2011. For Welsh applicants to English institutions the acceptance rate increased (Figure 30). This means that the trends of falling application rates to Welsh institutions, and increasing application rates to English institutions, are reinforced when looking at entry rates.
The entry rate to English institutions increased from 9.7 per cent in 2011 to 11.5 per cent in 2012, an increase of 1.7 percentage points, an 18 per cent increase proportionally. The entry rate to Welsh institutions fell from 15.0 to 14.5 per cent, a decrease of 0.5 percentage points (3.4 per cent proportionally). Entry rates to institutions in Scotland and Northern Ireland are very small (less than 0.2 per cent) and highly variable from cycle-to-cycle. The increase in the entry rate to English institutions more than offsets the decrease in entry to Welsh institutions so that 18 year olds in Wales become more likely to enter higher education overall in 2012 (Figure 29).

47
End of Cycle report 2012
Figure 29 Welsh 18 year old application rates and entry rates by country of institution
Figure 30 Welsh 18 year old acceptance rates by country of institution
Acce
ptan
ce ra
te
20%
30%
40%
50%
60%
70%
80%
2004
2005
2006
2007
2008
2009
2010
2011
2012
EnglandWales
Appl
icat
ion
/ ent
ry ra
te (c
ycle
)
0%
5%
10%
15%
20%
25%
30%20
04
2005
2006
2007
2008
2009
2010
2011
2012
Application: EnglandApplication: WalesEntry: EnglandEntry: Wales

48
End of Cycle report 2012
England in 2012
One of the changes to higher education for the 2012 cycle was the increase in the level and range of tuition fees in England. This section reports the application cycle outcomes for institutions in England using the course-level tuition fee information provided by institutions in 2012, and a mapping of courses from previous cycles to this 2012 fee structure. These 2012 tuition fees are before any fee waiver or related bursary support that institutions may have made available to individuals.
Average tuition fee for UK and EU acceptances to English institutions in 2012 was £8,389
There were 359,300 UK and EU domiciled acceptances from the 2012 cycle to English institutions. The average tuition fee for these acceptances was £8,389. The average tuition fee for acceptances from England was £8,379. Average tuition fees were higher for EU domiciled acceptances (£8,433) and slightly higher again for those from Northern Ireland (£8,527), Scotland (£8,608) and Wales (£8,628). The average tuition fee for UK and EU acceptances to honours degree courses was £8,541. Average tuition fees were lower for acceptances to foundation degrees (£6,660) and HNDs (£6,047). UK and EU acceptances to institutions whose acceptances have historically had relatively higher attainment levels on entry (‘higher tariff institutions’), were at an average tuition fee of £8,969. The average tuition fee was lower at those institutions with medium (£8,732) or lower (£7,919) historical levels of typical attainment on entry.
Half of acceptances were to courses with a tuition fee of £9,000
Figure 31 shows the distribution of UK and EU 2012 acceptances to English institutions by the tuition fee of the course they were accepted to. The majority of acceptances (51 per cent) were to courses where the tuition fee was between £8,750 and £9,000. Overall, the distribution of acceptances was towards courses with higher tuition fees with 86 per cent of acceptances to courses with tuition fees of £7,750 or more.
Figure 31 Distribution of UK and EU domiciled acceptances to English institutions by tuition fee of course
Perc
enta
ge o
f acc
epta
nces
0%
10%
20%
30%
40%
50%
60%
0
1,00
0
2,00
0
3,00
0
4,00
0
5,00
0
6,00
0
7,00
0
8,00
0
9,00
0

49
End of Cycle report 2012
No substantial change in the pattern of English acceptances by 2012 tuition fee
English acceptances at English institutions were the largest group affected by the new tuition fee arrangements and their analysis is not complicated by different arrangements being available in institutions in their home country.
Figure 32 shows the average 2012 tuition fee of English acceptances to English institutions. For 2012, these are the actual recorded tuition fees. For earlier cycles, the 2012 tuition fees are mapped back to the courses that applicants were accepted to in that cycle. It represents a trend in the pattern of acceptances in terms of the 2012 fee structure.
The average tuition fee of English acceptances at English institutions was £8,379 in 2012. Between the 2004 and 2011 cycles, the profile of acceptances shifted each cycle towards courses with lower (2012) tuition fees so that the average (2012) tuition fee of acceptances decreased by between £4 and £40 each cycle from £8,511 in the 2004 cycle to £8,375 in 2011. The average tuition fee in 2012 is very similar to that in 2011, but the slight increase (+£4) compared to the previous cycle is the first time in the period that the profile of acceptances does not shift towards lower (2012) tuition fee courses.
Figure 32 Average tuition fee of English domiciled acceptances at English institutions
Aver
age
tuiti
on fe
e
8,000
8,200
8,400
8,600
8,800
9,000
2004
2005
2006
2007
2008
2009
2010
2011
2012

50
End of Cycle report 2012
Average tuition fee for English 18 year olds increased in 2012
Figure 33 splits the trend of average (2012) tuition fees for acceptances by age group. This shows that the overall trend differs across the age groups. The average (2012) tuition fee of 18 year olds decreases by less than for all acceptances over the period and shows a larger increase (+£29) to £8,553 in 2012; although this leaves the average fee below that for all cycles except 2011.
English acceptances at English institutions who are aged 20 or over show a stronger trend over the period of being accepted into courses that have lower (2012) tuition fees. The average tuition fee of acceptances aged 20 and over was £8,071 in 2012. This is £44 lower than in the previous cycle but typical of the cycle- to-cycle decrease over the period.
Figure 33 Average 2012 tuition fee of English acceptances at English institutions by age group
Aver
age
tuiti
on fe
e
8,000
8,200
8,400
8,600
8,800
9,000
2004
2005
2006
2007
2008
2009
2010
2011
2012
181920 plus

51
End of Cycle report 2012
Changes in average tuition fee in 2012 were similar for acceptances from different backgrounds
Figure 34 shows the average (2012) tuition fee of 18 year old English acceptances at English institutions by background (POLAR2). The measure of background is based on the neighbourhood of the applicant progressing from Q1 (areas with the lowest levels of young participation in higher education) to Q5 (areas with the highest levels of young participation in higher education).
In the 2012 cycle, acceptances from the most advantaged backgrounds averaged a higher tuition fee (£8,703) than acceptances from the most disadvantaged backgrounds (£8,341), with a progression for those from backgrounds in between these extremes.
The average tuition fee of acceptances from all backgrounds was broadly constant between the 2004 and 2008 cycles. It then decreased, again for all groups, between 2008 and 2011. The decrease in average (2012) tuition fee over this period was larger, at around £100, for quintiles 1, 2 and 3 than for the more advantaged quintiles 4 and 5. In the 2012 cycle, the average tuition fee of acceptances increased for all groups: Q1, +£16; Q2, +£15; Q3, +£35; Q4, +£36; Q5, +£40. If the trend of decreasing average tuition fees between 2008 and 2011 is extrapolated by group, then the increase in the average tuition fee in 2012 against this extrapolated trend is larger, around £50 to £60, and more similar across the background groups. For all the groups, the increases in the average (2012) tuition fee of acceptances in 2012 takes the average back to values seen between the 2008 and 2011 cycles.
Figure 34 Average 2012 tuition fee of 18 year old English acceptances at English institutions by POLAR2 (POLAR2, quintile 5 (Q5)= highest participation areas)
Aver
age
tuiti
on fe
e
8,300
8,400
8,500
8,600
8,700
8,800
2004
2005
2006
2007
2008
2009
2010
2011
2012
Q1Q2Q3Q4Q5

52
End of Cycle report 2012
Qualifications held by applicants
Entry to higher education is often determined by the type and strength of the qualifications held by an applicant. This analysis includes both qualifications that applicants list as achieved when they apply and those that are awarded during the application cycle itself. This section describes the type and strength of qualifications held by particular groups of applicants and how they have changed in the 2012 cycle.
23 per cent of the 18 year old population in the UK accepted holding A levels in 2012, less
than in 2011
Figure 35 reports the entry rate for UK 18 year olds split by the type of qualification held by accepted applicants. A levels are the most widely held qualification for this group; 23 per cent of UK 18 year olds were accepted for entry in 2012 holding A levels. This is half a percentage point lower than for 2011, but higher than recorded for the 2008 to 2010 cycles.
Five per cent of the 18 year old population accepted holding BTECs, up by 81 per cent on 2008
The second most widely held qualification for this group is BTECs; 4.7 per cent of UK 18 year olds were accepted for entry in 2012 holding BTECs. This continues an increase that has seen this entry rate rise by over 2 percentage points (81 per cent proportionally) since the 2008 cycle. About half of this increase has been for applicants who hold BTECs together with A levels. Acceptances holding Scottish Qualification Authority (SQA) qualifications form just under 2 per cent of the UK 18 year old population.
Figure 35 UK 18 year old entry rate split by qualifications held
Entry
rate
(cyc
le)
0%
5%
10%
15%
20%
25%
2008
2009
2010
2011
2012
A levelsBTECScottish quals
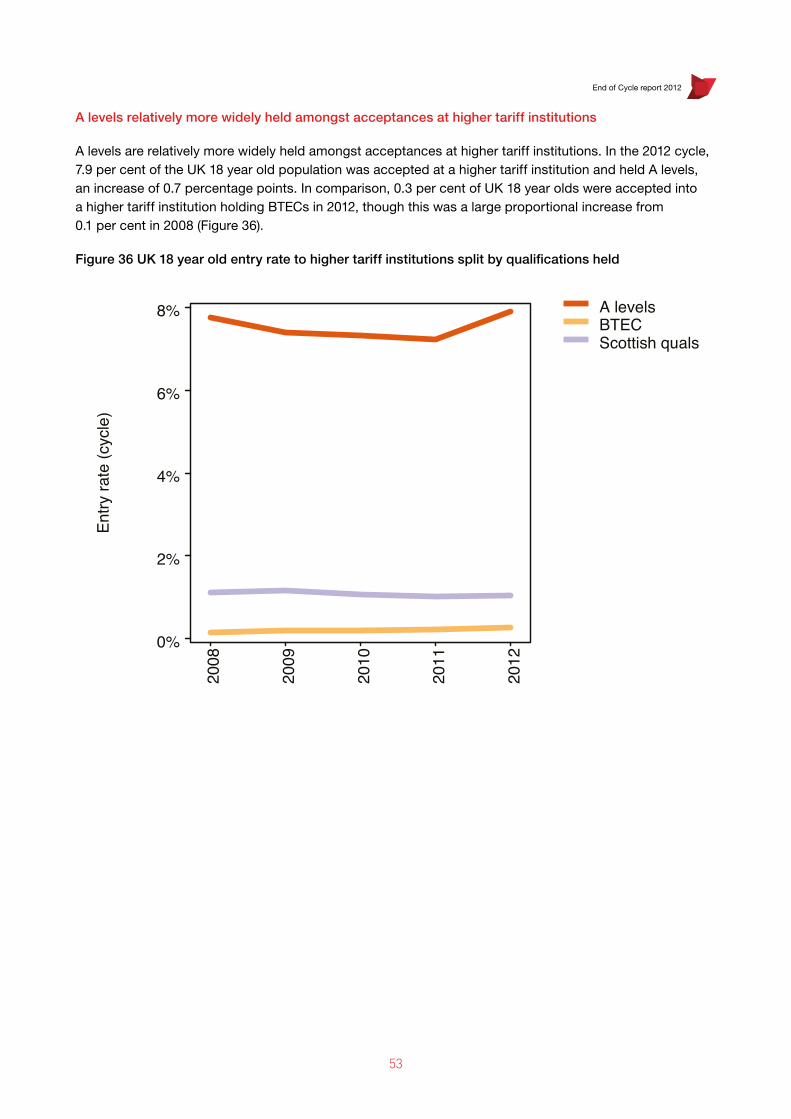
53
End of Cycle report 2012
A levels relatively more widely held amongst acceptances at higher tariff institutions
A levels are relatively more widely held amongst acceptances at higher tariff institutions. In the 2012 cycle, 7.9 per cent of the UK 18 year old population was accepted at a higher tariff institution and held A levels, an increase of 0.7 percentage points. In comparison, 0.3 per cent of UK 18 year olds were accepted into a higher tariff institution holding BTECs in 2012, though this was a large proportional increase from 0.1 per cent in 2008 (Figure 36).
Figure 36 UK 18 year old entry rate to higher tariff institutions split by qualifications held
Entry
rate
(cyc
le)
0%
2%
4%
6%
8%
2008
2009
2010
2011
2012
A levelsBTECScottish quals

54
End of Cycle report 2012
Entry rate holding A levels for older age groups fell in 2012, BTECs remained steady
In Figure 37 the entry rate for 19 to 21 year olds is split by the qualifications held by accepted applicants. In 2012, 3 per cent of the population in this age group entered higher education holding A levels, a fall of half a percentage point from the previous cycle. Accepted applicants holding BTECs represented 1.6 per cent of the population in this age group, around half that of those accepted holding A levels, and the same as in 2011.
Figure 37 UK domiciled 19 to 21 year old entry rate split by qualifications held
Entry
rate
(cyc
le)
0%
1%
2%
3%
4%
2008
2009
2010
2011
2012
A levelsBTECScottish quals

55
End of Cycle report 2012
Entry rate for those holding A levels highly differentiated by background
Figure 38 shows the proportions of the UK 18 year old population in each POLAR2 area who are accepted to higher education and hold A levels. There is a differentiation in these entry rates across the groups, with young people in more advantaged areas being substantially more likely to enter higher education and hold A levels than those living in more disadvantaged areas.
Of 18 year olds living in those areas with the lowest levels of higher education participation (Q1), 11.2 per cent held A levels and were accepted to higher education in 2012. This is a slight increase from 2011, continuing a trend of annual increases that has seen this rate increase (proportionally) by 18 per cent since 2008. The entry rate holding A levels for 18 year olds from other types of areas fell in 2012, and more so in the more advantaged areas. However, the entry rate holding A levels was higher in 2012 than in 2010 for all groups.
Figure 38 UK 18 year old entry rates by POLAR2 group (accepted applicants holding A levels) (POLAR2, quintile 5 (Q5)= highest participation areas)
Entry
rate
(cyc
le)
0%
10%
20%
30%
40%
2008
2009
2010
2011
2012
Q1Q2Q3Q4Q5

56
End of Cycle report 2012
Entry rate holding BTECs little different by background and increasing
The entry rate holding BTECs for the UK 18 year old population is lower than the entry rate for holding A levels has increased substantially for all groups over the past five cycles, and shows relatively little differentiation by background. Around 5 per cent of the 18 year old population in each background group were accepted for entry in 2012 holding BTECs with the exception of the most advantaged areas where 3.5 per cent of the population were accepted and held BTECs. These entry rates holding BTECs have increased over the period and are around twice what they were in the 2008 cycle.
Figure 39 UK 18 year old entry rates by POLAR2 group (accepted applicants holding BTECs) (POLAR2, quintile 5 (Q5)= highest participation areas)
Entry
rate
(cyc
le)
0%
1%
2%
3%
4%
5%
6%
2008
2009
2010
2011
2012
Q1Q2Q3Q4Q5
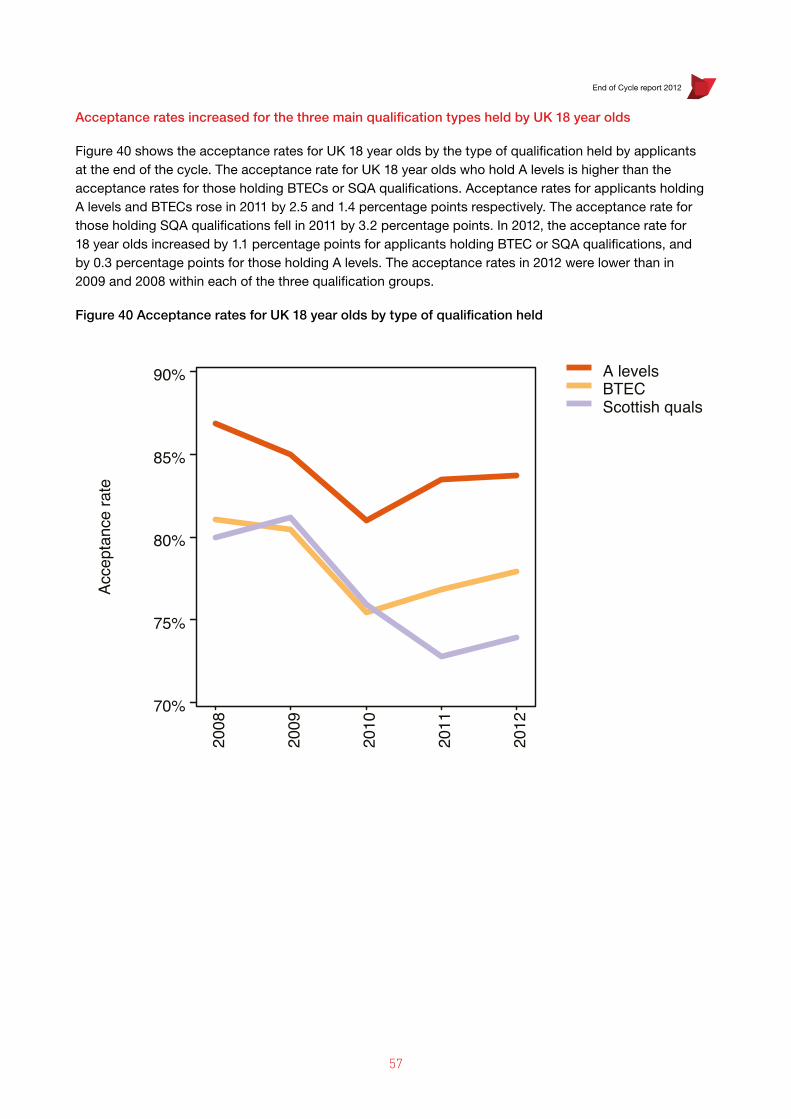
57
End of Cycle report 2012
Acceptance rates increased for the three main qualification types held by UK 18 year olds
Figure 40 shows the acceptance rates for UK 18 year olds by the type of qualification held by applicants at the end of the cycle. The acceptance rate for UK 18 year olds who hold A levels is higher than the acceptance rates for those holding BTECs or SQA qualifications. Acceptance rates for applicants holding A levels and BTECs rose in 2011 by 2.5 and 1.4 percentage points respectively. The acceptance rate for those holding SQA qualifications fell in 2011 by 3.2 percentage points. In 2012, the acceptance rate for 18 year olds increased by 1.1 percentage points for applicants holding BTEC or SQA qualifications, and by 0.3 percentage points for those holding A levels. The acceptance rates in 2012 were lower than in 2009 and 2008 within each of the three qualification groups.
Figure 40 Acceptance rates for UK 18 year olds by type of qualification held
Acce
ptan
ce ra
te
70%
75%
80%
85%
90%
2008
2009
2010
2011
2012
A levelsBTECScottish quals

58
End of Cycle report 2012
Qualification related outcomes for English applicants
One of the changes to higher education in 2012 was the introduction of qualification related criteria for student number controls at English institutions. Specifically, for most courses at HEFCE-funded institutions, entrants into the 2012-13 academic year whose qualifications were listed in a set of high grade combinations, were exempt from number control limits. Entrants to all other courses were subject to number control limits. As shorthand, the high grade qualification combinations that were exempt from the number control arrangements for 2012-13 are referred to as ‘AAB+’ in this report, reflecting the threshold for the A level exempted grades.
This section describes acceptance, entry and attainment rates for groups of applicants by an assessment of whether the attainment of the applicant matches the ‘AAB+’ set of high grade combinations. English domiciled applicants mostly apply to, and enter, English institutions, and 18 year olds are generally applying for the first time, so this group is used in this section to provide a clearer signal of any responses to the new arrangements.
Acceptance rates for ‘AAB+’ English 18 year olds fell in 2012
The acceptance rate for English 18 year olds holding ‘AAB+’ has varied between 88.8 per cent and 91.0 per cent over the past five cycles. The acceptance rate for applicants holding ‘AAB+’ from A levels has varied between 90.3 per cent and 92.9 per cent over this period and has remained around 9 percentage points higher than the acceptance rate of those holding ‘AAB+’ from BTECs (which has ranged from 80.7 per cent to 83.0 per cent over the period). The acceptance rate for both those holding ‘AAB+’ from A levels and those holding BTECs fell in 2012 by 1.4 percentage points and 0.8 percentage points respectively (A levels 91.4 per cent, BTECs 82.3 per cent), but in both cases remained higher, or similar to, the acceptance rates observed for applicants with these qualification in the 2008 to 2010 cycles.
Acceptance rates for ‘not AAB+’ English 18 year olds were lower than ‘AAB+’ but increased in 2012
In 2008, the acceptance rate for English 18 year olds not holding ‘AAB+’ was 83.9 per cent, this fell to a low of 75.6 per cent in 2010. The acceptance rate then increased in both the 2011 and 2012 cycles to reach 79.5 per cent in 2012, though this remains below the levels seen in 2008 and 2009.
Overall, the acceptance rates for English 18 year olds not holding ‘AAB+’ are always lower than those holding ‘AAB+’, but since they have shown more variation than the ‘AAB+’ group over the past five cycles the gap in the acceptance rates between the two groups has ranged from 6 percentage points in 2008 to 13 percentage points in 2010 and 2011 (equating to the ‘AAB+’ applicants being between 7 and 17 per cent more likely to be accepted than non ‘AAB+’ applicants).
Within those not holding ‘AAB+’, the acceptance rate for those with A levels is around 5 to 8 percentage points higher than those with BTECs. This is a smaller differential between these qualification types than amongst those holding ‘AAB+’, contributing to the acceptance rate for those not holding ‘AAB+’, but holding A levels, being similar, and in some cycles higher, than those holding ‘AAB+’ from BTEC qualifications (Figure 41).

59
End of Cycle report 2012
Figure 41 Acceptance rates for English 18 year olds by type of qualification held
Acce
ptan
ce ra
te
70%
80%
90%
100%
2008
2009
2010
2011
2012
AAB+ A levelsAAB+ BTECAAB+ allNot AAB+ A levelsNot AAB+ BTECNot AAB+ all

60
End of Cycle report 2012
English 18 year old entry rate holding ‘AAB+’ fell in 2012
Figure 42 shows the proportion of English 18 year olds who were accepted for entry into higher education split by whether they hold qualifications on the ‘AAB+’ list or not. Between 2008 and 2011, the proportion of 18 year olds who were accepted for higher education with qualifications in the ‘AAB+’ group increased from 6.8 per cent to 9.4 per cent of the population, with proportional increases in this entry rate of around 10 per cent per cycle. In 2012, 9.2 per cent of English 18 year olds were accepted for higher education with qualifications in the ‘AAB+’ group, a fall of 0.2 percentage points, around 3 per cent proportionally, but this entry rate remained above all other cycles except 2011.
Around 20 per cent of the English 18 year old population are accepted for entry to higher education each cycle and do not hold qualifications in the ‘AAB+’ group. This entry rate fell by 0.4 percentage points to 19.6 per cent (a 2 per cent fall proportionally) but remained at levels typical of the previous four cycles.
Figure 42 Entry rates for English 18 year old population split by qualification group
Entry
rate
(cyc
le)
0%
5%
10%
15%
20%
25%
2008
2009
2010
2011
2012
AAB+Not AAB+

61
End of Cycle report 2012
No pattern of divergence in acceptance rates either side of the ‘AAB+’ group
Grouping English 18 year old applicants by their attainment over three A levels results in grade profile groups that cover relatively narrow bands of attainment and can be mapped against the ‘AAB+’ group boundary exactly. The introduction of the A* grade over this period introduces some uncertainty; A* grades are treated as A grades for forming these groups, but the results are similar if they are excluded.
The acceptance rates for applicants who achieve exactly AAA, AAB, ABB or BBB are high, around 90 per cent, and within each cycle fall within a relatively narrow 2 to 4 percentage point range. The acceptance rates increase for all grade profile groups in the 2011 cycle by 2.5 percentage points to 3.0 percentage points. In the 2012 cycle the acceptance rates fall for all four groups. The largest fall, 2.1 percentage points, is for those applicants who achieve AAA. The acceptance rates for the AAB and ABB groups remain close to each other throughout the period and do not diverge in the 2012 cycle (Figure 43).
Figure 43 Acceptance rates for English 18 year olds by the highest three grades achieved at A level
Acce
ptan
ce ra
te
80%
85%
90%
95%
100%
2008
2009
2010
2011
2012
AAAAABABBBBB

62
End of Cycle report 2012
Deferred entry rate trends are relatively undifferentiated across qualification groups
Figure 44 shows the proportion of English 18 year old acceptances by grade profile that are for entry deferred to the following academic year, for example, the proportion of acceptances of English 18 year olds from the 2012 cycle that are for entry into the 2013-14 academic year. The proportion of acceptances for deferred entry for these grade profiles is higher than for English 18 year old acceptances as a whole. These deferred rates do not form a simple progression across these grade profiles with the highest rates seen for acceptances holding AAB and ABB, and the lowest rates for those holding AAA and BBB. There is a strong trend across the period that is shared by all the grade profiles; declines of (proportionally) around 10 per cent for 2009 and 2010 followed by a sharp fall of around two-thirds in 2011.
For the 2012 cycle, the deferred rate increased for all the grade profiles, but remained below levels seen prior to 2011 in all cases. The increase in the deferred rate was larger for those holding ABB and BBB than those holding AAA and AAB, and the deferred rate for ABB acceptances became higher than for AAB acceptances for the first time in the period. However, the 2012 deferred rates are not strongly divergent from trends prior to 2011 (for example, the deferred rate of ABB was increasing relative to that of AAB between 2008 and 2010). There is no signal of material changes in deferred acceptances in anticipation of an altered high grade list for the 2013-14 academic year, with no more than 50 to 100 of the most affected group (those holding ABB), appearing to change their deferred entry behaviour given the direction of recent trends.
Figure 44 Proportion of acceptances for deferred entry for English 18 year olds by the highest three grades achieved at A level
Prop
ortio
n of
def
erre
d ac
cept
ance
s
0%
5%
10%
15%
2008
2009
2010
2011
2012
AAAAABABBBBB
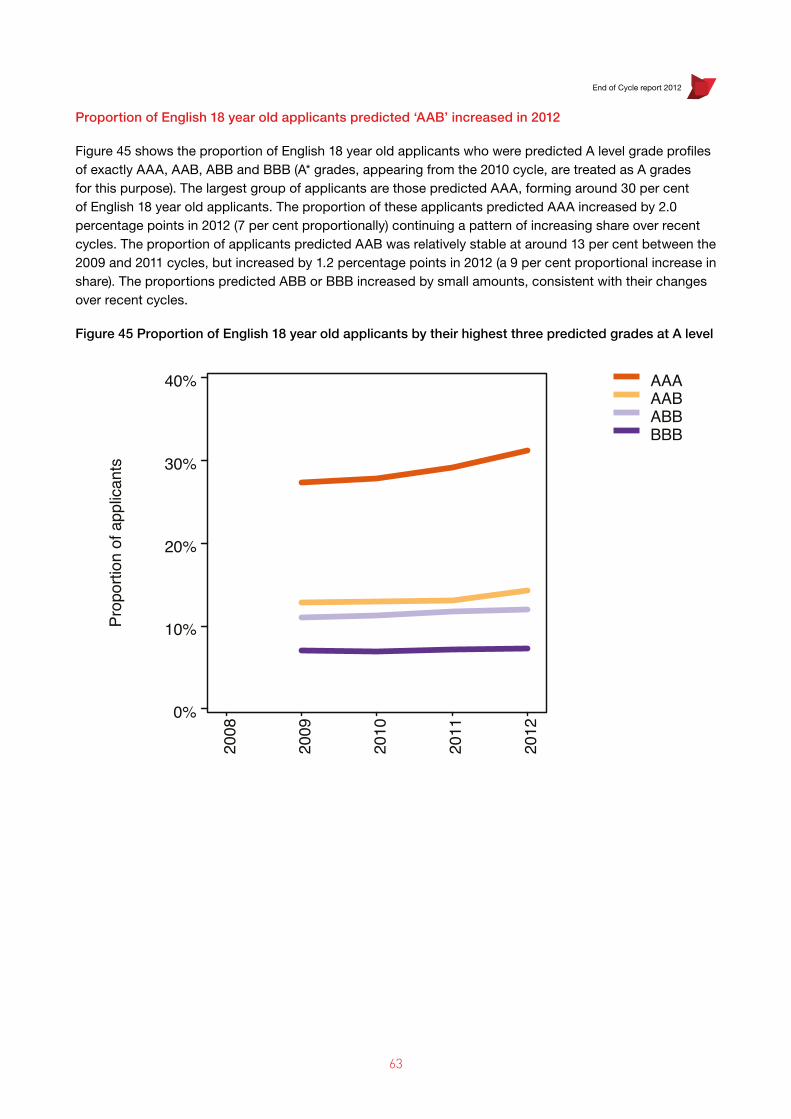
63
End of Cycle report 2012
Proportion of English 18 year old applicants predicted ‘AAB’ increased in 2012
Figure 45 shows the proportion of English 18 year old applicants who were predicted A level grade profiles of exactly AAA, AAB, ABB and BBB (A* grades, appearing from the 2010 cycle, are treated as A grades for this purpose). The largest group of applicants are those predicted AAA, forming around 30 per cent of English 18 year old applicants. The proportion of these applicants predicted AAA increased by 2.0 percentage points in 2012 (7 per cent proportionally) continuing a pattern of increasing share over recent cycles. The proportion of applicants predicted AAB was relatively stable at around 13 per cent between the 2009 and 2011 cycles, but increased by 1.2 percentage points in 2012 (a 9 per cent proportional increase in share). The proportions predicted ABB or BBB increased by small amounts, consistent with their changes over recent cycles.
Figure 45 Proportion of English 18 year old applicants by their highest three predicted grades at A level
Prop
ortio
n of
app
lican
ts
0%
10%
20%
30%
40%
2008
2009
2010
2011
2012
AAAAABABBBBB

64
End of Cycle report 2012
Proportion of English 18 year old population applying in 2012 with predicted higher grades was lower
or consistent with recent cycles
Figure 46 shows these same applicants, but this time expressed as the English 18 year old application rate split by predicted attainment. The proportion of English 18 year olds applying to higher education and being predicted AAA increased for the 2012 cycle, but by less than the recent trend. The proportion of the population applying and predicted AAB is consistent with the recent trend. The proportion of English 18 year olds applying and predicted ABB or BBB fell in 2012 in contrast to slight increases for the 2010 and 2011 cycles.
Figure 46 English 18 year old application rates split by the highest three predicted grades at A level
Appl
icat
ion
rate
0%
2%
4%
6%
8%
2008
2009
2010
2011
2012
AAAAABABBBBB

65
End of Cycle report 2012
Attainment relative to predicted grades continued to weaken in 2012
Figure 47 shows the proportion of English 18 year old applicants whose attainment at the end of the cycle placed them within the ‘AAB+’ group by the profile of the A level grades that they were predicted when they applied. Typically, eventual attainment is more likely to be lower than was predicted than higher. This is reflected in the proportions of those predicted the various grade profiles who go on to be awarded grades that would place them within the ‘AAB+’ group. The predicted profiles AAA and AAB would, if fully achieved, be within the ‘AAB+’ list, but only around 80 per cent and 40 per cent respectively do fall within this group when examination results are known. The proportion achieving ‘AAB+’ attainment profiles from those predicted ABB or BBB (which, if achieved, would not be within the ‘AAB+’ group) has been around 14 per cent and 4 per cent respectively, reflecting that attainment of higher than the predicted grades is relatively rare.
The proportion attaining ‘AAB+’ increased for each predicted grade profile in 2010 before falling in 2011. In 2012, the proportion attaining ‘AAB+’ fell again and, in each case, by more than in the 2011 cycle. For English 18 year olds predicted AAB, the proportion attaining ‘AAB+’ fell from 37.1 per cent in 2011 to 32.7 per cent in 2012, a fall of 4.4 percentage points (12 per cent proportionally). For those predicted AAA, the proportion attaining ‘AAB+’ fell from 81.6 per cent to 79.8 per cent, a reduction of 1.8 percentage points (2.2 per cent proportionally).
Figure 47 Proportion of English 18 year old applicants whose attainment is in the ‘AAB+’ grade list by profile of highest three predicted grades at A level
Prop
ortio
n of
app
lican
ts
0%
20%
40%
60%
80%
100%
2008
2009
2010
2011
2012
AAAAABABBBBB

66
End of Cycle report 2012
Acceptance and entry rates by background
Acceptance rates increased for disadvantaged 18 year old applicants in 2012
Figure 48 shows the acceptance rate for UK domiciled 18 year olds by area-based background. The acceptance rate is higher for those from more advantaged groups. The difference between the acceptance rate of applicants from the most and least advantaged groups has ranged from 3 percentage points (in 2008, 2009 and 2012) to 6 percentage points (in 2010 and 2011). The trends for each group are broadly similar in that the acceptance rates were relatively stable between 2004 and 2008, decreased to 2010, and have increased since then though not sufficiently to reach the levels typical in cycles before 2010.
In 2012, the acceptance rates for applicants from the most advantaged areas were 83.0 per cent compared to 79.6 per cent for those from the most disadvantaged areas. The acceptance rates for all groups increased similarly between 2010 and 2011 by around 2 percentage points. The increase in the acceptance rate between 2011 and 2012 has been differentiated by background. The largest increase in the acceptance rate was for applicants from disadvantaged backgrounds where it increased by 2.7 percentage points (3.5 per cent proportionally). Across the background groups, the level of increase declines until, for applicants from the two most advantaged quintiles, there is no increase in the acceptance rate.
Figure 48 UK 18 year old acceptance rates by POLAR2 (POLAR2, quintile 5 (Q5)= highest participation areas)
Acce
ptan
ce ra
te
70%
75%
80%
85%
90%
2004
2005
2006
2007
2008
2009
2010
2011
2012
Q1Q2Q3Q4Q5

67
End of Cycle report 2012
Increase in acceptance rate for disadvantaged driven by those not holding ‘AAB+’ qualifications
Figure 49 splits the acceptance rates of 18 year olds from England by whether they hold qualifications in the ‘AAB+’ list or not (those holding AAB+ are the upper five lines). Within the ‘AAB+’ group, acceptance rates are similar by background and no group shows an increase in 2012. For those not holding ‘AAB+’, there was a marked increase in the acceptance rate for applicants from more disadvantaged areas in 2012.
Figure 49 English 18 year olds, acceptance rates by POLAR2 groups, holding ‘AAB+’ (upper band), not holding ‘AAB+’ (lower band) (POLAR2, quintile 5 (Q5)= highest participation areas)
Acce
ptan
ce ra
te
70%
75%
80%
85%
90%
95%
2008
2009
2010
2011
2012
AAB+ Q1AAB+ Q2AAB+ Q3AAB+ Q4AAB+ Q5Not AAB+ Q1Not AAB+ Q2Not AAB+ Q3Not AAB+ Q4Not AAB+ Q5

68
End of Cycle report 2012
Entry rates for disadvantaged 18 year olds increased across the UK in 2012
Figure 50 shows the proportion of the 18 year old population living in the most disadvantaged areas who are accepted for entry by country. The entry rates for Scotland are low on this measure since not all higher education in Scotland uses UCAS. In all countries, the entry rate for this group has been increasing over the period and all countries show an increase in the entry rate in 2012: England +0.4 percentage points, Northern Ireland +1.3 percentage points, Scotland +0.8 percentage points and Wales +1.4 percentage points. These equate to disadvantaged 18 year olds becoming 3 per cent more likely to enter higher education from England, and around 10 per cent more likely to be accepted from elsewhere in the UK. These increases are a continuation of the trend across the period and 18 year olds in these disadvantaged areas were between 40 per cent and 60 per cent more likely to be accepted for entry to higher education in 2012 than they were in 2004.
Figure 50 18 year old entry rates (cycle) for disadvantaged areas (POLAR2 Q1) by country of domicile (POLAR2, quintile 1 (Q1)= lowest participation areas)
Entry
rate
(cyc
le)
0%
5%
10%
15%
20%
25%
2004
2005
2006
2007
2008
2009
2010
2011
2012
EnglandNorthern IrelandScotlandWales

69
End of Cycle report 2012
Entry rates for advantaged 18 year olds at similar levels to recent cycles
Figure 51 shows the entry rate of 18 year olds from the most advantaged areas by country. The entry rates for Scotland are low on this measure since not all higher education in Scotland uses UCAS. These entry rates are three to four times higher than for the most disadvantaged group but have not shown the same degree of change over the period. The entry rates in 2012 were at similar levels to those seen across the period, and less than 10 per cent different (proportionally) from where they were in 2004.
Between the 2011 and 2012 cycles, the entry rate for the 18 year olds living in advantaged areas increased in Scotland (+1.0, +2.8 per cent) and Wales (+2.1, +5.1 per cent) and decreased in England (-2.2, -4.5 per cent) and Northern Ireland (-1.7, -3.6 per cent). In England the decrease in the entry rate followed a similarly sized increase in the 2011 cycle.
Figure 51 18 year old entry rates (cycle) for advantaged areas (POLAR2 Q5) by country of domicile (POLAR2, quintile 5 (Q5)= highest participation areas)
Entry
rate
(cyc
le)
30%
35%
40%
45%
50%
55%
2004
2005
2006
2007
2008
2009
2010
2011
2012
EnglandNorthern IrelandScotlandWales

70
End of Cycle report 2012
English 18 year olds - entry rates in 2012 consistent with 2006 to 2010 trends for all groups
Figure 52 shows the cycle entry rates for English 18 year olds by area-based background (POLAR2). There is a progression from lower to higher entry rates across the disadvantaged to advantaged groups that is maintained throughout the period. The entry rates for all groups have increased across the period, and there is also a progression in the rate of increase: the highest increases are seen for the most disadvantaged areas, reducing with each group to reach the lowest for the most advantaged areas. This is the case whether the change is considered proportionally or in percentage points.
In the 2011 cycle, the entry rates for all groups increased by a similar amount proportionally (6 to 8 per cent) that is generally larger than the annual increase seen since 2006. This is similar to the increase in the English 18 year old entry rate for this cycle, with the above-trend component attributable to increases in the acceptance rate of applicants in the cycle. In the 2012 cycle, the changes in the entry rates show a progression from a decrease for the more advantaged groups (-5 per cent proportionally) to an increase for the most disadvantaged group (+3 per cent proportionally). For all groups the 2012 entry rate is above that seen in all previous cycles except 2011, and within a small margin of an extrapolation of the rate of increase that was typical between the 2006 and 2010 cycles. This can be seen in Figure 53 where the cycle entry rates are shown against a logarithmic axis (so that the proportional changes are clearer) together with an extrapolation of the trend between the 2006 and 2010 cycles.

71
End of Cycle report 2012
Entry
rate
(cyc
le)
10%
20%
30%
40%
50%
60%
2004
2005
2006
2007
2008
2009
2010
2011
2012
Figure 52 18 year olds in England, entry rates (cycle) by POLAR2 groups (POLAR2, quintile 5 (Q5)= highest participation areas)
Figure 53 18 year olds in England, entry rates (cycle) by POLAR2 groups (logarithmic scale) with extrapolation of 2006 to 2010 trend (POLAR2, quintile 5 (Q5)= highest participation areas)
Entry
rate
(cyc
le)
0%
10%
20%
30%
40%
50%
2004
2005
2006
2007
2008
2009
2010
2011
2012
Q1Q2Q3Q4Q5
Entry
rate
(cyc
le)
0%
10%
20%
30%
40%
50%
2004
2005
2006
2007
2008
2009
2010
2011
2012
Q1Q2Q3Q4Q5

72
End of Cycle report 2012
English 18 year olds - effect of deferred entry changes in 2011 greatest for advantaged groups
Figure 54 shows the proportion of the 18 year old English population in each background group who were accepted for entry into the academic year starting in the year shown. The pattern of differentiated entry rates and rates of increase by background are similar to the cycle entry rate. There are a higher proportion of acceptances for deferred entry at age 19 (which are not included in this measure) from more advantaged groups compared to more disadvantaged groups. One consequence of this is that the sharp reduction in deferred entry in the 2011 cycle for English 18 year olds acts to increase the entry rate into the 2011-12 academic year more for those from advantaged backgrounds.
For example, 18 year olds from the most advantaged group were 17 per cent more likely to enter higher education aged 18 in the 2011-12 academic year than in the previous year. This pattern of elevated increases in the academic year 2011-12 is paired with sharper declines (10 per cent proportionally) for 2012-13, as the proportion of deferred acceptances increased again to more typical levels. The entry rates for each group in 2012 remained higher than for any year prior to 2011, and are (for each group) at levels similar to those that would be expected if entry rate trends between 2006 and 2010 had continued.
Figure 54 18 year olds in England, entry rates (academic year) by POLAR2 groups (POLAR2, quintile 5 (Q5)= highest participation areas)
Entry
rate
(aca
dem
ic y
ear)
0%
10%
20%
30%
40%
50%
2004
2005
2006
2007
2008
2009
2010
2011
2012
Q1Q2Q3Q4Q5

73
End of Cycle report 2012
Cohort young entry rates for those aged 18 in 2011 increased for disadvantaged and were unchanged
for advantaged
Figure 55 reports cohort entry rates for English young people by area-based background. This measure combines the proportion of the population accepted for entry at age 18 with the proportion of the same population accepted for entry at age 19 a year later. As such, it gives a representation of the total proportion of a young cohort that has been accepted for entry into higher education by age 19. It is therefore unaffected by people switching their age of entry between age 18 and age 19; as happened with recent changes in deferred entry and acceptance rates for 18 year olds (which deplete the cohort of potential acceptances at age 19).
The entry rates are higher on this cohort measure than for entry at age 18 alone. For 18 year olds in 2011 living in the most advantaged areas, 62.5 per cent were accepted for entry aged either 18 in 2011 or 19 in 2012. This entry rate is similar for the cohort that reached age 18 in 2010, showing that the elevated rate of entry aged 18 in 2011 (from both the increase in the acceptance rate and the reduction in the deferred entry rate) is offset by a lower entry rate from 19 year olds in 2012. Between 2006 and 2010, the cohort entry rate typically increased by around 1 percentage point a year.
For the young cohort that was aged 18 in 2011 living in disadvantaged areas, 21.7 per cent were accepted for entry age (either) 18 in 2011 or 19 in 2012. This is an increase of 0.8 percentage points (3.8 per cent proportionally) on the previous cohort.
Figure 55 Young cohort entry rates (aged 18 or 19 on entry) by POLAR2 groups for England (POLAR2, quintile 5 (Q5)= highest participation areas)
Entry
rate
(coh
ort)
10%
20%
30%
40%
50%
60%
70%
Year aged 182005 2006 2007 2008 2009 2010 2011 2012
Q1Q2Q3Q4Q5

74
End of Cycle report 2012
Entry rates to higher tariff institutions for disadvantaged 18 year olds at highs in 2012
Figure 56 shows the proportion of 18 year olds living in disadvantaged areas across the UK who were accepted for entry into a higher tariff institution. These entry rates were relatively low, typically between 1 and 3 per cent of the age group and, for the smaller countries, show a high degree of cycle-to-cycle proportional variation (reflecting the small population and acceptance base). The entry rate to higher tariff institutions for disadvantaged 18 year olds increased for all countries in the 2012 cycle and, in all cases, takes the entry rate to a level similar to or higher than any other cycle in the period. The increase in Northern Ireland, Scotland and Wales is within the range of cycle-to-cycle increases seen in the period. In England the entry rate increased by 0.3 percentage points, to 2.6 per cent, an 11 per cent increase in the proportion of the disadvantaged 18 year old population entering higher tariff institutions, the largest increase in the period.
Figure 56 18 year olds cycle entry rates to higher tariff institutions for disadvantaged areas (POLAR2 Q1) by country (POLAR2, quintile 5 (Q5)= highest participation areas)
Entry
rate
(cyc
le)
0%
1%
2%
3%
4%
5%
2004
2005
2006
2007
2008
2009
2010
2011
2012
EnglandNorthern IrelandScotlandWales

75
End of Cycle report 2012
Entry rates to higher tariff institutions for advantaged areas increased in England and Wales
Entry rates to higher tariff institutions for 18 year olds in advantaged areas are typically between six to nine times greater than in disadvantaged areas. Across the 2006 to 2011 cycles, the entry rates have been relatively constant in England and Northern Ireland and decreasing in Scotland and Wales. In the 2012 cycle, the entry rate increased in England (to 21.0%, +1.6 percentage points, +8% proportionally) and Wales (to 16.9 per cent, +1.8 percentage points, +12 per cent proportionally), substantially the largest annual increases in the period and, for England, the highest entry rate in the period (Figure 57).
Figure 57 18 year olds cycle entry rates to higher tariff institutions for advantaged areas (POLAR2 Q5) by country (POLAR2, quintile 5 (Q5)= highest participation areas)
Entry
rate
(cyc
le)
5%
10%
15%
20%
25%
30%
2004
2005
2006
2007
2008
2009
2010
2011
2012
EnglandNorthern IrelandScotlandWales
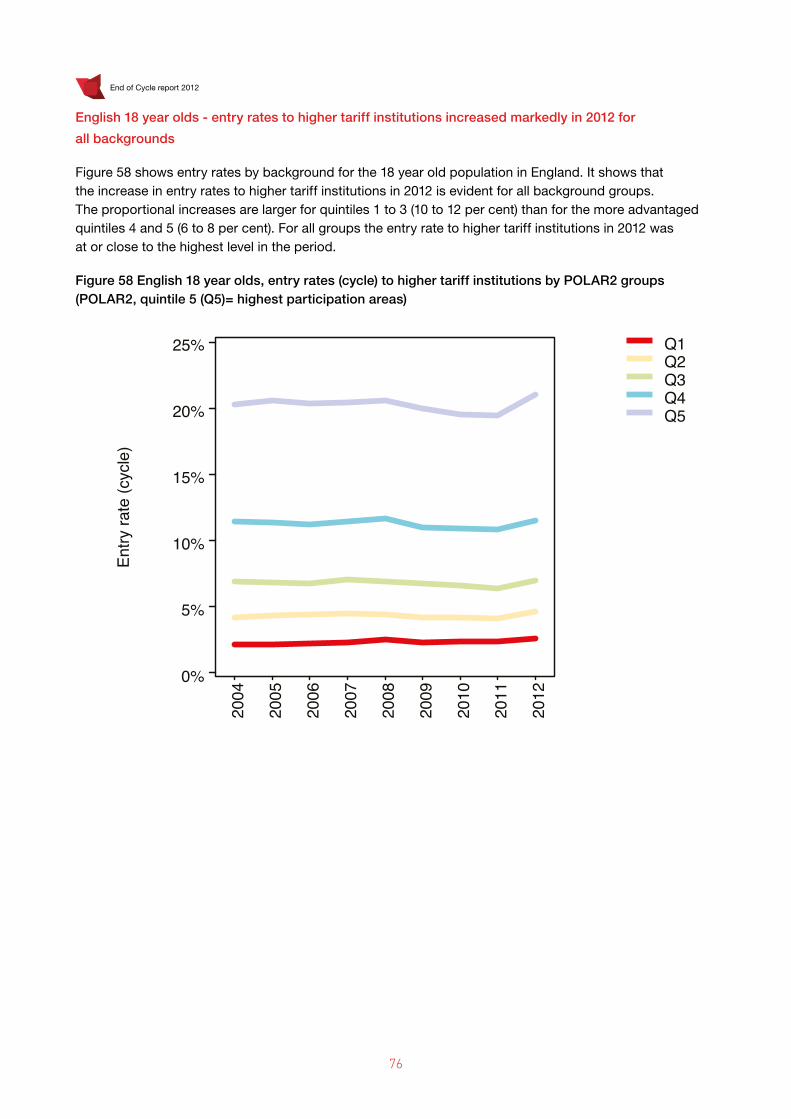
76
End of Cycle report 2012
English 18 year olds - entry rates to higher tariff institutions increased markedly in 2012 for
all backgrounds
Figure 58 shows entry rates by background for the 18 year old population in England. It shows that the increase in entry rates to higher tariff institutions in 2012 is evident for all background groups. The proportional increases are larger for quintiles 1 to 3 (10 to 12 per cent) than for the more advantaged quintiles 4 and 5 (6 to 8 per cent). For all groups the entry rate to higher tariff institutions in 2012 was at or close to the highest level in the period.
Figure 58 English 18 year olds, entry rates (cycle) to higher tariff institutions by POLAR2 groups (POLAR2, quintile 5 (Q5)= highest participation areas)
Entry
rate
(cyc
le)
0%
5%
10%
15%
20%
25%
2004
2005
2006
2007
2008
2009
2010
2011
2012
Q1Q2Q3Q4Q5

77
End of Cycle report 2012
Receiving free school meals as a proxy for income background for those from state schools in England
For pupils attending state schools in England, administrative datasets record whether an individual is receiving free school meals, which as a means-tested benefit can be used as an indicator of a low income background. Linking these pupil datasets (source: National Pupil Database, Department for Education) to the UCAS admissions data allows the calculation of statistics by whether the applicant was in receipt of free school meals when they were aged 15. To calculate these statistics a conservative linking method that requires a full match across a range of identifying details has been used. This necessarily makes the entry rate lower than the true value (since ambiguous matches are not used) and introduces less certainty into the trends than the other methods used in this report that do not rely on record matching.
Acceptance rates for those receiving free school meals increased in 2012
Figure 59 shows the acceptance rate of applicants who were matched back to pupils aged 15 in state schools in England split by whether they were in receipt of free school meals or not at that age. The acceptance rate for those who were in receipt of free school meals is 3 to 4 percentage points lower than for those who were not in receipt; and they show similar trends over the period. In the 2012 cycle, the acceptance rate for those who were in receipt of free school meals increased by 1.7 percentage points, twice the increase for those who were not in receipt of free school meals. However, since there are relatively few applicants who were in receipt of free school meals, this additional increase in the acceptance rate (additional compared to those who were not in receipt of free school meals) represents only around 100 additional acceptances.
Figure 59 Acceptance rates for English state school pupils by free school meal (FSM) status at age 15
Acce
ptan
ce ra
te
75%
80%
85%
90%
2004
2005
2006
2007
2008
2009
2010
2011
2012
Not receiving FSMReceiving FSM

78
End of Cycle report 2012
Entry rates increased in 2012 for free school meals population, decreased for others, both rates
consistent with recent trends
The application rate for applicants not in receipt of free schools meals has been substantially higher than that for others for the whole period, generally over twice as high. The application rates for those receiving free school meals remained constant in 2012, compared to a small reduction in the application rate for other pupils. Acceptance rates are lower for those in receipt of free school meals, however in 2012 the acceptance rate for these applicants increased by more than double the change in the acceptance rate for other pupils.
The combination of the unchanged application rate and the increased acceptance rate for those in receipt of free school meals means that the cycle entry rate for this group in 2012 increased slightly to 11.1 per cent (+0.3 percentage points, +3.0 per cent proportional change), compared with other pupils where the cycle entry rate in 2012 decreased slightly to 25.9 per cent (-0.2 percentage points, -0.8 per cent proportional change). In 2012, those not in receipt of free school meals were 2.3 times more likely to be accepted to enter higher education than those in receipt of free school meals, compared with 2.9 times more likely in 2006 – following a steady and gradual decrease over the period (Figure 60).
Figure 60 Application and entry rates for state school pupils by free school meal (FSM) status at age 15
Appl
icat
ion
/ ent
ry ra
te (c
ycle
)
0%
10%
20%
30%
40%
2004
2005
2006
2007
2008
2009
2010
2011
2012
Application: FSMApplication: Not FSMEntry: FSMEntry: Not FSM

79
End of Cycle report 2012
Application, acceptance and entry rates by sex
Figure 61 shows the application rates and entry rates (cycle) for UK domiciled 18 year old men and women from the UK. Figure 62 shows the proportion of applicants accepted (the acceptance rate) by sex.
The application rate for women has been substantially higher than that for men for the whole period. The application rate for men in 2012 remains below the level that women were at in 2004. The application rates of each sex decreased in 2012 but the decrease for men was about twice that of women. In 2012, 18 year old women were over a third more likely to apply than 18 year old men, higher than the past two cycles but similar to 2009. Acceptance rates are higher for men than for women but by a relatively small margin so that the trends in entry rates are similar to those for application rates. The acceptance rate for women increased in 2012 by more than that for men so that the fall in the entry rate for men in 2012 was proportionally, four times greater than for women.
The application rate for young men was 25.4 per cent in 2006 and then increased each cycle to 31.0 per cent in 2011, before decreasing by 1.0 percentage points (3.3 per cent proportionally) in 2012. The application rate for women was 33.4 per cent in 2006, increasing to 40.7 per cent in 2011. It then decreased by 0.6 percentage points (1.6 per cent proportionally) in 2012. 18 year old women in 2012 were 34 per cent more likely to apply to higher education than young men, an absolute difference in application rates of 10.1 percentage points. This is an increase from young women being 31 per cent more likely to apply in 2011 (9.7 percentage point difference between men and women).
Figure 61 UK domiciled 18 year olds, application and entry rates by sex
Appl
icat
ion
/ ent
ry ra
te (c
ycle
)
15%
20%
25%
30%
35%
40%
45%
2004
2005
2006
2007
2008
2009
2010
2011
2012
Application: MenApplication: WomenEntry: MenEntry: Women

80
End of Cycle report 2012
Acceptance rates for men were higher than those for women, but this difference is relatively small (ranging from 0.6 to 2.1 percentage points over the period, 0.8 percentage points in 2012). The acceptance rate for men in 2012 increased by 0.4 percentage points to 81.9 percent, for women it increased by twice as much, 0.8 percentage points to 81.1 per cent.
Figure 62 UK domiciled 18 year olds, acceptance rates by sex
18 year old women were a third more likely to enter higher education than men in 2012
The entry rate for 18 year old men increased from 21.7 per cent in 2006 to 25.3 per cent in 2011. It decreased by 0.7 percentage points (2.8 per cent proportionally) in 2012 to 24.6 per cent. For women, the entry rate increased from 28 per cent in 2006 to 32.7 per cent in 2011. It then decreased by 0.2 percentage points (0.6 per cent proportionally) to 32.5 per cent in 2012. 18 year old women were 32 per cent more likely (7.9 percentage points) to be accepted for entry into higher education in 2012 than 18 year old men, higher than in the 2011 and 2010 cycles but similar to the 2009 cycle.
The application rate for 18 year old men remains below the entry rate for women throughout the period. That is, if the acceptance rate for men was 100 per cent, the resulting entry rate for men would still be below that of women.
Acce
ptan
ce ra
te
70%
75%
80%
85%
90%
95%
2004
2005
2006
2007
2008
2009
2010
2011
2012
MenWomen

81
End of Cycle report 2012
Entry rates to higher tariff institutions greater for women than men, both increased in 2012
Figure 63 shows the entry rate of UK 18 year olds to higher tariff institutions by cycle. Between the 2004 and 2011 cycles around 8 per cent of men and 10 per cent of women were accepted to entry at a higher tariff institution with no strong trend. In the 2011 cycle 7.7 per cent of men and 9.4 per cent of women were accepted to a higher tariff institution, a little less than in 2004 (8.3 and 9.8 per cent respectively).
In the 2012 cycle the entry rate of men to higher tariff institutions increased by 0.5 percentage points to 8.3 per cent and for women by 0.9 percentage points to 10.3 per cent. This is a proportional increase in the entry rate to these institutions of 7 per cent for men and 10 per cent for women, some five times larger than any other increase in the period and taking the entry rates for both sexes into higher tariff institutions to highs for the period. The larger increase for women makes them 24 per cent more likely to enter higher tariff institutions than men, an increase from 22 per cent in 2011.
Figure 63 UK 18 year olds entry rates to higher tariff institutions by sex
Entry
rate
(cyc
le)
0%
3%
6%
9%
12%
15%
2004
2005
2006
2007
2008
2009
2010
2011
2012
MenWomen

82
End of Cycle report 2012
Unp
lace
d ra
te
0%
5%
10%
15%
20%
25%
2004
2005
2006
2007
2008
2009
2010
2011
2012
Excluding withdrawnIncluding withdrawn
Unplaced applicants
Unplaced rate for UK 18 year olds continues to decrease in 2012
At the end of each cycle there are applicants that have not been accepted for higher education, these applicants are the unplaced. A relatively small proportion of these, typically 15 to 20 per cent, will have withdrawn their application during the course of the cycle. The unplaced rate is the percentage of all applicants that are unplaced at the end of the cycle (and is therefore the counterpart of the acceptance rate).
Figure 64 shows the proportion of UK 18 year old applicants in two forms, including and excluding withdrawn applicants by cycle. The unplaced rate increased in 2010 as the number of applicants rose more quickly than the number of acceptances. In 2011, the number of applicants was similar, acceptances increased and the unplaced rate for UK 18 year olds decreased, as a greater proportion were successful in securing places. In 2012, the number of UK 18 year old applicants decreased to around the same level as 2009, however the unplaced rate still remains higher than at that point.
Applicants who have withdrawn before the end of the cycle can be viewed as different from the rest of the unplaced because they have explicitly indicated that they are not seeking UK higher education at this time. By removing this group we achieve a more accurate measure of unsatisfied demand, but inevitably some applicants who are not seeking places will still be included. This unplaced rate excluding those who have withdrawn, largely follows the same pattern as the unplaced rate including those who have withdrawn; around 3 percentage points lower each year. In 2011, the difference between the two rates decreased slightly as there were slightly fewer withdrawn applicants. The withdrawn rate in the 2012 cycle has returned to the level seen in cycles prior to 2011.
Figure 64 UK 18 year olds unplaced rates including and excluding withdrawn applicants

83
End of Cycle report 2012
Withdrawn unplaced applicants more highly qualified than other unplaced applicants
Figure 65 shows the proportion of different groups of applicants holding qualifications in the ‘AAB+’ group, the ‘AAB+’ rate. More than a third of applicants accepted to their firm choice are ‘AAB+’ making them the most highly qualified group. The proportion of firm choice accepted applicants who hold ‘AAB+’ has increased over recent cycles and reached a peak of 41.1 per cent in 2011, dropping slightly to 40.0 per cent in 2012. The next most qualified group are the small (around 3 per cent of all applicants) withdrawn group, within which around 30 per cent are ‘AAB+’. This group are relatively highly qualified, and the level of qualification has changed little in the most recent five cycles. The unplaced applicants that are not withdrawn have similar, relatively low (around 10 per cent), ‘AAB+’ rates as those placed at their insurance choice and those placed at an institution that was not firm or insurance choice at 30 June. The ‘AAB+’ rate of those placed at an institution that was not a firm or insurance choice at 30 June has been increasing steadily over recent cycles, so that the increase in 2012 was no more than a continuation of the recent trend.
Figure 65 UK 18 year olds percentage of applicants that are ‘AAB+’ by applicant acceptance route
‘AAB
+’ ra
te
0%
10%
20%
30%
40%
50%
2008
2009
2010
2011
2012
FirmInsuranceOther placedUnplacedWithdrawn

84
End of Cycle report 2012
Proportion of applicants declining offers citing academic reputation continued to increase
As soon as an applicant has made all of the decisions associated with their main scheme choices, they are asked to complete a short online questionnaire about the reasons for their decisions. For each offer that they have declined they are asked to select the three main reasons for the decision from a supplied list, with the opportunity to add additional reasons as free text. These options and the question asked have remained the same over the four most recent cycles, 2009 to 2012. Typically around 12,000 UK 18 and 19 year olds complete the survey.
Figure 66 shows the percentage of decisions where each reason has been selected, weighted to applicant level and to reflect the profile of the 18 and 19 year old UK applicant population. Over all four cycles, the most dominant reason cited is course content, and the second most dominant reason is the distance from home. Over the 2011 and 2012 cycles the academic reputation of the institution has increased in importance. Selected less frequently, but also increasing in the 2011 and 2012 cycles are the employment prospects associated with the course.
Figure 67 shows the responses from the applicants that were unplaced at the end of the cycle (around 5 per cent of the respondents to the track survey in each year). Whereas course content and distance from home are also the two most frequently cited reasons for declining offers for this group, distance from home has become more important and course content less important over the period. Academic reputation of the institution has been steadily more likely to be cited as a reason for declining an offer amongst this group, and is now the third most dominant reason, whilst unrealistic entry requirements although highly important in 2009 and 2010 has decreased in importance in 2011 and 2012.
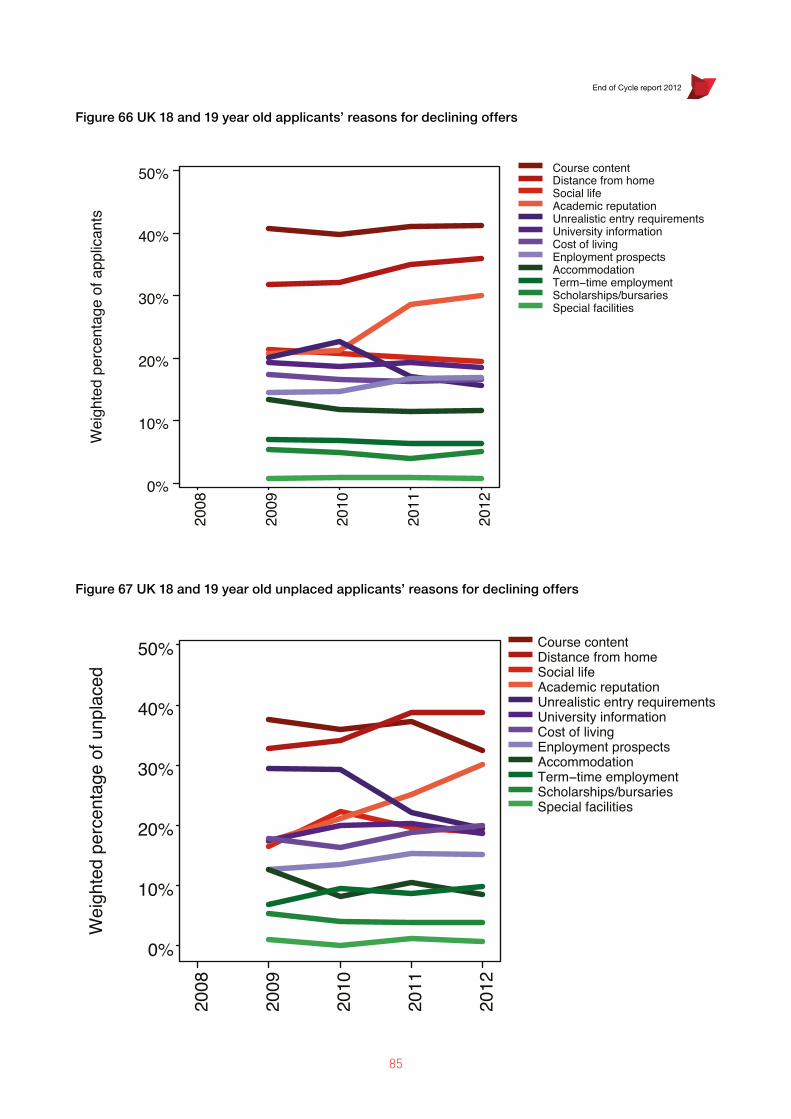
85
End of Cycle report 2012
Figure 66 UK 18 and 19 year old applicants’ reasons for declining offers
Figure 67 UK 18 and 19 year old unplaced applicants’ reasons for declining offers
Wei
ghte
d pe
rcen
tage
of a
pplic
ants
0%
10%
20%
30%
40%
50%20
08
2009
2010
2011
2012
Course contentDistance from homeSocial lifeAcademic reputationUnrealistic entry requirementsUniversity informationCost of livingEnployment prospectsAccommodationTerm−time employmentScholarships/bursariesSpecial facilities
Wei
ghte
d pe
rcen
tage
of u
npla
ced
0%
10%
20%
30%
40%
50%
2008
2009
2010
2011
2012
Course contentDistance from homeSocial lifeAcademic reputationUnrealistic entry requirementsUniversity informationCost of livingEnployment prospectsAccommodationTerm−time employmentScholarships/bursariesSpecial facilities

86
End of Cycle report 2012

87
End of Cycle report 2012
Section 3Reference tables

88
End of Cycle report 2012
Reference tables
90 Applicants and acceptances
Table 1a: Applicants and acceptances for full-time undergraduate courses at UK higher education institutions (2006-2012)
Table 1b: Cycle-to-cycle change of applicants and acceptances for full-time undergraduate courses at UK higher education institutions (2007-2012)
Table 1c: Applicants and acceptances (2006-2012) – diagramTable 2a: Application route (2006-2012)Table 2b: Cycle-to-cycle change of application route (2007-2012)Table 2c: Application route (2006-2012) – diagramTable 3a: Acceptance route (2006-2012)Table 3b: Cycle-to-cycle change of acceptance route (2007-2012)Table 3c: Acceptance route (2006-2012) – diagram
93 Age group
Table 4a: Applicants by age group (2006-2012)Table 4b: Cycle-to-cycle change of applicants by age group (2007-2012)Table 5a: Acceptances by age group (2006-2012)Table 5b: Cycle-to-cycle change of acceptances by age group (2007-2012)Table 6: Acceptance rate by age group (2006-2012)
95 Sex
Table 7a: Acceptances by sex (2006-2012)Table 7b: Cycle-to-cycle change of acceptances by sex (2007-2012)
96 Ethnicity
Table 8a: Acceptances by ethnicity (UK-domiciled only, 2006-2012)Table 8b: Cycle-to-cycle change of acceptances by ethnicity (UK domiciled only, 2007-2012)
97 Domicile
Table 9a: Applicants, acceptances and acceptance rate by domicile (2006-2012)Table 9b: Cycle-to-cycle change of applicants and acceptances by domicile (2007-2012)Table 10a: Applicants, acceptances and acceptance rate by country (UK domiciled only, 2006-2012) Table 10b: Cycle-to-cycle change of applicants and acceptances by country (UK domiciled only, 2007-
2012)
99 Institution country
Table 11a: Acceptances by institution country (2006-2012)Table 11b: Cycle-to-cycle change of acceptances by institution country (2007-2012)Table 12a: Acceptances by institution country (UK domiciled only, 2006-2012)Table 12b: Cycle-to-cycle change of acceptances by institution country (UK domiciled only, 2007-2012)

89
End of Cycle report 2012
101 Institution grouping
Table 13a: Acceptances by institution tariff grouping (2006-2012)Table 13b: Cycle-to-cycle change of acceptances by institution tariff grouping (2007-2012)Table 14a: Acceptances by acceptance route and institution tariff grouping (2006-2012)Table 14b: Cycle-to-cycle change of acceptances by acceptance route and institution tariff grouping
(2007-2012)
103 Educational establishment
Table 15a: Applicants by educational establishment (UK domiciled only, aged 19 and under, 2006-2012)Table 15b: Cycle-to-cycle change of applicants by educational establishment (UK domiciled only, aged
19 and under, 2007-2012)Table 16a: Acceptances by educational establishment (UK domiciled only, aged 19 and under, 2006-
2012)Table 16b: Cycle-to-cycle change of acceptances by educational establishment (UK domiciled only, aged
19 and under, 2007-2012)Table 17: Acceptance rate by educational establishment (UK domiciled only, aged 19 and under, 2006-
2012)Table 18a: Acceptances by educational establishment and institution tariff grouping (UK domiciled only,
aged 19 and under, 2006-2012)Table 18b: Cycle-to-cycle change of acceptances by educational establishment and institution tariff
grouping (UK domiciled only, aged 19 and under, 2007-2012)
107 Distance
Table 19a: Acceptances by distance (UK domiciled only, 2006-2012)Table 19b: Cycle-to-cycle change of acceptances by distance (UK domiciled only, 2007-2012)Table 19c: Acceptances by distance (UK domiciled only, 2006-2012) – diagram
109 POLAR2
Table 20a: Acceptances by POLAR2 quintile (UK domiciled only, aged 19 and under, 2006-2012)Table 20b: Cycle-to-cycle change of acceptances by POLAR2 quintile (UK domiciled only, aged 19 and
under, 2007-2012)
110 JACS3 subject group
Table 21: Acceptances by JACS3 subject group and educational establishment (UK domiciled only, aged 19 and under, 2012)
Table 22: Clearing acceptances by JACS3 subject group (2011-2012)

90
End of Cycle report 2012
2006 2007 2008 2009 2010 2011 2012
Total applicants 506,304 534,495 588,689 639,860 697,351 700,161 653,637
Total accepted applicants 390,890 413,430 456,627 481,854 487,329 492,030 464,910
Total unplaced applicants 115,414 121,065 132,062 158,006 210,022 208,131 188,727
Acceptance rate 77.2% 77.3% 77.6% 75.3% 69.9% 70.3% 71.1%
Average number of choices per applicant 4.4 4.4 3.7 3.7 3.9 4.1 4.0
Number of institutions with UCAS membership receiving applications
327 322 306 304 305 304 324
Table 1a:Applicants and acceptances for full-time undergraduate courses at UK higher education institutions (2006-2012)
2006 2007 2008 2009 2010 2011 2012
Total applicants - +5.6 % +10.1 % +8.7 % +9.0 % +0.4 % -6.6 %
Total accepted applicants - +5.8 % +10.4 % +5.5 % +1.1 % +1.0 % -5.5 %
Total unplaced applicants - +4.9 % +9.1 % +19.6 % +32.9 % -0.9 % -9.3 %
Table 1b:Cycle-to-cycle change of applicants and acceptances for full-time undergraduate courses at UK higher education institutions (2007-2012)
Table 1c:Applicants and acceptances (2006-2012) - diagram
Num
ber o
f app
lican
ts/a
ccep
ted
appl
ican
ts
0
200,000
400,000
600,000
800,000
2006
2007
2008
2009
2010
2011
2012
Perc
enta
ge o
f app
lican
ts
65%
70%
75%
80%
85%AcceptancesApplicants
Acceptance rate
Applicants and acceptances

91
End of Cycle report 2012
2006 2007 2008 2009 2010 2011 2012
Main scheme 466,598 492,136 537,494 589,473 657,953 667,952 616,521
Directly into Clearing 14,683 14,785 17,802 20,686 15,765 16,396 18,765
Record of Prior Acceptance 25,023 27,574 33,393 29,701 23,633 15,813 18,351
Total 506,304 534,495 588,689 639,860 697,351 700,161 653,637
Table 2a:Application route (2006-2012)
2006 2007 2008 2009 2010 2011 2012
Main scheme - +5.5 % +9.2 % +9.7 % +11.6 % +1.5 % -7.7 %
Directly into Clearing - +0.7 % +20.4 % +16.2 % -23.8 % +4.0 % +14.4 %
Record of Prior Acceptance - +10.2 % +21.1 % -11.1 % -20.4 % -33.1 % +16.1 %
Total - +5.6 % +10.1 % +8.7 % +9.0 % +0.4 % -6.6 %
Table 2b:Cycle-to-cycle change of application route (2007-2012)
Table 2c:Application route (2006-2012) - diagram
Num
ber o
f app
lican
ts
0
200,000
400,000
600,000
800,000
2006
2007
2008
2009
2010
2011
2012
0
10,000
20,000
30,000
40,000Main scheme
Directly into ClearingRecord of Prior Acceptance

92
End of Cycle report 2012
2006 2007 2008 2009 2010 2011 2012
Main scheme 325,072 343,833 375,105 399,283 409,994 415,340 382,535
Extra 3,262 3,767 5,327 5,619 7,018 9,537 7,859
Adjustment(1) - - - 382 377 552 1,329
Clearing 38,032 38,858 43,890 47,673 46,925 51,169 55,721
Record of Prior Acceptance 24,524 26,972 32,305 28,897 23,015 15,432 17,466
Total 390,890 413,430 456,627 481,854 487,329 492,030 464,910
Table 3a:Acceptance route (2006-2012)
2006 2007 2008 2009 2010 2011 2012
Main scheme - +5.8 % +9.1 % +6.4 % +2.7 % +1.3 % -7.9 %
Extra - +15.5 % +41.4 % +5.5 % +24.9 % +35.9 % -17.6 %
Adjustment(1) - - - - -1.3 % +46.4 % +140.8 %
Clearing - +2.2 % +12.9 % +8.6 % -1.6 % +9.0 % +8.9 %
Record of Prior Acceptance - +10.0 % +19.8 % -10.5 % -20.4 % -32.9 % +13.2 %
Total - +5.8 % +10.4 % +5.5 % +1.1 % +1.0 % -5.5 %
Table 3b:Cycle-to-cycle change of acceptance route (2007-2012)
Table 3c:Acceptance route (2006-2012) - diagram
(1) Adjustment has only been available since 2009.
Num
ber o
f acc
epte
d ap
plic
ants
0
100,000
200,000
300,000
400,000
500,000
2006
2007
2008
2009
2010
2011
2012
0
20,000
40,000
60,000
80,000
100,000Main scheme
AdjustmentClearingExtraRPA

93
End of Cycle report 2012
Age group
2006 2007 2008 2009 2010 2011 2012
Under 18 7,815 8,505 8,826 9,291 9,502 9,492 9,922
18 248,273 251,772 266,551 282,034 299,315 300,204 293,233
19 84,439 100,848 109,942 119,846 133,283 139,973 122,556
20 39,027 42,257 50,186 54,396 59,668 60,166 55,120
21 to 24 63,763 67,505 76,511 85,776 95,370 94,293 85,005
25 to 39 50,949 51,344 61,242 69,944 79,700 76,736 69,857
40 and over 12,038 12,264 15,431 18,573 20,513 19,297 17,944
Total 506,304 534,495 588,689 639,860 697,351 700,161 653,637
Table 4a:Applicants by age group (2006-2012)
2006 2007 2008 2009 2010 2011 2012
Under 18 - +8.8 % +3.8 % +5.3 % +2.3 % -0.1 % +4.5 %
18 - +1.4 % +5.9 % +5.8 % +6.1 % +0.3 % -2.3 %
19 - +19.4 % +9.0 % +9.0 % +11.2 % +5.0 % -12.4 %
20 - +8.3 % +18.8 % +8.4 % +9.7 % +0.8 % -8.4 %
21 to 24 - +5.9 % +13.3 % +12.1 % +11.2 % -1.1 % -9.9 %
25 to 39 - +0.8 % +19.3 % +14.2 % +13.9 % -3.7 % -9.0 %
40 and over - +1.9 % +25.8 % +20.4 % +10.4 % -5.9 % -7.0 %
Total - +5.6 % +10.1 % +8.7 % +9.0 % +0.4 % -6.6 %
Table 4b:Cycle-to-cycle change of applicants by age group (2007-2012)

94
End of Cycle report 2012
2006 2007 2008 2009 2010 2011 2012
Under 18 60.3% 60.0% 59.5% 57.6% 51.8% 50.4% 50.5%
18 82.7% 82.2% 82.8% 81.1% 76.5% 78.1% 78.3%
19 79.9% 80.4% 80.6% 79.2% 75.2% 75.1% 75.4%
20 74.8% 75.1% 75.6% 73.1% 68.3% 67.7% 69.1%
21 to 24 68.2% 68.9% 69.4% 67.0% 60.7% 59.8% 60.6%
25 to 39 63.9% 65.2% 66.0% 62.3% 54.3% 52.6% 54.6%
40 and over 67.5% 69.4% 69.2% 64.4% 55.3% 53.0% 56.1%
Total 77.2% 77.3% 77.6% 75.3% 69.9% 70.3% 71.1%
Table 6:Acceptance rate by age group (2006-2012)
2006 2007 2008 2009 2010 2011 2012
Under 18 4,716 5,104 5,249 5,347 4,921 4,782 5,014
18 205,400 207,047 220,660 228,829 228,947 234,499 229,664
19 67,445 81,097 88,633 94,934 100,200 105,078 92,417
20 29,206 31,722 37,939 39,751 40,741 40,721 38,093
21 to 24 43,461 46,478 53,080 57,428 57,852 56,370 51,534
25 to 39 32,535 33,468 40,390 43,595 43,315 40,362 38,124
40 and over 8,127 8,514 10,676 11,970 11,353 10,218 10,064
Total 390,890 413,430 456,627 481,854 487,329 492,030 464,910
Table 5a:Acceptances by age group (2006-2012)
2006 2007 2008 2009 2010 2011 2012
Under 18 - +8.2 % +2.8 % +1.9 % -8.0 % -2.8 % +4.9 %
18 - +0.8 % +6.6 % +3.7 % +0.1 % +2.4 % -2.1 %
19 - +20.2 % +9.3 % +7.1 % +5.5 % +4.9 % -12.0 %
20 - +8.6 % +19.6 % +4.8 % +2.5 % -0.0 % -6.5 %
21 to 24 - +6.9 % +14.2 % +8.2 % +0.7 % -2.6 % -8.6 %
25 to 39 - +2.9 % +20.7 % +7.9 % -0.6 % -6.8 % -5.5 %
40 and over - +4.8 % +25.4 % +12.1 % -5.2 % -10.0 % -1.5 %
Total - +5.8 % +10.4 % +5.5 % +1.1 % +1.0 % -5.5 %
Table 5b:Cycle-to-cycle change of acceptances by age group (2007-2012)

95
End of Cycle report 2012
Sex
2006 2007 2008 2009 2010 2011 2012
Men 180,556 189,685 204,695 218,185 220,085 221,876 208,287
Women 210,334 223,745 251,932 263,669 267,244 270,154 256,623
Total 390,890 413,430 456,627 481,854 487,329 492,030 464,910
Table 7a:Acceptances by sex (2006-2012)
2006 2007 2008 2009 2010 2011 2012
Men - +5.1 % +7.9 % +6.6 % +0.9 % +0.8 % -6.1 %
Women - +6.4 % +12.6 % +4.7 % +1.4 % +1.1 % -5.0 %
Total - +5.8 % +10.4 % +5.5 % +1.1 % +1.0 % -5.5 %
Table 7b:Cycle-to-cycle change of acceptances by sex (2007-2012)

96
End of Cycle report 2012
2006 2007 2008 2009 2010 2011 2012
Asian - Bangladeshi 3,147 3,249 3,705 4,040 4,308 4,685 4,821
Asian - Chinese 3,311 3,496 3,617 3,434 3,472 3,605 3,328
Asian - Indian 14,066 13,815 14,256 14,723 14,388 14,906 14,070
Asian - other Asian background 4,015 4,231 5,311 5,939 6,661 7,305 7,068
Asian - Pakistani 9,012 9,283 10,397 11,033 11,908 12,710 13,274
Black - African 10,973 12,556 15,809 17,643 19,247 21,427 22,665
Black - Caribbean 4,725 4,982 5,982 6,383 6,683 6,914 6,587
Black - other black background 1,110 1,156 1,223 1,218 1,232 1,347 1,542
Mixed - other mixed background 3,016 3,367 3,691 3,866 4,065 4,410 4,181
Mixed - White and Asian 3,045 3,468 3,858 4,094 4,492 4,823 4,631
Mixed - White and Black African 1,053 1,175 1,325 1,601 1,556 1,852 1,826
Mixed - White and Black Caribbean 2,171 2,705 3,265 3,746 4,072 4,409 4,183
Other ethnic background 3,541 3,869 3,878 4,056 4,419 4,709 5,901
Unknown 19,872 19,425 22,664 17,052 6,640 4,935 4,769
White 262,507 277,767 306,043 326,235 331,491 333,198 308,545
Total 345,564 364,544 405,024 425,063 424,634 431,235 407,391
Table 8a:Acceptances by ethnicity (UK domiciled only, 2006-2012)
2006 2007 2008 2009 2010 2011 2012
Asian - Bangladeshi - +3.2 % +14.0 % +9.0 % +6.6 % +8.8 % +2.9 %
Asian - Chinese - +5.6 % +3.5 % -5.1 % +1.1 % +3.8 % -7.7 %
Asian - Indian - -1.8 % +3.2 % +3.3 % -2.3 % +3.6 % -5.6 %
Asian - other Asian background - +5.4 % +25.5 % +11.8 % +12.2 % +9.7 % -3.2 %
Asian - Pakistani - +3.0 % +12.0 % +6.1 % +7.9 % +6.7 % +4.4 %
Black - African - +14.4 % +25.9 % +11.6 % +9.1 % +11.3 % +5.8 %
Black - Caribbean - +5.4 % +20.1 % +6.7 % +4.7 % +3.5 % -4.7 %
Black - other black background - +4.1 % +5.8 % -0.4 % +1.1 % +9.3 % +14.5 %
Mixed - other mixed background - +11.6 % +9.6 % +4.7 % +5.1 % +8.5 % -5.2 %
Mixed - White and Asian - +13.9 % +11.2 % +6.1 % +9.7 % +7.4 % -4.0 %
Mixed - White and Black African - +11.6 % +12.8 % +20.8 % -2.8 % +19.0 % -1.4 %
Mixed - White and Black Caribbean - +24.6 % +20.7 % +14.7 % +8.7 % +8.3 % -5.1 %
Other ethnic background - +9.3 % +0.2 % +4.6 % +8.9 % +6.6 % +25.3 %
Unknown - -2.2 % +16.7 % -24.8 % -61.1 % -25.7 % -3.4 %
White - +5.8 % +10.2 % +6.6 % +1.6 % +0.5 % -7.4 %
Total - +5.5 % +11.1 % +4.9 % -0.1 % +1.6 % -5.5 %
Table 8b:Cycle-to-cycle change of acceptances by ethnicity (UK domiciled only, 2007-2012)
Ethnicity

97
End of Cycle report 2012
Domicile
Applicants 2006 2007 2008 2009 2010 2011 2012
UK 432,196 454,148 502,461 544,285 586,821 589,350 544,752
Other EU 29,932 33,621 34,530 39,504 47,318 49,275 43,149
Non-EU 44,176 46,726 51,698 56,071 63,212 61,536 65,736
Total applicants 506,304 534,495 588,689 639,860 697,351 700,161 653,637
Acceptances
UK 345,564 364,544 405,024 425,063 424,634 431,235 407,391
Other EU 18,280 20,661 21,363 23,807 25,607 26,701 23,233
Non-EU 27,046 28,225 30,240 32,984 37,088 34,094 34,286
Total acceptances 390,890 413,430 456,627 481,854 487,329 492,030 464,910
Acceptance rate
UK 80.0% 80.3% 80.6% 78.1% 72.4% 73.2% 74.8%
Other EU 61.1% 61.5% 61.9% 60.3% 54.1% 54.2% 53.8%
Non-EU 61.2% 60.4% 58.5% 58.8% 58.7% 55.4% 52.2%
Total acceptance rate 77.2% 77.3% 77.6% 75.3% 69.9% 70.3% 71.1%
Table 9a:Applicants, acceptances and acceptance rate by domicile (2006-2012)
Applicants 2006 2007 2008 2009 2010 2011 2012
UK - +5.1 % +10.6 % +8.3 % +7.8 % +0.4 % -7.6 %
Other EU - +12.3 % +2.7 % +14.4 % +19.8 % +4.1 % -12.4 %
Non-EU - +5.8 % +10.6 % +8.5 % +12.7 % -2.7 % +6.8 %
Total applicants - +5.6 % +10.1 % +8.7 % +9.0 % +0.4 % -6.6 %
Acceptances
UK - +5.5 % +11.1 % +4.9 % -0.1 % +1.6 % -5.5 %
Other EU - +13.0 % +3.4 % +11.4 % +7.6 % +4.3 % -13.0 %
Non-EU - +4.4 % +7.1 % +9.1 % +12.4 % -8.1 % +0.6 %
Total acceptances - +5.8 % +10.4 % +5.5 % +1.1 % +1.0 % -5.5 %
Table 9b:Cycle-to-cycle change of applicants and acceptances by domicile (2007-2012)

98
End of Cycle report 2012
Applicants 2006 2007 2008 2009 2010 2011 2012
England 358,067 380,077 424,596 461,421 495,884 498,119 455,414
Northern Ireland 17,297 17,149 17,116 17,864 19,682 20,242 19,377
Scotland 35,429 35,496 38,035 40,053 46,347 46,015 45,116
Wales 21,403 21,426 22,714 24,947 24,908 24,974 24,845
Total applicants 432,196 454,148 502,461 544,285 586,821 589,350 544,752
Acceptances
England 289,229 306,959 343,608 360,236 360,208 368,316 343,902
Northern Ireland 12,385 13,001 13,430 13,601 13,507 13,792 13,283
Scotland 26,802 27,218 29,391 31,030 32,248 30,800 30,899
Wales 17,148 17,366 18,595 20,196 18,671 18,327 19,307
Total acceptances 345,564 364,544 405,024 425,063 424,634 431,235 407,391
Acceptance rate
England 80.8% 80.8% 80.9% 78.1% 72.6% 73.9% 75.5%
Northern Ireland 71.6% 75.8% 78.5% 76.1% 68.6% 68.1% 68.6%
Scotland 75.6% 76.7% 77.3% 77.5% 69.6% 66.9% 68.5%
Wales 80.1% 81.1% 81.9% 81.0% 75.0% 73.4% 77.7%
Total acceptance rate 80.0% 80.3% 80.6% 78.1% 72.4% 73.2% 74.8%
Table 10a:Applicants, acceptances and acceptance rate by country (UK domiciled only, 2006-2012)
Applicants 2006 2007 2008 2009 2010 2011 2012
England - +6.1 % +11.7 % +8.7 % +7.5 % +0.5 % -8.6 %
Northern Ireland - -0.9 % -0.2 % +4.4 % +10.2 % +2.8 % -4.3 %
Scotland - +0.2 % +7.2 % +5.3 % +15.7 % -0.7 % -2.0 %
Wales - +0.1 % +6.0 % +9.8 % -0.2 % +0.3 % -0.5 %
Total applicants - +5.1 % +10.6 % +8.3 % +7.8 % +0.4 % -7.6 %
Acceptances
England - +6.1 % +11.9 % +4.8 % -0.0 % +2.3 % -6.6 %
Northern Ireland - +5.0 % +3.3 % +1.3 % -0.7 % +2.1 % -3.7 %
Scotland - +1.6 % +8.0 % +5.6 % +3.9 % -4.5 % +0.3 %
Wales - +1.3 % +7.1 % +8.6 % -7.6 % -1.8 % +5.3 %
Total acceptances - +5.5 % +11.1 % +4.9 % -0.1 % +1.6 % -5.5 %
Table 10b:Cycle-to-cycle change of applicants and acceptances by country (UK domiciled only, 2007-2012)

99
End of Cycle report 2012
Institution country
2006 2007 2008 2009 2010 2011 2012
England 325,254 345,181 382,546 402,224 410,099 415,069 388,796
Northern Ireland 8,569 9,286 9,824 10,152 9,751 9,549 10,042
Scotland 35,318 36,475 40,618 43,057 42,317 41,163 41,944
Wales 21,749 22,488 23,639 26,421 25,162 26,249 24,128
Total 390,890 413,430 456,627 481,854 487,329 492,030 464,910
Table 11a:Acceptances by institution country (2006-2012)
2006 2007 2008 2009 2010 2011 2012
England - +6.1 % +10.8 % +5.1 % +2.0 % +1.2 % -6.3 %
Northern Ireland - +8.4 % +5.8 % +3.3 % -3.9 % -2.1 % +5.2 %
Scotland - +3.3 % +11.4 % +6.0 % -1.7 % -2.7 % +1.9 %
Wales - +3.4 % +5.1 % +11.8 % -4.8 % +4.3 % -8.1 %
Total - +5.8 % +10.4 % +5.5 % +1.1 % +1.0 % -5.5 %
Table 11b:Cycle-to-cycle change of acceptances by institution country (2007-2012)

100
End of Cycle report 2012
2006 2007 2008 2009 2010 2011 2012
England 287,409 304,796 340,879 356,029 357,581 365,243 341,925
Northern Ireland 8,157 8,744 9,316 9,601 9,088 8,920 9,388
Scotland 29,912 30,431 33,190 35,193 35,094 33,527 34,428
Wales 20,086 20,573 21,639 24,240 22,871 23,545 21,650
Total 345,564 364,544 405,024 425,063 424,634 431,235 407,391
Table 12a:Acceptances by institution country (UK domiciled only, 2006-2012)
2006 2007 2008 2009 2010 2011 2012
England - +6.0 % +11.8 % +4.4 % +0.4 % +2.1 % -6.4 %
Northern Ireland - +7.2 % +6.5 % +3.1 % -5.3 % -1.8 % +5.2 %
Scotland - +1.7 % +9.1 % +6.0 % -0.3 % -4.5 % +2.7 %
Wales - +2.4 % +5.2 % +12.0 % -5.6 % +2.9 % -8.0 %
Total - +5.5 % +11.1 % +4.9 % -0.1 % +1.6 % -5.5 %
Table 12b:Cycle-to-cycle change of acceptances by institution country (UK domiciled only, 2007-2012)

101
End of Cycle report 2012
2006 2007 2008 2009 2010 2011 2012
Higher Tariff group 112,078 117,376 125,285 125,823 123,971 121,382 123,286
Medium Tariff group 122,091 130,680 145,557 150,633 154,962 152,866 145,564
Lower Tariff group 156,721 165,374 185,785 205,398 208,396 217,782 196,060
Total 390,890 413,430 456,627 481,854 487,329 492,030 464,910
Table 13a:Acceptances by institution tariff grouping (2006-2012)
2006 2007 2008 2009 2010 2011 2012
Higher Tariff group - +4.7 % +6.7 % +0.4 % -1.5 % -2.1 % +1.6 %
Medium Tariff group - +7.0 % +11.4 % +3.5 % +2.9 % -1.4 % -4.8 %
Lower Tariff group - +5.5 % +12.3 % +10.6 % +1.5 % +4.5 % -10.0 %
Total - +5.8 % +10.4 % +5.5 % +1.1 % +1.0 % -5.5 %
Table 13b:Cycle-to-cycle change of acceptances by institution tariff grouping (2007-2012)
Institution grouping

102
End of Cycle report 2012
2006 2007 2008 2009 2010 2011 2012
Higher Tariff group 112,078 117,376 125,285 125,823 123,971 121,382 123,286
Main scheme 103,148 108,150 115,241 116,691 116,691 114,689 113,109
Extra 652 752 1,196 1,096 1,066 1,145 1,016
Adjustment(1) - - - 134 123 179 679
Clearing 6,205 6,357 6,386 5,814 4,393 3,582 6,669
Record of Prior Acceptance 2,073 2,117 2,462 2,088 1,698 1,787 1,813
Medium Tariff group 122,091 130,680 145,557 150,633 154,962 152,866 145,564
Main scheme 101,525 109,187 120,121 126,548 130,784 130,873 120,212
Extra 1,136 1,292 1,723 1,799 2,088 2,490 2,076
Adjustment(1) - - - 145 150 245 433
Clearing 13,059 13,253 14,669 14,559 12,435 13,054 16,814
Record of Prior Acceptance 6,371 6,948 9,044 7,582 9,505 6,204 6,029
Lower Tariff group 156,721 165,374 185,785 205,398 208,396 217,782 196,060
Main scheme 120,399 126,496 139,743 156,044 162,519 169,778 149,214
Extra 1,474 1,723 2,408 2,724 3,864 5,902 4,767
Adjustment(1) - - - 103 104 128 217
Clearing 18,768 19,248 22,835 27,300 30,097 34,533 32,238
Record of Prior Acceptance 16,080 17,907 20,799 19,227 11,812 7,441 9,624
Total 390,890 413,430 456,627 481,854 487,329 492,030 464,910
Table 14a:Acceptances by acceptance route and institution tariff grouping (2006-2012)
2006 2007 2008 2009 2010 2011 2012
Higher Tariff group - +4.7 % +6.7 % +0.4 % -1.5 % -2.1 % +1.6 %
Main scheme - +4.8 % +6.6 % +1.3 % +0.0 % -1.7 % -1.4 %
Extra - +15.3 % +59.0 % -8.4 % -2.7 % +7.4 % -11.3 %
Adjustment(1) - - - - -8.2 % +45.5 % +279.3 %
Clearing - +2.4 % +0.5 % -9.0 % -24.4 % -18.5 % +86.2 %
Record of Prior Acceptance - +2.1 % +16.3 % -15.2 % -18.7 % +5.2 % +1.5 %
Medium Tariff group - +7.0 % +11.4 % +3.5 % +2.9 % -1.4 % -4.8 %
Main scheme - +7.5 % +10.0 % +5.4 % +3.3 % +0.1 % -8.1 %
Extra - +13.7 % +33.4 % +4.4 % +16.1 % +19.3 % -16.6 %
Adjustment(1) - - - - +3.4 % +63.3 % +76.7 %
Clearing - +1.5 % +10.7 % -0.7 % -14.6 % +5.0 % +28.8 %
Record of Prior Acceptance - +9.1 % +30.2 % -16.2 % +25.4 % -34.7 % -2.8 %
Lower Tariff group - +5.5 % +12.3 % +10.6 % +1.5 % +4.5 % -10.0 %
Main scheme - +5.1 % +10.5 % +11.7 % +4.1 % +4.5 % -12.1 %
Extra - +16.9 % +39.8 % +13.1 % +41.9 % +52.7 % -19.2 %
Adjustment(1) - - - - +1.0 % +23.1 % +69.5 %
Clearing - +2.6 % +18.6 % +19.6 % +10.2 % +14.7 % -6.6 %
Record of Prior Acceptance - +11.4 % +16.2 % -7.6 % -38.6 % -37.0 % +29.3 %
Total - +5.8 % +10.4 % +5.5 % +1.1 % +1.0 % -5.5 %
Table 14b:Cycle-to-cycle change of acceptances by acceptance route and institution tariff grouping (2007-2012)
(1) Adjustment has only been available since 2009.

103
End of Cycle report 2012
Educational establishment
2006 2007 2008 2009 2010 2011 2012
State schools and colleges 246,256 256,914 284,725 298,231 320,007 301,510 280,959
Independent 33,545 35,576 37,442 38,554 38,931 37,302 35,178
Other/unknown 22,656 25,361 15,442 20,912 21,444 44,582 41,358
Total 302,457 317,851 337,609 357,697 380,382 383,394 357,495
Table 15a:Applicants by educational establishment (UK domiciled only, aged 19 and under, 2006-2012)
2006 2007 2008 2009 2010 2011 2012
State schools and colleges - +4.3 % +10.8 % +4.7 % +7.3 % -5.8 % -6.8 %
Independent - +6.1 % +5.2 % +3.0 % +1.0 % -4.2 % -5.7 %
Other/unknown - +11.9 % -39.1 % +35.4 % +2.5 % +107.9 % -7.2 %
Total - +5.1 % +6.2 % +6.0 % +6.3 % +0.8 % -6.8 %
Table 15b:Cycle-to-cycle change of applicants by educational establishment (UK domiciled only, aged 19 and under, 2007-2012)
Note: The numbers detailed within these tables relate to the recorded type of educational establishment in the year to which they refer.
These classifications can change from cycle-to-cycle.

104
End of Cycle report 2012
2006 2007 2008 2009 2010 2011 2012
State schools and colleges 206,684 215,533 241,322 248,412 251,392 243,571 228,675
Independent 29,158 30,712 32,087 32,495 32,234 31,535 30,140
Other/unknown 18,648 21,070 12,788 16,815 16,342 33,110 31,967
Total 254,490 267,315 286,197 297,722 299,968 308,216 290,782
Table 16a:Acceptances by educational establishment (UK domiciled only, aged 19 and under, 2006-2012)
2006 2007 2008 2009 2010 2011 2012
State schools and colleges - +4.3 % +12.0 % +2.9 % +1.2 % -3.1 % -6.1 %
Independent - +5.3 % +4.5 % +1.3 % -0.8 % -2.2 % -4.4 %
Other/unknown - +13.0 % -39.3 % +31.5 % -2.8 % +102.6 % -3.5 %
Total - +5.0 % +7.1 % +4.0 % +0.8 % +2.7 % -5.7 %
Table 16b:Cycle-to-cycle change of acceptances by educational establishment (UK domiciled only, aged 19 and under, 2007-2012)
Note: The numbers detailed within these tables relate to the recorded type of educational establishment in the year to which they refer.
These classifications can change from cycle-to-cycle.

105
End of Cycle report 2012
2006 2007 2008 2009 2010 2011 2012
State schools and colleges 83.9% 83.9% 84.8% 83.3% 78.6% 80.8% 81.4%
Independent school 86.9% 86.3% 85.7% 84.3% 82.8% 84.5% 85.7%
Other/unknown 82.3% 83.1% 82.8% 80.4% 76.2% 74.3% 77.3%
Total 84.1% 84.1% 84.8% 83.2% 78.9% 80.4% 81.3%
Table 17:Acceptance rate by educational establishment (UK domiciled only, aged 19 and under, 2006-2012)
Note: The numbers detailed within these tables relate to the recorded type of educational establishment in the year to which they refer.
These classifications can change from cycle-to-cycle.

106
End of Cycle report 2012
2006 2007 2008 2009 2010 2011 2012
Higher Tariff group 82,301 85,601 88,875 84,780 87,354 81,222 83,775
State schools and colleges 58,952 60,777 65,865 62,231 64,305 57,617 59,737
Independent 20,007 20,767 21,519 21,029 21,519 19,733 20,183
Other/unknown 3,342 4,057 1,491 1,520 1,530 3,872 3,855
Medium Tariff group 79,369 85,275 93,201 95,910 95,476 96,549 92,809
State schools and colleges 67,591 72,336 81,230 82,601 82,163 78,339 75,456
Independent 6,384 6,834 7,431 7,553 7,495 7,706 6,939
Other/unknown 5,394 6,105 4,540 5,756 5,818 10,504 10,414
Lower Tariff group 92,820 96,439 104,121 119,278 114,892 130,445 114,198
State schools and colleges 80,141 82,420 94,227 106,560 101,944 107,615 93,482
Independent 2,767 3,111 3,137 3,652 3,481 4,096 3,018
Other/unknown 9,912 10,908 6,757 9,066 9,467 18,734 17,698
Total 254,490 267,315 286,197 299,968 297,722 308,216 290,782
Table 18a:Acceptances by educational establishment and institution tariff grouping (UK domiciled only, aged 19 and under, 2006-2012)
2006 2007 2008 2009 2010 2011 2012
Higher Tariff group - +4.0 % +3.8 % -4.6 % +3.0 % -7.0 % +3.1 %
State schools and colleges - +3.1 % +8.4 % -5.5 % +3.3 % -10.4 % +3.7 %
Independent - +3.8 % +3.6 % -2.3 % +2.3 % -8.3 % +2.3 %
Other/unknown - +21.4 % -63.2 % +1.9 % +0.7 % +153.1 % -0.4 %
Medium Tariff group - +7.4 % +9.3 % +2.9 % -0.5 % +1.1 % -3.9 %
State schools and colleges - +7.0 % +12.3 % +1.7 % -0.5 % -4.7 % -3.7 %
Independent - +7.0 % +8.7 % +1.6 % -0.8 % +2.8 % -10.0 %
Other/unknown - +13.2 % -25.6 % +26.8 % +1.1 % +80.5 % -0.9 %
Lower Tariff group - +3.9 % +8.0 % +14.6 % -3.7 % +13.5 % -12.5 %
State schools and colleges - +2.8 % +14.3 % +13.1 % -4.3 % +5.6 % -13.1 %
Independent - +12.4 % +0.8 % +16.4 % -4.7 % +17.7 % -26.3 %
Other/unknown - +10.0 % -38.1 % +34.2 % +4.4 % +97.9 % -5.5 %
Total - +5.0 % +7.1 % +4.8 % -0.7 % +3.5 % -5.7 %
Table 18b:Cycle-to-cycle change of acceptances by educational establishment and institution tariff grouping (UK-domiciled only, aged 19 and under, 2007-2012)
Note: The numbers detailed within these tables relate to the recorded type of educational establishment in the year to which they refer.
These classifications can change from cycle to cycle.

107
End of Cycle report 2012
Distance
2006 2007 2008 2009 2010 2011 2012
0 to 24 miles 149,357 156,391 175,909 187,387 179,811 178,909 171,029
25 to 49 miles 57,270 60,249 66,276 71,507 72,714 74,719 70,218
50 to 74 miles 38,917 41,447 44,788 48,055 49,477 50,426 46,987
75 to 99 miles 29,185 31,504 34,481 35,910 38,197 39,560 37,110
100 to 124 miles 21,155 23,058 24,372 25,679 27,084 28,115 26,296
125 to 149 miles 13,341 14,146 14,712 15,719 16,306 17,290 16,020
150 to 174 miles 11,909 12,653 13,332 14,100 15,059 15,655 14,125
175 miles or further 18,742 20,225 20,967 22,687 23,537 24,284 22,739
Unknown 5,688 4,871 10,187 4,019 2,449 2,277 2,867
Total 345,564 364,544 405,024 425,063 424,634 431,235 407,391
Table 19a:Acceptances by distance (UK domiciled only, 2006-2012)
2006 2007 2008 2009 2010 2011 2012
0 to 24 miles - +4.7 % +12.5 % +6.5 % -4.0 % -0.5 % -4.4 %
25 to 49 miles - +5.2 % +10.0 % +7.9 % +1.7 % +2.8 % -6.0 %
50 to 74 miles - +6.5 % +8.1 % +7.3 % +3.0 % +1.9 % -6.8 %
75 to 99 miles - +7.9 % +9.4 % +4.1 % +6.4 % +3.6 % -6.2 %
100 to 124 miles - +9.0 % +5.7 % +5.4 % +5.5 % +3.8 % -6.5 %
125 to 149 miles - +6.0 % +4.0 % +6.8 % +3.7 % +6.0 % -7.3 %
150 to 174 miles - +6.2 % +5.4 % +5.8 % +6.8 % +4.0 % -9.8 %
175 miles or further - +7.9 % +3.7 % +8.2 % +3.7 % +3.2 % -6.4 %
Unknown - -14.4 % +109.1 % -60.5 % -39.1 % -7.0 % +25.9 %
Total - +5.5 % +11.1 % +4.9 % -0.1 % +1.6 % -5.5 %
Table 19b:Cycle-to-cycle change of acceptances by distance (UK domiciled only, 2007-2012)

108
End of Cycle report 2012
Table 19c:Acceptances by distance (UK domiciled only, 2006-2012) - diagram
Prop
ortio
n of
acc
epta
nces
0%
5%
10%
15%
20%
25%
30%
35%
40%
45%
>0 an
d <= 2
4 mile
s
>=25
and <
= 49 m
iles
>=50
and <
= 74 m
iles
>=75
and <
= 99 m
iles
>=10
0 and
<= 12
4 mile
s
>=12
5 and
<= 14
9 mile
s
>=15
0 and
<= 17
4 mile
s
>=17
5 mile
s
2006200720082009201020112012

109
End of Cycle report 2012
2006 2007 2008 2009 2010 2011 2012
Quintile 1 23,388 25,166 27,794 30,141 30,954 32,117 31,351
Quintile 2 36,475 38,468 42,027 44,568 45,398 47,075 44,963
Quintile 3 47,478 50,286 52,838 56,404 57,066 58,457 55,217
Quintile 4 60,904 64,016 67,743 70,464 71,242 72,763 67,598
Quintile 5 83,086 86,568 89,930 93,217 93,426 95,681 89,117
Unknown quintile 3,159 2,811 5,865 2,928 1,882 2,123 2,536
Total 254,490 267,315 286,197 297,722 299,968 308,216 290,782
Table 20a:Acceptances by POLAR2 quintile (UK domiciled only, aged 19 and under, 2006-2012)
Note: The POLAR2 (Participation of Local Areas 2) classification groups small areas across the UK into five quintile groups according
to their rate of young participation in higher education in the early 2000s. In quintile 1 fewer than one in five young people enter higher
education compared to well over half in quintile 5. Each quintile represents around 20 percent of the young population.
Further information on the POLAR2 classification can be found on the HEFCE website (www.hefce.ac.uk/widen/polar/polar2/).
2006 2007 2008 2009 2010 2011 2012
Quintile 1 - +7.6 % +10.4 % +8.4 % +2.7 % +3.8 % -2.4 %
Quintile 2 - +5.5 % +9.3 % +6.0 % +1.9 % +3.7 % -4.5 %
Quintile 3 - +5.9 % +5.1 % +6.7 % +1.2 % +2.4 % -5.5 %
Quintile 4 - +5.1 % +5.8 % +4.0 % +1.1 % +2.1 % -7.1 %
Quintile 5 - +4.2 % +3.9 % +3.7 % +0.2 % +2.4 % -6.9 %
Unknown quintile - -11.0 % +108.6 % -50.1 % -35.7 % +12.8 % +19.5 %
Total - +5.0 % +7.1 % +4.0 % +0.8 % +2.7 % -5.7 %
Table 20b:Cycle-to-cycle change of acceptances by POLAR2 quintile (UK domiciled only, aged 19 and under, 2007-2012)
POLAR2

110
End of Cycle report 2012
Table 21:Acceptances by JACS3 subject group and educational establishment (UK domiciled only, aged 19 and under, 2012)
JACS3 subject group
Aca
dem
y
Fu
rth
er
edu
cati
on
Gra
mm
ar
sch
oo
l
Ind
epen
den
t sc
ho
ol
Oth
er
Six
th f
orm
co
lleg
e
Sta
te e
xc
gra
mm
ar
Tota
l
Group A: medicine and dentistry
798 111 1,009 1,814 241 608 1,648 6,229
Group B: subjects allied to medicine
2,086 2,276 1,558 1,371 2,172 3,911 7,049 20,423
Group C: biological sciences 3,313 3,389 1,712 2,585 2,478 5,535 10,003 29,015
Group D: veterinary sciences, agriculture and related subjects
322 659 288 448 500 434 1,007 3,658
Group F: physical sciences 1,820 885 1,213 1,887 714 2,503 5,648 14,670
Group G: mathematical sciences
852 270 505 516 290 1,137 2,496 6,066
Group H: engineering 1,531 1,318 1,202 1,739 1,366 2,182 4,913 14,251
Group I: computer sciences 1,019 1,959 598 353 1,611 2,218 3,453 11,211
Group J: technologies 118 189 81 88 180 217 385 1,258
Group K: architecture, building and planning
412 490 333 502 528 661 1,345 4,271
Group L: social studies 2,305 1,841 1,289 3,351 1,856 3,626 6,385 20,653
Group M: law 1,374 1,319 877 1,050 1,069 3,339 4,535 13,563
Group N: business and administrative studies
3,116 3,526 1,727 2,892 3,673 6,248 10,283 31,465
Group P: mass communication and documentation
640 1,083 247 261 903 1,612 2,383 7,129
Group Q: linguistics, classics and related subjects
1,189 568 706 1,572 589 1,836 3,303 9,763
Group R: european languages, literature and related subjects
391 110 382 948 134 476 992 3,433
Group T: Eastern, Asiatic, African, American and Australasian languages, literature and related subjects
122 52 70 222 43 138 289 936
Group V: historical and philosophical studies
1,366 561 845 2,484 621 1,907 3,898 11,682
Group W: creative arts and design
2,039 6,749 794 1,330 7,569 5,777 6,600 30,858
Group X: education 1,136 1,529 439 304 1,316 2,222 4,127 11,073
Combined arts 982 763 511 920 775 1,609 2,882 8,442
Combined sciences 581 666 342 497 534 993 1,737 5,350
Combined social sciences 354 274 182 389 267 670 1,037 3,173
Sciences combined with social sciences or arts
1,092 1,725 441 753 1,481 2,037 3,843 11,372
Social sciences combined with arts
751 645 403 1,025 768 1,185 2,325 7,102
General, other combined and unknown
426 242 300 839 289 572 1,068 3,736
Total 30,135 33,199 18,054 30,140 31,967 53,653 93,634 290,782

111
End of Cycle report 2012
2011 2012 % change
Group A: medicine and dentistry 222 444 +100.0 %
Group B: subjects allied to medicine 4,711 5,203 +10.4 %
Group C: biological sciences 4,214 5,163 +22.5 %
Group D: veterinary sciences, agriculture and related subjects 553 653 +18.1 %
Group F: physical sciences 1,816 1,951 +7.4 %
Group G: mathematical sciences 933 892 -4.4 %
Group H: engineering 3,238 3,469 +7.1 %
Group I: computer sciences 2,844 2,721 -4.3 %
Group J: technologies 299 278 -7.0 %
Group K: architecture, building and planning 926 904 -2.4 %
Group L: social studies 4,299 5,299 +23.3 %
Group M: law 3,294 3,285 -0.3 %
Group N: business and administrative studies 8,102 8,610 +6.3 %
Group P: mass communication and documentation 1,213 1,284 +5.9 %
Group Q: linguistics, classics and related subjects 1,074 1,003 -6.6 %
Group R: european languages, literature and related subjects 368 345 -6.3 %
Group T: Eastern, Asiatic, African, American and Australasian languages, literature and related subjects
92 141 +53.3 %
Group V: historical and philosophical studies 1,321 1,344 +1.7 %
Group W: creative arts and design 3,493 4,066 +16.4 %
Group X: education 1,537 1,908 +24.1 %
Combined arts 990 1,088 +9.9 %
Combined sciences 1,274 1,222 -4.1 %
Combined social sciences 743 816 +9.8 %
Sciences combined with social sciences or arts 2,045 1,969 -3.7 %
Social sciences combined with arts 1,041 1,014 -2.6 %
General, other combined & unknown 527 649 +23.1 %
Total 51,169 55,721 +8.9 %
Table 22:Clearing acceptances by JACS3 subject group (2011-2012)

112
End of Cycle report 2012
Glossary

113
End of Cycle report 2012
Glossary

114
End of Cycle report 2012
AAB+ The high grade qualification combinations used in the number control arrangements for most courses in England in the 2012-13 academic year. They approximate the categories that relate to the Higher Education Funding Council for England (HEFCE) student number control arrangements from information recorded in the UCAS system. The assessment of entry qualifications uses a number of data sources including information provided by applicants themselves.
Academic year entry rates The number of acceptances for entry to start higher education within an academic year divided by the base population estimate. These may include acceptances from more than one application cycle. Within-cycle acceptances, those applicants accepted to start in the academic year within which they apply, are excluded from these rates.
Acceptance An applicant who at the end of the cycle has been placed for entry into higher education.
Acceptance rate The number of acceptances divided by the number of applicants.
Adjustment An acceptance route where applicants who have met and exceeded the conditions of their firm choice choose to take up an alternative offer.
Age This analysis uses country-specific age definitions that align with the cut off points for school/college cohorts within the different administrations of the UK. For England and Wales, ages are defined on the 31 August, for Northern Ireland on the 1 July and for Scotland on the 28 February the following year. Defining ages in this way matches the assignment of children to school cohorts. For applicants outside of the UK the cohort cut off for England and Wales has been used.
Applicant A person who has made an application in the UCAS system.
Application rate The number of applicants divided by the estimated base population.
Base population estimate The population estimates are based upon Office for National Statistics Mid-Year Estimates and National Population Projections. For 16 to 20 year olds the estimates are obtained by aging 15 year olds from the appropriate number of years earlier. This approach avoids the estimates being susceptible to changes in net migration (including overseas students) during these ages. Older ages are obtained from the Mid-Year Estimates and National Popula-tion Projections without aging. In both cases the estimates are adjusted from age at mid-year to age on the country-specific reference dates using the monthly distribution of births. The small area population estimates used were provided by HEFCE.
Clearing An acceptance route available late in the application cycle.
Cohort A group of the population all born in the same academic year, and are therefore, for example, all aged 18 on a particular reference date.
Conditional firm An offer made by an institution dependent on achieving specified requirements which has been accepted by the applicant as their first choice.
Cycle entry rate The number of acceptances from a UCAS application cycle divided by the estimated base population.
Defer (deferred) Most acceptances are into the academic year that starts immediately at the end of the cycle, for example into 2012-13 from the 2012 application cycle. Acceptances can also be deferred for entry into the following academic year, for example into 2013-14 from the 2012 cycle. These are called deferred acceptances.

115
End of Cycle report 2012
Domicile Declared area of permanent residence.
Extra An acceptance route where applicants who held no offers after using all five main scheme choices, make additional choices.
Firm choice An offer made by an institution which has been confirmed by the applicant as their first choice. These can be either conditional (dependent on achieving specified requirements) or unconditional (these are assumed to be accepted / placed).
HEFCE Higher Education Funding Council for England.
Higher tariff institution An institution that belongs to the higher tariff group, from the grouping of institutions based on the average levels of attainment of their accepted applicants (summarised through UCAS tariff points) in recent cycles. The other two groups are medium tariff institutions, and lower tariff institutions. Each group of institutions accounted for around a third of all UK 18 year old acceptances in recent cycles.
Insurance choice An offer made by an institution which has been confirmed by the applicant as their second choice, in case the conditions of the firm choice are not met. These can be either conditional (dependent on achieving specified requirements) or unconditional (no further requirements to be met).
Main scheme The main UCAS application scheme through which up to five institutions/courses can be applied to. This opens in September and closes to new applications at 30 June.
National Pupil Database The National Pupil Database (NPD, Department for Education) holds a range of information about pupils who attend schools and colleges in England. For this analysis a link has been formed between individuals attending state schools and colleges in the NPD at 15 and those that were 18 in UCAS data three years later.
ONS Office for National Statistics.
POLAR2 Developed by HEFCE and classifies small areas across the UK into five groups according to their level of young participation in HE. Each of these groups represents around 20 per cent of young people and are ranked from quintile 1 (areas with the lowest young participation rates, considered as the most disadvantaged) to quintile 5 (highest young participation rates, considered most advantaged). POLAR2 is used in preference to the newer POLAR3 to avoid any distortion of entry rate trends associated with the boundaries to the more recent period used to define POLAR3.
RPA Record of Prior Acceptance, where an application is submitted to UCAS via an institution when an unconditional firm has been offered and accepted by the applicant.
SQA Scottish Qualifications Authority.
Tariff A numerical summary of qualification level.
Track survey Track is a facility for applicants to track the progress of their applications using the UCAS website. The Track survey is carried out online for UK domiciled applicants who made all their reply decisions via Track between October and July.
Unplaced rate The number of unplaced applicants in a cycle divided by the number of applicants in that cycle, counterpart of the acceptance rate.
Withdrawal In this report withdrawal refers to complete withdrawal, where the application has been removed from the scheme.

116
End of Cycle report 2012

End of Cycle report2012
RosehillNew Barn LaneCheltenhamGL52 3LZ
t: +44 (0) 1242 222 444www.ucas.com


