Clinical Technical Expert Panel Meetings Draft Summary Report Arbor Research Collaborative for Health/University of Michigan Kidney Epidemiology and Cost Center Page 1 End-Stage Renal Disease (ESRD) Quality Measure Development and Maintenance Clinical Technical Expert Panel Draft Summary Report Prepared by Arbor Research/UM-KECC Submitted to CMS September 14, 2012 Contract No. HHSM-500-2008-000221, Task Order No. HHSM-500-T0001 This document summarizes the proceedings of the End-Stage Renal Disease (ESRD) Clinical Technical Expert Panels (TEPs) held May 1-2, 2012 in Baltimore, MD. Convening the Clinical TEPs in person was one important step in the quality measure development process. The results of any subsequent steps that are used to further refine these measures, including performing additional analyses, soliciting further input from Clinical TEP members, and holding a public-comment period, are not included in this document. This document therefore does not make a final determination on the direction of new proposed ESRD quality measures; rather, it provides an overview of the status of the quality measurement development process as of September 14, 2012.
Arbor Research Collaborative for Health/University of Michigan Kidney Epidemiology and Cost Center Page 1
End-Stage Renal Disease (ESRD) Quality Measure
Development and Maintenance Clinical Technical Expert Panel Draft Summary Report
Prepared by Arbor Research/UM-KECC Submitted to CMS September 14, 2012
Contract No. HHSM-500-2008-000221, Task Order No. HHSM-500-T0001
This document summarizes the proceedings of the End-Stage Renal Disease (ESRD) Clinical Technical Expert Panels (TEPs) held May 1-2, 2012 in Baltimore, MD. Convening the Clinical TEPs in person was one important step in the quality measure development process. The results of any subsequent steps that are used to further refine these measures, including performing additional analyses, soliciting further input from Clinical TEP members, and holding a public-comment period, are not included in this document. This document therefore does not make a final determination on the direction of new proposed ESRD quality measures; rather, it provides an overview of the status of the quality measurement development process as of September 14, 2012.
Arbor Research Collaborative for Health/University of Michigan Kidney Epidemiology and Cost Center Page 2
Technical Expert Panel Summary
The Centers for Medicare & Medicaid Services (CMS) has contracted with Arbor Research Collaborative for Health (Arbor Research) and the University of Michigan Kidney Epidemiology and Cost Center (UM-KECC) to develop End-Stage Renal Disease (ESRD) Quality Measures (QMs) for the following five measure areas:
• Hospitalization (hospital readmissions)
• Measurement of Dialysis Adequacy across Dialysis Modalities (including frequent hemodialysis)
• Anemia Management
• Preventive Care (Pneumococcal, Hepatitis B, and Influenza Vaccinations)
• Dialysis Adequacy for Pediatric Patients (Peritoneal Dialysis Adequacy [PD])
The purpose of the project is to develop measurements that can be used to provide quality care to Medicare beneficiaries. CMS identified Anemia Management and Hospitalization as the priority measure areas for the current round of measure development. The Clinical Technical Expert Panels (C-TEPs) for Preventive Care, Pediatric Peritoneal Dialysis Adequacy, and Measurement of Dialysis Adequacy across Dialysis Modalities have been deferred to a later date, yet to be determined.
Technical Expert Panel Objectives
The objectives of the ESRD C-TEPs for Anemia Management and Hospitalization were described in the charter that was approved by the C-TEPs. The C-TEPs were charged with providing expertise and input to Arbor Research on the development and implementation of measures that will be used to assess and improve the quality of care for Americans with ESRD. The C-TEPs were to provide guidance and assist in the development and specification of new quality measures in specific clinical areas. In addition, the C-TEP members were to consider potential measures using the framework of CMS and the National Quality Forum (NQF). The four evaluation criteria are: importance, scientific acceptability, feasibility, and usability.
Technical Expert Panel Meeting
The Anemia Management and Hospitalization TEPs met on May 1 and 2, 2012 in Baltimore, MD.
The TEPs were comprised of individuals with the following areas of expertise and perspectives:
• Topic Knowledge: ESRD • Performance Measurement • Quality Improvement • Consumer Perspective • Purchaser Perspective • Health Care Disparities
Arbor Research Collaborative for Health/University of Michigan Kidney Epidemiology and Cost Center Page 5
Hospitalization TEP
The Hospitalization TEP was charged with providing recommendations to Arbor Research/UM-KECC for specifications—including numerator, denominator, inclusion, exclusion criteria, and risk adjustment—of a 30-day readmission measure specific to the ESRD population. H.1 Background The TEP reviewed the current status of readmission measure development, which has generally focused on the inpatient hospital setting. Arbor Research/UM-KECC then gave an overview of the existing Standardized Hospitalization Ratio (SHR), which was developed specifically for the ESRD population. The SHR compares the observed hospitalization rate among patients in each dialysis facility with national hospitalization rates among patients with similar characteristics to those in the facility. These patient characteristics include age, sex, diabetes as the cause of ESRD, time since start of ESRD, comorbidities at start of ESRD (as reported on the ESRD Medical Evidence Form), body mass index (BMI) at start of ESRD, and nursing home status. Any difference between the observed and expected hospitalizations in a dialysis facility is not due to these factors. Separate SHRs have been calculated for hospital admissions, hospital days, and emergency department visits. Annual reporting of SHRs in the Dialysis Facility Reports allows facilities to evaluate trends and to compare their hospitalization rates with all facilities in the same state, ESRD Network, and the United States. Arbor Research/UM-KECC also presented a review of relevant literature that included a discussion of data on potentially avoidable readmissions and a review of studies demonstrating the effectiveness of pre- and post-discharge interventions in preventing readmissions. This review included several studies in non-ESRD populations that evaluated post-discharge interventions (Dunn 1994; Bostrom 1996; Dudas 2001; Azevedo 2002; Coleman 2004; Coleman 2006; Balaban 2008; Braun 2009) or a combination of pre- and post-discharge interventions (Naylor 1994; McDonald 2001; Creason 2001; Ahmed 2004; Anderson 2005; Jack 2009; Koehler 2009; Parry 2009). It was noted that the results of these studies, which included both randomized controlled trials and cohort studies, were mixed, with some studies indicating a reduction in the risk of readmission related to the intervention. There was then more specific discussion of opportunities to reduce readmissions in the ESRD population. Clinical processes that might be used to reduce the risk of readmission related to common clinical conditions in ESRD patients were described (Plantinga 2009). The results of a recent study that found certain post-discharge assessments and changes in treatment at the dialysis facility to be associated with a reduced risk of readmission were also discussed (Chan 2009). H.2 Prototype Measure Arbor Research/UM-KECC presented analyses for a prototype ESRD hospital readmission measure. This measure was intended as an example to facilitate further analysis and discussion. Many aspects of this prototype measure were based on the CMS Hospital Compare all-cause unplanned readmission (HC-HWR) measure. The HC-HWR measure is a single score derived from models of five clinical cohorts (general medicine, surgery and gynecology, cardiorespiratory, cardiovascular, and neurology) and is risk adjusted for patient age, discharge diagnosis (using the Agency for Healthcare Research and Quality [AHRQ] Clinical Classifications Software) and a fixed set of past-year comorbid conditions (using the CMS
Arbor Research Collaborative for Health/University of Michigan Kidney Epidemiology and Cost Center Page 6
Condition Category groups). Planned readmission was based on a clinical review of the AHRQ Clinical Classification System. The HC-HWR measure underwent an expedited review by the NQF and was endorsed in late April 2012. The prototype measure that was developed for the Hospitalization TEP to consider was specifically tailored for ESRD patients and the dialysis facility context. It, therefore, differs from the HC-HWR measure in certain respects. In particular, the stratification used in the HWR measure (based on the five clinical cohorts listed above) were selected to distinguish the contributions of specific clinical teams at the hospital that can support quality improvement activities. Such teams are less relevant in dialysis facilities because what is more relevant in an ESRD measure is the management of ESRD provided by the entire dialysis facility team and not management of the five clinical categories from the HS-HWR measure. Furthermore, although the multiple diagnosis cohorts were important for the HC-HWR measure that reflects the general population, the prototype measure was defined specifically for the ESRD population. Another distinction between the prototype measure and the HC-HWR measure is that the prototype measure recognizes that care provided at dialysis facilities and hospitals may contribute to all hospital readmissions. This aspect of the prototype measure is addressed in further detail below as part of our description of the statistical model (see Section H.2.4). The prototype measure that was presented to the TEP was based on index hospitalizations (discharges) for Medicare dialysis patients in the 2009 calendar year. The primary data sources used to define the prototype readmission measure are listed below. H.2.1 Data Sources
• Patient demographics o Consolidated Renal Operations in a Web-enabled Network (CROWN) o CMS Medical Evidence Form (Form 2728) o CMS Death Notification Form (Form 2746)
• Patient comorbidities o Past-year: Medicare claims (inpatient, outpatient, hospice, home health and skilled
nursing facility [SNF]) o Baseline: CMS Medical Evidence Form (Form 2728)
H.2.2 Denominator Specifications Definition: All hospitalization discharges during the year are treated as index hospitalizations. A readmission can also be an index hospitalization.
Exclusions
• Not Medicare covered • Died in hospital • Transferred to another hospital • Discharged against medical advice • Admissions to prospective payment system-exempt (PPS) cancer hospitals • Certain admissions (e.g., cancer, psychiatric, rehabilitation)
For the analyses of dialysis facility and hospital readmission rates that were presented to the TEP, an additional exclusion was made for dialysis facility/hospital pairs that accounted for fewer than five index
Arbor Research Collaborative for Health/University of Michigan Kidney Epidemiology and Cost Center Page 7
hospitalizations per year. This exclusion was made for exploratory analysis only; it is not intended for inclusion in the final measure specification. H.2.3 Numerator Specifications Definition: A readmission is any admission that occurs within 30 days of an index hospitalization discharge.
Exclusion: Planned readmissions It should be noted that for the prototype measure, deaths without readmission that occurred within 30 days of an index hospitalization discharge were not treated as events. However, analyses of an alternative measure that identified readmissions or deaths occurring within 30 days of an index hospitalization discharge as a composite outcome were also presented to the TEP. H.2.4 Statistical Model We developed a hierarchical logistic regression model of 30-day hospital readmissions that accounted for various patient-level characteristics and included dialysis facilities and hospitals as random effects. The inclusion of hospital-specific effects in a model that is used to assess readmission rates by dialysis facility represents one important difference from the model that was used as the basis for the HC-HWR measure. It was noted that this approach was taken to recognize that the responsibility for ESRD patient outcomes following hospital discharge is shared by dialysis facilities and hospitals for a population that requires high levels of care by a dialysis facility after discharge. The model used for the prototype measure takes the basic form:
Logit P(R=1) = XB + eh + ef , where R is an indicator of 30-day readmission, ef is a random effect for dialysis facility, eh is a random effect for hospital, and X represents a set of patient characteristics. As noted above, the inclusion of a random effect for hospital recognizes that a patient’s readmission can be attributed to care given at the discharging hospital and at the dialysis facility. This is different from the development of a readmission measure for hospitals alone, where care is not always affected by another institutional provider. Another distinguishing feature for an ESRD readmission measure is the inability of dialysis facilities to exert control over the quality of care provided by hospitals, which occurs prior to a patient’s return to the dialysis facility. The estimated dialysis facility effects based on the model reflect higher or lower readmissions than expected for individual facilities compared with average facilities, given the patient characteristics in the model and the hospital that discharged the patient. Estimates from the model were used to calculate standardized readmission ratios (SRRs) for dialysis facilities that were adjusted for the patient characteristics in the model and individual hospital effects. As with the approach used for the HC-HWR measure, we then multiplied each facility’s SRR by the raw national rate of 30-day readmissions (30.4% of index hospital discharges) to achieve a risk-standardized readmission ratio (RSRR). H.2.5 Risk Adjustment Our general approach to risk adjustment was similar to that used for the HC-HWR measure, in that we included age, sex, and indicators of comorbidity status based on past-year claims. There were
Arbor Research Collaborative for Health/University of Michigan Kidney Epidemiology and Cost Center Page 8
differences, however, from the HC-HWR measure with regard to the selection of risk adjustment factors that may be specifically relevant to the ESRD population. This included comorbidity adjusters based on diagnoses reported on Medicare claims for the previous year (see Table 1), as well as the inclusion of other adjustors, including diabetes as cause of ESRD, time on dialysis and BMI.
Table 1. Comorbidities Identified Using Past-Year Claims Cardiorespiratory failure/shock Other hematological disorders Respirator dependence/tracheostomy status Psychiatric comorbidity Coronary atherosclerosis or angina, cerebrovascular disease
COPD Seizure disorders and convulsions Fibrosis of lung or other chronic lung disorders CHF Drug and alcohol disorders Specified arrhythmias Metastatic cancer/acute leukemia Ulcers Severe cancer Septicemia/shock Severe infection Pancreatic disease Other infectious disease and pneumonias Transplants Protein-calorie malnutrition Coagulation defects & other specified
hematological disorders End-stage liver disease
Following a review of the prototype measure, the TEP discussed each specification in detail. H.3 Alternative Measures Throughout this summary, we present comparisons of the prototype measure with alternative readmission measures. We used six relatively well-known measures (see Table 2).
Table 2. Basic Description of Alternative Readmission Measures
Measure Steward Developer Purpose Population NQF Endorsed
Name Used in this Summary
3M Corporation (3M) 3M Commercial use All N/A 3M
United Health Group (UHG) UHG Health plan-hospital contracting All UHG
US Renal Data System (USRDS) USRDS Annual reporting ESRD N/A USRDS
CMS YNHHSC/CORE* Hospital Compare, cause-specific (CS) Medicare, age 65+ HC-CS
CMS YNHHSC/CORE* Hospital Compare, all-cause Medicare, age 18+ HC-HWR
CMS RTI Nursing Home Compare Nursing home (SNF) [draft] SNF
Arbor Research Collaborative for Health/University of Michigan Kidney Epidemiology and Cost Center Page 9
The TEP reviewed examples of alternative definitions of readmissions measures that targeted a variety of patient populations. The most common method allowed any admission to serve as both an index and a readmission. This method is used for the USRDS and HC-HWR measures, the latter of which serves as the basis for both the draft Arbor Research/UM-KECC measure and the draft SNF measure. The HC-CS measure approaches readmissions a bit differently. Beginning only with patients whose index admissions are for pneumonia, acute myocardial infarction, or heart failure, it looks for the first instance of a readmission within the 30-day window. That readmission is not eligible to be an index admission. Once that readmission is identified, the readmission “clock” resets, with the third admission—whether it is outside or inside the first admission’s 30-day window—becoming an index admission. The USRDS has developed yet another method of classifying admissions. It looks within the 30-day window that starts at the first admission’s discharge date to identify a readmission. As with the HC-CS measure, an index admission cannot also be a readmission. Thus, the USRDS method flags whether any readmission occurred within 30 days of the index admission and restarts the clock at day 31. Finally, the 3M Corporation has developed software to identify readmissions, which, if clinically related, can extend beyond the 30 days after the index admission discharge. As with the previous two methods, readmissions cannot also be index admissions; however, there cannot be another index admission until a patient is discharged without another admission within 30 days. Thus, as Table 3 demonstrates, it characterizes readmission events as a clinically related chain. Table 3 provides a general comparison of these measures in terms of their definitions of index hospitalizations and readmissions. The table demonstrates how one patient might contribute to his/her facility’s readmission rate under the different readmission definitions. As shown, this example patient was admitted to the hospital four times in a six-week period and died during the last hospitalization. In this example, each admission lasts exactly five days. Table 3. Definitions of Index Hospitalizations and Readmissions within Existing Readmission Measures: An Example Patient
Measure (Method)
Hospitalization Event
No. of Index Hospitalizations
#1 #2 #3 #4
Day 0- Day 5
Day 14- Day 19
Day 28- Day 33
Day 42; died on Day 47
3M (chain) I R R R 1
USRDS (30-day distinct) I R [not counted] I 2
HC-CS (distinct) I R I R 2
HC-HWR (overlapping) I R/I R/I R 3
RTI (overlapping) I R/I R/I R 3
UHG (overlapping) I R/I R/I R 3
Arbor/KECC (overlapping) I R/I R/I R 3
Note. This table was adapted from Collaborative Healthcare Strategies’ presentation for CMS STAAR project, November 17, 2011. I=index admission; R=readmission. After a discussion of this information, the TEP reached the following recommendations on issues associated with index hospitalizations:
Arbor Research Collaborative for Health/University of Michigan Kidney Epidemiology and Cost Center Page 10
i. In keeping with the HC-HWR and SNF approach, the TEP was in general agreement that the prototype should treat all admissions as index admissions (e.g., readmissions count as index admissions).
ii. Based on data presented by Arbor Research/UM-KECC, the TEP noted the large number of discharges against medical advice (AMA) in the ESRD population (see Table 4 below). The TEP expressed concerns about the exclusion of AMA discharges from an ESRD readmission measure, due to the potential for adverse incentives resulting from exclusion of AMA discharges (the facility would bear no responsibility for subsequent events and a large number of exclusions would result in this population). TEP members were also concerned that hospitals/physicians were not designating AMA in a uniform manner. The possibility of including an adjustment for AMA discharges, which might be relevant to the status of patients upon their return to the dialysis facility, and which may not be under the control of the dialysis facility, was discussed as a possible alternative to the exclusion of AMA discharges from the measure. The TEP requested regional analyses on AMA patients to see whether there were geographic trends in this practice.
Table 4. Admissions Excluded from 2009 Prototype Readmission Measure
Exclusion No. Removed Left against medical advice 46,067
Treated for a selected set of diagnoses 47,137
Hospitalization ended in death 27,744
Treated at a PPS-exempt cancer hospital 161
Dialysis facility/hospital shared <5 claims in 2009 54,816
Total Claims Excluded* 140,650 *Some admissions met multiple exclusion criteria, so total will not be the exact sum of its components.
iii. The TEP recommended, at least for preliminary analyses and the development of the initial measure, that pediatric patients be excluded. This recommendation was based on the fact that most ESRD facilities have few pediatric patients and that pediatric-only and mainly pediatric ESRD facilities tend to be qualitatively different from other ESRD facilities. It would be important to look at potential measures separately for the pediatric population at a later time.
The TEP also discussed how to best account for patients who are readmitted many times during a year. Initially, there was discussion of excluding specific diagnoses that are associated with frequent hospitalizations (e.g., sickle cell anemia). However, after further discussion, the TEP recommended that we instead place a limit on the number of readmissions one patient can contribute in a year. High numbers of readmissions may be related to patient-specific factors that may be less modifiable by actions taken at the dialysis facility, as in the case of sickle cell anemia. The TEP recommended that we explore the use of such upper bounds to limit the effect of outliers. The TEP also expressed interest in a measure based on an SHR-like model that would use patient exposure in the denominator. TEP members noted that although a facility could reduce its rate of readmissions substantially, the total number of hospitalizations could still increase. Conversely, a
Arbor Research Collaborative for Health/University of Michigan Kidney Epidemiology and Cost Center Page 11
facility’s rate of readmissions could be high while its total rate of hospitalizations is low. Thus, a measure that evaluated readmissions in terms of overall patient exposure might be preferable or would at least give a useful complementary view. The TEP recommended that Arbor Research/UM-KECC explore this approach. It was noted by the TEP that this approach would reflect a different view of readmissions and yield a measure quite different from readmission measures currently in use. H.4.2 Numerator Of the six comparison measures, only two include numerator exclusions: (1) the HC-HWR measure, with which Arbor Research/UM-KECC is attempting to harmonize; and (2) the SNF measure, which is based on the HC-HWR measure. The HC-HWR, SNF, and prototype measures exclude planned readmissions from the numerator. The TEP reviewed the HC-HWR definition of planned readmissions, which include (1) any non-acute readmission that involves one of 35 typically planned procedures or (2) any admission (acute or non-acute) that involves maintenance chemotherapy, organ transplant, or rehabilitation. This was not discussed in depth, as the TEP was supportive of excluding planned readmissions as done in the HC-HWR measure. There was extensive discussion on the use of a cause-specific versus an all-cause readmission measure. Regarding an all-cause readmission measure, a primary concern of the TEP members was the degree to which the dialysis care team could modify certain readmissions. Other TEP members considered including only causes for readmission that may be modifiable by the dialysis facility or applying weights to causes of readmission based on the degree to which these are modifiable. However, TEP members believed that reaching agreement on specific readmissions considered potentially modifiable would be very difficult if not impossible. A key point on which there was general, but not universal, agreement was that an all-cause readmission measure is supported by a paradigm of shared accountability, in which providers from different care settings are, as a group, accountable for the overall care of the patient. Many TEP members believed that the health care system is moving toward this paradigm and that an all-cause readmission measure, therefore, would be appropriate in this setting. Ultimately, a general consensus was reached by the TEP on recommending the development of an all-cause readmission measure, with the understanding that suitable adjustments would be made for patient characteristics, hospital effects, and, if possible, physician effects. As noted above in the description of the prototype measure, the rationale for adjustment for hospital effects is based on the recognition that the likelihood of readmission is affected by care that is provided by the hospital during the index hospitalization and that this component of care is not under the control of dialysis facilities. The rationale for the TEP recommendation that there also be an adjustment for physician effects is that dialysis facilities do not have full control of physician practices, such as emergency room referral rates, which may affect the frequency of readmissions. On the other hand, the TEP recognized that there is an overlap between physician practice and dialysis facility practice, which may not be appropriate to adjust for in a measure. For instance, dialysis practices related to adequacy or vascular access would be under direct control of both the physician and the dialysis facility; adjusting for these parameters would not be appropriate. Further detail on the TEP discussion of these and other potential adjustments is provided below in Section H.4.4 (Risk Adjustment). H.4.3 Mortality The TEP discussed how the readmission measure would account for ESRD patient mortality. This is a more substantial issue in the ESRD population than in other patient groups because the death rate is
Arbor Research Collaborative for Health/University of Michigan Kidney Epidemiology and Cost Center Page 12
relatively high following discharge, with about 4% of discharges resulting in death within 30 days (without readmission). The TEP considered two methods of handling such deaths. In the first, the measure would reflect a composite endpoint in which both readmission and death within 30 days would count as the event. In the second, discharges that resulted in death within 30 days with no readmission would be excluded from the measure (both numerator and denominator) altogether. The TEP did not come to a consensus as to which approach would be better and recommended exploring both as background for a later decision. H.4.4 Risk Adjustment The TEP reviewed how the risk adjustment performed by the six existing readmission measures compared with the prototype measure (Table 5). Note that sensitivity models for the prototype measure also included race/ethnicity and baseline comorbidities to explore the potential implications of not including adjustments for these factors in the prototype measure. For both types of factors, their inclusion as additional adjustment factors in the model led to very similar risk-adjusted readmission rates by dialysis facility (in both cases leading to correlations of > 0.99 with facility-level readmission rates that were based on the prototype measure). Table 5. Risk Adjustors Used in Existing Readmission Measures
Adjustor 3M UHG USRDS Hospital Compare
(both) SNF Arbor/KECC Prototype
Age
Sex
Race
Current Diagnosis
Selected set DRG
CCS
CC
Severity (DRG) Past-year comorbidity
Disability status Diabetes as cause of ESRD
BMI
Time on ESRD
Note: DRG=diagnosis-related group; CCS=AHRQ Clinical Classifications Software; CC=CMS condition categories. Arbor Research/UM-KECC presented results from comparative models, shown to the TEP as odds ratios. Some TEP members were concerned that the 30 or so covariates included in the prototype model create an excessively complicated model and expressed interest in a simpler approach. However, there was strong support for some kind of risk adjustment to account for differences in patient populations served by different facilities. In addition to the adjustments made in the prototype measure, the TEP was interested in exploring possible adjustments for AMA discharges (instead of excluding them), nursing home residence, and specific discharge diagnoses (e.g., sickle cell anemia, cancer, HIV, liver failure) as factors that may be associated with a higher risk of readmission and that dialysis facilities may not be able to modify. There was strong support for using past-year comorbidities—as opposed to baseline comorbidities—when accounting for a patient’s comorbidity status in the model. When considering past-year comorbidities, the TEP felt that a new list of clinical condition categories that are specifically relevant to
Arbor Research Collaborative for Health/University of Michigan Kidney Epidemiology and Cost Center Page 13
the ESRD population should be developed and included as risk adjusters. In considering which past-year comorbidities would be included, a concern was raised about the appropriateness of adjusting for conditions that may be influenced by the quality of dialysis care (e.g., CHF, where ultrafiltration or fluid removal during a dialysis treatment may reduce symptoms that require readmission); these conditions may be associated with the likelihood of being readmitted. The concern was that a readmission measure could include adjustments for clinical conditions that might result from poor care provided by the dialysis facility, which could limit its validity as a quality measure. The TEP was also interested in further analyses of how well this claims-based approach to risk adjustment applies to incident patients who are newly eligible for Medicare (i.e., age <65, not disabled), given the limited claims history available to identify comorbidities. The TEP was further concerned with the possibility that incident patients would be excluded from the measure, based on either the 90-day waiting period for Medicare eligibility or a limited claims history. The TEP noted the strong partnership that is needed between the dialysis facility and the hospital and that many issues that relate to readmissions would have shared aspects. There was a clear view that one desirable aspect of the readmission measure was to promote shared accountability between these care givers. The TEP was strongly supportive of the adjustment for hospital in the prototype measure and recommended that such an adjustment should also be a part of the final readmission measure. The TEP noted that the hospital to which patients were admitted was typically not at all within the control of the dialysis facilities; explicitly including a hospital component in the model would tend to make the readmission measure much more acceptable to the dialysis community. The TEP also recommended that Arbor Research/UM-KECC explore the possibility of including the physician provider (i.e., physician receiving the monthly capitation payment) as a factor in the model, so as to adjust also for this important source of patient care. It was also generally the view that the dialysis facility has little control over certain physician practices and that such adjustment would be appropriate. This type of adjustment was emphasized strongly in the context of an all-cause (rather than cause-specific) readmission measure, where the concept of shared accountability was viewed as being especially important. Concerns were raised that multiple providers often manage the same patient and that attributing care to one physician is often not feasible. It was also noted that fitting models with variables for physician would be difficult, especially given that patients are under the care of multiple physicians and attribution to a particular physician would be difficult. In addition, it was noted that there is likely a high degree of confounding between physician and facility effects, since dialysis-specific practices are under the influence of both the physician and the facility. The TEP suggested that if, on examination, adjustment for physician provider is determined to be impractical or unfeasible, Arbor Research/UM-KECC explore the inclusion as risk adjusters of measures that would be related to local (e.g., state-level) practices, such as the rate of ER visits or readmissions. H.4.5 SHR Development Some members of the TEP expressed interest in exploring a measure of hospitalization including all hospital admissions, not just readmissions. These members expressed the view that, to the extent dialysis facilities can affect hospitalization, they may do so for initial admissions at least as strongly as they can for readmissions; that is, initial admissions might be more attributable to the care of the dialysis facility than readmissions. Furthermore, it was noted that, based on the data presented by Arbor Research/UM-KECC, the distribution across diagnoses for all hospitalizations is very similar to that for readmissions. It was agreed that, per its charter, this TEP would consider only readmissions. However, the TEP strongly recommended continued development and use of the SHR as a second measure of
Arbor Research Collaborative for Health/University of Michigan Kidney Epidemiology and Cost Center Page 14
hospitalization that is relevant for dialysis facilities. The TEP recommended that more current comorbidity data be included in the risk adjustment for that measure. H.5 Summary of TEP Recommendations H.5.1 Points of General Agreement
• Develop an all-cause (versus cause-specific) readmission measure • Use past-year (versus baseline) comorbidities to account for a patient’s comorbidity status in
the model • In the spirit of coordination of care and shared accountability, include the hospital and physician
(if feasible) or aspects of physician practices as adjustors in the model • Exclude pediatric patients
H.5.2 Requests for Arbor Research/UM-KECC Analysis
• Compare methods of accounting for death without readmission within 30 days of the patient’s last hospitalization (i.e., any deaths that did not occur in the hospital but did occur within 30 days of the patient’s last discharge)
o Allow a composite endpoint in which both readmission and death within 30 days would count as the event
o Exclude admissions that resulted in death within 30 days with no readmission • Compare methods of accounting for the high rate of AMA discharges in this population
o Exclude AMA discharges (current approach) o Add AMA discharges as adjustor
• Assess the ability to use claims for risk adjustment for incident patients who are newly eligible for Medicare (i.e., age <65, not disabled) and have a limited claims history to identify comorbidities
• Explore feasibility of including the physician (nephrologist) and indicators of geographically localized practices (e.g., state rates of emergency room visits) as adjustors in the model
• In terms of adjustment, modify the currently used HC-HWR list of past-year comorbidity groups to include diagnosis groups that are more relevant to the ESRD population
• Continue development of the existing SHR as a second measure of hospitalization that is relevant for dialysis facilities
Arbor Research/UM-KECC will conduct analyses to further the development of a readmission measure. These analyses will take into account the recommendations and requests detailed above and those resulting from discussion with CMS.
H.6 Bibliography
Ahmed A, Thornton P, Perry GJ, Allman RM, DeLong JF. Impact of atrial fibrillation on mortality and readmission in older adults hospitalized with heart failure. Eur J Heart Fail. 2004;6:421–426.
Arbor Research Collaborative for Health/University of Michigan Kidney Epidemiology and Cost Center Page 15
Anderson C, Deepak BV, Amoateng-Adjepong Y, Zarich S. Benefits of comprehensive inpatient education and discharge planning combined with outpatient support in elderly patients with congestive heart failure. Congest Heart Fail. 2005;11(6):315–321.
Azevedo A, Pimenta J, Dias P, Bettencourt P, Ferreira A, Cerqueira-Gomes M. Effect of a heart failure clinic on survival and hospital readmission in patients discharged from acute hospital care. Eur J Heart Fail. 2002;4(3):353–359.
Balaban RB, Weissman JS, Samuel PA, Woolhandler S. Redefining and redesigning hospital discharge to enhance patient care: a randomized controlled study. J Gen Intern Med. 2008;23(8):1228–1133.
Bostrom J, Caldwell J, McGuire K, Everson D. Telephone follow-up after discharge from the hospital: does it make a difference? Appl Nurs Res. 1996;9(2):47–52.
Braun E, Baidusi A, Alroy G, Azzam ZS. Telephone follow-up improves patients’ satisfaction following hospital discharge. Eur J Intern Med. 2009;20(2):221–225 [Epub 2008 Aug 28].
Chan K, Lazarus M, Wingard R, et al. Association between repeat hospitalization and early intervention in dialysis patients following hospital discharge. Kidney Int. 2009;76:331–341.
Coleman EA, Smith JD, Frank JC, Min SJ, Parry C, Kramer AM. Preparing patients and caregivers to participate in care delivered across settings: the Care Transitions Intervention. J Am Geriatr Soc. 2004;52(11):1817–1825.
Coleman E, Parry C, Chalmers S, et al. The care transitions intervention. Arch Intern Med. 2006;166:1822–1828.
Creason H. Congestive heart failure telemanagement clinic. Lippincotts Case Manag. 2001;6(4):146–156.
Dudas V, Bookwalter T, Kerr KM, Pantilat SZ. The impact of follow-up telephone calls to patients after hospitalization. Am J Med. 2001;21(111 9B):26S–30S.
Dunn RB, Lewis PA, Vetter NJ, Guy PM, Hardman CS, Jones RW. Health visitor intervention to reduce days of unplanned hospital re-admission in patients recently discharged from geriatric wards: the results of a randomised controlled study. Arch Gerontol Geriatr. 1994;18(1):15–23.
Jack B, Chetty V, Anthony D, et al. A reengineered hospital discharge program to decrease rehospitalizaton. Annals Intern Med. 2009;150:178–188.
Koehler BE, Richter KM, Youngblood L, Cohen BA, Prengler ID, Cheng D, Masica AL. Reduction of 30-day post-discharge hospital readmission or emergency department (ED) visit rates in high-risk elderly medical patients through delivery of a targeted care bundle. J Hosp Med. 2009;4(4):211–218.
McDonald K, Ledwidge M, Cahill J, et al. Elimination of early rehospitalization in a randomized, controlled trial of multidisciplinary care in a high-risk, elderly heart failure population: the potential contributions of specialist care, clinical stability and optimal angiotensin-converting enzyme inhibitor dose at discharge. Eur J Heart Fail. 2001;3(2):209–215.
Arbor Research Collaborative for Health/University of Michigan Kidney Epidemiology and Cost Center Page 16
Naylor M, Brooten D, Jones R, Lavizzo-Mourey R, Mezey M, Pauly M. Comprehensive discharge planning for the hospitalized elderly. A randomized clinical trial. Ann Intern Med. 1994;120(12):999–1006.
Parry C, Min SJ, Chugh A, Chalmers S, Coleman EA. Further application of the care transitions intervention: results of a randomized controlled trial conducted in a fee-for-service setting. Home Health Care Serv Q. 2009;28(2-3):84–99.
Plantinga L, Jaar B. Preventing repeat hospitalizations in dialysis patients: a call for action. Kidney Int. 2009;76:249–251.
Arbor Research Collaborative for Health/University of Michigan Kidney Epidemiology and Cost Center Page 17
Anemia Management TEP The TEP was convened to make recommendations regarding the development of quality measures for anemia management that reflect current understanding about the most effective care of the anemia of chronic disease in dialysis patients, including consideration of FDA guidance on use of erythropoiesis-stimulating agents (ESAs), as well as published and forthcoming clinical practice guidelines. (UK-NICE, CARI, KDIGO) Specifically, the TEP was charged to: 1) Identify one or more outcomes suitable for development as a measure of dialysis facility quality of care in the area of anemia management. 2) Recommend measure specifications including specific numerator, denominator, inclusion, exclusion criteria, and whether risk-adjustment is appropriate.
A.1 Background
Members of the TEP introduced themselves and were asked to report any potential conflicts of interest.
A.1.1 Literature Review
The TEP was presented with a review of anemia management that covered relevant clinical trials and recent changes to ESA reimbursement. The review included content from the Normal Hematocrit Trial, CHOIR, CREATE, TREAT, ACORD primary reports, selected secondary analyses of these trials, observational analyses of achieved Hgb/Hematocrit vs. patient outcomes and meta-analyses evaluating ESRD anemia treatment and patient outcomes. In addition, the relationship between transfusion and anemia targets and outcomes was reviewed. (references 1-15, 17) During that presentation, it was noted that in most trials that evaluated the impact of Hgb level on patient-reported quality of life, patients were aware of their Hgb level and that knowledge may have biased the results. A member noted that it was important to differentiate between statistically significant and clinically meaningful differences in quality of life measurement (in reference to the TREAT trial). The TREAT data was then reviewed in more detail to address that comment. Data regarding poor ESA response as a predictor for outcome was reviewed (slide 29). The study (Solomon, et al. NEJM 2010) showed that a group with poor initial response (after four weeks) had worse outcomes (death, myocardial infarction, stroke, heart failure, or hospitalization for myocardial ischemia). It was noted by one TEP member that the FDA performed similar analyses (looking at 4, 8, and 12 weeks) that showed consistent results at each of the time periods. It was also noted that in these studies there were the presence of poor responder patients who could eventually get their hemoglobin levels up to a target with more time and more darbepoetin.
The TEP reviewed details of the most recent Epogen package insert and highlights the following three dosing recommendations from section 2.2.
For patients with CKD on dialysis: • Initiate Epogen treatment when the hemoglobin level is less than 10 g/dL. • If the hemoglobin level approaches or exceeds 11 g/dL, reduct or interrupt the dose of
Arbor Research Collaborative for Health/University of Michigan Kidney Epidemiology and Cost Center Page 18
• If hemoglobin level exceeds 10 g/dL, reduce or interrupt the doseof Epogen, and use the lowest dose of Epogen sufficient to reduce the need for RBC transfusions.
It is noted that the hemoglobin cutoffs in these recommendations do not exactly mirror the data (such as targeted Hgb levels) of the recent randomized clinical trials (e.g. TREAT, CHOIR, and CREATE). The group reviewed the KDIGO guidelines that were provided pre-publication. Discussion ensued about the guidelines recommendation of when to start an ESA and the target achieved. KDIGO guidelines for ESA Initiation stated below:
ESA INITIATION 3.1: Address all correctable causes of anemia (including iron deficiency and inflammatory states) prior to initiation of ESA therapy. (Not Graded) 3.2: In initiating and maintaining ESA therapy, we recommend balancing the potential benefits of reducing blood transfusions and anemia-related symptoms against the risks of harm in individual patients (e.g., stroke, vascular access loss, hypertension). (1B) 3.3: We recommend using ESA therapy with great caution, if at all, in CKD patients with active malignancy—in particular when cure is the anticipated outcome— (1B), a history of stroke (1B), or a history of malignancy (2C). 3.4.1: For adult CKD ND patients with Hb concentration ≥10.0 g/dl (≥100 g/l), we suggest that ESA therapy not be initiated. (2D) 3.4.2: For adult CKD ND patients with Hb concentration <10.0 g/dl (<100 g/l) we suggest that the decision whether to initiate ESA therapy be individualized based on the rate of fall of Hb concentration, prior response to iron therapy, the risk of needing a transfusion, the risks related to ESA therapy and the presence of symptoms attributable to anemia. (2C) 3.4.3: For adult CKD 5D patients, we suggest that ESA therapy be used to avoid having the Hb concentration fall below 9.0 g/dl (90 g/l) by starting ESA therapy when the hemoglobin is between 9.0-10.0 g/dl (90-100 g/l). (2B) 3.4.4: Individualization of therapy is reasonable as some patients may have improvements in quality of life at higher Hb concentration and ESA therapy may be started above 10.0 g/dl (100 g/l). (Not Graded) 3.4.5: For all pediatric CKD patients, we suggest that the selection of Hb concentration at which ESA therapy is initiated in the individual patient includes consideration of potential benefits (e.g., improvement in quality of life, school attendance/performance, and avoidance of transfusion) and potential harms. (2D).
Discussion that followed noted that guideline 3.4.2 states that when the HGB is below 10, other individual patient characteristics, and considerations should be looked at to determine if therapy should be initiated. One may or may not choose to begin ESA therapy, and 10 is not a target if one chooses to. There was some discussion about why 10 was chosen as the cut off and not some other number or a confidence interval. It was noted that the rational section of the guidelines provides additional information, and in addition the grade of 2c may reflect some of the uncertainty in the number.
KDIGO guidelines about Maintenance Therapy of ESAs were also discussed:
Arbor Research Collaborative for Health/University of Michigan Kidney Epidemiology and Cost Center Page 19
3.5.1: In general, we suggest that ESAs not be used to maintain Hb concentration above 11.5 g/dl (115 g/l) in adult patients with CKD. (2C) 3.5.2: Individualization of therapy will be necessary as some patients may have improvements in quality of life at Hb concentration above 11.5 g/dl (115 g/l) and will be prepared to accept the risks. (Not Graded) 3.6: In all adult patients, we recommend that ESAs not be used to intentionally increase the Hb concentration above 13 g/dl (130 g/l). (1A) 3.7: In all pediatric CKD patients receiving ESA therapy, we suggest that the selected Hb concentration be in the range of 11.0 to 12.0 g/dl (110 to 120 g/l). (2D)
It was noted that only 3.6 was graded 1A. One TEP member wanted more clarification on the purpose and authority of these guidelines. It was discussed that these guidelines are meant to provide guidance to the nephrologists and his or her patients. There are disclaimers mentioning that they are not be used for legal disputes, or reimbursement decisions, etc. One TEP member read out the exact disclaimer from the KDIGO document, "It is designed to provide information and assist decision making. It is not intended to define a standard of care, and should not be construed as one, nor should it be interpreted as prescribing an exclusive course of management…"
It is noted that when a measure is submitted to NQF, there is an area asking if the measures are based on a guideline or a recommendation. The NQF pays attention to these as part of the justification of a measure because of the systematic review and grading of the literature, and the inherent consensus of expert opinions represented in guidelines and recommendations such as KDIGO.
A.1.2 Prior Anemia Measures Submitted
The TEP reviewed the anemia measures that have previously been submitted to and/or endorsed by the National Quality Forum (NQF; see Table 5). It was noted that 3 of the 4 currently endorsed measures are pediatric measures. A comment was made that there is more variability in anemia management in the pediatric age group compared to adults, so that guidelines were needed to help standardize practice. Additional discussion focused on the AMA/PCPI measure for Hgb < 10 that did not receive NQF endorsement. At the time, there had been discussion about a one month vs. three month rolling average for the Hgb measure and that focusing on a monthly hemoglobin could lead some providers to manipulate monthly trends that are not clinically important. A TEP member noted that there exists inherent variability in a dialysis patient’s measured values (such as Hgb), and this needs to be accounted for in any measures that the group considers. A TEP member responded that case-mix adjustment and exclusion criteria could help address some of the variability that is present. When possible, the measures should be harmonized across all ages if appropriate.
Table 5: Anemia measures that have previously been submitted to and/or endorsed by the National Quality Forum (NQF).
NQF # Year & Source Measure Description NQF status n/a 2008
CMS DFC End stage renal disease (ESRD): percentage of hemodialysis and peritoneal dialysis patients, with ESRD greater than or equal to 3 months, who have a mean
Arbor Research Collaborative for Health/University of Michigan Kidney Epidemiology and Cost Center Page 20
NQF # Year & Source Measure Description NQF status hemoglobin less than 10 g/dL for a 12 month reporting period, treated with ESA
n/a 2008 CMS DFC
End stage renal disease (ESRD): percentage of hemodialysis and peritoneal dialysis patients, with ESRD greater than or equal to 3 months, who have a mean hemoglobin greater than 12 g/dL for a 12 month reporting period, treated with ESA
Not submitted
n/a 2008 CMS
End stage renal disease (ESRD): percentage of adult (greater than or equal to 18 years old) hemodialysis and peritoneal dialysis patients, with ESRD greater than or equal to 3 months, who had received ESA therapy at any time during a 3 month study period AND who had Hb values reported for at least 2 of the 3 study months AND have achieved a mean hemoglobin of 10.0-12.0 g/dL for the 3 month study period
Not endorsed
0370 2008 CMS
End stage renal disease (ESRD): percentage of all adult (greater than or equal to 18 years old) hemodialysis and peritoneal dialysis patients, with ESRD greater than or equal to 3 months and who had Hb values reported for at least 2 of the 3 study months, who have a mean Hb less than 10.0 g/dL for a 3 month study period, irrespective of ESA use
Time-limited endorsement 2008-2011; Full endorsement not sought in 2011. Measure withdrawn by CMS
0252 2008 CMS
End stage renal disease (ESRD): percentage of all adult (greater than or equal to 18 years old) hemodialysis and peritoneal dialysis patients prescribed an ESA at any time during the study period or who have a Hb less than 11.0 g/dL in at least one month of the study period for whom serum ferritin concentration AND either percent transferrin saturation or reticulocyte Hb content (CHr) are measured at least once during the study period for in-center hemodialysis patients, and at least twice during the study period for peritoneal dialysis patients and home hemodialysis patients
Endorsed 2008-2011; re-endorsement not sought as replacement measures were submitted
1424 2011 CMS
Monthly Hemoglobin Measurement for Pediatric Patients Number of pediatric (<18 years old) hemodialysis and peritoneal dialysis patients who have monthly measures for hemoglobin. The hemoglobin value reported for the end of each reporting month (end-of month hemoglobin) is used for the calculation.
Endorsed 2011
1430 2011
CMS Lower Limit of Hemoglobin for Pediatric Patients Number of pediatric (<18 years old) hemodialysis and peritoneal dialysis patients, with End Stage Renal Disease (ESRD) >= 3 months, who have a mean hemoglobin <10.0 g/dL for a 3 month reporting period, irrespective of erythropoiesis-stimulating agent (ESA) use. The hemoglobin value reported for the end of each
Endorsed?; No information present on NQF site but CSAC mtg. notes (8/2011) recommend endorsement Measure withdrawn
Arbor Research Collaborative for Health/University of Michigan Kidney Epidemiology and Cost Center Page 21
reporting month (end-of-month hemoglobin) is used for the calculation.
by CMS
1433 2011 CMS
Use of Iron Therapy for Pediatric Patients Number of patients in the denominator who received IV iron or were prescribed oral iron within three months following the first occurrence of serum ferritin <100 ng/mL and transferrin saturation (TSAT) <20% during the study period
Time-limited Endorsement 2011
1666 2011 AMA/PCPI
Patients on Erythropoiesis Stimulating Agent (ESA)- Hemoglobin Level > 12 g/dL Calendar months during which patients have a Hemoglobin level > 12.0 g/dL*
*The hemoglobin values used for this measure should be a most recent (last) hemoglobin value recorded for each calendar month
Endorsed 2011
1667 2011 AMA/PCPI
(Pediatric) ESRD Patients Receiving Dialysis: Hemoglobin Level < 10 g/dL. Calendar months during which patients have a Hemoglobin level <10 g/dL*
*The hemoglobin values used for this measure should be the most recent (last) hemoglobin value recorded for each calendar month
Endorsed 2011
1426 2011 CMS
Assessment of Iron Stores Number of patients in the denominator for whom serum ferritin and TSAT are measured simultaneously at least once during the study period. Simultaneous measurements are those reported with the same collection date
Not endorsed
1428 2011 CMS
Use of Iron Therapy When Indicated Number of patients in the denominator who received IV iron within three months following the first occurrence of serum ferritin < 100 ng/mL and TSAT < 50% during the study period.
Not endorsed
1429 2011 CMS
Avoidance of Iron Therapy in Iron Overload Number of patients in the denominator who did not receive IV iron within three months following the first occurrence of serum ferritin >= 1200 ng/mL or TSAT >=50% during the study period.
Not endorsed
1431 2011 CMS
Measurement of Iron Stores for Pediatric Patients Number of dialysis patients in the denominator for whom serum ferritin concentration and percent transferrin saturation (TSAT) are measured at least once in a three-month study period for all hemodialysis and peritoneal dialysis patients
Not endorsed
1660 2011 AMA/PCPI
ESRD Patients Receiving Dialysis: Hemoglobin Level < 10 g/dL Calendar months during which patients have a hemoglobin (Hgb) level <10g/dL* *The hemoglobin values used for this measure should
Arbor Research Collaborative for Health/University of Michigan Kidney Epidemiology and Cost Center Page 22
be the most recent (last) hemoglobin result recorded for each calendar month
The group reviewed the NQF submission form and discussed logistics including primary vs. intermediate outcomes, recognition of performance gaps, and the value of expert opinion when evidence is lacking.
The topic of the Usability requirement for NQF led to a discussion of whether there is a subtext for use of measures in reimbursement policy. It is noted that the TEP, the NQF, as well as the KDOQI guidelines, are not intended to set reimbursement policy, but to focus on quality. The TEP does not control how and by whom a measure is used, but can only control how good of a measure is that gets submitted, and the job of the TEP is to come up with the best quality measure possible..
A TEP member urged the group to consider downstream consequences of the measure development. The member argued that even though a measure’s use cannot be controlled, it can be predictable based on history and it is important to consider as it can profoundly affect patient care. Some pushback was given noting that since it is unknown what will happen downstream, trying to engineer a measure based on that can be dangerous and can keep us from achieving our best goal. If the TEP focuses on measures that protect patients from all corners and try to achieve the best outcomes, and trust that others are going to do the same thing, we are going to get to a good endpoint.
A.1.3 Potential Areas for Measure Development
As a way to map out what the TEP was interested in discussing, the group then began to consider all possible and potential areas for measure development before judging the feasibility and desirability of the measures. The list of all possible measure topics included: Hgb, amount of ESA used, cost of anemia management, reduction or avoidance of ESA or iron, transfusion rates (number of patients vs. number of units), cardiovascular events (congestive heart failure, stroke, death), quality of life, employment, return to work, exercise tolerance, ultrafiltration tolerance, physical function, neurocognitive function.
A1.3.1 Quality of Life: A TEP member underscored the importance of anemia management from a patient’s perspective as it relates to quality of life and a risk-benefit tradeoff. It was noted that different patients strike that balance at different places. A TEP member pointed out that there has never been a high quality clinical trial that evaluated QOL as a primary outcome, only as secondary outcomes. The TEP reviewed two meta-analysis papers that evaluated quality of life with different Hgb targets in the CKD and ESRD populations. A TEP member added that while anemia management may impact specific issues like oxygen carrying capacity; these effects are difficult to determine when measured globally.
The TEP discussed QOL results from some of the clinical trials to highlight that incremental benefit has not been demonstrated with Hgb above the 9.5-11 g/dL range. The TEP noted limitations in the studies, but a TEP member responded that if the goal is to provide a safety net, then the level of evidence need not be level 1A. It was noted that there may be potential consequences of waiting for the most solid data to make a decision. (refs 19-22)
The group discussed QOL as a potential measure and acknowledged that it would be difficult to use patient reported outcomes in a measure. It was suggested that QOL, along with transfusion, could be used as a justification for a measure such as achieved Hgb. There was some discussion about harmonization, and the importance that the NQF places on it. It was noted that as imperfect as Hgb is,
Arbor Research Collaborative for Health/University of Michigan Kidney Epidemiology and Cost Center Page 23
there are measures in existence that use achieved Hgb, such as a pediatric measure and the AMA/PCPI measures. A TEP member indicated that the previous NQF measure submissions had difficulty with justification of a lower bound for Hgb level, because of the lack of a strong case for that particular limit. However, it was noted that perhaps the group was moving towards a justification on the low end based on transfusion avoidance or QOL risks. The TEP noted the importance of QOL and patient reported outcomes and the need for further study.
A.1.3.2 Avoidance of ESA: Additional discussion focused on avoidance of ESA and the difficulty in determining whether it is the achieved Hgb, the ESA dose, or both that confers risk. There was some discussion about how a measure might address the individualization of management. One idea presented had to do with ESA dose adjustment. For example, if a physician started a patient on certain dose, observed a response in HGB, and adjusted the dose appropriately, could we judge the appropriateness of that adjustment. It was noted that much of the dosing decisions are aided by algorithms. Another hypothetical example presented involved two patients with two different appropriate HGB targets (one and 8 and one at 12.5). A measure of success could be keeping each of the patients near their appropriate targets. While there was consensus that these ideas are generally appropriate, they were operationally impractical given the large number of patients that are seen by each physician.
A1.3.3 ESA Dose: The TEP discussed ESA dose as a possible measure topic. The TEP members outlined several important aspects of dose (starting dose, dose titration, mass adjusted dose, relation to achieved Hgb). Some of the problems identified included a lack of clinical justification for what constitutes a high dose, poor usability (NQF criteria) due to the difficulty in explaining a complicated multi-faceted topic area, and the confounding in research studies of ESA resistance, ESA dose, and achieved Hgb. There was discussion of a measure related to the percentage of patients with EPO equivalent dose of less than 150 units per kg per week, and possibly linked to an achieved Hgb (through an exclusion criterion). Ultimately, the discussion of developing a measure based on ESA dose was put on hold as there was no consensus in what direction to take it, although there was general agreement that it is an important area with a need for additional research.
A.1.3.4 Iron Dose: There was discussion regarding iron use. Most of the discussion revolved around the problems that were encountered by the 2010 TEP that submitted a measure related to iron use that was not endorsed by NQF, such as T-sat and Ferritin being inadequate even though they are the most widely used markers of iron. There is general consensus that a snapshot measure of iron is not adequate without additional information about trends in iron, HGB levels, and ESA dose. It was noted that there are no studies that have looked at patient outcomes, or targeting Hgb levels, in which the manipulation was more or less iron. The underuse of iron in the past was mentioned, and the TEP agreed that with the current economic incentives with the bundled payment (iron is less expensive than ESAs), underuse is not likely to be a problem in the future. The discussion does not lead to any details of a measure. There was general agreement that iron is important, but not an area that can support an acceptable measure at this time.
Arbor Research Collaborative for Health/University of Michigan Kidney Epidemiology and Cost Center Page 24
The TEP then reviewed the remaining list of possible measures and removed ones that, although considered important, would be too difficult to implement at the present time.The TEP members were in agreement to remove the following:
• Neurocognitive function • Vocational rehabilitation • Exercise tolerance (it is difficult to determine the individually the impact of anemia
management) • UF tolerance • Cost of anemia management ( doesn't seem to be patient related) • Cardiovascular events (Congestive Heart Failure hospitalized admits (CHF). Not attributable
enough to anemia management (more focused on fluid management). It is too diffuse and too multi-factorial.
A.1.4 Blood Transfusions
The topic then moved towards transfusions and a TEP member proposed that not all transfusions should be considered “bad”, particularly if they help to avoid the reported risks of ESAs in certain situations. Another TEP member agreed and stated that while transfusions are often assumed to be inherently bad there is probably gradations of inappropriateness. For example, for a patient who is waiting for a transplant, or who is young and will probably receive a transplant at some point, a transfusion is more inappropriate than for a patient who may be very ESA hypo-responsive, have lots of comorbidities, be in and out of the hospital and every time they leave the hospital they come out on another 15,000 units a week of EPO. That patient may be better served by getting zero ESAs and being transfused as necessary. In general, caution needs to be taken with how wide a brush is used to describe the appropriateness of transfusions.
Another TEP member noted that very few centers transfuse during dialysis. This means that patients are getting their blood elsewhere in places that may have someone who does not know or understand the needs of a dialysis patient. They may not be trained in sticking access, and the patient’s volume, citrate and potassium is not removed. The member noted that this is not a good physiological trade off and that in general, transfusion offsite adds a large additional burden on the patient’s associated risk.
Interspersed in the conversation of appropriateness of transfusions was some discussion about the impact of the labeling and reimbursement changes of the last few years. One TEP member noted that, with the updated FDA label, the incidence of transfusions is rising and that patients in his area are starting dialysis with over a gram and a half lower Hgb values in 2012 than in 2010. He expressed concern that this is a result of the downstream effect of the labeling changes, possibly the delay in treatment with ESAs, and lower doses being used.
Another TEP member quoted data from their group (unknown source) that showed since Dec 2011, for their patients getting ESAs, the average is 10.94 g/dL (which has dropped). The percent of patients over 12 has dropped from 32% to 22%, the percent with less than 10 has increased from 9% to 16%, and less than 9 has gone from 3% to 5.2%. Another member notes that as we see national HGB levels trending downward, we tend towards a greater need for transfusions that could be avoided if we were maintaining a higher level.
Arbor Research Collaborative for Health/University of Michigan Kidney Epidemiology and Cost Center Page 25
An analysis of transfusion events as a function of achieved Hgb was presented to facilitate discussion, based on data for predominantly outpatient transfusion events from Medicare claims (see Figure 1). In addition, results of a secondary analysis of the Canadian/European trial of normalization of hemoglobin were presented to facilitate discussion of transfusion rates and their relationship to achieved hemoglobin. (ref 17)
Figure 1
The group continued to discuss low Hgb values and it was noted that it is unclear that patients are doing less well as a result of the Hgb curve shifting to the left and that additional study is needed. A TEP member added that with removal of the Hgb < 10, the safety net has been removed and there may be an opening for providers to use less ESA. A TEP member indicated that with lower ESA use we are seeing better iron management. It was noted that if we take away a floor altogether, there will be more dialysis patients that are left feeling poorly.
Data was presented on facility level variation in transfusion practices that was prepared by KECC. Discussion followed regarding whether all transfusions were considered “bad” and there was agreement that for transplant eligible patients (and possibly patients with pending decisions about wait-listing), transfusions should be avoided due to the risk of sensitization. The TEP then discussed groups of patients for which transfusions would be considered appropriate (e.g. chronic bone marrow failure, cancer, sickle cell disease, poor ESA responder, etc). There was consensus that if you could define a subset of patients where transfusion was preferable to ESA therapy, then transfusion as an alternative to ESA therapy would be a poorer option for the inverse of that subset. The topic was then put on hold for later discussion.
Arbor Research Collaborative for Health/University of Michigan Kidney Epidemiology and Cost Center Page 26
There is further discussion about the risks of patients being at the low end of achieved Hgb. It is stated, and generally agreed upon by the TEP, that the closer a patient is to a Hgb of 7 g/dL, the more likely he or she is to receiving a transfusion (either by the facility or in the hospital). In addition, if the average Hgb of patients in a facility (or the nation) falls, there will be more patients at the low end. This is due to the bell shaped distribution of achieved Hgb, for which it is very difficult to reduce the standard deviation. These patients that fall in the low end of the Hgb scale will be more likely to receive transfusions.
In addition, there was a reiteration that based on years of clinical experience in the room, and the message from the QOL literature (as small and uncertain it is), that there is a difference for Hgbs in the very low range. Specifically there seems to be a difference in QOL between severe anemia (7/8) and 9/10. That difference, along with increased transfusions, is the risk of maintaining the current absence of a low end Hgb target.
A.2 Prototype Measures
The remaining topic areas of hemoglobin and transfusions were discussed and resulted in the creation of three prototype measures to address risk of transfusions and quality of life. The details of the measures and corresponding discussions are provided below.
Numerator: number of patients of the denominator with one or more red cell transfusions in the reporting period (one year/three year)
Denominator: Prevalent (90/120 d) dialysis patients with possible exclusions for transfusion appropriate patients
Possible Exclusions: • Hemoglobinopathy • Myelodysplasia • Myeloma • Active malignancy • Sickle cell • Age > 70 years (less likely to be transplanted)
Rationale: Limitations of using claims data as a source was discussed. The group considered several ways of expressing transfusion rates, such as average number of transfusions per patient-year, one or more transfusions, or time to first transfusion. The issue of the transfusion “deductible” (where the first two units of blood are not reimbursed by CMS) was discussed and will need to be addressed. The potential difficulty with identifying transfusion records in a timely manner (final adjudicated claims arrive 6 months after the close of the year) was also discussed. A discussion of the denominator involved defining incident vs. prevalent patients. USRDS was noted to use 90 days, while the QIP uses 4 months. Some members of the TEP expressed concern that by limiting to prevalent patients, a high-impact period would be missed where transfusions could be given. Difficulties were discussed that related to knowledge of pre-existing conditions for incident patients, and claims only being available for patients that were already Medicare-eligible during the incident period. There was general agreement
Arbor Research Collaborative for Health/University of Michigan Kidney Epidemiology and Cost Center Page 27
that it would be difficult to attribute new patients to the facility practices and the issue of incident patients would need to be addressed separately. The TEP felt strongly that there is a need to collect data on transfusion in the first 90 days, so that a future measure could be developed, and that we are limited by data collection at the present time
The impact of transfusion on allosensitization was discussed. It was noted that while the level of scientific knowledge may be lacking, transfusions do have an impact on access to kidney transplantation through the wait-listing process. It was noted that having a measure that discouraged transfusion use emphasized the need for a measure to discourage low Hgb level. Otherwise there could be financial incentives for giving low ESA doses, not transfusing when necessary, and as a result keeping patients at low Hgb levels detrimental to their QOL. Exclusion criteria were discussed and how those criteria would impact the face validity of a measure. It was suggested that KECC staff could explore risk-adjusted models and present those analyses to the group to see what adjustments impact the risk of transfusion. The TEP agreed and requested that such an analysis be performed.
A.2.2 Achieved Hgb level to avoid symptomatic anemia and transfusions
Numerator: Number of patients from denominator whose 3 month average Hgb is ≤ 10 g/dl
Denominator: Prevalent patients with at least 2 Hgb measures in a quarter with exclusions as noted in the transfusion measure above
Rationale: Hgb below 10 was associated with increased risk of transfusions and thought to be detrimental to QOL. The TEP was presented with a summary of clinical trial data related to change in Hgb and PRO and suggested that Hgb < 10 d/dl should be considered a provisional proxy for the PRO benefit of increased Hgb. The TEP felt that current economic incentives would encourage providers to target an Hgb just above the lower end of any specified range. The TEP then discussed guidelines from other countries (NICE, Australia), and the potential benefits and challenges of using rolling averages. There was brief consideration of excluding recently hospitalized patients, but was not felt to be feasible. The group considered using guidelines as a basis vs. direct study evidence. There was a vote between using 9.5 g/dl and 10.0 g/dl; 5 votes for 10, 1 vote for 9.5; the two non-voting members did not vote.
A.2.3 Achieved Hgb level to avoid adverse outcomes
Numerator: Number of patients from denominator whose 3 month average Hgb is ≥ 12 or 13 g/dl.
Denominator: Prevalent patients, receiving ESA therapy in the quarter, with at least 2 Hgb measures in a quarter
Rationale: Hgb greater than 12 is beginning to get close to where there is a safety concern, and it is hard to show an incremental benefit between 12 and 13. The TEP discussed the distribution of achieved Hgb in terms of mean and standard deviation. There was appreciation the reasonable floor and ceiling measures would need to be separated by approximately 2 g/dl given the standard deviation of 1 g/dl that has been consistently reported. It was noted that due to significant variability in achieved Hgb at the patient level, there will be a significant number of people who fall outside of any given target, and that is not necessarily reflective of poor practice.
Arbor Research Collaborative for Health/University of Michigan Kidney Epidemiology and Cost Center Page 28
A TEP member asked about creating a composite measure vs. two separate measures for high and low Hgb. Given the separate justification (safety signal on the high end, transfusion and QOL on the low end) it was agreed that two separate measures would be best. It was noted that the clinical studies looked at an Hgb of 13 g/dl and so the TEP should consider that as the higher target. It was noted that the QIP would be a limiting factor in facilities allowing Hgb values to exceed 12 g/dl and approach 13 g/dl. In addition, there was discussion that within the dialysis community, a limit of 13 g/dl would not be taken seriously. The TEP reviewed the KDIGO guidelines with regards to the upper bound of Hgb level, and felt the guideline would support the level of 13 g/dl.
There was a vote between using 12 g/dl and 130 g/dl; 3 votes for 12, 3 votes for 13; the two non-voting members did not vote. In support of an Hgb value of 13 g/dl, a TEP member stated that, given the Hgb variation, facilities should not be penalized if patients have been advised of potential risks, and are able to achieve a higher Hgb with a lower dose of an ESA. It was noted that 13 harmonizes with KDIGO, and is in the range of what was targeted in the randomized trials. In support of the 12 g/dl target, a TEP member’s main concern was the practicality of getting the measure accepted and endorsed. Harmonization with other NQF measures was also cited as justification. The TEP discussed the lack of evidence to support improved PRO between 12 and 13 g/dl. A vote was held a second time, and no members of the TEP changed their vote.
A.3 Recommended Areas for Further Research
Quality Measures related to several areas could not be developed due to information gap, feasibility and implementability issues. However, there was consensus among the TEP members about the importance of these areas and the need for future research and measure development.
• Quality of Life • Successful vocational rehabilitation • Exercise tolerance • Overall functional status outcomes • Other patient reported outcomes
• Iron use • ESA dose • Transfusion rates in incident patients
A.4 Conclusion
The purpose of the TEP meeting was to identify measures that contain clinical and methodological properties that could be adapted and used to define quality measures for the ESRD setting. Our evaluation took into account criteria prioritized by CMS: measures have clinical importance, that are accurate (reliable, valid and risk-adjusted if necessary), that can be used to differentiate one facility or provider from another, that can be modified by high quality care, and that could be supported by national consensus methods as operationalized by the National Quality Forum consensus development process.
Arbor Research Collaborative for Health/University of Michigan Kidney Epidemiology and Cost Center Page 29
1. Canadian Erythropoietin Study Group. “Effect of recombinant human erythropoietin therapy on blood pressure in hemodialysis patients.” British Med J. (1990) 300;573-78.
2. Besarab A, Bolton WK, Browne JK, et al. “The Effects of Normal As Compared With Low Hematocrit Values in Patients With Cardiac Disease Who Are Receiving Hemodialysis and Epoetin” N Engl J Med (1998) 339:584-90.
3. Collins AJ, Li S, St Peter W, et al. “Death, Hospitalization, and Economic Associations Among Incident Hemodialysis Patients With Hematocrit Values of 36 to 39%” J Am Soc Nephrol (2001) 12:2465-73.
4. Li S, Collins AJ. “Association of Hematocrit Value with Cardiovascular Morbidity and Mortality in Incident Hemodialysis Patients.” Kidney Int (2004) 65:626-33.
5. Cotter DJ, Stefanik K, Zhang Y, et al. “Hematocrit was not validated as a surrogate end point for survival among epoetin-treated hemodialysis patients.” J Clin Epidemiol (2004) 57:1086-95.
6. Regidor DL, Kopple JD, Kovesdy CP, et al. "Associations between changes in hemoglobin and administered erythropoiesis-stimulating agent and survival in hemodialysis patients." Journal of the American Society of Nephrology : JASN (2006) 17:1181-91. PMID: 16565261
7. Drüeke TB, Locatelli F, Clyne N, et al. "Normalization of hemoglobin level in patients with chronic kidney disease and anemia." The New England journal of medicine (2006) 355:2071-84. PMID: 17108342
8. Ritz E, Laville M, Bilous R, et al. “Target Level for Hemoglobin Correction in Patients with Diabetes and CKD: Primary Results of the Anemia Correction in Diabetes (ACORD) Study” Am J Kidney Dis (2007) 49:194-207.
9. Singh AK, Szczech L, Tang KL, et al. "Correction of anemia with epoetin alfa in chronic kidney disease." The New England journal of medicine (2006) 355:2085-98. PMID: 17108343
10. Strippoli G, Craig J, Manno C, et al. “Hemoglobin Targets for the Anemia of Chronic Kidney Disease: A Meta-analysis of Randomized, Controlled Trials” J Am Soc Nephrol (2004) 15:3154-65.
11. Phrommintikul A, Haas SJ, Elsik M, et al. "Mortality and target haemoglobin concentrations in anaemic patients with chronic kidney disease treated with erythropoietin: a meta-analysis." Lancet (2007) 369:381-8. PMID: 17276778
12. Szczech LA, Barnhart HX, Inrig JK, et al. "Secondary analysis of the CHOIR trial epoetin-alpha dose and achieved hemoglobin outcomes." Kidney international (2008) 74:791-8. PMID: 18596733
13. Pfeffer MA, Burdmann EA, Chen CY, et al. "A trial of darbepoetin alfa in type 2 diabetes and chronic kidney disease." The New England journal of medicine (2009) 361:2019-32. PMID: 19880844Lewis, et al. CJASN 2011
14. Solomon SD, Uno H, Lewis EF, et al. "Erythropoietic response and outcomes in kidney disease and type 2 diabetes." The New England journal of medicine (2010) 363:1146-55. PMID: 20843249
15. Szczech LA, Barnhart HX, Sapp S, et al. “A Secondary Analysis of the CHOIR Trial Shows That Comorbid Conditions Differentially Affect Outcomes During Anemia Treatment” Kidney Int (2010) 77:239-246.
Arbor Research Collaborative for Health/University of Michigan Kidney Epidemiology and Cost Center Page 30
16. Ibrahim HN, Ishani A, Foley RN, et al. “Temporal Trends in Red Blood Transfusion Among US Dialysis Patients, 1992-2005” Am J Kidney Dis (2008) 55:1115-1121.
17. Parfrey PS, Foley RN, Wittreich BH, et al. "Double-blind comparison of full and partial anemia correction in incident hemodialysis patients without symptomatic heart disease." Journal of the American Society of Nephrology : JASN (2005) 16:2180-9. PMID: 15901766
18. Foley RN, Curtis BM, Parfrey PS. "Hemoglobin targets and blood transfusions in hemodialysis patients without symptomatic cardiac disease receiving erythropoietin therapy." Clinical journal of the American Society of Nephrology : CJASN (2008) 3:1669-75. PMID: 18922988
19. Gandra SR, Finkelstein FO, Bennett AV, et al. "Impact of erythropoiesis-stimulating agents on energy and physical function in nondialysis CKD patients with anemia: a systematic review." American journal of kidney diseases : the official journal of the National Kidney Foundation (2010) 55:519-34. PMID: 20031287
20. Johansen KL, Finkelstein FO, Revicki DA, et al. "Systematic review and meta-analysis of exercise tolerance and physical functioning in dialysis patients treated with erythropoiesis-stimulating agents." American journal of kidney diseases : the official journal of the National Kidney Foundation (2010) 55:535-48. PMID: 20133033
21. Johansen KL, Finkelstein FO, Revicki DA, et al. "Systematic review of the impact of erythropoiesis-stimulating agents on fatigue in dialysis patients." Nephrology, dialysis, transplantation : official publication of the European Dialysis and Transplant Association - European Renal Association (2011). PMID: 22187314
22. Lewis EF, Pfeffer MA, Feng A, et al. “Darbepoetin Alfa Impact on Health Status in Diabetes Patients with Kidney Disease: A Randomized Trial” Clinical journal of the American Society of Nephrology (2011) 6:845-55.


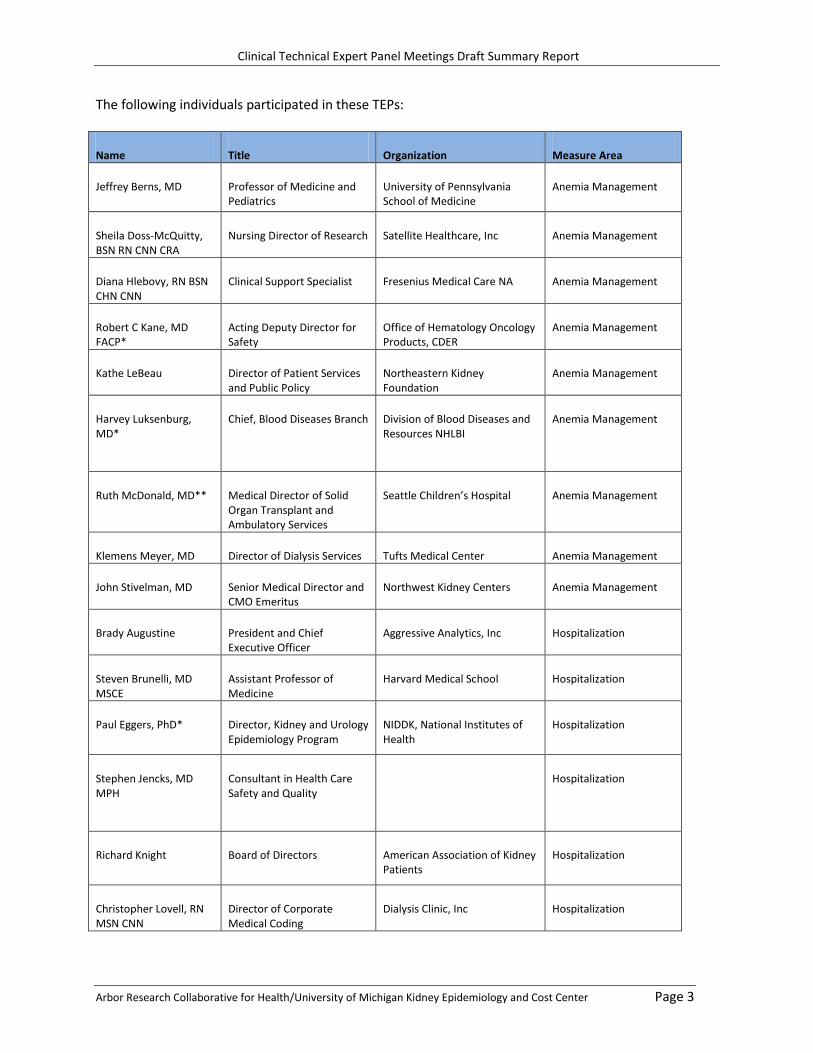


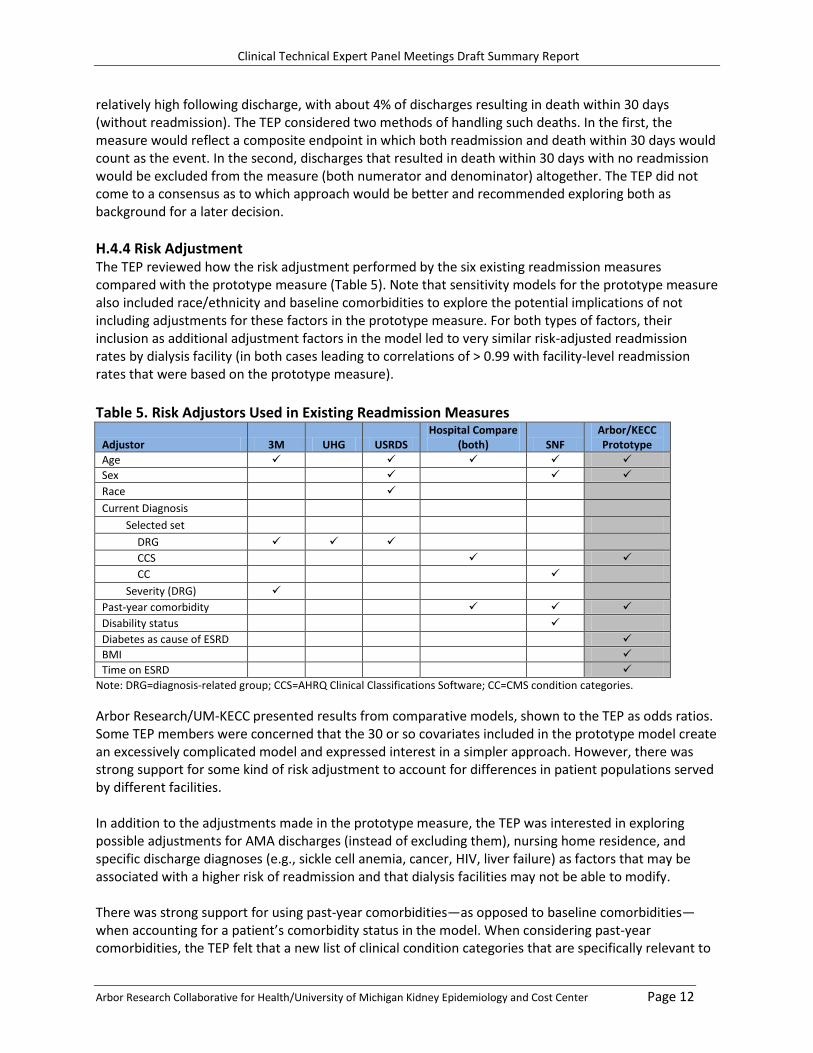


![Targeting Inflammation in Diabetic Kidney Disease: Is ...€¦ · Diabetic kidney disease (DKD) is the most common cause of end-stage renal disease (ESRD) in the U.S. [1]. The pathogenesis](https://static.documents.pub/doc/80x56/5f3e0be02bccb2663f6e45fc/targeting-inflammation-in-diabetic-kidney-disease-is-diabetic-kidney-disease.jpg)


