End-use Load Profiles for the U.S. Building Stock Technical Advisory Group Meeting #9 January 28, 2021 Eric Wilson, NREL Anthony Fontanini, NREL Chris CaraDonna, NREL Peter DeWitt, NREL, Amy LeBar, NREL Natalie Mims Frick, LBNL NREL/PR-5500-79106
Transcript
End-use Load Profiles for the U.S. Building Stock
Technical Advisory Group Meeting #9January 28, 2021
Eric Wilson, NRELAnthony Fontanini, NRELChris CaraDonna, NREL Peter DeWitt, NREL, Amy LeBar, NREL Natalie Mims Frick, LBNL
NREL/PR-5500-79106
NREL | 2
Logistics
• We are recording the webinar.
• Because of the large number of participants on the phone, please keep yourself muted during presentations.
• Please use the chat box to send us clarifying questions during presentations. You can chat or unmute yourself to ask a question during our designated discussion time.
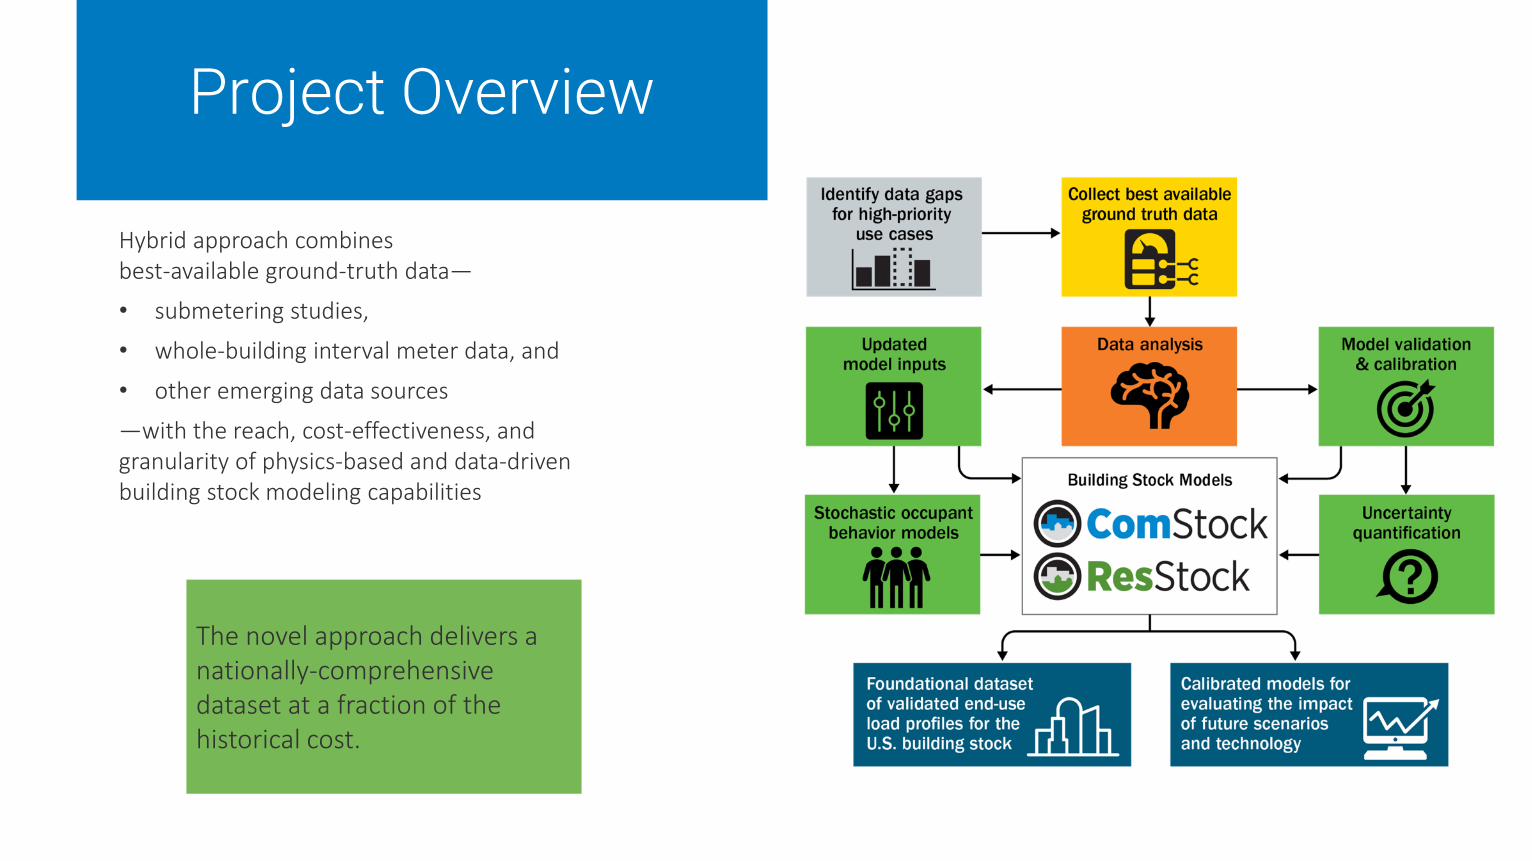
—with the reach, cost-effectiveness, and granularity of physics-based and data-driven building stock modeling capabilities
EE/DR savings profiles
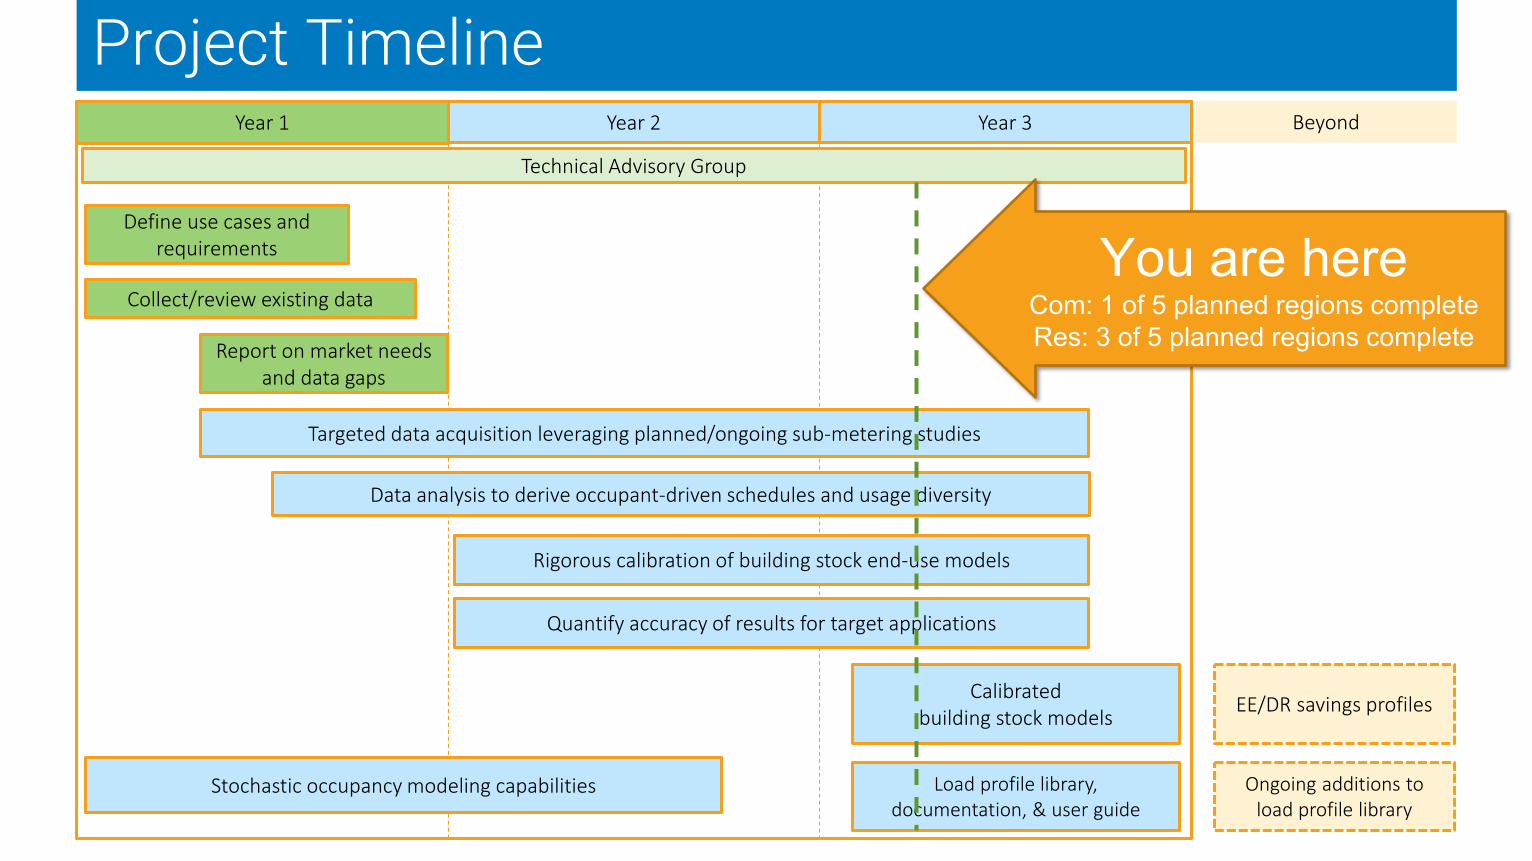
Stochastic occupancy modeling capabilities
Technical Advisory Group
Rigorous calibration of building stock end-use models
Load profile library, documentation, & user guide
Data analysis to derive occupant-driven schedules and usage diversity
Year 1 Year 2 Year 3
Ongoing additions to load profile library
Beyond
Calibratedbuilding stock models
Targeted data acquisition leveraging planned/ongoing sub-metering studies
Define use cases and requirements
Collect/review existing data
Report on market needs and data gaps
Quantify accuracy of results for target applications
You are hereCom: 1 of 5 planned regions completeRes: 3 of 5 planned regions complete
Project Timeline
Public Datasets• VizStock Web Interface• Pre-aggregated Load Profiles• Raw Individual Building Load Profiles• Raw Individual Building Models
EERE or NREL reportEnd-Use Load Profiles for the U.S. Building Stock: Methodology and Results of Model Calibration, Validation, and Uncertainty Quantification• Content: Detailed description of model
improvements made for calibration; detailed explanation of validation and uncertainty of results
• Audience: Dataset and model users interested in technical details
• NREL lead; LBNL and ANL co-authors
WebinarConduct public outreach webinar to TAG and other stakeholders to present project outcomes
EERE or LBNL reportEnd-Use Load Profiles for the U.S. Building Stock: Applications and Opportunities• Content: Example applications and opportunities
for using the datasetAudience: General users of datasets
• LBNL lead; NREL co-authors
Dataset Access InstructionsThe project website will provide instructions on how to access and download the various dataset formats
Published by 9/30/2021*
Completed by 9/30/2021*
Drafts to DOE & TAG by 9/30/2021*
Final reports published by 12/31/2021*
Summary of FY21 Final Products for End-Use Load Profiles
* Dates may change
NREL | 7
Resources
Publications• Li et al. Characterizing Patterns and Variability of Building Electric Load Profiles in Time and Frequency Domain (forthcoming)• Bianchi et al. 2020. Modeling occupancy-driven building loads for large and diversified building stocks through the use of parametric
schedules• Parker et al. 2020. Framework for Extracting and Characterizing Load Profile Variability Based on a Comparative Study of Different Wavelet
Functions• Present et al. 2020. Putting our Industry’s Data to Work: A Case Study of Large Scale Data Aggregation • Northeast Energy Efificency Partnership (NEEP). 2020. Sharing Load Profile Data: Best Practices and Examples • Frick et al. 2019. End-Use Load Profiles for the U.S. Building Stock: Market Needs, Use Cases, and Data Gaps• N. Frick. 2019. End Use Load Profile Inventory• E.Present and E. Wilson. 2019. End use load profiles for the U.S. Building Stock
Presentations and Slides• Technical Advisory Group slides
– LBNL and NREL site• E. Wilson. 2020. EFX webinar• E. Wilson. 2019. E Source interview• E. Wilson. 2019. Peer Review presentation • E. Present. 2019. NEEP presentation.
Software• OpenStudio Occupant Variability Gem and Non Routine Variability Gem (more info at IBPSA newsletter)
Data• First year of 15-min NEEA HEMS data available: https://neea.org/data/end-use-load-research/energy-metering-study-data
Chris CaraDonnaPeter DeWittAmy LeBarJanuary 28, 2021
Recap & Motivation from Commercial Calibration Region 1
NREL | 3
Building Classification
• Classification of AMI is critical for commercial building stock model calibration• Area and building type
• CoStar classifies based on real-estate needs• Some are clear: offices, outpatient, standalone retail• Some are ambiguous: strip malls, warehouses
• We care that the classifications also match from an energy standpoint• Otherwise, we are comparing modeled apples to AMI oranges
NREL | 4
Investigated “Outliers” with Google Maps
• strip_mall (23 outliers)• 9 are convenience store/gas stations• 11 are restaurants (or primarily restaurants)
• warehouse (18 outliers)• 13 are manufacturing• 2 are autobody shops
• small_office (13 outliers)• 2 are manufacturing• 1 is a nursery/greenhouse• 1 is a multifamily condo w/ maybe office space on first floor?• The rest are just normal-looking offices
• retail (5 outliers)• 3 are nursery/greenhouses
• outpatient (4 outliers)• All appear to legitimately be outpatient... perhaps some specialties use much more energy?
• quick_service_restaurant (1 outlier)• Drive-through where service is not tied to floor area
Conclusion: Most “outliers” were actually misclassified buildings, not truly “outliers” of the target building type
NREL | 5
Impact of Misclassification & Outliers
Misclassification & outliers: more impactful than any model changes we did in
Region 1!
Identification methods
Misclassification Detection Study
NREL | 7
Introducing a New Team Member
• Peter DeWitt, Ph.D.• Joint Appointee between NREL and the University of
Colorado Anschutz Medical Campus
• Ph.D. Biostatistics• University of Colorado Anschutz Medical Campus
• M.S. Statistics• Colorado State University
• B.S. and M.S. Mathematics & Computer Science • Colorado School of Mines
• Primary Role:• Inform study design and assessment from a
statistician’s point of view
NREL | 8
Xcel Energy Test Dataset
Xcel Energy has provided our project with monthly energy billing data for over 500,000 meters.
The scale of this dataset is ideal for testing outlier removal methods based on annual electric EUI (kWh/sf/yr), building area, and total electric usage, which can then be translated to our AMI dataset processing workflow.
For the context of this work, outliers could be defined as buildings that have inaccurate metadata (area and/or building type), or unrealistically high/low energy values.
NREL | 10
Data Set Before/After Culling
Premise: 1 Xcel locationMeter: 1 Xcel energy reading; can have multiple per premiseBuilding: 1+ Xcel meters/premises matched with 1+ CoStar entries• 1 building with 1 meter• 1 building with several meters• 2 buildings of the same type on the same parcel with several meters
• High Sensitivity • identify and remove misclassified
data at the expense of omitting correctly classified data
• High Specificity• retain a lot of correctly classified
data at the expense of retaining misclassified data
• Sensitivity and Specificity are inversely related• Selection of preferable methods is subjective
NREL | 16
Manual Verification Procedure1. Search the address in Google Maps2. Check for building type match using exterior signage or business name
• Can you make any reasonable argument that it is properly classified?3. Check for building area match using Google measure tool (accounting for multiple stories)
• Report as misclassified if error > 50%4. Report building classification as accurate or inaccurate
• If both building type and area are correct, the building is listed as “Verified Accurate”• If at least one of building type or area is incorrect, the building is listed as “Verified
Inaccurate”• If the building is not available on Google Maps, the building is listed as “Not Verifiable”
Human verification error is possible when identifying building type and measuring area.
NREL | 18
Examples of Misclassified Buildings
• Provided Data Set• CoStar: OFFICE
• Human• RETAIL_AUTO DEALERSHIP
NREL | 19
Examples of Misclassified Buildings
• Provided Data Set• CoStar: INDUSTRIAL_TRUCK
TERMINAL• Human
• OFFICE_SERVICE
NREL | 20
Examples of Misclassified Buildings
• Provided Data Set:• CoStar: Flex Light
Distribution• Human:
• Small Office
NREL | 21
Examples of Misclassified Buildings
• Provided Data Set• CoStar:
INDUSTRIAL_WAREHOUSE• Human
• Flea Market
kWh/sf/year value < 0.5 – ComStock does not attempt to model buildings of this type of irregularity
NREL | 22
Examples of Misclassified Buildings
• Provided Data Set• CoStar: FLEX
• Human• Camper/trailer retailer
kWh/sf/year value < 0.1 – ComStock does not attempt to model buildings of this type of irregularity
NREL | 23
Examples of Misclassified Buildings
• Provided Data Set• CoStar:
INDUSTRIAL_WAREHOUSE• Human
• Church maintenance equipment storage
kWh/sf/year value < 0.2 – ComStock does not attempt to model buildings of this type of irregularity
NREL | 24
Sensitivity and Specificity
If sensitivity (identifying misclassified data) was priority, then the 3X Median or a higher-percentile Kernel Density method would be of interest.
If specificity (maintaining properly classified data) was priority, then the Boxplot methods or a lower-percentile Kernel Density method would be of interest.
NREL | 26
Example: Outlier Removal Methods on CoStar Small Retail
Statistics on removed data can be provided for each calibration AMI dataset.
NREL | 27
Notes on Reported Units and Scales
All reported energy values are for electricity only, and therefore exclude any potential gas heating or equipment. EUI values may seem lower than typical due to this exclusion.
All EUI values are reported in kWh/sf/year, not kBtu/sf/year. Multiply the reported values by ~3.41 if kBtu/sf/year is a more familiar metric to you.
Log scales are used on several plots – keep this in mind when assessing behavior at increased values.
NREL | 28
Example: Outlier Removal Methods on CoStar Small Retail
NREL | 29
Example: Outlier Removal Methods on CoStar Small Retail
Typical football field = 57,600 sf
Typical Verizon = 1,800 sf
CBECS Retail 10th percentile
= 1,750 sf
Typical CVS = 13,000 sf
NREL | 30
Example: Outlier Removal Methods on CoStar Small Retail
NREL RSF A-wing 2019 lighting only = 1.08 kWh/sf/year
CBECS Retail 10th
Percentile = 2.53 kWh/sf/year
Bullitt Center 2014EUI = 2.93
kWh/sf/year
CBECS Retail 90th
Percentile = 25.35 kWh/sf/year
NREL | 31
What We Do and Don’t Model• We do not currently model buildings that are unconditioned or not adequality lit in accordance with
commercial building standards (i.e., an unconditioned “warehouse” barn with minimal lighting)• All ComStock models include an HVAC system and regularly-used lighting
• We do not currently model buildings that experience irregular occupancy, including:• Buildings that are up for lease or sale with no active tenants • Buildings that experience unoccupancy due to renovations• Buildings that typically experience abnormally low, sporadic usage (e.g., a restaurant that only serves
on Sundays, flea market, etc.)
• We do model buildings with varying occupied start and end times
• We do model buildings with typical low-occupancy periods (e.g., summer setbacks in schools)
• We do model buildings with varying schedules (e.g., lighting and plug loads) and operation behavior
• We do model buildings with varying HVAC system types, lighting power densities, vintages, insulation values, window properties, size, aspect ratio, etc.
NREL | 32
Selecting Method(s)• There is no clear statistical “winner”, as the most appropriate option is highly subjective to the
application.
• The main goals of the EULP project are to calibrate our stock models to:1. realistic measured building energy data with reasonable and achievable energy behavior
that we can represent with ComStock.2. datasets that cover the variety of occupied and operational buildings in the stock.
• The gold standard approach would be to manually verify every data point in every AMI dataset for calibration, but this is unrealistic due to both time and insufficient metadata.
• Must find a balance between keeping data that provides a useful and representative variety, while being sure to maximize the removal of misclassified and unrealistic data that could skew calibration.
• Median 3X outlier and Kernel Density 25% methods were chosen for further investigation by the project team as they appear to best meet the intent of the project goals.
NREL | 33
Focus on Two Methods: CoStar Small Retail
NREL | 34
Focus on Two Methods: CoStar Small Retail
Range:804k; min:5k; max:809k
Range:15.4mil; min:3k; max:15.5mil
3x median method keeps a 19x larger energy (kWh/yr) range
NREL | 35
Focus on Two Methods: CoStar Small Retail
Range:51k; min:1280; max:52k
Range:898k; min:256; max:898k
3x median method keeps a 18x larger square footage range
NREL | 36
Focus on Two Methods: CoStar Small Retail
Range:185; min:1; max:186
Range:25; min:4; max:39
KD 25% method keeps a 5x larger EUI (kWh/sf/yr) range
NREL | 37
Focus on Two Methods: Summary3x Median:• Tends to maintain a larger range of building area and energy usage as this method filters by EUI only. This
can leave uncommonly large or small buildings in the dataset.• Usually results in a narrower range of EUIs as it filters specifically along this axis.
KD 25%:• Tends to maintain a smaller range of building area and energy usage as this method removes outliers on
both axis, resulting in an inclusion boundary that hugs the mass. This can remove buildings with uncommonly small and large area and energy usage relative to the dataset.
• Usually results in a wider range of EUIs as it does not filter specifically along this axis.
Next Steps:• Test both outlier removal methods on AMI dataset to understand performance and stability on a calibration-
region dataset, where dataset size is smaller.• Determine if minimum and maximum EUI and square footage values would be appropriate in conjunction
with either or both methods.
NREL | 38
Key Takeaways1. Confirmed finding from Region 1 using a multi-state dataset
• Many buildings are misclassified• These must be removed before using data for calibration to avoid bad comparison
2. Evaluated 20 different approaches• No statistical “winner”• But several methods are reasonable given the project goals
3. Classification is a hard, even with manual human verification
4. Key factors moving forward are to be clear and transparent about the outlier removal methods being used when processing AMI datasets for calibration
• Communicate the outlier detection method used • Report percentages of data being removed (square footage and energy) for each AMI
dataset
Commercial AMI ClassificationPoll Question
NREL | 40
Commercial AMI Classification Poll Question 1
1. Based on the approaches presented today, which of the following are you more concerned about having a negative effect on commercial calibration efforts?
a. Misclassified buildings and bad data will remain in the calibration data setb. Valid data will be removed from the calibration data set
Questions?
Residential Region 3 Calibration
Anthony D. Fontanini, Ph.D.Eric WilsonTechnical Advisory GroupJanuary 28, 2021
Calibration Strategy
NREL | 3
Model Architecture
Housing stock characteristics database
National Climate/Region
State City/CBSA (Core-Based Statistical Area)
Physics-basedcomputer modeling
Modeling Algorithms
Component Properties
Performance Curves
Schedules Human Behavior
WeatherData
NREL | 4
0
0.1
0.2
0.3
0.4
Region 1 Calibration Region 2 Calibration Region 3 Calibration Region 4 Calibration Region 5 Calibration
Region 1
Calibration Process for One Region
Error
Focus on reducing error for one region at a time
BeforeCalibration
AfterCalibration
Keep an eye on impacts to other regions
NREL | 5
0
0.1
0.2
0.3
0.4
Region 1 Calibration Region 2 Calibration Region 3 Calibration Region 4 Calibration Region 5 Calibration
Region 1 Region 2
Calibration Process Over Time
Error
Focus on reducing error for one region at a time
Keep an eye on impacts to earlier regions
NREL | 6
0
0.1
0.2
0.3
0.4
Region 1 Calibration Region 2 Calibration Region 3 Calibration Region 4 Calibration Region 5 Calibration
Region 1 Region 2 Region 3 Region 4 Region 5
Calibration Process Over Time
Error
Calibration efforts for earlier regions create better starting point for later regions
NREL | 7
0
0.1
0.2
0.3
0.4
Region 1 Calibration Region 2 Calibration Region 3 Calibration Region 4 Calibration Region 5 Calibration
Region 1 Region 2 Region 3 Region 4 Region 5
Calibration Process Over Time
Error
Improvements from later regions will improve results for regions
focused on earlier
NREL | 8
Region 3 Focus: Nationally-Relevant Updates
Housing stock characteristics database
National Climate/Region
State
Physics-basedcomputer modeling
Modeling Algorithms
WeatherData
Component Properties
Performance Curves
Schedules Human Behavior
More weather stations
Household size
Public Use Microdata Area (PUMA)
Foundation types, roof material, lighting type, central DHW
Monthly usage
multipliers
NREL | 9
Region 3 Calibration Strategy
Validation Comparisons
ResStockCapabilitiesBaseload
HVAC
• Roof material distributions• Update foundation type
distributions• Cooling type IECC dependency fix• Cooling load/sizing bugfix
• More geographic resolution in household size• Monthly appliance usage multipliers• Regional variation in lighting efficiency• Regional variation in plug load usage• Add Multifamily Central DHW differentiation• Water heater fuel type and efficiency
dependencies
• 2019 end-use data from 73 homes from ongoing NEEA HEMS
• Monthly EIA electricity sales by state for residential sector
• Monthly EIA natural gas sales by state for residential sector
• Aggregates of AMI data from Seattle City Light
• More weather data locations
• Faster multifamily modeling
NREL | 10
Residential Calibration Dimensions
Calibration effort
EIA Form 861 EIA
electricity, natural gas
data
RECS end-use
scatterplots
Utility load research
data (LRD)
Submeter end-use
dataRegion 1 AMI data
Region 2 AMI data
Region 3 AMI data
Region 4 AMI data
Region 5 AMI data
Annual electric sales of all utilities in U.S.
Annual end-use loads of occupied dwelling units• Building type• Climate zone• Fuel (electricity, natural gas,
propane, fuel oil)
Load duration curves and seasonal load shapes of >20 utilities around U.S.
Advanced metering infrastructure (AMI) data from ComEd service territory (IL)
AMI data from Fort Collins municipal service territory (CO)
AMI data from future region 4
AMI data from future region 5
Sub-metered end-use load data power levels and load shapes
Annual and monthly electricity and natural gas consumption by state, sector
Aggregates of AMI data from Seattle City Light, WA
NREL | 11
Residential Calibration Dimensions
Calibration effort
EIA Form 861 EIA
electricity, natural gas
data
RECS end-use
scatterplots
Utility load research
data (LRD)
Submeter end-use
dataRegion 1 AMI data
Region 2 AMI data
Region 3 AMI data
Region 4 AMI data
Region 5 AMI data
Annual electric sales of all utilities in U.S.
Annual and monthly electricity and natural gas consumption by state, sector
Annual end-use loads of occupied dwelling units• Building type• Climate zone• Fuel (electricity, natural gas,
propane, fuel oil)
Load duration curves and seasonal load shapes of >20 utilities around U.S.
Advanced metering infrastructure (AMI) data from ComEd service territory (IL)
AMI data from Fort Collins municipal service territory (CO)
AMI data (aggregated by building type) from Seattle City Light, WA
AMI data from future region 4
AMI data from future region 5
Sub-metered end-use load data power levels and load shapes
New: NEEA HEMS 73 homes
New: monthly electric and gas
comparisons
New
NREL | 12
Region 3 – Seattle, WA
• Seattle, WA (pop. ~745k) plus parts of adjacent suburbs
• Municipal utility• Primarily used AMI data from 2019
(8% sample; aggregated by building type)• Compared to previous regions:
• Higher % multifamily• Higher % electric heating
NREL | 13
List of updatesNew validation comparisons• 2019 end-use data from 73 homes from ongoing NEEA HEMS• Monthly EIA electricity sales by state for residential sector• Monthly EIA natural gas sales by state for residential sector• Aggregates of AMI data sample from Seattle City LightNew capabilities• More weather data locations• Faster multifamily modelingBaseload updates• More geographic resolution in households size Usage of DHW, appliances, and plug loads• Monthly appliance usage multipliers• Regional variation in lighting efficiency• Regional variation in plug load usage• Add Multifamily Central DHW differentiation• Water heater fuel type and efficiency dependenciesHVAC updates• Roof material distributions• Update foundation type distributions• Cooling type IECC dependency fix• Cooling load/sizing bugfix
Where did we end up?
Calibration improvements and load shape status
NREL | 15
Seattle City Light, WA: Annual Error
Reasons• Single-Family Detached load too high• Electric heating load too high
High on annual usage per unit
NREL | 16
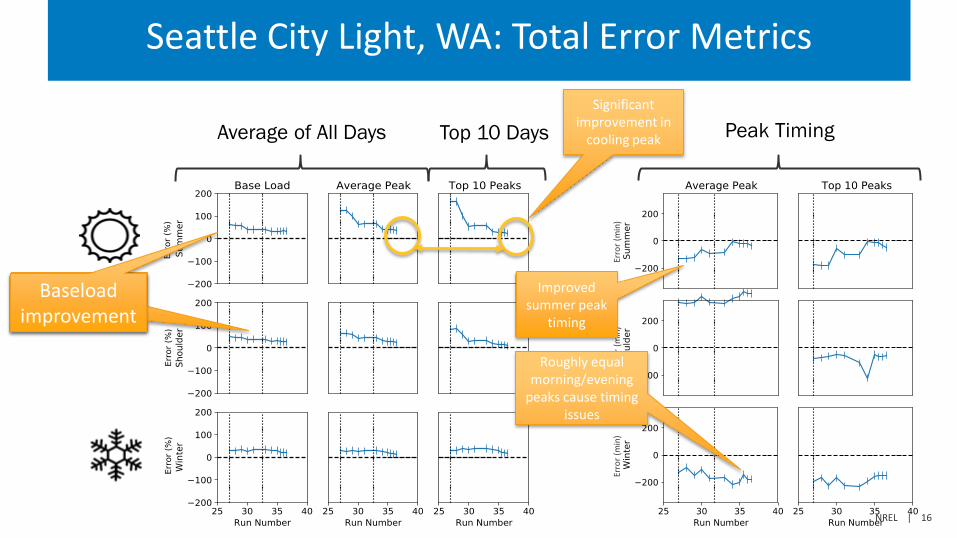
Seattle City Light, WA: Total Error Metrics
Top 10 DaysAverage of All Days Peak TimingSignificant
improvement in cooling peak
Baseload improvementBaseload
improvement
Erro
r (m
in)
Erro
r (m
in)
Roughly equal morning/evening
peaks cause timing issues
Improved summer peak
timing
Erro
r (m
in)
NREL | 17
Seasonal end-use loads by day type
Hour of day (0-23) Hour of day (0-23)
Seattle City Light service territory, WA
NREL | 18
Seasonal end-use loads by day type
Hour of day (0-23) Hour of day (0-23)
Seattle City Light service territory, WA
NREL | 19
Seasonal end-use loads by day type
Hour of day (0-23) Hour of day (0-23)
Seattle City Light service territory, WA
New validation comparisons
NREL | 21
NEEA Home Energy Metering Study (HEMS) Comparisons
Monthly kW per home profiles
• Seattle 2019 AMI,• 8% sample• Aggregate for single-family only
• HEMS (2019),• filtered to west of Cascades (BPA
H1C1; N=36)• Single-family only
• RBSAM (2012-2013)• filtered to west of Cascades
(BPA H1C1; N=57)• Single-family only
AMI is much lower on heating
AMI is lower on cooling
NREL | 22
NEEA Home Energy Metering Study (HEMS) Comparisons
Monthly kW per home profiles
• Seattle 2019 AMI,• 8% sample• Aggregate for single-family only
• HEMS (2019),• filtered to WA, west of Cascades
(BPA H1C1; N=24)• Single-family only
• RBSAM (2012-2013)• filtered to west of Cascades
(BPA H1C1; N=57)• Single-family only
Filtering HEMS to WA (and not OR) west of the Cascades reduces cooling slightly and increases heating slightly
NREL | 23
NEEA Home Energy Metering Study (HEMS) Comparisons
Monthly kW per home profiles
• Seattle 2019 AMI,• 8% sample• Aggregate for single-family only
• HEMS (2019),• filtered to WA, west of Cascades
(BPA H1C1; N=24)• Single-family only
• RBSAM (2012-2013)• Seattle city limits (N=12)• Single-family only
Filtering RBSAM to Seattle reduces cooling and heating, improving match to AMI, but sample size is low and weather is 2012-2013
NREL | 24
ResStock vs. HEMS vs. RBSAM End Use Comparison (Single-Family Only)
ResStock, AMI for Seattle HEMS for WA, west of Cascades (N=24)N=20 elec. (83%) (14 heat pumps)N=4 gas heat
res_seattle_36_01_01_2019
RBSAM, west of Cascades (N=57)2012-13(different weather)
2019 2019
Plug loads and lighting are not separately metered in HEMS (except for a few circuits)
Plug loads and lighting are not separately metered in RBSAM (except for a few circuits)
N=27 elec. (47%) (18 heat pumps)N=30 gas heat (53%)
Heat pumps in shoulder months assumed to be in heating mode but may actually include cooling
Misc. electric space heaters categorized as heating in HEMS and plug loads in RBSAM and ResStock
Heat pumps in shoulder months assumed to be in heating mode but may actually include cooling
NREL | 25
ResStock vs. HEMS vs. RBSAM End Use Comparison (Single-Family Only)
ResStock, AMI for Seattle HEMS for WA, west of Cascades (N=24)N=20 elec. (83%) (14 heat pumps)N=4 gas heat
res_seattle_36_01_01_2019
RBSAM, west of Cascades (N=57)2012-13(different weather)
2019 2019
Plug loads and lighting are not separately metered in HEMS (except for a few circuits)
Plug loads and lighting are not separately metered in RBSAM (except for a few circuits)
N=27 elec. (47%) (18 heat pumps)N=30 gas heat (53%)
Corrected to 25% elec. heat(67% of samples are heat
pumps vs. 25-35% in the stock)
Corrected to 25% elec. heat(70% of samples are heat
pumps vs. 25-35% in the stock)
Heat pumps in shoulder months assumed to be in heating mode
NREL | 26
Monthly EIA electricity sales by state, sector
res_national_36_01_01_2018
Region 1 and 2 calibration regions included comparison to annual EIA sales data:
NREL | 27
Monthly EIA electricity, gas sales by state, sectorWe now compare monthly residential sector electricity and gas sales for every state
res_national_36_01_01_2018
Overpredicting electric heating
Underpredicting gas heating
Washington (Region 3)
NREL | 28
Monthly EIA electricity, gas sales by state, sectorWe now compare monthly residential sector electricity and gas sales for every state
res_national_36_01_01_2018
Colorado (Region 2)
Overpredicting electric heating
Underpredicting gas heating
Underpredicting cooling
NREL | 29
Monthly EIA electricity, gas sales by state, sectorWe now compare monthly residential sector electricity and gas sales for every state
res_national_36_01_01_2018
Illinois (Region 1)
Overpredicting electric heating
Cooling looks good
Gas consumption looks good
Added Capabilities
NREL | 31
Update: More weather data locations
• Increased number of weather station data regions from 215 to 941• Weather data regions are the same for ResStock and ComStock• Increases resolution in weather events (e.g., cold fronts rolling across grid) and
sunrise/sunset times, which should increase weather response diversity in aggregate load profiles
Before: 215 weather data regions After: 941 weather data regions
NREL | 32
Impact: More weather data locationsBefore: 215 weather data regions
NREL | 33
Impact: More weather data locationsAfter: 941 weather data regions
Noticeable improvement in CA gas use
Some utilities got worse (e.g., Fort Collins)
CA
NREL | 34
• ResStock data sources are primarily defined in terms of dwelling units (and not multifamily buildings)
• Previous approach:– Model an entire multifamily building for each sampled dwelling unit
• New approach:– Model only a dwelling unit for each sampled dwelling unit– Shared walls are modeled as adiabatic
• Benefits:– Speed improvements: HPC usage reduced by about 80%– Aligns with HPXML and associated workflows (Home Energy Score,
WAP, ERI)• Drawbacks:
– Some heat flows not captured• Heat transfer between shared walls• Minor shading differences• 0.20% effect across total energy, 2.46% effect for worst test building
– Cannot explicitly model central HVAC systems serving multiple units; using ANSI/RESNET/ICC 301-2019 approach instead
Update: Faster Multifamily Modeling
NREL | 35
Test results for 10,000 MF buildings
Median Total Site Energy Difference 0.11%
Maximum Total Site Energy Difference 3.80%
Testing: Faster Multifamily Modeling
NREL | 36
Impact: Faster Multifamily Modeling
Negligible change to multifamily in Seattle, which is expected
– Before– After– AMI 2019
This change leveraged work from another project; it was motivated by runtime improvements and not by an observed error.
Baseload Updates
NREL | 38
Update: More granular household sizesBefore: Number of occupants depends on building type and number of bedroomsAfter: Number of occupants depends on building type and number of bedrooms and PUMS region (N=2,335)
• Number of occupants affects usage of domestic hot water, appliances, and plug loads• Switch from RECS 2015 to PUMS 2017 allows PUMA level spatial granularity in the
distributions and leverages more than 6 million samples.
NREL | 39
Update: More granular household sizesBefore: Number of occupants depends on building type and number of bedroomsAfter: Number of occupants depends on building type and number of bedrooms and PUMS region (N=2,335)
• Number of occupants affects usage of domestic hot water, appliances, and plug loads• Switch from RECS 2015 to PUMS 2017 allows PUMA level spatial granularity in the
distributions and leverages more than 6 million samples.
PUMS shows fewer occupants on average, so baseload is reduced nationally
Smaller sample size in RECS 2015
may explain difference
between the distributions
NREL | 40
Impact: More granular household sizes
– Before– After– AMI
Modeling fewer occupants per household reduces baseload
Seattle, WA
Fort Collins, CO ComEd, IL
NREL | 41
Update: Monthly appliance usage multipliers• The stochastic occupancy model incorporated for Region 2 eliminated monthly usage variation for
four major appliances• Now we re-introduce monthly usage variation for these appliances• Uses an average of monthly variation patterns seen across 6 end-use datasets• Implemented by slightly lengthening/shortening event durations to achieve correct monthly usage
NREL | 42
Update: Regional variation in lighting efficiencyBefore: Lighting technology saturation is a national average distributionAfter: Lighting technology saturation depends on building type and Census Division (N=10)
Before:
Option=100% Incandescent
Option=100% CFL
Option=100% LED
52% 41% 7%
NREL | 43
Update: Regional variation in lighting efficiencyBefore: Lighting technology saturation is a national average distributionAfter: Lighting technology saturation depends on building type and RECS Census Division (N=10)
Option=100% Incandescent
Option=100% CFL
Option=100% LED
52% 41% 7%
Dependency=Census Division RECS
Dependency=Geometry Building Type RECS
Option=100% Incandescent
Option=100% CFL
Option=100% LED
East North Central Single-Family Detached 44% 46% 10%East South Central Single-Family Detached 49% 44% 7%Middle Atlantic Single-Family Detached 43% 44% 13%Mountain North Single-Family Detached 36% 51% 14%Mountain South Single-Family Detached 38% 52% 10%New England Single-Family Detached 41% 44% 15%Pacific Single-Family Detached 34% 50% 16%South Atlantic Single-Family Detached 48% 43% 9%West North Central Single-Family Detached 48% 41% 11%West South Central Single-Family Detached 46% 46% 8%
Dependency=Census Division RECS
Dependency=Geometry Building Type RECS
Option=100% Incandescent
Option=100% CFL
Option=100% LED
Pacific Mobile Home 34% 50% 16%Pacific Multi-Family with 2 - 4 Units 39% 54% 8%Pacific Multi-Family with 5+ Units 39% 54% 8%Pacific Single-Family Attached 39% 50% 11%Pacific Single-Family Detached 34% 50% 16%
After:Before:
NREL | 44
Dependency=Census Division RECS
Dependency=Geometry Building Type RECS
Option=100% Incandescent
Option=100% CFL
Option=100% LED
East North Central Single-Family Detached 44% 46% 10%East South Central Single-Family Detached 49% 44% 7%Middle Atlantic Single-Family Detached 43% 44% 13%Mountain North Single-Family Detached 36% 51% 14%Mountain South Single-Family Detached 38% 52% 10%New England Single-Family Detached 41% 44% 15%Pacific Single-Family Detached 34% 50% 16%South Atlantic Single-Family Detached 48% 43% 9%West North Central Single-Family Detached 48% 41% 11%West South Central Single-Family Detached 46% 46% 8%
After:
Update: Regional variation in lighting efficiencyBefore: Lighting technology saturation is a national average distributionAfter: Lighting technology saturation depends on building type and RECS Census Division (N=10)
Pacific region has most efficient lighting
Single-family has more efficient lighting than multifamily
Before:
Dependency=Census Division RECS
Dependency=Geometry Building Type RECS
Option=100% Incandescent
Option=100% CFL
Option=100% LED
Pacific Mobile Home 34% 50% 16%Pacific Multi-Family with 2 - 4 Units 39% 54% 8%Pacific Multi-Family with 5+ Units 39% 54% 8%Pacific Single-Family Attached 39% 50% 11%Pacific Single-Family Detached 34% 50% 16%
Option=100% Incandescent
Option=100% CFL
Option=100% LED
52% 41% 7%
NREL | 45
Update: Regional variation in lighting efficiencyBefore: Lighting technology saturation is a national average distributionAfter: Lighting technology saturation depends on building type and RECS Census Division (N=10)
87%
13% 0%
52%41%
7%
44% 45%
11%0%
20%
40%
60%
80%
100%
Incandescent CFL/LFL LED
SATU
RATI
ON
BULB TYPE
Lighting Saturation By Bulb Type
RECS 2009 (ResStock before EULP)
2015 DOE U.S. Lighting Market Characterization (ResStock before Region 3)
RECS 2015 (ResStock now)
Comparison of national average lighting saturation to previous ResStock data sources
NREL | 46
Update: Regional variation in plug load usage
Captures regional variation in plug loads that isn’t captured elsewhere (e.g., humidifiers, dehumidifiers, fans)
Misc. plug load kWh reported in RECS 2015 microdata relative to misc. plug load kWh calculated using regression equations derived from RECS 2015
** MELS are defined by the following fields in RECS 2015: televisions, microwaves, humidifiers, and other devices not elsewhere classified
𝑛𝑛𝑜𝑜𝑜𝑜𝑜𝑜𝑜𝑜𝑜𝑜𝑜𝑜𝑜𝑜𝑜𝑜𝑜𝑜: Number of occupants𝑓𝑓𝑓𝑓𝑓𝑓: Finished floor area𝛼𝛼: Plug load regional and building type multiplierSFD: Single-Family DetachedSFA: Single-Family AttachedMF: Multi-Family
NREL | 47
Impact: Base load updates (lighting, appliances, plug loads)
Update: Water heater dependenciesBefore: Water heating fuel type and efficiency depends on space heating fuel type and custom region (N=10)
After: Water heating fuel type depends on space heating fuel type, custom region (N=10), and building typeWater heating efficiency depends on water heater fuel type and custom region (N=10)
Dependency=Geometry Building Type RECS
Dependency=Heating Fuel
Dependency= Location Region
Option= Electricity
Option=Fuel Oil Option=Gas
Option= Other Fuel
Option= Propane
Mobile Home Electricity CR06 90% 0% 4% 0% 5%Multi-Family with 2 - 4 Units Electricity CR06 93% 0% 7% 0% 0%Multi-Family with 5+ Units Electricity CR06 93% 0% 7% 0% 0%Single-Family Attached Electricity CR06 87% 0% 13% 0% 0%Single-Family Detached Electricity CR06 90% 0% 4% 0% 5%Mobile Home Natural Gas CR06 25% 0% 75% 0% 0%Multi-Family with 2 - 4 Units Natural Gas CR06 0% 0% 100% 0% 0%Multi-Family with 5+ Units Natural Gas CR06 0% 0% 100% 0% 0%Single-Family Attached Natural Gas CR06 13% 0% 87% 0% 0%Single-Family Detached Natural Gas CR06 25% 0% 75% 0% 0%
Update: Higher efficiency water heatersBefore: Tank vs. Tankless from RECS; all tanks are “Standard Efficiency”
After: RECS water heater blanket field is used as a proxy for premium storage tank water heatersHeat pump water heaters are added in (3% of electric stock in WA, OR per RBSA II; 0.5% elsewhere per Butzbaugh et al.)
Dependency=Geometry Building Type RECS
Dependency=Heating Fuel
Dependency= Location Region
Option= Electricity
Option=Fuel Oil Option=Gas
Option= Other Fuel
Option= Propane
Mobile Home Electricity CR06 90% 0% 4% 0% 5%Multi-Family with 2 - 4 Units Electricity CR06 93% 0% 7% 0% 0%Multi-Family with 5+ Units Electricity CR06 93% 0% 7% 0% 0%Single-Family Attached Electricity CR06 87% 0% 13% 0% 0%Single-Family Detached Electricity CR06 90% 0% 4% 0% 5%Mobile Home Natural Gas CR06 25% 0% 75% 0% 0%Multi-Family with 2 - 4 Units Natural Gas CR06 0% 0% 100% 0% 0%Multi-Family with 5+ Units Natural Gas CR06 0% 0% 100% 0% 0%Single-Family Attached Natural Gas CR06 13% 0% 87% 0% 0%Single-Family Detached Natural Gas CR06 25% 0% 75% 0% 0%
Water Heater Fuel
Water Heater EfficiencyNow model Heat pump water heatersNow model higher efficiency tank models
NREL | 50
Impact: Water heater dependencies, Higher efficiency water heaters
Seattle, WA
– Before– After– AMI
Efficiency improvements are minimal
HVAC Updates
NREL | 52
Update: Roof material distributionsBefore: the EULP project100% medium asphalt shingles
After: Calibration region 2Distribution based on RECSFor example:
Dependency=Geometry Building Type RECS
Dependency=Location Region
Option=None
Option=Asphalt, Medium
Option=Composition Shingles
Option=Metal, Dark
Option=Slate
Option=Tile, Clay or Ceramic
Option=Tile, Concrete
Option=Wood Shingles
Mobile Home CR06 (WA, OR) 0% 0% 49% 45% 0% 0% 0% 7%
This change leveraged work from another project; it was not motivated by an observed error.
NREL | 53
Impact: Roof material distributions
– Before– After– AMI
Negligible change (as was expected)
NREL | 54
Update: Cooling type IECC dependency
Cooling type (central AC, room AC, heat pump, none) depends on:Before:• building type, • vintage, • heating type (ducts or not, heat pump or not)
After:• building type, • vintage, • heating type (ducts or not, heat pump or not), • IECC Climate Zone
The HVAC organization restructure completed during Region 2 accidentally removed a dependency on location
Slicing RECS 2009 four ways requires careful binning of responses to ensure sufficient samples for all combinations:• Due to low sample sizes for some Heating Types, Heating Type data for Non-Ducted Heating and None is grouped.• Due to low sample sizes for some Building Types, Building Type data are grouped into: 1) Single-Family Detached and Single-Family
Attached, and 2) Multifamily 2-4 units and Multifamily 5+ units, and 3) Mobile Homes.• Due to low sample sizes for some Vintages, Vintage ACS (20-year bins) is used instead of the typical 10-year bins used for RECS data. Other assumptions:• If a sample has both Central AC and Room AC, we assume it has Central AC only• If a sample indicates using a heat pump for AC but does not indicate using a heat pump for heating, then we either assign it a heat
pump for heating (if electric heating was indicated), or we assign it Central AC (if non-electric heating was indicated).
NREL | 55
Update: HVAC Cooling Load/Sizing Fix
The stochastic occupancy feature added during Region 2 accidentally increased the magnitude of internal gains used for the design cooling load calculation for air conditioner sizing.
This did not significantly affect annual energy use, only peak demand (~1% of hours).
After this discovery, we implemented automated before/after checks on heating/cooling capacities and other output variables such as unmet hours for heating/cooling setpoints.
NREL | 56
Impact: Cooling type IECC dependency, Cooling Load/Sizing Fix
– Before– After– AMI
ComEd, ILSeattle, WA Fort Collins, CO
* Also includes fix to air conditioner sizing bug introduced in Region 2 calibration (primarily affect peak days)
Major improvement in cooling
Major improvement in cooling
Not much change since cooling saturation in ComEd is closer to national average
NREL | 57
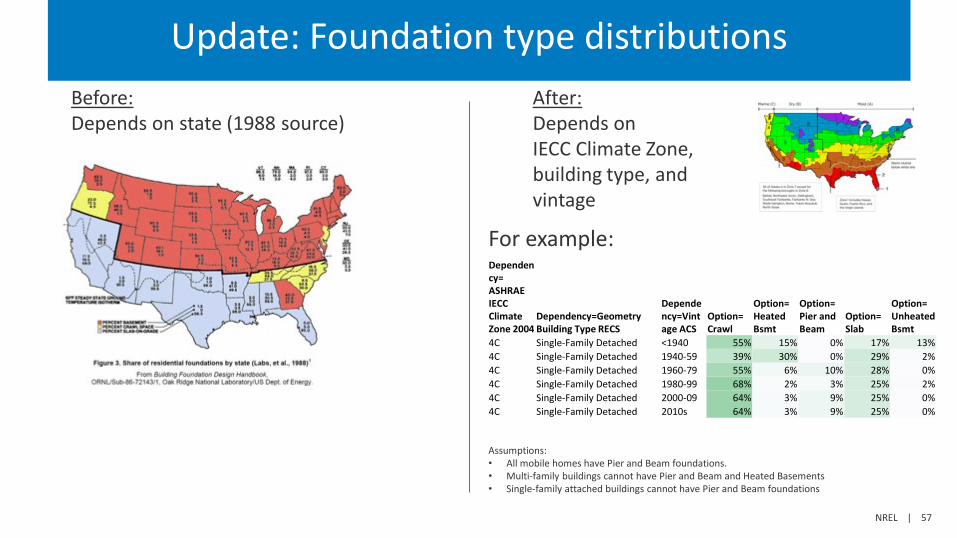
Update: Foundation type distributionsBefore:Depends on state (1988 source)
After: Depends on IECC Climate Zone, building type, and vintage
Assumptions:• All mobile homes have Pier and Beam foundations.• Multi-family buildings cannot have Pier and Beam and Heated Basements• Single-family attached buildings cannot have Pier and Beam foundations
The overprediction of electric heating in multifamily buildings led us to investigate whether building-level meters for centrally metered HVAC and domestic hot water (DHW) are included in the Seattle residential AMI data.
For Seattle:• Individual units typically have a residential rate code• Common areas and central metering are typically given a commercial
rate code
We can remove central system HVAC and DHW from ResStock results for Seattle to see how this affects the comparison (see next slide).• Uses data from RECS (entire U.S.) and RBSA (Pacific Northwest) on the
prevalence of central HVAC and DHW
We have inquiries out to Fort Collins and EIA to better understand how much this affects other dataset comparisons.• In ComEd, common meters are classified as residential• This effect may show up in Region 4 Hot Humid, which has higher
electric heat fractions.
(Photo by Dennis Schroeder / NREL #48963)
NREL | 61
Alternate Comparisons
– With central heating/cooling – Without central heating/cooling – AMI
Seat
tle, W
A –
Mul
tifam
ily U
nits
With and without DHW
Without central heating/cooling– With central DHW– Without central DHW– AMI
Significant improvement in winter load match
Improvement in shoulder load match
Improvement in summer load match
Seat
tle, W
A –
Mul
tifam
ily U
nits
With and without central heating/cooling
No significant difference because there is little to no central cooling
ResStock Correction Model
NREL | 63
Motivation for a correction model
• Cannot model everything– Ex: Cooling setpoints are lower in summer than shoulder– Ex: Mean radiant temperature causes setpoints to change during
heat waves• Best available data does not accurately capture all aspects in building
stock– Ex: RECS does not capture monthly changes in setpoints– Ex: Best available data could over or underpredicts appliance
saturations, age/efficiency, setpoints, etc.
NREL | 64
Example: model discrepancies across timescales
City of Fort Collins Total Residential StockAverage of Top 10 Load Days
Hour of day
ResStockAMI Data
Monthly Hourly
DailyFort Collins Total Residential Stock: Daily Electric Load
kwh/
unit
Consistent under-prediction of
cooling and over-prediction of
heating across timescales and data
sources
NREL | 65
Example approaches
Goal is to correct bulk errors but not overfit
Correction to EIA state and monthly data1. Adjust all end-uses 2. Adjust only HVAC loads3. …
Approach will evolve until calibration is finished• Example extension: County and daily factors based on
HDD/CDD
Suggests that discrepancies are combination of baseload and HVAC loads
Suggests that discrepancies are mostly HVAC loads
NREL | 66
Example model formulation
Planning on using multiplicative factors• If use state and month factors, then calculate 588
(49x12) factors• Model 1: all end-uses • Model 2: only HVAC end-uses
Example impacts of the potential correction models
Fort Collins Total Residential Stock: Daily Electric Loadkw
h/un
it
UncorrectedModel 1 (All loads)Model 2 (HVAC only)AMI Data
Significant improvement in heating season
Improvement in cooling season, but needs work
NREL | 68
Example impacts of the potential correction models
Fort Collins Total Residential Stock
Hour of day
Average of top 10 load days Season average load
Hour of day
Model 2 slightly better load shape suggests errors are HVAC related
Overcorrection in summer suggests degree days may be important
UncorrectedModel 1 (All loads)Model 2 (HVAC only)AMI Data
Residential stock end-use summary
Seattle, WA
NREL | 70
Seasonal end-use loads by day type
Hour of day (0-23) Hour of day (0-23)
Seattle City Light service territory, WA
NREL | 71
Seasonal end-use loads by day type
Hour of day (0-23) Hour of day (0-23)
Seattle City Light service territory, WA
NREL | 72
Seasonal end-use loads by day type
Hour of day (0-23) Hour of day (0-23)
Seattle City Light service territory, WA
Residential stock end-use summary
Fort Collins municipal utility, CO
NREL | 74
Seasonal end-use loads by day type
Hour of day (0-23) Hour of day (0-23)
Fort Collins municipal utility, CO
201820182018
NREL | 75
Seasonal end-use loads by day type
Hour of day (0-23) Hour of day (0-23)
Fort Collins municipal utility, CO
201820182018
NREL | 76
Seasonal end-use loads by day type
Hour of day (0-23) Hour of day (0-23)
Fort Collins municipal utility, CO
201820182018
Residential stock end-use summary
ComEd service territory, IL
NREL | 78
Seasonal end-use loads by day type
Hour of day (0-23) Hour of day (0-23)
ComEd service territory, IL
+10%
-10%
NREL | 79
Seasonal end-use loads by day type
Hour of day (0-23) Hour of day (0-23)
ComEd service territory, IL
+10%
-10%
NREL | 80
Seasonal end-use loads by day type
Hour of day (0-23) Hour of day (0-23)
ComEd service territory, IL
+10%
-10%
Tracking Quantities of Interest
NREL | 82
Seattle City Light, WA: Annual Error
Reasons• Single-Family Detached load too high• Electric heating load too high
High on annual usage per unit
NREL | 83
Fort Collins, CO: Annual Error
Reasons• Heating energy too high
High on annual usage per unitRegion 2 Region 3
NREL | 84
ComEd, IL: Annual Error
Reasons• Baseload is low in early morning
Region 1 Only slightly low after corrections
Region 2 Region 3
NREL | 85
Seattle City Light, WA: Total Error Metrics
Top 10 DaysAverage of All Days Peak TimingSignificant
improvement in cooling peak
Baseload improvementBaseload
improvement
Erro
r (m
in)
Erro
r (m
in)
Roughly equal morning/evening
peaks cause timing issues
Improved summer peak
timing
Erro
r (m
in)
NREL | 86
Fort Collins, CO: Total Error Metrics
Top 10 DaysAverage of All Days
Higher winter load after
weather update
Peak Timing
Average summer peak improvement
Issue with
winter timing
Higher winter load after
weather update
Higher winter load after
weather update
Region 2 Region 3
Erro
r (m
in)
Erro
r (m
in)
Erro
r (m
in)
NREL | 87
ComEd, IL: Total Error Metrics
Top 10 DaysAverage of All Days
Baseload still an issue
Peak Timing
Timing of peak heating
relatively accurate
Low on top peaks in summer
Region 1 Region 3Region 2
Erro
r (m
in)
Erro
r (m
in)
Erro
r (m
in)
Areas for Improvement
NREL | 89
Next Region: Likely Areas for Improvement
Hour of day (0-23)Hour of day (0-23)
Seattle, WA Fort Collins, COToo much electric heating
Too much electric heating
Incorporate partial home heating with electric baseboard
Update vacant unit setpoint assumptions
NREL | 90
Next Region: Likely Areas for ImprovementTwo regions provides additional insight into areas for improvement
Hour of day (0-23)
Fort Collins, COComEd, IL
Incorporate more seasonal usage of AC
Overpredicting cooling in Fort Collins, especially in the shoulder season
Daily electric load
Overpredicting cooling in ComEd in May, though not in remainder of summer
NREL | 91
Next Region: Likely Areas for ImprovementTwo regions provides additional insight into areas for improvement
Hour of day (0-23)Hour of day (0-23)
Fort Collins, CO ComEd, ILFort Collins still shows too much cooling, especially in the shoulder season
Incorporate more seasonal usage of AC
ComEd peak magnitude is good, but still too low at night
Lighting drops off too quickly?
NREL | 92
Conclusions (1)
• Ran 10 iterations of ResStock incorporating 12 discrete changes• Saw general improvements in QOI metrics• Most of the improvements made will carry over to the entire U.S.
• Increased number of weather stations• Weather data regions are the same for ResStock and ComStock• Increases resolution in weather events
• New/Updated visualizations• EIA monthly state electric and natural gas sales• NEEA Home Energy Metering Study (HEMS) Comparisons
NREL | 93
Conclusions (2)
• Summary of changes• Reduced baseload by adding geographic resolution to household size• Increases resolution in weather events by increasing number of weather stations• Added regional and building type variation in lighting and plug loads• Included monthly variation of baseloads with the stochastic occupant-driven load model • Added multifamily central DHW differentiation• Model higher efficiency tank and heat pump water heaters• More granular roof materials and updated foundation type distributions
• Priority areas for improvement for next region• Electric Heating• Regional behavior time shifts• Heating/cooling correction model
• Will be moving on to Regional Dataset 4 (Horry and EPB), but continue tracking metrics for the first three region datasets
Residential Calibration Poll Questions
NREL | 95
Residential Calibration Poll Question 1
1. Are we addressing the calibration issues you hoped we would address?
a. Yesb. Some (please explain in chat)c. No (please explain in chat)
NREL | 96
Residential Calibration Poll Question 2
2. If the residential EULP calibration stopped today, would our results be more useful than existing load profile sources (e.g., Hourly Load Profiles for TMY3 Locations on OpenEI.org)?
a. Yes, for all of my desired use casesb. Yes, for most of my desired use cases (please explain in chat)c. Yes, for some of my desired use cases (please explain in chat)d. No, for none of my desired use cases (please explain in chat)
NREL | 97
Residential Calibration Poll Question 3
3. If we have multiple regional data set options for the final residential region, whichshould we prioritize?
a. Using a data set from a new climate or geographic regionb. Using a large dataset, even if it is from a climate and geographic region that
has already been coveredc. Other (enter in chat)
Wrap-up
NREL | 2
Poll Question #5
Since we were unable to meet in person this year, we missed the opportunity for longer dialogue. If you have any ideas/critiques/concerns you think would be helpful to talk through on a smaller call, please indicate “yes” and we will reach out.
– Yes– No
NREL | 3
Next steps
• Next technical advisory group meeting via webinar in April/May 2021.• Region 4 residential calibration (Hot-Humid/Southeast)• Region 2 commercial calibration (Seattle, Portland)• Begin working on our final year reports
This work was authored [in part] by the National Renewable Energy Laboratory, operated by Alliance for Sustainable Energy, LLC, for the U.S. Department of Energy (DOE) under Contract No. DE-AC36-08GO28308. Funding provided by U.S. Department of Energy Office of Energy Efficiency and Renewable Energy Building Technologies Office. The views expressed in the article do not necessarily represent the views of the DOE or the U.S. Government. The U.S. Government retains and the publisher, by accepting the article for publication, acknowledges that the U.S. Government retains a nonexclusive, paid-up, irrevocable, worldwide license to publish or reproduce the published form of this work, or allow others to do so, for U.S. Government purposes.