“Energy, Environment, and Ecosystems (3E) Nexus Initiative for Sustainable Development in Asian Countries” Centre for Research on Energy Policy The Department of Chemical Engineering - Faculty of Industrial Technology INSTITUT TEKNOLOGI BANDUNG End-Use Model for Indonesia Low-Carbon Development Paths of Energy Sector by Retno Gumilang Dewi [email protected]or [email protected]Denpasar - Bali, 26 - 27 February 2015
Transcript
“Energy, Environment, and Ecosystems (3E) Nexus Initiative for Sustainable Development in Asian Countries”
Centre for Research on Energy PolicyThe Department of Chemical Engineering - Faculty of Industrial Technology
INSTITUT TEKNOLOGI BANDUNG !
End-Use Model for Indonesia Low-Carbon Development Paths of Energy Sector
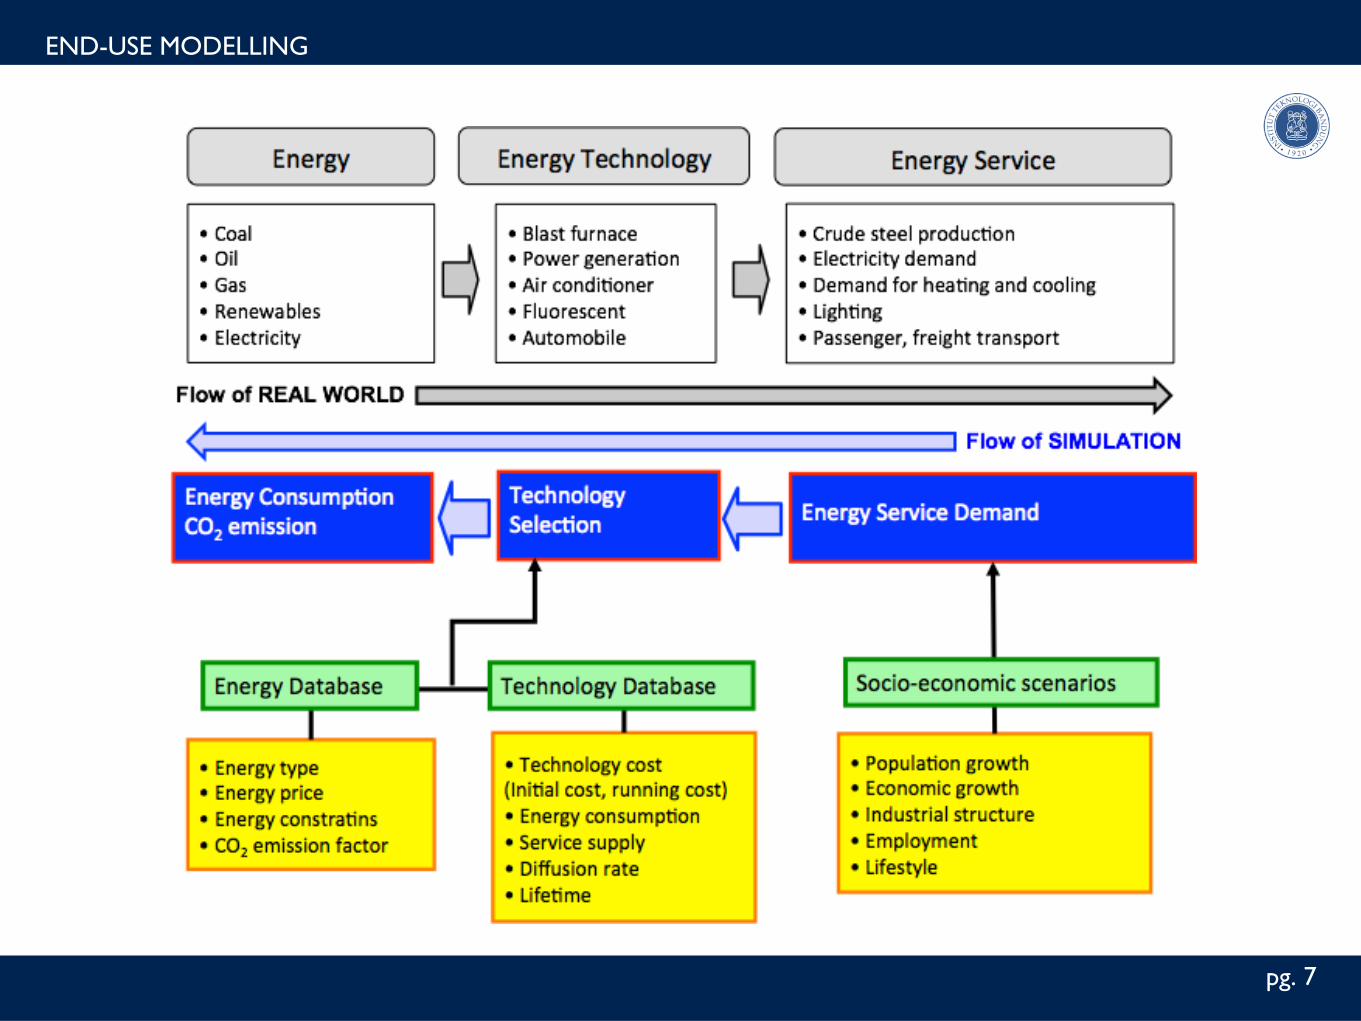
3. Energy and GHG Emission Model Using End-Use GAMS
4. Socio Economic Condition and Projection
5. Low Carbon Development Path of Energy Sector and GHG Emission Reduction
6. Role of Research Community
OUTLINE
2pg.
3pg.
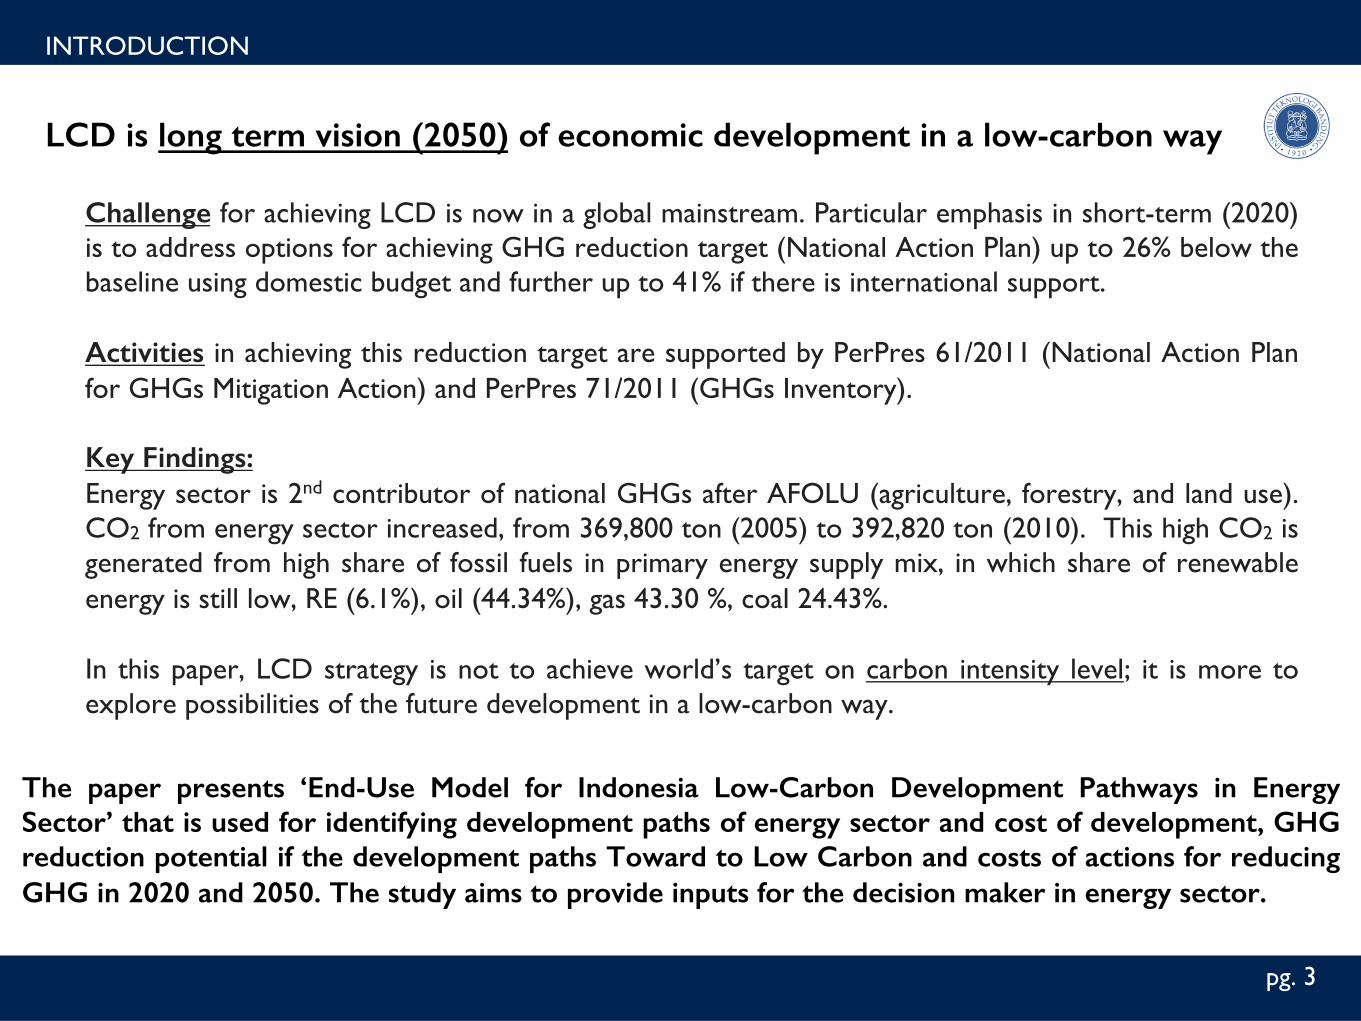
INTRODUCTION
LCD is long term vision (2050) of economic development in a low-carbon way!
Challenge for achieving LCD is now in a global mainstream. Particular emphasis in short-term (2020) is to address options for achieving GHG reduction target (National Action Plan) up to 26% below the baseline using domestic budget and further up to 41% if there is international support. Activities in achieving this reduction target are supported by PerPres 61/2011 (National Action Plan for GHGs Mitigation Action) and PerPres 71/2011 (GHGs Inventory). Key Findings: !Energy sector is 2nd contributor of national GHGs after AFOLU (agriculture, forestry, and land use). CO2 from energy sector increased, from 369,800 ton (2005) to 392,820 ton (2010). This high CO2 is generated from high share of fossil fuels in primary energy supply mix, in which share of renewable energy is still low, RE (6.1%), oil (44.34%), gas 43.30 %, coal 24.43%.In this paper, LCD strategy is not to achieve world’s target on carbon intensity level; it is more to explore possibilities of the future development in a low-carbon way.
The paper presents ‘End-Use Model for Indonesia Low-Carbon Development Pathways in Energy Sector’ that is used for identifying development paths of energy sector and cost of development, GHG reduction potential if the development paths Toward to Low Carbon and costs of actions for reducing GHG in 2020 and 2050. The study aims to provide inputs for the decision maker in energy sector. !
4pg.
INTRODUCTION
LCD is long term vision (2050) of economic development in a low-carbon way!
4pg.
INTRODUCTION
Inputs for Government of Indonesia in developing energy policy
Stakeholders
Stakeholders
Ministry(of(Industry
Ministry(of(Transport
other(MinistriesMEMR
(Ministry of Energy & Mineral Resources)
DEN(National Energy
Council)
Dra4(RUEN((Na:onal(
Energy(Plan)
Stakeholders(Energy Supply)
Scientific Community
President
MODEL(&(others(input
ParlementRUEN
KEN((Na:onal(
Energy(Policy) Approval
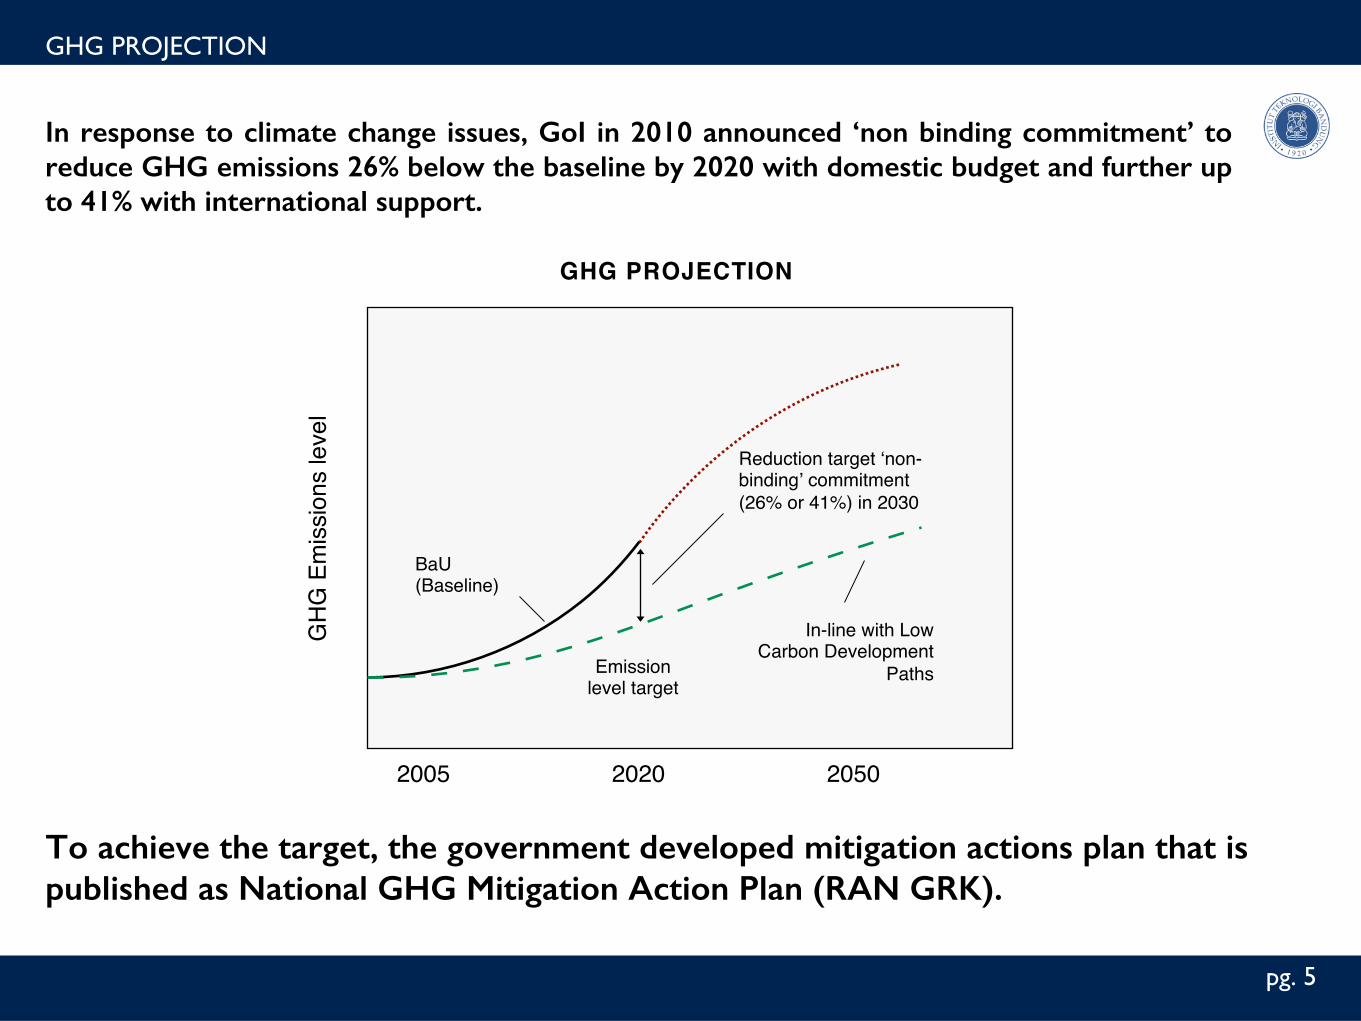
In response to climate change issues, GoI in 2010 announced ‘non binding commitment’ to reduce GHG emissions 26% below the baseline by 2020 with domestic budget and further up to 41% with international support. !
5pg.
GHG PROJECTION
To achieve the target, the government developed mitigation actions plan that is published as National GHG Mitigation Action Plan (RAN GRK). !
Emission level target"
GH
G E
mis
sion
s le
vel"
BaU (Baseline)"
2005" 2020" 2050"
Reduction target ‘non-binding’ commitment (26% or 41%) in 2030"
GHG PROJECTION"
In-line with Low Carbon Development
Paths"
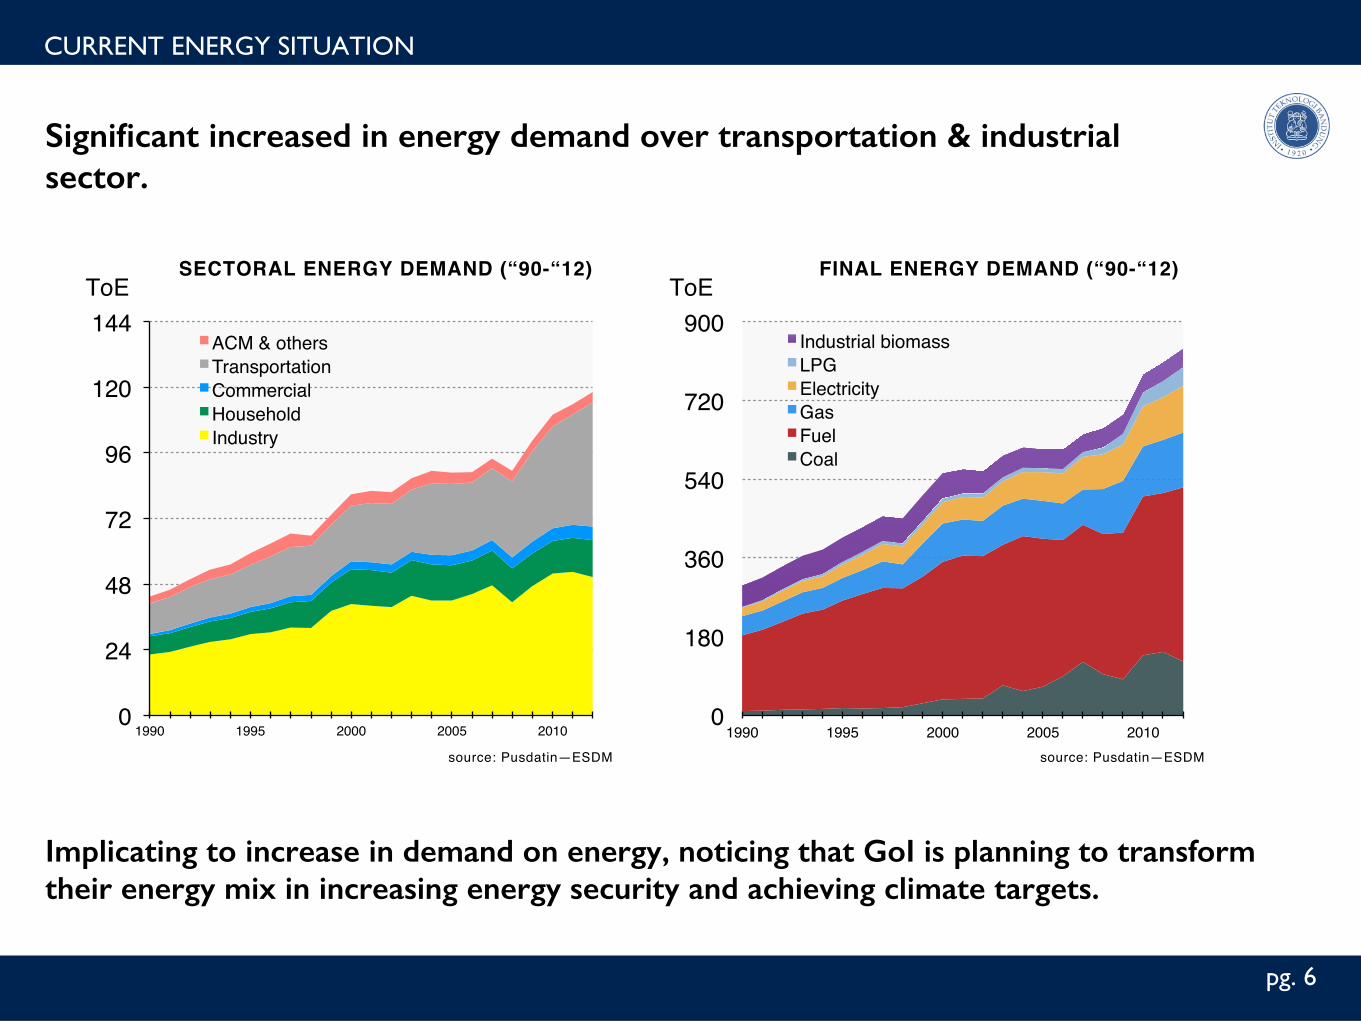
Significant increased in energy demand over transportation & industrial sector. !
6pg.
CURRENT ENERGY SITUATION
Implicating to increase in demand on energy, noticing that GoI is planning to transform their energy mix in increasing energy security and achieving climate targets. !
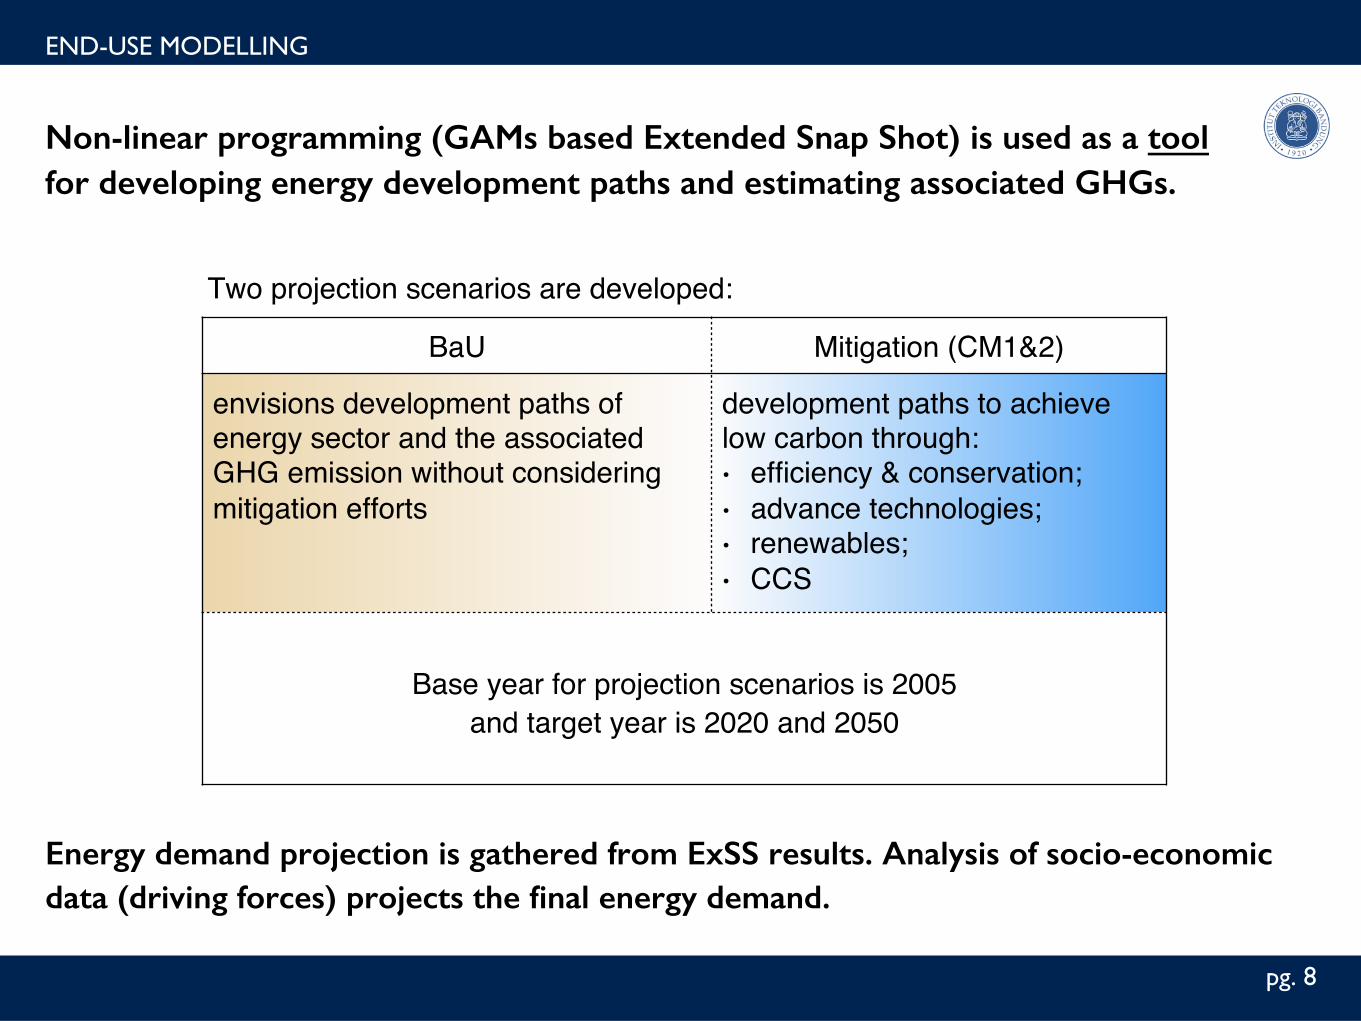
Counter Measure (CM) scenario:"Introduction of low-carbon measures which are already available. Assumptions are based on the official target (RAN-GRK, reduce 38 MtCO2 in energy sector).
Baseline scenario: "Projection of GHG emission under expected socio-economic development in Indonesia without additional countermeasures to reduce GHG from energy.
11pg.
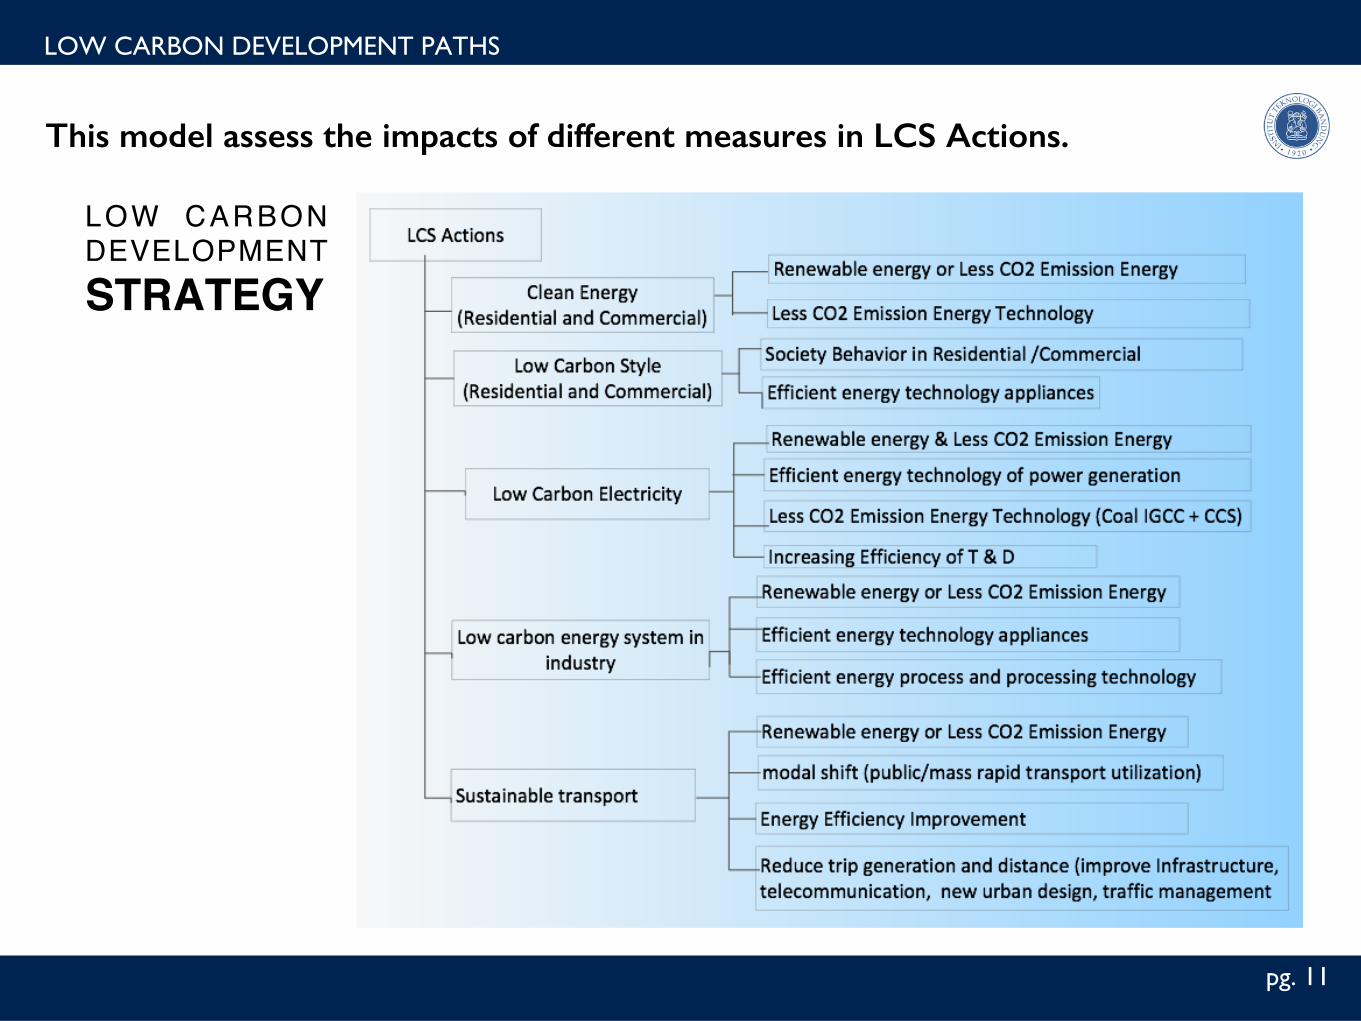
LOW CARBON DEVELOPMENT STRATEGY"
This model assess the impacts of different measures in LCS Actions. !
Difficult to move away from Oil — large share of oil in energy demand by type !
High increase in energy demand portion from industrial sector and freight whilst decrease in commercial sector!
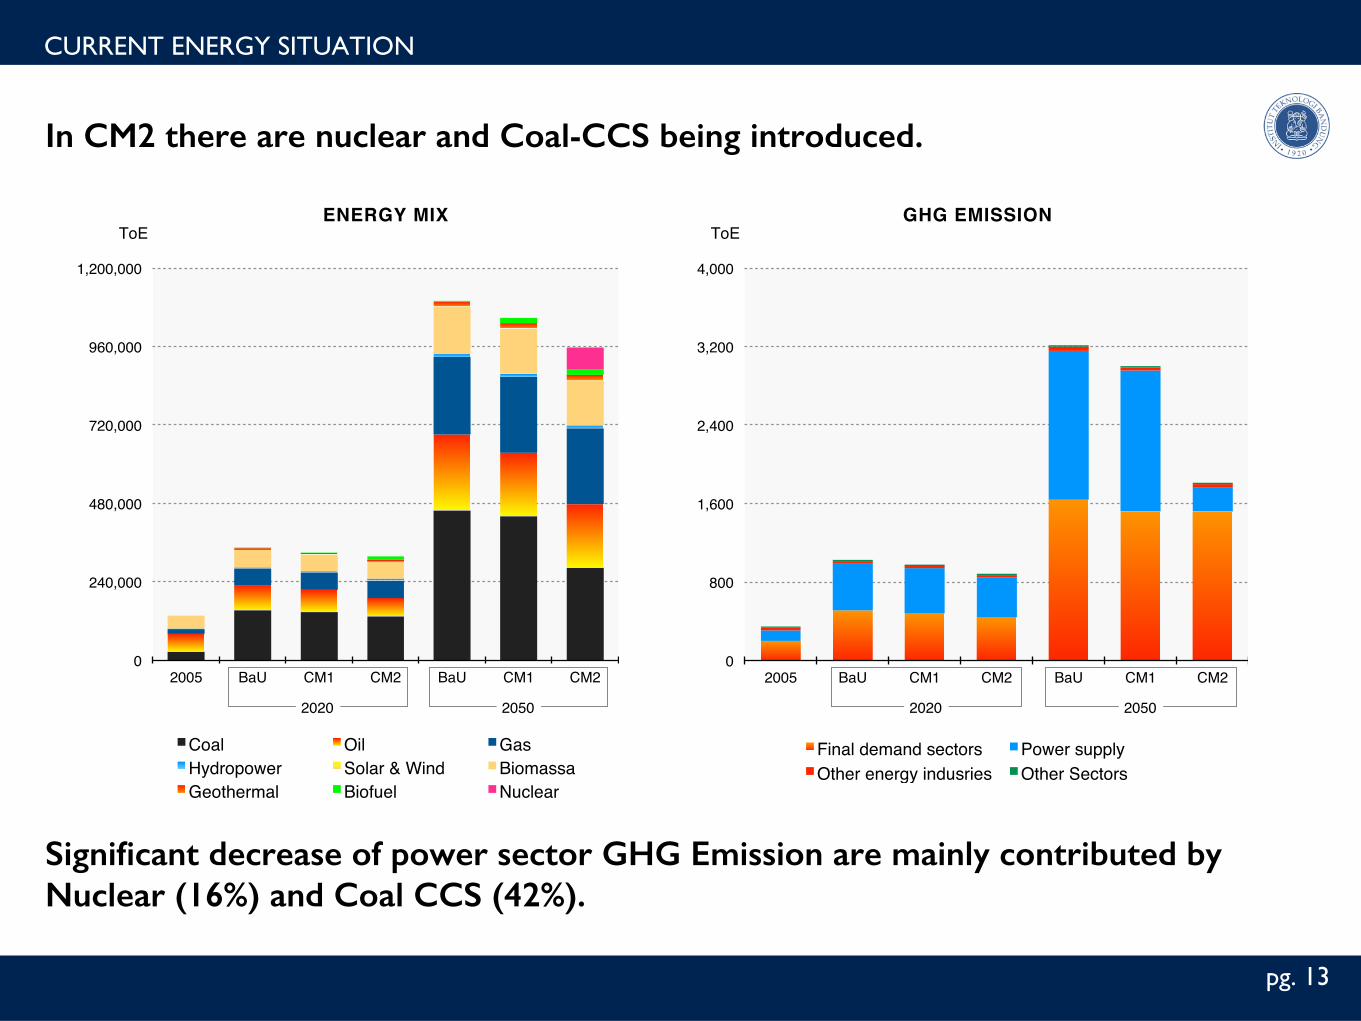
In CM2 there are nuclear and Coal-CCS being introduced. !
13pg.
CURRENT ENERGY SITUATION
Significant decrease of power sector GHG Emission are mainly contributed by Nuclear (16%) and Coal CCS (42%). !
2050"
ToE"ENERGY MIX"
0"
240,000"
480,000"
720,000"
960,000"
1,200,000"
2005" BaU" CM1" CM2" BaU" CM1" CM2"
Coal" Oil" Gas"Hydropower" Solar & Wind" Biomassa"Geothermal" Biofuel" Nuclear"
2020"
0"
800"
1,600"
2,400"
3,200"
4,000"
2005" BaU" CM1" CM2" BaU" CM1" CM2"
Final demand sectors" Power supply"Other energy indusries" Other Sectors"
ToE"GHG EMISSION"
2050"2020"
14pg.
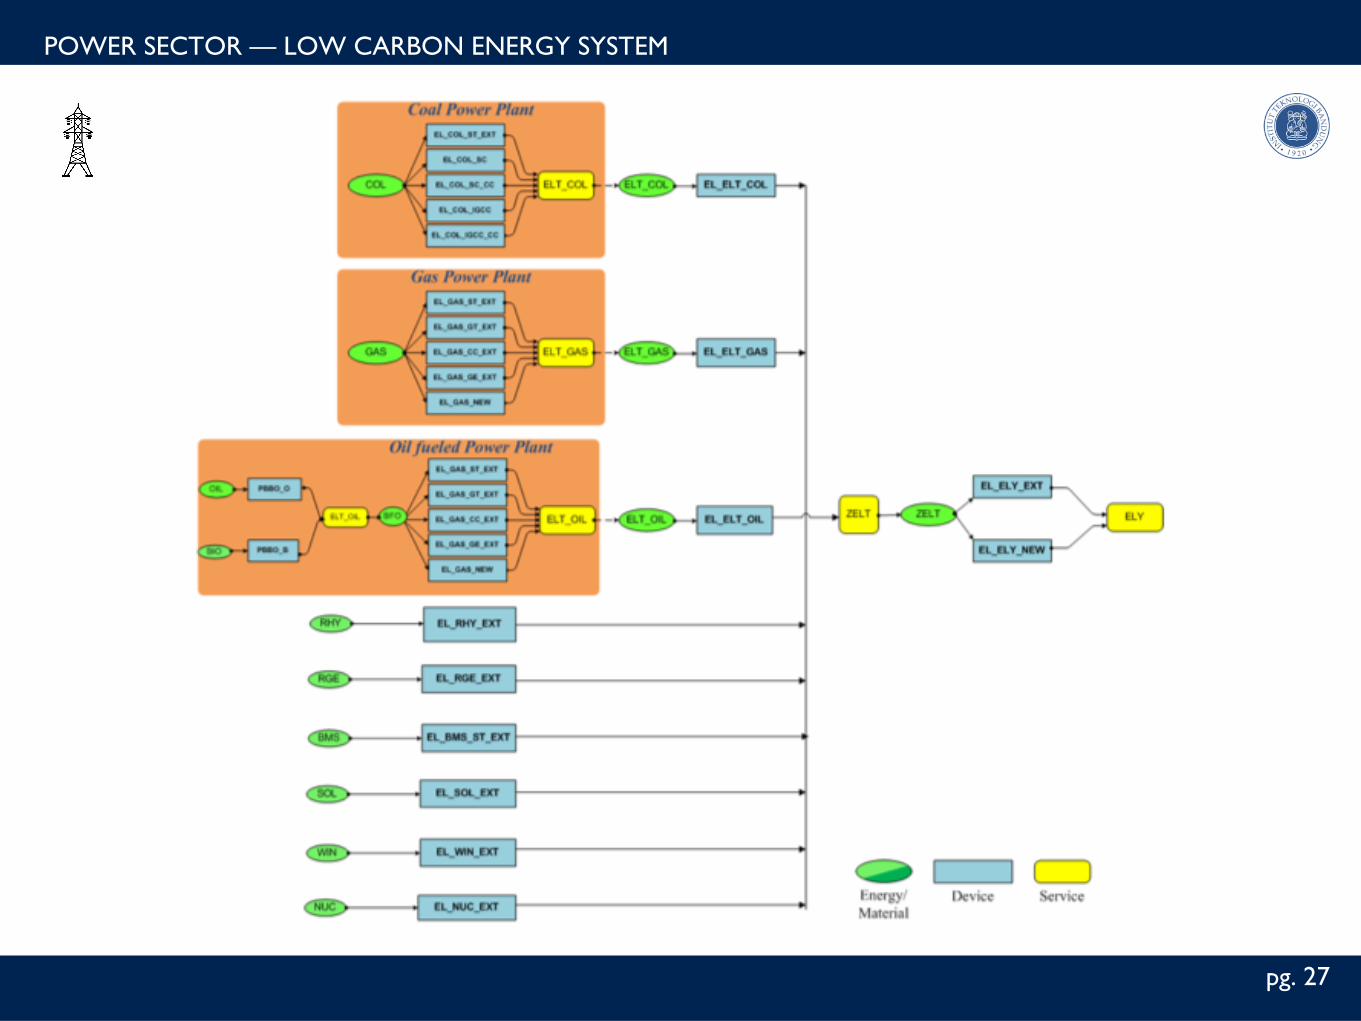
POWER SECTOR — LOW CARBON ENERGY SYSTEM
CM 1 follows the RAN-GRK plan in increasing the utilization of new and renewables technologies and energies (Hydro, Geothermal, Biomass), in this scenario there are a decrease in electricity demand due to lower activities in other sectors due to efficiency and conservation programs activated. There are changes in share of Coal, Oil, and Gas in the energy mix."CM 2 extend the use of Hydro power generation, Biomass, and especially the introduction of Biofuel in power sector. With a specified share of Coal in the energy mix (66%), the rest of energy share are competed, as well as the technology selection."
Business as Usual Scenario follows the planned energy mix and technologies share allocation for power sector in “Rencana Umum Pengembangan Tenaga Listrik” (RUPTL 2012-2020)."
POWER"
MtCO2eq"
0"
360"
720"
1,080"
1,440"
1,800"
2005" 2015" 2020" 2025" 2030" 2050"
BaUCM1CM2
0"
220"
440"
660"
880"
1,100"
BaU
Coal Gas Oil Biomass Hydro Geothermal Blended Bio-fuel
BaU CM1 CM2 BaU CM1 CM2 BaU CM1 CM2 BaU CM1 CM2 BaU CM1 CM2
Total Operating Cost Annualized Investment Cost Total Initial Investment Cost
BaU CM1CM2 BaU CM1CM2 BaU CM1CM2 BaU CM1CM2 BaU CM1CM2
millions USD"
2015" 2020" 2025" 2030" 2050"2005"
16pg.
POWER SECTOR — LOW CARBON ENERGY SYSTEM
USD/tCO2eq"
-24"
0"
24"
48"
72"
96"
120"
0" 450" 900" 1350" 1800"
ABATEMENT COST CURVE"G
as C
C w
ith
CC
S
Geo
ther
mal
IGC
C C
oal
wit
h C
CS Nuclear Hydro
Biomass ST
tCO2eq"
GHG REDUCTION"
CO
ST/
SA
VIN
GS"
POWER"
17pg.
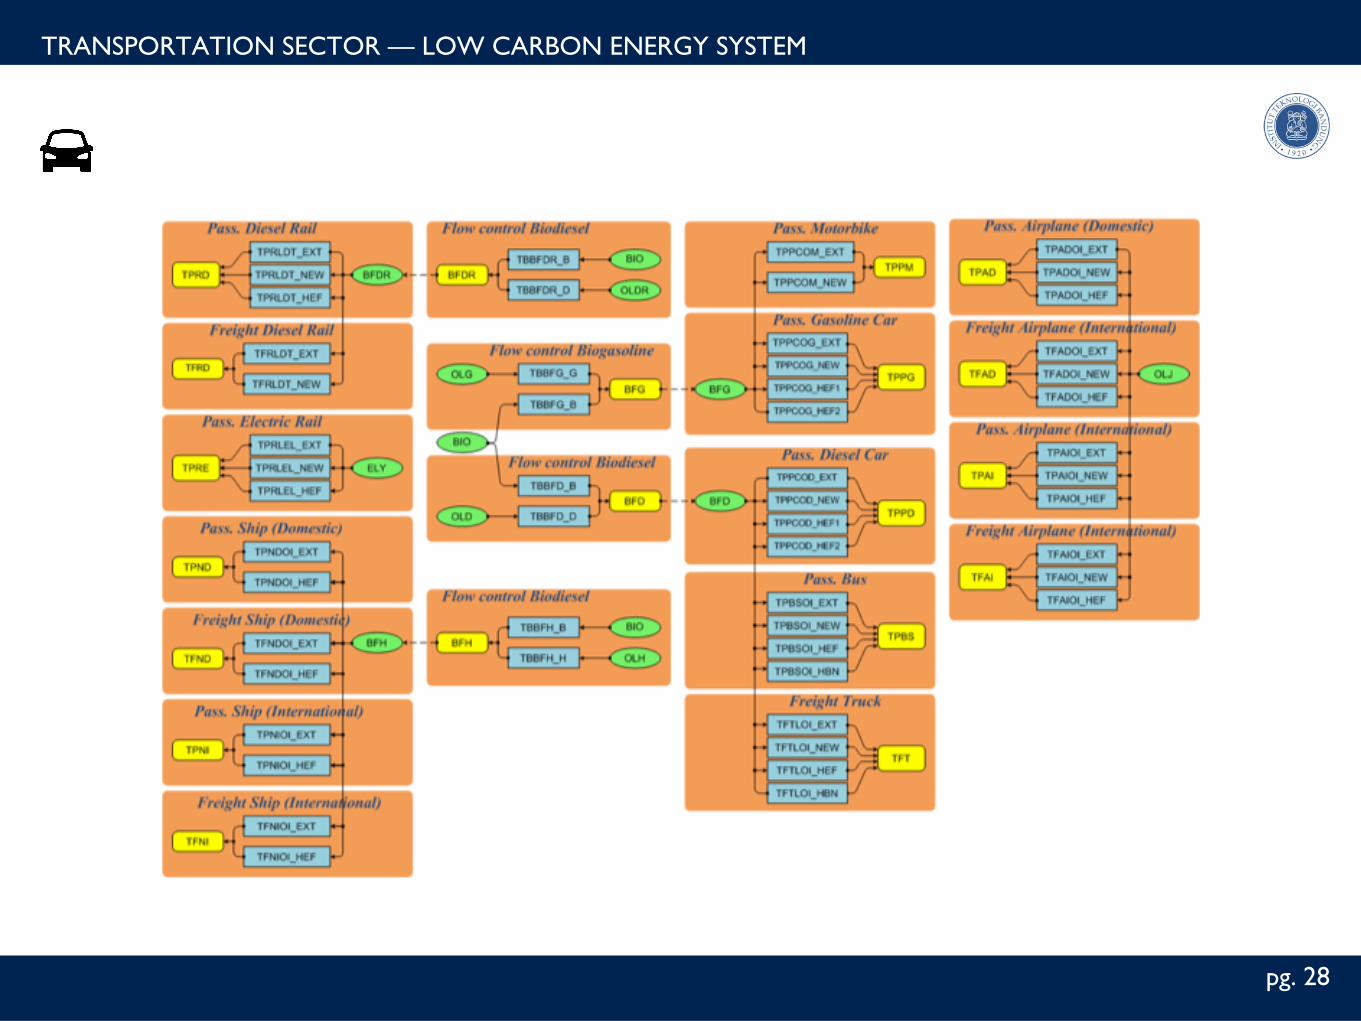
TRANSPORTATION SECTOR — LOW CARBON ENERGY SYSTEM
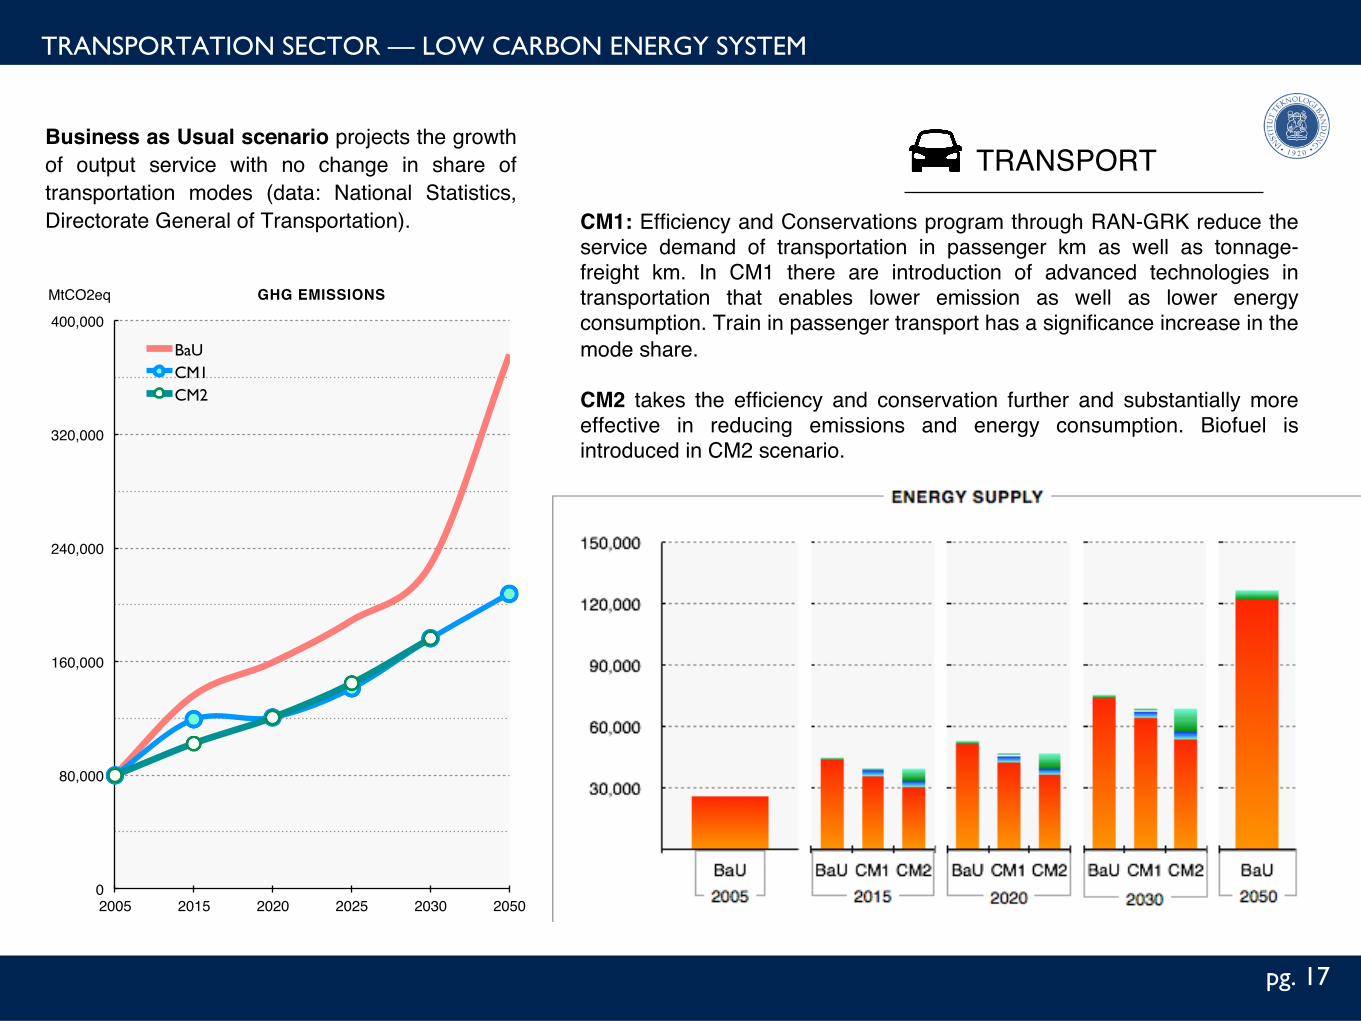
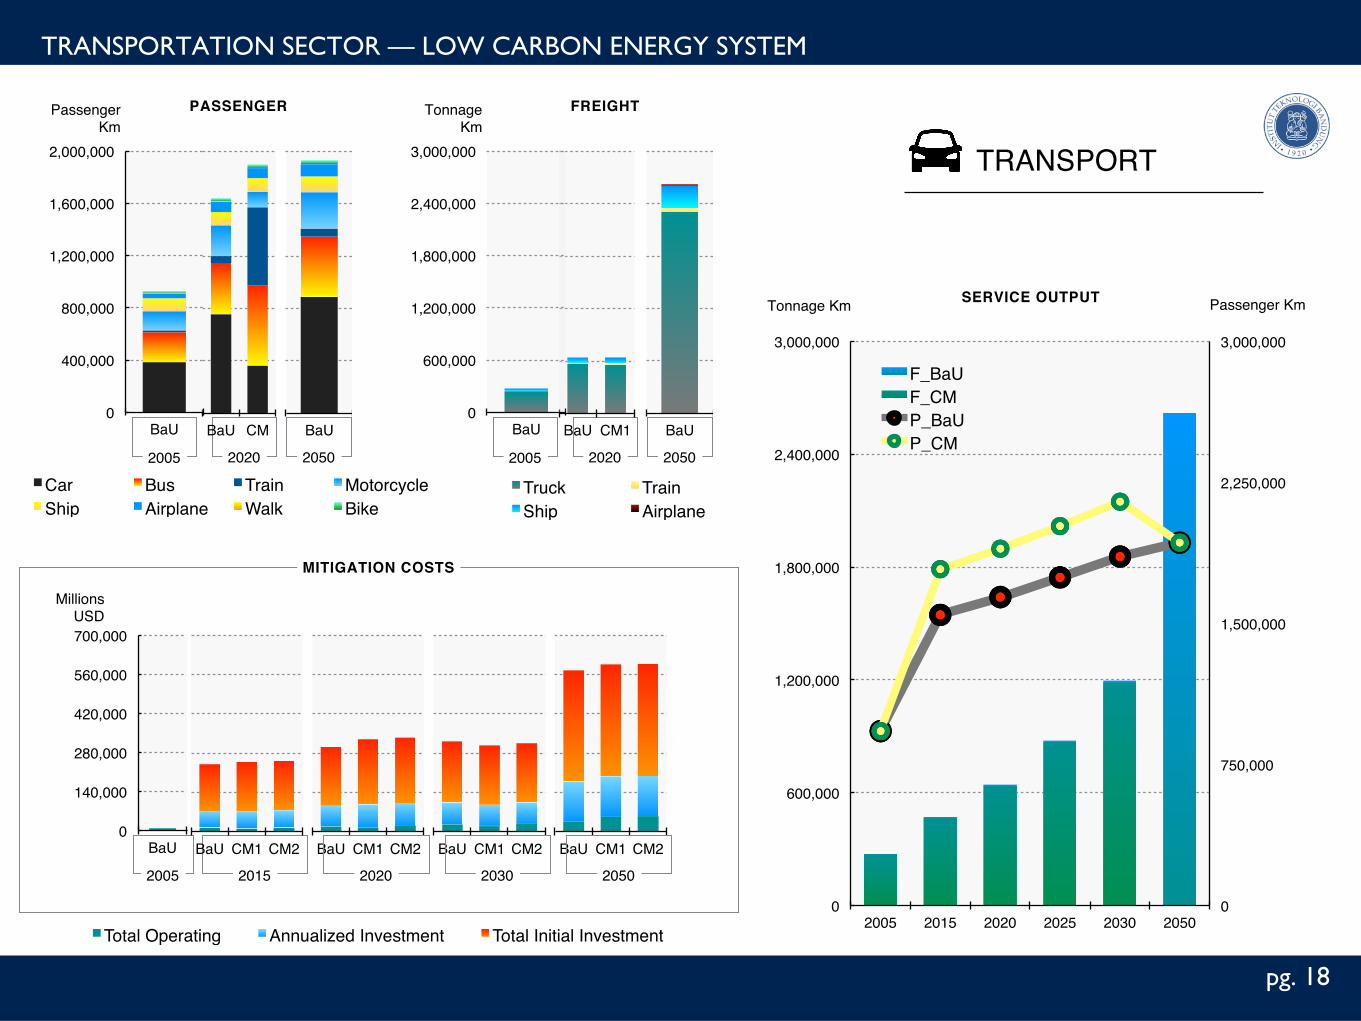
CM1: Efficiency and Conservations program through RAN-GRK reduce the service demand of transportation in passenger km as well as tonnage-freight km. In CM1 there are introduction of advanced technologies in transportation that enables lower emission as well as lower energy consumption. Train in passenger transport has a significance increase in the mode share.""CM2 takes the efficiency and conservation further and substantially more effective in reducing emissions and energy consumption. Biofuel is introduced in CM2 scenario. "
Business as Usual scenario projects the growth of output service with no change in share of transportation modes (data: National Statistics, Directorate General of Transportation)."
TRANSPORT"
GHG EMISSIONS"
0"
80,000"
160,000"
240,000"
320,000"
400,000"
2005" 2015" 2020" 2025" 2030" 2050"
BaUCM1CM2
MtCO2eq"
18pg.
TRANSPORTATION SECTOR — LOW CARBON ENERGY SYSTEM
Tonnage Km"
0"
750,000"
1,500,000"
2,250,000"
3,000,000"
0"
600,000"
1,200,000"
1,800,000"
2,400,000"
3,000,000"
2005" 2015" 2020" 2025" 2030" 2050"
F_BaU"F_CM"P_BaU"P_CM"
Passenger Km"SERVICE OUTPUT"
2015"2005"
Millions USD"
MITIGATION COSTS"
0"
140,000"
280,000"
420,000"
560,000"
700,000"
BaU"
Total Operating" Annualized Investment" Total Initial Investment"
CM1 scenario of cement industry, there are extensive use of alternative fuel and material (AFR), such as Biomass for clinker substitute material and Biomass for fuel combustion process (waste, husk, hazardous waste, etc.). The reuse of waste and use of renewables as fuel and materials reduces the GHG emissions. "CM1 scenario in iron & steel industry introduces the competition of advanced technologies in the production process. Advanced technologies have significant impact to higher efficiency in energy use and further reduce GHG emissions, noticing that Iron & Steel industry is a energy intensive industry. "
Business as Usual scenario: In cement industry there are limited introduction of alternative material in the production process.""There is development plan of production capacity of iron & steel industry that by 2020 blast furnace process for the first time will be running under several companies."
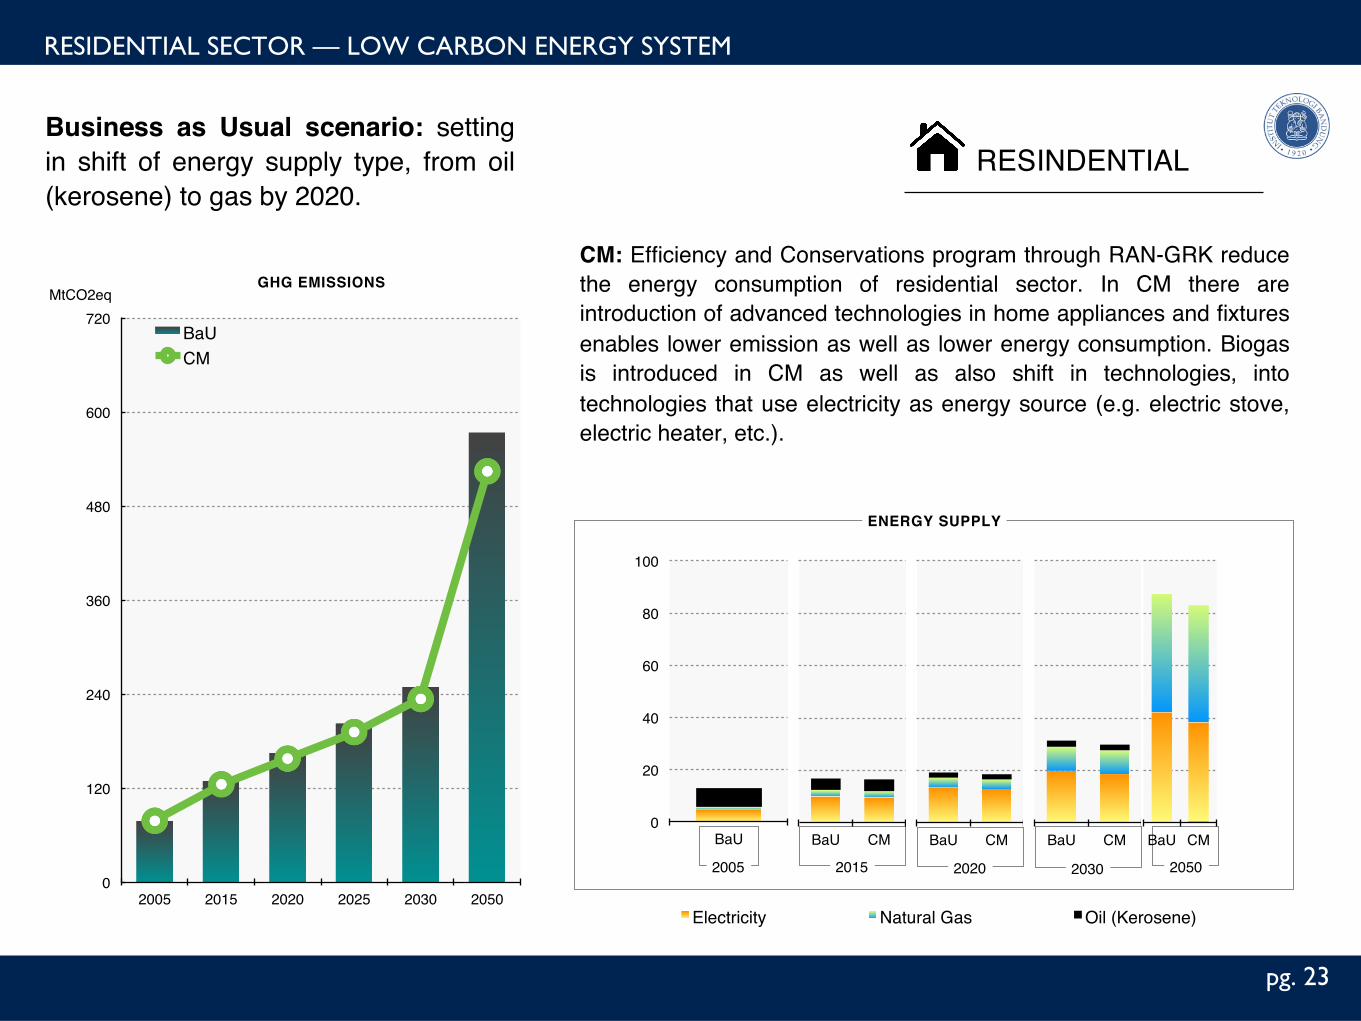
CM: Efficiency and Conservations program through RAN-GRK reduce the energy consumption of residential sector. In CM there are introduction of advanced technologies in home appliances and fixtures enables lower emission as well as lower energy consumption. Biogas is introduced in CM as well as also shift in technologies, into technologies that use electricity as energy source (e.g. electric stove, electric heater, etc.). "
Business as Usual scenario: setting in shift of energy supply type, from oil (kerosene) to gas by 2020."
Relationship Science & Policy: Independence and Neutrality of Scientists: • For science-base policy making to be realised, the scientific community has responsibility make knowledge more
accessible and policy-relevant for decision-makers to affect societal change (LCS・RNet 2010).
• In one side, it requires higher research education to be independent from government. In the other side, government also respect the independence and neutrality of scientists and each ministry has process to incorporate scientific knowledge and view in to policy by holding scientific advisor.
Role of economist, social science, and engineering science in low carbon policy: • Despite its relatively short history of economics and social sciences which contributed to climate change compare to
natural science, their role is essential in identifying a feasible transition to a low carbon society by analyzing human behaviour with higher degree of uncertainty.
• At the initial stage, economists have played a crucial role in deciding the realistic and agreeable level of commitment to achieve the target. At the time of introducing renewable obligation target in energy (electricity) supply, economists play an important role in providing cost and benefit analysis on subsidy given for technologies for energy-intensive sectors such as steel which requires special treatment.
• Due to recent movement for evidence-based policy, which requires more economic and scientific robustness, role of engineers and social scientists are increasingly important. Social science has not been focused that much, but it will have a greater role in changing people’s behaviour with high level of uncertainty.
• Fukushima accident in Japan triggered the discussion worldwide on the role of science and its relation with policy. • High independence of researcher/academia from the government through the statute and principle, evidence-based policy,
the regular communication and consultation among the related stakeholders and more preference for policy impact are worth to been considered for other countries as well.
Role of engineering science in energy and low carbon technology development: • introducing and deployment of renewable and less emission energy technology
Acknowledgment"
Institut Teknologi Bandung (ITB) - Indonesia "Institut Pertanian Bogor (IPB) - Indonesia"
Institute for Global Environmental Strategies (IGES) – Japan"Kyoto University – Japan"
Mizuho Information & Research Institute – Japan"
National Institute for Environmental Studies (NIES) – Japan"UN University Institute of Advance Studies – Japan"