Ranran Lin, Antti Nestori Laiho, Ari Haavisto, and Antero Arkkio. 2010.Endwinding vibrations caused by steadystate magnetic forces in aninduction machine. IEEE Transactions on Magnetics, volume 46, number 7,pages 26652674.
This material is posted here with permission of the IEEE. Such permission ofthe IEEE does not in any way imply IEEE endorsement of any of AaltoUniversity's products or services. Internal or personal use of this material ispermitted. However, permission to reprint/republish this material for advertisingor promotional purposes or for creating new collective works for resale orredistribution must be obtained from the IEEE by writing to pubs[email protected].
By choosing to view this document, you agree to all provisions of the copyrightlaws protecting it.
IEEE TRANSACTIONS ON MAGNETICS, VOL. 46, NO. 7, JULY 2010 2665
End-Winding Vibrations Caused by Steady-State Magnetic Forcesin an Induction Machine
Ranran Lin�, Antti Nestori Laiho�, Ari Haavisto�, and Antero Arkkio�
Department of Electrical Engineering, Faculty of Electronics, Communications and Automation,School of Science and Technology, Aalto University, Espoo, Finland
VTT Technical Research Centre of Finland, Espoo, Finland
We conducted a 3-D electromagnetic analysis coupled with a 3-D mechanical analysis to analyze end-winding vibrations and de-formation in an induction machine caused by steady-state magnetic forces on the end winding. Both the analyses were based on thefinite-element method. The electromagnetic analysis was used to calculate magnetic forces. During the mechanical analysis, complexsupport structures in the end region were simplified. We first updated and validated the mechanical model according to a modal modelobtained from a modal test, and afterward analyzed deformation, vibrations, and stresses. According to the analysis, the shape of therotary dynamic deformation of the end winding caused by dynamic forces is similar to the most excitable mode shape though the naturalfrequency of that mode is much higher than the excitation frequency. The static deformation caused by static forces tends to expand thecoil ends outward. Under both types of deformation, the nose portion of the coil ends experiences larger displacement, but von Misesstresses are larger mainly in the knuckle portion.
Index Terms—End winding, finite-element method, magnetic force, modal testing, vibration.
I. INTRODUCTION
I N LARGE radial-flux rotating electric machines, the statorend-winding leakage field can cause time-varying magnetic
forces on the end winding [1]–[11], and further, the forces cangive rise to forced vibrations [7], [12]–[20]. The stator windingis tightly fixed to the stator core, and therefore the core vibra-tions may affect the end-winding vibrations [13]. On the otherhand, the end-winding vibrations may slightly affect the end-re-gion magnetic field and further the magnetic forces on the endwinding. Consequently, the end-region magnetic field and theend-winding vibrations are interactive.
Long-term end-winding vibrations might cause prematurewinding failure [21], such as the degradation of the insulationintegration and the metal fatigue of the materials [15]. Inturbogenerators, the three-phase short-circuit current can be10 times as large as the rated current [16], so relatively largeforces may be caused [22], which may aggravate the damageto the end winding. Normally, the end winding is supported sotightly that its vibration level is negligible. However, this maybe an expensive solution, and further, the cooling of the endwinding may be greatly affected by excessive support struc-tures. Besides, the installation of support structures can changethe mechanical structure of the end region, such as naturalfrequencies and mode shapes. If a certain natural frequencyis close to the frequency of the forces and a correspondingmode shape is similar to the spatial distribution of the forcesat that frequency, a severe resonance may occur. As a result, itis of importance to model the end-winding vibrations to findoptimum support structures.
Manuscript received October 12, 2009; revised December 28, 2009 and Feb-ruary 01, 2010; accepted February 05, 2010. First published March 08, 2010;current version published June 23, 2010. Corresponding author: R. Lin (e-mail:[email protected]).
Color versions of one or more of the figures in this paper are available onlineat http://ieeexplore.ieee.org.
Digital Object Identifier 10.1109/TMAG.2010.2044043
Most previous studies are focused on large turbogenerators,possessing similar support structures and coil ends. In [7],natural frequencies of the end winding under different sorts ofsupport structures were analyzed and responses to displace-ment of the bars were concisely discussed. In [12], strains inthe insulation layer of the coil ends were analyzed when thenumber of spacers between two coil ends was changed andwhen a fatigue-life test was conducted. Reference [13] revealedthat the end-winding vibrations in synchronous generators werestronger under leading power factors than under lagging onesby taking the core vibrations into consideration. In addition,a response model of the end winding was developed in [14]with the use of proportional viscous damping, to identify themost excitable modes and to find effects of the changes andthe deterioration of relevant structures. Furthermore, effects ofthe end-winding vibrations on the insulation and the fatigueof materials used in the coil ends were stated in [15]. In [16],displacement caused by forces on the end winding under shortcircuit and full load was discussed.
Some studies are concerned with the monitoring of the long-term end-winding vibrations in large turbogenerators [17]–[20].The state and the condition variables to monitor include voltage,current, vibration signals, etc. Artificial intelligence algorithms,e.g., neural networks, are often employed to analyze those vari-ables. For instance, a feedforward and an auto-associative net-work were used in [17].
The aforesaid vibrations also exist in large induction motors.Support structures in those motors are normally different fromones in large synchronous generators, since the power of theformer is around several MW, whereas the capacity of the lattercan reach several hundred MVA. Support structures might bealso different among large induction motors made by differentmanufacturers. However, such a study of the end-winding vi-brations in large induction motors the power of which is largerthan 1 MW has not been reported yet.
The end-winding vibrations in a 2.24-MW squirrel-cage in-duction motor were studied. A 3-D electromagnetic and a 3-Dmechanical model were built, taking all support structures of
2666 IEEE TRANSACTIONS ON MAGNETICS, VOL. 46, NO. 7, JULY 2010
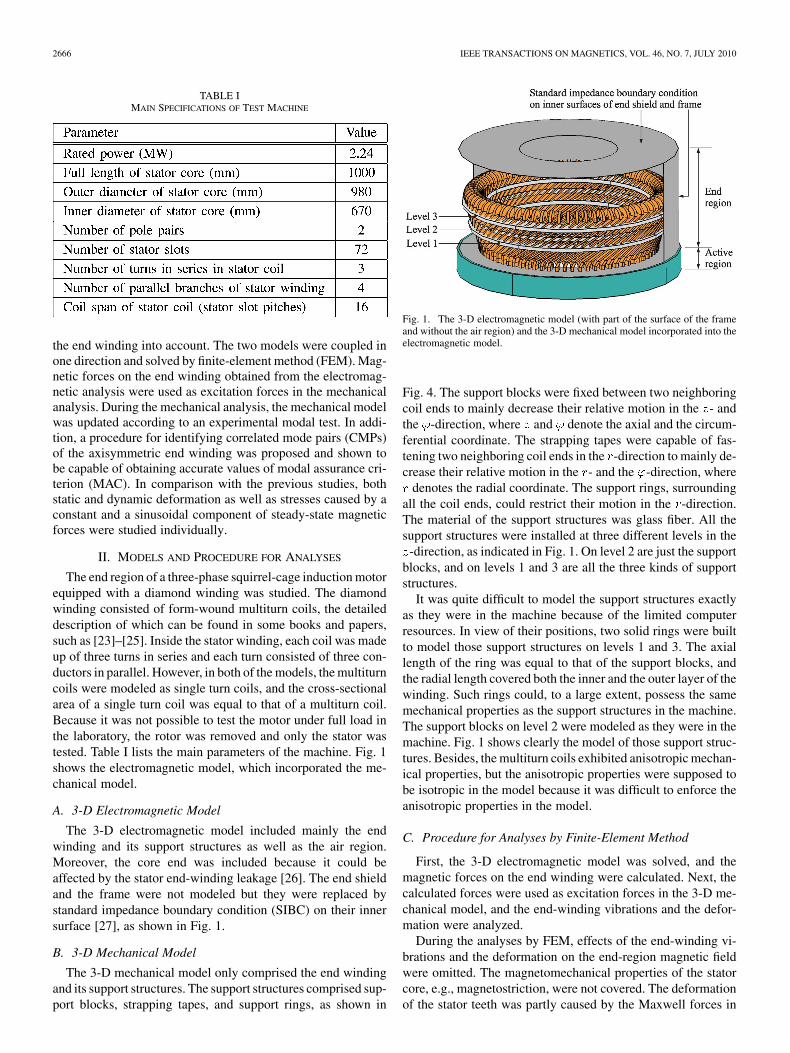
TABLE IMAIN SPECIFICATIONS OF TEST MACHINE
the end winding into account. The two models were coupled inone direction and solved by finite-element method (FEM). Mag-netic forces on the end winding obtained from the electromag-netic analysis were used as excitation forces in the mechanicalanalysis. During the mechanical analysis, the mechanical modelwas updated according to an experimental modal test. In addi-tion, a procedure for identifying correlated mode pairs (CMPs)of the axisymmetric end winding was proposed and shown tobe capable of obtaining accurate values of modal assurance cri-terion (MAC). In comparison with the previous studies, bothstatic and dynamic deformation as well as stresses caused by aconstant and a sinusoidal component of steady-state magneticforces were studied individually.
II. MODELS AND PROCEDURE FOR ANALYSES
The end region of a three-phase squirrel-cage induction motorequipped with a diamond winding was studied. The diamondwinding consisted of form-wound multiturn coils, the detaileddescription of which can be found in some books and papers,such as [23]–[25]. Inside the stator winding, each coil was madeup of three turns in series and each turn consisted of three con-ductors in parallel. However, in both of the models, the multiturncoils were modeled as single turn coils, and the cross-sectionalarea of a single turn coil was equal to that of a multiturn coil.Because it was not possible to test the motor under full load inthe laboratory, the rotor was removed and only the stator wastested. Table I lists the main parameters of the machine. Fig. 1shows the electromagnetic model, which incorporated the me-chanical model.
A. 3-D Electromagnetic Model
The 3-D electromagnetic model included mainly the endwinding and its support structures as well as the air region.Moreover, the core end was included because it could beaffected by the stator end-winding leakage [26]. The end shieldand the frame were not modeled but they were replaced bystandard impedance boundary condition (SIBC) on their innersurface [27], as shown in Fig. 1.
B. 3-D Mechanical Model
The 3-D mechanical model only comprised the end windingand its support structures. The support structures comprised sup-port blocks, strapping tapes, and support rings, as shown in
Fig. 1. The 3-D electromagnetic model (with part of the surface of the frameand without the air region) and the 3-D mechanical model incorporated into theelectromagnetic model.
Fig. 4. The support blocks were fixed between two neighboringcoil ends to mainly decrease their relative motion in the - andthe -direction, where and denote the axial and the circum-ferential coordinate. The strapping tapes were capable of fas-tening two neighboring coil ends in the -direction to mainly de-crease their relative motion in the - and the -direction, where
denotes the radial coordinate. The support rings, surroundingall the coil ends, could restrict their motion in the -direction.The material of the support structures was glass fiber. All thesupport structures were installed at three different levels in the
-direction, as indicated in Fig. 1. On level 2 are just the supportblocks, and on levels 1 and 3 are all the three kinds of supportstructures.
It was quite difficult to model the support structures exactlyas they were in the machine because of the limited computerresources. In view of their positions, two solid rings were builtto model those support structures on levels 1 and 3. The axiallength of the ring was equal to that of the support blocks, andthe radial length covered both the inner and the outer layer of thewinding. Such rings could, to a large extent, possess the samemechanical properties as the support structures in the machine.The support blocks on level 2 were modeled as they were in themachine. Fig. 1 shows clearly the model of those support struc-tures. Besides, the multiturn coils exhibited anisotropic mechan-ical properties, but the anisotropic properties were supposed tobe isotropic in the model because it was difficult to enforce theanisotropic properties in the model.
C. Procedure for Analyses by Finite-Element Method
First, the 3-D electromagnetic model was solved, and themagnetic forces on the end winding were calculated. Next, thecalculated forces were used as excitation forces in the 3-D me-chanical model, and the end-winding vibrations and the defor-mation were analyzed.
During the analyses by FEM, effects of the end-winding vi-brations and the deformation on the end-region magnetic fieldwere omitted. The magnetomechanical properties of the statorcore, e.g., magnetostriction, were not covered. The deformationof the stator teeth was partly caused by the Maxwell forces in
LIN et al.: END-WINDING VIBRATIONS CAUSED BY STEADY-STATE MAGNETIC FORCES 2667
the air gap [28], but it was omitted because the rotor was not in-cluded. Hence, the stator core was supposed not to be deformed.In addition, thermal effects causing stresses in the coil ends werenot considered.
III. ANALYSES BY FINITE-ELEMENT METHOD
A. Analysis of Electromagnetic Model
In the time-harmonic analysis, the stator winding wassupplied by a three-phase current source with an rms value
, where “ ” over a symbol means the rms value of thefield quantity symbolized by the symbol, denotes statorphase current, the number of turns in series in the stator coil,and the number of parallel branches of the stator winding.The governing equation was
(1)
where “ ” under a symbol means the complex vector or thephasor of the field quantity symbolized by the symbol,denotes magnetic vector potential, source current density,
tensor reluctivity, tensor conductivity, and angular fre-quency. A linear magnetization curve was adopted in the core.Electric scalar potential was not solved, because the statorcurrent was known and eddy currents inside the stator coil wereomitted owing to the thin conductors there [29]. Besides, theinclusion of would make the computation problem too largefor the computer.
On the inner surface of the frame and the end shield, SIBCalso called Leontovich boundary condition given by [30] wasenforced
(2)
where denotes electric field strength, magnetic fieldstrength, a unit normal vector on a boundary, and surfaceimpedance. On the other surfaces, either or
was enforced according to the direction of themagnetic induction. A detailed explanation of SIBC can befound in [31].
First-order tetrahedral and prismatic edge elements wereemployed and the number of degrees of freedom (DOFs) was973642. The weak formulation of the method of weightedresidual (Galerkin’s method) was used to construct the systemof equations.
B. Analysis of Mechanical Model
The mechanical model was a linear time-invariant (LTI)multi-DOF (MDOF) system. The analysis covered two aspects:free vibration and forced vibration. At first, a free-vibrationanalysis was conducted to obtain a modal model, and then themodal model was compared with one obtained from a modaltest to see whether the calculated modal model ought to be
Fig. 2. Diagram of the measurement set-up. DCM: dc motor; SG: synchronousgenerator; test IM: test induction motor; and PC: personal computer.
updated or not. The undamped free-vibration analysis wascompleted according to
(3)
where denotes mass matrix, stiffness matrix, the columnvector of displacement, and “ ” over a symbol means the secondderivative of the field quantity symbolized by the symbol withrespect to time.
Next, a forced-vibration analysis was conducted to analyzethe static and the dynamic deformation. Because the excitationfrequency was much lower than the possible resonant frequencyaccording to the modal test, the damping was omitted. The gov-erning equation was
(4)
where denotes the column vector of force.In the mechanical model, those surfaces between the coil
ends and the coil sides were forced to be stationary, because themodal test revealed that those surfaces were almost fixed. Theother surfaces of the model were allowed to move freely.
Second-order tetrahedral nodal elements were employed inboth of the analyses, and the number of DOFs was 1 488 882.The way in which the system of equations was constructed wassimilar to the one mentioned in Section III-A.
IV. UPDATING AND VALIDATION OF MODELS
Validations of the models were completed by measurement,and Fig. 2 shows a diagram of the measurement setup.
A. Validation of Electromagnetic Model
A search coil, made of enameled copper wire, was fixed alonga coil end, and its induced electromotive force (EMF) was mea-sured. Magnetic induction was also measured at two points inthe end region and in the active region, respectively.
Table II lists calculations and measurements. In Table II, denotes induced EMF, and , , and
the components of magnetic induction. The calculations are
2668 IEEE TRANSACTIONS ON MAGNETICS, VOL. 46, NO. 7, JULY 2010
TABLE IIRESULTS OF VALIDATION IN TERMS OF MAGNETIC FIELD
Fig. 3. Measured spots on the coil ends and the stator core end for the impacthammer test.
consistent with the measurements except for at the point inthe active region. The reason is that it was difficult to make theprobe of the meter exactly perpendicular to the direction of themeasured component.
B. Updating and Validation of Mechanical Model
During the validation, an impact hammer test was completedto obtain a modal model. In the 4-pole machine, the wavenumber of the fundamental of the rotating magnetic field was2, while that of the fundamental of the steady-state magneticforces was 4 in the -direction. Therefore, at least 8 spots on theend winding evenly distributed in the -direction were requiredfor measuring responses to identify the most excitable modes.On account of the 3-D structure, responses were measured onthree different axial levels, with eight spots on each level, asindicated in Fig. 3. Spots 1–8 were on the surface of the coreend to observe the core vibrations, spots 9–16 were on thesurface of the knuckle portion of the coil ends, and spots 17–24on the surface of the nose portion. Furthermore, a referencespot on the frame was chosen to eliminate effects of the varyingoperating conditions during the test.
Impact forces with a cut-off frequency 1.2 kHz were exertedon spot 17 from the -, the -, and the -direction. Accelerationat each spot was measured in the corresponding direction by atriaxial piezoelectric accelerometer. A part of the experimentalset-up is shown in Fig. 4.
A column of entries in a symmetric frequency response func-tion matrix was obtained during the modal test, which sufficedfor obtaining a modal model [32].
After the modal test, experimental mode shapes were com-pared with nine calculated ones, and values of MAC were com-puted to identify CMPs. The function of MAC is to provide a
Fig. 4. Part of the experimental set-up for the impact hammer test.
measure of the consistency between estimates of mode shapevectors originating from different sources [33], such as from anumerical computation and from an experimental modal test.MAC is defined as a scalar and is bounded between 0 and 1. Avalue of 0 means that two compared mode shape vectors are notconsistent totally, whereas a value of 1 means that they are ex-actly consistent. In this paper, values of MAC were computedbased on
(5)
where and denote experimental and calculated modeshape vector, respectively and “H” near a symbol means theHermitian transpose of the matrix symbolized by the symbol.
was computed from (3) relating to the eigenvalues of amatrix. The matrix of eigenvalues, , and that of correspondingeigenvectors, i.e., mode shape vectors, , were written as
and , re-spectively, where and denote the eigenvalue andthe corresponding eigenvector of mode , .
The end winding was almost axisymmetric, so calculatedmode shapes were not fixed and they could be shifted in the
-direction. However, experimental mode shapes were fixed onaccount of the fixed measured spots. Therefore, at first, thosepoints lying at the position of the measured spots in Fig. 3 werechosen in the model. Mode shape vectors were calculated basedon those positions, and then values of MAC were computed.Next, those points for calculating mode shapes were shifted bya stator slot pitch, i.e., 5 , in the -direction. Mode shape vec-tors were calculated again based on the updated positions, andvalues of MAC were computed again. The shift in calculatedpositions was not halted until 72 slot pitches were shifted, andvalues of MAC were computed under each shift. During thoseshifts, experimental mode shape vectors were kept constant.
Usually mode shapes of the end winding are viewed fromthe -direction, for variations in the - and the -direction aremore interesting. Because the end winding was a cylindricalstructure to some extent, it would be convenient to describe its
LIN et al.: END-WINDING VIBRATIONS CAUSED BY STEADY-STATE MAGNETIC FORCES 2669
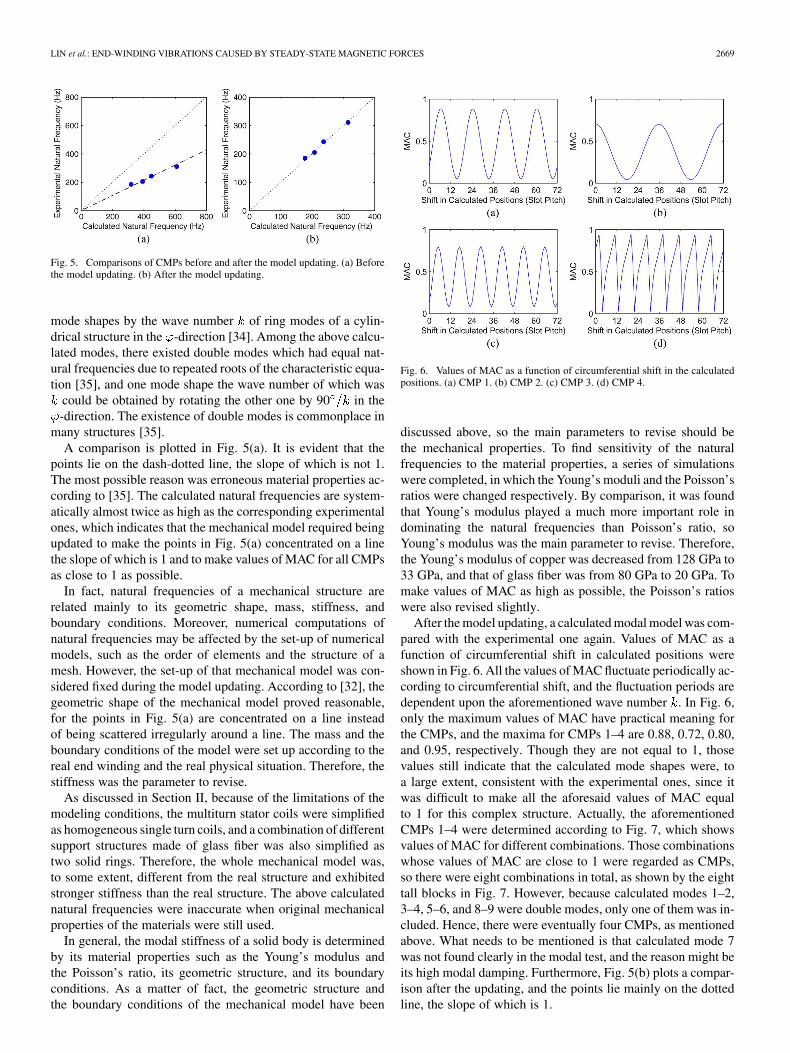
Fig. 5. Comparisons of CMPs before and after the model updating. (a) Beforethe model updating. (b) After the model updating.
mode shapes by the wave number of ring modes of a cylin-drical structure in the -direction [34]. Among the above calcu-lated modes, there existed double modes which had equal nat-ural frequencies due to repeated roots of the characteristic equa-tion [35], and one mode shape the wave number of which was
could be obtained by rotating the other one by 90 in the-direction. The existence of double modes is commonplace in
many structures [35].A comparison is plotted in Fig. 5(a). It is evident that the
points lie on the dash-dotted line, the slope of which is not 1.The most possible reason was erroneous material properties ac-cording to [35]. The calculated natural frequencies are system-atically almost twice as high as the corresponding experimentalones, which indicates that the mechanical model required beingupdated to make the points in Fig. 5(a) concentrated on a linethe slope of which is 1 and to make values of MAC for all CMPsas close to 1 as possible.
In fact, natural frequencies of a mechanical structure arerelated mainly to its geometric shape, mass, stiffness, andboundary conditions. Moreover, numerical computations ofnatural frequencies may be affected by the set-up of numericalmodels, such as the order of elements and the structure of amesh. However, the set-up of that mechanical model was con-sidered fixed during the model updating. According to [32], thegeometric shape of the mechanical model proved reasonable,for the points in Fig. 5(a) are concentrated on a line insteadof being scattered irregularly around a line. The mass and theboundary conditions of the model were set up according to thereal end winding and the real physical situation. Therefore, thestiffness was the parameter to revise.
As discussed in Section II, because of the limitations of themodeling conditions, the multiturn stator coils were simplifiedas homogeneous single turn coils, and a combination of differentsupport structures made of glass fiber was also simplified astwo solid rings. Therefore, the whole mechanical model was,to some extent, different from the real structure and exhibitedstronger stiffness than the real structure. The above calculatednatural frequencies were inaccurate when original mechanicalproperties of the materials were still used.
In general, the modal stiffness of a solid body is determinedby its material properties such as the Young’s modulus andthe Poisson’s ratio, its geometric structure, and its boundaryconditions. As a matter of fact, the geometric structure andthe boundary conditions of the mechanical model have been
Fig. 6. Values of MAC as a function of circumferential shift in the calculatedpositions. (a) CMP 1. (b) CMP 2. (c) CMP 3. (d) CMP 4.
discussed above, so the main parameters to revise should bethe mechanical properties. To find sensitivity of the naturalfrequencies to the material properties, a series of simulationswere completed, in which the Young’s moduli and the Poisson’sratios were changed respectively. By comparison, it was foundthat Young’s modulus played a much more important role indominating the natural frequencies than Poisson’s ratio, soYoung’s modulus was the main parameter to revise. Therefore,the Young’s modulus of copper was decreased from 128 GPa to33 GPa, and that of glass fiber was from 80 GPa to 20 GPa. Tomake values of MAC as high as possible, the Poisson’s ratioswere also revised slightly.
After the model updating, a calculated modal model was com-pared with the experimental one again. Values of MAC as afunction of circumferential shift in calculated positions wereshown in Fig. 6. All the values of MAC fluctuate periodically ac-cording to circumferential shift, and the fluctuation periods aredependent upon the aforementioned wave number . In Fig. 6,only the maximum values of MAC have practical meaning forthe CMPs, and the maxima for CMPs 1–4 are 0.88, 0.72, 0.80,and 0.95, respectively. Though they are not equal to 1, thosevalues still indicate that the calculated mode shapes were, toa large extent, consistent with the experimental ones, since itwas difficult to make all the aforesaid values of MAC equalto 1 for this complex structure. Actually, the aforementionedCMPs 1–4 were determined according to Fig. 7, which showsvalues of MAC for different combinations. Those combinationswhose values of MAC are close to 1 were regarded as CMPs,so there were eight combinations in total, as shown by the eighttall blocks in Fig. 7. However, because calculated modes 1–2,3–4, 5–6, and 8–9 were double modes, only one of them was in-cluded. Hence, there were eventually four CMPs, as mentionedabove. What needs to be mentioned is that calculated mode 7was not found clearly in the modal test, and the reason might beits high modal damping. Furthermore, Fig. 5(b) plots a compar-ison after the updating, and the points lie mainly on the dottedline, the slope of which is 1.
2670 IEEE TRANSACTIONS ON MAGNETICS, VOL. 46, NO. 7, JULY 2010
TABLE IIICOMPARISON OF TWO MODAL MODELS
Fig. 7. Values of MAC for different combinations of the experimental modesand the calculated modes.
Fig. 8. Views of the calculated mode shapes correlating with lower naturalfrequencies from the �-direction. Warm colors: large relative amplitude; coolcolors: small relative amplitude. (a) Mode 1 �� � ��. (b) Mode 3 �� � ��. (c)Mode 5 �� � ��. (d) Mode 7 �� � ��. (e) Mode 8 �� � ��.
V. RESULTS AND ANALYSIS
A. Calculated and Experimental Modal Model
The undamped mode shapes correlating with lower naturalfrequencies are shown in Fig. 8. With respect to those doublemodes, only one of them was shown. The mode shape of mode8 in Fig. 8(e) corresponds to the steady-state magneticforces in the 4-pole machine.
The calculated modal model was compared with the exper-imental one, as shown in Table III. In the experimental modalmodel, modal damping was supposed and no point damping wasconsidered. As a matter of fact, it was difficult to find certainmodes with high modal damping during the modal test. The nat-ural frequency of mode 8 or mode 9 , which correspondsto the magnetic forces, is 315.6 Hz, which is much higher thanthe excitation frequency, 100 Hz, so the damping does not havean important effect on the forced vibrations.
B. Magnetic Forces and Deformation
Magnetic forces on the stator end winding were classified asLorentz force [22], and the force density was defined by
, where and denote current density and magneticinduction, respectively. Under the time-harmonic analysis, themagnetic force density in the coil ends was
(6)
where “ ” over a symbol means the amplitude of the field quan-tity symbolized by the symbol, , , and denote the forcecomponents, , , and the constant components,
, , and the sinusoidal components, , , andthe phase angles, the angular frequency of the stator
field, and time. Obviously, each force density componentconsisted of a constant component and a double-frequencysinusoidal component, so the force also comprised a static anda dynamic component. Because of the LTI characteristic, theabove two components were tackled individually.
The static components, , , and , would not leadto vibrations but static deformation. The magnitude of the staticforce density was calculated by
(7)
Fig. 9 shows the distribution of . In Fig. 9, every phase beltcomprising six stator coils experiences the same static forces. Inthe coil ends except the portion close to the core, relatively largeforce density in each phase belt appears in the involute portionof the first coil end along the direction of the rotating magneticfield, and the force density gets smaller in the rest of the coilends. The force density in the involute and the knuckle portion
LIN et al.: END-WINDING VIBRATIONS CAUSED BY STEADY-STATE MAGNETIC FORCES 2671
Fig. 9. Distribution of ���� � in the stator end winding.
Fig. 10. Static deformation caused by � , � , and � . (a) View from the�-direction. (b) View from the �-direction.
of the coil ends, marked by the ellipse, is much larger than theone in the nose portion.
The deformation was dependent on displacement at each ofthe nodal points. Fig. 10 shows the static deformation causedby , , and . It is visible that the end winding isexpanded outward due to the static forces. The deformation ofthe nose portion of the first coil end is stronger than that ofthe nose portion of the other coil ends in a phase belt, and themaximum displacement is . Although the involuteand the knuckle portion experience larger static forces, strongstatic deformation appears at the nose portion, as marked by theellipse in Fig. 10(a).
The dynamic components, , , and , would leadto forced vibrations, which might cause a resonance. The mag-nitude of the dynamic force density at a certain instant wascalculated by
(8)
Fig. 11. Distribution of ���� � in the stator end winding.
Fig. 11 shows the distribution of at the instant when thecurrent of phase A reaches the maximum. The distribution of
rotates in the same direction as the magnetic field. Thoughthe current of phase A reaches the maximum in Fig. 11, rela-tively large dynamic force density does not appear in the phasebelt of phase A. Like the static forces, in the coil ends exceptthe portion close to the core, the involute and the knuckle por-tion experience larger dynamic forces than the nose portion, asmarked by the ellipse.
The corresponding deformation based on the computation ofoperating deflection shapes is illustrated in Fig. 12. Thoughis larger in the involute and the knuckle portion, stronger defor-mation appears at the nose portion, as marked in Fig. 12(a) bythe ellipse with a solid line. The maximum displacement in theforced vibrations is . In addition, the deformationof the nose portion of the coil ends in two successive phase beltsis in the opposite direction at a certain instant, as shown by theellipse with a dash line. In a phase belt, e.g., the one indicatedin Fig. 11, the dynamic deformation at the nose portion of coilends 1–6 is also different. Fig. 13 shows the magnitude of dis-placement of each coil end as a function of solution angle, andit can be seen that the nose portion of the outermost coil ends1 and 6 experiences larger displacement than that of the otherfour coil ends. Due to the rotary distribution of , the defor-mation also rotates in the same -direction. Another importantphenomenon is that the dynamic deformation correlates with themode shape of mode 8 or mode 9 , though the excitationfrequency, 100 Hz, is much lower than the natural frequency ofmode 8 or 9, 315.6 Hz.
C. Real-Time Measurement of Forced Vibrations
During the measurement of forced vibrations, the supplyvoltage varied at a frequency of 50 Hz, and real-time acceler-ation at spots 17–24 marked in Fig. 3 was measured by eighttriaxial piezoelectric accelerometers.
Acceleration at spots 1–16 was not measured since vibrationlevels at those spots were small by comparison with thoseat spots 17–24. By integrating the acceleration twice, corre-sponding displacement was obtained. Only under the dynamicforces did the acceleration exist, so the displacement obtainedcorrelated with the dynamic forces. The components of thedisplacement at spot 20, and the discrete Fourier transform(DFT) of those components based on an algorithm of fastFourier transform, are shown in Fig. 14. In fact, measurementsof the displacement based on 100-Hz components were around
2672 IEEE TRANSACTIONS ON MAGNETICS, VOL. 46, NO. 7, JULY 2010
Fig. 12. Dynamic deformation caused by � , � , and � . (a) View fromthe �-direction. (b) View from the �-direction.
Fig. 13. Calculated magnitude of displacement at the nose portion of each coilend in a phase belt as a function of solution angle.
10%–30% larger than calculations at all the spots, which mightresult from the following two aspects. One is that the end-regionmagnetic field and the end-winding vibrations were interactivebut the interaction was not covered in the calculation by FEM,and the other is that the structure of the end winding was notexactly axisymmetric due to manufacture but the calculationused an exactly axisymmetric model. In addition to the expected100-Hz components, in Fig. 14, notable 50-Hz componentsare found. Actually, 50-Hz components were detected in allthe measured spots, and they had a considerable effect on thetime-domain waveforms.
To find the reason for the 50-Hz components, similar mea-surement was completed, in which the supply voltage varied ata frequency of 25 Hz. Under the circumstances, the sinusoidalcomponents of the forces should vary at a frequency of 50 Hz.After checking the DFT of the components of displacement, no-table 25-Hz components were found in the frequency domain.Therefore, the presence of the 25-Hz and the aforementioned50-Hz components resulted from the measurement. The electro-magnetic sensitivity of the accelerometers was 1.4 , where
denotes the acceleration of gravity. And the electromagneticsensitivity was regarded as the main reason. In addition, there
Fig. 14. Time-domain and frequency-domain analysis of the displacement. (a)The components of the displacement at spot 20 in the time domain. (b) The DFTof the radial displacement. (c) The DFT of the circumferential displacement. (d)The DFT of the axial displacement.
was a 4.7-mA dc current inside the connection wire, and thatit interacted with the time-varying magnetic field caused forceson the wire, which also affected the measurements.
D. Stresses
The von Mises criterion is one of the yield criteria for duc-tile materials [36]. Corresponding von Mises stresses , i.e.,equivalent scalar stresses expressed by principal stresses, werecalculated in the mechanical model by
(9)
where , , and denote principal stresses. Under the staticdeformation, the maximum was 0.096 MPa, and under thedynamic deformation, the maximum was 0.111 MPa. In boththe cases, the maxima appeared in the knuckle portion of thecoil ends. Compared with the yield strength of copper, 69 MPa,the maxima were small.
Metal fatigue, on account of repeated stresses in copper con-ductors of the end winding, was also evaluated. Because themagnetic forces on the end winding were like fluctuating loads,corresponding stresses could be divided into mean stress and
LIN et al.: END-WINDING VIBRATIONS CAUSED BY STEADY-STATE MAGNETIC FORCES 2673
alternating stress. Goodman relationship, accounting for effectsof mean stress on the fatigue life of a material [37], was usedaccording to [38] by
(10)
where “ ” over a symbol means the mean of the field quan-tity symbolized by the symbol, denotes stress, the desiredfatigue strength for zero mean stress, and the tensile stressof a material. In most of the literature, copper was regardedas a metal without an obvious endurance limit [38]. Moreover,different types of copper have different S-N curves also calledWöhler curves, such as annealed copper and stretched copper[39], and their fatigue strength can also be affected by temper-ature and pressure [40]. In this paper, mechanical propertiesof annealed copper were used. and were 75 MPa and220 MPa, respectively. Inside the copper conductors, the max-imum level of calculated mean and alternating stress was in amagnitude of 0.01 MPa, which was much smaller than and
. Therefore, when the mean and the alternating stresses weretaken into (10), their points in the plane of a Goodmandiagram were definitely below the Goodman line.
VI. CONCLUSIONS AND DISCUSSIONS
This paper gives a deeper understanding of end-windingvibrations in a large induction motor. End-winding vibrationscaused by the steady-state magnetic forces and correspondingdeformation are analyzed based on a 3-D electromagneticanalysis coupled with a 3-D mechanical analysis. The analysesare carried out by FEM and both are validated.
The spatial distribution of the static deformation, due to thestatic magnetic forces, is the same in every phase belt, but in aphase belt, different coil ends have different degrees of defor-mation. There is strong static deformation at the nose portion ofthe coil ends, but von Mises stresses in the knuckle portion arelarger. On the other hand, the dynamic magnetic forces causeforced vibrations and further dynamic deformation. The defor-mation is rotary in the circumferential direction. And its spatialdistribution, to some extent, correlates with the mode shape thewave number of which is equal to that of the forces, although theexcitation frequency is much lower than the natural frequencyof that mode. Like the static deformation, the nose portion of thecoil ends experiences stronger deformation, but relatively largevon Mises stresses are found in the knuckle portion. The max-imum von Mises stresses are absolutely small in comparisonwith the yield strength of copper, and the points of the meanand the alternating stresses are far below the Goodman line in aGoodman diagram. As a result, the metal fatigue of the copperconductors is not important.
The mode shapes of the end winding of the induction motorcorrelating with lower natural frequencies are similar to thoseof large turbogenerators. However, the overall levels of the end-winding steady-state vibrations are small, by comparison withthose in large turbogenerators reported in such as [13], [16]. Fur-thermore, effects of the core vibrations on the end-winding vi-brations can be omitted in the induction motor, but those effectsneed to be considered in some large turbogenerators as reportedin [13].
In fact, the end region is the most complex structure in largeinduction machines, and it has to be analyzed in 3-D space. Tostudy the end-region magnetic field and the end-winding vibra-tions, 3-D analyses based on FEM, currently, are the most appro-priate means. However, even if modern computers are powerful,such 3-D analyses are still challenging, and some assumptionsand simplifications are still required. For instance, in the models,the nonlinear magnetization characteristic of the core and thenonlinear mechanical properties are not covered; the complexsupport structures of the end winding are simplified, etc. There-fore, validations, as well as further model updating, are neces-sary for both the electromagnetic and the mechanical model. Itis well known that time-dependent analyses by FEM can givemore accurate results for nonlinear models, but, for models ofthe end region, they are extremely time-consuming and requireplenty of computer resources. Hence, when nonlinearity in theend region is not strong, time-harmonic analyses based on FEMare a relatively fast and accurate method for electromagnetic andmechanical analysis of the end region.
ACKNOWLEDGMENT
This work was supported by Finnish Foundation for Tech-nology Promotion and by Aalto University, Finland. The authorsthank J. Roivainen, T. Holopainen, and J. Järvinen from ABBCorporation in Helsinki, Finland for making some comments onthis paper. The authors also thank ABB Corporation in Finlandfor providing the test electric machine, and VTT Technical Re-search Centre of Finland for providing devices for the vibrationmeasurement.
REFERENCES
[1] J. F. Calvert, “Forces in turbine generator stator windings,” Trans.AIEE, vol. 50, no. 1, pp. 178–194, Mar. 1931.
[2] J. A. Tegopoulos, “Forces on the end winding turbine-generatorsII—Determination of forces,” IEEE Trans. Power App. Syst., vol.PAS-85, no. 2, pp. 114–122, Feb. 1966.
[3] D. J. Scott, S. J. Salon, and G. L. Kusik, “Electromagnetic forces onthe armature end windings of large turbine generators I—Steady stateconditions,” IEEE Trans. Power App. Syst., vol. PAS-100, no. 11, pp.4597–4603, Nov. 1981.
[4] S. J. Salon, D. J. Scott, and G. L. Kusic, “Electromagnetic forces onthe end windings of large turbine generators. II. Transient conditions,”IEEE Trans. Power App. Syst., vol. PAS-102, no. 1, pp. 14–19, Jan.1983.
[5] G. K. M. Khan, G. W. Buckley, and N. Brooks, “Calculation of forcesand stresses on generator end-windings—Part I: Forces,” IEEE Trans.Energy Convers., vol. 4, no. 4, pp. 661–670, Dec. 1989.
[6] X. Wen, R. Yao, and J. A. Tegopoulos, “Calculation of forces onthe stator end windings of turbogenerator by the transient quasi-3Dmethod,” IEEE Trans. Magn., vol. 32, no. 3, pp. 1669–1672, May1996.
[7] A. Merkhouf, B. F. Boueri, and H. Karmaker, “Generator end wind-ings forces and natural frequency analysis,” in Proc. IEEE Int. ElectricMachines and Drives Conf., Jun. 2003, vol. 1, pp. 111–114.
[8] K.-C. Kim, H.-W. Lee, Y.-D. Chun, and J. Lee, “Analysis of electro-magnetic force distribution on end winding for motor reliance,” IEEETrans. Magn., vol. 41, no. 10, pp. 4072–4074, Oct. 2005.
[9] Y. Liu and S. Hjärne, “Analysis of forces on coil ends of formed statorwindings,” in Proc. Int. Conf. Electrical Machines and Systems, Seoul,Korea, Oct. 2007, pp. 1019–1024.
[10] R. Lin and A. Arkkio, “3-D finite element analysis of magnetic forceson stator end-windings of an induction machine,” IEEE Trans. Magn.,vol. 44, no. 11, pp. 4045–4048, Nov. 2008.
[11] R. D. Stancheva and I. I. Iatcheva, “3-D electromagnetic force distribu-tion in the end region of turbogenerator,” IEEE Trans. Magn., vol. 45,no. 3, pp. 1000–1003, Mar. 2009.
2674 IEEE TRANSACTIONS ON MAGNETICS, VOL. 46, NO. 7, JULY 2010
[12] M. Ohtaguro, K. Yagiuchi, and H. Yamaguchi, “Mechanical behaviorof stator endwindings,” IEEE Trans. Power App. Syst., vol. PAS-99, no.3, pp. 1181–1185, May/Jun. 1980.
[13] M. R. Patel and J. M. Butler, “End-winding vibrations in large syn-chronous generators,” IEEE Trans. Power App. Syst., vol. PAS-102, no.5, pp. 1371–1377, May 1983.
[14] A. C. Léger and N. Szylowicz, “Modelling the vibration behaviour ofstator end windings,” in Proc. 8th Int. Conf. Electrical Machines andDrives, Cambridge, U.K., Sep. 1997, pp. 160–164.
[15] J. Zhang, X. Jiang, and Z. You, “Vibration measurement of the gener-ator stator end windings and precautions against insulation wearing,” inProc. Int. Conf. Power System Technology, Beijing, China, Aug. 1998,vol. 2, pp. 1021–1024.
[16] O. Drubel, S. Kulig, and K. Senske, “End winding deformations in dif-ferent turbo generators during 3-phase short circuit and full load oper-ation,” Electr. Eng., vol. 82, no. 3–4, pp. 145–152, Mar. 2000.
[17] E. M. P. van Wyk and A. J. Hoffman, “Detecting long-term trends inturbo-generator stator end-winding vibrations through neural networkmodelling,” J. Sound Vibr., vol. 253, no. 3, pp. 529–544, Jun. 2002.
[18] J. Demcko, J. Velotta, and A. Tesla, “New tools to monitor criticalvibration of end-windings in turbo-generators,” in Proc. IEEE Int.Electric Machines and Drives Conf., Antalya, Turkey, May 2007, pp.1020–1024.
[19] R. Sewak, R. Ranjan, and A. K. L. Rao, “Intricate aspects of turbo-generator endwinding vibration monitoring based on data analysis,” inProc. Int. Conf. Condition Monitoring and Diagnosis, Beijing, China,Apr. 2008, pp. 130–135.
[20] D. Shally, M. Farrell, and K. Sullivan, “Generator end winding vibra-tion monitoring,” in Proc. 43rd Int. Univ. Power Engineering Conf.,Padova, Italy, Sep. 2008, pp. 1–5.
[21] G. Klempner and I. Kerszenbaum, Operation and Maintenance ofLarge Turbo-Generators. Hoboken, NJ: Wiley, 2004.
[22] S. J. Salon, “Finite element analysis of electric machinery,” IEEEComput. Appl. Power, vol. 3, no. 2, pp. 29–32, Apr. 1990.
[23] M. T. Holmberg, “Three-Dimensional Finite Element Computationof Eddy Currents in Synchronous Machines,” Ph.D. dissertation,Chalmers Univ. Technol., Gothenberg, Sweden, Dec. 1998.
[24] W. Tong, “Numerical analysis of flow field in generator end-windingregion,” Int. J. Rotat. Mach., vol. 2008, pp. 1–10, 2008.
[25] D. Ban, D. Zarko, and I. Mandic, “Turbogenerator end-winding leakageinductance calculation using a 3-D analytical approach based on thesolution of Neumann integrals,” IEEE Trans. Energy Convers., vol. 20,no. 1, pp. 98–105, Mar. 2005.
[26] R. Lin and A. Arkkio, “Calculation and analysis of stator end-windingleakage inductance of an induction machine,” IEEE Trans. Magn., vol.45, no. 4, pp. 2009–2014, Apr. 2009.
[27] R. Lin, A. Haavisto, and A. Arkkio, “Validation of a time-harmonic nu-merical model for solving magnetic field in end region of a radial-fluxmachine,” IEEE Trans. Magn., vol. 45, no. 12, pp. 5360–5367, Dec.2009.
[28] S. Somkun, A. J. Moses, and P. I. Anderson, “Effect of magnetostric-tion anisotropy in nonoriented electrical steels on deformation of in-duction motor stator cores,” IEEE Trans. Magn., vol. 45, no. 10, pp.4744–4747, Oct. 2009.
[29] A. Arkkio, “Analysis of Induction Motors Based on the Numerical So-lution of the Magnetic Field and Circuit equations,” Ph.D. dissertation,Helsinki Univ. Technol., Espoo, Finland, Dec. 1987.
[30] P. Alotto, A. De Cian, G. Molinari, and M. Rossi, “Implementationof surface impedance boundary conditions in the cell method via thevector fitting technique,” COMPEL: Int. J. Comput. Math. Elect. Elec-tron. Eng., vol. 26, no. 3, pp. 859–872, 2007.
[31] D. J. Hoppe and Y. Rahmat-Samii, Impedance Boundary Conditionsin Electromagnetics. Washington, DC: Taylor & Francis, 1995.
[32] J. He and Z. Fu, Modal Analysis. Oxford, U.K.: Butterworth-Heine-mann, 2001.
[33] R. J. Allemang, “The modal assurance criterion—Twenty years of useand abuse,” Sound Vibr., vol. 37, no. 8, pp. 14–21, Aug. 2003.
[34] C. K. Mechefske and F. Wang, “Theoretical, numerical, and ex-perimental modal analysis of a single-winding gradient coil insertcylinder,” Magn. Reson. Mater. Phy., vol. 19, no. 3, pp. 152–166, Aug.2006.
[35] D. J. Ewins, Modal Testing: Theory, Practice and Application, 2nded. Hertfordshire, U.K.: Research Studies, 2000.
[36] F. P. Beer, E. R. Johnston, Jr., J. T. DeWolf, and D. F. Mazurek, Me-chanics of Materials, 5th ed. New York: McGraw-Hill, 2009.
[37] R. W. Hertzberg, Deformation and Fracture Mechanics of EngineeringMaterials, 3rd ed. New York: Wiley, 1989.
[38] D. R. Askeland and P. P. Phulé, The Science and Engineering of Ma-terials, 4th ed. Pacific Grove, CA: Brooks/Cole, 2003.
[39] J. Awatani, K. Katagiri, A. Omura, and T. Shiraishi, “A study of thefatigue limit of copper,” Metallurgical Trans. A, vol. 6A, no. 5, pp.1029–1034, May 1975.
[40] V. F. Udovenko, A. I. Alekseev, L. F. Yakovenko, and I. M. Lyubarskii,“Fatigue strength of copper under cyclic loading conditions at low tem-perature and in vacuum,” Metal Sci. Heat Treat., vol. 9, no. 9, pp.697–699, Sep. 1967.
Ranran Lin (S’09) was born in Beijing, China, in 1980. He received the B.Sc.degree in engineering from Shanghai Jiao Tong University, Shanghai, China, in2002, and the M.Sc. degree in technology from Helsinki University of Tech-nology, Espoo, Finland, in 2004.
He is a Research Scientist with the Department of Electrical Engineering,Faculty of Electronics, Communications, and Automation, School of Scienceand Technology, Aalto University, Espoo. His current research interests include3-D numerical analysis of the electromagnetic field and mechanical vibration inthe end region of large rotating electric machines.
Mr. Lin served as Session Chair of 2008 IEEE International Magnetics Con-ference held in Madrid, Spain. He is a Member of International CompumagSociety (ICS). He won the 2009 Chinese Government Award for OutstandingSelf-Financed Students Abroad.
Antti Nestori Laiho was born in Helsinki, Finland, in 1977. He received theM.Sc. (Tech.) degree and the D.Sc. (Tech.) degree from Helsinki University ofTechnology, Espoo, Finland, in 2003 and 2009, respectively.
He is a Research Scientist with VTT Technical Research Centre of Finland,Espoo. His research interests involve electromechanical interactions, structuralanalysis, and active control of vibration.
Ari Haavisto was born in Huittinen, Finland, in 1968. He received the B.Sc. de-gree in electrical engineering from Satakunta University of Applied Sciences,Pori, Finland, in 1994, and the M.Sc. degree in technology from Helsinki Uni-versity of Technology, Espoo, Finland, in 2006.
He is Operations Engineer with the Department of Electrical Engineering,Faculty of Electronics, Communications, and Automation, School of Scienceand Technology, Aalto University, Espoo. His current research interests includethermal modeling of electric machines.
Antero Arkkio was born in Vehkalahti, Finland, in 1955. He received the M.Sc.degree in technology and the D.Sc. degree in technology from Helsinki Univer-sity of Technology, Espoo, Finland, in 1980 and 1988, respectively.
He has been working with various research projects dealing with modeling,design, and measurement of all manner of electric machines. He served firstas Senior Research Scientist, then as Laboratory Manager, and eventually Pro-fessor of electrical engineering at Helsinki University of Technology, Espoo.He is Professor of electrical engineering with the School of Science and Tech-nology, Aalto University, Espoo.