Endogenous Protein “Barcode” for Data Validation andNormalization in Quantitative MS AnalysisWooram Lee and Iulia M. Lazar*
Department of Biological Sciences, Virginia Polytechnic Institute and State University, 1981 Kraft Drive, Blacksburg, Virginia 24061,United States
*S Supporting Information
ABSTRACT: Quantitative proteomic experiments with mass spectrometrydetection are typically conducted by using stable isotope labeling and label-freequantitation approaches. Proteins with housekeeping functions and stableexpression level such actin, tubulin, and glyceraldehyde-3-phosphate dehydrogen-ase are frequently used as endogenous controls. Recent studies have shown that theexpression level of such common housekeeping proteins is, in fact, dependent onvarious factors such as cell type, cell cycle, or disease status and can change inresponse to a biochemical stimulation. The interference of such phenomena can,therefore, substantially compromise their use for data validation, alter theinterpretation of results, and lead to erroneous conclusions. In this work, weadvance the concept of a protein “barcode” for data normalization and validation inquantitative proteomic experiments. The barcode comprises a novel set of proteinsthat was generated from cell cycle experiments performed with MCF7, an estrogenreceptor positive breast cancer cell line, and MCF10A, a nontumorigenicimmortalized breast cell line. The protein set was selected from a list of ∼3700 proteins identified in different cellularsubfractions and cell cycle stages of MCF7/MCF10A cells, based on the stability of spectral count data generated with an LTQion trap mass spectrometer. A total of 11 proteins qualified as endogenous standards for the nuclear and 62 for the cytoplasmicbarcode, respectively. The validation of the protein sets was performed with a complementary SKBR3/Her2+ cell line.
Mass spectrometry (MS) has evolved over the past twodecades into the most powerful tool for the analysis of
proteomic samples. The high resolving power, mass accuracy,and sensitivity provide unsurpassed capabilities for theexploration of complex samples of biological origin. Commonlyused quantitative approaches rely on label-free and stableisotope labeling strategies. A vast range of isotopicallydistinguishable amino acids or tags have been used to modifypeptides metabolically, enzymatically, or chemically to enablethe relative or absolute quantitation of their abundance invarious samples. The use of stable isotope pairs (1H/2H,12C/13C, 14N/15N, 16O/18O) or of their combination has beenincorporated in analysis strategies such as stable isotopelabeling by amino acids in cell culture (SILAC), isobaric tagsfor relative and absolute quantitation (iTRAQ), or metal codedaffinity tags (MCAT), just to name a few.1−4 While label-basedstrategies are generally valued for superior accuracy, the highcosts related to sample preparation, inconsistencies in labelingefficiency, and the limitations in the number of samples that canbe compared simultaneously are drawbacks that advocate theuse of alternative label-free approaches that measure peptideion intensities, the area under the curve, or the tandem MSspectral counts.5,6 Even though the quantitation accuracy isgenerally inferior to that of labeling methods, the lack of alabeling step results in a simplified workflow, reduced costs,
and, most importantly, in no limitations in the number ofsamples that can be compared.To decrease the impact of biological and experimental
variability that can reach multifold values in improperlydesigned experiments, adequate data processing and normal-ization are imperative in differential expression profiling studies.A broad range of statistical approaches, often adapted frommicroarray analysis (global normalization, normalization tomeans or medians, local regression smoothing−LOWESS,normalization to external standard spikes or to housekeepinggenes7), have been tested and applied to the analysis ofproteomic data.7−11 The efficacy of the process is assessable byan as simple and widely used indicator such as the coefficient ofvariation (CV). Unlike external standards that are spiked into asample to assess experimental errors that are associated withvarious stages of an analysis, housekeeping genes or theirproducts (mRNAs and proteins) are used as endogenouscontrols for assessing biological homeostasis. They areconstitutive genes that maintain fundamental cellular functionsand are expressed in all cells at a rather constant level undernormal or altered conditions.12−16 The most common examplesinclude actin, tubulin, and glyceraldehyde-3-phosphate dehy-
Received: February 20, 2014Accepted: May 23, 2014Published: May 23, 2014
drogenase (GAPDH). Actin and tubulin are cytoskeletalproteins that provide mechanical support to cells, andGAPDH is a key enzyme involved in glycolysis. Their utilityas universal standards has been questioned, however, andcareful selection based on the specifics of a given biologicalexperiment and the nature of the sample or tissue to beanalyzed was suggested instead.17,18 For example, 28S rRNAand 18S rRNA were recommended as internal mRNAstandards for studies of rat brain by reverse transcription-polymerase chain reaction (RT-PCR) and of mouse spleen andhuman peripheral blood mononuclear cells by RNaseprotection assays.17 In the study of an amyotrophic lateralsclerosis mouse model, beta-actin and GAPDH mRNA werefound to be suitable housekeeping genes for RT-PCR studies ofthe skeletal muscle and brain, whereas the beta-actin andGAPDH proteins were found suitable for spinal cord and brainstudies by Western blotting.14 Other experiments validatedbeta-actin and heat shock protein 60 at both protein andmRNA levels for the study of human hepatic tissues andhepatocellular carcinoma by Western blot, immunohistochem-istry, and real-time quantitative PCR.18
As the “one-size-fits-all” internal marker does not exist, andwith increasing body of evidence that commonly usedhousekeeping proteins are not universal standards but rathercell line specific,14,16 there is a need for identifying larger sets ofendogenous proteins that could be used with greaterconfidence either as a whole or as a cell-type or disease subset,in the normalization and validation of quantitative proteomicdata. To address this need, the objectives of this study were (i)to devise a strategy that will enable the identification ofendogenous cell line proteins that maintain stable expressionlevel under experimental conditions that induce a majorbiological perturbation, (ii) to identify a set of proteins thatcan be used for the normalization and validation of biologicaldata generated by peptide-based quantitative mass spectrom-etry analysis, and (iii) to assess the stability of proteinexpression levels and validate the proposed protein set withdata generated from a complementary cell line. Relativequantitation of peptides was performed by spectral counting.
■ MATERIALS AND METHODSMaterials. MCF7, SKBR3, and MCF10A cells, EMEM
(Eagle’s Minimum Essential Medium), fetal bovine serum(FBS), phosphate-buffered saline, and cell culture grade waterwere purchased from ATCC (Manassas, VA). Phenol-red freeDMEM (Dulbecco’s Modified Eagle Medium), DMEM/F12,McCoy media, and horse serum were from Invitrogen/LifeTechnologies (Carlsbad, CA), charcoal/dextran treated FBSfrom Hyclone (Logan, UT), and recombinant humanepidermal growth factor (hEGF) from PeproTech (RockyHill, NJ). The Cell Lytic NuCLEAR extraction kit, the bovineprotein standards, and the rest of cell culture and commonreagents were from Sigma (St. Louis, MO). Sequencing-grademodified trypsin was from Promega (Madison, WI). SPEC-PTC18 and SPEC-PTSCX solid-phase extraction tips werepurchased from Varian Inc. (Lake Forest, CA), and HPLC-grade methanol and acetonitrile were purchased from FisherScientific (Fair Lawn, NJ). DI water was generated by a Milli-QUltrapure water system (Millipore, Bedford, MA).Cell Culture and Processing. Cells were cultured at 37 °C
(5% CO2), in EMEM with FBS (10%) and bovine insulin (10μg/mL) for MCF7,19,20 and DMEM−nutrient mixture F12(1:1) with 5% horse serum, 20 ng/mL hEGF, 0.5 μg/mL
hydrocortisone, 0.1 μg/mL cholera toxin and 10 μg/mL bovineinsulin, for MCF10. The cells were arrested in G1 by serumdeprivation for 48 h in DMEM with 4 mM L-glutamine(MCF7) or in DMEM/F12 (MCF10). The cells were releasedinto S by a 24 h stimulation with DMEM, E2 (1 nM), 10%charcoal/dextran-treated FBS, 4 mM L-glutamine, and 10 μg/mL bovine insulin (MCF7) or MCF10 culture medium with10% horse serum (MCF10). Three biological replicates wereprepared for each cell line. SKBR3 cells were cultured inMcCoy medium with 10% FBS. Cell cycle fluorescenceactivated cell sorting (FACS) was conducted on a BeckmanCoulter EPICS XL-MCL analyzer (Brea, CA). Cells wereseparated into nuclear and cytoplasmic fractions by using theCell Lytic NuCLEAR kit. Protein concentrations weremeasured with the Bradford assay (SmartSpec Plus, Bio-Rad,Hercules, CA). The protein extracts were spiked with standardbovine proteins, digested with trypsin (24 h, 37 °C), cleaned upwith C18/SCX cartridges, and reconstituted with CH3CN/H2O/TFA (5:95:0.1) to a final concentration of 2 μg/μL inproteins and 0.2 μM in standards.
LC−MS Analysis. The protein extracts were analyzed withan Agilent 1100 micro-HPLC (Palo Alto, CA) coupled to alinear trap quadrupole (LTQ) mass spectrometer (ThermoElectron, San Jose, CA), using an on-column/no split injectionand a split flow during analysis.19,20 The amount of proteininjected for analysis was 16 μg. The nano-LC separationcolumns were prepared in-house from 100 μm i.d. × 12 cmfused silica capillaries and 5 μm Zorbax SB-C18 particles andoperated at a flow rate that maximized the number of identifiedpeptides (∼160−180 nL/min). Mobile phases A and Bconsisted of H2O−CH3CN−TFA in 95:5:0.01 and 20:80:0.01v/v ratios, and the gradient (0−100% B) was 3 h long.19,20
Tandem MS data were acquired by using a data-dependentstrategy, by performing Zoom/MS2 scans on the 5 most intensepeaks in each MS scan. Five microscans were averaged for theMS and the zoom scans, the zoom scan width was ±5 m/z,dynamic exclusion was enabled at repeat count 1, repeatduration 30 s, exclusion duration 60 s, and exclusion masswidth ±1.5 m/z. Collision induced dissociation (CID)parameters were set at isolation width 3 m/z, normalizedcollision energy 35%, activation Q 0.25, and activation time 30ms. Five LC−MS/MS technical and three biological replicateswere performed for each cell state. Raw data were searchedagainst a SwissProt Homo sapiens database with the Bioworks3.1 software by allowing for only fully tryptic fragments, twomissed cleavages, peptide/fragment ion tolerances of 2 amu/1amu, respectively, and no post-translational modifications.Peptides were filtered with the Xcorr vs charge state filter(1.9, 2.2, 3.8) and proteins with the p-score (<0.001) topreserve the false discovery rates (FDR) at <3% at the proteinand <1% at the peptide levels, respectively. FDRs were assessedwith a forward−reversed sequence database. Only proteinsmatched by ≥4 spectral counts and multiple unique peptides(minimum 3) were considered in the study. STRINGparameters were set to medium/high, less than 10 interactors,network depth 1.
■ RESULTS AND DISCUSSIONRequirements for Ideal Proteins Suitable for Data
Validation and Normalization. To achieve accuratequantitation, a broad range of genes and gene products havebeen explored for data normalization and validation (Supple-mental Table 1 in the Supporting Information). Housekeeping
mRNAs are typically used in RT-PCR, qPCR, and RNaseprotection assays, while protein products are used in 2D gelelectrophoresis, Western blot, and mass spectrometry experi-ments. Protein quantitation in a biological sample is typicallyperformed at the intact protein level and involves a variety ofstrategies that rely on staining, fluorescent/radioactive labeling,and the specificity of protein−protein affinity interactions.When using MS detection, however, protein identification andquantitation is performed most often at the peptide level. Asonly a subset of peptides that match a protein is detected, andas supporting information such as MW, pI-value, or protein−protein interaction specificity may be not available, a number ofadditional criteria should be considered when selecting aprotein for data normalization/validation. The life of a proteinis initiated by an extra- or intracellular signal that induces DNAtranscription and translation. Proteins are then synthesized inthe ribosomes/endoplasmic reticulum (ER) and delivered tospecific locations in the cell such as the nucleus, mitochondria,Golgi apparatus, or cell membrane. Such proteins can besubjected to further processes that result in subcellularrelocation, ubiquitination and degradation, modifications byPTMs to fulfill certain biological functions, or secretion in theextracellular environment (Figure 1).
To qualify as internal standards, ideally, cellular proteinsshould satisfy a number of requirements. (a) The expressionlevel of these proteins should remain constant irrespective ofthe biological perturbation that is performed in the study (e.g.,gene knockouts, cell transfections, cell stimulations, etc.).(b) The cellular location should be in accordance with the
protein function and in line with data provided by classicalstudies. The processes that control protein localization andtranslocation are tightly regulated, proper spatiotemporalprotein localization, as part of tissue-specific interactionnetworks, being an important factor for regulating function ina particular physiological context.12−14
(c) The proteins or peptides that are used for normalizationshould be free of PTMs. Hundreds of PTMs are known, themost common ones including phosphorylation, acetylation,ubiquitination, glycosylation, methylation, and oxidation.21
Protein PTMs have the important role of determining proteinfunction, location, and fate and can change status as a result of a
biological perturbation. Unfortunately, the great majority ofproteins, including the housekeeping ones, carry multiplePTMs that affect multiple amino acids, rendering the selectionof PTM-free peptides difficult. The impact of PTMs on thedetection of these proteins can be substantial. For example,GAPDH is primarily located in the cytoplasm but cantranslocate to the nucleus following S-nitrosylation on Cys-152 and interaction with SIAH2.22 Moreover, PTMs on epitopesites may hinder antigen−antibody interactions and affect theresults of Western blot analysis used for data validation, furthercontributing to the misinterpretation of the data. A sequencealignment of alpha/beta-tubulin and actin isoforms, GAPDH,and several other proteins is provided in Supplemental Table 2in the Supporting Information. Highlighted in the table are thematching peptides identified in this data set and thephosphorylation, acetylation, and ubiquitination sites confirmedby five or more references, according to the present state ofknowledge reflected in the PhosphoSite database.21
(d) Proteins that generate a reasonable number of uniquepeptides after proteolytic digestion, rather than shared peptideswith other protein isoforms, are preferred.14−17 This processcauses a so-called “protein inference problem,” as afterproteolytic digestion the connectivity between proteins andpeptides is lost.15 If due to sequence homology a peptide can bematched to more than one protein in the database, the actualparent protein cannot be specified with certainty. Such apeptide is called shared, nonunique, or degenerate. Forexample, the protein sequence alignment of 6 actin, 8 alphatubulin, and 9 beta tubulin isoforms indicates 92.1%, 65.9%,and 69.4% sequence homology, respectively (SupplementalTable 3 in the Supporting Information). To remove thisambiguity, some simple approaches would be to ignore theshared peptide from the data set16 or to distribute the count ofthe shared peptide among the parent proteins in proportion tothe total spectral counts associated with each contributingparent.17 Both approaches can be implemented, however, onlyif there exist several other unique peptides that could be used toconfidently identify the parent protein of interest. Given,however, that in most large-scale MS experiments the majorityof proteins are identified by only very few peptides, suchapproaches do not have practical utility, not even forhousekeeping proteins such as actin and tubulin (note inSupplemental Table 2 in the Supporting Information that mostmatching peptides are common to all protein isoforms andcannot uniquely identify the protein). Nevertheless, taking intoaccount that many protein isoforms perform identical or similarfunctions, the shared peptide problem could be addressed byconsidering the set of isoforms as a whole set and using forcomparison the sum of all peptide contributions to this set.(e) The detection of proteins chosen for normalization
should be reproducible and within the linear dynamic range ofthe analysis method and/or detector response. The spectralcount for a protein is proportional to the protein abundance, itslength, and its number of detectable (proteotypic) peptides. Athigh concentrations levels (>20−50 spectral counts per protein,estimated based on the concentration of high-abundanceproteins in a cell) when all proteotypic peptides are detectedand/or the width of the chromatographic peak does not changeany longer proportionally with concentration, the change inspectral counts may not reflect an accurate change in proteinexpression. In contrast, at low concentration levels (1−2 countsper protein), there is a better proportionality between spectralcounts and abundance but the variability of spectral count data
is too high and can lead to a biased interpretation of results.The detection of low intensity peptides is also suppressed bythe presence of highly abundant ions. In addition, the numberof spectral counts is affected by the parameters set for the data-dependent acquisition (DDA) process and the LC gradient. Tomaximize the number of detected peptides during LC−MS/MSanalysis, ideally, the MS analyzer should continuously generatenew tandem mass spectra for new peptides. For detecting lowintensity peptides, the intense ones for which tandem MS wasperformed first are sent to an exclusion list for a stipulated timeduring DDA. This is the so-called exclusion time, which shouldbe long enough to avoid the generation of a second tandem MSon the same peptide but short enough to avoid the exclusionfrom analysis of other peptides with roughly the same LCretention time and close m/z to the peptide on the exclusionlist (i.e., usually with m/z within a range of m/zexcluded_peptide ±1.5 Da). As abundant peptides may produce a broad peakduring a long LC gradient, inevitably, some peptides will accrueseveral tandem mass spectra during analysis. Alternatively,peptides with narrow peak widths will be easily missed duringDDA. For example, in our studies, for a 3 h long LC gradient,narrow peaks were <5 s, while broad peaks were 3−4 min wide.As the great majority of LC peaks were <1 min in width, theexclusion time was set at 60 s. The result was that during anyone LC−MS/MS analysis: (a) the majority of peptides weredetected by only one tandem mass spectrum; (b) the spectralcounts for a protein increased proportionally with abundancethrough the number of unique, detectable peptides; and (c) anincrease in chromatographic peak width contributed to anincrease in spectral counts by increasing the likelihood of apeptide to be detected if the peak width was <1 min or byadditional spectral counts if the peak width was >1 min (thiscan be viewed as a spectral count “bonus” for very broadpeaks). There is always the option to count only uniquepeptides, but regardless, DDA will contribute to an increase inthe variability of peptide detection and will often introducesome peptide-specific bias in the detection of broader peaks. Byproperly optimizing the parameters for DDA analysis and by
performing multiple LC−MS/MS replicates, however, thevariability in spectral count data can be decreased and theconfidence in the trends displayed by spectral count analysisincreased.
Approach for Generating and Analyzing PerturbedCell States. To generate a representative set of proteins thatpreserve stable expression level over a broad range of biologicalconditions, MCF7 and MCF10A cells were cultured inappropriate growth media, arrested in the cell cycle by serumdeprivation, and released with medium containing hormones orgrowth factors, respectively. The percent of G1:S:G2/M cells inthe different stages of MCF7 cell cycle was 80:10:7 in G1arrested cells and 30:60:10 in S released cells (CV = 2−12%),representing a ∼16-fold change in G1-to-S cells. In MCF10, thepercentages were 90:6:5 in G1 and 57:33:11 in S. The cellextracts were separated into nuclear and cytoplasmic fractions.This process generated two complementary cell fractions(nuclear and cytoplasmic), in two complementary stages ofthe cell cycle (nonproliferating G1 and proliferating S), fromtwo functionally distinct cell lines (cancerous and non-tumorigenic). Three biological replicates were processed toenable the evaluation of statistical significance, and five LC−MStechnical replicates were performed for each cell fraction toincrease the number of counts and the confidence in thespectral count data. This experimental approach resulted in theidentification of a total of 3 700 proteins and 800−1000proteins per LC−MS run, matched by 4000−4200 spectralcounts. Multiple tandem mass spectra per peptide wereallowed, the five technical replicates were averaged, and thedata were normalized based on a grand average (∼4000)calculated from the total spectral counts corresponding to the12 nuclear and 12 cytoplasmic fractions, respectively (2 celllines × 2 cell cycle stages × 3 biological replicates).
Proposed Protein Set for Normalization and Vali-dation of Spectral Count Data. Using identical dataacquisition and processing conditions, the MS analysis of thesame amount of a proteolytic digest will generate roughly thesame number of total spectral counts. The total count for such
Figure 2. Protein barcodes illustrating the spectral count distributions of the (A) nuclear and (B) cytoplasmic protein sets in the 12 cell states ofMCF7/MCF10 cells. The far right barcodes represent the average counts in MCF7/MCF10 with global normalization (gn), the average counts inthe SKBR3 validation set with global normalization (gn), and with normalization to housekeeping proteins (hpn).
a sample can be used to perform global normalization of rawdata sets to reduce the impact of systematic errors, if their levelis small, generally <10%.5,20 Under the underlying hypothesisthat the expression level of ideal endogenous proteins suitablefor normalization will not change in response to a majorbiological perturbation such as a change in cell cycle stage or atransition from a noncancerous to a cancerous cell state,proteins that exhibit the smallest variations in their spectralcount values are expected to represent the best candidates forvalidation of differential expression data. Such proteins can alsobe used for data normalization to housekeeping proteins, as analternative to global normalization. To identify such proteins inthe list of 3700, the nuclear and cytoplasmic fractions weresorted based on the spectral count CV values calculated foreach protein across the 12 nuclear or cytoplasmic fractions,respectively, and selection occurred according to the followingcriteria: (a) The average number of matching spectral counts inthe 12 cell states had to be ≥4 to avoid variability concerns atthe low-end of the spectral count range and ≤50 to avoidsaturation effects at the high-end of the range; proteins withmuch larger spectral counts did not qualify, in fact, forselection, except PRKDC (DNA-dependent protein kinase) inthe nuclear fraction and KPYM (pyruvate kinase isozymes M1/M2) in the cytoplasmic fraction. (b) The reproducibility of
protein identifications in a particular nuclear or cytoplasmicfraction had to be reflected by a CV value of ≤30%. (c) Theproteins had to have preponderantly nuclear or cytoplasmiclocalization, with minimal translocation tendency in response toendogenous cell stimuli. Figure 2 illustrates through stackedcolumn charts the average spectral count contributions of a setof 11 nuclear and 62 cytoplasmic proteins that met thesecriteria. The condition of selecting only PTM-free peptidescould not be met, due to the consistent distribution of variousPTMs along the entire length of these proteins (select proteinsare shown in Supplemental Table 2 in the SupportingInformation). The 12 left-most columns represent the G1and S cell cycle stages of MCF7 and MCF10 cells, followed bya column representing their normalized average. The stableprotein counts in the chart, as well as their sum, create,essentially, a “barcode” characteristic to the nuclear orcytoplasmic fraction, respectively. The order of proteins inthe barcode, from bottom to top, follows the order provided inTable 1, i.e., from small (∼10−12%) to high (∼27−30%) CVs.In addition, Supplemental Table 4 in the SupportingInformation provides the cellular location and the commonPTMs associated with these proteins. In comparison, across the24 protein data sets, the standard protein spikes were matchedby 4−20 spectral counts with typical CV values of <20% and
Table 1. Proposed Protein Set for Data Normalization/Validation
CV extremes in the 30−40% range (Supplemental Table 5 inthe Supporting Information).20
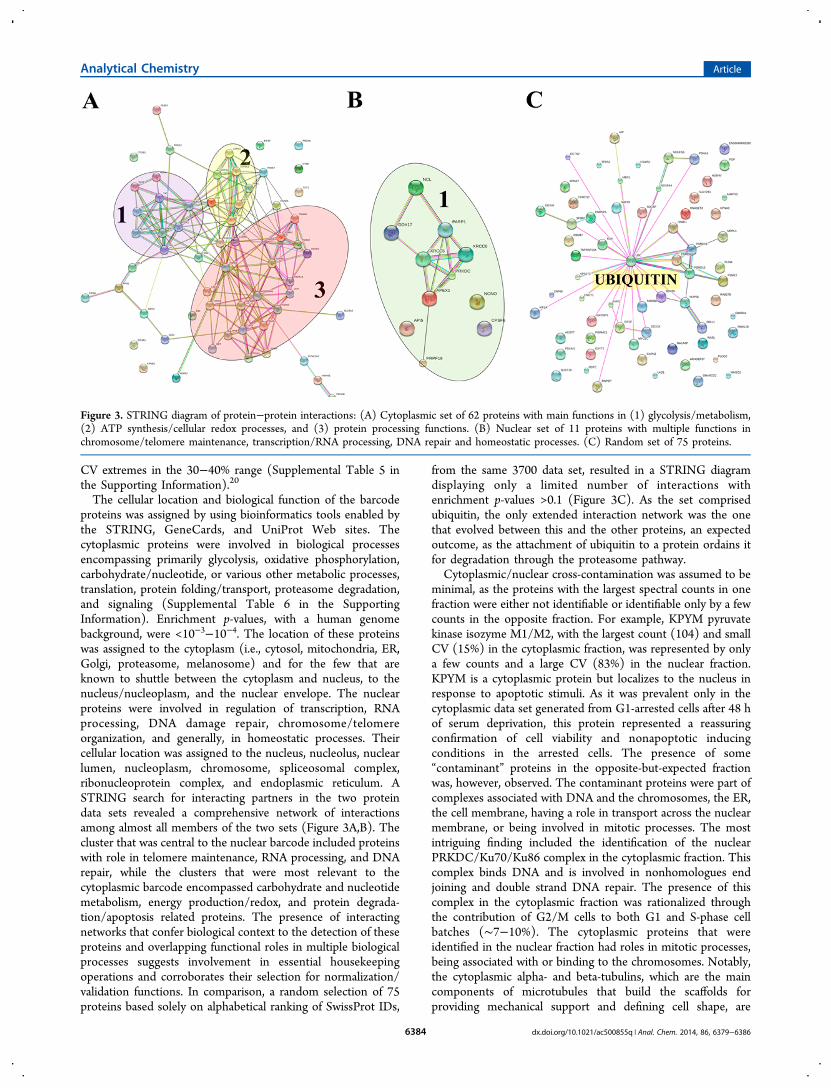
The cellular location and biological function of the barcodeproteins was assigned by using bioinformatics tools enabled bythe STRING, GeneCards, and UniProt Web sites. Thecytoplasmic proteins were involved in biological processesencompassing primarily glycolysis, oxidative phosphorylation,carbohydrate/nucleotide, or various other metabolic processes,translation, protein folding/transport, proteasome degradation,and signaling (Supplemental Table 6 in the SupportingInformation). Enrichment p-values, with a human genomebackground, were <10−3−10−4. The location of these proteinswas assigned to the cytoplasm (i.e., cytosol, mitochondria, ER,Golgi, proteasome, melanosome) and for the few that areknown to shuttle between the cytoplasm and nucleus, to thenucleus/nucleoplasm, and the nuclear envelope. The nuclearproteins were involved in regulation of transcription, RNAprocessing, DNA damage repair, chromosome/telomereorganization, and generally, in homeostatic processes. Theircellular location was assigned to the nucleus, nucleolus, nuclearlumen, nucleoplasm, chromosome, spliceosomal complex,ribonucleoprotein complex, and endoplasmic reticulum. ASTRING search for interacting partners in the two proteindata sets revealed a comprehensive network of interactionsamong almost all members of the two sets (Figure 3A,B). Thecluster that was central to the nuclear barcode included proteinswith role in telomere maintenance, RNA processing, and DNArepair, while the clusters that were most relevant to thecytoplasmic barcode encompassed carbohydrate and nucleotidemetabolism, energy production/redox, and protein degrada-tion/apoptosis related proteins. The presence of interactingnetworks that confer biological context to the detection of theseproteins and overlapping functional roles in multiple biologicalprocesses suggests involvement in essential housekeepingoperations and corroborates their selection for normalization/validation functions. In comparison, a random selection of 75proteins based solely on alphabetical ranking of SwissProt IDs,
from the same 3700 data set, resulted in a STRING diagramdisplaying only a limited number of interactions withenrichment p-values >0.1 (Figure 3C). As the set comprisedubiquitin, the only extended interaction network was the onethat evolved between this and the other proteins, an expectedoutcome, as the attachment of ubiquitin to a protein ordains itfor degradation through the proteasome pathway.Cytoplasmic/nuclear cross-contamination was assumed to be
minimal, as the proteins with the largest spectral counts in onefraction were either not identifiable or identifiable only by a fewcounts in the opposite fraction. For example, KPYM pyruvatekinase isozyme M1/M2, with the largest count (104) and smallCV (15%) in the cytoplasmic fraction, was represented by onlya few counts and a large CV (83%) in the nuclear fraction.KPYM is a cytoplasmic protein but localizes to the nucleus inresponse to apoptotic stimuli. As it was prevalent only in thecytoplasmic data set generated from G1-arrested cells after 48 hof serum deprivation, this protein represented a reassuringconfirmation of cell viability and nonapoptotic inducingconditions in the arrested cells. The presence of some“contaminant” proteins in the opposite-but-expected fractionwas, however, observed. The contaminant proteins were part ofcomplexes associated with DNA and the chromosomes, the ER,the cell membrane, having a role in transport across the nuclearmembrane, or being involved in mitotic processes. The mostintriguing finding included the identification of the nuclearPRKDC/Ku70/Ku86 complex in the cytoplasmic fraction. Thiscomplex binds DNA and is involved in nonhomologues endjoining and double strand DNA repair. The presence of thiscomplex in the cytoplasmic fraction was rationalized throughthe contribution of G2/M cells to both G1 and S-phase cellbatches (∼7−10%). The cytoplasmic proteins that wereidentified in the nuclear fraction had roles in mitotic processes,being associated with or binding to the chromosomes. Notably,the cytoplasmic alpha- and beta-tubulins, which are the maincomponents of microtubules that build the scaffolds forproviding mechanical support and defining cell shape, are
Figure 3. STRING diagram of protein−protein interactions: (A) Cytoplasmic set of 62 proteins with main functions in (1) glycolysis/metabolism,(2) ATP synthesis/cellular redox processes, and (3) protein processing functions. (B) Nuclear set of 11 proteins with multiple functions inchromosome/telomere maintenance, transcription/RNA processing, DNA repair and homeostatic processes. (C) Random set of 75 proteins.
also the major components of the mitotic spindle apparatusthat segregates chromosomes during mitosis. The microtubuleorganizing centers that anchor the microtubules are the mitoticspindle poles and centrosomes that can be found adjacent tothe nucleus. Actin, another cytoskeletal protein, can be localizedin the cytoplasmic mRNP granules, and its presence inmonomeric actin form in the nucleus is documented.23
Assessment of the Protein Barcodes. The proposed listis expected to find broad utility for the validation of MSquantitation data, as a control set for assessing (i) the accuracyof sample loading, (ii) the effectiveness of global normalizationbased on total spectral counts (or other methods ofnormalization), and (iii) the dependability of differentialexpression under the impact of biological variability associatedwith a given experiment. The spectral count CVs associatedwith the cytoplasmic and nuclear sets (<30%) were less orequal to the CVs associated with the standard protein spikes,denoting that the abundance of the proposed proteins wasconstant, and that biological variability did not exceedsignificantly the levels of experimental variability (SupplementalTables 4 and 5 in the Supporting Information).Validation of the barcode proteins was performed with
SKBR3 cells with various cell cycle distributions, i.e., G1:S:G2/M (62−72%):(18−27%):(10−16%). The MCF7, MCF10, andSKBR3 experiments were each conducted 2 years apart, usingcompletely different reagent batches and analytical supplies.The average spectral counts for SKBR3 are provided in the fifthcolumn of Table 1, the Pearson correlation coefficient betweenthe MCF7/MCF10 and SKBR3 counts being 0.95−0.96.Statistical evaluation of the data was carried out by performinga two-tailed/unpaired student t test on the log2 ratios of theSKBR3 and reference sets.20 The log2 ratios and the associatedp-values are provided in the last two columns of Table 1. Onthe basis of the stability of spectral counts pertaining to proteinspikes, the count fold-change for qualifying a protein asdifferentially expressed between a test and control experimentwas set to a minimum value of 2, i.e., average log2(test/control)≥1 or ≤(−1).20 According to the same criteria, then, thehousekeeping proteins that do not change expression shouldpreserve the count levels such that (−)1 < log2[SKBR3/MCF]< 1. As noted, this was the case for the majority of proteins,which, despite multiple functional roles, exhibited spectralcounts within the variability limits encountered in MCF7 andMCF10. These were the housekeeping proteins known to havelittle relocation tendency. Actin and tubulin were also “well-behaved.” While a clear correlation between the stability of thespectral counts and the presence of PTMs was not evident, ashighlighted for select proteins in Supplemental Table 2 in theSupporting Information, the PTM-free beta-tubulin peptidesappeared to represent a more dependable choice for validationthan alpha-tubulin or actin. As anticipated, however, thedetection reproducibility of proteins known to shuttle betweenvarious cytoplasmic (cytosol, mitochondrion, melanosome, ER,proteasome) or nuclear organelles, or proteins represented by asmall number of spectral counts, was less than that of thecytosolic proteins. This was the case of seven proteins in theSKBR3 cytoplasmic set which passed the 2-fold threshold inchanging spectral counts. With p-values <0.01, these proteinswould have been selected as differentially expressed (shadedentries in Table 1). Interestingly, the most extreme change wasobserved for the commonly used GAPDH (fold-change inspectral counts >3), challenging its broad utilization forvalidation of biological quantitative data. While the biological
source of this large variation requires further investigation, theobservation confirms previous results that revealed thatGAPDH gene expression is dependent on estrogen stimulationand that this protein should not be used as a control incancerous cell states.24 Another protein that displayed a largechange in spectral counts was fructose-bisphosphate aldolase A(>2-fold). Both GAPDH and aldolase A are involved in glucosemetabolism. Aldolase A is a glycolytic enzyme that catalyzes thereversible conversion of fructose-1,6-bisphosphate to glycer-aldehyde-3-phosphate and dihydroxyacetone phosphate, whileGAPDH catalyzes the reversible oxidative phosphorylation ofthe same glyceraldehyde-3-phosphate to 1,3-biphosphoglycer-ate. Therefore, their concomitant change is not an unexpectedoutcome, a result that confirms that the evaluation andselection of proteins for normalization/validation should notbe performed in an isolated fashion but in the context ofbiological functional networks. On the other hand, the SKBR3nuclear protein set performed remarkably well, with mostproteins displaying spectral counts within the ±30% variabilitylimit of the reference set. The selected DNA damage repairproteins exhibited stable levels despite the different mecha-nisms that promote aberrant proliferation in Her2+ vs ER+cells. As also noted in Figure 2, the distribution of proteincounts in the normalized SKBR3 barcodes matched closely theMCF7/MCF10 reference barcodes (note the barcodes markedwith an arrow). Taking into account the sum of SKBR3 counts,for the nuclear set, both global normalization (gn) andnormalization to the reference housekeeping proteins (hpn)generated similar results. For the cytoplasmic set, normalizationto housekeeping proteins performed better than globalnormalization, denoting that other factors than a systematicerror contributed to the variability of the counts. Nonetheless, ifthe same 2-fold threshold is maintained, the results confirm theapplicability of the proposed set for the validation of MSspectral count data. By summing the spectral counts for aparticular category of proteins, e.g., all tubulin or actin isoforms,a further reduction of CV values can be achieved(Supplemental Table 4 in the Supporting Information).Furthermore, by expanding the summing process to the entireset of proteins, individual CV values of 10−30% can be reducedto 4−5%. Alternatively, if cytoplasmic/nuclear fractionation isnot performed, as often the case, protein relocation will notconstitute a problem any longer and the reproducibility of thespectral counts is expected to exhibit additional improvement.Given, however, the multitude of biological processes that makeuse of these proteins and control cellular location ordegradation, indiscriminate use of the control sets, withoutpreliminary assessment of suitability for a particular experiment,should be avoided. Our previous studies have identified, forexample, a large set of proteins involved in DNA damagerepair.20 These proteins play an essential role in maintaininggenome integrity, some members being more active inparticular cell cycle stages, while others exercising their functionin all stages of the cell cycle. The cluster that emerged in thiswork encompassed PRKDC, XRCC5 (KU80), XRCC6(KU70), PARP1, and APEX1. These proteins are involved innonhomologous end-joining/double strand break repair, amechanism that is prevalent in G1, or base excision repair, amechanism that is active throughout all cell cycle stages.Despite stable counts in the present experiments, theassociation between cancer development and the failure ofcertain DNA repair mechanisms suggests exercising prudencewhen selecting such DNA repair proteins as a control set.
■ CONCLUSIONSIn this work, a novel set of nuclear and cytoplasmic proteinswas assembled into a barcode that can be used for thenormalization and validation of label-free spectral count data.The protein set exhibited a stable expression level in the nuclearand cytoplasmic cell fractions despite major biologicalperturbations induced by a change from a cancerous (MCF7)to a noncancerous (MCF10) cell state or a change from onecell cycle stage (G1) to another (S). As the protein setcomprises a large number of functionally relevant proteins withvarious concentrations and molecular weights, a more reliableassessment, and over a broader dynamic range, can beperformed than with actin, tubulin or GAPDH alone. Furtherdata analysis uncovered that these proteins are not isolatedparticipants in various biological processes but are part ofinteracting networks which perform essential biologicalfunctions such as DNA/mRNA and carbohydrate metabolism,cellular redox, protein processing and degradation, signaling,and even DNA damage repair. Experiments aimed at validatingthe protein set in SKBR3 cells demonstrated that >90% of theproposed proteins preserved the counts within the limitsnecessary for distinguishing the differentially expressed proteinsat a 2-fold change threshold in spectral count values. Thetendency of a protein to conserve its cellular location, and theavailability of a sufficient number of counts, improved thereproducibility of the measurements. The data also revealedthat the commonly used GAPDH cannot be used for validationexperiments that involve cancerous cell states. While theproposed protein barcode presents particular value to thedevelopment of improved label-free quantitation strategies incell cycle experiments, we anticipate that further refinement ofthe concept will support the advance of novel disease-, tissue-,or experiment-specific barcodes for a variety of discoveryapplications.
■ ASSOCIATED CONTENT*S Supporting InformationThis material is available free of charge via the Internet athttp://pubs.acs.org.
■ ACKNOWLEDGMENTSThis work was supported in part by Grant NSF/DBI-1255991to I.M.L.
■ REFERENCES(1) Ong, S. E.; Blagoev, B.; Kratchmarova, I.; Kristensen, D. B.;Steen, H.; Pandey, A.; Mann, M. Mol. Cell. Proteomics 2002, 1 (5),376−386.(2) Yao, X.; Freas, A.; Ramirez, J.; Demirev, P. A.; Fenselau, C. Anal.Chem. 2001, 73 (13), 2836−2842.(3) Ross, P. L.; Huang, Y. N.; Marchese, J. N.; Williamson, B.; Parker,K.; Hattan, S.; Khainovski, N.; Pillai, S.; Dey, S.; Daniels, S.;Purkayastha, S.; Juhasz, P.; Martin, S.; Bartlet-Jones, M.; He, F.;Jacobson, A.; Pappin, D. J. Mol. Cell. Proteomics 2004, 3 (12), 1154−1169.(4) Cagney, G.; Emili, A. Nat. Biotechnol. 2002, 20 (2), 163−170.
(5) Old, W. M.; Meyer-Arendt, K.; Aveline-Wolf, L.; Pierce, K. G.;Mendoza, A.; Sevinsky, J. R.; Resing, K. A.; Ahn, N. G. Mol. Cell.Proteomics 2005, 4 (10), 1487−1502.(6) Neilson, K. A.; Ali, N. A.; Muralidharan, S.; Mirzaei, M.; Mariani,M.; Assadourian, G.; Lee, A.; van Sluyter, S. C.; Haynes, P. A.Proteomics 2011, 11 (4), 535−553.(7) Podwojski, K.; Eisenacher, M.; Kohl, M.; Turewicz, M.; Meyer,H. E.; Rahnenfuhrer, J.; Stephan, C. Expert Rev. Proteomics 2010, 7 (2),249−261.(8) Cairns, D. A.; Thompson, D.; Perkins, D. N.; Stanley, A. J.; Selby,P. J.; Banks, R. E. Proteomics 2008, 8 (1), 21−27.(9) Webb-Robertson, B. J.; Matzke, M. M.; Jacobs, J. M.; Pounds, J.G.; Waters, K. M. Proteomics 2011, 11 (24), 4736−4741.(10) Kultima, K.; Nilsson, A.; Scholz, B.; Rossbach, U. L.; Falth, M.;Andren, P. E. Mol. Cell. Proteomics 2009, 8 (10), 2285−2295.(11) Andreev, V. P.; Petyuk, V. A.; Brewer, H. M.; Karpievitch, Y. V.;Xie, F.; Clarke, J.; Camp, D.; Smith, R. D.; Lieberman, A. P.; Albin, R.L.; Nawaz, Z.; El Hokayem, J.; Myers, A. J. J. Proteome Res. 2012, 11(6), 3053−3067.(12) Ferguson, R. E.; Carroll, H. P.; Harris, A.; Maher, E. R.; Selby, P.J.; Banks, R. E. Proteomics 2005, 5 (2), 566−571.(13) Thellin, O.; Zorzi, W.; Lakaye, B.; De Borman, B.; Coumans, B.;Hennen, G.; Grisar, T.; Igout, A.; Heinen, E. J. Biotechnol. 1999, 75(2−3), 291−295.(14) Calvo, A. C.; Moreno-Igoa, M.; Manzano, R.; Ordovas, L.;Yague, G.; Olivan, S.; Munoz, M. J.; Zaragoza, P.; Osta, R. Proteomics2008, 8 (20), 4338−4343.(15) Pailleux, F.; Beaudry, F. Biomed. Chromatogr. 2012, 26 (8),881−891.(16) Sheng, W. Y.; Wang, T. C. PLoS One 2009, 4 (7), e6322.(17) Yamada, H.; Chen, D.; Monstein, H. J.; Hakanson, R. Biochem.Biophys. Res. Commun. 1997, 231 (3), 835−838.(18) Sun, S.; Yi, X.; Poon, R. T.; Yeung, C.; Day, P. J.; Luk, J. M.BMC Cancer 2009, 9, 309.(19) Sarvaiya, H. A.; Yoon, J. H.; Lazar, I. M. Rapid Commun. MassSpectrom. 2006, 20 (20), 3039−3055.(20) Tenga, M. J.; Lazar, I. M. Proteomics 2013, 13 (1), 48−60.(21) Hornbeck, P. V.; Chabra, I.; Kornhauser, J. M.; Skrzypek, E.;Zhang, B. Proteomics 2004, 4 (6), 1551−1561.(22) Rebhan, M.; Chalifa-Caspi, V.; Prilusky, J.; Lancet, D. TrendsGenet. 1997, 13 (4), 163.(23) Baarlink, C.; Wang, H.; Grosse, R. Science 2013, 340 (6134),864−867.(24) Revillion, F.; Pawlowski, V.; Hornez, L.; Peyrat, J. P. Eur. J.Cancer 2000, 36 (8), 1038−1042.