Energetic, spatial, and momentum character of the electronic structure at a buried interface:The two-dimensional electron gas between two metal oxides
S. Nemsak,1,2,* G. Conti,1,2 A. X. Gray,1,2,3,† G. K. Palsson,1,2,‡ C. Conlon,1,2 D. Eiteneer,1,2 A. Keqi,1,2 A. Rattanachata,1,2
A. Y. Saw,1,2 A. Bostwick,2 L. Moreschini,2 E. Rotenberg,2 V. N. Strocov,4 M. Kobayashi,4 T. Schmitt,4 W. Stolte,2,§ S. Ueda,5
K. Kobayashi,5,‖ A. Gloskovskii,6 W. Drube,6 C. A. Jackson,7,¶ P. Moetakef,7,** A. Janotti,7,†† L. Bjaalie,7 B. Himmetoglu,7
C. G. Van de Walle,7 S. Borek,8 J. Minar,8,9 J. Braun,8 H. Ebert,8 L. Plucinski,10 J. B. Kortright,2 C. M. Schneider,10
L. Balents,11 F. M. F. de Groot,12 S. Stemmer,6 and C. S. Fadley1,2
1Department of Physics, University of California, 1 Shields Avenue, Davis, California 95616, USA2Materials Sciences Division, Lawrence Berkeley National Laboratory, 1 Cyclotron Road, Berkeley, California 94720, USA
3Stanford Institute for Materials and Energy Science, Stanford University and Stanford Linear Accelerator Center National AcceleratorLaboratory, 2575 Sand Hill Road, Menlo Park, California 94029, USA
4Swiss Light Source, Paul Scherrer Institute, Villigen, Switzerland5Synchrotron X-ray Station at Spring-8, National Institute for Materials Science, Hyogo 679-5148, Japan
6Deutsches Elektronen-Synchrotron, 22607 Hamburg, Germany7Materials Department, University of California, Santa Barbara, California 93106, USA
8Physical Chemistry Institute, Ludwig-Maximilian University, Munich, Germany9New Technologies-Research Center, University of West Bohemia, 306 14 Plzen, Czech Republic
10Peter-Grunberg-Institut PGI-6, Forschungszentrum Julich, 52425 Julich, Germany11Department of Physics, University of California, Santa Barbara, California 93106, USA
12Inorganic Chemistry and Catalysis, Utrecht University, 3584 CG Utrecht, Netherlands(Received 7 August 2015; published 1 June 2016)
The interfaces between two condensed phases often exhibit emergent physical properties that can lead tonew physics and novel device applications and are the subject of intense study in many disciplines. We hereapply experimental and theoretical techniques to the characterization of one such interesting interface system: thetwo-dimensional electron gas (2DEG) formed in multilayers consisting of SrTiO3 (STO) and GdTiO3 (GTO). Thissystem has been the subject of multiple studies recently and shown to exhibit very high carrier charge densitiesand ferromagnetic effects, among other intriguing properties. We have studied a 2DEG-forming multilayer of theform [6 unit cells (u.c.) STO/3 u.c. of GTO]20 using a unique array of photoemission techniques including softand hard x-ray excitation, soft x-ray angle-resolved photoemission, core-level spectroscopy, resonant excitation,and standing-wave effects, as well as theoretical calculations of the electronic structure at several levels andof the actual photoemission process. Standing-wave measurements below and above a strong resonance havebeen exploited as a powerful method for studying the 2DEG depth distribution. We have thus characterizedthe spatial and momentum properties of this 2DEG in detail, determining via depth-distribution measurementsthat it is spread throughout the 6 u.c. layer of STO and measuring the momentum dispersion of its states.The experimental results are supported in several ways by theory, leading to a much more complete picture ofthe nature of this 2DEG and suggesting that oxygen vacancies are not the origin of it. Similar multitechniquephotoemission studies of such states at buried interfaces, combined with comparable theory, will be a very fruitfulfuture approach for exploring and modifying the fascinating world of buried-interface physics and chemistry.
†Present address: Department of Physics, Temple University,Philadelphia, PA 19122, USA.
‡Present address: Department of Physics, Uppsala University,Uppsala, SE-751 20 Sweden.
§Present address: National Security Technologies, Livermore, CA94551 USA.
‖Present address: Japan Atomic Energy Agency, Materials SciencesResearch Center, Energy and Environment Materials Science Divi-sion, Kouto 1-1-1, Sayou-cho, Hyogo 679-5148, Japan.
¶Present address: HRL Laboratories, LLC, Malibu, CA 90265 USA.**Present address: Department of Chemistry, University of Mary-
land, College Park, MD 20742, USA.
I. INTRODUCTION
There is presently high interest in bilayer and multilayerstructures involving metal oxides due to the novel electronicstates that can develop at the interfaces between the differentconstituents, which can often be markedly different fromthose states in the native materials [1–3]. A classic exampleof this is the two-dimensional electron gas (2DEG) at theSrTiO3/LaAlO3 heterointerface [1], which was revealed to beconducting and to exhibit magnetic properties [2,4] as wellas superconductivity [2,5], in spite of both constituents beingnonmagnetic insulators. The electronic structure of this 2DEGhas also been studied by resonant soft x-ray angle-resolved
††Present address: Materials Science and Engineering, Universityof Delaware, Newark, Delaware 19716-3106, USA.
S. NEMSAK et al. PHYSICAL REVIEW B 93, 245103 (2016)
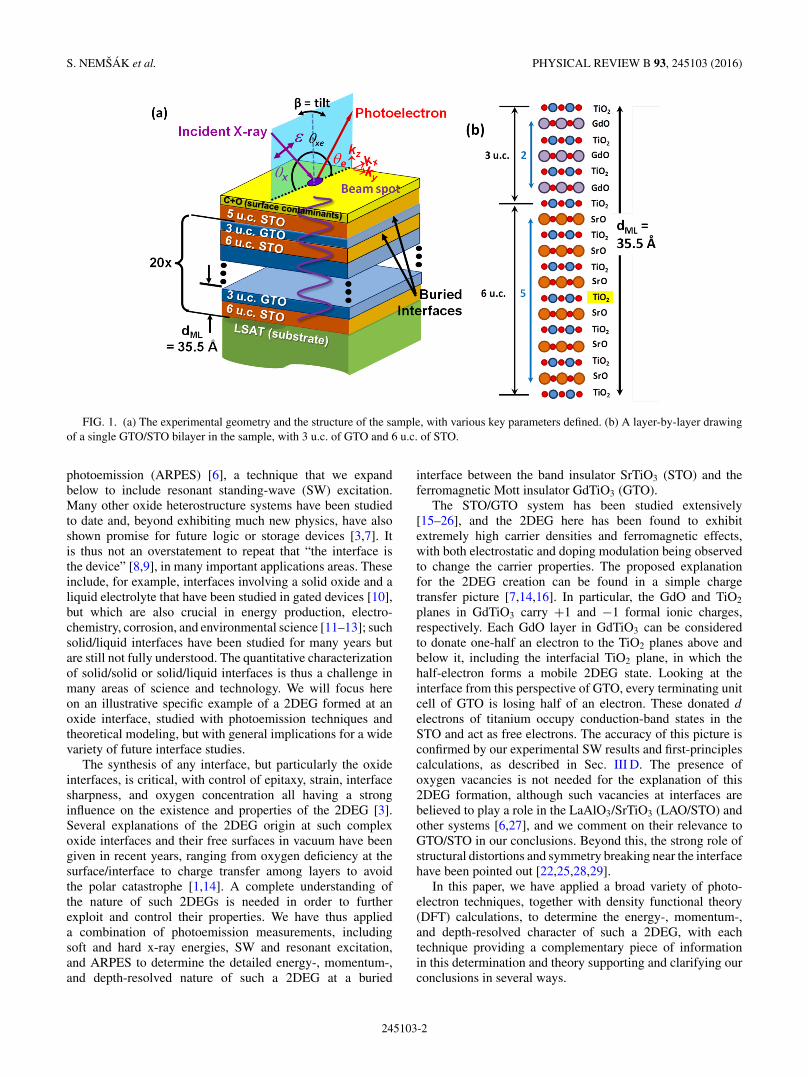
FIG. 1. (a) The experimental geometry and the structure of the sample, with various key parameters defined. (b) A layer-by-layer drawingof a single GTO/STO bilayer in the sample, with 3 u.c. of GTO and 6 u.c. of STO.
photoemission (ARPES) [6], a technique that we expandbelow to include resonant standing-wave (SW) excitation.Many other oxide heterostructure systems have been studiedto date and, beyond exhibiting much new physics, have alsoshown promise for future logic or storage devices [3,7]. Itis thus not an overstatement to repeat that “the interface isthe device” [8,9], in many important applications areas. Theseinclude, for example, interfaces involving a solid oxide and aliquid electrolyte that have been studied in gated devices [10],but which are also crucial in energy production, electro-chemistry, corrosion, and environmental science [11–13]; suchsolid/liquid interfaces have been studied for many years butare still not fully understood. The quantitative characterizationof solid/solid or solid/liquid interfaces is thus a challenge inmany areas of science and technology. We will focus hereon an illustrative specific example of a 2DEG formed at anoxide interface, studied with photoemission techniques andtheoretical modeling, but with general implications for a widevariety of future interface studies.
The synthesis of any interface, but particularly the oxideinterfaces, is critical, with control of epitaxy, strain, interfacesharpness, and oxygen concentration all having a stronginfluence on the existence and properties of the 2DEG [3].Several explanations of the 2DEG origin at such complexoxide interfaces and their free surfaces in vacuum have beengiven in recent years, ranging from oxygen deficiency at thesurface/interface to charge transfer among layers to avoidthe polar catastrophe [1,14]. A complete understanding ofthe nature of such 2DEGs is needed in order to furtherexploit and control their properties. We have thus applieda combination of photoemission measurements, includingsoft and hard x-ray energies, SW and resonant excitation,and ARPES to determine the detailed energy-, momentum-,and depth-resolved nature of such a 2DEG at a buried
interface between the band insulator SrTiO3 (STO) and theferromagnetic Mott insulator GdTiO3 (GTO).
The STO/GTO system has been studied extensively[15–26], and the 2DEG here has been found to exhibitextremely high carrier densities and ferromagnetic effects,with both electrostatic and doping modulation being observedto change the carrier properties. The proposed explanationfor the 2DEG creation can be found in a simple chargetransfer picture [7,14,16]. In particular, the GdO and TiO2
planes in GdTiO3 carry +1 and −1 formal ionic charges,respectively. Each GdO layer in GdTiO3 can be consideredto donate one-half an electron to the TiO2 planes above andbelow it, including the interfacial TiO2 plane, in which thehalf-electron forms a mobile 2DEG state. Looking at theinterface from this perspective of GTO, every terminating unitcell of GTO is losing half of an electron. These donated d
electrons of titanium occupy conduction-band states in theSTO and act as free electrons. The accuracy of this picture isconfirmed by our experimental SW results and first-principlescalculations, as described in Sec. III D. The presence ofoxygen vacancies is not needed for the explanation of this2DEG formation, although such vacancies at interfaces arebelieved to play a role in the LaAlO3/SrTiO3 (LAO/STO) andother systems [6,27], and we comment on their relevance toGTO/STO in our conclusions. Beyond this, the strong role ofstructural distortions and symmetry breaking near the interfacehave been pointed out [22,25,28,29].
In this paper, we have applied a broad variety of photo-electron techniques, together with density functional theory(DFT) calculations, to determine the energy-, momentum-,and depth-resolved character of such a 2DEG, with eachtechnique providing a complementary piece of informationin this determination and theory supporting and clarifying ourconclusions in several ways.
245103-2
ENERGETIC, SPATIAL, AND MOMENTUM CHARACTER OF . . . PHYSICAL REVIEW B 93, 245103 (2016)
In order to probe more deeply into the buried interface,photoemission with both soft x-ray (∼460–1200 eV) and hardx-ray excitation (∼6000 eV) was used. At these energies, theinelastic mean free paths (IMFPs) of the photoelectrons thatdetermine the information depth range in STO(GTO) from11 A(10 A) at 460 eV to 22 A(20 A) at 1200 eV to 83 A(72 A)at 6000 eV was determined from the TPP-2M formula using theSimulation of Electron Spectra for Surface Analysis (SESSA)program [30], thus permitting us to penetrate into the firstburied interface of our multilayer, which is about 20 Abelow the surface, as shown in Fig. 1(a). Such considerationshave also led to increased interest in carrying out ARPESin the soft x-ray regime [31], and we have done that in thispaper.
In another set of measurements, in order to enhancephotoemission of states with Ti 3d character, the well-knownresonant photoemission at the Ti 2p-to-Ti 3d absorption edgeat about 465 eV was used.
For precise depth resolution of the electronic structure,the recently developed SW approach, including momentumresolution via SWARPES was exploited [32,33]. In thistechnique, the incidence angle θx is tuned to the first-orderBragg condition of the multilayer as determined from λx =2dML sin θBragg, where λx is the x-ray wavelength, where dML
is the bilayer thickness in the multilayer mirror, and θBragg isthe Bragg angle, so that a strong SW is created. The incidenceangle is then scanned through that angle, thus also scanningthe SW by one-half of its wavelength vertically through thesample, as indicated in Fig. 1(a). Such scans generate rockingcurves (RCs) of core and valence photoelectron intensitiesthat encompass all the elements in the sample. Additionalinterference effects due to reflection of the x-rays from the topand bottom of the multilayer sample generate fine structuretermed “Kiessig fringes” [32,33]. If the multilayer sample hasa total thickness of DML = NdML, where N is the number of bi-layer repeats in the multilayer mirror, the interference maximawill appear for mλx = 2DML sin θKiessig,m, where m is somehigh order of interference and θKiessig,m is the incidence anglecorresponding to this order. Additional resonant effects on thex-ray optical constants below and above the Gd 3d5/2(M5)absorption edge were also used to move the scanning depth ofthe SW in a controlled way and to increase the amplitudeof the SW. Moving the SW position in this way over aresonance was demonstrated by Bedzyk and Materlik [34] forBragg reflections from single-crystal planes and with x-rayfluorescence detection; this paper describes this techniquebeing used with reflection from a multilayer heterostructureand with photoelectron detection. The SW data is compared tosimulations using the Yang X-Ray Optics (YXRO) softwarepackage [35], which includes detailed x-ray optical andphotoemission intensity modeling and implicitly both Braggand Kiessig interference effects. The expected depth resolutionof the SW technique with fitting of experimental RCs to x-rayoptical theory while varying geometric parameters is expectedto be � 1/10th of the SW period, which is comparable to thesize of 1 unit cell (u.c.) of STO (3.905 A).
The experimental results for electronic structure are thencompared to hybrid functional calculations [7,36,37] and one-step photoemission calculations of ARPES in the relativisticspin-polarized Korringa-Kohn-Rostoker (KKR) approach that
includes the surface and matrix-element effects [38]. Wealso discuss core-level binding energy (BE) shifts and theirtheoretical interpretation [39], e.g. using an Anderson ImpurityModel with final-state screening [40].
II. EXPERIMENTAL METHODS
Reference samples of STO (30 nm thick) and GTO (26nm thick) of thicknesses much greater than the photoelectronIMFPs as well as the primary epitaxial multilayer STO/GTOsample were prepared using a hybrid molecular beam epitaxy(MBE) approach with both gas and solid sources [15,20].The thick reference samples are thus representative of “bulk”material since the photoemission measurement does not reachthe bottom of the layer in sensitivity. The multilayer samplewas grown on a (001) surface of (LaAlO3)0.3(Sr2AlTaO6)0.7
(LSAT) single crystals with Ta-backing layers in a GEN930oxide MBE system, with a chamber background pressure of10−9 torr. The geometry of the sample and the photoemissionexperiment are shown in Fig. 1(a). Twenty bilayers, eachconsisting of 6 u.c. of STO (nominally 23.7 A) and 3 u.c.of GTO (nominally 11.8 A), were deposited on the LSATsubstrate and capped by a final STO layer (5 u.c. or 19.8 Athick). The period of the multilayer is thus 35.5 A, which willalso be the period of the SW perpendicular to the surface ofthe sample [32,33]. The STO and GTO layers were coherentlyand compressively strained to the underlying LSAT by about1%. To clarify the precise sample structure, Fig. 1(b) showsthe internal stacking of TiO2, SrO, and GdO layers, whichmakes it clear that each interface contains a shared TiO2 layer.Scanning transmission electron microscopy measurementswith high angular aperture dark field imaging confirm well-defined and sharp interfaces, with very little interdiffusion, asdemonstrated for a similar sample in Ref. [15]. The results ofx-ray optical simulations of core-level RCs also confirm thehigh quality of the sample and its interfaces, as shown below.
Photoemission measurements were carried out at severalfacilities, permitting measurements with both soft and hardx-ray excitation. In all cases, the radiation was p polarized,with different fixed angles θxe between x-ray incidence andelectron exit, as indicated in Fig. 1(a) and specified below.The soft x-ray data was obtained at Beamline 7.0.1 of theAdvanced Light Source (Ti 2p3/2 or L3 resonant at ∼460 eVand nonresonant at 833 eV, with an overall energy resolutionof 0.15 eV and θxe = 60◦) and the ADRESS Beamline atthe Swiss Light Source (Gd 3d5/2 or M5 resonant at 1182or 1187 eV, resolution of 0.20 eV and θxe = 70◦) [41], andthe hard x-ray data was obtained at the P09 Beamline ofPetra III (∼5000 eV, resolution of 0.30 eV and θxe = 88◦),Beamline BL15XU of SPring-8 (∼6000 eV, resolution of0.24 eV and θxe = 88◦) and Beamline 9.3.1 of the AdvancedLight Source (∼4000 eV, resolution of 0.60 eV and θxe = 88◦).Frequent calibration of the Fermi level (EF) was made withgold samples, and all experimental BEs are presented withthis reference. Each of these experimental stations is equippedwith a hemispherical electrostatic spectrometer manufacturedby Scienta or Specs and sample manipulators that can scan thepolar angle θ and the azimuthal angle φ in Fig. 1(a) and, inthe case of the soft x-ray measurements, also the “tilt” angleβ that is critical to obtaining ARPES results versus kx and ky .
245103-3
S. NEMSAK et al. PHYSICAL REVIEW B 93, 245103 (2016)
III. EXPERIMENTAL AND THEORETICAL RESULTSAND DISCUSSION
A. Valence-band (VB) densities of states (DOS)and core-level spectra
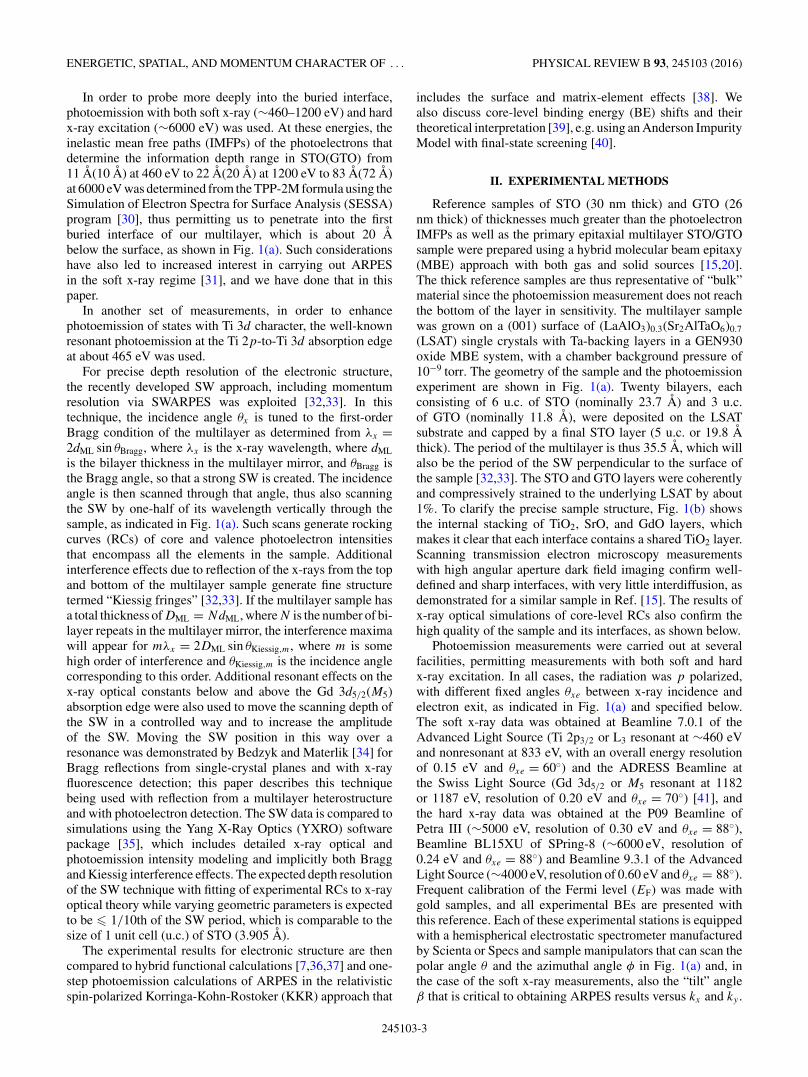
In Fig. 2, we show room-temperature soft and hard x-rayVB photoemission at 833 eV [Fig. 2(a)] and between 4000and 5950 eV [Fig. 2(c), for bulk STO, bulk GTO, and themultilayer]. At this temperature, such spectra should representmatrix element-weighted DOS (MEWDOS). We can hereidentify, particularly in the soft x-ray spectrum of Fig. 2(a) andits blowup in Fig. 2(b), five features 1, 1′, 2, 3, 4 and 5, withthese being slightly different in position and much differentin weight with hard x-ray excitation due to matrix-element(or equivalently cross-section) effects. The feature labels inthe hard x-ray spectra of Fig. 2(c) are color-coded to indicatethe dominant origin, either from STO (green) or GTO (blue).The blowup in Fig. 2(d) again shows the multilayer spectrum(red curve) features reminiscent of 1 and 1′ in Fig. 2(b), withthe spectrum of GTO being more similar to feature 1′ in thesoft x-ray data and STO not showing significant intensity overthis near-Fermi-energy region, as expected for STO with abandgap of ∼3.4 eV. Figures 2(e) and 2(f) show soft x-raycore-level spectra for the two elements characteristic of eachmember of the bilayer, Ti 2p and Sr 3d, respectively. Ti 2p
clearly shows evidence of two valence states, Ti4+ associatedwith the top layer STO and all other STO layers, and Ti3+associated primarily with the GTO layers, or possibly also withthe presence of Ti3+ near STO/GTO interfaces. Rocking curvedata below conclusively show that Ti4+ is associated with STO,and Ti3+ is associated with GTO. Although not as pronouncedas for Ti, peak fitting of the Sr 3d spectra in Fig. 2(f) indicatea higher BE (HBE) state that is about 1/3 as intense asthe main Sr2+ low-BE (LBE) peak and with a separation ofabout 0.7–0.8 eV. Such HBE and LBE components for Sr 3d
have in fact been observed before in an x-ray photoelectronspectroscopy (XPS) study of SrTiO3 [42], with the HBE peakinterpreted as being due to surface Sr species bound in moreelectronegative environments to F and O. Alternatively, thepossibility of different Sr electronic configurations such asSr2+ and Sr1+ associated with final-state screening of the Sr3d core hole have been considered [39]. We comment furtherbelow on the behavior of these core-level components usingthe additional information from the SW scans through thesample.
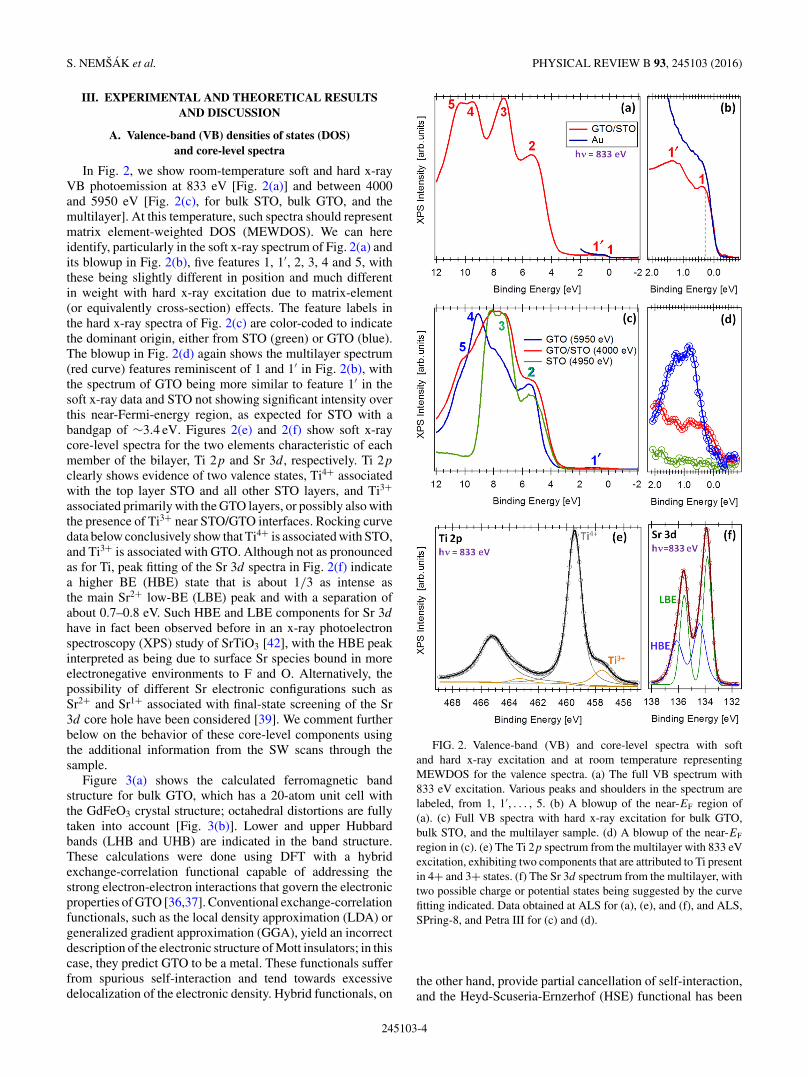
Figure 3(a) shows the calculated ferromagnetic bandstructure for bulk GTO, which has a 20-atom unit cell withthe GdFeO3 crystal structure; octahedral distortions are fullytaken into account [Fig. 3(b)]. Lower and upper Hubbardbands (LHB and UHB) are indicated in the band structure.These calculations were done using DFT with a hybridexchange-correlation functional capable of addressing thestrong electron-electron interactions that govern the electronicproperties of GTO [36,37]. Conventional exchange-correlationfunctionals, such as the local density approximation (LDA) orgeneralized gradient approximation (GGA), yield an incorrectdescription of the electronic structure of Mott insulators; in thiscase, they predict GTO to be a metal. These functionals sufferfrom spurious self-interaction and tend towards excessivedelocalization of the electronic density. Hybrid functionals, on
FIG. 2. Valence-band (VB) and core-level spectra with softand hard x-ray excitation and at room temperature representingMEWDOS for the valence spectra. (a) The full VB spectrum with833 eV excitation. Various peaks and shoulders in the spectrum arelabeled, from 1, 1′, . . . , 5. (b) A blowup of the near-EF region of(a). (c) Full VB spectra with hard x-ray excitation for bulk GTO,bulk STO, and the multilayer sample. (d) A blowup of the near-EF
region in (c). (e) The Ti 2p spectrum from the multilayer with 833 eVexcitation, exhibiting two components that are attributed to Ti presentin 4+ and 3+ states. (f) The Sr 3d spectrum from the multilayer, withtwo possible charge or potential states being suggested by the curvefitting indicated. Data obtained at ALS for (a), (e), and (f), and ALS,SPring-8, and Petra III for (c) and (d).
the other hand, provide partial cancellation of self-interaction,and the Heyd-Scuseria-Ernzerhof (HSE) functional has been
245103-4
ENERGETIC, SPATIAL, AND MOMENTUM CHARACTER OF . . . PHYSICAL REVIEW B 93, 245103 (2016)
FIG. 3. First-principles results for electronic structure of bulk GTO and bulk STO. (a) Band structure along high-symmetry lines in the BZfor bulk GTO with the unit cell shown in (b). The locations of the LHB and UHB are indicated. (c) DOS for bulk GTO: total, with 0.30 eVconvolution to mimic experimental resolution, and orbital-projected for Ti, O, and Gd. (d) Superposition of the DOS for GTO and STO, alignedaccording to the calculated band offset of 2.6 eV.
shown to give an accurate description of the electronicand structural properties of a wide range of materials [43],including perovskite oxides [44].
The calculations were done with the VASP code [45,46],using the default 25% Hartree-Fock mixing parameter and
a 0.2 A−1
range separation parameter. Projector-augmentedwave (PAW) potentials [47] were used to describe theinteraction between the valence electrons and the ionic cores,with the Gd 4f electrons included in the VBs for bulk GTOand treated as core levels for the superlattice. All calculationswere carried out with spin polarization, which is required tocorrectly describe the electronic properties of GTO. The bulkcalculation [Fig. 3(a)] was done using a 500 eV plane-waveenergy cutoff and a 4 × 4 × 2 Monkhorst-Pack k-point grid,and the superlattice calculation (Fig. 9) was done with a 400 eVcutoff and a 4 × 4 × 1 k-point grid.
Figure 3(c) shows total and projected DOS from all of theelements in bulk GTO, and it is clear that the LHB is mainly Ti3d, but with strong mixing of O 2p, and to some degree alsoGd 5d. In Fig. 3(d), the total DOS for GTO and STO are shown,aligned using the calculated band offset of 2.6 eV that is ingood agreement with the 2.9 ± 0.3 eV found from hard x-rayphotoemission measurements [21]. From Figs. 2 and 3, we canthus tentatively identify peak 1′ in experiment as being due tothe LHB, and peaks 2, 3, and 4 in Figs. 2(a) and 2(c) to the peaksin the combined DOS of STO and GTO in Fig. 3(d) denoteda, b, and c, respectively. Peak 5 in experiment is assigned toGd 4f states. The experimental results also make it clear thatthe same LHB bands are observed both in bulk GTO and themultilayer [Figs. 2(b) and 2(d)]. However, peak 1, which is
centered about 350 meV below the Fermi level and markedwith a dashed vertical guideline in Fig. 2(b), is not observedat all in the calculated spectra for bulk GTO; we show belowthat it is in fact a signature of the 2DEG.
B. Resonant ARPES
We now turn to resonant photoemission and ARPES toexplore more of the properties of the two states representedby features 1 and 1′, including their k-space distributions. Themethodology here is thus like that applied to the LAO/STOsystem by Berner et al. [6]. Figure 4(a) displays a seriesof angle-integrated MEWDOS-like VB spectra measured atliquid N2 temperature as the photon energy sweeps throughthe Ti 2p resonances, with the peaks labelled pre = pre-edge,and a–d. Peaks a–d occur associated with the 2p1/2(L2) and2p3/2 (L3) absorption edges, with each of these being furthersplit into their eg (b and d) and t2g (a and c) components; thesefeatures are well-known from prior x-ray absorption studies ofTi oxides [48]. The strong enhancement of features 1 and 1′are also obvious in Fig. 4(a), near the energies of peaks b andd. The maximum enhancement is found just below peak d, theTi L2 eg resonance, at a photon energy of 465.2 eV. Figure 4(b)shows the resonantly enhanced MEWDOS VB spectrum, withboth features 1 and 1′ clearly visible. To explore the energy de-pendence of resonant and nonresonant ARPES, we also definethe five energy intervals A–E in Fig. 4(b) that span features 1and 1′, with A being strongly associated with feature 1.
We first consider three ARPES patterns over region A,i.e. integrated over the energy interval between Fermi edgeand 0.4 eV, which overlaps with the energy position of the
245103-5
S. NEMSAK et al. PHYSICAL REVIEW B 93, 245103 (2016)
FIG. 4. Resonant photoemission from the [6 u.c. STO/3 u.c. GTO]×20 multilayer sample. (a) The effect of scanning photon energy throughthe Ti 2p absorption resonances on MEWDOS-level VB spectra. Labeled features are pre-edge, a = Ti 2p3/2-3d t2g , b = Ti 2p3/2-3d eg ,c = Ti 2p1/2-3d t2g , and d = Ti 2p1/2-3d eg . (b) Resonant MEWDOS VB spectrum near EF with 465.2 eV excitation. The features 1 and 1′ areindicated, together with five energy regions A–E. (c) Nonresonant and resonant kx-ky ARPES maps for: (i) nonresonant excitation at 833 eV,region A; (ii) nonresonant excitation at 470 eV, region A; (iii) resonant excitation at 465.2 eV, region A; (iv)–(vii) Resonant excitation at 465.2 eVfor regions B–E, respectively; and (viii) theoretical prediction for region A from one-step photoemission theory. All data collected at ALS.
feature 1. The collected data were measured off and onresonance, see Figs. 4(c)(i)–(iii). Measurements performed ata higher nonresonant excitation energy of 833 eV that willpenetrate at least two interfaces [Fig. 4(c)(i)] show a weakrotated square-grid pattern. The higher energy results showover 20 Brillouin zones (BZs) due to the longer final-statek-vector and the higher angular acceptance in θ , (±20◦) of theparticular spectrometer used, with the associated mechanicalβ scan being chosen to match this angular acceptance (cf.Fig. 1). On the other hand, for an energy off resonance ata lower photon energy 470 eV that is well above the Ti2p resonances [Fig. 4(c)(ii)], scarcely any modulation inthe intensity is observable. However, going to the optimum
resonance energy of 465.2 eV reveals an intense and sharpsquare-grid pattern [Fig. 4(c)(iii)] for this lower energy andthe same spectrometer samples over 10 BZs. Using resonantexcitation is thus essential for carrying out ARPES on theseweak features at such low electron kinetic energies due tothe rapidly decreasing mean free paths for both inelastic andelastic scattering, with elastic scattering further acting to smearfeatures out in momentum [31].
As noted above, at these soft x-ray photon energies, wesample several BZs, and an analysis of the emission processin reciprocal space below reveals that the intensity maximain Fig. 4(c) are located at � points in each BZ, with sleevesof higher intensity running between those maxima through X
245103-6
ENERGETIC, SPATIAL, AND MOMENTUM CHARACTER OF . . . PHYSICAL REVIEW B 93, 245103 (2016)
directions, as labeled in Fig. 4(c)(iii). The difference in theintensity between different � points is caused by a differentposition in the BZ along the perpendicular direction of kcaused by the curvature of the sphere in k-space that is beingsampled at these energies, as discussed in more detail below.It is remarkable that the sharp square momentum distributionpattern in Fig. 4(c) is not only observed in the lowest BEinterval of A, but also continues to appear for deeper stateslocated as low as BE = −1.6 eV, although with reducedsharpness and intensity as BE increases.
An additional comment here concerns the periodicity of thepatterns seen in Figs. 4(c)(i)–(vi), for which the � and X labelsare found to be those of the simple five-atom unit perovskitecell of GTO, rather than the larger unit cell that allows foroctahedral tilts shown in Fig. 3(b). Such observations ofeffectively reduced spatial periodicity in ARPES data, as seen,e.g. in the reduced importance of folded bands, have beendiscussed recently in a Fe-based superconductor [49] and ahalf-metallic ferromagnet [50]. We suggest that this is dueat least partially to the final state damping with distance inARPES due to inelastic scattering, which effectively reducesthe spatial extent of sampling the long-range symmetry of thelattice, especially when the distortions from the simple unitcell are small. An additional cause is no doubt phonon effects,which are more important in the several hundred electronvoltsor higher range and tend to smear the experimental resultsin the BZ, thus again effectively shrinking the periodicityin experiment. Such phonon effects and their theoreticalmodeling are discussed in detail elsewhere [31,51].
Feature 1 and feature 1′ exhibit similar k-space distributionsfollowing the periodicity of the simple perovskite BZ, in spiteof the fact that they have a different fundamental origin.This is consistent with the calculated band structure for themultilayer presented below. However, feature 1, associatedwith the 2DEG, does exhibit much sharper features indicativeof greater spatial delocalization in the BE interval 0.0–0.4 eV.
C. SW core-level photoemission and ARPES
We next make use of the superb depth resolution ofSW photoemission, including ARPES [32,33], to provideunique information on the depth distribution of the statesinvolved in features 1 and 1′. In particular, we have used aprocedure involving resonant effects to change the scanningdepth of the SW in the sample, in particular by going belowand above the Gd M5 absorption edge, as pointed out insingle-crystal Bragg reflection studies with x-ray fluorescencedetection [34]. To validate and illustrate this new aspect of SWphotoemission, we performed extensive numerical simulationswith the YXRO program [35] before and after the experimentin order to choose the best photon energies and then toidentify precisely the depth of origin of photoelectrons foreach atomic species through core-level RCs. The RCs ofdifferent VB features were then compared to the core levelRCs to provide definitive depth information. The optimizationof the sample structural model was done in an iterative mannerby comparing experimental and calculated RCs for variouschoices of sample configuration. The model with the best fitbetween experimental data and simulations is presented below.
The resonant optical constants needed for our simulationswere obtained by measuring Gd M4,5 x-ray absorption spectra[Fig. 5(a)] from total electron yield and applying a Kramers-Kronig transformation [52], with the end results for the realand imaginary parts of the index of refraction n = 1 − δ − iβ
being shown in Fig. 5(b). In order to make the simulationas close as possible to reality, the model included a surfacecontaminant layer consisting of 12 A of adsorbed CO toallow for the C- and O-containing species that are expectedto be present, with this thickness being estimated from thecombination of the C 1s relative intensity in the photoemissionspectra and YXRO simulations. All interfaces were assumedto be ideally flat, with transmission electron microscopyimages from prior work making this a very reasonable startingassumption [15].
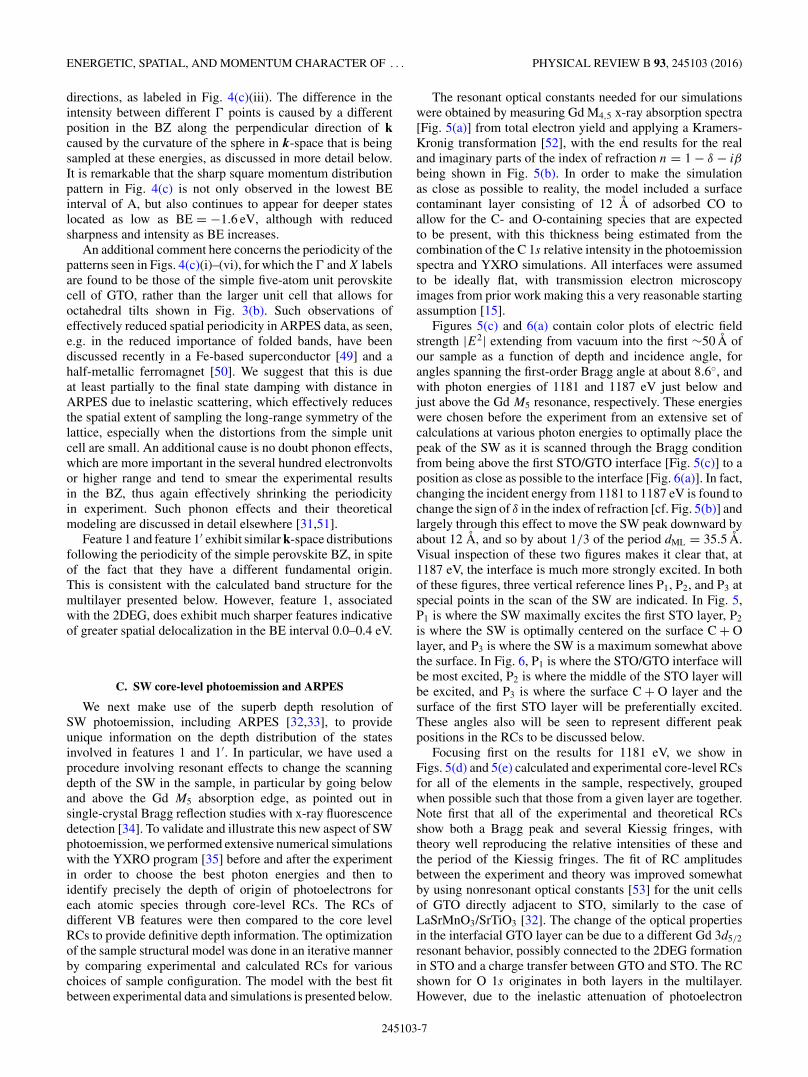
Figures 5(c) and 6(a) contain color plots of electric fieldstrength |E2| extending from vacuum into the first ∼50 A ofour sample as a function of depth and incidence angle, forangles spanning the first-order Bragg angle at about 8.6◦, andwith photon energies of 1181 and 1187 eV just below andjust above the Gd M5 resonance, respectively. These energieswere chosen before the experiment from an extensive set ofcalculations at various photon energies to optimally place thepeak of the SW as it is scanned through the Bragg conditionfrom being above the first STO/GTO interface [Fig. 5(c)] to aposition as close as possible to the interface [Fig. 6(a)]. In fact,changing the incident energy from 1181 to 1187 eV is found tochange the sign of δ in the index of refraction [cf. Fig. 5(b)] andlargely through this effect to move the SW peak downward byabout 12 A, and so by about 1/3 of the period dML = 35.5 A.Visual inspection of these two figures makes it clear that, at1187 eV, the interface is much more strongly excited. In bothof these figures, three vertical reference lines P1, P2, and P3 atspecial points in the scan of the SW are indicated. In Fig. 5,P1 is where the SW maximally excites the first STO layer, P2
is where the SW is optimally centered on the surface C + Olayer, and P3 is where the SW is a maximum somewhat abovethe surface. In Fig. 6, P1 is where the STO/GTO interface willbe most excited, P2 is where the middle of the STO layer willbe excited, and P3 is where the surface C + O layer and thesurface of the first STO layer will be preferentially excited.These angles also will be seen to represent different peakpositions in the RCs to be discussed below.
Focusing first on the results for 1181 eV, we show inFigs. 5(d) and 5(e) calculated and experimental core-level RCsfor all of the elements in the sample, respectively, groupedwhen possible such that those from a given layer are together.Note first that all of the experimental and theoretical RCsshow both a Bragg peak and several Kiessig fringes, withtheory well reproducing the relative intensities of these andthe period of the Kiessig fringes. The fit of RC amplitudesbetween the experiment and theory was improved somewhatby using nonresonant optical constants [53] for the unit cellsof GTO directly adjacent to STO, similarly to the case ofLaSrMnO3/SrTiO3 [32]. The change of the optical propertiesin the interfacial GTO layer can be due to a different Gd 3d5/2
resonant behavior, possibly connected to the 2DEG formationin STO and a charge transfer between GTO and STO. The RCshown for O 1s originates in both layers in the multilayer.However, due to the inelastic attenuation of photoelectron
245103-7
S. NEMSAK et al. PHYSICAL REVIEW B 93, 245103 (2016)
FIG. 5. SW photoemission from the [6 u.c. STO/3 u.c. GTO]×20 multilayer sample with excitation at 1181 eV. (a) X-ray absorptionspectrum measured through the Gd M5 resonance. (b) The variation of the real and imaginary parts of the index of refraction (δ and β) withthe two energies selected for SW photoemission indicated. (c) The electric field strength |E2| as a function of depth and incidence angle. (d)Calculated RCs for various core levels and the LHB, assuming the structure in (c). (e) Experimental RCs for the same core levels, but withLBE and HBE Sr 3d shown separately, and the LHB. Experimental data are from the ALS.
intensities, the signal from the top-layer STO is expected todominate the O 1s spectra, and in fact, the shape and phaseof the O 1s RC coincides with the one for Sr 3d. Here, C1s comes from the surface contaminant layer, and its RC isshifted considerably from all other RCs, due to its uniquedepth distribution. As might be expected from the differentalternating depth distributions of Gd and Sr atoms in thesample, the RCs of Sr 3d and Gd 4f show opposite phases asthe SW scans through them, demonstrating the high sensitivityof such SW RC measurements to the depth of a given species.Beyond this, we can make use of the two components in theTi 2p spectrum shown in Fig. 2(e) to try to depth-resolvethe positions of these two types of Ti. Rocking curves werethus separately determined for Ti 2p4+ and Ti 2p3+ by peakfitting, and these are shown separately in Fig. 5(e). We findthat the Sr 3d and Ti 2p4+ RCs are almost identical in bothexperiment and theory, including the Kiessig fringes that areevident for angles below the Bragg angle, as they should be
in originating uniquely in the STO layers of the sample. Thesame is true of Ti 2p3+ and Gd 4f , which are expected tooriginate in the GTO layers of the sample. Although the RCfor Ti 2p4+ has a slightly different shape from Gd 4f , thisis largely due to the greater difficulty of fitting this weakerpeak. The average Ti3+/Ti4+ intensity ratio of ∼7 over theRCs, and measured at both 1181 and 1187 eV before andafter the Gd M5 edge is also qualitatively consistent with thetotal relative number of these ions in our sample, which is 1
2 ,provided that we also allow for the fact that STO is the top layerand is thus enhanced due to photoelectron inelastic scattering;this conclusion has been confirmed using the SESSA programfor simulating XPS spectra [30]. An experimental RC for theLHB determined by integrating all intensity over regions B,C, and D as defined in Fig. 4(b) in a spectrum taken in theroom-temperature MEWDOS limit yields the curve shownat the bottom of Fig. 5(e). Although noisier than the othersdue to the low relative intensities of this VB feature [cf.
245103-8
ENERGETIC, SPATIAL, AND MOMENTUM CHARACTER OF . . . PHYSICAL REVIEW B 93, 245103 (2016)
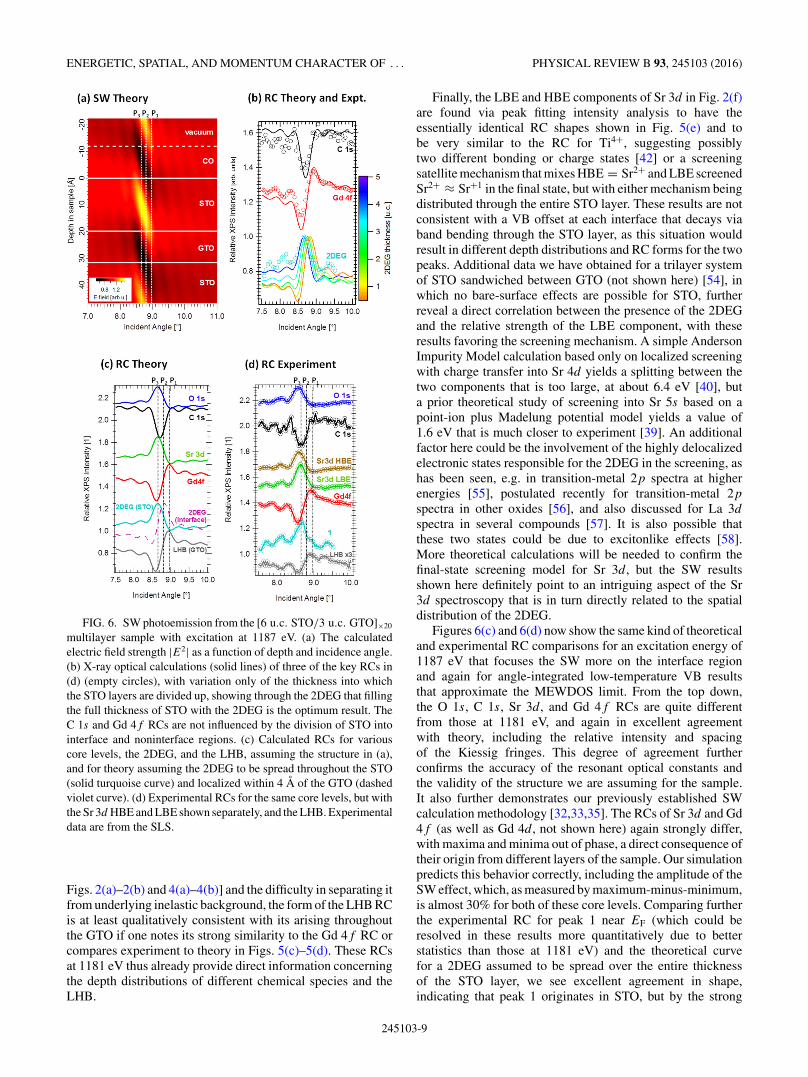
FIG. 6. SW photoemission from the [6 u.c. STO/3 u.c. GTO]×20
multilayer sample with excitation at 1187 eV. (a) The calculatedelectric field strength |E2| as a function of depth and incidence angle.(b) X-ray optical calculations (solid lines) of three of the key RCs in(d) (empty circles), with variation only of the thickness into whichthe STO layers are divided up, showing through the 2DEG that fillingthe full thickness of STO with the 2DEG is the optimum result. TheC 1s and Gd 4f RCs are not influenced by the division of STO intointerface and noninterface regions. (c) Calculated RCs for variouscore levels, the 2DEG, and the LHB, assuming the structure in (a),and for theory assuming the 2DEG to be spread throughout the STO(solid turquoise curve) and localized within 4 A of the GTO (dashedviolet curve). (d) Experimental RCs for the same core levels, but withthe Sr 3d HBE and LBE shown separately, and the LHB. Experimentaldata are from the SLS.
Figs. 2(a)–2(b) and 4(a)–4(b)] and the difficulty in separating itfrom underlying inelastic background, the form of the LHB RCis at least qualitatively consistent with its arising throughoutthe GTO if one notes its strong similarity to the Gd 4f RC orcompares experiment to theory in Figs. 5(c)–5(d). These RCsat 1181 eV thus already provide direct information concerningthe depth distributions of different chemical species and theLHB.
Finally, the LBE and HBE components of Sr 3d in Fig. 2(f)are found via peak fitting intensity analysis to have theessentially identical RC shapes shown in Fig. 5(e) and tobe very similar to the RC for Ti4+, suggesting possiblytwo different bonding or charge states [42] or a screeningsatellite mechanism that mixes HBE = Sr2+ and LBE screenedSr2+ ≈ Sr+1 in the final state, but with either mechanism beingdistributed through the entire STO layer. These results are notconsistent with a VB offset at each interface that decays viaband bending through the STO layer, as this situation wouldresult in different depth distributions and RC forms for the twopeaks. Additional data we have obtained for a trilayer systemof STO sandwiched between GTO (not shown here) [54], inwhich no bare-surface effects are possible for STO, furtherreveal a direct correlation between the presence of the 2DEGand the relative strength of the LBE component, with theseresults favoring the screening mechanism. A simple AndersonImpurity Model calculation based only on localized screeningwith charge transfer into Sr 4d yields a splitting between thetwo components that is too large, at about 6.4 eV [40], buta prior theoretical study of screening into Sr 5s based on apoint-ion plus Madelung potential model yields a value of1.6 eV that is much closer to experiment [39]. An additionalfactor here could be the involvement of the highly delocalizedelectronic states responsible for the 2DEG in the screening, ashas been seen, e.g. in transition-metal 2p spectra at higherenergies [55], postulated recently for transition-metal 2p
spectra in other oxides [56], and also discussed for La 3d
spectra in several compounds [57]. It is also possible thatthese two states could be due to excitonlike effects [58].More theoretical calculations will be needed to confirm thefinal-state screening model for Sr 3d, but the SW resultsshown here definitely point to an intriguing aspect of the Sr3d spectroscopy that is in turn directly related to the spatialdistribution of the 2DEG.
Figures 6(c) and 6(d) now show the same kind of theoreticaland experimental RC comparisons for an excitation energy of1187 eV that focuses the SW more on the interface regionand again for angle-integrated low-temperature VB resultsthat approximate the MEWDOS limit. From the top down,the O 1s, C 1s, Sr 3d, and Gd 4f RCs are quite differentfrom those at 1181 eV, and again in excellent agreementwith theory, including the relative intensity and spacingof the Kiessig fringes. This degree of agreement furtherconfirms the accuracy of the resonant optical constants andthe validity of the structure we are assuming for the sample.It also further demonstrates our previously established SWcalculation methodology [32,33,35]. The RCs of Sr 3d and Gd4f (as well as Gd 4d, not shown here) again strongly differ,with maxima and minima out of phase, a direct consequence oftheir origin from different layers of the sample. Our simulationpredicts this behavior correctly, including the amplitude of theSW effect, which, as measured by maximum-minus-minimum,is almost 30% for both of these core levels. Comparing furtherthe experimental RC for peak 1 near EF (which could beresolved in these results more quantitatively due to betterstatistics than those at 1181 eV) and the theoretical curvefor a 2DEG assumed to be spread over the entire thicknessof the STO layer, we see excellent agreement in shape,indicating that peak 1 originates in STO, but by the strong
245103-9
S. NEMSAK et al. PHYSICAL REVIEW B 93, 245103 (2016)
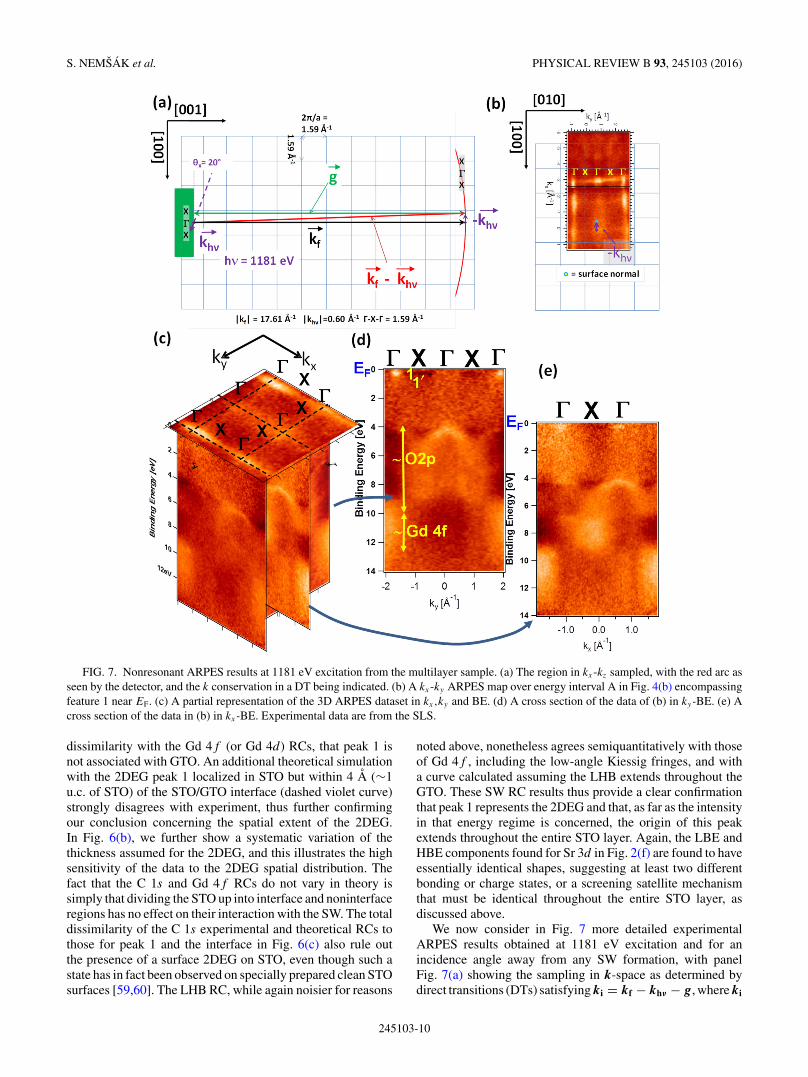
FIG. 7. Nonresonant ARPES results at 1181 eV excitation from the multilayer sample. (a) The region in kx-kz sampled, with the red arc asseen by the detector, and the k conservation in a DT being indicated. (b) A kx-ky ARPES map over energy interval A in Fig. 4(b) encompassingfeature 1 near EF. (c) A partial representation of the 3D ARPES dataset in kx,ky and BE. (d) A cross section of the data of (b) in ky-BE. (e) Across section of the data in (b) in kx-BE. Experimental data are from the SLS.
dissimilarity with the Gd 4f (or Gd 4d) RCs, that peak 1 isnot associated with GTO. An additional theoretical simulationwith the 2DEG peak 1 localized in STO but within 4 A (∼1u.c. of STO) of the STO/GTO interface (dashed violet curve)strongly disagrees with experiment, thus further confirmingour conclusion concerning the spatial extent of the 2DEG.In Fig. 6(b), we further show a systematic variation of thethickness assumed for the 2DEG, and this illustrates the highsensitivity of the data to the 2DEG spatial distribution. Thefact that the C 1s and Gd 4f RCs do not vary in theory issimply that dividing the STO up into interface and noninterfaceregions has no effect on their interaction with the SW. The totaldissimilarity of the C 1s experimental and theoretical RCs tothose for peak 1 and the interface in Fig. 6(c) also rule outthe presence of a surface 2DEG on STO, even though such astate has in fact been observed on specially prepared clean STOsurfaces [59,60]. The LHB RC, while again noisier for reasons
noted above, nonetheless agrees semiquantitatively with thoseof Gd 4f , including the low-angle Kiessig fringes, and witha curve calculated assuming the LHB extends throughout theGTO. These SW RC results thus provide a clear confirmationthat peak 1 represents the 2DEG and that, as far as the intensityin that energy regime is concerned, the origin of this peakextends throughout the entire STO layer. Again, the LBE andHBE components found for Sr 3d in Fig. 2(f) are found to haveessentially identical shapes, suggesting at least two differentbonding or charge states, or a screening satellite mechanismthat must be identical throughout the entire STO layer, asdiscussed above.
We now consider in Fig. 7 more detailed experimentalARPES results obtained at 1181 eV excitation and for anincidence angle away from any SW formation, with panelFig. 7(a) showing the sampling in k-space as determined bydirect transitions (DTs) satisfying ki = kf − khν − g, where ki
245103-10
ENERGETIC, SPATIAL, AND MOMENTUM CHARACTER OF . . . PHYSICAL REVIEW B 93, 245103 (2016)
FIG. 8. As Figs. 7(c)–7(e), but for a nonresonant excitation energy of 833 eV and with a larger spectrometer acceptance angle that leads tosampling a greater number of BZs. Experimental data are from the ALS.
is the initial state wave vector, kf is the final-state photoelectronwave vector inside the surface, assumed in this drawing to bea free-electron state, khν is the photon wave vector and g isthe relevant reciprocal lattice vector supporting the transition;Fig. 7(b) some raw ARPES data in kx-ky over the near-EF
region of feature 1, superimposed upon a projected crosssection of the sampling sphere; and Figs. 7(c)–7(e) severalrepresentations, including cross-section cuts, of the three-dimensional dataset in kx , ky , and BE. The small correctiondue to photon momentum vector is indicated in both Figs. 7(a)and 7(b). The horizontal top surface in Fig. 7(c) resembles thatin Fig. 4(c)(iii)–(iv) for emission from the A and B energyregions, with maxima at the � point and intensity sleevesconnecting those maxima through X points for this energy.The perpendicular cuts in Figs. 7(d) and 7(e) reveal newdetails of the electronic structure, with distinct maxima nearthe � points for the energy range of peak 1 and much morediffuse structure in k for the energy range of peak 1′, althoughFig. 7(e) in fact shows to a higher degree the similar momentumintensity distribution of peaks 1 and 1′ over a broader BE rangedown to ∼4 eV. Thus, although these two features show verymuch the same pattern in kx-ky ARPES cross sections, andthus have led us to suggest them to be strongly admixed,they nonetheless have very different intensity profiles whenviewed in these kx-BE or ky-BE cross sections. Beyond this,Figs. 7(d) and 7(e) reveal additional dispersive features in theelectronic structure over BEs of ∼4–9 eV that we compareto theory below. The nondispersive nature of the bands overBEs of ∼10–12 eV identifies them as being highly localizedin character and thus exhibiting only XPD effects, supportingour previous suggestion that they must represent Gd 4f bandswith no dispersion.
Figures 8(a)–8(c) at a nonresonant 833 eV excitation arethus lower energy analogues of Figs. 7(c)–7(e) at resonant1181 eV excitation, and they fully support the conclusions
based on Fig. 7. The top surface in Fig. 8(a), analogous to theone in Fig. 7(a), is in fact identical to the plot in Fig. 4(c)(i).As noted in connection with Fig. 4(c)(i), the energy used hereand the larger acceptance angle of the spectrometer permitsobserving a much larger number of BZs.
Based on our combined experimental results, includingMEWDOS VB results, resonant ARPES, and SW core andVB photoemission, we thus conclude that peak 1 represents the2DEG formed by the presence of the STO/GTO interfaces, thatit is spatially localized within the STO layers, that it exhibitsnonuniform momentum distribution very similar to peak 1′,which we assign to the LHB of GTO, but that it is much morelocalized in k than the LHB. It is also worth noting that ourresults for this buried interface do not appear consistent withthe suggestion in prior 2DEG photoemission studies involvingeither a free surface of STO [59,60] or a buried interface ofSTO [6] of the essential role played by oxygen vacancies informing both the 2DEG and states at the position of peak 1′,in that it seems very unlikely that these would be uniformlydistributed over both the STO and GTO layers, as our SWanalysis indicates.
D. More detailed comparisons to theory
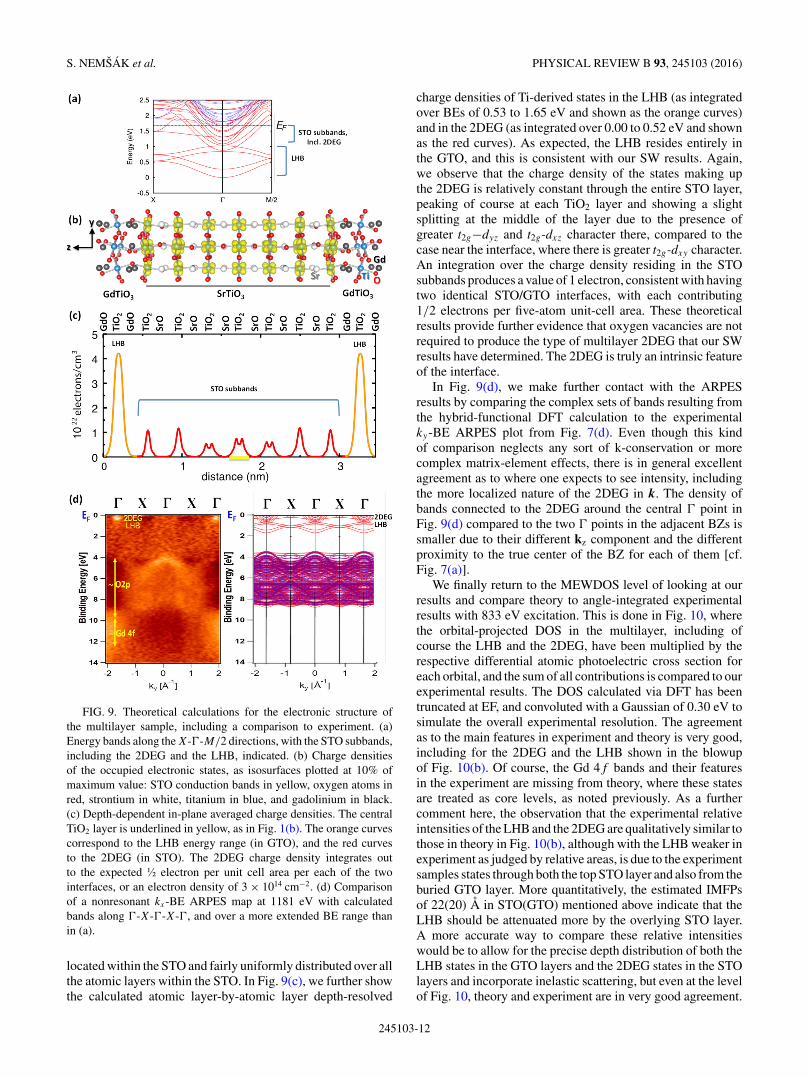
In order to better understand our results, we now considertheoretical calculations at several levels. Figure 9(a) depicts thecalculated band structure of the multilayer, clearly indicatingits metallic character with electrons residing in STO subbands.The figure focuses on the energy region near EF encompassingthe LHB and the 2DEG for bands along X-�-M/2, againexhibiting ferromagnetic order such that the spin-up andspin-down bands are nondegenerate. The fact that the electronsreside in the STO is further confirmed by Figs. 9(b) and 9(c).Figure 9(b) shows via charge-density plots that the electroniccharge density associated with the STO subbands is entirely
245103-11
S. NEMSAK et al. PHYSICAL REVIEW B 93, 245103 (2016)
FIG. 9. Theoretical calculations for the electronic structure ofthe multilayer sample, including a comparison to experiment. (a)Energy bands along the X-�-M/2 directions, with the STO subbands,including the 2DEG and the LHB, indicated. (b) Charge densitiesof the occupied electronic states, as isosurfaces plotted at 10% ofmaximum value: STO conduction bands in yellow, oxygen atoms inred, strontium in white, titanium in blue, and gadolinium in black.(c) Depth-dependent in-plane averaged charge densities. The centralTiO2 layer is underlined in yellow, as in Fig. 1(b). The orange curvescorrespond to the LHB energy range (in GTO), and the red curvesto the 2DEG (in STO). The 2DEG charge density integrates outto the expected ½ electron per unit cell area per each of the twointerfaces, or an electron density of 3 × 1014 cm−2. (d) Comparisonof a nonresonant kx-BE ARPES map at 1181 eV with calculatedbands along �-X-�-X-�, and over a more extended BE range thanin (a).
located within the STO and fairly uniformly distributed over allthe atomic layers within the STO. In Fig. 9(c), we further showthe calculated atomic layer-by-atomic layer depth-resolved
charge densities of Ti-derived states in the LHB (as integratedover BEs of 0.53 to 1.65 eV and shown as the orange curves)and in the 2DEG (as integrated over 0.00 to 0.52 eV and shownas the red curves). As expected, the LHB resides entirely inthe GTO, and this is consistent with our SW results. Again,we observe that the charge density of the states making upthe 2DEG is relatively constant through the entire STO layer,peaking of course at each TiO2 layer and showing a slightsplitting at the middle of the layer due to the presence ofgreater t2g−dyz and t2g-dxz character there, compared to thecase near the interface, where there is greater t2g-dxy character.An integration over the charge density residing in the STOsubbands produces a value of 1 electron, consistent with havingtwo identical STO/GTO interfaces, with each contributing1/2 electrons per five-atom unit-cell area. These theoreticalresults provide further evidence that oxygen vacancies are notrequired to produce the type of multilayer 2DEG that our SWresults have determined. The 2DEG is truly an intrinsic featureof the interface.
In Fig. 9(d), we make further contact with the ARPESresults by comparing the complex sets of bands resulting fromthe hybrid-functional DFT calculation to the experimentalky-BE ARPES plot from Fig. 7(d). Even though this kindof comparison neglects any sort of k-conservation or morecomplex matrix-element effects, there is in general excellentagreement as to where one expects to see intensity, includingthe more localized nature of the 2DEG in k. The density ofbands connected to the 2DEG around the central � point inFig. 9(d) compared to the two � points in the adjacent BZs issmaller due to their different kz component and the differentproximity to the true center of the BZ for each of them [cf.Fig. 7(a)].
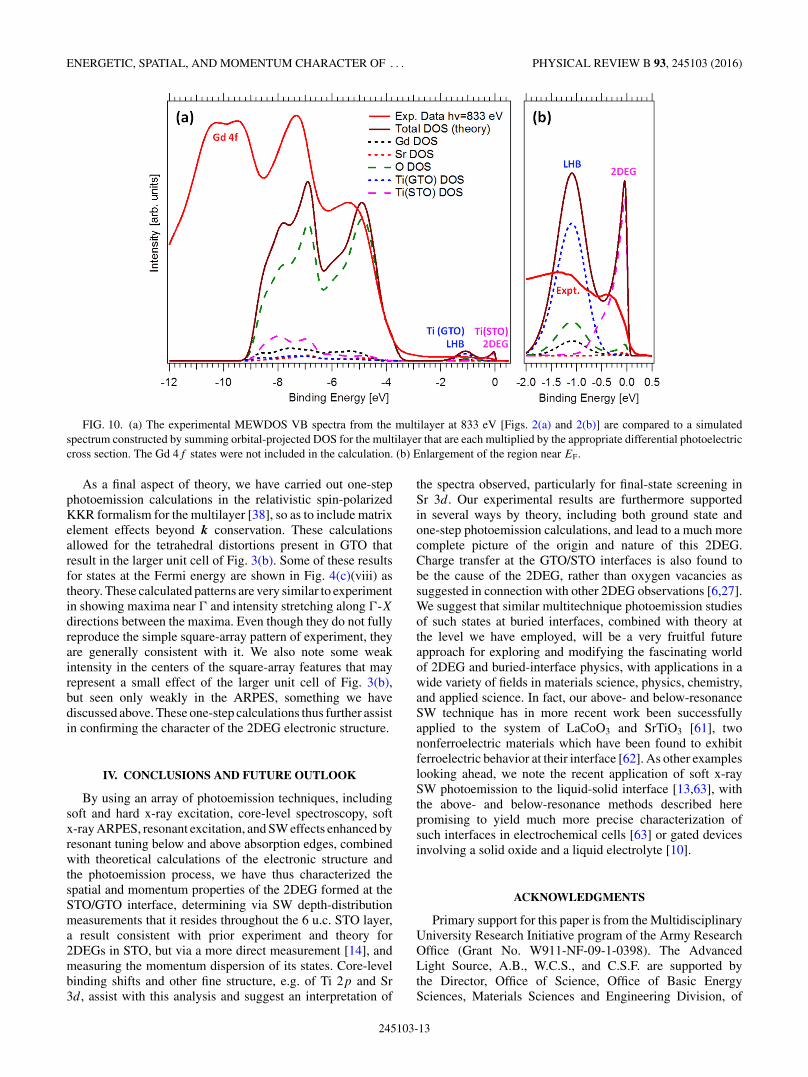
We finally return to the MEWDOS level of looking at ourresults and compare theory to angle-integrated experimentalresults with 833 eV excitation. This is done in Fig. 10, wherethe orbital-projected DOS in the multilayer, including ofcourse the LHB and the 2DEG, have been multiplied by therespective differential atomic photoelectric cross section foreach orbital, and the sum of all contributions is compared to ourexperimental results. The DOS calculated via DFT has beentruncated at EF, and convoluted with a Gaussian of 0.30 eV tosimulate the overall experimental resolution. The agreementas to the main features in experiment and theory is very good,including for the 2DEG and the LHB shown in the blowupof Fig. 10(b). Of course, the Gd 4f bands and their featuresin the experiment are missing from theory, where these statesare treated as core levels, as noted previously. As a furthercomment here, the observation that the experimental relativeintensities of the LHB and the 2DEG are qualitatively similar tothose in theory in Fig. 10(b), although with the LHB weaker inexperiment as judged by relative areas, is due to the experimentsamples states through both the top STO layer and also from theburied GTO layer. More quantitatively, the estimated IMFPsof 22(20) A in STO(GTO) mentioned above indicate that theLHB should be attenuated more by the overlying STO layer.A more accurate way to compare these relative intensitieswould be to allow for the precise depth distribution of both theLHB states in the GTO layers and the 2DEG states in the STOlayers and incorporate inelastic scattering, but even at the levelof Fig. 10, theory and experiment are in very good agreement.
245103-12
ENERGETIC, SPATIAL, AND MOMENTUM CHARACTER OF . . . PHYSICAL REVIEW B 93, 245103 (2016)
FIG. 10. (a) The experimental MEWDOS VB spectra from the multilayer at 833 eV [Figs. 2(a) and 2(b)] are compared to a simulatedspectrum constructed by summing orbital-projected DOS for the multilayer that are each multiplied by the appropriate differential photoelectriccross section. The Gd 4f states were not included in the calculation. (b) Enlargement of the region near EF.
As a final aspect of theory, we have carried out one-stepphotoemission calculations in the relativistic spin-polarizedKKR formalism for the multilayer [38], so as to include matrixelement effects beyond k conservation. These calculationsallowed for the tetrahedral distortions present in GTO thatresult in the larger unit cell of Fig. 3(b). Some of these resultsfor states at the Fermi energy are shown in Fig. 4(c)(viii) astheory. These calculated patterns are very similar to experimentin showing maxima near � and intensity stretching along �-Xdirections between the maxima. Even though they do not fullyreproduce the simple square-array pattern of experiment, theyare generally consistent with it. We also note some weakintensity in the centers of the square-array features that mayrepresent a small effect of the larger unit cell of Fig. 3(b),but seen only weakly in the ARPES, something we havediscussed above. These one-step calculations thus further assistin confirming the character of the 2DEG electronic structure.
IV. CONCLUSIONS AND FUTURE OUTLOOK
By using an array of photoemission techniques, includingsoft and hard x-ray excitation, core-level spectroscopy, softx-ray ARPES, resonant excitation, and SW effects enhanced byresonant tuning below and above absorption edges, combinedwith theoretical calculations of the electronic structure andthe photoemission process, we have thus characterized thespatial and momentum properties of the 2DEG formed at theSTO/GTO interface, determining via SW depth-distributionmeasurements that it resides throughout the 6 u.c. STO layer,a result consistent with prior experiment and theory for2DEGs in STO, but via a more direct measurement [14], andmeasuring the momentum dispersion of its states. Core-levelbinding shifts and other fine structure, e.g. of Ti 2p and Sr3d, assist with this analysis and suggest an interpretation of
the spectra observed, particularly for final-state screening inSr 3d. Our experimental results are furthermore supportedin several ways by theory, including both ground state andone-step photoemission calculations, and lead to a much morecomplete picture of the origin and nature of this 2DEG.Charge transfer at the GTO/STO interfaces is also found tobe the cause of the 2DEG, rather than oxygen vacancies assuggested in connection with other 2DEG observations [6,27].We suggest that similar multitechnique photoemission studiesof such states at buried interfaces, combined with theory atthe level we have employed, will be a very fruitful futureapproach for exploring and modifying the fascinating worldof 2DEG and buried-interface physics, with applications in awide variety of fields in materials science, physics, chemistry,and applied science. In fact, our above- and below-resonanceSW technique has in more recent work been successfullyapplied to the system of LaCoO3 and SrTiO3 [61], twononferroelectric materials which have been found to exhibitferroelectric behavior at their interface [62]. As other exampleslooking ahead, we note the recent application of soft x-raySW photoemission to the liquid-solid interface [13,63], withthe above- and below-resonance methods described herepromising to yield much more precise characterization ofsuch interfaces in electrochemical cells [63] or gated devicesinvolving a solid oxide and a liquid electrolyte [10].
ACKNOWLEDGMENTS
Primary support for this paper is from the MultidisciplinaryUniversity Research Initiative program of the Army ResearchOffice (Grant No. W911-NF-09-1-0398). The AdvancedLight Source, A.B., W.C.S., and C.S.F. are supported bythe Director, Office of Science, Office of Basic EnergySciences, Materials Sciences and Engineering Division, of
245103-13
S. NEMSAK et al. PHYSICAL REVIEW B 93, 245103 (2016)
the US Department of Energy under Contract No. DEAC02-05CH11231. P.M. was supported by the US National ScienceFoundation (NSF) (Grant No. DMR-1006640). The hardX-ray photoemission measurements at Beamline BL15XUof SPring-8 were performed under the approval of NIMSSynchrotron X-ray Station (Proposal No. 2011A4606). Thehard x-ray photoelectron spectra instrument at Petra IIIbeamline P09 is jointly operated by the University of Wurzburg(R. Claessen), the University of Mainz (C. Felser), andDeutsches Elektronen-Synchrotron. Funding by the FederalMinistry of Education and Research under Contracts No.05KS7UM1, No. 05K10UMA, No. 05KS7WW3, and No.05K10WW1 is gratefully acknowledged. A.J. and C.G.V.d.W.were supported by the US Army Research Office (GrantNo. W911-NF-11-1-0232) and L.B. by the NSF MaterialsResearch Science and Engineering Centers Program (GrantNo. DMR-1121053). Computational resources were providedby the Extreme Science and Engineering Discovery Environ-ment supported by NSF (Grants No. ACI-1053575 and No.DMR-07-0072N). S.N. received support in the completion ofthis paper from the Julich Research Center. G.K.P. also thanksthe Swedish Research Council for financial support. A.R. wasfunded by the Royal Thai Government, and C.C. was funded
by the Graduate Assistance in Areas of National Need programthrough University of California Davis Physics Department.C.S.F. has also been supported during the writing of thispaper for salary by the Director, Office of Science, Office ofBasic Energy Sciences, Materials Sciences and EngineeringDivision, of the US Department of Energy under Contract No.DE-AC02-05CH11231, by the Laboratory Directed Researchand Development Program of Lawrence Berkeley NationalLaboratory under the same contract, as well as by Contract No.DE-SC0014697 from DOE Office of Basic Energy Sciences,Materials Science and Engineering Division through theUniversity of California Davis, and by the LabEx PALMprogram Investissements d’Avenir overseen by the FrenchNational Research Agency (ANR) (project: ANR-10-LABX-0039). One-step theory calculations of J.M., J.B., and H.E. aresupported by Bundesministerium fur Bildung und ForschungProject No. 05K13WMA, and J.M. also acknowledges supportby the Centre of New Technologies and Materials (CENTEM)(CZ.1.05/2.1.00/03.0088) and CENTEM PLUS (LO1402),cofunded by the European Regional Development Fund,through the Ministry of Education, Youth and Sports ofthe Czech Republic Operational Programme Research andDevelopment for Innovation Programme.
[1] A. Ohtomo and H. Y. Hwang, A high-mobility electrongas at the LaAlO3/SrTiO3 heterointerface, Nature 427, 423(2004).
[2] J. A. Bert, B. Kalisky, C. Bell, M. Kim, Y. Hikita, H. Y.Hwang, and K. A. Moler, Direct imaging of the coexistenceof ferromagnetism and superconductivity at the LaAlO3/SrTiO3
interface, Nature Phys. 7, 767 (2011).[3] Functional oxide interfaces, a series of articles in the MRS
Bulletin 38, 1017 (2013).[4] A. Brinkman, M. Huijben, M. van Zalk, J. Huijben, U. Zeitler,
J. C. Maan, W. G. van der Wiel, G. Rijnders, D. H. A. Blank,H. Hilgenkamp, Magnetic effects at the interface between non-magnetic oxides, Nat. Mater. 6, 493 (2007).
[5] N. Reynen, S. Thiel, A. D. Caviglia, L. Fitting Kourkoutis,G. Hammerl, C. Richter, C. W. Schneider, T. Kopp, A.-S.Ruetschi, D. Jaccard, M. Gabay, D. A. Muller, J.-M. Triscone,and J. Mannhart, Superconducting interfaces between insulatingoxides, Science 317, 1196 (2007).
[6] G. Berner, M. Sing, H. Fujiwara, A. Yasui, Y. Saitoh, A.Yamasaki, Y. Nishitani, A. Sekiyama, N. Pavlenko, T. Kopp,C. Richter, J. Mannhart, S. Suga, and R. Claessen, Directk-Space Mapping of the Electronic Structure in an Oxide-OxideInterface, Phys. Rev. Lett. 110, 247601 (2013).
[7] L. Bjaalie, B. Himmetoglu, L. Weston, A. Janotti, and C. G. Vande Walle, Oxide interfaces for novel electronic applications,New J. Phys. 16, 025005 (2014).
[8] H. Kroemer, Quasi-electric fields and band offsets: Teachingelectrons new tricks, Int. J. Mod. Phys. B 16, 677 (2002).
[9] The interface is still the device, Editorial, Nat. Mater. 11, 91(2012).
[10] Mingyang Li, Wei Han, Xin Jiang, Jaewoo Jeong, Mahesh G.Samant, and Stuart S. P. Parkin, Suppression of ionic liquid
gate-induced metallization of SrTiO3(001) by oxygen, NanoLett. 13, 4675 (2013).
[11] H. Ohno, Electrochemical Aspects of Ionic Liquids (John Wiley& Sons, Hoboken, NJ, USA, 2011).
[12] G. E. Brown and G. Calas, Mineral-aqueous solution interfacesand their impact on the environment, Geochem. Perspect. 1, 483(2012).
[13] S. Nemsak, A. Shavorskiy, O. Karslioglu, I. Zegkinoglou, A.Rattanachata, C. S. Conlon, A. Keqi, P. K. Greene, E. C. Burks, F.Salmassi, E. M. Gullikson, S.-H. Yang, K. Liu, H. Bluhm, and C.S. Fadley, Chemical-state resolved concentration profiles withsub-nm accuracy at solid/gas and solid/liquid interfaces fromstanding-wave ambient-pressure photoemission, Nature Comm.5, 5441 (2014).
[14] S. Stemmer and S. J. Allen, Two-dimensional electron gases atcomplex oxide interfaces, Ann. Rev. Mater. Res. 44, 151 (2014).
[15] P. Moetakef, J. Y. Zhang, A. Kozhanov, B. Jalan, R. Seshadri,S. J. Allen, and S. Stemmer, Transport in ferromagneticGdTiO3/SrTiO3 heterostructures, Appl. Phys. Lett. 98, 112110(2011).
[16] P. Moetakef, T. A. Cain, D. G. Ouellette, J. Y. Zhang, D. O.Klenov, A. Janotti, C. G. Van de Walle, S. Rajan, S. J. Allen,and S. Stemmer, Electrostatic carrier doping of GdTiO3/SrTiO3
interfaces, Appl. Phys. Lett. 99, 232116 (2011).[17] C. Jackson, P. Moetakef, S. J. Allen, and S. Stem-
mer, Capacitance-voltage analysis of high-carrier-densitySrTiO3/GdTiO3 heterostructures, Appl. Phys. Lett. 100, 232106(2012).
[18] P. Moetakef, J. R. Williams, D. G. Ouellette, A. P. Kajdos,D. Goldhaber-Gordon, S. J. Allen, and S. Stemmer, Carrier-Controlled Ferromagnetism in SrTiO3, Phys. Rev. X 2, 021014(2012).
ENERGETIC, SPATIAL, AND MOMENTUM CHARACTER OF . . . PHYSICAL REVIEW B 93, 245103 (2016)
[19] P. Moetakef, C. A. Jackson, J. Hwang, L. Balents, S. J. Allen, andS. Stemmer, Toward an artificial Mott insulator: Correlations inconfined high-density electron liquids in SrTiO3, Phys. Rev. B86, 201102 (2012).
[20] P. Moetakef, D. G. Ouellette, H. Y. Zhang, T. A. Cain, S. J.Allen, and S. Stemmer, Growth and properties of GdTiO3 filmsprepared by hybrid molecular beam epitaxy, J. Cryst. Growth355, 166 (2012).
[21] G. Conti, A. M. Kaiser, A. X. Gray, S. Nemsak, G. K.Palsson, J. Son, P. Moetakef, A. Janotti, L. Bjaalie, C. S.Conlon, D. Eiteneer, A. A. Greer, A. Keqi, A. Rattanachata,A. Y. Saw, A. Bostwick, W. C. Stolte, A. Gloskovskii, W.Drube, S. Ueda, M. Kobata, K. Kobayashi, C. G. Van deWalle, S. Stemmer, C. M. Schneider, and C. S. Fadley, Bandoffsets in complex-oxide thin films and heterostructures ofSrTiO3/LaNiO3 and SrTiO3/GdTiO3 by soft and hard x-rayphotoelectron spectroscopy, J. Appl. Phys. 113, 143704 (2013).
[22] J. Y. Zhang, J. Hwang, S. Raghavan, and S. Stemmer, SymmetryLowering in Extreme-Electron-Density Perovskite QuantumWells, Phys. Rev. Lett. 110, 256401 (2013).
[23] M. Boucherit, O. F. Shoron, T. A. Cain, C. A. Jackson, S.Stemmer, and S. Rajan, Extreme charge density SrTiO3/GdTiO3
heterostructure field effect transistors, Appl. Phys. Lett. 102,242909 (2013).
[24] J. Y. Zhang, C. A. Jackson, R. Chen, S. Raghavan, P. Moetakef,L. Balents, and S. Stemmer, Correlation between metal-insulatortransitions and structural distortions in high-electron-densitySrTiO3 quantum wells, Phys. Rev. B 89, 075140 (2014).
[25] D. G. Ouellette, P. Moetakef, T. A. Cain, J. Y. Zhang, S. Stemmer,D. Emin, and S. J. Allen, High-density two-dimensional smallpolaron gas in a delta-doped Mott insulator, Scientific Rep. 3,3284 (2013).
[26] M. Boucherit, O. Shoron, C. A. Jackson, T. A. Cain, M. L. C.Buffon, C. Polchinski, S. Stemmer, and S. Rajan, Modulationof over 1014 cm−2 electrons in SrTiO3/GdTiO3 heterostructures,Appl. Phys. Lett. 104, 182904 (2014).
[27] Z. Q. Liu, L. Sun, Z. Huang, C. J. Li, S. W. Zeng, K. Han, W.M. Lu, T. Venkatesan, and Ariando, Dominant role of oxygenvacancies in electrical properties of unannealed LaAlO3/SrTiO3
interfaces, J. Appl. Phys. 115, 054303 (2014).[28] R. Chen, S. Lee, and L. Balents, Dimer Mott insulator in an
oxide heterostructure, Phys. Rev. B 87, 161119 (2013).[29] L. Bjaalie, A. Janotti, B. Himmetoglu, and C. G. Van de Walle,
Turning SrTiO3 into a Mott insulator, Phys. Rev. B 90, 195117(2014).
[30] W. S. M. Werner, W. Smekal, T. Hisch, J. Himmelsbach,and C. J. Powell, Simulation of electron spectra for surfaceanalysis (SESSA) for quantitative interpretation of (hard) x-rayphotoelectron spectra (HAXPES), J. Electron Spectrosc. 190,137 (2013).
[31] C. S. Fadley, Looking deeper: angle-resolved photoemissionwith soft and hard x-rays, Synchr. Rad. News 25, 26 (2012); V. N.Strocov, M. Kobayashi, X. Wang, L. L. Lev, J. Krempasky, V. A.Rogalev, T. Schmitt, C. Cancellieri, and M. L. Reinle-Schmitt,Soft x-ray ARPES at the Swiss Light Source: from 3D materialsto buried interfaces and impurities, ibid. 27, 31 (2014).
[32] A. X. Gray, C. Papp, B. Balke, S.-H. Yang, M. Huijben, E.Rotenberg, A. Bostwick, S. Ueda, Y. Yamashita, K. Kobayashi,E. M. Gullikson, J. B. Kortright, F. M. F. de Groot, G. Rijnders,D. H. A. Blank, R. Ramesh, and C. S. Fadley, Interface
properties of magnetic tunnel junction La0.7Sr0.3MnO3/SrTiO3
superlattices studied by standing-wave excited photoemissionspectroscopy, Phys. Rev. B 82, 205116 (2010).
[33] A. X. Gray, J. Minar, L. Pluczinski, M. Huijben, A. Bostwick,E. Rotenberg, S.-H. Yang, J. Braun, A. Winkelmann, G. Conti,and D. Eiteneer, Momentum-resolved electronic structure at aburied interface from soft x-ray standing-wave angle-resolvedphotoemission, Europhys. Lett. 104, 17004 (2013).
[34] M. J. Bedzyk and G. Materlik, Two-beam dynamical diffractionsolution of the phase problem: a determination with x-raystanding-wave fields, Phys. Rev. B 32, 6456 (1985).
[35] S.-H. Yang, A. X. Gray, A. M. Kaiser, B. S. Mun, J. B.Kortright, and C. S. Fadley, Making use of x-ray opticaleffects in photoelectron-, Auger electron-, and x-ray emissionspectroscopies: total reflection, standing-waves, and resonantexcitation, J. Appl. Phys. 113, 073513 (2013).
[36] J. Heyd, G. E. Scuseria, and M. J. Ernzerhof, Hybrid functionalsbased on a screened Coulomb potential, J. Chem. Phys. 118,8207 (2003).
[37] J. Heyd and G. E. Scuseria, Efficient hybrid density func-tional calculations in solids: assessment of the Heyd-Scuseria-Ernzerhof screened Coulomb hybrid functional, J. Chem. Phys.121, 1187 (2004).
[38] H. Ebert, D. Koedderitzsch, and J. Minar, Calculating condensedmatter properties using the KKR Green’s function method—recent developments and applications, Rep. Prog. Phys. 74,096501 (2011).
[39] R. Courths, J. Noffke, H. Wern, and R. Heise, Photoelectronstudy of SrTiO3: an inspection of core-level binding energieswith the use of a point-ion model and self-consistent atomicstructure calculations, Phys. Rev. B 42, 9127 (1990).
[40] F. de Groot, private communication.[41] V. N. Strocov, X. Wang, M. Shi, M. Kobayashi, J. Krempasky,
C. Hess, T. Schmitt, and L. Patthey, Soft-x-ray ARPES facilityat the ADRESS beamline of the SLS: concepts, technicalrealisation and scientific applications, J. Synchrotron Radiat.21, 32 (2014).
[42] S. A. Chambers, T. C. Droubay, C. Capan, and G. Y.Sun, Unintentional F doping of SrTiO3(001) etched in HFacid-structure and electronic properties, Surf. Sci. 606, 554(2012).
[43] J. Paier, M. Marsman, K. Hummer, G. Kresse, I. C. Gerber,and J. G. Angyn, Screened hybrid density functionals applied tosolids, J. Chem. Phys. 124, 154709 (2006).
[44] C. Franchini, Hybrid functionals applied to perovskites, J. Phys.:Condens. Matter 26, 253202 (2014).
[45] G. Kresse and J. Furthmuller, Efficient iterative schemes forab initio total-energy calculations using a plane-wave basis set,Phys. Rev. B 54, 11169 (1996).
[46] G. Kresse and J. Furthmuller, Efficiency of ab-initio total energycalculations for metals and semiconductors using a plane-wavebasis set, Comput. Mater. Sci. 6, 15 (1996).
[47] P. E. Blochl, Projector augmented-wave method, Phys. Rev. B50, 17953 (1994).
[48] A. Koitzsch, J. Ocker, M. Knupfer, M. C. Dekker, K. Dorr,B. Buchner, and P. Hoffmann, In-gap electronic structureof LaAlO3-SrTiO3 heterointerfaces investigated by soft x-rayspectroscopy, Phys. Rev. B 84, 245121 (2011).
[49] M. Tomic, H. O. Jeschke, and R. Valenti, Unfolding of electronicstructure through induced representations of space groups:
S. NEMSAK et al. PHYSICAL REVIEW B 93, 245103 (2016)
application to Fe-based superconductors, Phys. Rev. B 90,195121 (2014).
[50] L. Lev, J. Krempasky, U. Staub, V. A. Rogalev, T. Schmitt,M. Shi, P. Blaha, A. S. Mishchenko, A. A. Veligzhanin,Y. V. Zubavichus, M. B. Tsetlin, H. Volfova, J. Braun, J.Minar, and V. N. Strocov, Fermi Surface of Three-DimensionalLa1−xSrxMnO3 Explored by Soft-X-Ray ARPES: Rhombohe-dral Lattice Distortion and its Effect on Magnetoresistance,Phys. Rev. Lett. 114, 237601 (2015).
[51] J. Braun, J. Minar, S. Mankovsky, L. Plucinski, V. N. Strocov,N. B. Brookes, C. M. Schneider, C. S. Fadley, H. Ebert, Explor-ing the XPS-limit in hard x-ray angle-resolved photoemissionspectroscopy by fully temperature-dependent one-step theory,Phys. Rev. B 88, 205409 (2013).
[52] J. D. Jackson, Classical Electrodynamics, Third Edition (Wiley,New York, NY, USA, 1999), pp. 332–333.
[53] B. L. Henke, E. M. Gullikson, and J. C. Davis, X-ray interac-tions: photoabsorption, scattering, transmission, and reflectionat E = 50–30,000 eV, Z = 1–92, At. Data. Nucl. Data Tables54, 181 (1993).
[54] S. Nemsak, G. Conti, G. K. Palsson, C. Conlon, S. Cho, J.Avila, M.-C. Asensio, C. Jackson, P. Moetakef, A. Janotti,L. Bjaalie, B. Himmetoglu, C. G. Van de Walle, L. Balents,C. M. Schneider, S. Stemmer, and C. S. Fadley, Obser-vation by resonant angle-resolved photoemission of a crit-ical thickness for 2-dimensional electron gas formation inSrTiO3 embedded in GdTiO3, Appl. Phys. Lett. 107, 231602(2015).
[55] M. van Veenendaal, Competition between screening channelsin core-level x-ray photoemission as a probe of changes in theground-state properties of transition-metal compounds, Phys.Rev. B 74, 085118 (2006).
[56] C. W. Lin, A. Posadas, T. Hadamek, and A. A. Demkov, Final-state effect on x-ray photoelectron spectrum of nominally d1 and
n-doped d0 transition metal oxides, Phys. Rev. B 92, 035110(2015).
[57] C. Suzuki, T. Mukoyama, J. Kawai, and H. Adachi, Calculationfor the charge-transfer effect of La compounds in the 3d−1 core-hole state, Phys. Rev. B 57, 9507 (1998).
[58] G. van der Laan, Polaronic satellites in x-ray absorption spectra,Phys. Rev. B 41, 12366 (1990).
[59] A. F. Santander-Syro, O. Copie, T. Kondo, F. Fortuna, S. Pailhes,R. Weht, X. G. Qiu, F. Bertran, A. Nicolaou, A. Taleb-Ibrahimi,P. Le Fevre, G. Herranz, M. Bibes, N. Reyren, Y. Apertet, P.Lecoeur, A. Barthelemy, and M. J. Rozenberg, Two-dimensionalelectron gas with universal subbands at the surface of SrTiO3,Nature 469, 189 (2011).
[60] W. Meevasana, P. D. C. King, R. H. He, S-K. Mo, M. Hashimoto,A. Tamai, P. Songsiriritthigul, F. Baumberger, and Z-X. Shen,Creation and control of a two-dimensional electron liquid at thebare SrTiO3 surface, Nat. Mater. 10, 114 (2011).
[61] R. B. Comes, S.-C. Lin, C.-T. Kuo, S. M. Heald, S. R. Spurgeon,D. M. Kepaptsoglou, Q. M. Ramasse, M. Engelhard, J. Rault,S. Nemsak, P. Sushko, S. A. Chambers, and C. S. Fadley,Application of resonant standing-wave soft- and hard- XPSand ARPES to the ferroelectric LaCrO3/SrTiO3 interface, tobe published.
[62] S. A. Chambers, L. Qiao, T. C. Droubay, T. C. Kaspar, B. W.Arey, and P. V. Sushko, Band Alignment, Built-In Potential,and the Absence of Conductivity at the LaCrO3/SrTiO3 (001)Heterojunction, Phys. Rev. Lett. 107, 206802 (2011).
[63] O. Karslıoglu, S. Nemsak, I. Zegkinoglou, A. Shavorskiy, M.Hartl, F. Salmassi, E. M. Gullikson, M. L. Ng, Ch. Rameshan,B. Rude, D. Bianculli, A. A. Cordones-Hahn, S. Axnanda,E. J. Crumlin, P. N. Ross, C. M. Schneider, Z. Hussain, Z. Liu,C. S. Fadley, and H. Bluhm, Aqueous solution/metal interfacesinvestigated in operando by photoelectron spectroscopy, FaradayDiscuss. 180, 35 (2015).


![Review Article Diffuse Scattering from Lead-Containing ...downloads.hindawi.com/journals/isrn/2013/107178.pdf · scattering are relatively rare, for example DNS at J ulich¨ [ ],DattheInstitutLaueLangevin[](https://static.documents.pub/doc/80x56/5f74d09c196a1e221173d3f0/review-article-diffuse-scattering-from-lead-containing-scattering-are-relatively.jpg)


