28
Energex Smart Network Trials 1

Energex Smart Network Trials
1

Agenda
Power line carrier trials
Low voltage network management trial

Why did we do a PRIME trial
Low cost technologySame cost as a electronic meter without communications
Active mapping of the LV network
Solution to our edge network problem
Organic / targeted rollout
Open standards with multi vendor interoperability – no lock in
Next Generation PLC, not trialled outside of Europe
PRIME Meter Manufacturers
Open standards, low risk, multiple vendors
What is PRIME
Plug & Play active two‐way mesh network
Distribution transformer to customer network
Back‐haul from distribution transformer using any available communications (Fibre, LTE etc)
Operates in the upper CENELEC A Band
Enable organic rolloutsLow cost
Value of PRIME PLC
Accurate natural network connectivity including phase identification
Guaranteed delivery
No wireless spectrum required
Reduced risk from cyber security with encryption and segmented communications architecture
Concentrator provides both Dist Trans monitoring and Prime meter data collection facilities.
Low cost, low risk, meets business requirements
Trial Details ‐ Newmarket
Deployment on 3 distribution transformer areas 2 x O/H and 1 x U/G
SP2280‐I 70 / 116 customers with Prime meters Circuit distances ( Max ~352m)
O/H Open Wire
SP5861‐E 30 / 106 customers with Prime meters Circuit Distances (Max ~338m)
O/H ABC + open wire
SP549015 38 / 57 customers with Prime Meters Circuit Distances (Max ~374m)
U/G residential estate with 1 O/H transition to TX
Works in multiple network topologies
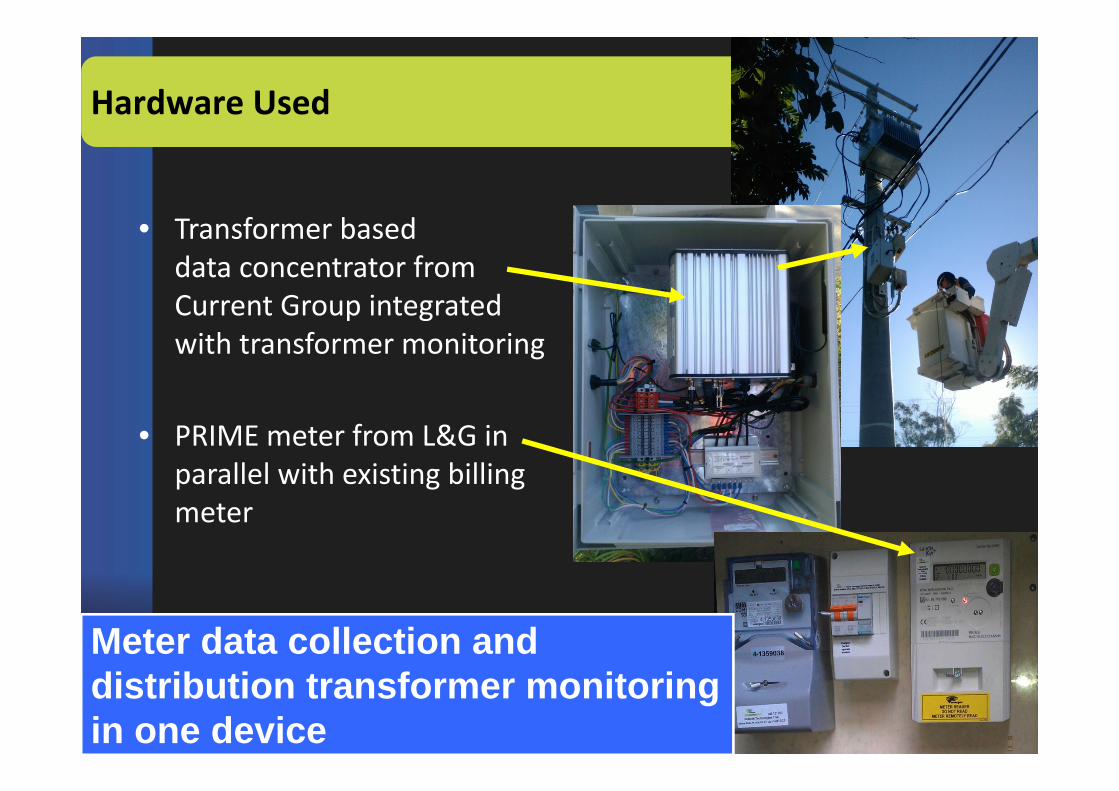
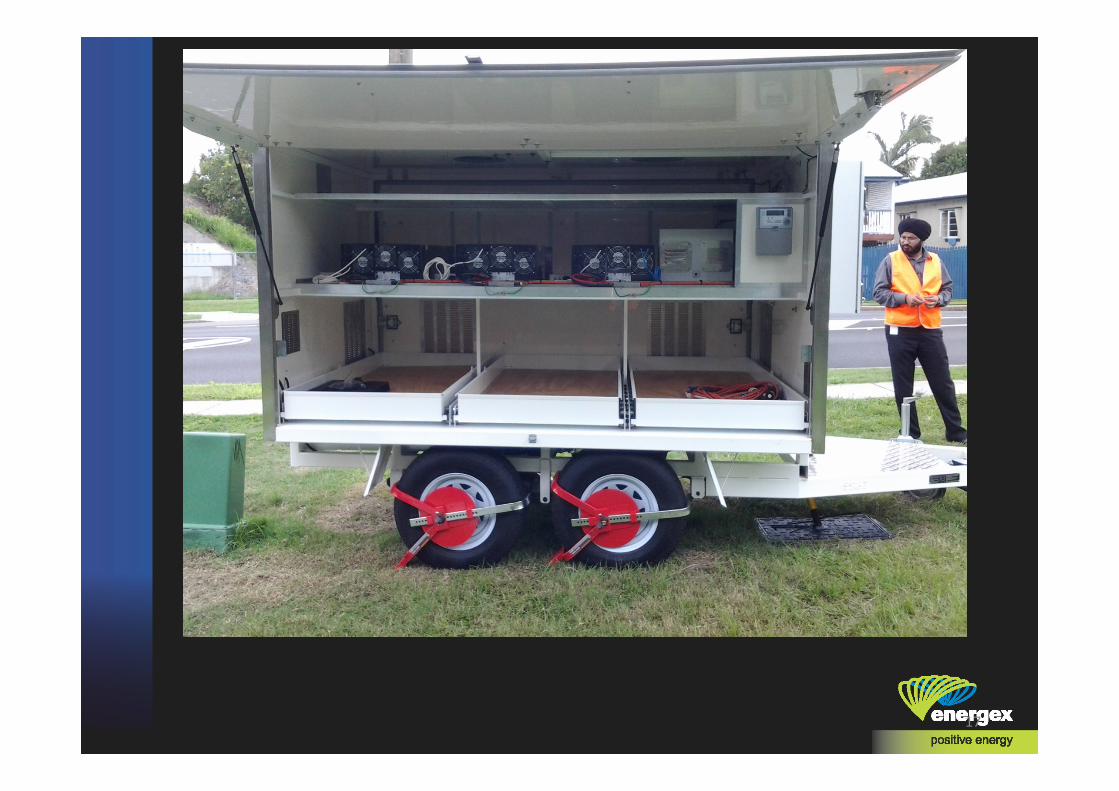
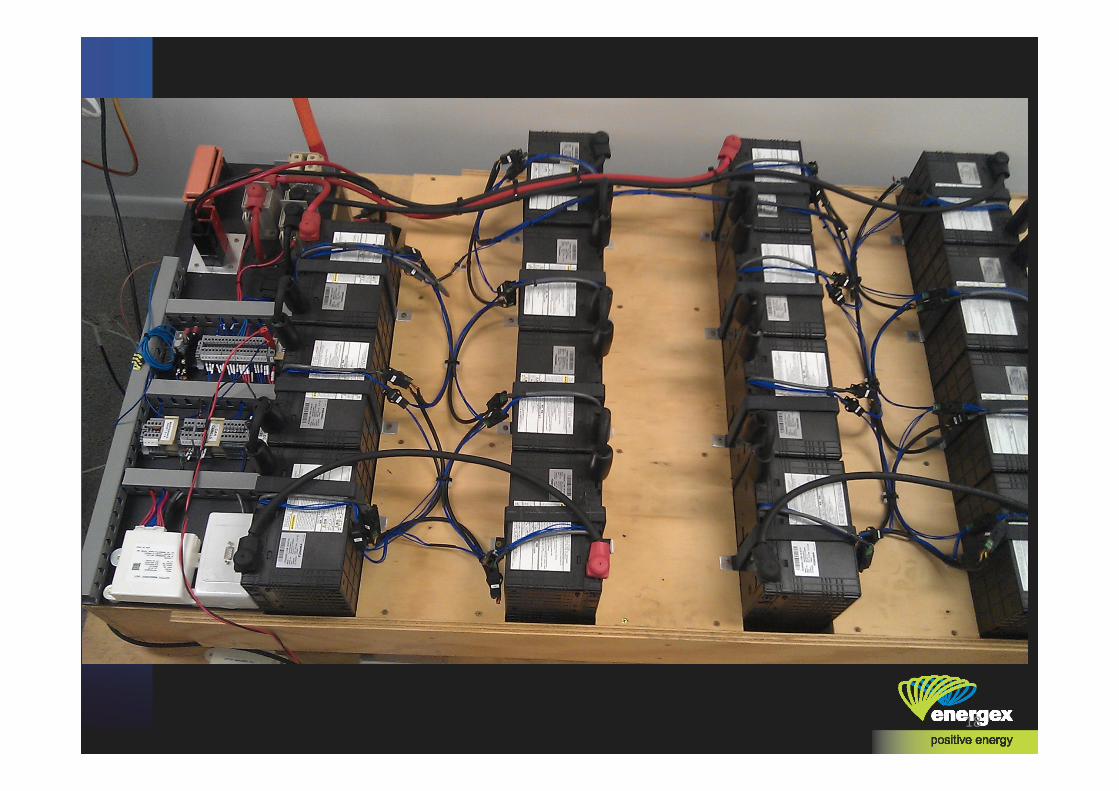
Hardware Used
• Transformer based data concentrator from Current Group integrated with transformer monitoring
• PRIME meter from L&G in parallel with existing billing meter
Meter data collection and distribution transformer monitoring in one device
Trial Results
Tested volume is an order of magnitude higher than those required to meet the National Smart Meter Specification
Protocol is guaranteed delivery
Results apply to both overhead and underground networks
Majority of responses under 5 secs

Test Results – Duration –SP5861‐E
Old F/W
New F/W

Test Results – Availability –SP5861‐E
Summary
Mapping the LV network with phase identification
New firmware loaded on meters remotely improved performance
Optimisation not undertaken to date, however multiple strategies are available (repeaters etc)
Data speeds sufficient to national specification
Enables autonomous distributed intelligence at a distribution transformer ( ie local load control matched to actual local load / voltage / state)
Results are very positive from initial trials

LV Networks and the use of STATCOMs
12

Why did we do a LV management trial
Drivers for LV Management
~50% of Energex’s network is low voltage
Performance of LV network is unquantified
Distribution transformer monitoring rollout is providing valuable information on LV side at distribution transformer (DT)
>2000 Distribution transformer monitoring installations
Increasing PV penetration causing greater voltage variability
Future will see EVs & customer energy storage in low voltage networks
Traditional ‘static’ engineering solutions may not be the most cost effective solution. New technologies present opportunities
Understand the state of the LV Network
LV Management Objectives
Quantify the power quality of the LV network
Reduce peak‐demand by utilising storage
Develop computer models of the LV network (validated against field data)
Understand the benefits of “Grid” Distributed Energy Resources:(voltage regulation, power factor, unbalance, losses, sags/swells)
Determine optimum size, placement and control of Grid DER
Simulate clustered PV, EV, customer energy storage
Assess network and customer impacts and values of a transition to a 230V network. ( INC kWh, Demand and Network Losses impacts)
Assess the size of the problem, now and for the future.Cater for future customer choices

LV Active Management Trial Overview
Remote meters installed at 150 customers providing 1min sampled data ‐ voltage, current, phase, THD
Grid DER in the trial area: Two sites with 3x20kVA Statcoms (4 quadrant)
with 50kWh batteries
Control algorithms and methodologies based on sampled data to determine optimum Statcom size, placement & operation
Experiment with kW & VAr injection to better manage the LV network voltage regulation, power factor, unbalance, losses, sags/swells
Detailed measurementsFlexible device to rectify problems

16
Trial Area
17
18

Learning’s to date
Voltage variation along LV circuits are becoming more difficult to manage
Voltage unbalance is very evident, Many TX have more than 20V phase differential at times.
Some TX have rising voltage profile at times due to Solar PV
Existing phase allocation procedures do not provide the most optimal load balance conditions.
Higher proportion of customer loads are now Constant Power Devices (CPD) (switch modes, A/C, Pumps)
CVR Opportunities have been eroded by CPD’s
Transformer power factor has changed
Voltage management problems will continue to grow into the future

Statcom Terminal Voltage During Operation
0
50
100
150
200
225
230
235
240
245
250
6/04/2013 19:12 7/04/2013 0:00 7/04/2013 4:48 7/04/2013 9:36 7/04/2013 14:24 7/04/2013 19:12 8/04/2013 0:00
Voltage Ph-A AvgVoltage Ph-B AvgVoltage Ph-C AvgCurrent Ph-A AvgCurrent Ph-B AvgCurrent Ph-C Avg
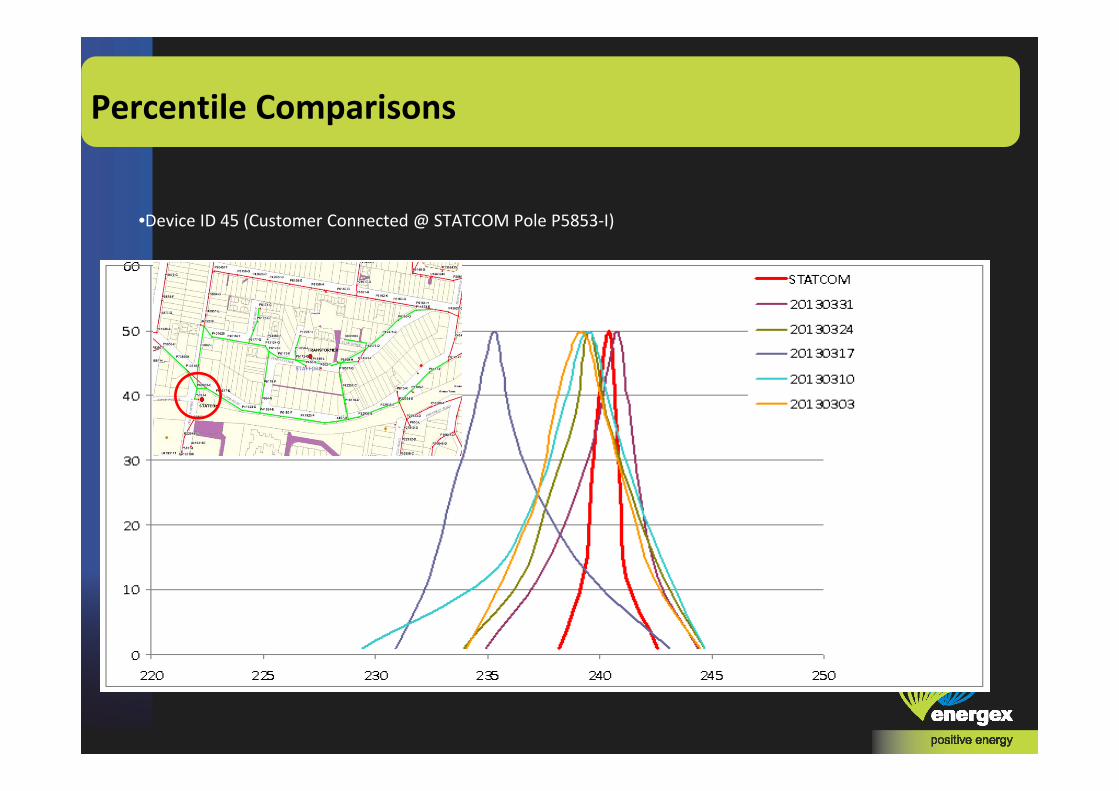
Percentile Comparisons
•Device ID 45 (Customer Connected @ STATCOM Pole P5853‐I)

Percentile Comparisons
•Device ID 3255 (Customer Connected @ Distribution Transformer P4548‐L)
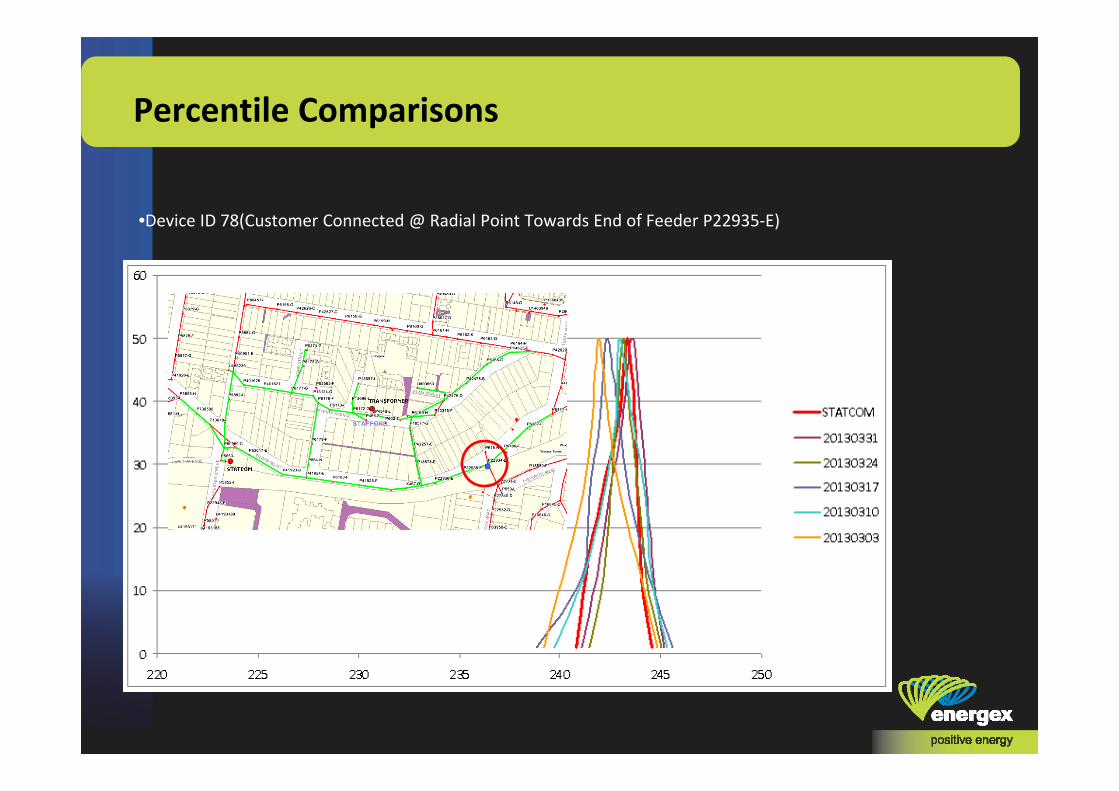
Percentile Comparisons
•Device ID 78(Customer Connected @ Radial Point Towards End of Feeder P22935‐E)
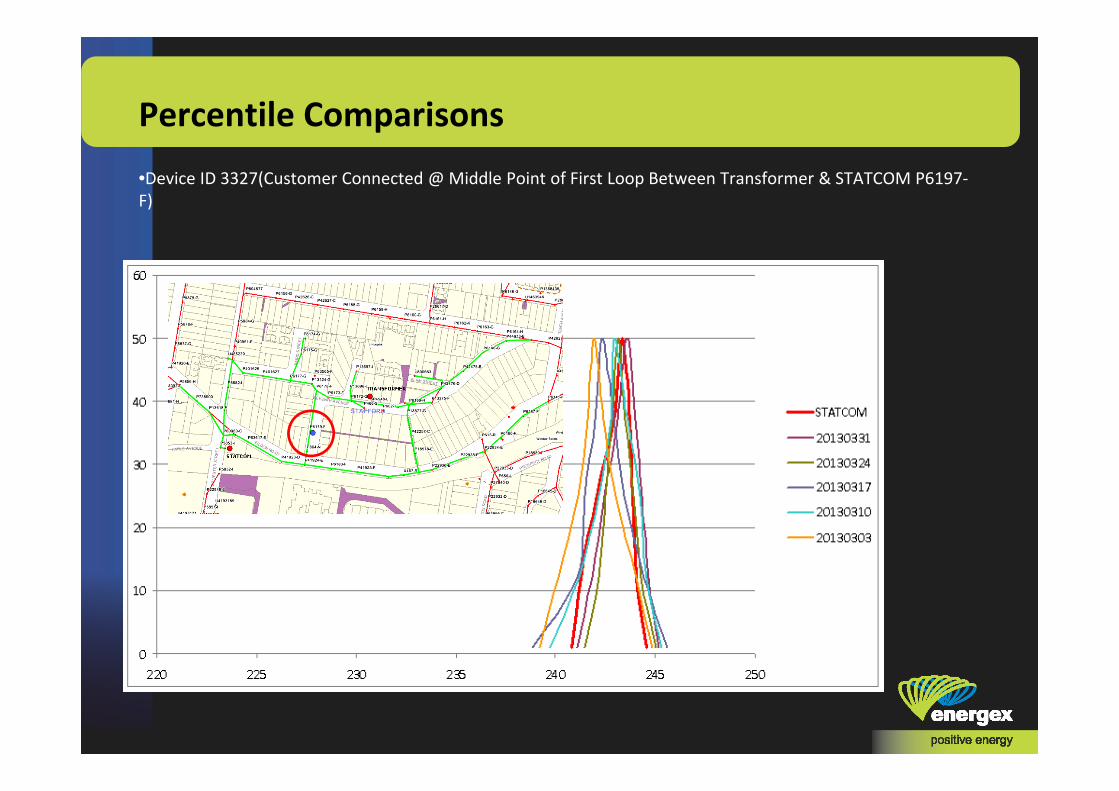
Percentile Comparisons•Device ID 3327(Customer Connected @ Middle Point of First Loop Between Transformer & STATCOM P6197‐F)

Percentile Comparisons
•Device ID 48(Customer Connected @ Furthest Distance from Distribution Transformer P738500)

Percentile Comparisons•Device ID 3308 (Customer Connected Next to 3kW PV System P6141‐H)
Summary
LV Management initiative: Understand performance of the existing LV network
Apply Grid DER to improve voltage regulation, unbalance, losses, power quality
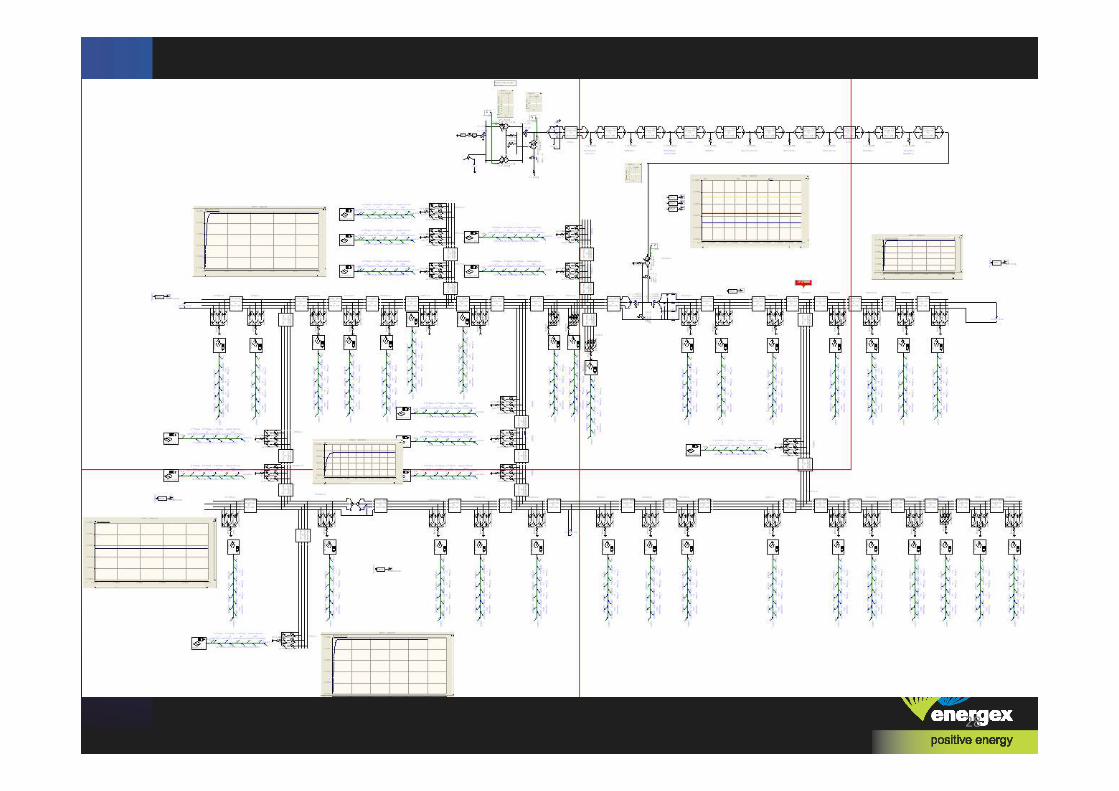
PSCAD network model completed linked to actual 1min meter data
Next steps: 2 Grid DER systems currently being installed in the field
Continue trials and modelling
Develop revised LV planning, management and design tools
Accurate models developed usingdata collected from the field.
28


![[PPT]PowerPoint Presentation - IEEEewh.ieee.org/r10/calcutta/comsoc/Lecture/200407/ppb.pps · Web viewAccurate field measurement should be made in urban area and the measured data](https://static.documents.pub/doc/80x56/5ac3f1d97f8b9a12608c8723/pptpowerpoint-presentation-viewaccurate-field-measurement-should-be-made-in.jpg)


