Energies 2015, 8, 5266-5286; doi:10.3390/en8065266 energies ISSN 1996-1073 www.mdpi.com/journal/energies Article Quantitative Vulnerability Assessment of Cyber Security for Distribution Automation Systems Xiaming Ye 1 , Junhua Zhao 2, *, Yan Zhang 1 and Fushuan Wen 3 1 College of Electrical Engineering, Zhejiang University, Hangzhou 310027, China; E-Mails: [email protected] (X.Y.); [email protected] (Y.Z.) 2 School of Electrical Engineering and Computer Science, the University of Newcastle, Newcastle, NSW 2308, Australia 3 Department of Electrical and Electronic Engineering, Institut Teknologi Brunei, Bandar Seri Begawan BE1410, Brunei; E-Mail: [email protected]* Author to whom correspondence should be addressed; E-Mail: [email protected]; Tel.: +86-571-8795-3133; Fax: +86-571-8795-2869. Academic Editor: Thorsten Staake Received: 19 March 2015 / Accepted: 25 May 2015 / Published: 3 June 2015 Abstract: The distribution automation system (DAS) is vulnerable to cyber-attacks due to the widespread use of terminal devices and standard communication protocols. On account of the cost of defense, it is impossible to ensure the security of every device in the DAS. Given this background, a novel quantitative vulnerability assessment model of cyber security for DAS is developed in this paper. In the assessment model, the potential physical consequences of cyber-attacks are analyzed from two levels: terminal device level and control center server level. Then, the attack process is modeled based on game theory and the relationships among different vulnerabilities are analyzed by introducing a vulnerability adjacency matrix. Finally, the application process of the proposed methodology is illustrated through a case study based on bus 2 of the Roy Billinton Test System (RBTS). The results demonstrate the reasonability and effectiveness of the proposed methodology. Keywords: smart grid; distribution automation system; cyber security; vulnerability assessment OPEN ACCESS
* Author to whom correspondence should be addressed; E-Mail: [email protected];
Tel.: +86-571-8795-3133; Fax: +86-571-8795-2869.
Academic Editor: Thorsten Staake
Received: 19 March 2015 / Accepted: 25 May 2015 / Published: 3 June 2015
Abstract: The distribution automation system (DAS) is vulnerable to cyber-attacks due to
the widespread use of terminal devices and standard communication protocols. On account
of the cost of defense, it is impossible to ensure the security of every device in the DAS.
Given this background, a novel quantitative vulnerability assessment model of cyber security
for DAS is developed in this paper. In the assessment model, the potential physical
consequences of cyber-attacks are analyzed from two levels: terminal device level and
control center server level. Then, the attack process is modeled based on game theory and
the relationships among different vulnerabilities are analyzed by introducing a vulnerability
adjacency matrix. Finally, the application process of the proposed methodology is illustrated
through a case study based on bus 2 of the Roy Billinton Test System (RBTS). The results
demonstrate the reasonability and effectiveness of the proposed methodology.
Keywords: smart grid; distribution automation system; cyber security;
vulnerability assessment
OPEN ACCESS
Energies 2015, 8 5267
1. Introduction
The seamless merging of traditional power systems with cutting-edge information technologies has
become an inevitable trend in smart grids [1,2]. In a power distribution system, with the help of advanced
information technologies and intelligent feeder remote terminal units (FRTU), a distribution automation
system (DAS) is able to provide higher reliability, greater efficiency and intensive interactions with
consumers [3].
Nonetheless, the adoption of common communication protocols and deployment of various
intelligent electronic devices (IED) introduces more vulnerabilities which can be used by cyber
attackers [4]. Moreover, the tighter integration of cyber systems and physical power systems can easily
lead to cyber-attacks that can degrade control performance or even cause power outages in a smart
grid [5,6]. Thus, knowing how to deal with the cyber security issues of smart grids has become a new
challenge. Some basic guidelines for cyber security have been published [7,8] and some studies on the
cyber security of power control systems have been carried out in the past few years [9–14].
The existence of exploitable vulnerabilities is the precondition for cyber-attacks.
However, most of the existing cyber security studies focus on the control systems in power plants or
substations. In these studies, the intelligent terminal devices are usually located in restricted areas. On
the contrary, the terminal devices in a DAS are usually located at remote areas with limited physical
protection, e.g., FRTUs [15]. These terminal devices act as widespread real-time monitors and intelligent
controllers in a distribution system, and can exchange measurement data and control commands with the
DAS control center server through communication network in normal operations. As for cyber-attacks,
an attacker can penetrate FRTUs or other terminal devices via the modems between them and the
communication network. On account of the limited computational capacity, most of the effective security
measures found in computer networks cannot be used directly in the terminal devices [16]. Moreover,
the intelligent terminal devices in a DAS will support more open and standardized communication
protocols such as IEC 61850 in the near future [17]. For these reasons, the DAS is more vulnerable to
cyber-attacks and therefore the security issues in a DAS should be properly addressed.
It is worth noting that ensuring the complete security of every single device in the DAS is hardly
possible from the point of view of the cost of implementing the security measures [18]. Thus, an
assessment framework for vulnerability ranking in a DAS is urgently required. The common
vulnerability scoring system (CVSS) provides an open framework for vulnerability assessment [19]. It
evaluates the impacts of vulnerabilities in computer networks from three aspects: base, temporal and
environmental. However, the CVSS scores each vulnerability independently. It cannot analyze the
impacts of cyber- attacks on physical systems, and does not take the interactions among different
vulnerabilities into consideration. Ten [11] proposed an assessment framework to evaluate the
vulnerability of supervisory control and data acquisition (SCADA) systems. Zonous [13] presented a
unified formalism to model cyber-physical systems and proposed a vulnerability ranking method
according to the potential physical consequences as well as attack complexity. However, these researches
mainly focus on the cyber-attacks against power transmission systems and the interaction between
attackers and defenders has not been analysed.
This paper focuses on the vulnerability assessment issue in a DAS. The purposes are to study the
potential physical consequences of cyber-attacks on a DAS and to help system operators rank the
Energies 2015, 8 5268
vulnerabilities so as to more effectively enhance the cyber security of a DAS. The main contribution of
this paper is proposing an original vulnerability assessment model to rank the vulnerabilities in a DAS
based on potential consequences of cyber-attacks and the relationship among different vulnerabilities.
Specifically, the potential physical consequences of cyber-attacks are discussed from two aspects:
terminal devices and control center servers. The attack processes are modeled as a series of
attack-defense games (ADGs) and relationships among different vulnerabilities are analyzed by
introducing vulnerability adjacency matrix.
The rest of this paper is organized as follows: Section 2 presents the overall process of vulnerability
assessment. Section 3 analyzes the physical consequences of cyber-attacks. Section 4 and Section 5 build
the game model and introduce the vulnerability adjacency matrix to analyze the relationship among
vulnerabilities, respectively. A case study based on bus 2 of the Roy Billinton Test System (RBTS) is
used to illustrate how to apply the proposed method in Section 6. Finally, some conclusions are given in
Section 7.
2. Outline of Methodology
The assessment methodology can be divided into three parts: physical consequences analysis, attack
processes modeling and vulnerability adjacency matrix formation.
2.1. Physical Consequences
Potential consequences of cyber-attacks include revealing utilities’ and consumers’ private
information, economic losses, and loss of load [18]. This paper mainly focuses on the control
performance of the DAS, so the physical consequences are assessed by the quantity of loss of load and
its duration.
A successful cyber-attack will result in a violation of all or part of the security properties (the integrity,
availability, and confidentiality) [20]. Loss of different security properties leads to different physical
consequences. Loss of integrity renders attackers the ability to change the control commands or
measurement data. For instance, an attacker can send modified control commands to trip the switches in
a distribution system, or send incorrect measurement data to misguide the decision-making of control
strategies, both of which will result in unnecessary loss of load. Loss of availability renders the operators
unable to collect measurement data or control the terminal devices, but it would not lead to severe
physical consequences directly and immediately [21]. For example, a denial of service (DoS) attack on
a relay protection IED will not affect the normal operation of a distribution system until a fault occurs.
Confidentiality is usually the main concern in terms of personal privacy [22] and the leakage of system
settings can ultimately lead to integrity or availability attacks [23]. However, compared with integrity
and availability, loss of confidentiality will not affect the control performance of the DAS directly in
most cases [15]. Thus, the physical consequences of cyber-attacks on confidentiality are not the research
emphasis of this paper.
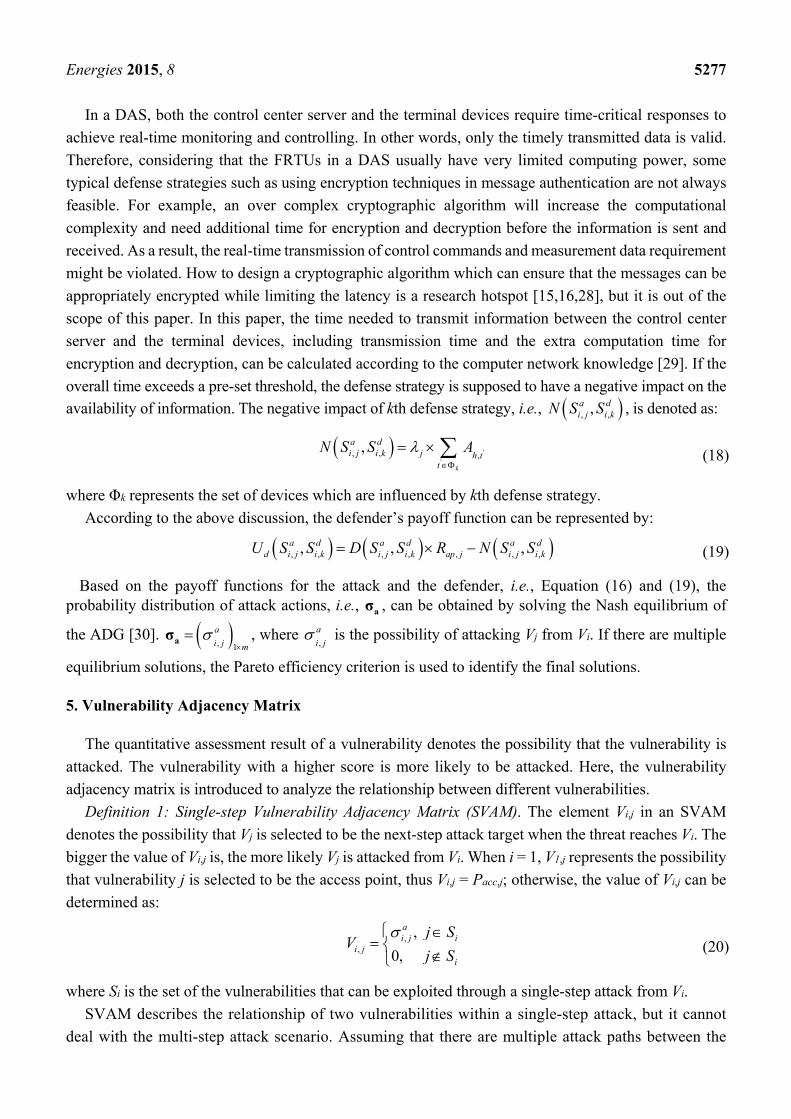
A DAS consists of a control center, terminal devices and a communication network. The
communication architecture of a DAS is depicted in Figure 1. Except for the remote monitoring and
control under normal operations, the fault detection, isolation and restoration are the most important
Energies 2015, 8 5269
functions in a DAS which can enhance the reliability of a distribution system. There are primarily two
restoration schemes in distribution systems [24,25], both of which will be discussed in Section 3.
Figure 1. DAS communication architecture.
2.2. Attack Process
In order to launch a successful attack, the attackers have to first look for exploitable access points,
and then hack other vulnerabilities in the network based on the entry at the access point.
2.2.1. Selecting Access Point
In a DAS, potential access points include the servers in a control center as well as the intelligent
terminal devices located in remote areas. The terminal devices are usually deployed in remote areas with
little physical protection and many of them do not even require a password for authentication [18], while
the servers are typically isolated within an electronic security perimeter [12], so it is usually easier to
get access to the vulnerabilities in terminal devices than those in control center servers. On the other
hand, the exploitation of the vulnerabilities in the servers usually results in severer physical
consequences. Thus, the possibility of selecting different vulnerabilities to be access point varies.
2.2.2. Hacking Other Vulnerabilities
The second stage of an attack can be modeled as a series of two-person ADGs. The attacker intends
to cause the severest physical consequences, while the defender (i.e., the system operators) aims at
minimizing this loss. Thus, the game discussed in this paper is basically a non-cooperative ADG. In the
ADGs, payoffs for the attacker and the defender are the uppermost elements which are related to the
potential physical consequences, vulnerability information and the topology of the distribution system.
The Nash equilibrium of the game indicates the attack’s attack intention and the optimal defense strategy.
The specific analysis method will be presented comprehensively in Section 4.
The overall process of the quantitative vulnerability assessment for a DAS is shown as Figure 2. The
vulnerability adjacency matrix is used to analyze the relationship among different vulnerabilities and
will be discussed in Section 5.
Energies 2015, 8 5270
Figure 2. Overall process of vulnerability assessment.
3. Physical Consequences Analysis
Based on the discussion in Section 2.1, the physical consequences caused by loss of integrity and
availability are analyzed from two levels: terminal devices and control center server. Moreover, both of
the normal and fault work condition are considered in this paper.
As shown in Figure 3, a typical multi-sectioned and multi-linked distribution system is given for
understanding the potential physical consequences of cyber-attacks. In Figure 3, CB, L, F, S, T represents
the circuit breaker, the load, the FRTU, the section switch and the tie switch, respectively. Every switch
and circuit breaker is monitored and controlled by control center through an FRTU. The main feeder is
divided into several feeder sections by the circuit breaker and other switches.
Figure 3. Multi-sectioned and multi-linked network of a distribution system.
When a fault occurs, there are two schemes to implement the restoration function: centralized feeder
automation (Scheme 1) and agent-based feeder automation (Scheme 2). As for Scheme 1, all the
information will be sent to the control center server from FRTUs, and the server performs fault detection,
isolation, and restoration. In Scheme 2, an FRTU can exchange information with its neighbor FRTUs to
detect and isolate the fault area. The FRTU of the feeder breaker (i.e., F0 in
Figure 3) collects information from other FRTUs in feeder h, communicates with the FRTUs of the
breakers in its neighbor feeders (i.e., the feeders that are connected with feeder h through tie switches),
and then performs restoration function to the power outage area.
Energies 2015, 8 5271
3.1. Terminal Devices
3.1.1. FRTUs of Section Switches
Control commands and measurement data are the core information being exchanged in a DAS. The
control commands are mainly used to operate switches, while the measurement data is used for
decision-making. Thus, the consequence caused by loss of integrity in FRTUs of section switches can be
determined by:
, , ,
C Mh i h i h i
I I I (1)
where Ih,i represents the consequence caused by loss of integrity in Fh,i and Fh,i is the ith FRTU in main feeder h;
,
C
h iI and
,
M
h iI denotes the consequence caused by loss of control command integrity and
measurement data integrity in Fh,i respectively.
Loss of control commands integrity or measurement data integrity allows an attacker to modify the
corresponding information. The modification of control information will result in loss of load directly.
For example, a command injection attack on F4 can trip section switch S4 and therefore cause the loss
of load L5. With the help of fault detection, isolation and restoration, the power supply to L5 can be
restored automatically in several minutes. Thus, the consequence caused by integrity loss of control
command is described as:
,,1
NhC
h j hh ij i
I t
(2)
,
,
h j k kk Sh j
L
(3)
where Ωh,j is the impact factor of the loads in the jth feeder section of feeder h; th is the duration of power
outage which is equal to the time needed to apply restoration function in feeder h; Nh is the number of
feeder sections in feeder h; Lk and ωk represents the loading level and the importance of kth load
respectively; Sh,j is the set of loads in jth feeder section of feeder h. The importance of load represents
the comprehensive influence on personal and property safety, which is on a scale of 1–5 [26]. The more
important the load is, the higher it scores.
The modification of measurement data will mislead the DAS to make an improper control decision.
Let us take the measurement data in F2 as an example. When a fault occurs between S1 and S2, S1
experiences a fault current while S2 does not. The correct actions include disconnecting S1 and S2, and
closing tie switches to restore power supply to the rest of the distribution system. However, if the
measurement data in F2 is tampered, the control center server (in Scheme 1) or agent-based FRTUs
(in Scheme 2) would mistakenly believe that S2 experiences a fault current and therefore disconnect S2
and S3. Moreover, CB1 cannot be reclosed as a result that the fault has not been isolated. Thus, L1 and
L3 will be wrongly removed compared to the correct control actions. On the other hand, if the fault
occurs between S2 and S3, the manipulation of measurement data in F2 may mislead the control center
server or agent-based FRTUs into believing that S2 does not experience a fault current. Consequently,
S1 and S2 will be disconnected, and therefore L2 will be left in blackout. Furthermore, because of the
fault has not been isolated, fault current appears again in the neighbor feeder (i.e., feeder h′) which
Energies 2015, 8 5272
supplies electricity to L3 after restoration. Therefore, the loads which need to be restored in feeder h and
the loads in feeder h′ will experience outage for some time until the fault is finally isolated by another
fault diagnosis process. Based on this discussion, the consequence caused by loss of measurement data
integrity can be represented by:
'
' '
1
, , , , , , , 1 , , 1 , ,1 2 1
h hNNi
Mh i h i h j h j h i h i h i h i h i h k h g h
j k i g
I T T T t
(4)
where γh,i is the failure rate of the ith feeder section of feeder h; Th,i is the time required to repair the
permanent failure in ith feeder section of feeder h; Nh′ is the number of feeder sections in feeder h′; th′
is the time needed to apply restore function in feeder h′. If the fault occurs in the last feeder section, set
th′ = 0 because there is no need to close tie switches in this circumstance.
As for availability, it ensures both the control center server and the FRTUs to get the requested
information in time. Loss of availability would result in expanding the blackout area. For example, if the
trip commands cannot reach S2 when a fault occurs between S1 and S2, S1 and S3 will be disconnected
in order to isolate the fault. As a result, L3 will lose electricity additionally.
Therefore, the physical consequence caused by loss of availability in FRTUs of section switches can
be denoted as:
, , , 1 , , 1 , , 1h i h i h i h i h i h i h iA T T (5)
where Ah,i denotes the consequences caused by loss of availability in Fh,i.
3.1.2. FRTUs of Tie Switches
Tie switches are normally open switches. This enables power wheeling in normal operation and fault
restoration. A cyber-attack on the FRTU of a tie switch can result in loss of load. For example, if a fault
occurs between S1 and S2, while T1 cannot be closed because of the commands from F5 is modified or
not received, just closing T2 may not be able to fully restore the blackout area due to the system constraints.
Therefore, the consequence caused by loss of control commands integrity or availability in FTRUs of
tie switches can be denoted as:
1
, , ,1, ,
Nh
h i h j h j k k tieh S j k Stie i cut h
I T L i S
(6)
1
, , ,1, ,
Nh
h i h j h j k k tieh S j k Stie i cut h
A T L i S
(7)
where Stie is the set of tie switches; Stie,i is the set of main feeders which can be connected by ith tie
switch; Scut,h is the set of the loads that cannot be restored when a fault occurs in feeder h.
In the above equations, the load with a higher importance usually has a higher priority in restoration.
Thus, Scut,h can be confirmed by Algorithm 1. In this algorithm, SΔ is the set of loads that need to be
restored by closing tie switches; Pl is the redundant capacity of other feeders; Ψ is a temporary variable; is the number of the power consumers in SΔ.
SN
Energies 2015, 8 5273
Algorithm 1. LoadCut
Input: SΔ, Pl
Output: Scut,h
begin sorting the loads in SΔ according to its importance; for i = 1 to SN
do
P P S i ;
end if lP P then
return ,cut hS ;
end 1j ;
for i = 1 to do
S i ;
if lP then
, ( ) ( )cut hS j S i ;
( )S i ;
1j j ;
end
end
end
3.1.3. FRTU of Feeder Breaker
The FRTU of a feeder breaker plays different roles in different restoration schemes. In Scheme 1, the
control center server performs the isolation and restoration strategies. F0 (i.e., the FRTU of feeder
breaker in feeder h) does not communicate with other FRTUs. The consequence caused by loss of
integrity in F0 is similar with that of FRTUs of section switches:
, , ,1
Nh
h i h j h h CBj
I t i S
(8)
where Sh,CB is the set of feeder breakers in feeder h.
If the close command cannot reach CB1 after fault isolation, the loads in the source side of feeder h
will remain in blackout. Thus, the consequence caused by loss of availability in the FRTU of a feeder
breaker can be represented as:
1
, , , , ,2 1
hN j
h i h j h j h k h CBj k
A T i S
(9)
In Scheme 2, F0 makes the restoration strategy and sends commands to other FRTUs. A modified
command from F0 to trip CB1 may lead to blackout in feeder h. On the other hand, if a fault occurs in
the neighbor feeder of feeder h, F0 may send a tampered response to misguide the neighbor feeder into
SN
Energies 2015, 8 5274
believing that feeder h does not have extra power to restore the outage loads. In other words, feeder h is
unable to provide restoration power to its neighbor feeders. Therefore, in Scheme 2, the consequence
caused by loss of integrity in F0 can be confirmed by:
1'
, , ' ', ,'1 1 ', ,
NNh h
h i h j h k kh g h gj g k Sh Snei h cut h
I t T L
(10)
where Snei,h denotes the set of neighbor feeders of feeder h.
If the service of F0 is not available when a fault occurs, the loads will remain in outage as a result of
CB1 and tie switches have not been closed. Furthermore, feeder h′ cannot get restoration power from
feeder h because it cannot get the necessary information from F0. Thus, in Scheme 2, the consequence
caused by loss of availability in F0 can be confirmed by:
1'
, , , , ' ', ,'1 1 1 ', ,
NN Nh h h
h i h j h j h l k kh g h gj l g k Sh Snei h cut h
A T T L
(11)
3.2. Control Center Server
The control center server performs supervisory control to the distribution system in normal operation,
and plays different roles when a fault occurs according to different schemes.
In Scheme 1, the control center server is in charge of making control decisions and sending control
commands to the FRTUs when a fault occurs. If the control center server is attacked, the loss of control
commands integrity can result in blackout of the entire distribution system. Thus:
,1
Nh
ctrl h j serverh S jF
I T
(12)
Where Ictrl is the consequence caused by loss of information integrity in control center server; SF is the
set of feeders; Tserver is the time needed to recover the control center server.
If the control center server is not available to formulate control strategies, the fault will not be
removed and the loads in the fault feeder will remain in outage. Thus, the consequence caused by loss
of information availability in control center server (i.e., Actrl) can be represented as:
, , ,1 1
h h
F
N N
ctrl h i h i h jh S i j
A T
(13)
In Scheme 2, the agent-based FRTUs are in charge of fault detection, isolation and restoration. Loss
of availability in a control center server will not affect fault isolation and loads restoration. In other
words, an attack on the availability of a control center server will not result in loss of load, so Actrl = 0.
However, the control center server can still trip or close the switches through remote control in normal
operations. Thus, the physical consequence caused by loss of integrity in control center server in this
scheme is determined by Equation (12).
Energies 2015, 8 5275
4. DAS Vulnerability Assessment Model
4.1. Selecting Access Point
Both the FRTUs and the control center server in the DAS can be used as initial access points by
attackers. The possibility of selecting a specific vulnerability to be access point is mainly related to two
factors: (1) the difficulty of getting access to a specific vulnerability; (2) the potential physical
consequences of successful exploitation of a vulnerability.
The metrics of access difficulty are shown in Table 1. The greater the difficulty is, the lower the
metric value will be. Table 1 reflects the reality that comprehensive physical protection and network
isolation are helpful to prevent a vulnerability from being attacked.
Table 1. Access Difficulty Scoring Evaluation.
Metric value Description
0.2 A vulnerability is of comprehensive physical protection and is local exploitable only. 0.5 A vulnerability is of comprehensive physical protection and is remotely exploitable. 0.8 A vulnerability is of little physical protection and is local exploitable only. 1.0 A vulnerability is of little physical protection and is remotely exploitable.
After getting access to the access point, the attackers can launch a further attack by taking advantages
of the vulnerabilities in other devices. As a matter of fact, the exploitation of a vulnerability does not
always result in the complete loss of integrity and availability. Different vulnerabilities have different
impacts on the security properties. For the vulnerability i in device t, the potential physical consequence
after being attacked takes the following form:
T,vul i i t iR α C (14)
In Equation (14), Rvul,i denotes the potential physical consequence if vulnerability i (i.e., Vi) is
successfully exploited; λi measures the complexity to exploit Vi, its reference value is provided by the
Access Complexity metric in CVSS [19]; Ct = [Ih,t Ah,t] (if t belongs to terminal devices) or Ct = [Ictrl Actrl]
(if t is a control center server) is a vector of a specific device t which includes two aspects of potential
physical consequences; αi = [αint,i αavail,i] is a logical array, where αint,i and αavail,i represent whether an
attack on Vi will result in loss of integrity and availability in device t respectively. If the exploitation of
Vi does have an impact on the loss of integrity or availability, the corresponding element is assigned to 1,
otherwise the element is assigned to 0.
Therefore, the possibility of selecting Vi to be access point (i.e., Pacc,i) can be represented as follows:
, ,
, ,,
,
0 ,
ap i vul iacc
ap j vul jacc i j Sacc
acc
R Ri S
R RP
i S
(15)
where Rap,i and Rap,j represent the difficulty to get access to Vi and Vj respectively; Sacc is the set of
potential access points in a DAS.
Energies 2015, 8 5276
4.2. Hacking Other Vulnerabilities
After penetrating an access point, an attacker can get sensitive information about surrounding devices
such as device settings and vulnerability information for a next-step attack. As mentioned above, the
relationship between the attacker and the system operator can be modeled as a two-person ADG. The
attacker’s strategy is to select an attack target, and the defender’s strategy is to take a defense action. In
order to predict the probability distribution of attack actions and defense strategies that reasonable attacker
and defender would take, the attacker’s payoff and defender’s payoff should be analyzed elaborately.
The maximal payoff for an attacker by attacking Vj in device t’ can be calculated according to
Equation (14). However, the attacker can barely get the maximal payoff because of the defense strategies
and access difficulty. Suppose an attack is launched from Vi, the set of attacker’s strategy and defender’s
strategy can be denoted as , 1
i ai ja m
S S
and , 1
i dd i k n
S S
respectively, where ,ai jS represents the
strategy of attacking Vj, ,di kS represents using kth defense strategy.
The payoff function for an attacker, i.e., , ,,a da i j i kU S S , can be represented as follows:
, , , , , ,, ,a d a da i j i k vul j i j i k ap jU S S R D S S R
(16)
where , ,,a di j i kD S S represents the positive impact of the defense strategy ,
di kS when the attacker takes
the strategy ,ai jS . The quantitative method of , ,,a d
i j i kD S S will be presented in the following text.
Because of the real-time requirement of DAS operations and the limited computing power in terminal
devices, some common secure methods such as message authentication may have disruptive effects on
the normal operation of a DAS [8,27], so both the positive and negative impacts of a specific defense
strategy should be taken into consideration in formulating the payoff function for a defender.
The positive impact refers to the defense reward against an attack, i.e., the reduction of attacker’s
payoff through deploying a defense strategy. Different defense strategies lead to different defense
effects. For example, message authentication contributes to checking data integrity. Therefore, the
positive impact could be denoted as follows:
, , ',a di j i k j k jt
D S S Tα β C (17)
In Equation (17), ∧ represents the logical AND operation which performs the logical operation on
each element of array αj and array βk; βk = [βint,k βavail,k] is a logical array, where βint,k and βavail,k represent whether defense strategy ,
di kS contributes to enhance the integrity and availability, respecively. If ,
di kS
effectively enhances the integrity or availability, the corresponding element is set to be 1, otherwise it
will be 0.
The negative impacts of a defense strategy mainly include loss of availability of devices and other
costs of deploying the defense strategy. In practice, the overall cost of deploying defense strategies in a
DAS is usually constrained, so we need to rank the vulnerabilities and then enhance the DAS cyber
security in a more effective way, i.e., according to the ranking list. While the cost of deploying the
defense strategy for a single device is not a major concern in calculating the defender’s payoff. For
example, if a defense strategy can significantly increase the cyber security of the DAS, it should be used
even if it requires a high cost to deploy.
Energies 2015, 8 5277
In a DAS, both the control center server and the terminal devices require time-critical responses to
achieve real-time monitoring and controlling. In other words, only the timely transmitted data is valid.
Therefore, considering that the FRTUs in a DAS usually have very limited computing power, some
typical defense strategies such as using encryption techniques in message authentication are not always
feasible. For example, an over complex cryptographic algorithm will increase the computational
complexity and need additional time for encryption and decryption before the information is sent and
received. As a result, the real-time transmission of control commands and measurement data requirement
might be violated. How to design a cryptographic algorithm which can ensure that the messages can be
appropriately encrypted while limiting the latency is a research hotspot [15,16,28], but it is out of the
scope of this paper. In this paper, the time needed to transmit information between the control center
server and the terminal devices, including transmission time and the extra computation time for
encryption and decryption, can be calculated according to the computer network knowledge [29]. If the
overall time exceeds a pre-set threshold, the defense strategy is supposed to have a negative impact on the
availability of information. The negative impact of kth defense strategy, i.e., , ,,a di j i kN S S , is denoted as:
'
', , ,
,k
a di j i k j h t
t
N S S A
(18)
where Φk represents the set of devices which are influenced by kth defense strategy.
According to the above discussion, the defender’s payoff function can be represented by:
, , , , , , ,, , ,a d a d a dd i j i k i j i k ap j i j i kU S S D S S R N S S
(19)
Based on the payoff functions for the attack and the defender, i.e., Equation (16) and (19), the probability distribution of attack actions, i.e., aσ , can be obtained by solving the Nash equilibrium of
the ADG [30]. , 1
a
i j m
aσ , where
,
a
i j is the possibility of attacking Vj from Vi. If there are multiple
equilibrium solutions, the Pareto efficiency criterion is used to identify the final solutions.
5. Vulnerability Adjacency Matrix
The quantitative assessment result of a vulnerability denotes the possibility that the vulnerability is
attacked. The vulnerability with a higher score is more likely to be attacked. Here, the vulnerability
adjacency matrix is introduced to analyze the relationship between different vulnerabilities.
Definition 1: Single-step Vulnerability Adjacency Matrix (SVAM). The element Vi,j in an SVAM
denotes the possibility that Vj is selected to be the next-step attack target when the threat reaches Vi. The
bigger the value of Vi,j is, the more likely Vj is attacked from Vi. When i = 1, V1,j represents the possibility
that vulnerability j is selected to be the access point, thus Vi,j = Pacc,j; otherwise, the value of Vi,j can be
determined as:
,,
,
0,
ai j i
i j
i
j SV
j S
(20)
where Si is the set of the vulnerabilities that can be exploited through a single-step attack from Vi.
SVAM describes the relationship of two vulnerabilities within a single-step attack, but it cannot
deal with the multi-step attack scenario. Assuming that there are multiple attack paths between the
Energies 2015, 8 5278
source node (Vi) and the destination node (Vj), the possibilities of selecting different paths can be
calculated by Algorithm 2. This algorithm traverses all the nodes based on depth first search strategy,
where Ei,j is the set of attack paths between Vi and Vj, Pi,j is the set of the possibilities of selecting different
paths. Some rings which will result in repetitive computation of the quantitative results may occur in attack paths during traversing. Thus, we use π to store the nodes in the attack path, iV π . If the next-
step attack node nV π , the iterative process will be stopped. Pπ is the possibility of selecting the path.
In order to get Ei,j and Pi,j, the initial values of π and Pπ are Vi and 1, respectively.
Algorithm 2. FindPaths Input: SVAM, Vj, π, Pπ
Output: Ei,j, Pi,j
begin Vlast the last node in π;
,i jE ;
if Vlast == Vj then
,i jE π ;
,i jP P π ;
return ,i jE and ,i jP ;
end
for each child node of i in SVAM do if , 0i mV and mV π then
// Vnext is the set of next-step attackable nodes.
Vnext ← Vm;
end
end for each n nextV V
add Vn to the bottom of π; (Ei,j, Pi,j) = FindPaths (SVAM, Vj, π, Pπ×SVAM(Vlast, Vn));
end
end
The statistical data of cyber-attacks shows that the length of an attack path is usually shorter than
10 steps. Therefore, the attacks which need more than 10 attack steps should be removed from Ei,j. In
conclusion, the quantitative result of Vj, i.e., Qj, can be denoted as:
1,
1,
j
kj j
k E
Q P
(21)
where 1,kjP denotes the possibility of attacking Vj through kth path.
6. Case Studies
The IEEE RBTS bus 2 distribution system [31] is introduced here to illustrate how to apply the
proposed assessment model. Both the scenarios of Scheme 1 and Scheme 2 are simulated. Simulation
results demonstrated the effectiveness of the method.
Energies 2015, 8 5279
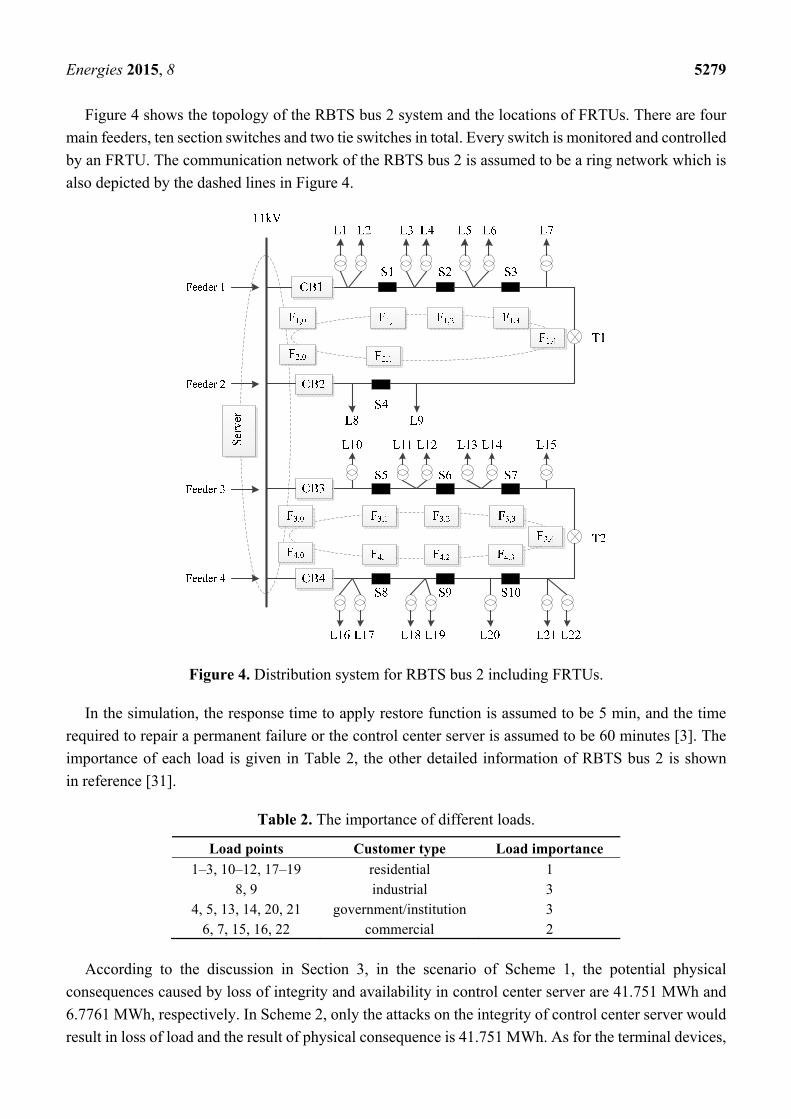
Figure 4 shows the topology of the RBTS bus 2 system and the locations of FRTUs. There are four
main feeders, ten section switches and two tie switches in total. Every switch is monitored and controlled
by an FRTU. The communication network of the RBTS bus 2 is assumed to be a ring network which is
also depicted by the dashed lines in Figure 4.
Figure 4. Distribution system for RBTS bus 2 including FRTUs.
In the simulation, the response time to apply restore function is assumed to be 5 min, and the time
required to repair a permanent failure or the control center server is assumed to be 60 minutes [3]. The
importance of each load is given in Table 2, the other detailed information of RBTS bus 2 is shown
Thus, by attacking vulnerability 17, the attacker can get a payoff up to 34.4563 MWh and
29.6425 MWh in Scheme 1 and Scheme 2, respectively. For other vulnerabilities, the maximal payoffs
for the attacker are depicted in Figure 6. Obviously, an attacker can cause greater losses by attacking
vulnerability 17 than others.
Energies 2015, 8 5281
Table 3. Information of vulnerabilities.
Vul. No. Affiliated IEDs Identifier Type of Vulnerability AC
1 F1,0 CVE-2011-4034 Get administrator rights 0.61 2 F1,1 CVE-2012-0258 Get administrator rights 0.61 3 F1,2 CVE-2013-3528 Get administrator rights 0.71 4 F1,3 CVE-2012-0258 Get administrator rights 0.61 5 F1,4 CVE-2012-3847 Denial of Service 0.71 6 F2,0 CVE-2011-4034 Get administrator rights 0.61 7 F2,1 CVE-2012-3847 Denial of Service 0.71 8 F3,0 CVE-2011-4034 Get administrator rights 0.61 9 F3,1 CVE-2011-4056 Unauthorized access 0.61
10 F3,2 CVE-2011-4056 Unauthorized access 0.61 11 F3,3 CVE-2011-4056 Unauthorized access 0.61 12 F3,4 CVE-2012-3847 Denial of Service 0.71 13 F4,0 CVE-2011-4034 Get administrator rights 0.61 14 F4,1 CVE-2012-0258 Get administrator rights 0.61 15 F4,2 CVE-2013-3528 Get administrator rights 0.71 16 F4,3 CVE-2012-0258 Get administrator rights 0.61 17 Central Server CVE-2011-4514 Privilege escalation 0.71 18 Central Server CVE-2012-3847 Denial of Service 0.71
Figure 6. Maximal payoffs of attacking different vulnerabilities.
In a DAS, all the FRTUs and the control center server are potential access points. In general, the
control center server is located in the control station and the FRTUs of circuit breakers are located in
substations, both of which are well protected in restricted areas. Other FRTUs are located in remote areas
with limited physical protection. Therefore, the access difficulty and the possibility that a specific
vulnerability is selected to be access point are shown in Table 4. As calculated above, an attacker can
cause the severest physical consequence by attacking vulnerability 17. So, as seen in this table, the
possibility of selecting vulnerability 17 to be access point is much higher than others.
After penetrating access points, an attacker can launch further attacks. Some commonly used defense
strategies [32] are used in this study. The detailed information of these countermeasures is described in
Table 5. Updating patches are helpful to enhance the overall security properties.
1 Message authentication Check the integrity of information 2 Update patch 1 Patches for Vul. No. 17 3 Update patch 2 Patches for Vul. No. 5, 7, 12, and 18 4 Update patch 3 Patches for Vul. No. 9, 10, and 11 5 No countermeasures None defense measures are deployed
The possibility that a specific vulnerability is selected to be the next-step attack node can be calculated
by solving the Nash equilibrium of an ADG. For example, in Scheme 2, when the attacker penetrates
into vulnerability 1 successfully, the attackable nodes by a single-step attack include vulnerability 2
to vulnerability 6. According to the analysis in Section 4.2, the Nash equilibrium for attacker is σa =
(0, 0.5211, 0, 0.4789, 0), which means that the possibility of choosing vulnerability 3 and vulnerability
5 to be the next-step attack nodes are 0.5211 and 0.4789 respectively.
Based on the analysis of selecting access points and the relationship among different vulnerabilities,
we can get the final quantitative results of all vulnerabilities which are shown in Table 6 and Figure 7.
Table 6. Quantitative results of vulnerabilities in different schemes.