265
Energy STATISTICAL POCKETBOOK 2017 energy in figures EU ISSN 1977-4559

Energy
STATISTICAL POCKETBOOK 2017
energyin figures
EU
ISSN 1977-4559

Manuscript completed in 07/2017
Neither the European Commission nor any person acting on behalf of the
Commission is responsible for the use that might be made of the following
information.
Luxembourg: Publications Office of the European Union, 2017
© European Union, 2017
Reuse is authorised provided the source is acknowledged.
The reuse policy of European Commission documents is regulated by Decision
2011/833/EU (OJ L 330, 14.12.2011, p. 39).
Credits all images ©Shutterstock
For any use or reproduction of photos or other material that is not under the EU
copyright, permission must be sought directly from the copyright holders.
Print ISBN 978-92-79-70448-2 ISSN 1977-4559 doi:10.2833/16497 MJ-AB-17-001-EN-C
PDF ISBN 978-92-79-70449-9 ISSN 2363-247X doi:10.2833/80717 MJ-AB-17-001-EN-N
Epub ISBN 978-92-79-70231-0 ISSN 2363-247X doi:10.2833/743352 MJ-AB-17-001-EN-E

1
EU ENERGY IN FIGURES 2017
Introduction
The energy sector is one of the pillars of growth, competitiveness and
development for modern economies. To keep up with the ongoing trans-
formation of the energy sector in Europe, we need data that is accurate
and up-to-date.
This publication provides an overview of the most relevant annual energy-
related statistics for the European Union as a whole and for each of its
Member States.
The data contained in this pocketbook is drawn from several sources: from
the European Commission’s services, from international organisations
such as the European Environment Agency and the International Energy
Agency and also from the European Commission’s estimates when other
data is unavailable.
The publication is divided into five parts:
Part 1. Energy overview at global and EU levels.
Part 2. Main energy indicators, at EU and Member States levels.
Part 3. Socio-economic indicators in the EU.
Part 4. Impact of the energy sector on the environment.
Part 5. Country profiles – Main energy indicators.
Indicators have been calculated using the methodology established by the
European Commission – DG Energy. The appendices include a glossary and
methodological notes.
This publication was produced using the most recently available data.
Corrections and updates will be published at: http://ec.europa.eu/energy/
en/data-analysis/energy-statistical-pocketbook
Recommended sources of data:
European Commission websites:
DG Energy
Pocketbook: http://ec.europa.eu/energy/en/data-analysis/energy-statistical-pocketbook
Country statistics: http://ec.europa.eu/energy/en/data-analysis/country
Energy data and analysis: http://ec.europa.eu/energy/en/data-analysis
Eurostat
Eurostat Database: http://ec.europa.eu/eurostat/data/database
DG Economic and Financial Affairs
AMECO: http://ec.europa.eu/economy_finance/db_indicators/ameco/index_en.htm
DG Climate Action
Climate strategies, targets and progress reports:
http://ec.europa.eu/clima/policies/strategies/index_en.htm
Websites of other organisations:
European Environment Agency
Data and maps: http://www.eea.europa.eu/
International Energy Agency
Statistics and balances: http://www.iea.org/stats/index.asp
Please send your comments on this publication and suggestions for improvement to
[email protected], with the word ‘Pocketbook’ in the subject line.

2
Statistical pocketbook 2017
Summary
PART 1 Overview
1.1 Energy in the World (Overview) . . . . . . . . . . . . . . . . . . . . . . . . . . . . . . . . . . . . . . . . . . . 10
1.1.1 World Energy Production by Region . . . . . . . . . . . . . . . . . . . . . . . . . . . . . . . . . . . 10
1.1.2 World Energy Production by Fuel . . . . . . . . . . . . . . . . . . . . . . . . . . . . . . . . . . . . . . 11
1.1.3 World Gross Inland Consumption by Region . . . . . . . . . . . . . . . . . . . . . . . . . 12
1.1.4 World Gross Inland Consumption by Fuel. . . . . . . . . . . . . . . . . . . . . . . . . . . . . 13
1.1.5 World Final Energy Consumption by Region . . . . . . . . . . . . . . . . . . . . . . . . . . 14
1.1.6 World Final Energy Consumption by Fuel . . . . . . . . . . . . . . . . . . . . . . . . . . . . . 15
1.1.7 World Electricity Generation by Fuel . . . . . . . . . . . . . . . . . . . . . . . . . . . . . . . . . . 16
1.1.8 World Heat Generation by Fuel . . . . . . . . . . . . . . . . . . . . . . . . . . . . . . . . . . . . . . . . . 17
1.1.9 World CO2 Emissions by Region . . . . . . . . . . . . . . . . . . . . . . . . . . . . . . . . . . . . . . . . 18
1.1.10 World CO2 Intensity by Region . . . . . . . . . . . . . . . . . . . . . . . . . . . . . . . . . . . . . . . . . . 19
1.2 Energy in the EU (Overview) . . . . . . . . . . . . . . . . . . . . . . . . . . . . . . . . . . . . . . . . . . . . . . . . 20
1.2.1 EU-28 Energy Flow – 1995 . . . . . . . . . . . . . . . . . . . . . . . . . . . . . . . . . . . . . . . . . . . . . 20
1.2.2 EU-28 Energy Flow – 2015 . . . . . . . . . . . . . . . . . . . . . . . . . . . . . . . . . . . . . . . . . . . . . 21
1.2.3 EU-28 Gross Inland Consumption . . . . . . . . . . . . . . . . . . . . . . . . . . . . . . . . . . . . . . 22
1.2.4 EU-28 Energy Import Dependency . . . . . . . . . . . . . . . . . . . . . . . . . . . . . . . . . . . . 24
1.2.5 EU-28 Energy Import Dependency – Net Imports . . . . . . . . . . . . . . . . . . . 25
1.2.6 EU-28 Imports by Country of Origin . . . . . . . . . . . . . . . . . . . . . . . . . . . . . . . . . . . 26
1.3 EU 2020 Targets . . . . . . . . . . . . . . . . . . . . . . . . . . . . . . . . . . . . . . . . . . . . . . . . . . . . . . . . . . . . . . . . 27
1.3.1 Renewable Energy Targets . . . . . . . . . . . . . . . . . . . . . . . . . . . . . . . . . . . . . . . . . . . . . . 27
1.3.2 Renewable Energy Shares. . . . . . . . . . . . . . . . . . . . . . . . . . . . . . . . . . . . . . . . . . . . . . . 29
1.3.3 GHG Emissions Targets . . . . . . . . . . . . . . . . . . . . . . . . . . . . . . . . . . . . . . . . . . . . . . . . . . 30
PART 2 Energy in the EU
2.1 Energy Supply. . . . . . . . . . . . . . . . . . . . . . . . . . . . . . . . . . . . . . . . . . 35
2.1.1 Production . . . . . . . . . . . . . . . . . . . . . . . . . . . . . . . . . . . . . . . . . . . . . . . . . . . . . . . . . . . . . . . . . 35
2.1.2 Net Imports . . . . . . . . . . . . . . . . . . . . . . . . . . . . . . . . . . . . . . . . . . . . . . . . . . . . . . . . . . . . . . . . 38
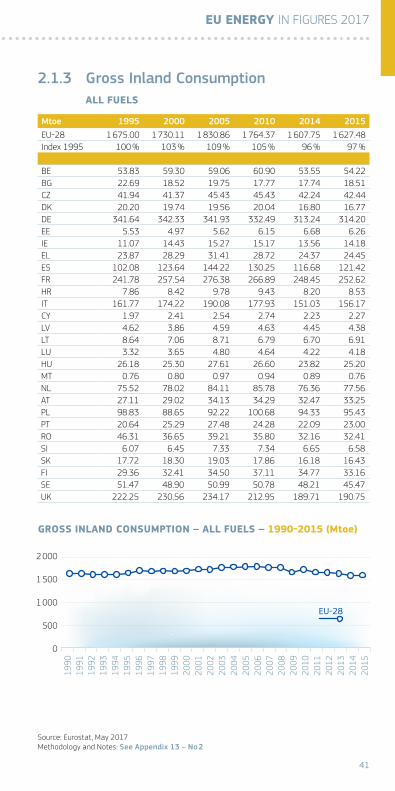
2.1.3 Gross Inland Consumption . . . . . . . . . . . . . . . . . . . . . . . . . . . . . . . . . . . . . . . . . . . . . . 41
2.2 Energy Imports . . . . . . . . . . . . . . . . . . . . . . . . . . . . . . . . . . . . . . . . . 45
2.2.1 Imports – Solid Fuels . . . . . . . . . . . . . . . . . . . . . . . . . . . . . . . . . . . . . . . . . . . . . . . . . . . . 45
2.2.2 Imports – Petroleum and Products . . . . . . . . . . . . . . . . . . . . . . . . . . . . . . . . . . . . 50
2.2.3 Imports – Gases . . . . . . . . . . . . . . . . . . . . . . . . . . . . . . . . . . . . . . . . . . . . . . . . . . . . . . . . . . 55
2.2.4 Imports – Electricity . . . . . . . . . . . . . . . . . . . . . . . . . . . . . . . . . . . . . . . . . . . . . . . . . . . . . 59
2.2.5 Imports by Country of Origin . . . . . . . . . . . . . . . . . . . . . . . . . . . . . . . . . . . . . . . . . . . 63

3
EU ENERGY IN FIGURES 2017
2.3 Energy Import Dependency . . . . . . . . . . . . . . . . . . . . . . . . . . . . . . 66
2.3.1 Import Dependency – All Fuels . . . . . . . . . . . . . . . . . . . . . . . . . . . . . . . . . . . . . . . . 66
2.3.2 Import Dependency – By Fuel . . . . . . . . . . . . . . . . . . . . . . . . . . . . . . . . . . . . . . . . . . 67
2.3.3 Import Dependency – Solid Fuels . . . . . . . . . . . . . . . . . . . . . . . . . . . . . . . . . . . . . 68
2.3.4 Import Dependency – Hard Coal . . . . . . . . . . . . . . . . . . . . . . . . . . . . . . . . . . . . . . . 69
2.3.5 Import Dependency – Petroleum and Products . . . . . . . . . . . . . . . . . . . . . 70
2.3.6 Import Dependency – Crude and NGL . . . . . . . . . . . . . . . . . . . . . . . . . . . . . . . . . 71
2.3.7 Import Dependency – Natural Gas . . . . . . . . . . . . . . . . . . . . . . . . . . . . . . . . . . . . 72
2.4 Energy Transformation . . . . . . . . . . . . . . . . . . . . . . . . . . . . . . . . . 73
2.4.1 Transformation Input – All Fuels . . . . . . . . . . . . . . . . . . . . . . . . . . . . . . . . . . . . . . . 73
2.4.2 Transformation Input – By Fuel . . . . . . . . . . . . . . . . . . . . . . . . . . . . . . . . . . . . . . . . 74
2.4.3 Transformation Input – By Sector . . . . . . . . . . . . . . . . . . . . . . . . . . . . . . . . . . . . . 75
2.4.4 Transformation Output – All Fuels . . . . . . . . . . . . . . . . . . . . . . . . . . . . . . . . . . . . . 76
2.4.5 Transformation Output – By Fuel . . . . . . . . . . . . . . . . . . . . . . . . . . . . . . . . . . . . . . 77
2.4.6 Transformation Output – By Sector . . . . . . . . . . . . . . . . . . . . . . . . . . . . . . . . . . . 78
2.5 Final Energy . . . . . . . . . . . . . . . . . . . . . . . . . . . . . . . . . . . . . . . . . . . 79
2.5.1 Primary Energy Consumption . . . . . . . . . . . . . . . . . . . . . . . . . . . . . . . . . . . . . . . . . . 79
2.5.2 Available for Final Consumption . . . . . . . . . . . . . . . . . . . . . . . . . . . . . . . . . . . . . . 80
2.5.3 Final Non-Energy Consumption . . . . . . . . . . . . . . . . . . . . . . . . . . . . . . . . . . . . . . . . 81
2.5.4 Final Energy Consumption . . . . . . . . . . . . . . . . . . . . . . . . . . . . . . . . . . . . . . . . . . . . . . 82
2.6 Electricity . . . . . . . . . . . . . . . . . . . . . . . . . . . . . . . . . . . . . . . . . . . . . 86
2.6.1 Installed Electricity Capacity . . . . . . . . . . . . . . . . . . . . . . . . . . . . . . . . . . . . . . . . . . 86
2.6.2 Gross Electricity Generation . . . . . . . . . . . . . . . . . . . . . . . . . . . . . . . . . . . . . . . . . . . . 89
2.6.3 Market Share of the Largest Electricity Producer . . . . . . . . . . . . . . . . . . 94
2.7 Solar and Wind Energy . . . . . . . . . . . . . . . . . . . . . . . . . . . . . . . . . . 95
2.7.1 Solar and Wind Energy – Cumulative Capacity . . . . . . . . . . . . . . . . . . . . . . 95
2.7.2 Wind Cumulative Installed Capacity . . . . . . . . . . . . . . . . . . . . . . . . . . . . . . . . . . 97
2.7.3 Wind Gross Electricity Production . . . . . . . . . . . . . . . . . . . . . . . . . . . . . . . . . . . . 99
2.7.4 Wind Penetration Level . . . . . . . . . . . . . . . . . . . . . . . . . . . . . . . . . . . . . . . . . . . . . . . . 100
2.7.5 Wind Capacity Factor . . . . . . . . . . . . . . . . . . . . . . . . . . . . . . . . . . . . . . . . . . . . . . . . . . 101
2.7.6 Solar Collectors’ Surface . . . . . . . . . . . . . . . . . . . . . . . . . . . . . . . . . . . . . . . . . . . . . . 102
2.7.7 Solar Installed Capacity . . . . . . . . . . . . . . . . . . . . . . . . . . . . . . . . . . . . . . . . . . . . . . . 103
2.7.8 Solar Gross Electricity Production . . . . . . . . . . . . . . . . . . . . . . . . . . . . . . . . . . . 104
2.7.9 Solar Penetration Level . . . . . . . . . . . . . . . . . . . . . . . . . . . . . . . . . . . . . . . . . . . . . . . . 105

4
Statistical pocketbook 2017
2.8 CHP . . . . . . . . . . . . . . . . . . . . . . . . . . . . . . . . . . . . . . . . . . . . . . . . . . 106
2.8.1 CHP Electricity . . . . . . . . . . . . . . . . . . . . . . . . . . . . . . . . . . . . . . . . . . . . . . . . . . . . . . . . . . 106
2.8.2 CHP Heat . . . . . . . . . . . . . . . . . . . . . . . . . . . . . . . . . . . . . . . . . . . . . . . . . . . . . . . . . . . . . . . . . 107
2.8.3 CHP Electricity and Heat . . . . . . . . . . . . . . . . . . . . . . . . . . . . . . . . . . . . . . . . . . . . . . 108
2.9 Heat . . . . . . . . . . . . . . . . . . . . . . . . . . . . . . . . . . . . . . . . . . . . . . . . . 109
2.9.1 Gross Heat Generation . . . . . . . . . . . . . . . . . . . . . . . . . . . . . . . . . . . . . . . . . . . . . . . . . 109
2.10 Transport . . . . . . . . . . . . . . . . . . . . . . . . . . . . . . . . . . . . . . . . . . . . . 112
2.10.1 Fuels Final Consumption . . . . . . . . . . . . . . . . . . . . . . . . . . . . . . . . . . . . . . . . . . . . . . 112
2.10.2 Biofuels . . . . . . . . . . . . . . . . . . . . . . . . . . . . . . . . . . . . . . . . . . . . . . . . . . . . . . . . . . . . . . . . . . 113
2.11 Energy Efficiency . . . . . . . . . . . . . . . . . . . . . . . . . . . . . . . . . . . . . . 115
2.11.1 Energy Intensity . . . . . . . . . . . . . . . . . . . . . . . . . . . . . . . . . . . . . . . . . . . . . . . . . . . . . . . . 115
2.11.2 Energy Consumption per Capita . . . . . . . . . . . . . . . . . . . . . . . . . . . . . . . . . . . . . 116
2.11.3 Final Electricity Consumption per Capita . . . . . . . . . . . . . . . . . . . . . . . . . . . 117
2.11.4 Primary Energy Intensity . . . . . . . . . . . . . . . . . . . . . . . . . . . . . . . . . . . . . . . . . . . . . . 118
2 .11 .5 Carbon Intensity . . . . . . . . . . . . . . . . . . . . . . . . . . . . . . . . . . . . . . . . . . . . . . . . . . . . . . . . 119
2.12 RES Indicators . . . . . . . . . . . . . . . . . . . . . . . . . . . . . . . . . . . . . . . . 120
2.12.1 RES Shares . . . . . . . . . . . . . . . . . . . . . . . . . . . . . . . . . . . . . . . . . . . . . . . . . . . . . . . . . . . . . . 120
2.13 Energy Prices . . . . . . . . . . . . . . . . . . . . . . . . . . . . . . . . . . . . . . . . . 123
2.13.1 Prices of Transport Fuels . . . . . . . . . . . . . . . . . . . . . . . . . . . . . . . . . . . . . . . . . . . . . . 123
2.13.2 Fuel Prices – Domestic Consumers . . . . . . . . . . . . . . . . . . . . . . . . . . . . . . . . . . 126
2.13.3 Fuel Prices – Industrial Consumers . . . . . . . . . . . . . . . . . . . . . . . . . . . . . . . . . . 128
PART 3 Socio-Economic Indicators in the EU
3.1 Classification of the Energy Sector . . . . . . . . . . . . . . . . . . . . . . . . . . . . . . . . . . . 134
3.1.1 Comparative Table . . . . . . . . . . . . . . . . . . . . . . . . . . . . . . . . . . . . . . . . . . . . . . . . . . . . . 134
3.2 Enterprises in the Energy Sector . . . . . . . . . . . . . . . . . . . . . . . . . . . . . . . . . . . . . . . . 135
3.2.1 Number of Enterprises in the Energy Sector . . . . . . . . . . . . . . . . . . . . . . . 135
3.2.2 Turnover in the Energy Sector . . . . . . . . . . . . . . . . . . . . . . . . . . . . . . . . . . . . . . . . 139
3.2.3 Number of Persons Declared as Employed in the Energy Sector 143
3.3 Economy . . . . . . . . . . . . . . . . . . . . . . . . . . . . . . . . . . . . . . . . . . . . . . . . . . . . . . . . . . . . . . . . . . . . . . . . . . 147
3.3.1 GDP at Current Market Prices . . . . . . . . . . . . . . . . . . . . . . . . . . . . . . . . . . . . . . . . . 147
3.3.2 GDP per Capita at Current Market Prices . . . . . . . . . . . . . . . . . . . . . . . . . . . 148
3.3.3 GDP at 2010 Market Prices . . . . . . . . . . . . . . . . . . . . . . . . . . . . . . . . . . . . . . . . . . . 149
3.3.4 GDP per Capita at 2010 Market Prices . . . . . . . . . . . . . . . . . . . . . . . . . . . . . . 150

5
EU ENERGY IN FIGURES 2017
3.4 Demography . . . . . . . . . . . . . . . . . . . . . . . . . . . . . . . . . . . . . . . . . . . . . . . . . . . . . . . . . . . . . . . . . . . . 151
3.4.1 Population . . . . . . . . . . . . . . . . . . . . . . . . . . . . . . . . . . . . . . . . . . . . . . . . . . . . . . . . . . . . . . . 151
3.5 Employment . . . . . . . . . . . . . . . . . . . . . . . . . . . . . . . . . . . . . . . . . . . . . . . . . . . . . . . . . . . . . . . . . . . . . 152
3.5.1 Total Persons Employed in the Energy Sector (15-64 years) . . . 152
3.5.2 Employment Rate in all Economic Sectors . . . . . . . . . . . . . . . . . . . . . . . . . . 153
3.5.3 Unemployment Rate in all Economic Sectors. . . . . . . . . . . . . . . . . . . . . . . . . . 154
PART 4 Environment Indicators in the EU
4.1 Gases Emissions . . . . . . . . . . . . . . . . . . . . . . . . . . . . . . . . . . . . . . . . . . . . . . . . . . . . . . . . . . . . . . 158
4.1.1 GHGs Emissions . . . . . . . . . . . . . . . . . . . . . . . . . . . . . . . . . . . . . . . . . . . . . . . . . . . . . . . . . 158
4.1.2 CO2 Emissions . . . . . . . . . . . . . . . . . . . . . . . . . . . . . . . . . . . . . . . . . . . . . . . . . . . . . . . . . . . 163
4.2 Main Emissions Indicators . . . . . . . . . . . . . . . . . . . . . . . . . . . . . . . . . . . . . . . . . . . . . . . . 168
4.2.1 CO2 per Capita . . . . . . . . . . . . . . . . . . . . . . . . . . . . . . . . . . . . . . . . . . . . . . . . . . . . . . . . . . 168
4.2.2 Carbon GDP Intensity . . . . . . . . . . . . . . . . . . . . . . . . . . . . . . . . . . . . . . . . . . . . . . . . . . 169
PART 5 Country Profiles
5.0 European Union 28 . . . . . . . . . . . . . . . . . . . . . . . . . . . . . . . . . . . . . . . . . . . . . . . . . . . . . . . . . . . 174
5.1 Belgium . . . . . . . . . . . . . . . . . . . . . . . . . . . . . . . . . . . . . . . . . . . . . . . . . . . . . . . . . . . . . . . . . . . . . . . . . . . 176
5.2 Bulgaria . . . . . . . . . . . . . . . . . . . . . . . . . . . . . . . . . . . . . . . . . . . . . . . . . . . . . . . . . . . . . . . . . . . . . . . . . . . 178
5.3 Czech Republic . . . . . . . . . . . . . . . . . . . . . . . . . . . . . . . . . . . . . . . . . . . . . . . . . . . . . . . . . . . . . . . . 180
5.4 Denmark . . . . . . . . . . . . . . . . . . . . . . . . . . . . . . . . . . . . . . . . . . . . . . . . . . . . . . . . . . . . . . . . . . . . . . . . . . 182
5.5 Germany . . . . . . . . . . . . . . . . . . . . . . . . . . . . . . . . . . . . . . . . . . . . . . . . . . . . . . . . . . . . . . . . . . . . . . . . . 184
5.6 Estonia . . . . . . . . . . . . . . . . . . . . . . . . . . . . . . . . . . . . . . . . . . . . . . . . . . . . . . . . . . . . . . . . . . . . . . . . . . . 186
5.7 Ireland . . . . . . . . . . . . . . . . . . . . . . . . . . . . . . . . . . . . . . . . . . . . . . . . . . . . . . . . . . . . . . . . . . . . . . . . . . . . 188
5.8 Greece . . . . . . . . . . . . . . . . . . . . . . . . . . . . . . . . . . . . . . . . . . . . . . . . . . . . . . . . . . . . . . . . . . . . . . . . . . . . . 190
5.9 Spain . . . . . . . . . . . . . . . . . . . . . . . . . . . . . . . . . . . . . . . . . . . . . . . . . . . . . . . . . . . . . . . . . . . . . . . . . . . . . . . 192
5.10 France . . . . . . . . . . . . . . . . . . . . . . . . . . . . . . . . . . . . . . . . . . . . . . . . . . . . . . . . . . . . . . . . . . . . . . . . . . . . 194
5.11 Croatia . . . . . . . . . . . . . . . . . . . . . . . . . . . . . . . . . . . . . . . . . . . . . . . . . . . . . . . . . . . . . . . . . . . . . . . . . . . 196
5.12 Italy . . . . . . . . . . . . . . . . . . . . . . . . . . . . . . . . . . . . . . . . . . . . . . . . . . . . . . . . . . . . . . . . . . . . . . . . . . . . . . . . 198
5.13 Cyprus . . . . . . . . . . . . . . . . . . . . . . . . . . . . . . . . . . . . . . . . . . . . . . . . . . . . . . . . . . . . . . . . . . . . . . . . . . . . 200
5.14 Latvia . . . . . . . . . . . . . . . . . . . . . . . . . . . . . . . . . . . . . . . . . . . . . . . . . . . . . . . . . . . . . . . . . . . . . . . . . . . . . . 202
5.15 Lithuania . . . . . . . . . . . . . . . . . . . . . . . . . . . . . . . . . . . . . . . . . . . . . . . . . . . . . . . . . . . . . . . . . . . . . . . . 204

6
Statistical pocketbook 2017
5.16 Luxembourg . . . . . . . . . . . . . . . . . . . . . . . . . . . . . . . . . . . . . . . . . . . . . . . . . . . . . . . . . . . . . . . . . . . . 206
5.17 Hungary . . . . . . . . . . . . . . . . . . . . . . . . . . . . . . . . . . . . . . . . . . . . . . . . . . . . . . . . . . . . . . . . . . . . . . . . . . 208
5.18 Malta . . . . . . . . . . . . . . . . . . . . . . . . . . . . . . . . . . . . . . . . . . . . . . . . . . . . . . . . . . . . . . . . . . . . . . . . . . . . . . . 210
5.19 The Netherlands . . . . . . . . . . . . . . . . . . . . . . . . . . . . . . . . . . . . . . . . . . . . . . . . . . . . . . . . . . . . . . . 212
5.20 Austria . . . . . . . . . . . . . . . . . . . . . . . . . . . . . . . . . . . . . . . . . . . . . . . . . . . . . . . . . . . . . . . . . . . . . . . . . . . . 214
5.21 Poland . . . . . . . . . . . . . . . . . . . . . . . . . . . . . . . . . . . . . . . . . . . . . . . . . . . . . . . . . . . . . . . . . . . . . . . . . . . . . 216
5.22 Portugal . . . . . . . . . . . . . . . . . . . . . . . . . . . . . . . . . . . . . . . . . . . . . . . . . . . . . . . . . . . . . . . . . . . . . . . . . . 218
5.23 Romania . . . . . . . . . . . . . . . . . . . . . . . . . . . . . . . . . . . . . . . . . . . . . . . . . . . . . . . . . . . . . . . . . . . . . . . . . . 220
5.24 Slovenia . . . . . . . . . . . . . . . . . . . . . . . . . . . . . . . . . . . . . . . . . . . . . . . . . . . . . . . . . . . . . . . . . . . . . . . . . . 222
5.25 Slovak Republic . . . . . . . . . . . . . . . . . . . . . . . . . . . . . . . . . . . . . . . . . . . . . . . . . . . . . . . . . . . . . . . . 224
5.26 Finland . . . . . . . . . . . . . . . . . . . . . . . . . . . . . . . . . . . . . . . . . . . . . . . . . . . . . . . . . . . . . . . . . . . . . . . . . . . . 226
5.27 Sweden . . . . . . . . . . . . . . . . . . . . . . . . . . . . . . . . . . . . . . . . . . . . . . . . . . . . . . . . . . . . . . . . . . . . . . . . . . . . 228
5.28 United Kingdom . . . . . . . . . . . . . . . . . . . . . . . . . . . . . . . . . . . . . . . . . . . . . . . . . . . . . . . . . . . . . . . 230
Appendices
Appendices Methodology . . . . . . . . . . . . . . . . . . . . . . . . . . . . . . . . . . . . . . . . . . . . . . . . . . . . . . . . . . . 236
Appendix 1 – Country Nomenclature . . . . . . . . . . . . . . . . . . . . . . . . . . . . . . . . . . . . . . . . . . . 236
Appendix 2 – Main Indicators – EN . . . . . . . . . . . . . . . . . . . . . . . . . . . . . . . . . . . . . . . . . . . . . . 237
Appendix 3 – Main Indicators – DE . . . . . . . . . . . . . . . . . . . . . . . . . . . . . . . . . . . . . . . . . . . . . . 238
Appendix 4 – Main Indicators – FR . . . . . . . . . . . . . . . . . . . . . . . . . . . . . . . . . . . . . . . . . . . . . . 239
Appendix 5 – Main Products – EN . . . . . . . . . . . . . . . . . . . . . . . . . . . . . . . . . . . . . . . . . . . . . . . 240
Appendix 6 – Main Products – DE . . . . . . . . . . . . . . . . . . . . . . . . . . . . . . . . . . . . . . . . . . . . . . . 241
Appendix 7 – Main Products – FR . . . . . . . . . . . . . . . . . . . . . . . . . . . . . . . . . . . . . . . . . . . . . . . . 242
Appendix 8 – Symbols and Abbreviations . . . . . . . . . . . . . . . . . . . . . . . . . . . . . . . . . . . . . . 243
Appendix 9 – SI Units – Prefixes . . . . . . . . . . . . . . . . . . . . . . . . . . . . . . . . . . . . . . . . . . . . . . . . . 244
Appendix 10 – Conversion Factors . . . . . . . . . . . . . . . . . . . . . . . . . . . . . . . . . . . . . . . . . . . . . . 245
Appendix 11 – Average Calorific Values . . . . . . . . . . . . . . . . . . . . . . . . . . . . . . . . . . . . . . . . 246
Appendix Glossary . . . . . . . . . . . . . . . . . . . . . . . . . . . . . . . . . . . . . . . . . . . . . . . . . . . . . . . . . . . . . . . . . . . . . 247
Appendix 12 – Glossary . . . . . . . . . . . . . . . . . . . . . . . . . . . . . . . . . . . . . . . . . . . . . . . . . . . . . . . . . . . 247
Appendix Notes . . . . . . . . . . . . . . . . . . . . . . . . . . . . . . . . . . . . . . . . . . . . . . . . . . . . . . . . . . . . . . . . . . . . . . . . . . 257
Appendix 13 – Notes . . . . . . . . . . . . . . . . . . . . . . . . . . . . . . . . . . . . . . . . . . . . . . . . . . . . . . . . . . . . . . . 257
Notes . . . . . . . . . . . . . . . . . . . . . . . . . . . . . . . . . . . . . . . . . . . . . . . . . . . . . . . . . . . . . . . . . . . . . . . . . . . . . . . . . . . . . . . . 262

1PART
Overview

PART 1 Overview

9
EU ENERGY IN FIGURES 2017
Summary
1.1 Energy in the World (Overview) . . . . . . . . . . . . . . . . . . . . . . . . . . . . . . . . . . . . . . . . . . . 10
1.1.1 World Energy Production by Region . . . . . . . . . . . . . . . . . . . . . . . . . . . . . . . . . . . 10
1.1.2 World Energy Production by Fuel . . . . . . . . . . . . . . . . . . . . . . . . . . . . . . . . . . . . . . 11
1.1.3 World Gross Inland Consumption by Region . . . . . . . . . . . . . . . . . . . . . . . . . 12
1.1.4 World Gross Inland Consumption by Fuel. . . . . . . . . . . . . . . . . . . . . . . . . . . . . 13
1.1.5 World Final Energy Consumption by Region . . . . . . . . . . . . . . . . . . . . . . . . . . 14
1.1.6 World Final Energy Consumption by Fuel . . . . . . . . . . . . . . . . . . . . . . . . . . . . . 15
1.1.7 World Electricity Generation by Fuel . . . . . . . . . . . . . . . . . . . . . . . . . . . . . . . . . . 16
1.1.8 World Heat Generation by Fuel . . . . . . . . . . . . . . . . . . . . . . . . . . . . . . . . . . . . . . . . . 17
1.1.9 World CO2 Emissions by Region . . . . . . . . . . . . . . . . . . . . . . . . . . . . . . . . . . . . . . . . 18
1.1.10 World CO2 Intensity by Region . . . . . . . . . . . . . . . . . . . . . . . . . . . . . . . . . . . . . . . . . . 19
1.2 Energy in the EU (Overview) . . . . . . . . . . . . . . . . . . . . . . . . . . . . . . . . . . . . . . . . . . . . . . . . 20
1.2.1 EU-28 Energy Flow – 1995 . . . . . . . . . . . . . . . . . . . . . . . . . . . . . . . . . . . . . . . . . . . . . 20
1.2.2 EU-28 Energy Flow – 2015 . . . . . . . . . . . . . . . . . . . . . . . . . . . . . . . . . . . . . . . . . . . . . 21
1.2.3 EU-28 Gross Inland Consumption . . . . . . . . . . . . . . . . . . . . . . . . . . . . . . . . . . . . . . 22
1.2.4 EU-28 Energy Import Dependency . . . . . . . . . . . . . . . . . . . . . . . . . . . . . . . . . . . . 24
1.2.5 EU-28 Energy Import Dependency – Net Imports . . . . . . . . . . . . . . . . . . . 25
1.2.6 EU-28 Imports by Country of Origin . . . . . . . . . . . . . . . . . . . . . . . . . . . . . . . . . . . 26
1.3 EU 2020 Targets . . . . . . . . . . . . . . . . . . . . . . . . . . . . . . . . . . . . . . . . . . . . . . . . . . . . . . . . . . . . . . . . 27
1.3.1 Renewable Energy Targets . . . . . . . . . . . . . . . . . . . . . . . . . . . . . . . . . . . . . . . . . . . . . . 27
1.3.2 Renewable Energy Shares. . . . . . . . . . . . . . . . . . . . . . . . . . . . . . . . . . . . . . . . . . . . . . . 29
1.3.3 GHG Emissions Targets . . . . . . . . . . . . . . . . . . . . . . . . . . . . . . . . . . . . . . . . . . . . . . . . . . 30

10
PART 1 Overview
3 000
2 500
2 000
1 500
1 000
500
0
19
95
19
96
19
97
19
98
19
99
20
00
20
01
20
02
20
03
20
04
20
05
20
06
20
07
20
08
20
09
20
10
20
11
20
12
20
13
20
14
20
15
Mtoe
* non OECD and OECD Asia, excluding China.
Source: IEA, August 2017
Methodology and Notes: See Appendix 13 – No 1
1.1 Energy in the World (Overview)
1.1.1 World Energy Production by Region
�Mtoe�
1995 2000 2005 2010 2015 2015 (%)
EU-28 967 950 909 843 771 5.6 %
China 1 064 1 124 1 671 2 236 2 496 18.1 %
United States 1 659 1 667 1 631 1 723 2 019 14.6 %
Middle East 1 137 1 324 1 516 1 624 1 884 13.7 %
Asia* 934 1 062 1 248 1 484 1 568 11.4 %
Russia 968 978 1 203 1 279 1 334 9.7 %
Africa 773 885 1 087 1 173 1 118 8.1 %
Rest of the World 1 760 2 038 2 287 2 438 2 601 18.9 %
World 9 263 10 028 11 554 12 799 13 790 100.0 %
United States
Middle East
EU-28
Asia*
China
Russia
Africa
Rest of the World
18.1 %
13.7 %
14.6 %9.7 %
11.4 %
8.1 %
18.9 %
5.6 %
TOTAL 2015: 13 790 Mtoe
China Middle East Russia
Asia* AfricaEU-28 United States
Rest of the World

11
EU ENERGY IN FIGURES 2017
1.1.2 World Energy Production by Fuel
�Mtoe�
1995 2000 2005 2010 2015 2015 (%)
Petroleum and Products 3 397 3 703 4 045 4 082 4 416 32.0 %
Solid Fuels 2 220 2 278 2 997 3 663 3 872 28.1 %
Gas 1 811 2 064 2 370 2 715 2 976 21.6 %
Renewables 1 211 1 287 1 398 1 590 1 819 13.2 %
Nuclear 608 676 722 719 671 4.9 %
Other 17 21 21 31 37 0.3 %
Total 9 263 10 028 11 554 12 799 13 790 100.0 %
Source: IEA, August 2017
Methodology and Notes: See Appendix 13 – No 1
32.0 %
28.1 %
21.6 %
13.2 %
4.9 %
TOTAL 2015: 13 790 Mtoe
5 000
4 000
3 000
2 000
1 000
0
19
95
19
96
19
97
19
98
19
99
20
00
20
01
20
02
20
03
20
04
20
05
20
06
20
07
20
08
20
09
20
10
20
11
20
12
20
13
20
14
20
15
Mtoe
Solid Fuels
Nuclear
Petroleum and Products
Renewables
Gas
Other
Solid Fuels
Nuclear
Petroleum and Products
Renewables
Gas
Other (0.3 %)

12
PART 1 Overview
1.1.3 World Gross Inland Consumption by Region
�Mtoe�
1995 2000 2005 2010 2015 2015 (%)
EU-28 1 649 1 695 1 794 1 726 1 586 11.6 %
China 1 055 1 143 1 794 2 550 2 987 21.9 %
United States 2 067 2 273 2 319 2 215 2 188 16.0 %
Asia* 1 521 1 761 1 983 2 291 2 495 18.3 %
Russia 637 619 652 688 710 5.2 %
Africa 444 496 600 695 788 5.8 %
Middle East 307 354 469 624 729 5.3 %
Rest of the World 1 549 1 686 1 890 2 083 2 165 15.9 %
World 9 228 10 028 11 499 12 873 13 647 100.0 %
* non OECD and OECD Asia, excluding China.
Source: IEA, August 2017
Methodology and Notes: See Appendix 13 – No 1
United States
Middle East
EU-28
Asia*
China
Russia
Africa
Rest of the World
21.9 %
16.0 %
5.8 %
5.2 %
18.3 %
5.3 %
15.9 %11.6 %
TOTAL 2015: 13 647 Mtoe
3 500
3 000
2 500
2 000
1 500
1 000
500
0
19
95
19
96
19
97
19
98
19
99
20
00
20
01
20
02
20
03
20
04
20
05
20
06
20
07
20
08
20
09
20
10
20
11
20
12
20
13
20
14
20
15
China Middle East
RussiaAsia* Africa
EU-28 United States
Rest of the World
Mtoe

13
EU ENERGY IN FIGURES 2017
1.1.4 World Gross Inland Consumption by Fuel
�Mtoe�
1995 2000 2005 2010 2015 2015 (%)
Petroleum and Products 3 376 3 660 4 005 4 142 4 334 31.8 %
Solid Fuels 2 208 2 311 2 993 3 654 3 836 28.1 %
Gas 1 807 2 071 2 360 2 736 2 944 21.6 %
Renewables 1 212 1 288 1 398 1 591 1 823 13.4 %
Hydro* 213 225 252 296 334 2.5 %
Geothermal* 39 52 54 63 74 0.5 %
Solar/Wind/Other* 4 8 17 48 126 0.9 %
Biofuels and Waste* 972 1 023 1 096 1 213 1 323 9.7 %
Nuclear 608 676 722 719 671 4.9 %
Other 16 21 21 31 40 0.3 %
Total 9 228 10 028 11 499 12 873 13 647 100.0 %
* Partial disaggregation of the Renewables group. Waste also includes non-RES wastes.
Source: IEA, August 2017
Methodology and Notes:See Appendix 13 – No 1
31.8 %
28.1 %
21.6 %
13.4 %
4.9 %
TOTAL 2015: 13 647 Mtoe
5 000
4 500
4 000
3 500
3 000
2 500
2 000
1 500
1 000
500
0
19
95
19
96
19
97
19
98
19
99
20
00
20
01
20
02
20
03
20
04
20
05
20
06
20
07
20
08
20
09
20
10
20
11
20
12
20
13
20
14
20
15
Mtoe
Solid Fuels
Nuclear
Petroleum and Products
Renewables
Gas
Other
Solid Fuels
Nuclear
Petroleum and Products
Renewables
Gas
Other (0.3 %)

14
PART 1 Overview
1.1.5 World Final Energy Consumption by Region
�Mtoe�
1995 2000 2005 2010 2015 2015 (%)
EU-28 1 133 1 180 1 243 1 208 1 114 11.9 %
China 788 791 1 192 1 587 1 915 20.4 %
United States 1 378 1 546 1 563 1 512 1 520 16.2 %
Asia* 1 076 1 211 1 357 1 548 1 716 18.3 %
Africa 324 369 437 508 573 6.1 %
Russia 458 418 412 447 457 4.9 %
Middle East 202 241 313 416 475 5.1 %
Rest of the World 1 180 1 281 1 420 1 554 1 614 17.2 %
World 6 539 7 036 7 937 8 781 9 384 100.0 %
* non OECD and OECD Asia, excluding China.
Source: IEA, August 2017
Methodology and Notes: See Appendix 13 – No 1
United States
Middle East
EU-28
Asia*
China
Russia
Africa
Rest of the World
20.4 %
16.2 %
4.9 %
6.1 %
18.3 %
5.1 %
17.2 % 11.9 %
TOTAL 2015: 9 384 Mtoe
2 500
2 000
1 500
1 000
500
0
19
95
19
96
19
97
19
98
19
99
20
00
20
01
20
02
20
03
20
04
20
05
20
06
20
07
20
08
20
09
20
10
20
11
20
12
20
13
20
14
20
15
China Middle East
RussiaAsia*
EU-28
Rest of the World
Mtoe
Africa
United States

15
EU ENERGY IN FIGURES 2017
1.1.6 World Final Energy Consumption by Fuel
�Mtoe�
1995 2000 2005 2010 2015 2015 (%)
Petroleum and Products 2 797 3 115 3 438 3 597 3 840 40.9 %
Solid Fuels 662 548 792 1 005 1 044 11.1 %
Gas 1 006 1 117 1 190 1 337 1 401 14.9 %
Renewables 848 910 950 1 021 1 082 11.5 %
Electricity 936 1 092 1 302 1 540 1 737 18.5 %
Heat 287 248 260 274 271 2.9 %
Other 3 7 5 7 9 0.1 %
Total 6 539 7 036 7 937 8 781 9 384 100.0 %
Source: IEA, August 2017
Methodology and Notes: See Appendix 13 – No 1
40.9 %
11.1 %
11.5 %
14.9 %
18.5 %
2.9 %
TOTAL 2015: 9 384 Mtoe
4 000
3 000
2 000
1 000
0
19
95
19
96
19
97
19
98
19
99
20
00
20
01
20
02
20
03
20
04
20
05
20
06
20
07
20
08
20
09
20
10
20
11
20
12
20
13
20
14
20
15
Mtoe
Solid Fuels
Heat
Petroleum and Products
Renewables
Gas
Other
Electricity
Solid Fuels
Electricity
Heat
Petroleum and Products
Renewables
Gas
Other (0.1 %)

16
PART 1 Overview
1.1.7 World Electricity Generation by Fuel
�TWh�
1995 2000 2005 2010 2015 2015 (%)
Solid Fuels 4 992 6 005 7 335 8 664 9 538 39.3 %
Petroleum and Products 1 279 1 252 1 178 982 990 4.1 %
Gas 2 022 2 753 3 702 4 828 5 543 22.9 %
Renewables 2 637 2 837 3 295 4 209 5 534 22.8 %
Hydro* 2 479 2 619 2 935 3 443 3 888 16.0 %
Solar/Wind/Other* 10 35 120 387 1 111 4.6 %
Biofuels and Waste* 131 164 227 372 528 2.2 %
Geothermal* 40 52 58 68 80 0.3 %
Nuclear 2 332 2 591 2 768 2 756 2 571 10.6 %
Other 24 34 46 62 78 0.3 %
Total 13 285 15 471 18 324 21 502 24 255 100.0 %
* Partial disaggregation of the Renewables group. Waste also includes non-RES wastes.
Source: IEA, August 2017
Methodology and Notes: See Appendix 13 – No 1
TOTAL 2015: 24 255 TWh
TWh
39.3 %
4.1 %
22.8 %
22.9 %
10.6 %
Solid Fuels
Nuclear
Petroleum and Products
Renewables
Gas
Other (0.3 %)
10 000
8 000
6 000
4 000
2 000
0
19
95
19
96
19
97
19
98
19
99
20
00
20
01
20
02
20
03
20
04
20
05
20
06
20
07
20
08
20
09
20
10
20
11
20
12
20
13
20
14
20
15
Solid Fuels
Nuclear
Petroleum and Products
Renewables
Gas
Other

17
EU ENERGY IN FIGURES 2017
1.1.8 World Heat Generation by Fuel
�PJ�
1995 2000 2005 2010 2015 2015 (%)
Gas 7 157 6 232 6 654 6 588 5 703 41.6 %
Solid Fuels 4 367 4 332 4 720 5 456 5 941 43.3 %
Petroleum and Products 1 939 1 160 965 843 602 4.4 %
Renewables 254 296 395 584 710 5.2 %
Geothermal* 17 18 24 26 34 0.2 %
Solar/Wind/Other* 9 12 386 347 367 2.7 %
Biofuels and Waste* 345 414 530 781 940 6.9 %
Nuclear 20 19 21 27 26 0.2 %
Other 162 203 601 635 729 5.3 %
Total 13 900 12 242 13 355 14 135 13 711 100.0 %
* Partial disaggregation of the Renewables group. Waste also includes non-RES wastes.
Source: IEA, August 2017
Methodology and Notes: See Appendix 13 – No 1
TOTAL 2015: 13 711 PJ
PJ
41.6 %
4.4 %
43.3 %
5.2 %5.3 %
Solid Fuels
Nuclear (0.2 %)
Petroleum and Products
Renewables
Gas
Other
8 000
7 000
6 000
5 000
4 000
3 000
2 000
1 000
0
19
95
19
96
19
97
19
98
19
99
20
00
20
01
20
02
20
03
20
04
20
05
20
06
20
07
20
08
20
09
20
10
20
11
20
12
20
13
20
14
20
15
Solid Fuels
Nuclear
Petroleum and Products
Renewables
Gas
Other

18
PART 1 Overview
10 000
9 000
8 000
7 000
6 000
5 000
4 000
3 000
2 000
1 000
0
19
95
19
96
19
97
19
98
19
99
20
00
20
01
20
02
20
03
20
04
20
05
20
06
20
07
20
08
20
09
20
10
20
11
20
12
20
13
20
14
Mio ton CO2
1.1.9 World CO2 Emissions* by Region
�Mio ton CO2�
1995 2000 2005 2010 2014 2014 (%)
EU-28 4 012 4 036 4 205 3 898 3 425 10.2 %
China 2 951 3 159 5 459 7 848 9 222 27.5 %
United States 5 211 5 790 5 854 5 496 5 290 15.8 %
Asia** 3 275 3 836 4 412 5 221 5 925 17.7 %
Middle East 816 951 1 229 1 595 1 846 5.5 %
Russian Federation 1 562 1 488 1 497 1 552 1 532 4.6 %
Africa 614 700 899 1 041 1 148 3.4 %
Rest of the World 3 639 4 038 4 480 4 926 5 124 15.3 %
World 22 080 23 997 28 034 31 576 33 511 100.0 %
* Contains CO2 emissions from fuel combustion and international maritime and aviation bunkers.
** non OECD and OECD Asia, excluding China.
Source: IEA, August 2017
Methodology and Notes: See Appendix 13 – No 1
United States
Middle East
EU-28
Asia**
China
Russian Federation
Africa
Rest of the World
27.5 %
15.8 %
4.6 %
5.5 %
17.7 %
3.4 %
15.3 % 10.2 %
TOTAL 2014: 33 289 Mio ton CO2
China Middle East
Russian FederationAsia**
EU-28
Rest of the WorldAfrica
United States

19
EU ENERGY IN FIGURES 2017
3 500
3 000
2 500
2 000
1 500
1 000
500
0
1.1.10 World CO2 Intensity* by Region
�Kg CO2 per toe – Average�
1995 2000 2005 2010 2013 2014
EU-28 2 433 2 381 2 344 2 258 2 221 2 186
China 2 797 2 763 3 043 3 078 3 119 3 107
United States 2 521 2 547 2 525 2 481 2 395 2 386
Asia** 2 153 2 178 2 225 2 279 2 386 2 406
Middle East 2 661 2 689 2 624 2 556 2 616 2 558
Russia 2 454 2 402 2 297 2 255 2 180 2 114
Africa 1 383 1 412 1 499 1 498 1 489 1 481
Rest of the World 2 350 2 395 2 371 2 364 2 368 2 363
World 2 393 2 393 2 438 2 453 2 474 2 463
* Per Unit of Gross Inland Consumption.
** non OECD and OECD Asia, excluding China.
Source: IEA, August 2017
Methodology and Notes: See Appendix 13 – No 1
United States
Asia**
EU-28
China
Middle East
Russia
Africa
Rest of the World
World
WORLD AVERAGE 2014: 2 463 Kg CO2 per toe
3 500
3 000
2 500
2 000
1 500
1 000
19
95
19
96
19
97
19
98
19
99
20
00
20
01
20
02
20
03
20
04
20
05
20
06
20
07
20
08
20
09
20
10
20
11
20
12
20
13
20
14
China Middle East
RussiaAsia**
EU-28
Rest of the World
Kg CO2 per toe
Africa
United States

20
PART 1 Overview
1.2 Energy in the EU (Overview)
1.2.1 EU-28 Energy Flow – 1995 �Mtoe�
Fina
l En
ergy
Con
s. –
Agr
icul
ture
/For
estr
y: 3
1.1
Fina
l Ene
rgy
Con
sum
ptio
n –
Fish
ing:
1.4
Fina
l Ene
rgy
Cons
umpt
ion
– Non
-spe
cified
: 12.2
Fin
al Energ
y C
onsu
mpti
on –
Serv
ices:
11
4.3
Fin
al Energ
y C
onsu
mpti
on –
Indust
ry: 3
31
.6
Fin
al Energ
y C
onsu
mpti
on –
Tra
nsp
ort
: 3
06
.8
Net
Import
s:
73
6.8
Direct Use: 5.4
Stock
Changes: 9.2
Intern
ational M
arine B
unkers:
34.9
Distrib
ution Lo
sses
: 26.6
Consumptio
n in Ener
gy Sec
tor:
87.4
Transformation Losses: 370.7
Final N
on-E
nerg
y Consu
mpti
on: 1
07.4
Tota
l
Pro
duct
ion:
96
9.3
Gro
ss Inla
nd
Consu
mpti
on:
1 6
75
Transf
orm
ati
on
Input:
1 4
16
.1
Transf
orm
ati
on
Outp
ut:
1 0
26
.6
Non-T
ransf
orm
ed E
nerg
y
Fin
al
Energ
y
Consu
mpti
on:
1 0
82
.8
Supply
Dem
and
Inte
rmedia
ryFin
al
Fin
al Energ
y C
onsu
mpti
on –
Resi
denti
al:
28
5.5
Available
for
Fin
al
Consu
mpti
on:
1 1
93
.1
Source: Eurostat, May 2017
Methodology and Notes: See Appendix 13 – No 1

21
EU ENERGY IN FIGURES 2017
1.2.2 EU-28 Energy Flow – 2015 �Mtoe�
Fina
l En
ergy
Con
s. –
Agr
icul
ture
/For
estr
y: 2
3.4
Fina
l Ene
rgy
Con
sum
ptio
n –
Fish
ing:
1.2
Fina
l Ene
rgy
Cons
umpt
ion
– Non
-spe
cified
: 3.8
Fin
al Energ
y C
onsu
mpti
on –
Serv
ices:
14
6.9
Fin
al Energ
y C
onsu
mpti
on –
Indust
ry: 2
74
.7
Fin
al Energ
y C
onsu
mpti
on –
Tra
nsp
ort
: 3
58
.6
Net
Import
s:
90
2.1
Direct Use: 10.7
Stock
Changes: 3.7
Intern
ational M
arine B
unkers:
42.1
Distrib
ution Lo
sses
: 25.5
Consumptio
n in Ener
gy Sec
tor:
81.1
Transfo
rmation Losse
s: 341.4
Final N
on-E
nerg
y Consu
mpti
on: 9
6.8
Tota
l
Pro
duct
ion:
78
1.9
Gro
ss Inla
nd
Consu
mpti
on:
1 6
27
.5
Transf
orm
ati
on
Input:
1 4
16
.1
Transf
orm
ati
on
Outp
ut:
96
2.8
Non-T
ransf
orm
ed E
nerg
y
Fin
al
Energ
y
Consu
mpti
on:
1 0
84
Fin
al Energ
y C
onsu
mpti
on –
Resi
denti
al:
27
5.2
Supply
Dem
and
Inte
rmedia
ryFin
al
Available
for
Fin
al
Consu
mpti
on:
1 1
82
.4
Source: Eurostat, May 2017
Methodology and Notes: See Appendix 13 – No 1

22
PART 1 Overview
Solid Fuels
Nuclear Heat
Petroleum and Products
Renewables
Gas
Waste, Non-Renewable (0 %)
Solid Fuels
Nuclear Heat
Petroleum and Products
Renewables
Gas
Waste, Non-Renewable
39 %
20 %
22 %
14 %
5 %
34%
22%
16 %
14 %
13 %1 %
1.2.3 EU-28 Gross Inland Consumption
ENERGY MIX �%� � PRIMARY PRODUCTS ONLY
TOTAL PRIMARY 2015: 1 626.2 Mtoe(Total Primary and Secondary 2015: 1 627.5 Mtoe)
TOTAL PRIMARY 1995: 1 673.2 Mtoe(Total Primary and Secondary 1995: 1 675 Mtoe)
Source: Eurostat, May 2017
Methodology and Notes: See Appendix 13 – No 1

23
EU ENERGY IN FIGURES 2017
1.2.3 EU-28 Gross Inland Consumption
ENERGY MIX* � 2015 �%�
* Primary Products Only.
Source: Eurostat, May 2017
Methodology and Notes: See Appendix 13 – No 1
UK
SE
FI
SK
SI
RO
PT
PL
AT
NL
MT
HU
LU
LT
LV
CY
IT
HR
FR
ES
EL
IE
EE
DE
DK
CZ
BG
BE
EU
-28
0 % 20 % 40 % 60 % 80 % 100 %
0 % 20 % 40 % 60 % 80 % 100 %
Solid Fuels Nuclear HeatPetroleum and ProductsRenewables
GasWaste, Non-Renewable

24
PART 1 Overview
Source: Eurostat, May 2017
Methodology and Notes: See Appendix 13 – No 1
1.2.4 EU-28 Energy Import Dependency
BY FUEL � �%�
1995 2000 2005 2010 2014 2015
Total 43.1 46.7 52.1 52.6 53.4 54.0
Solid Fuels 21.5 30.6 39.4 39.4 45.7 42.8
of which Hard Coal 29.7 42.6 55.7 57.9 68.0 64.1
Petroleum and Products 74.1 75.7 82.1 84.5 87.5 88.8
of which Crude and NGL 73.0 74.4 81.3 84.6 87.9 88.4
Natural Gas 43.3 48.8 57.1 62.2 67.3 69.1
1995�2015 �%�
100 %
90 %
80 %
70 %
60 %
50 %
40 %
30 %
20 %
10 %
0 %Total Solid Fuels of which
Hard Coal
Petroleum
and Products
of which
Crude
and NGL
Natural Gas
2000
2014
2010
1995
2005
2015

25
EU ENERGY IN FIGURES 2017
1.2.5 EU-28 Energy Import Dependency – Net Imports
2015
ENERGY IMPORT DEPENDENCY �%� NET IMPORTS �Mtoe�
Source: Eurostat, May 2017
Methodology and Notes: See Appendix 13 – No 1
UK
SE
FI
SK
SI
RO
PT
PL
AT
NL
MT
HU
LU
LT
LV
CY
IT
HR
FR
ES
EL
IE
EE
DE
DK
CZ
BG
BE
0 20 40 60 80 100
0 20 40 60 80 100
UK
SE
FI
SK
SI
RO
PT
PL
AT
NL
MT
HU
LU
LT
LV
CY
IT
HR
FR
ES
EL
IE
EE
DE
DK
CZ
BG
BE
0 40 80 120 160 200
0 40 80 120 160 200

26
PART 1 Overview
Other non-EU suppliers
Canada
Indonesia
Not Specified
South Africa
Australia
United States
Colombia
Russia
Other non-EU suppliers
Algeria
Azerbaijan
Kazakhstan
Iraq
Soudi Arabia
Nigeria
Norway
Russia
Other non-EU suppliers
Trinidad & Tobago
Nigeria
Libya
Not specified
Qatar
Algeria
Norway
Russia
1.2.6 EU-28 Imports by Country of Origin
EU�28 IMPORTS* OF NATURAL GAS – 2015
Total non-EU = 12 624 717 TJ-GCV
EU�28 IMPORTS* OF CRUDE OIL – 2015
Total non-EU = 526 776 kton
EU�28 IMPORTS* OF SOLID FUELS – 2015
Total non-EU = 216 921 kton
37.0 %
29.1 %
29.1 %
32.5 %
12.0 %
24.0 %
11.1 %
8.4 %
9.1 %
7.7 %
7.9 %
7.8 %
6.3 %
7.6 %
6.4 %
2.1 %
6.5 %
3.5 %
2.1 %
5.2 %
1.6 %
0.6 %
4.3 %
15.8 %
0.5 %
19.0 %
2.7 %
* From non-EU suppliers and as a share of total non-EU imports.
Source: Eurostat, May 2017
Methodology and Notes: See Appendix 13 – No 1

27
EU ENERGY IN FIGURES 2017
* In % of the Gross Final Energy Consumption.
Source: Eurostat-SHARES, March 2017
Methodology and Notes: See Appendix 13 – No 1
1.3 EU 2020 Targets
1.3.1 Renewable Energy Targets
2015 Renewable Energy Shares
Indic
ati
ve T
raje
ctory
2
01
5/2
01
6
20
20
RES T
arg
et
% RES T
ransp
ort
RES E
lect
rici
ty
RES H
eati
ng
and C
ooling
Overa
ll R
ES
Share
EU-28 6.7 28.8 18.6 16.7 n.a. 20.0
BE 3.8 15.4 7.6 7.9 7.1 13.0
BG 6.5 19.1 28.6 18.2 12.4 16.0
CZ 6.5 14.1 19.8 15.1 9.2 13.0
DK 6.7 51.3 39.6 30.8 22.9 30.0
DE 6.8 30.7 12.9 14.6 11.3 18.0
EE 0.4 15.1 49.6 28.6 21.2 25.0
IE 6.5 25.2 6.4 9.2 8.9 16.0
EL 1.4 22.1 25.9 15.4 11.9 18.0
ES 1.7 36.9 16.8 16.2 13.8 20.0
FR 8.5 18.8 19.8 15.2 16.0 23.0
HR 3.5 45.4 38.6 29.0 15.9 20.0
IT 6.4 33.5 19.2 17.5 10.5 17.0
CY 2.5 8.4 22.5 9.4 7.4 13.0
LV 3.9 52.2 51.8 37.6 35.9 40.0
LT 4.6 15.5 46.1 25.8 18.6 23.0
LU 6.5 6.2 6.9 5.0 5.4 11.0
HU 6.2 7.3 21.3 14.5 8.2 13.0
MT 4.7 4.2 14.1 5.0 4.5 10.0
NL 5.3 11.1 5.5 5.8 7.6 14.0
AT 11.4 70.3 32.0 33.0 28.1 34.0
PL 6.4 13.4 14.3 11.8 10.7 15.0
PT 7.4 52.6 33.4 28.0 25.2 31.0
RO 5.5 43.2 25.9 24.8 20.6 24.0
SI 2.2 32.7 34.1 22.0 20.1 25.0
SK 8.5 22.7 10.8 12.9 10.0 14.0
FI 22.0 32.5 52.8 39.3 32.8 38.0
SE 24.0 65.8 68.6 53.9 43.9 49.0
UK 4.4 22.4 5.5 8.2 7.5 15.0
*

28
PART 1 Overview
1.3.1 Renewable Energy Targets
OVERALL RENEWABLE ENERGY SHARE 2015 �%�
* In Gross Final Energy Consumption.
Source: Eurostat-SHARES, March 2017
Methodology and Notes: See Appendix 13 – No 1
UK
SE
FI
SK
SI
RO
PT
PL
AT
NL
MT
HU
LU
LT
LV
CY
IT
HR
FR
ES
EL
IE
EE
DE
DK
CZ
BG
BE
EU
-28
0 % 10 % 20 % 30 % 40 % 50 % 60 %
0 % 10 % 20 % 30 % 40 % 50 % 60 %
*
Overall RES Share 2015
Indicative Trajectory 2015/2016
2020 RES Target

29
EU ENERGY IN FIGURES 2017
1.3.2 Renewable Energy Shares
RES SHARES IN HEATING AND COOLING, ELECTRICITY,
AND TRANSPORT – 2015 �%�
* In Gross Final Energy Consumption.
Source: Eurostat-SHARES, March 2017
Methodology and Notes: See Appendix 13 – No 1
UK
SE
FI
SK
SI
RO
PT
PL
AT
NL
MT
HU
LU
LT
LV
CY
IT
HR
FR
ES
EL
IE
EE
DE
DK
CZ
BG
BE
EU
-28
0 % 10 % 20 % 30 % 40 % 50 % 60 % 70 % 80 %
0 % 10 % 20 % 30 % 40 % 50 % 60 % 70 % 80 %
*
RES Heating and Cooling 2015
RES in Transport 2015
RES Electricity 2015

30
PART 1 Overview
1.3.3 GHG Emissions Targets
EMISSIONS COMPARED TO 1990
Index 100=1990 1990 1995 2000 2005 2010 2014 2015
EU-28 100.0 94.1 92.2 93.5 85.9 77.4 77.9
BE 100.0 105.7 103.6 99.9 91.8 79.4 81.8
BG 100.0 72.2 57.1 61.6 58.3 55.6 59.4
CZ 100.0 79.4 75.6 74.9 70.8 64.2 64.9
DK 100.0 111.1 101.4 95.6 91.0 74.2 70.7
DE 100.0 89.9 84.1 80.4 76.5 73.5 73.4
EE 100.0 50.0 42.9 47.7 52.5 52.3 44.7
IE 100.0 106.6 124.0 126.8 112.0 104.9 109.2
EL 100.0 105.9 122.1 131.6 114.5 96.8 93.4
ES 100.0 114.2 134.9 153.9 125.9 115.3 119.4
FR 100.0 99.8 101.9 102.4 95.0 84.6 85.4
HR 100.0 71.3 80.4 93.4 87.3 74.0 75.4
IT 100.0 102.4 107.0 112.3 98.1 82.5 84.5
CY 100.0 123.5 144.1 159.7 163.8 144.7 144.5
LV 100.0 48.5 39.6 43.5 47.6 43.7 44.1
LT 100.0 46.3 40.6 47.9 43.2 41.5 42.0
LU 100.0 81.0 80.8 108.8 102.6 91.4 88.9
HU 100.0 80.5 78.6 81.1 70.1 61.9 65.3
MT 100.0 111.5 116.6 126.5 128.0 125.7 99.2
NL 100.0 105.8 101.6 99.7 99.3 87.8 91.4
AT 100.0 101.8 103.2 118.7 109.3 98.3 101.6
PL 100.0 93.9 83.5 85.3 87.2 82.1 82.8
PT 100.0 117.3 138.3 144.9 118.0 110.2 117.9
RO 100.0 73.6 56.9 59.4 49.1 47.0 47.7
SI 100.0 100.7 102.8 110.3 105.5 89.5 90.7
SK 100.0 73.1 67.0 69.2 62.7 54.7 55.6
FI 100.0 100.6 98.3 98.0 106.9 84.5 79.6
SE 100.0 103.1 96.8 94.3 91.4 76.9 76.6
UK 100.0 94.7 91.4 89.6 79.6 68.7 66.4
*
* Emissions of the Kyoto basket of GHG.
Source: Eurostat, May 2017
Methodology and Notes: See Appendix 13 – No 1

2PART
Energy in the EU

PART 2 Energy in the EU

33
EU ENERGY IN FIGURES 2017
Summary
2.1 Energy Supply. . . . . . . . . . . . . . . . . . . . . . . . . . . . . . . . . . . . . . . . . . 35
2.1.1 Production . . . . . . . . . . . . . . . . . . . . . . . . . . . . . . . . . . . . . . . . . . . . . . . . . . . . . . . . . . . . . . . . . 35
2.1.2 Net Imports . . . . . . . . . . . . . . . . . . . . . . . . . . . . . . . . . . . . . . . . . . . . . . . . . . . . . . . . . . . . . . . . 38
2.1.3 Gross Inland Consumption . . . . . . . . . . . . . . . . . . . . . . . . . . . . . . . . . . . . . . . . . . . . . . 41
2.2 Energy Imports . . . . . . . . . . . . . . . . . . . . . . . . . . . . . . . . . . . . . . . . . 45
2.2.1 Imports – Solid Fuels . . . . . . . . . . . . . . . . . . . . . . . . . . . . . . . . . . . . . . . . . . . . . . . . . . . . 45
2.2.2 Imports – Petroleum and Products . . . . . . . . . . . . . . . . . . . . . . . . . . . . . . . . . . . . 50
2.2.3 Imports – Gases . . . . . . . . . . . . . . . . . . . . . . . . . . . . . . . . . . . . . . . . . . . . . . . . . . . . . . . . . . 55
2.2.4 Imports – Electricity . . . . . . . . . . . . . . . . . . . . . . . . . . . . . . . . . . . . . . . . . . . . . . . . . . . . . 59
2.2.5 Imports by Country of Origin . . . . . . . . . . . . . . . . . . . . . . . . . . . . . . . . . . . . . . . . . . . 63
2.3 Energy Import Dependency . . . . . . . . . . . . . . . . . . . . . . . . . . . . . . 66
2.3.1 Import Dependency – All Fuels . . . . . . . . . . . . . . . . . . . . . . . . . . . . . . . . . . . . . . . . 66
2.3.2 Import Dependency – By Fuel . . . . . . . . . . . . . . . . . . . . . . . . . . . . . . . . . . . . . . . . . . 67
2.3.3 Import Dependency – Solid Fuels . . . . . . . . . . . . . . . . . . . . . . . . . . . . . . . . . . . . . 68
2.3.4 Import Dependency – Hard Coal . . . . . . . . . . . . . . . . . . . . . . . . . . . . . . . . . . . . . . . 69
2.3.5 Import Dependency – Petroleum and Products . . . . . . . . . . . . . . . . . . . . . 70
2.3.6 Import Dependency – Crude and NGL . . . . . . . . . . . . . . . . . . . . . . . . . . . . . . . . . 71
2.3.7 Import Dependency – Natural Gas . . . . . . . . . . . . . . . . . . . . . . . . . . . . . . . . . . . . 72
2.4 Energy Transformation . . . . . . . . . . . . . . . . . . . . . . . . . . . . . . . . . 73
2.4.1 Transformation Input – All Fuels . . . . . . . . . . . . . . . . . . . . . . . . . . . . . . . . . . . . . . . 73
2.4.2 Transformation Input – By Fuel . . . . . . . . . . . . . . . . . . . . . . . . . . . . . . . . . . . . . . . . 74
2.4.3 Transformation Input – By Sector . . . . . . . . . . . . . . . . . . . . . . . . . . . . . . . . . . . . . 75
2.4.4 Transformation Output – All Fuels . . . . . . . . . . . . . . . . . . . . . . . . . . . . . . . . . . . . . 76
2.4.5 Transformation Output – By Fuel . . . . . . . . . . . . . . . . . . . . . . . . . . . . . . . . . . . . . . 77
2.4.6 Transformation Output – By Sector . . . . . . . . . . . . . . . . . . . . . . . . . . . . . . . . . . . 78
2.5 Final Energy . . . . . . . . . . . . . . . . . . . . . . . . . . . . . . . . . . . . . . . . . . . 79
2.5.1 Primary Energy Consumption . . . . . . . . . . . . . . . . . . . . . . . . . . . . . . . . . . . . . . . . . . 79
2.5.2 Available for Final Consumption . . . . . . . . . . . . . . . . . . . . . . . . . . . . . . . . . . . . . . 80
2.5.3 Final Non-Energy Consumption . . . . . . . . . . . . . . . . . . . . . . . . . . . . . . . . . . . . . . . . 81
2.5.4 Final Energy Consumption . . . . . . . . . . . . . . . . . . . . . . . . . . . . . . . . . . . . . . . . . . . . . . 82
2.6 Electricity . . . . . . . . . . . . . . . . . . . . . . . . . . . . . . . . . . . . . . . . . . . . . 86
2.6.1 Installed Electricity Capacity . . . . . . . . . . . . . . . . . . . . . . . . . . . . . . . . . . . . . . . . . . 86
2.6.2 Gross Electricity Generation . . . . . . . . . . . . . . . . . . . . . . . . . . . . . . . . . . . . . . . . . . . . 89
2.6.3 Market Share of the Largest Electricity Producer . . . . . . . . . . . . . . . . . . 94

34
PART 2 Energy in the EU
2.7 Solar and Wind Energy . . . . . . . . . . . . . . . . . . . . . . . . . . . . . . . . . . 95
2.7.1 Solar and Wind Energy – Cumulative Capacity . . . . . . . . . . . . . . . . . . . . . . 95
2.7.2 Wind Cumulative Installed Capacity . . . . . . . . . . . . . . . . . . . . . . . . . . . . . . . . . . 97
2.7.3 Wind Gross Electricity Production . . . . . . . . . . . . . . . . . . . . . . . . . . . . . . . . . . . . 99
2.7.4 Wind Penetration Level . . . . . . . . . . . . . . . . . . . . . . . . . . . . . . . . . . . . . . . . . . . . . . . . 100
2.7.5 Wind Capacity Factor . . . . . . . . . . . . . . . . . . . . . . . . . . . . . . . . . . . . . . . . . . . . . . . . . . 101
2.7.6 Solar Collectors’ Surface . . . . . . . . . . . . . . . . . . . . . . . . . . . . . . . . . . . . . . . . . . . . . . 102
2.7.7 Solar Installed Capacity . . . . . . . . . . . . . . . . . . . . . . . . . . . . . . . . . . . . . . . . . . . . . . . 103
2.7.8 Solar Gross Electricity Production . . . . . . . . . . . . . . . . . . . . . . . . . . . . . . . . . . . 104
2.7.9 Solar Penetration Level . . . . . . . . . . . . . . . . . . . . . . . . . . . . . . . . . . . . . . . . . . . . . . . . 105
2.8 CHP . . . . . . . . . . . . . . . . . . . . . . . . . . . . . . . . . . . . . . . . . . . . . . . . . . 106
2.8.1 CHP Electricity . . . . . . . . . . . . . . . . . . . . . . . . . . . . . . . . . . . . . . . . . . . . . . . . . . . . . . . . . . 106
2.8.2 CHP Heat . . . . . . . . . . . . . . . . . . . . . . . . . . . . . . . . . . . . . . . . . . . . . . . . . . . . . . . . . . . . . . . . . 107
2.8.3 CHP Electricity and Heat . . . . . . . . . . . . . . . . . . . . . . . . . . . . . . . . . . . . . . . . . . . . . . 108
2.9 Heat . . . . . . . . . . . . . . . . . . . . . . . . . . . . . . . . . . . . . . . . . . . . . . . . . 109
2.9.1 Gross Heat Generation . . . . . . . . . . . . . . . . . . . . . . . . . . . . . . . . . . . . . . . . . . . . . . . . . 109
2.10 Transport . . . . . . . . . . . . . . . . . . . . . . . . . . . . . . . . . . . . . . . . . . . . . 112
2.10.1 Fuels Final Consumption . . . . . . . . . . . . . . . . . . . . . . . . . . . . . . . . . . . . . . . . . . . . . . 112
2.10.2 Biofuels . . . . . . . . . . . . . . . . . . . . . . . . . . . . . . . . . . . . . . . . . . . . . . . . . . . . . . . . . . . . . . . . . . 113
2.11 Energy Efficiency . . . . . . . . . . . . . . . . . . . . . . . . . . . . . . . . . . . . . . 115
2.11.1 Energy Intensity . . . . . . . . . . . . . . . . . . . . . . . . . . . . . . . . . . . . . . . . . . . . . . . . . . . . . . . . 115
2.11.2 Energy Consumption per Capita . . . . . . . . . . . . . . . . . . . . . . . . . . . . . . . . . . . . . 116
2.11.3 Final Electricity Consumption per Capita . . . . . . . . . . . . . . . . . . . . . . . . . . . 117
2.11.4 Primary Energy Intensity . . . . . . . . . . . . . . . . . . . . . . . . . . . . . . . . . . . . . . . . . . . . . . 118
2 .11 .5 Carbon Intensity . . . . . . . . . . . . . . . . . . . . . . . . . . . . . . . . . . . . . . . . . . . . . . . . . . . . . . . . 119
2.12 RES Indicators . . . . . . . . . . . . . . . . . . . . . . . . . . . . . . . . . . . . . . . . 120
2.12.1 RES Shares . . . . . . . . . . . . . . . . . . . . . . . . . . . . . . . . . . . . . . . . . . . . . . . . . . . . . . . . . . . . . . 120
2.13 Energy Prices . . . . . . . . . . . . . . . . . . . . . . . . . . . . . . . . . . . . . . . . . 123
2.13.1 Prices of Transport Fuels . . . . . . . . . . . . . . . . . . . . . . . . . . . . . . . . . . . . . . . . . . . . . . 123
2.13.2 Fuel Prices – Domestic Consumers . . . . . . . . . . . . . . . . . . . . . . . . . . . . . . . . . . 126
2.13.3 Fuel Prices – Industrial Consumers . . . . . . . . . . . . . . . . . . . . . . . . . . . . . . . . . . 128

35
EU ENERGY IN FIGURES 2017
2.1 Energy Supply
2.1.1 Production
ALL FUELS
Mtoe 1995 2000 2005 2010 2014 2015
EU-28 969.3 952.1 914.6 851.6 788.3 781.9
Index 1995 100 % 98 % 94 % 88 % 81 % 81 %
BE 11.83 13.61 13.72 16.19 13.32 11.59
BG 10.27 9.87 10.70 10.53 11.31 12.13
CZ 32.69 30.81 33.17 32.03 29.81 29.05
DK 16.26 28.77 30.78 22.92 15.75 15.72
DE 145.26 135.60 139.11 133.04 124.69 124.23
EE 3.89 3.55 4.39 5.60 6.58 6.50
IE 4.10 2.16 1.65 1.88 2.12 2.00
EL 9.36 10.01 10.33 9.46 8.85 8.51
ES 31.43 31.49 30.09 34.53 35.10 33.60
FR 127.36 130.14 136.20 134.90 136.94 137.56
HR 5.00 4.26 4.75 5.16 4.43 4.47
IT 29.83 28.49 30.33 33.07 36.81 36.13
CY 0.04 0.04 0.05 0.09 0.12 0.13
LV 1.43 1.47 1.87 1.98 2.38 2.35
LT 3.78 3.28 3.96 1.33 1.50 1.61
LU 0.05 0.06 0.11 0.12 0.16 0.15
HU 13.90 11.60 10.37 11.92 11.09 11.28
MT 0.00 0.00 0.00 0.00 0.01 0.02
NL 70.07 61.95 66.86 74.42 62.99 51.99
AT 8.77 9.79 9.80 11.85 11.97 11.93
PL 99.38 79.59 78.59 67.39 67.91 68.33
PT 3.38 3.89 3.62 5.80 6.19 5.51
RO 32.31 28.47 28.22 27.82 26.66 26.74
SI 2.96 3.09 3.49 3.78 3.67 3.40
SK 5.06 6.39 6.68 6.35 6.72 6.74
FI 13.13 15.16 16.95 17.99 18.72 18.17
SE 31.38 30.05 34.26 32.76 34.31 33.81
UK 256.46 268.55 204.60 148.77 108.16 118.27
PRODUCTION � ALL FUELS � 1990�2015 (Mtoe)
1 200
1 000
800
600
400
200
0
19
90
19
91
19
92
19
93
19
94
19
95
19
96
19
97
19
98
19
99
20
00
20
01
20
02
20
03
20
04
20
05
20
06
20
07
20
08
20
09
20
10
20
11
20
12
20
13
20
14
20
15
* Primary Production and Receipt, Production from Other Sources and Recycled Products.
Source: Eurostat, May 2017
Methodology and Notes: See Appendix 13 – No 2
*
EU-28

36
PART 2 Energy in the EU
* Primary Production and Receipt, Production from Other Sources and Recycled Products.
Source: Eurostat, May 2017
Methodology and Notes: See Appendix 13 – No 2
2.1.1 Production *
BY FUEL
2015
Mtoe Nucl
ear
Solid F
uels
Renew
able
s
Gase
s
Petr
ole
um
and P
roduct
s
Wast
es,
N
on-R
enew
able
EU-28 221.2 145.4 205.0 107.9 89.3 13.0
Share (%) 28.3 % 18.6 % 26.2 % 13.8 % 11.4 % 1.7 %
BE 6.73 0.01 2.96 0.00 1.22 0.68
BG 3.98 5.87 2.03 0.09 0.14 0.03
CZ 6.95 17.06 4.28 0.21 0.28 0.28
DK 0.00 0.00 3.53 4.16 7.66 0.38
DE 23.68 43.00 38.89 6.34 8.08 4.25
EE 0.00 4.20 1.29 0.00 0.95 0.07
IE 0.00 0.76 0.98 0.11 0.09 0.06
EL 0.00 5.68 2.64 0.01 0.10 0.09
ES 14.78 1.25 16.87 0.05 0.40 0.25
FR 112.84 0.00 21.42 0.03 1.94 1.35
HR 0.00 0.00 2.23 1.47 0.76 0.01
IT 0.00 0.05 23.56 5.55 5.82 1.15
CY 0.00 0.00 0.12 0.00 0.01 0.00
LV 0.00 0.00 2.33 0.00 0.01 0.01
LT 0.00 0.02 1.47 0.00 0.10 0.02
LU 0.00 0.00 0.11 0.01 0.00 0.03
HU 4.10 1.52 3.24 1.37 0.94 0.11
MT 0.00 0.00 0.02 0.00 0.00 0.00
NL 1.05 0.00 4.81 39.26 6.17 0.69
AT 0.00 0.00 9.30 1.04 0.87 0.73
PL 0.00 53.87 8.64 3.68 1.62 0.52
PT 0.00 0.00 5.18 0.00 0.20 0.12
RO 3.00 4.71 5.94 8.79 4.24 0.07
SI 1.46 0.86 1.03 0.00 0.00 0.04
SK 3.95 0.50 1.59 0.08 0.43 0.19
FI 6.00 0.84 10.39 0.01 0.70 0.24
SE 14.54 0.11 18.37 0.01 0.16 0.62
UK 18.15 5.12 11.84 35.66 46.48 1.04

37
EU ENERGY IN FIGURES 2017
2.1.1 Production *
BY FUEL � EU�28 – 1990�2015 (Mtoe)
PRODUCTION � BY FUEL � EU�28 � 2015 �% OF TOTAL�
Total = 782 Mtoe
* Primary Production and Receipt, Production from Other Sources and Recycled Products.
Source: Eurostat, May 2017
Methodology and Notes: See Appendix 13 – No 2
400
350
300
250
200
150
100
50
0
19
90
19
91
19
92
19
93
19
94
19
95
19
96
19
97
19
98
19
99
20
00
20
01
20
02
20
03
20
04
20
05
20
06
20
07
20
08
20
09
20
10
20
11
20
12
20
13
20
14
20
15
Solid Fuels
Nuclear
Petroleum and Products
Renewables
Gases
Wastes, Non-Renewable
Solid Fuels
Nuclear
Petroleum and Products
Renewables
Gases
Wastes, Non-Renewable
1.7 %
28.3 %
18.6 %26.2 %
13.8 %
11.4 %

38
PART 2 Energy in the EU
2.1.2 Net Imports
ALL FUELS
Mtoe 1995 2000 2005 2010 2014 2015
EU-28 736.76 827.10 980.19 953.73 881.24 902.12
Index 1995 100 % 112 % 133 % 129 % 120 % 122 %
BE 46.64 50.50 53.43 53.56 47.13 50.63
BG 12.83 8.54 9.28 7.08 6.16 6.59
CZ 8.60 9.41 12.64 11.59 12.79 13.54
DK 7.27 -7.37 -10.13 -3.25 2.15 2.30
DE 195.18 204.71 208.19 201.99 194.75 196.02
EE 1.81 1.63 1.50 0.87 0.62 0.48
IE 7.77 12.37 13.77 13.21 11.68 12.72
EL 18.29 22.15 23.50 21.72 17.36 18.81
ES 75.42 99.34 123.83 106.34 90.66 94.43
FR 117.06 134.08 143.96 131.95 115.33 116.84
HR 2.85 4.08 5.15 4.39 3.59 4.12
IT 134.50 152.07 160.37 149.46 116.12 121.83
CY 2.04 2.57 2.84 2.94 2.29 2.45
LV 3.36 2.36 3.10 2.22 1.90 2.37
LT 5.54 4.25 5.03 5.67 5.23 5.48
LU 3.25 3.64 4.68 4.51 4.07 4.01
HU 12.55 13.96 17.42 15.00 14.12 13.45
MT 0.84 1.46 1.63 2.37 2.05 2.23
NL 17.32 34.67 37.58 29.91 29.60 46.79
AT 18.02 19.01 24.52 21.57 21.48 20.21
PL -1.16 8.77 15.94 31.53 27.05 28.02
PT 18.02 22.07 24.85 18.59 16.15 18.30
RO 14.03 7.99 10.84 7.83 5.50 5.54
SI 3.09 3.41 3.86 3.58 2.99 3.23
SK 12.14 12.00 12.43 11.26 9.86 9.64
FI 15.91 18.22 18.95 17.84 17.06 15.66
SE 20.43 20.44 19.46 19.29 15.99 14.24
UK -36.83 -39.22 31.61 60.74 87.58 72.19
NET IMPORTS � ALL FUELS � 1990�2015 (Mtoe)
Source: Eurostat, May 2017
Methodology and Notes: See Appendix 13 – No 2
1 200
1 000
800
600
400
200
0
19
90
19
91
19
92
19
93
19
94
19
95
19
96
19
97
19
98
19
99
20
00
20
01
20
02
20
03
20
04
20
05
20
06
20
07
20
08
20
09
20
10
20
11
20
12
20
13
20
14
20
15
EU-28

39
EU ENERGY IN FIGURES 2017
Source: Eurostat, May 2017
Methodology and Notes: See Appendix 13 – No 2
2.1.2 Net Imports
BY FUEL
2015
Mtoe Net
import
s
Petr
ole
um
and P
roduct
s
Gase
s
Solid F
uels
Renew
able
s
Ele
ctri
city
EU-28 902.1 534.9 247.3 112.4 6.0 1.2
Share (%) 100 % 59.3 % 27.4 % 12.5 % 0.7 % 0.1 %
BE 50.63 31.18 13.87 3.10 0.68 1.81
BG 6.59 4.25 2.52 0.74 -0.02 -0.91
CZ 13.54 8.75 6.16 -0.29 -0.01 -1.08
DK 2.30 0.42 -1.38 1.47 1.23 0.51
DE 196.02 105.86 58.68 36.17 -0.53 -4.15
EE 0.48 0.55 0.39 -0.01 -0.37 -0.08
IE 12.72 7.49 3.62 1.46 0.09 0.06
EL 18.81 15.02 2.67 0.16 0.13 0.83
ES 94.43 60.70 23.78 10.36 -0.40 -0.01
FR 116.84 78.65 34.59 8.69 0.43 -5.51
HR 4.12 2.62 0.56 0.62 -0.27 0.58
IT 121.83 52.83 50.00 12.32 2.69 3.99
CY 2.45 2.42 0.00 0.00 0.03 0.00
LV 2.37 1.79 1.08 0.04 -0.74 0.16
LT 5.48 2.69 2.06 0.16 -0.06 0.62
LU 4.01 2.62 0.77 0.05 0.09 0.48
HU 13.45 6.45 5.22 0.80 -0.22 1.18
MT 2.23 2.13 0.00 0.00 0.01 0.09
NL 46.79 44.17 -9.37 12.30 -1.18 0.75
AT 20.21 11.25 4.99 2.71 0.41 0.87
PL 28.02 23.35 9.95 -5.61 0.36 -0.03
PT 18.30 11.01 4.07 3.21 -0.21 0.19
RO 5.54 4.89 0.16 1.03 0.04 -0.58
SI 3.23 2.34 0.66 0.20 0.03 0.00
SK 9.64 2.99 3.69 2.77 -0.02 0.21
FI 15.66 9.46 2.24 2.46 0.09 1.41
SE 14.24 12.68 0.72 1.95 0.83 -1.94
UK 72.19 26.33 25.60 15.57 2.89 1.80

40
PART 2 Energy in the EU
Source: Eurostat, May 2017
Methodology and Notes: See Appendix 13 – No 2
2.1.2 Net Imports
BY FUEL � EU�28 – 1990�2015 (Mtoe)
NET IMPORTS � BY FUEL � EU�28 � 2015 �% TOTAL�
Total = 902 Mtoe
700
600
500
400
300
200
100
0
19
90
19
91
19
92
19
93
19
94
19
95
19
96
19
97
19
98
19
99
20
00
20
01
20
02
20
03
20
04
20
05
20
06
20
07
20
08
20
09
20
10
20
11
20
12
20
13
20
14
20
15
Solid Fuels
Electricity
Petroleum and Products
Renewables
Gases
Wastes, Non-Renewable
Solid Fuels
Electricity (0.1 %)
Petroleum and Products
Renewables (0.7 %)
Gases
Wastes, Non-Renewable (0 %)
59.3 %27.4 %
12.5 %
41
EU ENERGY IN FIGURES 2017
2.1.3 Gross Inland Consumption
ALL FUELS
Mtoe 1995 2000 2005 2010 2014 2015
EU-28 1 675.00 1 730.11 1 830.86 1 764.37 1 607.75 1 627.48
Index 1995 100 % 103 % 109 % 105 % 96 % 97 %
BE 53.83 59.30 59.06 60.90 53.55 54.22
BG 22.69 18.52 19.75 17.77 17.74 18.51
CZ 41.94 41.37 45.43 45.43 42.24 42.44
DK 20.20 19.74 19.56 20.04 16.80 16.77
DE 341.64 342.33 341.93 332.49 313.24 314.20
EE 5.53 4.97 5.62 6.15 6.68 6.26
IE 11.07 14.43 15.27 15.17 13.56 14.18
EL 23.87 28.29 31.41 28.72 24.37 24.45
ES 102.08 123.64 144.22 130.25 116.68 121.42
FR 241.78 257.54 276.38 266.89 248.45 252.62
HR 7.86 8.42 9.78 9.43 8.20 8.53
IT 161.77 174.22 190.08 177.93 151.03 156.17
CY 1.97 2.41 2.54 2.74 2.23 2.27
LV 4.62 3.86 4.59 4.63 4.45 4.38
LT 8.64 7.06 8.71 6.79 6.70 6.91
LU 3.32 3.65 4.80 4.64 4.22 4.18
HU 26.18 25.30 27.61 26.60 23.82 25.20
MT 0.76 0.80 0.97 0.94 0.89 0.76
NL 75.52 78.02 84.11 85.78 76.36 77.56
AT 27.11 29.02 34.13 34.29 32.47 33.25
PL 98.83 88.65 92.22 100.68 94.33 95.43
PT 20.64 25.29 27.48 24.28 22.09 23.00
RO 46.31 36.65 39.21 35.80 32.16 32.41
SI 6.07 6.45 7.33 7.34 6.65 6.58
SK 17.72 18.30 19.03 17.86 16.18 16.43
FI 29.36 32.41 34.50 37.11 34.77 33.16
SE 51.47 48.90 50.99 50.78 48.21 45.47
UK 222.25 230.56 234.17 212.95 189.71 190.75
GROSS INLAND CONSUMPTION � ALL FUELS � 1990�2015 (Mtoe)
Source: Eurostat, May 2017
Methodology and Notes: See Appendix 13 – No 2
2 000
1 500
1 000
500
0
19
90
19
91
19
92
19
93
19
94
19
95
19
96
19
97
19
98
19
99
20
00
20
01
20
02
20
03
20
04
20
05
20
06
20
07
20
08
20
09
20
10
20
11
20
12
20
13
20
14
20
15
EU-28

42
PART 2 Energy in the EU
Source: Eurostat, May 2017
Methodology and Notes: See Appendix 13 – No 2
2.1.3 Gross Inland Consumption
BY FUEL
2015
Mtoe Petr
ole
um
and P
roduct
s
Gase
s
Solid F
uels
Nucl
ear
Renew
able
s
Wast
e,
Non-R
enew
able
Ele
ctri
city
EU-28 560.1 357.9 262.7 221.2 211.0 13.3 1.2
Share (%) 34.4 % 22.0 % 16.1 % 13.6 % 13.0 % 0.8 % 0.1 %
BE 24.22 13.97 3.18 6.73 3.63 0.68 1.81
BG 4.20 2.60 6.62 3.98 1.99 0.03 -0.91
CZ 8.96 6.48 16.58 6.95 4.28 0.28 -1.08
DK 6.47 2.87 1.73 0.00 4.76 0.43 0.51
DE 107.41 65.15 79.52 23.68 38.35 4.25 -4.15
EE 1.12 0.39 3.85 0.00 0.91 0.07 -0.08
IE 7.04 3.75 2.19 0.00 1.07 0.06 0.06
EL 12.48 2.68 5.61 0.00 2.78 0.09 0.83
ES 52.00 24.54 13.24 14.78 16.62 0.25 -0.01
FR 78.26 35.05 8.83 112.84 21.81 1.35 -5.51
HR 3.28 2.08 0.61 0.00 1.96 0.01 0.58
IT 57.16 55.30 12.30 0.00 26.27 1.15 3.99
CY 2.11 0.00 0.00 0.00 0.15 0.01 0.00
LV 1.49 1.10 0.05 0.00 1.54 0.06 0.16
LT 2.60 2.07 0.19 0.00 1.42 0.02 0.62
LU 2.63 0.77 0.05 0.00 0.21 0.03 0.48
HU 6.92 7.49 2.36 4.10 3.01 0.13 1.18
MT 0.65 0.00 0.00 0.00 0.02 0.00 0.09
NL 31.20 29.18 10.94 1.05 3.64 0.80 0.75
AT 11.96 6.88 3.18 0.00 9.65 0.73 0.87
PL 23.92 13.78 48.26 0.00 8.99 0.52 -0.03
PT 10.40 4.07 3.21 0.00 4.97 0.16 0.20
RO 9.10 8.93 5.91 3.00 5.97 0.07 -0.58
SI 2.29 0.66 1.07 1.46 1.06 0.04 0.00
SK 3.34 3.88 3.28 3.95 1.58 0.19 0.21
FI 8.76 2.24 4.03 6.00 10.49 0.24 1.41
SE 10.22 0.73 2.12 14.54 19.19 0.62 -1.94
UK 69.94 61.28 23.80 18.15 14.74 1.04 1.80

43
EU ENERGY IN FIGURES 2017
2.1.3 Gross Inland Consumption
RENEWABLES
2015
Mtoe Renew
able
s
Bio
mass
and
Renew
able
W
ast
es
Hydro
Win
d
Sola
r
Geoth
erm
al
Tide, W
ave
and O
cean
EU-28 211.0 136.2 29.3 26.0 13.1 6.5 0.0
Share (%) 13.0 % 8.4 % 1.8 % 1.6 % 0.8 % 0.4 % 0.0 %
BE 3.63 2.84 0.03 0.48 0.29 0.00 0.00
BG 1.99 1.21 0.49 0.13 0.14 0.03 0.00
CZ 4.28 3.86 0.15 0.05 0.21 0.00 0.00
DK 4.76 3.46 0.00 1.22 0.09 0.00 0.00
DE 38.35 25.70 1.63 6.81 4.00 0.21 0.00
EE 0.91 0.84 0.00 0.06 0.00 0.00 0.00
IE 1.07 0.42 0.07 0.57 0.01 0.00 0.00
EL 2.78 1.31 0.52 0.40 0.53 0.01 0.00
ES 16.62 6.75 2.42 4.24 3.19 0.02 0.00
FR 21.81 14.33 4.68 1.83 0.72 0.21 0.04
HR 1.96 1.32 0.55 0.07 0.02 0.01 0.00
IT 26.27 13.45 3.92 1.28 2.16 5.47 0.00
CY 0.15 0.05 0.00 0.02 0.08 0.00 0.00
LV 1.54 1.37 0.16 0.01 0.00 0.00 0.00
LT 1.42 1.31 0.03 0.07 0.01 0.00 0.00
LU 0.21 0.18 0.01 0.01 0.01 0.00 0.00
HU 3.01 2.81 0.02 0.06 0.02 0.11 0.00
MT 0.02 0.01 0.00 0.00 0.01 0.00 0.00
NL 3.64 2.80 0.01 0.65 0.12 0.06 0.00
AT 9.65 5.75 3.19 0.42 0.27 0.04 0.00
PL 8.99 7.83 0.16 0.93 0.05 0.02 0.00
PT 4.97 2.89 0.75 1.00 0.15 0.19 0.00
RO 5.97 3.74 1.43 0.61 0.17 0.03 0.00
SI 1.06 0.65 0.33 0.00 0.03 0.04 0.00
SK 1.58 1.19 0.33 0.00 0.05 0.01 0.00
FI 10.49 8.84 1.44 0.20 0.00 0.00 0.00
SE 19.19 11.30 6.48 1.40 0.02 0.00 0.00
UK 14.74 10.03 0.54 3.47 0.70 0.00 0.00
Source: Eurostat, May 2017
Methodology and Notes: See Appendix 13 – No 2

44
PART 2 Energy in the EU
Source: Eurostat, May 2017
Methodology and Notes: See Appendix 13 – No 2
2.1.3 Gross Inland Consumption
BY FUEL � EU�28 – 1990�2015 (Mtoe)
GROSS INLAND CONSUMPTION � BY FUEL � EU�28 � 2015 �% TOTAL�
Total = 1 627 Mtoe
700
600
500
400
300
200
100
0
19
90
19
91
19
92
19
93
19
94
19
95
19
96
19
97
19
98
19
99
20
00
20
01
20
02
20
03
20
04
20
05
20
06
20
07
20
08
20
09
20
10
20
11
20
12
20
13
20
14
20
15
Solid FuelsPetroleum and Products
Renewables
Gases
Wastes, Non-Renewable
Solid Fuels
Petroleum and Products
Nuclear
Gases
Wastes, Non-Renewable
Renewables
Nuclear
34.4 %
16.2 %
22.0 %
13.0 %
13.6 %
0.8 %

45
EU ENERGY IN FIGURES 2017
2.2 Energy Imports
2.2.1 Imports – Solid Fuels
TOTAL
Mtoe 1995 2000 2005 2010 2014 2015
EU-28 116.3 131.7 153.6 136.2 160.3 151.5
Index 1995 100 % 113 % 132 % 117 % 138 % 130 %
BE 10.34 8.41 6.01 4.39 3.87 3.16
BG 2.42 2.38 2.57 1.75 0.95 0.76
CZ 1.84 1.04 1.35 2.38 2.98 2.81
DK 7.68 3.86 3.56 2.68 2.56 1.52
DE 12.26 22.20 26.57 32.55 37.17 37.45
EE 0.35 0.33 0.07 0.05 0.05 0.01
IE 1.90 1.70 1.91 0.96 1.22 1.48
EL 0.92 0.81 0.40 0.40 0.20 0.16
ES 8.67 13.35 14.83 7.85 9.53 10.96
FR 9.60 13.55 14.14 12.37 9.25 8.70
HR 0.15 0.48 0.62 0.70 0.60 0.62
IT 13.09 13.22 16.52 14.00 13.13 12.58
CY 0.01 0.03 0.04 0.01 0.00 0.00
LV 0.17 0.06 0.08 0.12 0.05 0.04
LT 0.16 0.08 0.18 0.22 0.22 0.17
LU 0.49 0.11 0.08 0.07 0.05 0.05
HU 1.65 1.21 1.45 1.41 1.06 1.11
MT 0.00 0.00 0.00 0.00 0.00 0.00
NL 11.62 14.01 12.99 12.78 28.67 34.27
AT 2.64 3.06 3.99 3.37 3.06 2.76
PL 1.08 1.02 2.15 8.27 6.43 5.07
PT 3.86 3.97 3.23 1.63 2.60 3.21
RO 3.07 1.93 2.96 1.28 1.01 1.10
SI 0.19 0.24 0.33 0.28 0.23 0.20
SK 4.18 3.47 3.90 3.22 2.93 2.83
FI 3.86 3.55 3.36 3.98 3.65 2.55
SE 2.80 2.43 2.58 2.57 2.01 2.01
UK 11.34 15.23 27.73 16.92 26.84 15.92
IMPORTS � SOLID FUELS � TOTAL � 1990�2015 (Mtoe)
Source: Eurostat, May 2017
Methodology and Notes: See Appendix 13 – No 2
200
150
100
50
0
19
90
19
91
19
92
19
93
19
94
19
95
19
96
19
97
19
98
19
99
20
00
20
01
20
02
20
03
20
04
20
05
20
06
20
07
20
08
20
09
20
10
20
11
20
12
20
13
20
14
20
15
EU-28

46
PART 2 Energy in the EU
2.2.1 Imports – Solid Fuels
HARD COAL
Mtoe 1995 2000 2005 2010 2014 2015
EU-28 105.9 120.7 144.1 127.1 151.3 143.5
Index 1995 100 % 114 % 136 % 120 % 143 % 136 %
BE 9.44 7.46 5.70 4.09 3.45 2.69
BG 2.35 2.25 2.49 1.70 0.89 0.70
CZ 1.63 0.63 0.76 1.42 2.06 1.92
DK 7.65 3.82 3.54 2.67 2.54 1.51
DE 9.50 17.39 23.93 29.33 34.66 35.35
EE 0.05 0.06 0.04 0.05 0.05 0.01
IE 1.87 1.68 1.88 0.95 1.20 1.47
EL 0.92 0.81 0.40 0.40 0.20 0.16
ES 8.09 13.25 14.74 7.71 9.36 10.73
FR 8.91 12.49 13.00 11.41 8.71 8.29
HR 0.07 0.44 0.57 0.66 0.56 0.59
IT 12.58 12.87 15.94 13.99 12.30 12.12
CY 0.01 0.03 0.04 0.01 0.00 0.00
LV 0.17 0.05 0.07 0.11 0.05 0.04
LT 0.16 0.07 0.16 0.18 0.18 0.14
LU 0.13 0.10 0.07 0.06 0.05 0.04
HU 1.23 1.12 1.30 1.40 1.03 1.05
MT 0.00 0.00 0.00 0.00 0.00 0.00
NL 11.06 13.63 12.71 12.54 28.29 34.03
AT 2.05 2.34 3.00 2.48 2.20 2.09
PL 1.05 1.01 2.05 8.16 6.22 4.91
PT 3.84 3.97 3.22 1.63 2.59 3.20
RO 3.01 1.65 2.42 0.52 0.41 0.47
SI 0.14 0.20 0.30 0.23 0.19 0.18
SK 3.10 3.15 3.48 2.57 2.59 2.53
FI 3.67 3.21 3.01 3.68 3.36 2.24
SE 2.37 2.14 2.22 2.29 1.91 1.92
UK 10.87 14.90 27.11 16.84 26.20 15.15
IMPORTS � SOLID FUELS � HARD COAL � 1990�2015 (Mtoe)
Source: Eurostat, May 2017
Methodology and Notes: See Appendix 13 – No 2
200
150
100
50
0
19
90
19
91
19
92
19
93
19
94
19
95
19
96
19
97
19
98
19
99
20
00
20
01
20
02
20
03
20
04
20
05
20
06
20
07
20
08
20
09
20
10
20
11
20
12
20
13
20
14
20
15
EU-28

47
EU ENERGY IN FIGURES 2017
2.2.1 Imports – Solid Fuels
RANKING
Mtoe and % 1995 2015
Top 10 Ranking MS Imports EU-28 Share MS Imports EU-28
Share
Solid Fuels
1 IT 13.1 11.3 % DE 37.5 24.7 %
2 DE 12.3 10.5 % NL 34.3 22.6 %
3 NL 11.6 10.0 % UK 15.9 10.5 %
4 UK 11.3 9.7 % IT 12.6 8.3 %
5 BE 10.3 8.9 % ES 11.0 7.2 %
6 FR 9.6 8.3 % FR 8.7 5.7 %
7 ES 8.7 7.4 % PL 5.1 3.3 %
8 DK 7.7 6.6 % PT 3.2 2.1 %
9 SK 4.2 3.6 % BE 3.2 2.1 %
10 PT 3.9 3.3 % SK 2.8 1.9 %
Top 5 Total 58.6 50.4 % 111.2 73.4 %
Total EU-28 116.3 100.0 % 151.5 100.0 %
Of which: Hard Coal
1 IT 12.6 11.9 % DE 35.3 24.6 %
2 NL 11.1 10.4 % NL 34.0 23.7 %
3 UK 10.9 10.3 % UK 15.2 10.6 %
4 DE 9.5 9.0 % IT 12.1 8.4 %
5 BE 9.4 8.9 % ES 10.7 7.5 %
6 FR 8.9 8.4 % FR 8.3 5.8 %
7 ES 8.1 7.6 % PL 4.9 3.4 %
8 DK 7.6 7.2 % PT 3.2 2.2 %
9 PT 3.8 3.6 % BE 2.7 1.9 %
10 FI 3.7 3.5 % SK 2.5 1.8 %
Top 5 Total 53.4 50.5 % 107.4 74.8 %
Total EU-28 105.9 100.0 % 143.5 100.0 %
Source: Eurostat, May 2017
Methodology and Notes: See Appendix 13 – No 2

48
PART 2 Energy in the EU
SE
FI
AT
CZ
SK
BE
PT
PL
FR
ES
IT
UK
NL
DE
0 10 20 30 40
2.2.1 Imports – Solid Fuels
BY MEMBER STATE – TOP 14 IMPORTERS
1990�2015 (Mtoe)
2000
2014
2010
1990
1995
2005
2015
Source: Eurostat, May 2017
Methodology and Notes: See Appendix 13 – No 2

49
EU ENERGY IN FIGURES 2017
MT
CY
EE
LV
LU
EL
LT
SI
HR
BG
RO
HU
IE
DK
0 1 2 3 4 5 6 7 8
2.2.1 Imports – Solid Fuels
BY MEMBER STATE – LEAST 14 IMPORTERS
1990�2015 (Mtoe)
2000
2014
2010
1990
1995
2005
2015
Source: Eurostat, May 2017
Methodology and Notes: See Appendix 13 – No 2

50
PART 2 Energy in the EU
2.2.2 Imports – Petroleum and Products
TOTAL
Mtoe 1995 2000 2005 2010 2014 2015
EU-28 801.4 868.0 954.5 914.3 884.6 934.1
Index 1995 100 % 108 % 119 % 114 % 110 % 117 %
BE 44.53 52.79 58.21 56.35 58.36 60.19
BG 7.96 5.97 7.55 7.60 7.92 8.73
CZ 8.89 8.60 10.90 10.61 10.94 11.21
DK 10.32 9.88 8.69 9.38 11.77 13.80
DE 146.77 147.99 147.46 128.69 127.19 128.16
EE 1.17 0.93 1.16 1.16 1.89 1.71
IE 6.80 9.56 10.14 9.17 7.86 9.24
EL 21.43 23.81 26.44 27.05 29.48 31.36
ES 67.52 78.17 87.72 80.31 78.99 83.58
FR 102.35 114.09 122.74 105.98 96.91 100.05
HR 4.49 4.19 5.50 4.94 3.93 4.51
IT 106.72 109.37 108.86 97.87 72.33 81.13
CY 2.03 2.53 2.79 2.91 2.27 2.44
LV 2.14 1.35 2.28 1.94 2.36 2.76
LT 5.32 5.41 9.61 10.22 9.43 11.18
LU 1.78 2.39 3.16 2.86 2.69 2.62
HU 7.59 7.09 8.79 8.37 8.76 9.15
MT 0.84 1.46 1.63 2.38 2.24 2.67
NL 90.44 104.30 125.46 146.20 143.04 155.87
AT 11.02 12.29 15.39 13.70 13.35 13.81
PL 15.42 20.98 24.46 28.68 28.39 31.74
PT 17.96 17.48 19.55 15.30 15.08 17.92
RO 11.18 6.30 9.88 8.46 9.39 9.80
SI 2.35 2.69 2.85 3.28 3.75 4.08
SK 5.11 6.01 6.92 6.69 6.67 7.44
FI 12.65 15.33 15.75 16.06 17.88 16.35
SE 26.90 27.93 27.30 27.94 26.86 28.11
UK 59.68 69.14 83.34 80.18 84.89 84.47
IMPORTS � PETROLEUM AND PRODUCTS � TOTAL �
1990�2015 (Mtoe)
Source: Eurostat, May 2017
Methodology and Notes: See Appendix 13 – No 2
1 500
1 000
500
0
19
90
19
91
19
92
19
93
19
94
19
95
19
96
19
97
19
98
19
99
20
00
20
01
20
02
20
03
20
04
20
05
20
06
20
07
20
08
20
09
20
10
20
11
20
12
20
13
20
14
20
15
EU-28

51
EU ENERGY IN FIGURES 2017
2.2.2 Imports – Petroleum and Products
CRUDE AND NGL
Mtoe 1995 2000 2005 2010 2014 2015
EU-28 565.6 609.8 635.4 572.9 535.1 567.1
Index 1995 100 % 108 % 112 % 101 % 95 % 100 %
BE 26.18 34.04 31.77 33.11 32.57 32.26
BG 7.39 5.18 5.84 5.37 5.02 5.91
CZ 7.06 5.68 7.70 7.83 7.51 7.27
DK 5.43 3.77 2.71 2.69 3.44 4.15
DE 102.37 104.69 111.82 92.61 89.29 90.09
EE 0.00 0.00 0.00 0.00 0.00 0.00
IE 2.27 2.98 3.16 3.08 2.70 3.69
EL 15.51 19.60 18.92 20.40 21.10 22.34
ES 55.34 57.70 59.94 52.69 58.81 64.87
FR 78.65 86.84 85.22 64.95 54.92 58.22
HR 4.23 3.95 4.02 3.56 1.87 2.34
IT 73.82 83.27 89.91 79.59 54.90 62.87
CY 0.80 1.16 0.00 0.00 0.00 0.00
LV 0.00 0.00 0.00 0.00 0.00 0.00
LT 3.10 4.86 9.05 9.16 7.57 8.73
LU 0.00 0.00 0.00 0.00 0.00 0.00
HU 5.89 5.88 6.25 5.68 6.04 6.19
MT 0.00 0.00 0.00 0.00 0.00 0.00
NL 61.08 60.56 62.05 60.13 54.89 59.93
AT 7.56 7.28 7.88 6.70 7.62 8.02
PL 11.95 17.48 17.75 22.49 23.24 26.10
PT 13.04 11.63 13.46 11.39 10.61 14.18
RO 8.31 4.76 8.86 6.11 6.92 6.77
SI 0.49 0.13 0.00 0.00 0.00 0.00
SK 5.09 5.74 5.46 5.33 5.37 5.78
FI 8.67 11.56 10.57 11.21 12.08 11.10
SE 19.50 21.97 19.49 19.62 18.61 19.95
UK 41.91 49.11 53.57 49.24 50.03 46.34
IMPORTS � PETROLEUM AND PRODUCTS � CRUDE AND NGL �
1990�2015 (Mtoe)
Source: Eurostat, May 2017
Methodology and Notes: See Appendix 13 – No 2
700
600
500
400
300
200
100
0
19
90
19
91
19
92
19
93
19
94
19
95
19
96
19
97
19
98
19
99
20
00
20
01
20
02
20
03
20
04
20
05
20
06
20
07
20
08
20
09
20
10
20
11
20
12
20
13
20
14
20
15
EU-28

52
PART 2 Energy in the EU
2.2.2 Imports – Petroleum and Products
RANKING
Mtoe and % 1995 2015
Top 10 Ranking MS Imports EU-28 Share MS Imports EU-28
Share
Petroleum and Products
1 DE 146.8 18.3 % NL 155.9 16.7 %
2 IT 106.7 13.3 % DE 128.2 13.7 %
3 FR 102.3 12.8 % FR 100.1 10.7 %
4 NL 90.4 11.3 % UK 84.5 9.0 %
5 ES 67.5 8.4 % ES 83.6 8.9 %
6 UK 59.7 7.4 % IT 81.1 8.7 %
7 BE 44.5 5.6 % BE 60.2 6.4 %
8 SE 26.9 3.4 % PL 31.7 3.4 %
9 EL 21.4 2.7 % EL 31.4 3.4 %
10 PT 18.0 2.2 % SE 28.1 3.0 %
Top 5 Total 513.8 64.1 % 552.1 59.1 %
Total 801.4 100.0 % 934.1 100.0 %
Of which: Crude and NGL
1 DE 102.4 18.1 % DE 90.1 15.9 %
2 FR 78.7 13.9 % ES 64.9 11.4 %
3 IT 73.8 13.1 % IT 62.9 11.1 %
4 NL 61.1 10.8 % NL 59.9 10.6 %
5 ES 55.3 9.8 % FR 58.2 10.3 %
6 UK 41.9 7.4 % UK 46.3 8.2 %
7 BE 26.2 4.6 % BE 32.3 5.7 %
8 SE 19.5 3.4 % PL 26.1 4.6 %
9 EL 15.5 2.7 % EL 22.3 3.9 %
10 PT 13.0 2.3 % SE 20.0 3.5 %
Top 5 Total 371.3 65.6 % 336.0 59.2 %
Total 565.6 100.0 % 567.1 100.0 %
Source: Eurostat, May 2017
Methodology and Notes: See Appendix 13 – No 2

53
EU ENERGY IN FIGURES 2017
DK
AT
FI
PT
SE
EL
PL
BE
IT
ES
UK
FR
DE
NL
0 50 100 150 200
Source: Eurostat, May 2017
Methodology and Notes: See Appendix 13 – No 2
2.2.2 Imports – Petroleum and Products
BY MEMBER STATE – TOP 14 IMPORTERS
1990�2015 (Mtoe)
2000
2014
2010
1990
1995
2005
2015

54
PART 2 Energy in the EU
EE
CY
LU
MT
LV
SI
HR
SK
BG
HU
IE
RO
LT
CZ
0 5 10 15 20
2.2.2 Imports – Petroleum and Products
BY MEMBER STATE – LEAST 14 IMPORTERS
1990�2015 (Mtoe)
2000
2014
2010
1990
1995
2005
2015
Source: Eurostat, May 2017
Methodology and Notes: See Appendix 13 – No 2

55
EU ENERGY IN FIGURES 2017
2.2.3 Imports – Gases
TOTAL
Mtoe 1995 2000 2005 2010 2014 2015
EU-28 180.18 242.43 323.75 365.91 320.42 341.28
Index 1995 100 % 135 % 180 % 203 % 178 % 189 %
BE 10.42 13.28 14.82 19.55 13.56 15.32
BG 4.56 2.74 2.46 2.13 2.22 2.52
CZ 6.43 7.48 7.60 6.98 5.95 6.16
DK 0.00 0.00 0.00 0.14 0.56 0.59
DE 55.32 61.09 78.90 78.80 75.34 85.92
EE 0.58 0.66 0.80 0.56 0.44 0.39
IE 0.09 2.48 3.01 4.48 3.59 3.62
EL 0.00 1.69 2.33 3.23 2.47 2.67
ES 7.52 15.47 30.25 31.96 31.66 28.18
FR 28.11 36.46 41.62 42.11 40.14 39.45
HR 0.22 0.91 0.93 0.87 0.94 0.87
IT 28.56 47.05 60.16 61.72 45.67 50.18
CY 0.00 0.00 0.00 0.00 0.00 0.00
LV 1.00 1.11 1.43 0.90 0.78 1.08
LT 2.03 2.07 2.49 2.49 2.15 2.14
LU 0.56 0.67 1.18 1.20 0.84 0.77
HU 5.53 7.35 9.81 7.91 7.44 5.68
MT 0.00 0.00 0.00 0.00 0.00 0.00
NL 2.76 12.48 16.44 18.45 20.87 27.15
AT 5.47 5.32 8.03 10.19 8.31 9.43
PL 5.84 6.64 8.57 8.91 9.71 9.99
PT 0.00 2.04 3.89 4.51 3.48 4.07
RO 4.79 2.71 4.19 1.82 0.47 0.16
SI 0.75 0.82 0.93 0.86 0.62 0.66
SK 4.53 5.71 6.05 5.00 3.96 3.69
FI 2.84 3.43 3.61 3.84 2.51 2.24
SE 0.76 0.78 0.84 1.47 0.79 0.72
UK 1.51 2.01 13.42 45.86 35.96 37.62
IMPORTS � GASES � TOTAL � 1990�2015 (Mtoe)
400
300
200
100
0
19
90
19
91
19
92
19
93
19
94
19
95
19
96
19
97
19
98
19
99
20
00
20
01
20
02
20
03
20
04
20
05
20
06
20
07
20
08
20
09
20
10
20
11
20
12
20
13
20
14
20
15
Source: Eurostat, May 2017
Methodology and Notes: See Appendix 13 – No 2
EU-28

56
PART 2 Energy in the EU
2.2.3 Imports – Gases
RANKING
Mtoe and % 1995 2015
EU-28 Ranking MS Imports EU-28 Share MS Imports EU-28
Share
Gases
1 DE 55.3 30.7 % DE 85.9 25.2 %
2 IT 28.6 15.9 % IT 50.2 14.7 %
3 FR 28.1 15.6 % FR 39.5 11.6 %
4 BE 10.4 5.8 % UK 37.6 11.0 %
5 ES 7.5 4.2 % ES 28.2 8.3 %
6 CZ 6.4 3.6 % NL 27.2 8.0 %
7 PL 5.8 3.2 % BE 15.3 4.5 %
8 HU 5.5 3.1 % PL 10.0 2.9 %
9 AT 5.5 3.0 % AT 9.4 2.8 %
10 RO 4.8 2.7 % CZ 6.2 1.8 %
11 BG 4.6 2.5 % HU 5.7 1.7 %
12 SK 4.5 2.5 % PT 4.1 1.2 %
13 FI 2.8 1.6 % SK 3.7 1.1 %
14 NL 2.8 1.5 % IE 3.6 1.1 %
15 LT 2.0 1.1 % EL 2.7 0.8 %
16 UK 1.5 0.8 % BG 2.5 0.7 %
17 LV 1.0 0.6 % FI 2.2 0.7 %
18 SE 0.8 0.4 % LT 2.1 0.6 %
19 SI 0.8 0.4 % LV 1.1 0.3 %
20 EE 0.6 0.3 % HR 0.9 0.3 %
21 LU 0.6 0.3 % LU 0.8 0.2 %
22 HR 0.2 0.1 % SE 0.7 0.2 %
23 IE 0.1 0.0 % SI 0.7 0.2 %
24 DK 0.0 0.0 % DK 0.6 0.2 %
25 EL 0.0 0.0 % EE 0.4 0.1 %
26 CY 0.0 0.0 % RO 0.2 0.0 %
27 MT 0.0 0.0 % CY 0.0 0.0 %
28 PT 0.0 0.0 % MT 0.0 0.0 %
Top 5 Total 129.9 72.1 % 241.4 70.7 %
Total 180.2 100.0 % 341.3 100.0 %
Source: Eurostat, May 2017
Methodology and Notes: See Appendix 13 – No 2

57
EU ENERGY IN FIGURES 2017
IE
SK
PT
HU
CZ
AT
PL
BE
NL
ES
UK
FR
IT
DE
0 25 50 75 100
2.2.3 Imports – Gases
BY MEMBER STATE – TOP 14 IMPORTERS
1990�2015 (Mtoe)
2000
2014
2010
1990
1995
2005
2015
Source: Eurostat, May 2017
Methodology and Notes: See Appendix 13 – No 2

58
PART 2 Energy in the EU
MT
CY
RO
EE
DK
SI
SE
LU
HR
LV
LT
FI
BG
EL
0 1 2 3 4 5 6 7
2.2.3 Imports – Gases
BY MEMBER STATE – LEAST 14 IMPORTERS
1990�2015 (Mtoe)
Source: Eurostat, May 2017
Methodology and Notes: See Appendix 13 – No 2
2000
2014
2010
1990
1995
2005
2015

59
EU ENERGY IN FIGURES 2017
2.2.4 Imports – Electricity
TOTAL
Mtoe 1995 2000 2005 2010 2014 2015
EU-28 17.0 22.9 28.8 25.7 33.3 35.3
Index 1995 100 % 135 % 170 % 151 % 196 % 208 %
BE 0.81 1.00 1.23 1.07 1.87 2.04
BG 0.17 0.08 0.07 0.10 0.37 0.37
CZ 0.58 0.75 1.06 0.57 1.02 1.39
DK 0.35 0.72 1.11 0.91 1.09 1.35
DE 3.42 3.88 4.89 3.69 3.48 3.18
EE 0.02 0.03 0.03 0.10 0.32 0.47
IE 0.00 0.02 0.18 0.07 0.25 0.15
EL 0.12 0.15 0.48 0.73 0.81 0.95
ES 0.66 1.06 0.88 0.45 1.06 1.29
FR 0.25 0.32 0.69 1.68 0.68 0.86
HR 0.38 0.38 0.75 1.07 0.94 1.13
IT 3.32 3.86 4.32 3.95 4.02 4.37
CY 0.00 0.00 0.00 0.00 0.00 0.00
LV 0.23 0.18 0.25 0.34 0.46 0.45
LT 0.45 0.44 0.49 0.70 0.73 0.68
LU 0.49 0.55 0.55 0.63 0.60 0.65
HU 0.28 0.82 1.35 0.85 1.64 1.71
MT 0.00 0.00 0.00 0.00 0.00 0.09
NL 1.03 1.97 2.04 1.34 2.83 2.65
AT 0.63 1.19 1.75 1.71 2.30 2.53
PL 0.38 0.28 0.43 0.54 1.16 1.24
PT 0.23 0.40 0.83 0.50 0.62 0.69
RO 0.07 0.07 0.20 0.07 0.24 0.39
SI 0.06 0.36 0.80 0.74 0.62 0.78
SK 0.30 0.51 0.69 0.63 1.12 1.29
FI 0.73 1.05 1.54 1.35 1.86 1.85
SE 0.66 1.57 1.25 1.28 1.19 0.80
UK 1.41 1.23 0.96 0.61 2.00 1.95
IMPORTS � ELECTRICITY � TOTAL � 1990�2015 (Mtoe)
40
30
20
10
0
19
90
19
91
19
92
19
93
19
94
19
95
19
96
19
97
19
98
19
99
20
00
20
01
20
02
20
03
20
04
20
05
20
06
20
07
20
08
20
09
20
10
20
11
20
12
20
13
20
14
20
15
Source: Eurostat, May 2017
Methodology and Notes: See Appendix 13 – No 2
EU-28

60
PART 2 Energy in the EU
2.2.4 Imports – Electricity
RANKING
Mtoe and % 1995 2015
EU-28 Ranking MS Imports EU-28 Share MS Imports EU-28
Share
Electricity
1 DE 3.4 20.1 % IT 4.4 12.4 %
2 IT 3.3 19.6 % DE 3.2 9.0 %
3 UK 1.4 8.3 % NL 2.6 7.5 %
4 NL 1.0 6.1 % AT 2.5 7.2 %
5 BE 0.8 4.8 % BE 2.0 5.8 %
6 FI 0.7 4.3 % UK 2.0 5.5 %
7 SE 0.7 3.9 % FI 1.8 5.2 %
8 ES 0.7 3.9 % HU 1.7 4.9 %
9 AT 0.6 3.7 % CZ 1.4 3.9 %
10 CZ 0.6 3.4 % DK 1.3 3.8 %
11 LU 0.5 2.9 % SK 1.3 3.7 %
12 LT 0.5 2.7 % ES 1.3 3.6 %
13 HR 0.4 2.2 % PL 1.2 3.5 %
14 PL 0.4 2.2 % HR 1.1 3.2 %
15 DK 0.3 2.0 % EL 1.0 2.7 %
16 SK 0.3 1.7 % FR 0.9 2.4 %
17 HU 0.3 1.6 % SE 0.8 2.3 %
18 FR 0.2 1.4 % SI 0.8 2.2 %
19 LV 0.2 1.3 % PT 0.7 2.0 %
20 PT 0.2 1.3 % LT 0.7 1.9 %
21 BG 0.2 1.0 % LU 0.6 1.8 %
22 EL 0.1 0.7 % EE 0.5 1.3 %
23 RO 0.1 0.4 % LV 0.5 1.3 %
24 SI 0.1 0.4 % RO 0.4 1.1 %
25 EE 0.0 0.1 % BG 0.4 1.0 %
26 IE 0.0 0.0 % IE 0.2 0.4 %
27 CY 0.0 0.0 % MT 0.1 0.3 %
28 MT 0.0 0.0 % CY 0.0 0.0 %
Top 5 Total 10.0 58.7 % 14.8 41.8 %
Total 17.0 100.0 % 35.3 100.0 %
Source: Eurostat, May 2017
Methodology and Notes: See Appendix 13 – No 2

61
EU ENERGY IN FIGURES 2017
HR
PL
ES
SK
DK
CZ
HU
FI
UK
BE
AT
NL
DE
IT
0 1 2 3 4 5 6
2.2.4 Imports – Electricity
BY MEMBER STATE – TOP 14 IMPORTERS
1990�2015 (Mtoe)
2000
2014
2010
1990
1995
2005
2015
Source: Eurostat, May 2017
Methodology and Notes: See Appendix 13 – No 2

62
PART 2 Energy in the EU
CY
MT
IE
BG
RO
LV
EE
LU
LT
PT
SI
SE
FR
EL
0 0.5 1.0 1.5 2.0
2.2.4 Imports – Electricity
BY MEMBER STATE – LEAST 14 IMPORTERS
1990�2015 (Mtoe)
2000
2014
2010
1990
1995
2005
2015
Source: Eurostat, May 2017
Methodology and Notes: See Appendix 13 – No 2

63
EU ENERGY IN FIGURES 2017
2.2.5 Imports by Country of Origin
EU�28 � HARD COAL
TOP 15 EXTRA�EU � �ORDERED BY 2015 VOLUME�
kton 1995 2000 2005 2010 2014 2015
Russia 8 800 14 966 48 784 48 666 66 127 61 837
Colombia 11 181 22 763 24 253 36 144 48 307 51 614
United States 41 140 20 665 15 737 30 519 47 310 33 914
Australia 19 551 28 608 27 120 19 251 14 533 19 422
South Africa 32 108 41 920 51 988 17 622 22 620 16 846
Not specified 6 604 5 229 3 359 7 594 6 856 13 438
Indonesia 3 411 9 102 14 949 10 158 7 886 7 626
Canada 4 237 6 378 6 642 3 637 5 732 3 377
Mozambique 0 107 0 0 736 1 100
Kazakhstan 262 0 932 332 1 124 1 001
Ukraine 348 2 058 4 229 3 183 2 941 802
Norway 329 928 1 124 1 385 1 532 676
Venezuela 2 822 3 621 2 003 685 292 345
Chile 0 0 0 0 435 254
Vietnam 363 560 253 60 43 177
Other extra-EU 2 504 1 899 592 162 153 195
kton
Extra-EU 133 660 158 804 201 965 179 398 226 627 212 624
Intra-EU 30 115 31 206 26 519 22 090 17 024 18 750
Total Intra-EU and Extra-EU 163 775 190 010 228 484 201 488 243 651 231 374
Source: Eurostat, May 2017
Methodology and Notes: See Appendix 13 – No 2
EU�28 � HARD COAL � TOP 5 IMPORTS FROM EXTRA�EU �1990�2015�
Volume (kton)
70 000
60 000
50 000
40 000
30 000
20 000
10 000
0
19
90
19
91
19
92
19
93
19
94
19
95
19
96
19
97
19
98
19
99
20
00
20
01
20
02
20
03
20
04
20
05
20
06
20
07
20
08
20
09
20
10
20
11
20
12
20
13
20
14
20
15
Russia
Australia
Colombia
South Africa
United States

64
PART 2 Energy in the EU
2.2.5 Imports by Country of Origin
EU�28 � CRUDE OIL AND NGL
TOP 15 EXTRA�EU � �ORDERED BY 2015 VOLUME�
kton 1995 2000 2005 2010 2014 2015
Russia 76 349 120 165 191 504 182 879 150 984 153 913
Norway 102 382 115 861 97 606 73 406 67 131 66 019
Nigeria 28 633 22 530 18 617 21 783 45 170 44 276
Saudi Arabia 82 630 65 089 60 740 30 759 44 218 41 728
Iraq 0 31 317 12 290 16 945 22 836 40 019
Kazakhstan 78 9 993 26 386 29 701 32 621 35 104
Azerbaijan 0 3 712 7 255 22 922 21 940 27 296
Algeria 17 069 21 434 22 776 8 252 22 915 24 518
Angola 4 758 3 861 7 065 8 479 16 486 22 167
Mexico 7 247 9 770 10 647 6 782 10 851 13 114
Libya 47 978 45 883 50 681 53 751 16 828 12 816
Egypt 6 950 5 579 1 716 4 654 5 975 7 794
Kuwait 12 239 9 741 7 618 3 420 4 816 6 649
Venezuela 9 929 6 944 6 988 5 001 6 183 5 502
Other African countries* 0 0 510 553 3 627 5 052
other extra-EU 114 269 71 106 62 082 61 804 29 162 28 290
kton
Extra-EU 510 511 542 985 584 481 531 091 501 743 534 257
Intra-EU 50 375 62 254 48 269 39 612 30 055 30 286
Total Intra-EU and Extra-EU 560 886 605 239 632 750 570 703 531 798 564 543
Mio barrels
Extra-EU 3 743 3 981 4 285 3 894 3 678 3 917
Intra-EU 369 456 354 290 220 222
Total Intra-EU and Extra-EU 4 112 4 437 4 639 4 184 3 899 4 139
Source: Eurostat, May 2017
Methodology and Notes: See Appendix 13 – No 2
EU�28 � CRUDE OIL AND NGL � TOP 5 IMPORTS FROM EXTRA�EU �1990�2015�
Volume (kton)
240 000
200 000
160 000
120 000
80 000
40 000
0
19
90
19
91
19
92
19
93
19
94
19
95
19
96
19
97
19
98
19
99
20
00
20
01
20
02
20
03
20
04
20
05
20
06
20
07
20
08
20
09
20
10
20
11
20
12
20
13
20
14
20
15
Russia NigeriaNorway
Iraq
Saudi Arabia

65
EU ENERGY IN FIGURES 2017
2.2.5 Imports by Country of Origin
EU�28 � NATURAL GAS
TOP 8 EXTRA�EU SUPPLIERS � �ORDERED BY 2015 VOLUME�
TJ (GCV) 1995 2000 2005 2010 2014 2015
Russia 4 245 121 4 582 197 5 207 606 4 555 386 4 422 811 4 674 423
Norway 1 159 830 1 921 081 3 040 188 3 905 622 3 731 858 4 107 571
Algeria 1 362 649 2 203 075 2 256 826 1 986 974 1 451 855 1 401 603
Qatar 0 12 443 195 713 1 383 263 814 597 974 639
Not specified 61 134 334 765 937 105 957 962 763 322 794 091
Libya 54 497 33 442 209 499 381 660 248 145 269 748
Nigeria 0 172 020 436 319 576 236 179 042 259 922
Trinidad & Tobago 0 36 334 29 673 206 167 109 214 76 446
Other Extra-EU 47 267 49 082 475 679 235 075 81 174 66 274
Extra-EU 6 930 498 9 344 439 12 788 608 14 188 345 11 802 018 12 624 717
Intra-EU 1 451 229 1 933 316 2 272 283 2 833 535 3 103 701 3 251 534
Total Intra-EU and Extra-EU
8 381 727 11 277 755 15 060 891 17 021 880 14 905 719 15 876 251
Mio m3
Russia 112 079 120 699 136 283 119 665 115 166 121 689
Norway 28 968 47 879 79 259 100 851 96 680 106 837
Algeria 33 607 55 513 57 004 50 360 36 227 35 036
Qatar 0 309 4 859 34 828 20 672 24 805
Not specified 1 473 8 126 23 859 24 111 19 621 20 432
Libya 1 353 830 5 445 9 980 6 513 7 080
Nigeria 0 4 385 10 586 14 024 4 425 6 440
Trinidad & Tobago 0 902 751 5 142 2 732 1 948
Other Extra-EU 1 172 1 272 11 962 5 857 2 034 1 660
Extra-EU 178 652 239 915 330 008 364 818 304 070 325 927
Intra-EU 41 582 54 625 60 169 75 091 80 875 84 713
Total Intra-EU and Extra-EU
220 234 294 540 390 177 439 909 384 945 410 640
Source: Eurostat, May 2017
Methodology and Notes: See Appendix 13 – No 2
EU�28 � NATURAL GAS � TOP 4 IMPORTS FROM EXTRA�EU �1990�2015�
Volume (Mio m³)
140 000
120 000
100 000
80 000
60 000
40 000
20 000
0
19
90
19
91
19
92
19
93
19
94
19
95
19
96
19
97
19
98
19
99
20
00
20
01
20
02
20
03
20
04
20
05
20
06
20
07
20
08
20
09
20
10
20
11
20
12
20
13
20
14
20
15
Russia Norway QatarAlgeria

66
PART 2 Energy in the EU
2.3 Energy Import Dependency
2.3.1 Import Dependency – All Fuels *�%�
Imports from Extra-EU 1995 2000 2005 2010 2014 2015
EU-28 43.1 46.7 52.1 52.6 53.4 54.0
Index 1995 100.0 108.3 121.0 122.1 124.0 125.4
Intra and Extra-EU Imports
BE 80.8 78.1 80.1 78.2 80.0 84.3
BG 55.9 46.0 46.7 39.6 34.5 35.4
CZ 20.5 22.8 27.8 25.5 30.3 31.9
DK 33.4 -35.0 -49.8 -15.7 12.2 13.1
DE 56.8 59.4 60.5 60.3 61.7 61.9
EE 32.3 32.2 26.1 13.6 8.9 7.4
IE 69.5 84.8 89.6 86.6 85.3 88.7
EL 66.7 69.5 68.6 69.1 66.2 71.7
ES 71.7 76.6 81.4 76.7 72.9 73.3
FR 48.0 51.5 51.6 49.0 46.1 46.0
HR 36.1 48.4 52.5 46.6 43.8 48.3
IT 81.9 86.5 83.4 82.6 75.9 77.1
CY 100.5 98.6 100.7 100.8 93.2 97.7
LV 70.4 61.0 63.9 45.5 40.6 51.2
LT 63.1 59.4 56.8 81.8 78.0 78.4
LU 97.7 99.6 97.4 97.1 96.5 95.9
HU 47.9 55.2 63.1 56.4 59.3 53.4
MT 104.8 100.3 100.0 99.0 97.7 97.3
NL 20.1 38.1 37.8 30.1 33.3 52.1
AT 66.4 65.4 71.8 62.9 66.1 60.8
PL -1.2 9.9 17.2 31.3 28.6 29.3
PT 85.3 85.1 88.6 75.1 71.2 77.4
RO 30.3 21.8 27.6 21.9 17.1 17.1
SI 50.9 52.8 52.5 48.7 44.5 48.7
SK 68.5 65.6 65.3 63.1 60.9 58.7
FI 53.6 55.1 54.1 47.8 48.9 46.8
SE 38.9 40.7 36.8 36.6 32.0 30.1
UK -16.4 -16.9 13.4 28.2 45.5 37.4
* Negative Rate Indicates a Net Exporter.
Values Over 100 % Indicate Stocks Build Up.
Source: Eurostat, May 2017
Methodology and Notes: See Appendix 13 – No 2

67
EU ENERGY IN FIGURES 2017
Source: Eurostat, May 2017
Methodology and Notes: See Appendix 13 – No 2
2.3.2 Import Dependency – By FuelEU�28 � IMPORTS FROM EXTRA�EU � 1990�2015 �%�
100
90
80
70
60
50
40
30
20
10
0
19
90
19
91
19
92
19
93
19
94
19
95
19
96
19
97
19
98
19
99
20
00
20
01
20
02
20
03
20
04
20
05
20
06
20
07
20
08
20
09
20
10
20
11
20
12
20
13
20
14
20
15
Natural Gas
Solid FuelsAll Fuels Hard Coal Crude and NGL

68
PART 2 Energy in the EU
2.3.3 Import Dependency – Solid Fuels *�%�
Imports from Extra-EU 1995 2000 2005 2010 2014 2015
EU-28 21.5 30.6 39.4 39.4 45.7 42.8
Index 1995 100.0 142.5 183.5 183.7 213.0 199.4
Intra and Extra-EU Imports
BE 108.9 91.2 101.3 98.3 101.6 97.2
BG 31.8 35.1 37.0 24.7 14.5 11.2
CZ -25.5 -21.8 -16.1 -15.1 -4.2 -1.8
DK 117.9 94.9 94.4 69.4 104.9 85.0
DE 11.2 25.5 31.7 40.1 44.8 45.5
EE 8.4 9.1 0.8 -0.6 0.2 -0.3
IE 64.9 64.6 70.8 49.1 60.0 66.7
EL 11.0 8.5 4.1 5.1 2.9 2.8
ES 45.4 61.3 70.1 85.5 77.1 78.3
FR 56.8 86.4 94.5 101.0 98.6 98.4
HR 85.7 110.9 91.4 102.3 92.4 103.1
IT 105.9 104.6 99.4 101.0 98.7 100.2
CY 100.0 100.0 119.4 64.7 150.0 100.0
LV 61.6 46.2 93.9 102.8 76.7 87.0
LT 64.4 87.0 94.6 92.0 89.4 87.2
LU 100.0 100.0 100.0 100.0 100.0 100.0
HU 29.5 28.2 42.9 41.9 28.3 34.0
MT
NL 97.9 102.0 101.5 121.7 108.9 112.4
AT 75.7 83.9 99.3 99.4 100.9 85.2
PL -30.2 -29.1 -23.9 -5.2 -8.7 -11.6
PT 105.8 102.9 96.3 98.3 96.9 100.0
RO 26.5 25.6 33.4 17.6 17.4 17.4
SI 13.6 18.7 21.0 19.2 21.4 18.9
SK 76.7 80.2 88.4 75.7 83.3 84.6
FI 63.4 68.9 67.4 57.5 80.3 61.2
SE 95.4 98.3 97.2 102.2 94.7 92.3
UK 22.2 39.6 71.9 51.9 87.5 65.4
* Negative Rate Indicates a Net Exporter.
Values Over 100 % Indicate Stocks Build Up.
Source: Eurostat, May 2017
Methodology and Notes: See Appendix 13 – No 2

69
EU ENERGY IN FIGURES 2017
2.3.4 Import Dependency – Hard Coal *�%�
Imports from Extra-EU 1995 2000 2005 2010 2014 2015
EU-28 29.7 42.6 55.7 57.9 68.0 64.1
Index 1995 100.0 143.2 187.3 194.8 228.9 215.6
Intra and Extra-EU Imports
BE 108.5 90.4 100.9 100.7 103.2 96.5
BG 73.0 100.5 94.7 88.3 73.9 94.9
CZ -34.2 -56.1 -49.4 -54.3 -18.1 -9.1
DK 118.0 94.7 94.3 69.3 104.9 85.0
DE 17.1 39.2 57.5 73.7 86.5 87.6
EE 101.9 116.4 97.2 117.9 103.9 26.3
IE 105.9 93.2 100.8 79.3 96.7 102.7
EL 95.2 105.9 112.5 100.3 109.8 91.4
ES 48.5 66.8 74.4 85.4 76.8 78.2
FR 58.0 87.3 92.9 100.6 97.5 96.8
HR 73.9 112.9 90.5 102.7 92.3 102.5
IT 105.6 105.7 99.7 101.5 99.0 100.5
CY 100.0 100.0 119.4 64.7 150.0 100.0
LV 93.6 81.8 97.3 106.7 78.0 87.0
LT 69.1 100.0 102.6 95.3 97.3 90.1
LU 100.0 100.0 100.0 100.0 100.0 100.0
HU 103.5 99.0 105.1 99.5 101.0 99.3
MT
NL 97.4 101.5 100.3 122.3 109.3 112.8
AT 88.3 91.6 107.1 97.5 101.7 82.9
PL -31.7 -29.9 -21.3 3.7 1.0 -2.4
PT 105.9 103.4 96.3 98.2 96.9 100.0
RO 81.7 96.0 102.2 100.9 87.0 95.3
SI 100.0 100.5 93.8 100.9 103.8 96.7
SK 92.9 103.8 105.2 91.9 98.5 97.5
FI 89.0 97.7 102.6 85.5 118.5 89.9
SE 101.6 107.7 104.3 115.2 103.9 99.5
UK 21.8 39.4 71.3 52.1 86.8 64.5
* Negative Rate Indicates a Net Exporter.
Values Over 100 % Indicate Stocks Build Up.
Source: Eurostat, May 2017
Methodology and Notes: See Appendix 13 – No 2

70
PART 2 Energy in the EU
2.3.5 Import Dependency – Petroleum and Products *�%�
Imports from Extra-EU 1995 2000 2005 2010 2014 2015
EU-28 74.1 75.7 82.1 84.5 87.5 88.8
Index 1995 100.0 102.2 110.8 114.0 118.1 119.9
Intra and Extra-EU Imports
BE 99.6 100.2 100.8 101.4 101.1 103.8
BG 99.6 95.4 102.2 101.1 97.9 99.1
CZ 98.0 95.3 97.5 96.5 97.6 97.8
DK 11.0 -80.8 -102.7 -43.4 -9.5 5.8
DE 95.8 94.6 97.1 96.5 95.7 96.4
EE 80.2 77.4 70.8 57.5 51.6 39.3
IE 100.1 98.8 100.0 97.2 97.6 103.9
EL 98.4 100.2 97.7 98.7 99.9 105.4
ES 101.5 101.0 101.2 99.9 101.7 102.1
FR 96.9 99.5 99.3 97.7 98.5 98.5
HR 55.6 61.0 79.4 80.4 74.0 79.7
IT 93.3 96.1 91.8 93.5 88.6 89.5
CY 102.6 100.3 102.3 104.2 97.9 102.9
LV 102.6 94.8 102.2 94.4 92.4 102.9
LT 114.5 100.4 91.9 98.7 93.0 100.7
LU 98.2 102.1 99.4 99.4 100.3 99.3
HU 71.0 76.0 81.2 84.7 87.7 93.2
MT 104.8 100.3 100.1 99.2 98.3 97.8
NL 85.7 97.4 96.2 94.2 91.9 101.5
AT 89.3 89.1 91.6 89.9 91.6 94.0
PL 95.9 98.7 97.5 97.0 93.1 96.8
PT 100.6 99.4 102.3 97.5 95.5 99.7
RO 48.6 34.2 38.5 51.9 54.0 53.4
SI 97.8 101.5 101.2 99.2 97.7 99.6
SK 100.6 90.5 88.2 89.5 91.0 89.4
FI 94.6 103.5 98.4 89.4 94.8 104.5
SE 95.6 100.8 104.0 93.6 101.7 105.4
UK -57.4 -54.9 -3.2 14.1 42.1 36.4
* Negative Rate Indicates a Net Exporter.
Values Over 100 % Indicate Stocks Build Up.
Source: Eurostat, May 2017
Methodology and Notes: See Appendix 13 – No 2

71
EU ENERGY IN FIGURES 2017
2.3.6 Import Dependency – Crude and NGL *�%�
Imports from Extra-EU 1995 2000 2005 2010 2014 2015
EU-28 73.0 74.4 81.3 84.6 87.9 88.4
Index 1995 100.0 101.9 111.3 115.8 120.4 121.1
Intra and Extra-EU Imports
BE 99.8 100.2 99.5 99.9 100.1 100.0
BG 99.7 98.7 97.7 99.1 99.0 100.5
CZ 100.2 95.2 99.3 97.6 98.2 98.4
DK 6.3 -120.5 -141.3 -68.8 -19.4 -5.0
DE 96.9 93.8 97.3 97.3 97.6 97.1
EE
IE 100.2 89.8 98.8 101.6 98.1 108.2
EL 98.8 99.5 95.2 99.5 100.4 101.5
ES 99.1 100.6 100.1 99.3 100.0 99.5
FR 95.8 98.5 98.2 98.2 98.0 98.8
HR 69.2 72.1 78.9 82.2 75.6 79.6
IT 92.8 95.1 94.0 94.5 90.7 92.2
CY 96.3 98.5
LV
LT 99.5 94.5 95.3 99.0 98.8 99.5
LU
HU 71.9 78.6 81.2 85.2 89.2 91.3
MT
NL 94.2 96.7 96.7 97.6 94.4 98.0
AT 87.6 86.9 88.5 86.2 89.0 90.8
PL 97.1 99.1 97.3 98.4 96.5 100.5
PT 100.0 99.0 100.2 98.8 97.7 100.9
RO 54.9 43.5 61.3 56.5 64.1 62.4
SI 95.9 87.5
SK 101.5 97.6 97.7 99.9 101.1 99.3
FI 94.1 101.5 97.5 101.1 99.3 104.1
SE 99.3 100.6 100.4 99.0 99.4 100.7
UK -47.7 -48.0 -0.2 12.7 32.4 22.9
* Negative Rate Indicates a Net Exporter.
Values Over 100 % Indicate Stocks Build Up.
Source: Eurostat, May 2017
Methodology and Notes: See Appendix 13 – No 2

72
PART 2 Energy in the EU
2.3.7 Import Dependency – Natural Gas *�%�
Imports from Extra-EU 1995 2000 2005 2010 2014 2015
EU-28 43.4 48.9 57.1 62.2 67.3 69.1
Index 1995 100.0 112.7 131.6 143.4 155.2 159.3
Intra and Extra-EU Imports
BE 98.2 99.3 100.5 100.3 101.2 99.3
BG 99.5 93.6 87.7 92.7 94.0 97.0
CZ 98.0 99.8 97.8 84.8 96.3 95.1
DK -47.2 -64.8 -113.9 -68.3 -46.9 -48.2
DE 78.6 79.1 79.6 81.2 89.4 90.1
EE 100.0 100.0 100.0 100.0 100.0 100.0
IE 3.6 72.1 86.7 95.5 96.5 96.5
EL 0.0 99.1 99.1 99.9 99.3 99.9
ES 97.4 101.6 101.4 99.4 103.5 96.9
FR 93.0 100.0 99.3 93.0 103.6 98.7
HR 11.6 41.0 23.7 18.1 28.6 27.1
IT 63.9 81.1 84.7 90.5 89.7 90.4
CY
LV 98.9 101.9 105.6 61.8 72.1 98.6
LT 100.0 100.0 100.7 99.7 104.1 99.7
LU 100.0 100.0 100.0 100.0 99.5 99.4
HU 60.3 75.4 81.1 78.7 97.7 69.7
MT
NL -76.4 -49.1 -59.3 -61.6 -73.1 -32.1
AT 84.8 80.6 88.5 75.3 96.8 72.5
PL 64.6 66.3 69.7 69.3 72.0 72.2
PT 100.2 103.8 100.4 100.1 99.8
RO 24.9 19.8 30.1 16.8 5.0 1.8
SI 100.5 99.3 99.6 99.3 99.5 99.7
SK 86.8 98.8 97.5 99.9 104.8 95.1
FI 100.0 100.0 100.0 100.0 99.9 99.7
SE 100.0 100.0 100.0 100.0 100.0 100.0
UK 1.0 -10.7 7.0 37.9 44.9 41.8
* Negative Rate Indicates a Net Exporter.
Values Over 100 % Indicate Stocks Build Up.
Source: Eurostat, May 2017
Methodology and Notes: See Appendix 13 – No 2

73
EU ENERGY IN FIGURES 2017
2.4 Energy Transformation
2.4.1 Transformation Input – All Fuels
Mtoe 1995 2000 2005 2010 2014 2015
EU-28 1 397.3 1 434.1 1 504.2 1 398.4 1 278.3 1 304.2
Index 1995 100 % 103 % 108 % 100 % 91 % 93 %
BE 51.36 61.54 60.49 58.68 52.12 50.55
BG 23.49 18.20 20.19 18.85 18.78 19.06
CZ 33.11 30.61 35.46 35.54 33.83 32.50
DK 19.19 16.81 15.38 15.68 12.58 14.15
DE 268.82 264.63 276.08 250.59 235.29 234.01
EE 3.70 3.41 3.89 4.68 4.88 4.34
IE 6.30 8.33 8.06 7.65 6.59 7.34
EL 27.08 34.06 33.95 33.42 36.74 36.60
ES 94.09 106.42 114.63 102.18 102.13 110.69
FR 198.86 218.10 228.40 206.52 187.35 190.95
HR 6.50 6.64 6.81 5.68 4.14 4.60
IT 141.98 150.89 165.68 149.47 114.24 124.14
CY 1.48 2.07 1.08 1.18 0.90 0.92
LV 1.49 1.09 1.06 1.16 1.12 1.19
LT 8.46 8.85 13.94 11.29 9.41 10.39
LU 0.28 0.10 0.58 0.56 0.33 0.24
HU 20.05 18.95 18.77 19.60 17.01 16.86
MT 0.45 0.49 0.73 0.58 0.50 0.26
NL 82.75 83.04 85.41 85.84 81.78 85.87
AT 15.90 15.20 17.42 16.74 15.99 16.76
PL 68.92 69.51 69.86 75.97 74.66 77.65
PT 19.53 19.52 21.87 17.94 18.67 22.36
RO 36.90 26.90 29.77 23.88 23.06 23.33
SI 3.30 2.78 3.12 3.08 2.84 2.68
SK 14.26 15.55 16.64 15.01 14.42 15.07
FI 25.67 28.35 29.38 33.54 30.99 28.48
SE 45.28 44.24 46.58 45.86 44.62 43.47
UK 178.14 177.78 178.99 157.26 133.29 129.77
TRANSFORMATION INPUT � ALL FUELS � 1990�2015 (Mtoe)
2 000
1 500
1 000
500
0
19
90
19
91
19
92
19
93
19
94
19
95
19
96
19
97
19
98
19
99
20
00
20
01
20
02
20
03
20
04
20
05
20
06
20
07
20
08
20
09
20
10
20
11
20
12
20
13
20
14
20
15
Source: Eurostat, May 2017
Methodology and Notes: See Appendix 13 – No 2
EU-28

74
PART 2 Energy in the EU
2.4.2 Transformation Input – By Fuel
2015
Mtoe Tota
l,
All P
roduct
s
Solid F
uels
Petr
ole
um
and P
roduct
s
Gase
s
Nucl
ear
Renew
able
s
Wast
es
non-R
ES
EU-28 1 304.2 247.4 657.0 107.9 221.2 59.5 9.8
Share (%) 100.0 % 19.0 % 50.4 % 8.3 % 17.0 % 4.6 % 0.7 %
BE 50.55 2.23 35.48 4.07 6.73 1.29 0.50
BG 19.06 7.14 6.92 0.95 3.98 0.06 0.00
CZ 32.50 14.79 7.71 1.83 6.95 1.15 0.06
DK 14.15 1.62 9.23 0.84 0.00 2.04 0.41
DE 234.01 77.44 101.18 16.42 23.68 12.07 3.21
EE 4.34 3.62 0.04 0.29 0.00 0.36 0.04
IE 7.34 1.76 3.50 1.94 0.00 0.12 0.03
EL 36.60 5.40 29.78 1.32 0.00 0.08 0.03
ES 110.69 13.84 69.27 8.56 14.78 3.98 0.25
FR 190.95 6.90 61.58 5.01 112.84 3.11 1.19
HR 4.60 0.52 3.47 0.50 0.00 0.10 0.00
IT 124.14 11.86 79.68 20.97 0.00 10.75 0.88
CY 0.92 0.00 0.91 0.00 0.00 0.01 0.00
LV 1.19 0.00 0.00 0.76 0.00 0.43 0.00
LT 10.39 0.01 9.11 0.58 0.00 0.62 0.02
LU 0.24 0.00 0.00 0.17 0.00 0.05 0.02
HU 16.86 2.61 7.40 1.94 4.10 0.74 0.07
MT 0.26 0.00 0.26 0.00 0.00 0.00 0.00
NL 85.87 10.85 62.22 8.91 1.05 1.66 0.76
AT 16.76 2.66 9.24 2.30 0.00 2.14 0.42
PL 77.65 44.45 27.61 3.08 0.00 2.44 0.04
PT 22.36 3.25 15.69 2.34 0.00 0.98 0.10
RO 23.33 5.19 12.09 2.84 3.00 0.20 0.00
SI 2.68 1.02 0.01 0.10 1.46 0.08 0.01
SK 15.07 3.04 6.57 0.92 3.95 0.56 0.02
FI 28.48 3.94 13.24 1.61 6.00 3.42 0.19
SE 43.47 1.78 21.22 0.39 14.54 4.73 0.62
UK 129.77 21.50 63.61 19.30 18.15 6.32 0.90
Source: Eurostat, May 2017
Methodology and Notes: See Appendix 13 – No 2

75
EU ENERGY IN FIGURES 2017
2.4.3 Transformation Input – By Sector
2015
Mtoe Tota
l,
All S
ect
ors
Conventi
onal
Therm
al
Pow
er
Sta
tions
Nucl
ear
Pow
er
Sta
tions
Dis
tric
t
Heati
ng P
lants
Refi
neri
es,
Petr
ole
um
and
sub-p
roduct
s
Oth
er
Tr
ansf
orm
ati
on
Input
Indust
ry
EU-28 1 304.2 361.1 221.2 19.7 642.1 60.2
Share (%) 100.0 % 27.7 % 17.0 % 1.5 % 49.2 % 4.6 %
BE 50.55 6.58 6.73 0.00 35.47 1.76
BG 19.06 7.08 3.98 0.23 6.75 1.03
CZ 32.50 13.91 6.95 0.65 7.66 3.33
DK 14.15 4.03 0.00 0.98 9.13 0.02
DE 234.01 89.51 23.68 4.14 100.07 16.60
EE 4.34 2.84 0.00 0.30 0.00 1.20
IE 7.34 3.79 0.00 0.00 3.43 0.12
EL 36.60 7.92 0.00 0.00 28.67 0.00
ES 110.69 27.87 14.78 0.00 65.92 2.12
FR 190.95 10.99 112.84 1.69 60.98 4.46
HR 4.60 1.03 0.00 0.07 3.42 0.09
IT 124.14 46.78 0.00 0.13 75.16 2.07
CY 0.92 0.92 0.00 0.00 0.00 0.00
LV 1.19 0.97 0.00 0.20 0.00 0.02
LT 10.39 0.76 0.00 0.56 9.08 0.00
LU 0.24 0.23 0.00 0.01 0.00 0.01
HU 16.86 3.32 4.10 0.78 7.38 1.27
MT 0.26 0.26 0.00 0.00 0.00 0.00
NL 85.87 19.77 1.05 0.54 61.34 3.17
AT 16.76 4.59 0.00 0.97 9.16 2.03
PL 77.65 36.72 0.00 2.66 27.47 10.80
PT 22.36 6.65 0.00 0.00 15.44 0.26
RO 23.33 7.66 3.00 0.48 11.85 0.34
SI 2.68 1.18 1.46 0.04 0.00 0.00
SK 15.07 2.15 3.95 0.33 6.37 2.27
FI 28.48 6.35 6.00 1.46 13.04 1.63
SE 43.47 5.14 14.54 1.20 21.13 1.47
UK 129.77 42.05 18.15 2.26 63.18 4.13
Source: Eurostat, May 2017
Methodology and Notes: See Appendix 13 – No 2

76
PART 2 Energy in the EU
2.4.4 Transformation Output – All Fuels
Mtoe 1995 2000 2005 2010 2014 2015
EU-28 1 026.6 1 056.5 1 103.1 1 022.2 932.2 962.8
Index 1995 100 % 103 % 107 % 100 % 91 % 94 %
BE 39.85 49.65 48.44 46.39 43.77 43.28
BG 15.81 11.40 12.61 11.58 11.55 11.86
CZ 21.85 19.56 22.47 22.35 21.13 20.41
DK 15.83 14.01 13.32 13.47 11.37 13.40
DE 190.24 188.46 199.84 177.68 168.31 169.54
EE 1.69 1.52 1.66 1.91 1.74 1.48
IE 3.91 5.41 5.36 5.18 4.58 5.28
EL 21.19 26.84 26.24 26.55 31.11 31.92
ES 71.54 79.39 85.48 78.39 77.93 84.41
FR 127.11 140.68 142.41 123.01 106.68 109.46
HR 6.00 6.00 6.06 5.09 3.59 4.03
IT 114.66 119.80 133.23 120.58 90.60 99.55
CY 1.05 1.47 0.38 0.46 0.35 0.36
LV 1.19 0.87 0.88 0.95 0.88 0.92
LT 6.04 7.11 11.81 10.98 9.41 10.33
LU 0.18 0.04 0.35 0.34 0.20 0.14
HU 14.19 13.35 13.42 13.95 12.42 12.21
MT 0.14 0.17 0.19 0.18 0.19 0.10
NL 73.97 74.23 75.68 75.61 72.36 76.09
AT 13.45 13.36 14.91 14.41 14.21 14.78
PL 46.70 47.97 48.42 54.79 53.84 56.71
PT 16.15 15.79 17.69 15.06 15.48 18.52
RO 28.82 20.70 23.79 17.54 17.38 17.38
SI 1.65 1.24 1.24 1.24 1.13 1.13
SK 9.96 11.03 12.17 11.17 10.57 11.20
FI 19.83 22.46 23.27 26.22 24.72 22.71
SE 32.79 33.76 33.26 34.49 32.54 32.85
UK 130.84 130.20 128.51 112.71 94.17 92.72
TRANSFORMATION OUTPUT � ALL FUELS � 1990�2015 (Mtoe)
1 500
1 000
500
0
19
90
19
91
19
92
19
93
19
94
19
95
19
96
19
97
19
98
19
99
20
00
20
01
20
02
20
03
20
04
20
05
20
06
20
07
20
08
20
09
20
10
20
11
20
12
20
13
20
14
20
15
Source: Eurostat, May 2017
Methodology and Notes: See Appendix 13 – No 2
EU-28

77
EU ENERGY IN FIGURES 2017
2.4.5 Transformation Output – By Fuel
2015
Mtoe Tota
l,
All P
roduct
s
Solid F
uels
Petr
ole
um
and P
roduct
s
Gase
s
Ele
ctri
city
Deri
ved H
eat
EU-28 962.8 32.0 641.9 20.8 211.4 56.6
Share (%) 100.0 % 3.3 % 66.7 % 2.2 % 22.0 % 5.9 %
BE 43.28 0.88 35.47 0.82 5.21 0.90
BG 11.86 0.45 6.74 0.00 3.46 1.20
CZ 20.41 1.76 7.66 1.38 6.71 2.90
DK 13.40 0.00 9.12 0.00 1.22 3.06
DE 169.54 9.17 100.03 6.07 43.34 10.93
EE 1.48 0.01 0.00 0.13 0.83 0.51
IE 5.28 0.07 3.43 0.00 1.78 0.00
EL 31.92 0.00 28.67 0.00 3.20 0.05
ES 84.41 1.13 65.90 0.85 16.51 0.00
FR 109.46 2.32 60.97 1.65 41.28 3.25
HR 4.03 0.00 3.42 0.00 0.34 0.27
IT 99.55 1.35 75.14 0.83 17.05 5.18
CY 0.36 0.00 0.00 0.00 0.36 0.00
LV 0.92 0.00 0.00 0.00 0.30 0.61
LT 10.33 0.00 9.08 0.00 0.26 0.99
LU 0.14 0.00 0.00 0.00 0.09 0.06
HU 12.21 0.70 7.38 0.38 2.52 1.24
MT 0.10 0.00 0.00 0.00 0.10 0.00
NL 76.09 1.46 61.32 1.27 8.71 3.33
AT 14.78 0.96 9.16 1.03 1.63 2.00
PL 56.71 7.01 27.45 2.50 13.04 6.72
PT 18.52 0.00 15.44 0.00 2.60 0.47
RO 17.38 0.00 11.85 0.24 3.46 1.83
SI 1.13 0.00 0.00 0.00 0.92 0.21
SK 11.20 1.17 6.37 0.87 1.91 0.88
FI 22.71 0.63 13.04 0.55 4.25 4.24
SE 32.85 0.81 21.12 0.51 6.04 4.38
UK 92.72 2.12 63.16 1.75 24.26 1.42
Source: Eurostat, May 2017
Methodology and Notes: See Appendix 13 – No 2

78
PART 2 Energy in the EU
2.4.6 Transformation Output – By Sector
2015
Mtoe Tota
l,
All S
ect
ors
Conventi
onal
Therm
al
Pow
er
Sta
tions
Nucl
ear
Pow
er
Sta
tions,
Ele
ctri
city
Dis
tric
t H
eati
ng P
lants
, H
eat
Refi
neri
es,
Petr
ole
um
and
sub-p
roduct
s
Oth
er
Transf
orm
ati
on
Outp
ut
Indust
ry
EU-28 962.8 177.8 73.7 16.4 641.9 53.0
Share (%) 100.0 % 18.5 % 7.7 % 1.7 % 66.7 % 5.5 %
BE 43.28 3.87 2.24 0.00 35.47 1.70
BG 11.86 3.08 1.32 0.24 6.74 0.47
CZ 20.41 6.66 2.31 0.61 7.66 3.16
DK 13.40 3.28 0.00 1.01 9.12 0.00
DE 169.54 43.27 7.89 3.11 100.03 15.24
EE 1.48 1.10 0.00 0.24 0.00 0.14
IE 5.28 1.78 0.00 0.00 3.43 0.07
EL 31.92 3.25 0.00 0.00 28.67 0.00
ES 84.41 11.59 4.93 0.00 65.90 2.00
FR 109.46 5.56 37.61 1.35 60.97 3.97
HR 4.03 0.55 0.00 0.05 3.42 0.01
IT 99.55 22.14 0.00 0.09 75.14 2.18
CY 0.36 0.36 0.00 0.00 0.00 0.00
LV 0.92 0.76 0.00 0.16 0.00 0.01
LT 10.33 0.72 0.00 0.53 9.08 0.00
LU 0.14 0.14 0.00 0.01 0.00 0.00
HU 12.21 1.63 1.36 0.75 7.38 1.10
MT 0.10 0.10 0.00 0.00 0.00 0.00
NL 76.09 11.23 0.35 0.45 61.32 2.73
AT 14.78 2.82 0.00 0.81 9.16 1.98
PL 56.71 17.49 0.00 2.26 27.45 9.51
PT 18.52 3.07 0.00 0.00 15.44 0.01
RO 17.38 3.98 1.00 0.32 11.85 0.24
SI 1.13 0.61 0.49 0.04 0.00 0.00
SK 11.20 1.15 1.30 0.29 6.37 2.09
FI 22.71 5.06 2.00 1.44 13.04 1.18
SE 32.85 4.35 4.85 1.23 21.12 1.32
UK 92.72 18.22 6.05 1.42 63.16 3.87
Source: Eurostat, May 2017
Methodology and Notes: See Appendix 13 – No 2

79
EU ENERGY IN FIGURES 2017
Source: Eurostat, May 2017
Methodology and Notes: See Appendix 13 – No 2
2.5 Final Energy
2.5.1 Primary Energy Consumption
TOTAL
Mtoe 1995 2000 2005 2010 2014 2015
EU-28 1 567.6 1 618.0 1 713.1 1 657.4 1 508.6 1 530.7
Index 1995 100 % 103 % 109 % 106 % 96 % 98 %
BE 47.91 52.32 51.33 53.54 45.15 45.70
BG 21.46 17.54 18.91 17.35 17.23 17.90
CZ 39.63 39.27 42.48 42.50 39.29 39.93
DK 19.88 19.44 19.27 19.78 16.55 16.51
DE 318.02 317.27 317.26 309.91 291.11 292.94
EE 5.35 4.79 5.39 6.06 6.57 6.16
IE 10.49 13.75 14.75 14.82 13.35 13.96
EL 23.37 27.57 30.65 27.61 23.67 23.75
ES 94.20 114.25 135.87 123.22 112.57 117.11
FR 225.92 241.36 260.27 252.94 234.59 239.27
HR 7.05 7.77 9.11 8.83 7.66 8.00
IT 152.03 165.79 181.47 168.37 143.84 149.56
CY 1.90 2.33 2.47 2.66 2.21 2.25
LV 4.58 3.79 4.50 4.56 4.36 4.27
LT 8.10 6.40 7.98 6.13 5.69 5.80
LU 3.28 3.60 4.77 4.61 4.19 4.15
HU 24.55 23.71 25.44 24.63 21.99 23.28
MT 0.76 0.80 0.95 0.93 0.88 0.75
NL 64.46 66.04 68.89 70.45 62.23 64.59
AT 25.73 27.30 32.42 32.45 30.45 31.33
PL 95.12 84.29 87.65 95.72 89.17 90.00
PT 18.55 22.89 24.89 22.55 20.65 21.66
RO 45.07 34.77 36.74 34.33 30.64 31.29
SI 5.95 6.21 7.02 7.13 6.51 6.45
SK 16.79 16.94 17.75 16.80 15.25 15.38
FI 28.24 31.37 33.35 35.88 33.57 31.95
SE 49.48 47.17 48.70 48.67 46.24 43.70
UK 209.76 219.23 222.81 205.04 183.05 183.04
PRIMARY ENERGY CONSUMPTION � 1990�2015 (Mtoe)
2 000
1 500
1 000
500
0
19
90
19
91
19
92
19
93
19
94
19
95
19
96
19
97
19
98
19
99
20
00
20
01
20
02
20
03
20
04
20
05
20
06
20
07
20
08
20
09
20
10
20
11
20
12
20
13
20
14
20
15
EU-28

80
PART 2 Energy in the EU
Source: Eurostat, May 2017
Methodology and Notes: See Appendix 13 – No 2
2.5.2 Available for Final Consumption
Mtoe 1995 2000 2005 2010 2014 2015
EU-28 1 193.1 1 243.2 1 313.4 1 276.4 1 161.1 1 182.4
Index 1995 100 % 104 % 110 % 107 % 97 % 99 %
BE 39.93 44.83 44.42 45.66 42.73 44.46
BG 12.93 9.99 10.56 8.79 8.95 9.65
CZ 28.09 27.50 29.55 29.01 26.58 27.37
DK 15.03 15.02 15.47 15.67 13.71 14.10
DE 244.01 247.33 247.18 242.63 229.87 233.14
EE 3.04 2.69 3.00 3.02 3.15 3.03
IE 8.30 11.05 12.02 12.20 11.07 11.63
EL 16.40 19.08 21.39 19.66 16.23 17.15
ES 72.46 88.79 105.95 95.95 81.44 83.18
FR 156.87 166.22 177.09 170.66 157.05 160.34
HR 6.10 6.66 7.91 7.81 6.78 7.12
IT 124.85 133.74 145.23 137.17 118.59 121.99
CY 1.48 1.75 1.80 1.97 1.65 1.67
LV 3.94 3.28 4.11 4.17 3.99 3.89
LT 5.13 4.28 5.39 5.48 5.90 5.99
LU 3.17 3.56 4.53 4.36 4.03 4.02
HU 18.16 17.72 20.37 19.41 17.71 19.10
MT 0.41 0.44 0.40 0.52 0.56 0.58
NL 64.32 67.80 72.28 72.69 63.61 64.59
AT 22.74 25.45 29.57 30.05 28.76 29.30
PL 67.25 58.57 62.71 71.09 66.19 66.52
PT 15.92 20.22 21.69 19.81 17.18 17.29
RO 30.36 25.03 26.87 24.77 22.76 23.04
SI 4.23 4.70 5.23 5.27 4.73 4.82
SK 12.23 12.72 12.84 12.65 10.98 11.16
FI 21.92 24.76 26.44 27.50 26.39 25.43
SE 36.67 36.21 35.23 36.90 33.83 32.66
UK 157.11 163.83 164.16 151.59 136.74 139.19

81
EU ENERGY IN FIGURES 2017
Source: Eurostat, May 2017
Methodology and Notes: See Appendix 13 – No 2
2.5.3 Final Non-Energy Consumption
TOTAL
Mtoe 1995 2000 2005 2010 2014 2015
EU-28 107.4 112.2 117.8 106.9 99.1 96.8
Index 1995 100 % 104 % 110 % 100 % 92 % 90 %
BE 5.92 6.99 7.73 7.36 8.40 8.52
BG 1.23 0.98 0.85 0.42 0.51 0.61
CZ 2.32 2.09 2.95 2.93 2.95 2.52
DK 0.32 0.30 0.29 0.26 0.25 0.25
DE 23.62 25.06 24.66 22.58 22.13 21.27
EE 0.18 0.18 0.23 0.09 0.11 0.10
IE 0.57 0.68 0.52 0.34 0.21 0.22
EL 0.49 0.72 0.76 1.11 0.71 0.70
ES 7.87 9.40 8.35 7.03 4.11 4.31
FR 15.86 16.18 16.12 13.95 13.86 13.35
HR 0.81 0.66 0.68 0.60 0.54 0.53
IT 9.73 8.43 8.61 9.56 7.19 6.61
CY 0.06 0.09 0.07 0.09 0.02 0.02
LV 0.04 0.08 0.10 0.07 0.09 0.11
LT 0.54 0.66 0.73 0.66 1.01 1.12
LU 0.05 0.06 0.03 0.03 0.04 0.03
HU 1.63 1.59 2.17 1.97 1.83 1.92
MT 0.00 0.00 0.02 0.01 0.00 0.01
NL 11.07 11.99 15.22 15.34 14.13 12.96
AT 1.38 1.72 1.71 1.84 2.02 1.92
PL 3.71 4.36 4.57 4.96 5.16 5.43
PT 2.08 2.39 2.59 1.73 1.44 1.34
RO 1.24 1.88 2.47 1.47 1.52 1.13
SI 0.12 0.24 0.31 0.21 0.14 0.13
SK 0.93 1.37 1.28 1.05 0.93 1.05
FI 1.13 1.04 1.15 1.22 1.20 1.21
SE 1.99 1.73 2.29 2.11 1.97 1.77
UK 12.49 11.33 11.37 7.91 6.66 7.71

82
PART 2 Energy in the EU
Source: Eurostat, May 2017
Methodology and Notes: See Appendix 13 – No 2
2.5.4 Final Energy Consumption
TOTAL
Mtoe 1995 2000 2005 2010 2014 2015
EU-28 1 082.8 1 132.9 1 192.3 1 164.5 1 061.7 1 084.0
Index 1995 100 % 105 % 110 % 108 % 98 % 100 %
BE 34.35 37.53 36.58 37.63 34.20 35.78
BG 11.42 9.11 10.19 8.84 9.01 9.51
CZ 26.32 25.07 26.33 25.38 23.63 24.19
DK 14.82 14.72 15.50 15.52 13.52 13.95
DE 221.62 220.01 218.46 219.65 208.88 212.12
EE 2.56 2.43 2.88 2.91 2.82 2.77
IE 7.99 10.78 12.60 11.96 10.77 11.21
EL 15.81 18.68 20.96 19.00 15.52 16.50
ES 64.03 79.90 97.77 89.08 79.23 80.46
FR 143.48 155.31 160.77 155.30 140.35 144.12
HR 5.28 6.00 7.24 7.21 6.24 6.59
IT 114.58 124.72 137.15 128.46 113.35 116.44
CY 1.43 1.65 1.83 1.93 1.62 1.66
LV 3.85 3.25 4.02 4.12 3.89 3.79
LT 4.60 3.77 4.67 4.81 4.89 4.87
LU 3.11 3.50 4.48 4.32 4.00 3.99
HU 16.23 16.14 18.23 17.41 16.19 17.31
MT 0.46 0.44 0.38 0.50 0.55 0.57
NL 50.99 52.34 54.18 55.14 47.32 48.51
AT 21.37 23.69 27.84 28.17 26.74 27.37
PL 62.94 55.21 58.47 66.33 61.60 62.25
PT 13.85 17.92 19.01 18.10 15.77 16.04
RO 26.97 22.77 24.71 22.59 21.72 21.89
SI 4.09 4.46 4.90 5.04 4.59 4.69
SK 11.03 10.98 11.56 11.55 9.98 10.08
FI 21.97 24.32 25.19 26.25 24.50 24.18
SE 35.05 34.97 33.66 34.08 31.19 31.76
UK 142.65 153.24 152.76 143.22 129.62 131.37

83
EU ENERGY IN FIGURES 2017
2.5.4 Final Energy Consumption
BY FUEL
2015
Mtoe Petr
ole
um
and P
roduct
s
Gase
s
Ele
ctri
city
Renew
able
s
Deri
ved H
eat
Solid F
uels
Wast
es,
N
on-R
enew
able
EU-28 429.6 236.3 235.7 86.8 45.9 46.3 3.5
Share (%) 39.6 % 21.8 % 21.7 % 8.0 % 4.2 % 4.3 % 0.3 %
BE 15.72 9.20 7.03 1.58 0.51 1.61 0.14
BG 3.37 1.31 2.44 1.21 0.82 0.33 0.03
CZ 6.72 5.43 4.68 2.73 2.08 2.33 0.22
DK 5.84 1.47 2.64 1.45 2.42 0.12 0.02
DE 81.12 51.76 44.26 13.96 9.59 10.40 1.03
EE 0.99 0.22 0.59 0.48 0.43 0.04 0.01
IE 6.47 1.72 2.16 0.33 0.00 0.51 0.04
EL 9.39 0.97 4.37 1.44 0.05 0.22 0.07
ES 40.47 13.45 19.95 5.29 0.00 1.31 0.00
FR 61.13 28.32 36.54 11.54 2.35 4.11 0.13
HR 2.75 0.98 1.32 1.24 0.21 0.08 0.01
IT 44.34 33.18 24.72 8.37 3.85 1.72 0.27
CY 1.18 0.00 0.35 0.11 0.00 0.00 0.01
LV 1.37 0.32 0.56 0.94 0.50 0.04 0.06
LT 1.87 0.52 0.80 0.70 0.80 0.18 0.00
LU 2.60 0.60 0.54 0.13 0.05 0.05 0.01
HU 5.13 5.45 3.11 2.17 0.97 0.43 0.06
MT 0.38 0.00 0.18 0.01 0.00 0.00 0.00
NL 17.20 17.17 8.87 1.23 2.46 1.53 0.04
AT 9.84 4.88 5.23 3.83 1.83 1.46 0.30
PL 19.19 8.98 10.99 5.45 5.46 11.69 0.49
PT 7.96 1.64 3.94 2.19 0.24 0.01 0.06
RO 7.01 5.47 3.70 3.53 1.27 0.84 0.07
SI 2.17 0.56 1.10 0.62 0.17 0.04 0.04
SK 2.12 3.09 2.10 0.64 0.63 1.32 0.17
FI 6.72 0.84 6.75 5.39 3.83 0.60 0.05
SE 8.52 0.75 10.74 6.53 4.19 1.04 0.00
UK 58.02 37.97 26.04 3.77 1.15 4.28 0.14
Source: Eurostat, May 2017
Methodology and Notes: See Appendix 13 – No 2

84
PART 2 Energy in the EU
2.5.4 Final Energy Consumption
BY SECTOR
2015
Mtoe Transp
ort
Resi
denti
al
Indust
ry
Serv
ices
Agri
cult
ure
and F
ishin
g
Oth
er
EU-28 358.6 275.2 274.7 146.9 24.7 3.8
Share (%) 33.1 % 25.4 % 25.3 % 13.6 % 2.3 % 0.4 %
BE 10.44 8.14 11.89 4.56 0.72 0.03
BG 3.40 2.20 2.71 0.99 0.19 0.02
CZ 6.49 6.69 7.47 2.85 0.61 0.07
DK 4.95 4.25 2.11 1.87 0.76 0.01
DE 63.17 53.17 60.95 34.72 0.00 0.12
EE 0.79 0.86 0.52 0.47 0.13 0.00
IE 4.62 2.71 2.41 1.25 0.22 0.00
EL 6.58 4.40 3.13 1.87 0.27 0.25
ES 33.60 14.88 18.92 10.04 2.49 0.55
FR 50.08 37.66 28.64 22.54 4.43 0.78
HR 2.11 2.42 1.09 0.74 0.23 0.00
IT 39.54 32.49 26.02 15.39 2.85 0.14
CY 0.87 0.32 0.20 0.21 0.04 0.02
LV 1.15 1.11 0.79 0.59 0.16 0.00
LT 1.83 1.37 0.98 0.58 0.10 0.01
LU 2.42 0.50 0.65 0.40 0.02 0.00
HU 4.35 5.96 4.24 2.18 0.58 0.00
MT 0.31 0.08 0.05 0.13 0.01 0.00
NL 14.27 9.56 14.27 6.55 3.76 0.09
AT 9.00 5.98 9.12 2.73 0.55 0.00
PL 17.24 18.84 15.05 7.81 3.31 0.00
PT 6.61 2.54 4.45 1.96 0.44 0.04
RO 5.58 7.38 6.47 1.76 0.46 0.25
SI 1.80 1.11 1.23 0.46 0.08 0.02
SK 2.21 1.99 4.43 1.30 0.15 0.00
FI 4.79 4.90 10.70 2.71 0.72 0.36
SE 8.67 7.20 11.53 4.00 0.37 0.00
UK 51.77 36.48 24.73 16.28 1.02 1.09
Source: Eurostat, May 2017
Methodology and Notes: See Appendix 13 – No 2

85
EU ENERGY IN FIGURES 2017
2.5.4 Final Energy Consumption
BY SECTOR – EU�28 – 1990�2015 (Mtoe)
Source: Eurostat, May 2017
Methodology and Notes: See Appendix 13 – No 2
450
400
350
300
250
200
150
100
50
0
19
90
19
91
19
92
19
93
19
94
19
95
19
96
19
97
19
98
19
99
20
00
20
01
20
02
20
03
20
04
20
05
20
06
20
07
20
08
20
09
20
10
20
11
20
12
20
13
20
14
20
15
600
500
400
300
200
100
0
19
90
19
91
19
92
19
93
19
94
19
95
19
96
19
97
19
98
19
99
20
00
20
01
20
02
20
03
20
04
20
05
20
06
20
07
20
08
20
09
20
10
20
11
20
12
20
13
20
14
20
15
ResidentialIndustry
Agriculture and FishingServices Other
Transport
Electricity
Solid Fuels Petroleum and Products
Renewables
Gases
Wastes, Non-Renewable
Derived Heat
FINAL ENERGY CONSUMPTION � BY FUEL – 1990�2015 (Mtoe)

86
PART 2 Energy in the EU
1 000 000
800 000
600 000
400 000
200 000
19
90
19
91
19
92
19
93
19
94
19
95
19
96
19
97
19
98
19
99
20
00
20
01
20
02
20
03
20
04
20
05
20
06
20
07
20
08
20
09
20
10
20
11
20
12
20
13
20
14
20
15
2.6 Electricity
2.6.1 Installed Electricity Capacity
TOTAL
MW 1995 2000 2005 2010 2014 2015
EU-28* 618 490 681 077 758 023 883 927 974 965 981 870
Index 1995 100 % 110 % 123 % 143 % 158 % 159 %
BE 14 917 15 685 16 096 18 690 20 934 21 146
BG 1 975 11 085 12 260 10 031 11 390 10 914
CZ 13 803 15 323 17 406 20 073 21 920 21 866
DK 10 823 12 316 13 036 13 438 13 624 14 005
DE 116 226 118 884 128 612 162 698 198 416 204 052
EE 1 2 800 2 559 2 751 3 030 2 857
IE 4 060 4 711 6 175 8 019 9 084 9 557
EL 8 942 10 904 13 306 15 312 18 895 18 942
ES 45 621 53 924 76 574 101 788 106 470 106 901
FR 107 616 114 665 115 755 124 551 128 942 129 309
HR 2 072 2 079 3 866 4 121 4 426 4 798
IT 65 923 75 510 85 498 106 610 121 747 116 955
CY 690 988 1 125 1 560 1 724 1 756
LV 2 068 2 092 2 166 2 557 2 924 2 933
LT 5 866 5 716 4 556 3 570 4 037 3 587
LU 1 250 1 217 1 682 1 711 2 022 2 023
HU 7 404 8 282 8 586 8 993 8 655 8 579
MT 0 0 0 572 678 667
NL 19 034 21 062 21 800 26 688 31 762 33 866
AT 17 395 17 802 18 898 21 187 24 048 24 443
PL 29 482 30 559 32 257 33 360 35 989 37 322
PT 9 384 10 908 13 374 18 932 19 125 19 625
RO 5 998 6 120 18 951 19 912 23 884 23 830
SI 2 518 2 614 2 992 3 193 3 453 3 359
SK 7 238 7 454 8 257 7 873 8 092 7 782
FI 14 434 16 260 16 468 15 536 16 245 15 875
SE 33 625 33 724 33 390 36 454 38 736 39 712
UK 70 125 78 393 82 378 93 747 94 713 95 209
INSTALLED ELECTRICITY CAPACITY � TOTAL � 1990�2015 �MW�
* No complete EU-28 data available for 1990-2000.
Source: Eurostat, May 2017
Methodology and Notes: See Appendix 13 – No 2
EU-28

87
EU ENERGY IN FIGURES 2017
2.6.1 Installed Electricity Capacity
BY FUEL
2015
MW Inst
alled
Ele
ctri
city
Capaci
ty
Com
bust
ible
Fuels
Hydro
Win
d
Nucl
ear
Sola
r PV
Oth
er
Sourc
es
EU-28 981 870 465 830 152 400 141 481 121 957 94 864 5 338
Share ( %) 100.0 % 47.4 % 15.5 % 14.4 % 12.4 % 9.7 % 0.5 %
BE 21 146 8 509 1 422 2 176 5 913 3 122 4
BG 10 914 3 991 3 219 700 1 975 1 029 0
CZ 21 866 12 960 2 260 281 4 290 2 075 0
DK 14 005 8 141 7 5 075 0 782 0
DE 204 052 96 967 11 399 44 670 10 799 39 786 431
EE 2 857 2 551 6 300 0 0 0
IE 9 557 6 586 529 2 440 0 2 0
EL 18 942 10 855 3 392 2 091 0 2 604 0
ES 106 901 49 350 20 053 22 943 7 399 4 856 2 300
FR 129 309 22 553 25 278 10 217 63 130 6 755 1 376
HR 4 798 2 124 2 208 418 0 48 0
IT 116 955 65 617 22 220 9 137 0 18 892 1 089
CY 1 756 1 522 0 158 0 76 0
LV 2 933 1 275 1 589 69 0 0 0
LT 3 587 2 180 877 436 0 69 25
LU 2 023 513 1 330 64 0 116 0
HU 8 579 6 011 57 329 2 000 168 14
MT 667 593 0 0 0 74 0
NL 33 866 28 401 37 3 391 485 1 515 37
AT 24 443 7 665 13 351 2 489 0 937 1
PL 37 322 29 956 2 370 4 886 0 108 2
PT 19 625 8 048 6 168 4 937 0 447 25
RO 23 830 11 233 6 730 3 130 1 411 1 326 0
SI 3 359 1 133 1 295 5 688 238 0
SK 7 782 2 754 2 522 3 1 940 533 30
FI 15 875 8 854 3 249 1 005 2 752 15 0
SE 39 712 7 751 16 329 5 840 9 688 104 0
UK 95 209 57 737 4 503 14 291 9 487 9 187 4
Source: Eurostat, May 2017
Methodology and Notes: See Appendix 13 – No 2

88
PART 2 Energy in the EU
2.6.1 Installed Electricity Capacity *
RENEWABLES
2015
MW Tota
l Renew
able
s
Hydro
Win
d
Sola
r PV
Sola
r Therm
al
Geoth
erm
al
Tide W
ave
and O
cean
EU-28 392 113 152 400 141 481 94 864 2 302 822 244
Share (%) 39.9 % 15.5 % 14.4 % 9.7 % 0.2 % 0.1 % 0.0 %
BE 6 720 1 422 2 176 3 122 0 0 0
BG 4 948 3 219 700 1 029 0 0 0
CZ 4 616 2 260 281 2 075 0 0 0
DK 5 864 7 5 075 782 0 0 0
DE 95 883 11 399 44 670 39 786 2 26 0
EE 306 6 300 0 0 0 0
IE 2 971 529 2 440 2 0 0 0
EL 8 087 3 392 2 091 2 604 0 0 0
ES 50 152 20 053 22 943 4 856 2 300 0 0
FR 42 492 25 278 10 217 6 755 0 2 240
HR 2 674 2 208 418 48 0 0 0
IT 51 017 22 220 9 137 18 892 0 768 0
CY 234 0 158 76 0 0 0
LV 1 658 1 589 69 0 0 0 0
LT 1 382 877 436 69 0 0 0
LU 1 510 1 330 64 116 0 0 0
HU 554 57 329 168 0 0 0
MT 74 0 0 74 0 0 0
NL 4 943 37 3 391 1 515 0 0 0
AT 16 778 13 351 2 489 937 0 1 0
PL 7 364 2 370 4 886 108 0 0 0
PT 11 577 6 168 4 937 447 0 25 0
RO 11 186 6 730 3 130 1 326 0 0 0
SI 1 538 1 295 5 238 0 0 0
SK 3 058 2 522 3 533 0 0 0
FI 4 269 3 249 1 005 15 0 0 0
SE 22 273 16 329 5 840 104 0 0 0
UK 27 985 4 503 14 291 9 187 0 0 4
* Net maximum capacity.
Source: Eurostat, May 2017
Methodology and Notes: See Appendix 13 – No 2

89
EU ENERGY IN FIGURES 2017
Source: Eurostat, May 2017
Methodology and Notes: See Appendix 13 – No 2
2.6.2 Gross Electricity Generation
TOTAL
TWh 1995 2000 2005 2010 2014 2015
EU-28 2 743.6 3 035.8 3 325.8 3 366.1 3 190.8 3 234.3
Index 1995 100 % 111 % 121 % 123 % 116 % 118 %
BE 74.41 84.01 87.03 95.19 72.67 70.65
BG 41.79 40.92 44.37 46.65 47.49 49.23
CZ 60.85 73.47 82.58 85.90 86.15 83.89
DK 36.76 36.05 36.25 38.86 32.18 28.95
DE 537.28 576.54 622.58 632.98 627.80 646.89
EE 8.69 8.51 10.21 12.96 12.45 10.42
IE 17.86 23.98 25.97 28.35 26.09 28.39
EL 41.55 53.84 60.02 57.39 50.47 51.87
ES 167.09 224.47 294.08 301.53 278.75 281.02
FR 494.27 539.95 576.06 569.10 563.69 568.45
HR 9.28 11.28 13.16 14.90 13.55 11.40
IT 241.49 276.64 303.70 302.06 279.83 282.99
CY 2.50 3.37 4.38 5.32 4.35 4.53
LV 3.98 4.14 4.91 6.63 5.14 5.53
LT 13.90 11.43 14.78 5.75 4.40 4.93
LU 1.23 1.17 4.13 4.59 2.97 2.76
HU 34.02 35.19 35.76 37.37 29.39 30.34
MT 1.63 1.92 2.24 2.11 2.25 1.30
NL 81.17 89.63 99.92 119.27 103.42 110.07
AT 56.23 61.26 66.83 71.13 65.44 65.30
PL 139.01 145.18 156.94 157.66 159.06 164.94
PT 33.27 43.76 46.58 54.09 52.80 52.42
RO 59.27 51.93 59.41 60.98 65.68 66.30
SI 12.91 13.62 15.12 16.44 17.44 15.10
SK 26.77 31.16 31.46 27.86 27.40 26.90
FI 64.04 69.98 70.58 80.67 68.09 68.60
SE 148.35 145.27 158.44 148.56 153.66 162.06
UK 334.04 377.07 398.36 381.77 338.18 339.10

90
PART 2 Energy in the EU
2.6.2 Gross Electricity Generation
BY FUEL
2015
TWh Gro
ss
Ele
ctri
city
G
enera
tion
Solid F
uels
Renew
able
s
Nucl
ear
Gase
s
Petr
ole
um
and P
roduct
s
Wast
es
non-R
ES
EU-28 3 234.3 791.5 965.8 857.1 529.9 61.1 23.2
Share (%) 100.0 % 24.5 % 29.9 % 26.5 % 16.4 % 1.9 % 0.7 %
BE 70.65 2.21 15.57 26.10 24.85 0.21 1.25
BG 49.23 22.52 9.25 15.38 1.86 0.18 0.00
CZ 83.89 41.14 10.70 26.84 4.96 0.09 0.08
DK 28.95 7.11 18.96 0.00 1.82 0.31 0.75
DE 646.89 272.20 193.29 91.79 74.53 6.21 7.06
EE 10.42 8.04 1.50 0.00 0.62 0.13 0.13
IE 28.39 7.39 8.15 0.00 12.37 0.41 0.07
EL 51.87 22.11 14.90 0.00 9.09 5.66 0.11
ES 281.02 51.37 100.32 57.31 53.81 17.24 0.77
FR 568.45 9.65 94.32 437.43 22.32 2.16 2.25
HR 11.40 2.31 7.68 0.00 1.20 0.22 0.00
IT 282.99 43.20 110.34 0.00 113.05 13.38 2.43
CY 4.53 0.00 0.40 0.00 0.00 4.14 0.00
LV 5.53 0.00 2.78 0.00 2.76 0.00 0.00
LT 4.93 0.00 2.35 0.00 1.98 0.28 0.06
LU 2.76 0.00 1.86 0.00 0.83 0.00 0.07
HU 30.34 5.79 3.21 15.83 5.23 0.08 0.14
MT 1.30 0.00 0.10 0.00 0.00 1.20 0.00
NL 110.07 38.44 13.70 4.08 49.39 1.43 1.63
AT 65.30 2.98 50.78 0.00 9.88 0.86 0.78
PL 164.94 130.52 23.29 0.00 8.83 2.12 0.08
PT 52.42 14.73 25.51 0.00 10.56 1.31 0.30
RO 66.30 18.13 26.58 11.64 9.48 0.47 0.00
SI 15.10 4.39 4.64 5.65 0.40 0.02 0.01
SK 26.90 2.83 6.31 15.15 2.11 0.38 0.03
FI 68.60 8.21 30.53 23.25 5.77 0.21 0.39
SE 162.06 0.57 102.57 56.35 1.12 0.25 1.20
UK 339.10 75.63 86.29 70.35 101.12 2.13 3.58
Source: Eurostat, May 2017
Methodology and Notes: See Appendix 13 – No 2

91
EU ENERGY IN FIGURES 2017
2.6.2 Gross Electricity Generation
RENEWABLES
2015
TWh Renew
able
s
Hydro
Win
d
Bio
mass
and R
enew
able
Sola
r
Geoth
erm
al
Tide, W
ave
and O
cean
EU-28 965.8 371.2 301.9 177.9 107.9 6.5 0.5
Share (%) 100.0 % 38.4 % 31.3 % 18.4 % 11.2 % 0.7 % 0.1 %
BE 15.57 1.42 5.57 5.51 3.07 0.00 0.00
BG 9.25 6.15 1.45 0.27 1.38 0.00 0.00
CZ 10.70 3.07 0.57 4.79 2.26 0.00 0.00
DK 18.96 0.02 14.13 4.21 0.60 0.00 0.00
DE 193.29 24.90 79.21 50.32 38.73 0.13 0.00
EE 1.50 0.03 0.72 0.76 0.00 0.00 0.00
IE 8.15 1.10 6.57 0.48 0.00 0.00 0.00
EL 14.90 6.15 4.62 0.23 3.90 0.00 0.00
ES 100.32 31.37 49.33 5.76 13.86 0.00 0.00
FR 94.32 59.40 21.25 5.92 7.26 0.00 0.49
HR 7.68 6.56 0.80 0.27 0.06 0.00 0.00
IT 110.34 46.97 14.84 19.40 22.94 6.19 0.00
CY 0.40 0.00 0.22 0.05 0.13 0.00 0.00
LV 2.78 1.86 0.15 0.77 0.00 0.00 0.00
LT 2.35 1.02 0.81 0.45 0.07 0.00 0.00
LU 1.86 1.53 0.10 0.13 0.10 0.00 0.00
HU 3.21 0.23 0.69 2.16 0.12 0.00 0.00
MT 0.10 0.00 0.00 0.01 0.09 0.00 0.00
NL 13.70 0.09 7.55 4.93 1.12 0.00 0.00
AT 50.78 40.59 4.84 4.41 0.94 0.00 0.00
PL 23.29 2.44 10.86 9.94 0.06 0.00 0.00
PT 25.51 9.80 11.61 3.10 0.80 0.20 0.00
RO 26.58 17.01 7.06 0.52 1.98 0.00 0.00
SI 4.64 4.09 0.01 0.27 0.27 0.00 0.00
SK 6.31 4.14 0.01 1.66 0.51 0.00 0.00
FI 30.53 16.77 2.33 11.42 0.01 0.00 0.00
SE 102.57 75.44 16.27 10.77 0.10 0.00 0.00
UK 86.29 9.03 40.31 29.39 7.56 0.00 0.00
Source: Eurostat, May 2017
Methodology and Notes: See Appendix 13 – No 2

92
PART 2 Energy in the EU
2.6.2 Gross Electricity Generation
BY FUEL – EU�28
Share of Total (%) Solid F
uels
Renew
able
s
Nucl
ear
Gase
s
Petr
ole
um
and P
roduct
s
1990 39.3 12.6 30.6 8.6 8.6
1991 38.7 13.0 31.1 8.2 8.8
1992 37.2 13.6 31.5 8.1 9.2
1993 35.5 13.9 32.8 9.1 8.3
1994 35.1 14.1 32.2 10.2 8.1
1995 34.5 13.9 32.1 10.7 8.4
1996 33.6 13.6 32.5 12.0 8.0
1997 31.6 13.9 32.8 13.8 7.5
1998 31.2 14.4 31.9 14.6 7.5
1999 29.8 14.4 31.9 16.6 6.9
2000 30.8 14.8 31.1 16.9 6.0
2001 30.2 15.3 31.4 17.0 5.6
2002 30.4 13.9 31.5 17.7 5.9
2003 31.1 13.6 30.8 18.7 5.3
2004 29.8 14.8 30.5 19.8 4.5
2005 28.9 14.9 30.0 21.2 4.3
2006 29.2 15.5 29.4 21.3 4.0
2007 29.1 16.2 27.6 23.0 3.4
2008 26.6 17.6 27.7 24.4 3.2
2009 25.5 19.5 27.7 23.5 3.1
2010 24.6 21.1 27.2 23.7 2.6
2011 25.8 21.4 27.5 22.3 2.2
2012 27.3 24.2 26.8 18.7 2.2
2013 26.8 27.2 26.8 16.6 1.9
2014 25.3 29.2 27.5 15.4 1.8
2015 24.5 29.9 26.5 16.4 1.9
Source: Eurostat, May 2017
Methodology and Notes: See Appendix 13 – No 2

93
EU ENERGY IN FIGURES 2017
1 200
1 000
800
600
400
200
0
19
90
19
91
19
92
19
93
19
94
19
95
19
96
19
97
19
98
19
99
20
00
20
01
20
02
20
03
20
04
20
05
20
06
20
07
20
08
20
09
20
10
20
11
20
12
20
13
20
14
20
15
2.6.2 Gross Electricity Generation
BY FUEL – EU�28 – 1990�2015 (TWh)
Source: Eurostat, May 2017
Methodology and Notes: See Appendix 13 – No 2
500
400
300
200
100
0
19
90
19
91
19
92
19
93
19
94
19
95
19
96
19
97
19
98
19
99
20
00
20
01
20
02
20
03
20
04
20
05
20
06
20
07
20
08
20
09
20
10
20
11
20
12
20
13
20
14
20
15
Solar Geothermal
Wind Biomass and Renewable WastesHydro
Tide, Wave and Ocean
GROSS ELECTRICITY GENERATION � EU�28 � RENEWABLES – 1990�2015 (TWh)
Solid Fuels
Nuclear
Petroleum and Products
Renewables
Gases
Wastes non-RES
Wastes non-RES

94
PART 2 Energy in the EU
2.6.3 Market Share of the Largest Electricity Producer
% 1999 2000 2005 2010 2013 2014 2015
BE 92.3 91.1 85.0 79.1 64.9 59.8 48.5
BG
CZ 71.0 69.2 72.0 73.0 58.2 57.5 55.4
DK 40.0 36.0 33.0 46.0 41.0 36.6 33.0
DE 28.1 34.0 31.0 28.4 32.0 32.0 32.0
EE 93.0 91.0 92.0 89.0 87.0 84.8 79.8
IE 97.0 97.0 71.0 34.0 54.0 51.0 55.0
EL 98.0 97.0 97.0 85.1 67.0 71.5 70.7
ES 51.8 42.4 35.0 24.0 22.0 23.8 24.5
FR 93.8 90.2 89.1 86.5 83.8 86.8 85.7
HR 87.0 88.0 84.0 80.3 77.8
IT 71.1 46.7 38.6 28.0 27.0 29.0 27.0
CY 99.7 99.6 100.0 100.0 100.0 100.0 100.0
LV 96.5 95.8 92.7 88.0 79.8 54.8 57.4
LT 73.7 72.8 70.3 35.4 24.4 20.6 22.7
LU 85.4 58.4 61.3 43.8
HU 38.9 41.3 38.7 42.1 52.9 54.0 53.1
MT 100.0 100.0 100.0 100.0 100.0 100.0 100.0
NL
AT 21.4 32.6
PL 20.8 19.5 18.5 17.4 17.3 17.9 17.4
PT 57.8 58.5 53.9 47.2 43.9 46.5 42.5
RO 36.4 33.6 26.8 29.9 25.7
SI 50.1 56.3 57.1 52.4 51.3
SK 83.6 85.1 83.6 80.9 83.8 81.8 73.1
FI 26.0 23.3 23.0 26.6 25.3 25.2 25.9
SE 52.8 49.5 47.0 42.0 44.8 42.9 40.6
UK 21.0 20.6 20.5 21.0 29.3
Source: Eurostat, May 2017
Methodology and Notes: See Appendix 13 – No 2

95
EU ENERGY IN FIGURES 2017
300 000
200 000
100 000
0
19
90
19
91
19
92
19
93
19
94
19
95
19
96
19
97
19
98
19
99
20
00
20
01
20
02
20
03
20
04
20
05
20
06
20
07
20
08
20
09
20
10
20
11
20
12
20
13
20
14
20
15
2.7 Solar and Wind Energy
2.7.1 Solar and Wind Energy – Cumulative Capacity
TOTAL
MW 1995 2000 2005 2010 2014 2015
EU-28 2 479 12 890 42 697 114 837 218 224 238 647
BE 5 14 169 1 816 4 971 5 298
BG 0 0 8 513 1 726 1 729
CZ 0 1 23 1 940 2 346 2 356
DK 599 2 391 3 131 3 809 5 493 5 857
DE 1 155 6 209 20 431 44 734 77 429 84 458
EE 0 0 31 108 275 300
IE 6 119 517 1 375 2 213 2 442
EL 27 226 492 1 500 4 574 4 695
ES 105 2 218 9 978 25 346 30 062 30 099
FR 5 45 703 6 956 14 722 16 972
HR 0 0 6 79 372 466
IT 38 382 1 669 9 386 27 277 28 029
CY 0 0 1 89 211 234
LV 1 2 26 30 69 69
LT 0 0 1 133 357 505
LU 0 14 59 73 168 180
HU 0 0 17 295 406 497
MT 0 0 0 1 55 74
NL 252 460 1 275 2 327 3 913 4 906
AT 2 55 808 1 135 2 895 3 426
PL 0 4 121 1 108 3 863 4 994
PT 8 84 1 066 3 930 5 271 5 384
RO 0 0 1 389 4 537 4 456
SI 0 0 0 12 227 243
SK 0 0 5 22 536 536
FI 7 40 86 204 638 1 020
SE 69 212 497 2 030 5 157 5 944
UK 200 414 1 576 5 497 18 461 23 478
SOLAR AND WIND ENERGY � CUMULATIVE CAPACITY � TOTAL �
1990�2015 �MW�
Source: Eurostat, May 2017
Methodology and Notes: See Appendix 13 – No 2
EU-28

96
PART 2 Energy in the EU
30
20
10
0
19
90
19
91
19
92
19
93
19
94
19
95
19
96
19
97
19
98
19
99
20
00
20
01
20
02
20
03
20
04
20
05
20
06
20
07
20
08
20
09
20
10
20
11
20
12
20
13
20
14
20
15
2.7.1 Solar and Wind Energy – Cumulative Capacity
SHARE OF TOTAL INSTALLED ELECTRICITY CAPACITY
% 1995 2000 2005 2010 2014 2015
EU-28 0.4 1.9 5.6 13.0 22.4 24.3
BE 0.03 0.09 1.05 9.72 23.75 25.05
BG 0.00 0.00 0.07 5.11 15.15 15.84
CZ 0.00 0.01 0.13 9.66 10.70 10.77
DK 5.53 19.41 24.02 28.34 40.32 41.82
DE 0.99 5.22 15.89 27.50 39.02 41.39
EE 0.00 0.00 1.21 3.93 9.08 10.50
IE 0.15 2.53 8.37 17.15 24.36 25.55
EL 0.30 2.07 3.70 9.80 24.21 24.79
ES 0.23 4.11 13.03 24.90 28.24 28.16
FR 0.00 0.04 0.61 5.58 11.42 13.13
HR 0.00 0.00 0.16 1.92 8.40 9.71
IT 0.06 0.51 1.95 8.80 22.40 23.97
CY 0.00 0.00 0.09 5.71 12.24 13.33
LV 0.05 0.10 1.20 1.17 2.36 2.35
LT 0.00 0.00 0.02 3.73 8.84 14.08
LU 0.00 1.15 3.51 4.27 8.31 8.90
HU 0.00 0.00 0.20 3.28 4.69 5.79
MT 0.00 0.00 0.00 0.17 8.11 11.09
NL 1.32 2.18 5.85 8.72 12.32 14.49
AT 0.01 0.31 4.28 5.36 12.04 14.02
PL 0.00 0.01 0.38 3.32 10.73 13.38
PT 0.09 0.77 7.97 20.76 27.56 27.43
RO 0.00 0.00 0.01 1.95 19.00 18.70
SI 0.00 0.00 0.00 0.38 6.57 7.23
SK 0.00 0.00 0.06 0.28 6.62 6.89
FI 0.05 0.25 0.52 1.31 3.93 6.43
SE 0.21 0.63 1.49 5.57 13.31 14.97
UK 0.29 0.53 1.91 5.86 19.49 24.66
SOLAR AND WIND ENERGY � CUMULATIVE CAPACITY �
SHARE OF TOTAL � 1990�2015 �%�
Source: Eurostat, May 2017
Methodology and Notes: See Appendix 13 – No 2
EU-28

97
EU ENERGY IN FIGURES 2017
150 000
100 000
50 000
0
19
90
19
91
19
92
19
93
19
94
19
95
19
96
19
97
19
98
19
99
20
00
20
01
20
02
20
03
20
04
20
05
20
06
20
07
20
08
20
09
20
10
20
11
20
12
20
13
20
14
20
15
2.7.2 Wind Cumulative Installed Capacity
TOTAL
MW 1995 2000 2005 2010 2014 2015
EU-28 2 430 12 711 40 400 84 566 129 100 141 481
BE 5 14 167 912 1 944 2 176
BG 0 0 8 488 700 700
CZ 0 1 22 213 278 281
DK 599 2 390 3 128 3 802 4 886 5 075
DE 1 137 6 095 18 375 27 180 39 193 44 670
EE 0 0 31 108 275 300
IE 6 119 517 1 374 2 211 2 440
EL 27 226 491 1 298 1 978 2 091
ES 98 2 206 9 918 20 693 22 975 22 943
FR 3 38 690 5 912 9 068 10 217
HR 0 0 6 79 339 418
IT 22 363 1 635 5 794 8 683 9 137
CY 0 0 0 82 147 158
LV 1 2 26 30 69 69
LT 0 0 1 133 288 436
LU 0 14 35 44 58 64
HU 0 0 17 293 329 329
MT 0 0 0 0 0 0
NL 250 447 1 224 2 237 2 865 3 391
AT 1 50 778 981 2 110 2 489
PL 0 4 121 1 108 3 836 4 886
PT 8 83 1 064 3 796 4 856 4 937
RO 0 0 1 389 3 244 3 130
SI 0 0 0 0 4 5
SK 0 0 5 3 3 3
FI 6 38 82 197 627 1 005
SE 67 209 493 2 019 5 097 5 840
UK 200 412 1 565 5 401 13 037 14 291
WIND CUMULATIVE INSTALLED CAPACITY � TOTAL �
1990�2015 �MW�
Source: Eurostat, May 2017
Methodology and Notes: See Appendix 13 – No 2
EU-28

98
PART 2 Energy in the EU
2.7.2 Wind Cumulative Installed Capacity
SHARE OF TOTAL INSTALLED ELECTRICITY CAPACITY
% 1995 2000 2005 2010 2014 2015
EU-28 0.4 1.9 5.3 9.6 13.2 14.4
BE 0.0 0.1 1.0 4.9 9.3 10.3
BG 0.0 0.0 0.1 4.9 6.1 6.4
CZ 0.0 0.0 0.1 1.1 1.3 1.3
DK 5.5 19.4 24.0 28.3 35.9 36.2
DE 1.0 5.1 14.3 16.7 19.8 21.9
EE 0.0 0.0 1.2 3.9 9.1 10.5
IE 0.1 2.5 8.4 17.1 24.3 25.5
EL 0.3 2.1 3.7 8.5 10.5 11.0
ES 0.2 4.1 13.0 20.3 21.6 21.5
FR 0.0 0.0 0.6 4.7 7.0 7.9
HR 0.0 0.0 0.2 1.9 7.7 8.7
IT 0.0 0.5 1.9 5.4 7.1 7.8
CY 0.0 0.0 0.0 5.3 8.5 9.0
LV 0.0 0.1 1.2 1.2 2.4 2.4
LT 0.0 0.0 0.0 3.7 7.1 12.2
LU 0.0 1.2 2.1 2.6 2.9 3.2
HU 0.0 0.0 0.2 3.3 3.8 3.8
MT 0.0 0.0 0.0 0.0 0.0 0.0
NL 1.3 2.1 5.6 8.4 9.0 10.0
AT 0.0 0.3 4.1 4.6 8.8 10.2
PL 0.0 0.0 0.4 3.3 10.7 13.1
PT 0.1 0.8 8.0 20.1 25.4 25.2
RO 0.0 0.0 0.0 2.0 13.6 13.1
SI 0.0 0.0 0.0 0.0 0.1 0.1
SK 0.0 0.0 0.1 0.0 0.0 0.0
FI 0.0 0.2 0.5 1.3 3.9 6.3
SE 0.2 0.6 1.5 5.5 13.2 14.7
UK 0.3 0.5 1.9 5.8 13.8 15.0
Source: Eurostat, May 2017
Methodology and Notes: See Appendix 13 – No 2

99
EU ENERGY IN FIGURES 2017
Source: Eurostat, May 2017
Methodology and Notes: See Appendix 13 – No 2
400
300
200
100
0
19
90
19
91
19
92
19
93
19
94
19
95
19
96
19
97
19
98
19
99
20
00
20
01
20
02
20
03
20
04
20
05
20
06
20
07
20
08
20
09
20
10
20
11
20
12
20
13
20
14
20
15
2.7.3 Wind Gross Electricity Production
TOTAL
TWh 1995 2000 2005 2010 2014 2015
EU-28 4.1 22.2 70.5 149.4 253.1 301.9
BE 0.0 0.0 0.2 1.3 4.6 5.6
BG 0.0 0.0 0.0 0.7 1.3 1.5
CZ 0.0 0.0 0.0 0.3 0.5 0.6
DK 1.2 4.2 6.6 7.8 13.1 14.1
DE 1.7 9.4 27.2 37.8 57.4 79.2
EE 0.0 0.0 0.1 0.3 0.6 0.7
IE 0.0 0.2 1.1 2.8 5.1 6.6
EL 0.0 0.5 1.3 2.7 3.7 4.6
ES 0.3 4.7 21.2 44.3 52.0 49.3
FR 0.0 0.0 1.0 9.9 17.2 21.2
HR 0.0 0.0 0.0 0.1 0.7 0.8
IT 0.0 0.6 2.3 9.1 15.2 14.8
CY 0.0 0.0 0.0 0.0 0.2 0.2
LV 0.0 0.0 0.0 0.0 0.1 0.1
LT 0.0 0.0 0.0 0.2 0.6 0.8
LU 0.0 0.0 0.1 0.1 0.1 0.1
HU 0.0 0.0 0.0 0.5 0.7 0.7
MT 0.0 0.0 0.0 0.0 0.0 0.0
NL 0.3 0.8 2.1 4.0 5.8 7.6
AT 0.0 0.1 1.3 2.1 3.8 4.8
PL 0.0 0.0 0.1 1.7 7.7 10.9
PT 0.0 0.2 1.8 9.2 12.1 11.6
RO 0.0 0.0 0.0 0.3 6.2 7.1
SI 0.0 0.0 0.0 0.0 0.0 0.0
SK 0.0 0.0 0.0 0.0 0.0 0.0
FI 0.0 0.1 0.2 0.3 1.1 2.3
SE 0.1 0.5 0.9 3.5 11.2 16.3
UK 0.4 0.9 2.9 10.3 32.0 40.3
WIND GROSS ELECTRICITY PRODUCTION � TOTAL �
1990�2015 �TWh�
EU-28

100
PART 2 Energy in the EU
Source: Eurostat, May 2017
Methodology and Notes: See Appendix 13 – No 2
2.7.4 Wind Penetration Level
IN TOTAL GROSS ELECTRICITY GENERATION
% 1995 2000 2005 2010 2014 2015
EU-28 0.1 0.7 2.1 4.4 7.9 9.3
BE 0.0 0.0 0.3 1.4 6.4 7.9
BG 0.0 0.0 0.0 1.5 2.8 2.9
CZ 0.0 0.0 0.0 0.4 0.6 0.7
DK 3.2 11.8 18.2 20.1 40.6 48.8
DE 0.3 1.6 4.4 6.0 9.1 12.2
EE 0.0 0.0 0.5 2.1 4.9 6.9
IE 0.1 1.0 4.3 9.9 19.7 23.2
EL 0.1 0.8 2.1 4.7 7.3 8.9
ES 0.2 2.1 7.2 14.7 18.7 17.6
FR 0.0 0.0 0.2 1.7 3.1 3.7
HR 0.0 0.0 0.1 0.9 5.4 7.0
IT 0.0 0.2 0.8 3.0 5.4 5.2
CY 0.0 0.0 0.0 0.6 4.2 4.9
LV 0.0 0.1 1.0 0.7 2.7 2.7
LT 0.0 0.0 0.0 3.9 14.5 16.4
LU 0.0 2.3 1.3 1.2 2.7 3.7
HU 0.0 0.0 0.0 1.4 2.2 2.3
MT 0.0 0.0 0.0 0.0 0.0 0.0
NL 0.4 0.9 2.1 3.3 5.6 6.9
AT 0.0 0.1 2.0 2.9 5.9 7.4
PL 0.0 0.0 0.1 1.1 4.8 6.6
PT 0.0 0.4 3.8 17.0 22.9 22.1
RO 0.0 0.0 0.0 0.5 9.4 10.7
SI 0.0 0.0 0.0 0.0 0.0 0.0
SK 0.0 0.0 0.0 0.0 0.0 0.0
FI 0.0 0.1 0.2 0.4 1.6 3.4
SE 0.1 0.3 0.6 2.4 7.3 10.0
UK 0.1 0.3 0.7 2.7 9.5 11.9

101
EU ENERGY IN FIGURES 2017
Source: Eurostat, May 2017
Methodology and Notes: See Appendix 13 – No 2
2.7.5 Wind Capacity Factor
ANNUAL AVERAGE
% 1995 2000 2005 2010 2014 2015
EU-28 19.1 19.9 19.9 20.1 22.4 24.3
BE 20.5 13.0 15.5 16.2 27.1 29.2
BG 0.0 0.0 7.1 15.9 21.7 23.7
CZ 0.0 11.4 10.9 17.9 19.6 23.3
DK 22.4 20.2 24.1 23.4 30.5 31.8
DE 17.2 17.5 16.9 15.9 16.7 20.2
EE 0.0 0.0 19.9 29.3 25.1 27.2
IE 30.4 23.4 24.5 23.4 26.5 30.7
EL 14.4 22.8 29.4 23.9 21.3 25.2
ES 31.4 24.4 24.4 24.4 25.8 24.5
FR 19.0 14.4 15.9 19.2 21.7 23.7
HR 0.0 0.0 19.0 20.1 24.6 21.7
IT 4.7 17.7 16.4 18.0 19.9 18.5
CY 0.0 0.0 0.0 4.3 14.1 16.0
LV 0.0 22.8 20.6 18.6 23.3 24.3
LT 0.0 0.0 22.8 19.2 25.3 21.2
LU 0.0 22.0 16.9 14.3 15.7 18.2
HU 0.0 0.0 6.7 20.8 22.8 24.0
MT 0.0 0.0 0.0 0.0 0.0 0.0
NL 14.5 21.2 19.3 20.4 23.1 25.4
AT 11.4 15.3 19.5 24.0 20.8 22.2
PL 0.0 14.3 12.7 17.1 22.8 25.4
PT 22.8 23.1 19.0 27.6 28.5 26.8
RO 0.0 0.0 0.0 9.0 21.8 25.7
SI 0.0 0.0 0.0 0.0 11.4 13.7
SK 0.0 0.0 13.7 22.8 22.8 22.8
FI 20.9 23.4 23.7 17.0 20.1 26.4
SE 16.9 24.9 21.7 19.8 25.1 31.8
UK 22.3 26.2 21.2 21.7 28.0 32.2

102
PART 2 Energy in the EU
Source: Eurostat, May 2017
Methodology and Notes: See Appendix 13 – No 2
60 000
40 000
20 000
0
19
90
19
91
19
92
19
93
19
94
19
95
19
96
19
97
19
98
19
99
20
00
20
01
20
02
20
03
20
04
20
05
20
06
20
07
20
08
20
09
20
10
20
11
20
12
20
13
20
14
20
15
2.7.6 Solar Collectors’ Surface
1 000 m2 1995 2000 2005 2010 2014 2015
EU-28 6 543 11 052 18 291 35 537 46 251 48 152
BE 36 41 77 371 615 661
BG 0 0 0 194 327 344
CZ 0 0 85 309 507 538
DK 144 243 286 480 810 957
DE 1 166 3 251 7 099 14 044 17 987 18 625
EE 0 0 0 0 0 0
IE 2 4 13 185 300 320
EL 2 101 2 941 3 047 4 100 4 287 4 390
ES 319 403 797 2 373 3 348 3 591
FR 598 513 583 1 447 2 096 2 171
HR 0 20 41 92 162 183
IT 174 271 680 2 415 3 538 3 724
CY 0 0 730 909 993 1 009
LV 0 0 0 0 0 0
LT 0 0 0 0 0 0
LU 0 0 6 29 52 56
HU 27 36 45 140 250 280
MT 0 0 0 40 50 51
NL 139 276 422 576 644 647
AT 1 241 2 202 3 083 4 441 5 059 5 059
PL 0 0 95 656 1 730 1 900
PT 200 238 289 752 1 079 1 121
RO 0 0 0 104 143 204
SI 0 0 0 178 236 239
SK 0 0 64 123 166 171
FI 7 10 16 31 45 50
SE 135 207 371 510 475 478
UK 254 396 462 1 038 1 352 1 383
SOLAR COLLECTORS’ SURFACE � TOTAL � 1990�2015 �1 000 m2�
EU-28

103
EU ENERGY IN FIGURES 2017
Source: Eurostat, May 2017
Methodology and Notes: See Appendix 13 – No 2
150 000
100 000
50 000
0
19
90
19
91
19
92
19
93
19
94
19
95
19
96
19
97
19
98
19
99
20
00
20
01
20
02
20
03
20
04
20
05
20
06
20
07
20
08
20
09
20
10
20
11
20
12
20
13
20
14
20
15
2.7.7 Solar Installed Capacity
TOTAL
MW 1995 2000 2005 2010 2014 2015
EU-28 49 179 2 297 30 271 89 124 97 166
BE 0 0 2 904 3 027 3 122
BG 0 0 0 25 1 026 1 029
CZ 0 0 1 1 727 2 068 2 075
DK 0 1 3 7 607 782
DE 18 114 2 056 17 554 38 236 39 788
EE 0 0 0 0 0 0
IE 0 0 0 1 2 2
EL 0 0 1 202 2 596 2 604
ES 7 12 60 4 653 7 087 7 156
FR 2 7 13 1 044 5 654 6 755
HR 0 0 0 0 33 48
IT 16 19 34 3 592 18 594 18 892
CY 0 0 1 7 64 76
LV 0 0 0 0 0 0
LT 0 0 0 0 69 69
LU 0 0 24 29 110 116
HU 0 0 0 2 77 168
MT 0 0 0 1 55 74
NL 2 13 51 90 1 048 1 515
AT 1 5 30 154 785 937
PL 0 0 0 0 27 108
PT 0 1 2 134 415 447
RO 0 0 0 0 1 293 1 326
SI 0 0 0 12 223 238
SK 0 0 0 19 533 533
FI 1 2 4 7 11 15
SE 2 3 4 11 60 104
UK 0 2 11 96 5 424 9 187
SOLAR INSTALLED CAPACITY � TOTAL � 1990�2015 �MW�
EU-28

104
PART 2 Energy in the EU
Source: Eurostat, May 2017
Methodology and Notes: See Appendix 13 – No 2
150
100
50
0
19
90
19
91
19
92
19
93
19
94
19
95
19
96
19
97
19
98
19
99
20
00
20
01
20
02
20
03
20
04
20
05
20
06
20
07
20
08
20
09
20
10
20
11
20
12
20
13
20
14
20
15
2.7.8 Solar Gross Electricity Production
TOTAL
TWh 1995 2000 2005 2010 2014 2015
EU-28 0.0 0.1 1.5 23.3 97.8 107.9
BE 0.0 0.0 0.0 0.6 2.9 3.1
BG 0.0 0.0 0.0 0.0 1.3 1.4
CZ 0.0 0.0 0.0 0.6 2.1 2.3
DK 0.0 0.0 0.0 0.0 0.6 0.6
DE 0.0 0.1 1.3 11.7 36.1 38.7
EE 0.0 0.0 0.0 0.0 0.0 0.0
IE 0.0 0.0 0.0 0.0 0.0 0.0
EL 0.0 0.0 0.0 0.2 3.8 3.9
ES 0.0 0.0 0.0 7.2 13.7 13.9
FR 0.0 0.0 0.0 0.6 5.9 7.3
HR 0.0 0.0 0.0 0.0 0.0 0.1
IT 0.0 0.0 0.0 1.9 22.3 22.9
CY 0.0 0.0 0.0 0.0 0.1 0.1
LV 0.0 0.0 0.0 0.0 0.0 0.0
LT 0.0 0.0 0.0 0.0 0.1 0.1
LU 0.0 0.0 0.0 0.0 0.1 0.1
HU 0.0 0.0 0.0 0.0 0.1 0.1
MT 0.0 0.0 0.0 0.0 0.1 0.1
NL 0.0 0.0 0.0 0.1 0.8 1.1
AT 0.0 0.0 0.0 0.1 0.8 0.9
PL 0.0 0.0 0.0 0.0 0.0 0.1
PT 0.0 0.0 0.0 0.2 0.6 0.8
RO 0.0 0.0 0.0 0.0 1.6 2.0
SI 0.0 0.0 0.0 0.0 0.3 0.3
SK 0.0 0.0 0.0 0.0 0.6 0.5
FI 0.0 0.0 0.0 0.0 0.0 0.0
SE 0.0 0.0 0.0 0.0 0.0 0.1
UK 0.0 0.0 0.0 0.0 4.0 7.6
SOLAR GROSS ELECTRICITY PRODUCTION � TOTAL � 1990�2015 (TWh)
EU-28

105
EU ENERGY IN FIGURES 2017
Source: Eurostat, May 2017
Methodology and Notes: See Appendix 13 – No 2
2.7.9 Solar Penetration Level
IN TOTAL GROSS ELECTRICITY GENERATION
% 1995 2000 2005 2010 2014 2015
EU-28 0.0 0.0 0.0 0.7 3.1 3.3
BE 0.0 0.0 0.0 0.6 4.0 4.3
BG 0.0 0.0 0.0 0.0 2.6 2.8
CZ 0.0 0.0 0.0 0.7 2.5 2.7
DK 0.0 0.0 0.0 0.0 1.9 2.1
DE 0.0 0.0 0.2 1.9 5.7 6.0
EE 0.0 0.0 0.0 0.0 0.0 0.0
IE 0.0 0.0 0.0 0.0 0.0 0.0
EL 0.0 0.0 0.0 0.3 7.5 7.5
ES 0.0 0.0 0.0 2.4 4.9 4.9
FR 0.0 0.0 0.0 0.1 1.0 1.3
HR 0.0 0.0 0.0 0.0 0.3 0.5
IT 0.0 0.0 0.0 0.6 8.0 8.1
CY 0.0 0.0 0.0 0.1 1.9 2.8
LV 0.0 0.0 0.0 0.0 0.0 0.0
LT 0.0 0.0 0.0 0.0 1.7 1.5
LU 0.0 0.0 0.4 0.5 3.2 3.8
HU 0.0 0.0 0.0 0.0 0.2 0.4
MT 0.0 0.0 0.0 0.0 3.0 7.1
NL 0.0 0.0 0.0 0.0 0.8 1.0
AT 0.0 0.0 0.0 0.1 1.2 1.4
PL 0.0 0.0 0.0 0.0 0.0 0.0
PT 0.0 0.0 0.0 0.4 1.2 1.5
RO 0.0 0.0 0.0 0.0 2.5 3.0
SI 0.0 0.0 0.0 0.1 1.5 1.8
SK 0.0 0.0 0.0 0.1 2.2 1.9
FI 0.0 0.0 0.0 0.0 0.0 0.0
SE 0.0 0.0 0.0 0.0 0.0 0.1
UK 0.0 0.0 0.0 0.0 1.2 2.2

106
PART 2 Energy in the EU
Source: Eurostat, July 2017
Methodology and Notes: See Appendix 13 – No 2
2.8 CHP
2.8.1 CHP Electricity
GENERATION AND CAPACITY
CHP Electricity Generation
CHP Electrical Capacity
TWh GW
2013 2014 2015 2013 2014 2015
EU-28 378.5 331.1 362.9 113.4 119.3 119.7
BE 12.7 12.2 12.5 2.3 2.4 2.4BG 3.7 3.0 2.9 1.2 0.9 1.1CZ 12.0 11.8 11.8 4.6 4.6 4.6DK 14.1 11.5 11.6 6.3 6.2 6.1DE 78.7 74.8 78.8 27.3 37.2 37.1EE 1.2 1.2 1.2 0.5 0.5 0.4IE 2.0 2.0 2.1 0.3 0.3 0.3EL 1.9 1.9 2.0 0.6 0.6 0.6ES 24.1 23.3 22.7 3.4 3.9 3.5FR 13.9 11.6 13.9 4.8 6.2 5.6HR 1.7 0.9 0.8 0.7 0.7 0.6IT 36.7 36.7 39.5 8.3 8.6 9.0CY 0.1 0.1 0.0 0.0 0.0 0.0LV 2.4 2.4 2.5 1.2 1.1 1.1LT 1.7 1.5 1.5 1.2 1.1 1.0LU 0.4 0.4 0.4 0.5 0.1 0.1HU 3.9 3.8 4.1 1.7 2.3 1.6MT 0.0 0.0 0.0 0.0 0.0 0.0NL 34.8 30.0 29.8 9.4 9.2 9.2AT 9.9 8.5 9.0 5.6 4.0 2.8PL 26.1 24.1 26.5 8.3 8.6 8.6PT 7.2 6.8 6.5 1.4 1.4 1.3RO 6.6 6.1 5.6 2.1 1.8 1.8SI 1.2 1.2 1.2 0.4 0.4 0.4SK 22.2 - 21.1 4.4 - 3.7FI 24.3 23.0 21.7 6.1 6.0 5.8SE 15.6 12.1 13.7 4.8 5.0 4.9UK 19.7 20.3 19.4 6.2 6.3 5.9

107
EU ENERGY IN FIGURES 2017
* Data on heat capacity before 2009 is not consistent across the EU-28.
Source: Eurostat, July 2017
Methodology and Notes: See Appendix 13 – No 2
2.8.2 CHP Heat
PRODUCTION AND CAPACITY
CHP Heat Production CHP Heat Capacity*
PJ GW
2013 2014 2015 2013 2014 2015
EU-28 2 901.1 2 767.9 2 791.7 279.7 285.7 303.8
BE 27.1 107.4 104.4 5.3 5.5 5.1
BG 40.4 33.4 31.9 4.1 3.4 3.7
CZ 120.9 105.6 106.0 21.0 21.0 21.0
DK 104.6 91.1 93.3 9.7 9.6 9.5
DE 654.0 651.4 669.9 73.1 92.2 95.1
EE 12.6 12.7 12.5 1.4 1.4 1.3
IE 12.4 11.6 12.6 0.7 0.6 0.6
EL 10.5 10.1 10.9 0.8 0.8 0.7
ES 174.9 138.2 120.3 5.6 5.5 5.0
FR 150.7 132.0 154.9 12.1 13.7 14.1
HR 13.3 11.3 10.0 1.7 1.7 1.6
IT 212.8 202.5 213.2 16.3 19.8 14.2
CY 0.2 0.2 0.2 0.0 0.0 0.0
LV 11.3 11.8 12.4 3.3 1.3 1.2
LT 15.3 13.1 12.4 2.4 2.2 1.9
LU 3.4 2.5 2.4 0.9 0.2 0.2
HU 27.0 25.9 24.4 3.2 4.8 3.2
MT 0.0 0.0 0.0 0.0 0.0 0.0
NL 217.9 196.3 189.6 18.3 18.3 18.1
AT 110.8 102.5 105.9 9.2 8.9 8.6
PL 257.4 237.6 238.6 24.6 25.2 23.9
PT 68.4 69.3 59.3 4.8 4.6 4.3
RO 57.9 55.4 51.0 10.1 10.0 9.8
SI 10.8 10.2 10.4 0.7 0.7 0.7
SK 27.8 - 27.3 15.5 - 24.3
FI 251.2 247.6 242.4 15.8 15.4 15.2
SE 165.1 145.1 151.3 11.4 10.7 12.8
UK 142.5 143.3 124.2 7.7 8.2 7.6

108
PART 2 Energy in the EU
Source: Eurostat, July 2017
Methodology and Notes: See Appendix 13 – No 2
3 500
3 000
2 500
2 000
1 500
1 0002004 2005 2006 2007 2008 2009 2010 2011 2012 2013 2014 2015
2.8.3 CHP Electricity and Heat
CHP ELECTRICITY AND HEAT GENERATION
EU�28 �PJ – GCV�
CHP Electricity Generation CHP Heat Production

109
EU ENERGY IN FIGURES 2017
* Only Heat sold, as considered currently in the energy balances.
Source: Eurostat, May 2017
Methodology and Notes: See Appendix 13 – No 2
2.9 Heat
2.9.1 Gross Heat Generation
TOTAL
PJ (GCV) 1995 2000 2005 2010 2013 2014 2015
EU-28 2 286.7 2 187.3 2 593.2 2 703.6 2 504.3 2 324.7 2 370.4
Index 1995 100 % 96 % 113 % 118 % 110 % 102 % 104 %
BE 10.0 23.2 22.4 38.3 38.6 36.3 37.8
BG 133.5 50.8 52.1 59.4 53.0 54.2 50.3
CZ 175.9 139.2 139.2 148.6 137.3 119.7 121.3
DK 119.1 119.2 129.0 152.1 135.8 122.2 128.1
DE 416.6 315.9 494.0 515.2 488.3 438.3 457.6
EE 30.7 27.0 26.8 25.5 23.0 21.8 21.2
IE 0.0 0.0 0.0 0.0 0.0 0.0 0.0
EL 0.0 1.2 2.0 1.9 1.7 2.1 2.1
ES 0.0 0.0 0.0 0.0 0.0 0.0 0.0
FR 23.0 135.5 178.3 160.9 138.0 122.6 135.9
HR 13.2 11.5 13.3 12.5 11.7 10.1 11.1
IT 0.0 0.0 193.1 205.3 216.4 206.0 216.9
CY 0.0 0.0 0.0 0.0 0.0 0.0 0.1
LV 46.1 31.9 31.1 28.7 26.2 25.7 25.5
LT 66.9 48.2 49.9 48.8 43.6 43.3 41.5
LU 0.0 0.5 3.2 3.1 3.3 2.5 2.3
HU 61.3 69.2 63.6 53.0 49.0 48.0 52.0
MT 0.0 0.0 0.0 0.0 0.0 0.0 0.0
NL 130.1 172.4 178.5 159.9 150.1 147.2 139.3
AT 39.2 47.9 58.9 83.9 88.4 79.9 83.9
PL 420.8 340.7 336.3 335.8 302.3 276.9 281.4
PT 1.5 5.6 13.7 21.1 25.6 21.4 19.6
RO 287.0 190.8 127.7 99.1 84.8 78.0 76.6
SI 8.9 9.4 10.1 9.8 9.4 8.2 8.7
SK 42.1 36.8 52.5 48.6 42.5 34.8 36.7
FI 97.7 150.6 179.3 211.0 188.4 185.0 177.6
SE 163.1 157.9 181.1 224.2 190.1 179.9 183.5
UK 0.0 102.1 57.2 57.0 56.4 60.5 59.6
*

110
PART 2 Energy in the EU
2.9.1 Gross Heat Generation
BY FUEL
2015
PJ (GCV) Gro
ss H
eat
G
enera
tion
Gase
s
Solid F
uels
Renew
able
s
Petr
ole
um
and P
roduct
s
Wast
es
non-R
ES
Nucl
ear
EU-28 2 370.4 914.5 624.6 543.3 104.3 112.8 4.3
Share (%) 100.0% 38.6% 26.3% 22.9% 4.4% 4.8% 0.2%
BE 37.8 23.6 0.0 2.0 0.5 1.6 0.0
BG 50.3 23.1 19.2 0.5 5.3 0.0 0.6
CZ 121.3 37.2 70.2 8.6 1.1 1.4 0.9
DK 128.1 23.6 26.0 61.3 1.4 12.3 0.0
DE 457.6 190.7 150.7 64.8 4.9 37.8 0.0
EE 21.2 7.3 3.2 9.1 0.6 1.0 0.0
IE 0.0 0.0 0.0 0.0 0.0 0.0 0.0
EL 2.1 0.0 2.1 0.0 0.0 0.0 0.0
ES 0.0 0.0 0.0 0.0 0.0 0.0 0.0
FR 135.9 58.2 7.6 47.7 9.4 12.4 0.0
HR 11.1 9.2 0.0 0.8 1.1 0.0 0.0
IT 216.9 139.7 1.9 37.9 32.7 4.7 0.0
CY 0.1 0.0 0.0 0.1 0.0 0.0 0.0
LV 25.5 16.0 0.1 9.3 0.0 0.0 0.0
LT 41.5 11.5 0.1 19.2 0.5 0.5 0.0
LU 2.3 1.7 0.0 0.6 0.0 0.0 0.0
HU 52.0 40.3 1.4 6.8 0.3 0.8 0.8
MT 0.0 0.0 0.0 0.0 0.0 0.0 0.0
NL 139.3 91.7 7.9 13.1 17.1 9.6 0.0
AT 83.9 31.7 3.5 37.8 4.8 6.1 0.0
PL 281.4 34.2 228.9 12.9 3.4 0.7 0.0
PT 19.6 19.1 0.0 0.0 0.4 0.0 0.0
RO 76.6 44.8 24.1 3.3 4.5 0.0 0.0
SI 8.7 2.0 4.9 1.5 0.1 0.1 0.0
SK 36.7 17.8 6.7 5.6 4.6 0.0 2.0
FI 177.6 27.9 54.3 74.1 7.4 5.0 0.0
SE 183.5 10.2 8.5 125.6 2.6 18.2 0.0
UK 59.6 53.2 3.3 0.8 1.6 0.7 0.0
Source: Eurostat, May 2017
Methodology and Notes: See Appendix 13 – No 2

111
EU ENERGY IN FIGURES 2017
3 000
2 500
2 000
1 500
1 000
500
0
19
90
19
91
19
92
19
93
19
94
19
95
19
96
19
97
19
98
19
99
20
00
20
01
20
02
20
03
20
04
20
05
20
06
20
07
20
08
20
09
20
10
20
11
20
12
20
13
20
14
20
15
2.9.1 Gross Heat Generation
TOTAL – EU�28 – 1990�2015 �PJ � GCV�
Source: Eurostat, May 2017
Methodology and Notes: See Appendix 13 – No 2
1 600
1 400
1 200
1 000
800
600
400
200
0
19
90
19
91
19
92
19
93
19
94
19
95
19
96
19
97
19
98
19
99
20
00
20
01
20
02
20
03
20
04
20
05
20
06
20
07
20
08
20
09
20
10
20
11
20
12
20
13
20
14
20
15
GROSS HEAT GENERATION � BY FUEL – 1990�2015 �PJ � GCV�
Other
Solid Fuels
Nuclear
Petroleum and Products
Renewables
Gases
Wastes non-RES
EU-28

112
PART 2 Energy in the EU
2.10 Transport
2.10.1 Fuels Final Consumption
PETROLEUM PRODUCTS AND BIOFUELS � EU�28
ktoe Fin
al
Consu
mpti
on
Petr
ole
um
Pro
duct
s
Gas/
Die
sel
Oil
Moto
r
Gaso
line
LPG
Fin
al
Consu
mpti
on
Bio
fuels
Bio
die
sel
Bio
gaso
line
1990 278 520 106 291 138 227 2 707 5.7 5.7 0.0
1991 280 700 108 995 138 709 2 629 6.4 6.4 0.0
1992 290 092 114 516 140 943 2 488 21.9 15.0 5.1
1993 293 578 117 452 140 419 2 616 51.8 24.8 24.3
1994 296 714 120 485 138 994 2 792 138.8 111.1 25.0
1995 300 387 123 436 138 159 3 046 216.2 187.4 24.3
1996 310 455 130 056 139 720 3 182 317.2 273.7 39.0
1997 316 052 133 918 139 232 3 470 432.3 368.3 55.0
1998 327 291 142 150 139 526 3 552 408.3 335.0 63.4
1999 336 595 148 388 140 127 3 531 455.3 383.2 59.5
2000 337 134 153 117 134 043 3 653 709.0 636.4 58.2
2001 339 505 158 754 131 701 3 872 835.6 752.3 65.3
2002 342 372 163 945 129 676 4 132 1 109.3 929.6 158.1
2003 346 769 171 738 124 667 4 292 1 420.3 1 168.5 240.8
2004 355 999 181 161 120 828 4 632 1 927.0 1 603.4 304.4
2005 357 872 186 031 115 318 4 775 3 198.0 2 469.9 573.4
2006 363 630 193 613 111 416 4 937 5 365.0 3 898.2 876.3
2007 367 825 199 700 107 600 4 898 7 592.8 5 807.3 1 162.6
2008 359 781 197 894 101 750 5 050 9 753.5 7 693.2 1 800.4
2009 346 185 192 289 97 502 5 267 11 553.8 9 258.3 2 238.6
2010 343 116 195 221 91 755 5 312 13 104.6 10 261.7 2 804.6
2011 340 230 194 911 87 891 5 510 13 608.2 10 731.5 2 864.3
2012 329 030 191 104 81 987 5 478 14 307.2 11 473.5 2 822.0
2013 326 363 191 310 79 207 5 787 13 007.7 10 328.3 2 674.7
2014 330 254 195 017 78 975 5 839 14 062.6 11 397.3 2 656.9
2015 335 867 200 266 77 449 5 890 14 030.0 11 345.3 2 680.2
EU�28 � FUELS CONSUMPTION IN THE TRANSPORT SECTOR �
1990�2015 �ktoe�
400 000
350 000
300 000
250 000
200 000
150 000
100 000
50 000
0
19
90
19
91
19
92
19
93
19
94
19
95
19
96
19
97
19
98
19
99
20
00
20
01
20
02
20
03
20
04
20
05
20
06
20
07
20
08
20
09
20
10
20
11
20
12
20
13
20
14
20
15
Biogasoline
Motor Gasoline LPG
Final Consumption Petroleum Products
Biodiesel
Gas/Diesel Oil
Final Consumption Biofuels
Source: Eurostat, May 2017
Methodology and Notes: See Appendix 13 – No 2

113
EU ENERGY IN FIGURES 2017
2.10.2 Biofuels
BY FUEL � EU�28
Production Share in Transport Fuels
Tota
l B
iofu
els
Bio
die
sel
Bio
gaso
line
Tota
l B
iofu
els
of
Bio
gaso
line
in M
oto
r
Gaso
line
of
Bio
die
sel
in G
as/
Die
sel O
il
ktoe %
1990 6 6 0 0.0 % 0.0 % 0.0 %
1991 7 7 0 0.0 % 0.0 % 0.0 %
1992 20 16 2 0.0 % 0.0 % 0.0 %
1993 48 25 18 0.0 % 0.0 % 0.0 %
1994 135 95 25 0.0 % 0.0 % 0.1 %
1995 222 188 24 0.1 % 0.0 % 0.2 %
1996 313 268 39 0.1 % 0.0 % 0.2 %
1997 401 338 53 0.1 % 0.0 % 0.3 %
1998 383 310 63 0.1 % 0.0 % 0.2 %
1999 441 369 58 0.1 % 0.0 % 0.3 %
2000 709 634 59 0.2 % 0.0 % 0.4 %
2001 886 789 70 0.2 % 0.0 % 0.5 %
2002 1 186 997 159 0.3 % 0.1 % 0.6 %
2003 1 496 1 183 263 0.4 % 0.2 % 0.7 %
2004 2 191 1 772 311 0.5 % 0.3 % 0.9 %
2005 3 373 2 499 480 0.9 % 0.5 % 1.3 %
2006 5 486 3 674 741 1.5 % 0.8 % 2.0 %
2007 7 362 5 199 1 036 2.1 % 1.1 % 2.8 %
2008 8 716 6 401 1 492 2.7 % 1.7 % 3.7 %
2009 10 510 7 876 1 688 3.3 % 2.2 % 4.6 %
2010 11 725 8 931 1 972 3.8 % 3.0 % 5.0 %
2011 10 593 8 504 1 763 4.0 % 3.2 % 5.2 %
2012 11 482 9 111 2 046 4.3 % 3.3 % 5.7 %
2013 12 743 9 793 2 564 4.0 % 3.3 % 5.1 %
2014 13 982 11 370 2 274 4.3 % 3.3 % 5.5 %
2015 13 660 11 085 2 177 4.2 % 3.3 % 5.4 %
Source: Eurostat, May 2017
Methodology and Notes: See Appendix 13 – No 2

114
PART 2 Energy in the EU
14 000
12 000
10 000
8 000
6 000
4 000
2 000
0
19
90
19
91
19
92
19
93
19
94
19
95
19
96
19
97
19
98
19
99
20
00
20
01
20
02
20
03
20
04
20
05
20
06
20
07
20
08
20
09
20
10
20
11
20
12
20
13
20
14
20
15
2.10.2 Biofuels
PRODUCTION BIOFUELS � EU�28 – 1990�2015 �ktoe�
6 %
5%
4 %
3%
2 %
1%
0 %
19
90
19
91
19
92
19
93
19
94
19
95
19
96
19
97
19
98
19
99
20
00
20
01
20
02
20
03
20
04
20
05
20
06
20
07
20
08
20
09
20
10
20
11
20
12
20
13
20
14
20
15
BIOFUELS SHARE IN TRANSPORT FUELS � EU�28 – 1990�2015 �%�
Biogasoline Biodiesel
Other Liquid Biofuels
Total Biofuels
of Biogasoline in Motor Gasoline
of Biodiesel in Gas/Diesel Oil
Total Biofuels
Source: Eurostat, May 2017
Methodology and Notes: See Appendix 13 – No 2

115
EU ENERGY IN FIGURES 2017
2.11 Energy Efficiency
2.11.1 Energy Intensity
ALL FUELS
toe/M€ '2010 1995 2000 2005 2010 2014 2015
EU-28 174 155 149 138 122 120
Index 1995 100 % 89 % 86 % 79 % 70 % 69 %
BE 199 190 173 167 142 141
BG 947 759 614 465 445 448
CZ 401 362 328 291 261 251
DK 104 88 81 82 66 65
DE 159 145 141 129 114 113
EE 696 466 374 418 388 358
IE 141 116 93 91 75 62
EL 150 149 137 127 132 133
ES 144 142 141 121 113 114
FR 158 145 144 134 120 120
HR 263 239 223 209 190 194
IT 115 112 117 111 98 100
CY 166 169 149 142 128 129
LV 484 315 252 260 216 207
LT 592 386 330 242 202 205
LU 144 119 135 116 94 89
HU 377 314 278 271 228 234
MT 175 149 163 142 114 91
NL 168 141 142 136 119 118
AT 124 114 124 116 106 107
PL 519 360 322 278 233 227
PT 151 151 157 135 131 134
RO 551 442 357 282 234 227
SI 268 231 220 202 184 178
SK 503 437 355 264 220 215
FI 238 205 192 198 186 177
SE 205 163 149 138 123 111
UK 166 147 130 116 96 94
ENERGY INTENSITY � ALL FUELS � 1990�2015 �toe/M€ '2010�
Source: Eurostat, DG Economic and Financial Affairs, June 2017
Methodology and Notes: See Appendix 13 – No 2
200
150
100
50
0
19
90
19
91
19
92
19
93
19
94
19
95
19
96
19
97
19
98
19
99
20
00
20
01
20
02
20
03
20
04
20
05
20
06
20
07
20
08
20
09
20
10
20
11
20
12
20
13
20
14
20
15
EU-28

116
PART 2 Energy in the EU
2.11.2 Energy Consumption per Capita
GROSS INLAND CONSUMPTION � ALL FUELS
kgoe/cap 1995 2000 2005 2010 2014 2015
EU-28 3 476 3 551 3 702 3 506 3 171 3 201
Index 1995 100 % 102 % 106 % 101 % 91 % 92 %
BE 5 314 5 792 5 654 5 618 4 789 4 825
BG 2 692 2 261 2 569 2 395 2 449 2 570
CZ 4 059 4 025 4 454 4 342 4 018 4 027
DK 3 873 3 703 3 614 3 621 2 986 2 962
DE 4 190 4 166 4 145 4 065 3 878 3 870
EE 3 815 3 549 4 132 4 613 5 074 4 757
IE 3 076 3 819 3 713 3 334 2 945 3 063
EL 2 265 2 626 2 863 2 583 2 230 2 252
ES 2 575 3 055 3 331 2 802 2 509 2 614
FR 4 076 4 254 4 403 4 128 3 768 3 799
HR 1 686 1 872 2 269 2 191 1 930 2 018
IT 2 846 3 061 3 284 3 006 2 485 2 569
CY 3 045 3 495 3 464 3 345 2 598 2 682
LV 1 849 1 622 2 041 2 183 2 224 2 205
LT 2 371 2 011 2 596 2 160 2 275 2 366
LU 8 194 8 427 10 407 9 244 7 681 7 420
HU 2 533 2 475 2 735 2 656 2 411 2 557
MT 2 006 2 060 2 414 2 268 2 083 1 761
NL 4 896 4 918 5 158 5 175 4 537 4 589
AT 3 413 3 627 4 161 4 106 3 817 3 877
PL 2 562 2 317 2 416 2 648 2 481 2 511
PT 2 062 2 467 2 618 2 297 2 118 2 217
RO 2 039 1 632 1 834 1 764 1 612 1 631
SI 3 052 3 245 3 667 3 584 3 228 3 189
SK 3 308 3 390 3 542 3 312 2 988 3 030
FI 5 759 6 267 6 589 6 934 6 378 6 059
SE 5 838 5 518 5 659 5 437 4 998 4 665
UK 3 836 3 922 3 891 3 407 2 948 2 940
ENERGY CONSUMPTION PER CAPITA � ALL FUELS �
1990�2015 �kgoe/cap�
Source: Eurostat, June 2017
Methodology and Notes: See Appendix 13 – No 2
4 000
3 000
2 000
1 000
0
19
90
19
91
19
92
19
93
19
94
19
95
19
96
19
97
19
98
19
99
20
00
20
01
20
02
20
03
20
04
20
05
20
06
20
07
20
08
20
09
20
10
20
11
20
12
20
13
20
14
20
15
EU-28

117
EU ENERGY IN FIGURES 2017
2.11.3 Final Electricity Consumption per Capita
ALL FUELS
kWh/cap 1995 2000 2005 2010 2014 2015
EU-28 4 685 5 189 5 630 5 642 5 331 5 390
Index 1995 100 % 111 % 120 % 120 % 114 % 115 %
BE 6 757 7 573 7 678 7 686 7 258 7 272
BG 3 404 2 961 3 345 3 652 3 819 3 933
CZ 4 653 4 804 5 421 5 183 5 082 5 169
DK 5 922 6 089 6 184 5 792 5 425 5 424
DE 5 534 5 884 6 330 6 509 6 350 6 339
EE 3 146 3 579 4 445 5 181 5 248 5 211
IE 4 128 5 371 5 923 5 588 5 241 5 416
EL 3 235 4 005 4 640 4 777 4 530 4 677
ES 3 555 4 657 5 595 5 266 4 878 4 995
FR 5 780 6 357 6 735 6 868 6 291 6 391
HR 2 129 2 631 3 344 3 686 3 493 3 631
IT 4 192 4 795 5 199 5 057 4 631 4 729
CY 3 444 4 339 5 402 5 960 4 621 4 830
LV 1 786 1 880 2 547 2 931 3 289 3 253
LT 1 744 1 764 2 377 2 652 3 138 3 198
LU 12 316 13 319 13 334 13 132 11 247 11 051
HU 2 684 2 880 3 203 3 416 3 517 3 672
MT 3 345 4 031 4 614 4 406 4 713 4 924
NL 5 245 6 020 6 419 6 516 6 039 6 101
AT 5 881 6 441 7 001 7 222 7 133 7 091
PL 2 325 2 563 2 751 3 122 3 297 3 363
PT 2 878 3 744 4 414 4 718 4 334 4 416
RO 1 601 1 511 1 817 2 036 2 101 2 166
SI 4 696 5 293 6 379 5 835 6 045 6 199
SK 4 057 4 077 4 253 4 477 4 460 4 495
FI 12 791 14 636 15 420 15 603 14 518 14 340
SE 14 129 14 526 14 504 14 048 12 669 12 810
UK 5 086 5 611 5 797 5 262 4 709 4 668
FINAL ELECTRICITY CONSUMPTION PER CAPITA � ALL FUELS �
1990�2015 �kWh/cap�
Source: Eurostat, June 2017
Methodology and Notes: See Appendix 13 – No 2
8 000
6 000
4 000
2 000
0
19
90
19
91
19
92
19
93
19
94
19
95
19
96
19
97
19
98
19
99
20
00
20
01
20
02
20
03
20
04
20
05
20
06
20
07
20
08
20
09
20
10
20
11
20
12
20
13
20
14
20
15
EU-28

118
PART 2 Energy in the EU
2.11.4 Primary Energy Intensity
ALL FUELS
toe/M€ '2010 1995 2000 2005 2010 2014 2015
EU-28 162 145 140 129 114 113
Index 1995 100 % 89 % 86 % 80 % 70 % 70 %
BE 177 168 151 147 119 119
BG 896 719 588 454 433 434
CZ 378 343 306 272 243 236
DK 102 86 80 81 65 64
DE 148 135 131 120 106 105
EE 674 450 359 412 381 352
IE 134 110 90 89 74 61
EL 147 145 133 122 128 129
ES 133 132 133 114 109 110
FR 147 136 135 127 113 114
HR 236 220 207 196 177 182
IT 108 107 111 105 93 96
CY 161 163 145 138 127 127
LV 480 309 247 256 211 201
LT 555 349 302 219 172 172
LU 142 117 134 115 93 88
HU 353 295 256 250 210 216
MT 175 149 159 141 114 90
NL 144 119 116 112 97 99
AT 118 108 117 110 99 101
PL 499 342 306 265 221 214
PT 136 137 143 125 122 126
RO 536 419 335 271 223 219
SI 263 223 211 197 180 174
SK 477 404 331 249 207 201
FI 229 198 186 192 180 171
SE 197 157 143 132 118 107
UK 157 140 124 112 92 90
PRIMARY ENERGY INTENSITY � ALL FUELS � 1990�2015 �toe/M€ '2010�
Source: Eurostat, DG Economic and Financial Affairs, June 2017
Methodology and Notes: See Appendix 13 – No 2
200
150
100
50
0
19
90
19
91
19
92
19
93
19
94
19
95
19
96
19
97
19
98
19
99
20
00
20
01
20
02
20
03
20
04
20
05
20
06
20
07
20
08
20
09
20
10
20
11
20
12
20
13
20
14
20
15
EU-28

119
EU ENERGY IN FIGURES 2017
2 .11 .5 Carbon Intensity
ALL FUELS
kg CO2/toe 1995 2000 2005 2010 2014 2015
EU-28 2 508 2 415 2 353 2 241 2 186 2 181
Index 1995 100 % 96 % 94 % 89 % 87 % 87 %
BE 2 230 2 030 1 933 1 716 1 707 1 739
BG 2 545 2 442 2 574 2 701 2 564 2 625
CZ 3 148 3 083 2 787 2 599 2 473 2 485
DK 2 965 2 735 2 696 2 514 2 312 2 178
DE 2 773 2 666 2 580 2 555 2 596 2 579
EE 3 252 3 038 3 013 3 004 2 720 2 439
IE 3 304 3 224 3 287 2 881 2 839 2 854
EL 3 267 3 311 3 402 3 180 3 106 2 967
ES 2 609 2 485 2 515 2 143 2 159 2 222
FR 1 674 1 648 1 577 1 501 1 391 1 392
HR 2 185 2 369 2 418 2 279 2 214 2 143
IT 2 760 2 696 2 602 2 401 2 329 2 321
CY 3 275 3 047 3 119 3 026 3 115 3 032
LV 1 940 1 854 1 648 1 825 1 603 1 637
LT 1 725 1 660 1 607 2 001 1 955 1 915
LU 2 919 2 642 2 785 2 693 2 615 2 563
HU 2 374 2 342 2 220 1 990 1 871 1 878
MT 3 367 1 915 1 823 1 232 1 342 919
NL 2 096 2 001 1 895 1 943 1 900 1 966
AT 2 415 2 342 2 381 2 174 2 037 2 070
PL 3 658 3 574 3 485 3 306 3 274 3 268
PT 2 669 2 617 2 552 2 240 2 244 2 341
RO 2 723 2 548 2 550 2 311 2 414 2 446
SI 2 520 2 403 2 313 2 234 2 025 2 059
SK 2 530 2 257 2 254 2 166 2 074 2 068
FI 1 992 1 759 1 669 1 761 1 426 1 387
SE 1 157 1 128 1 056 1 046 912 962
UK 2 568 2 526 2 521 2 486 2 406 2 310
CARBON INTENSITY � ALL FUELS � 1990�2015 �kg CO2/toe�
Sources: EEA/UNFCCC, Eurostat – June 2017
Methodology and Notes: See Appendix 13 – No 2
3 000
2 500
2 000
1 500
1 000
500
0
19
90
19
91
19
92
19
93
19
94
19
95
19
96
19
97
19
98
19
99
20
00
20
01
20
02
20
03
20
04
20
05
20
06
20
07
20
08
20
09
20
10
20
11
20
12
20
13
20
14
20
15
EU-28

120
PART 2 Energy in the EU
2.12 RES Indicators
2.12.1 RES Shares
OVERALL AND HEATING & COOLING
Overall RES with Aviation Cap** RES-H&C – Heating and Cooling
% 2005 2010 2014 2015 2005 2010 2014 2015
EU-28 9.0 12.9 16.1 16.7 10.9 14.9 18.1 18.6
BE 2.3 5.7 8.0 7.9 3.4 6.1 7.7 7.6
BG 9.4 14.1 18.0 18.2 14.3 24.4 28.3 28.6
CZ 7.1 10.5 15.1 15.1 10.9 14.1 19.6 19.8
DK 16.0 22.1 29.3 30.8 22.8 31.0 37.9 39.6
DE 6.7 10.5 13.8 14.6 6.8 9.8 12.2 12.9
EE 17.5 24.6 26.3 28.6 32.2 43.3 45.2 49.6
IE 2.9 5.6 8.7 9.2 3.5 4.5 6.6 6.4
EL 7.0 9.8 15.3 15.4 12.8 17.9 26.9 25.9
ES 8.4 13.8 16.1 16.2 9.4 12.6 15.7 16.8
FR 9.5 12.5 14.7 15.2 12.2 15.8 18.8 19.8
HR 23.8 25.1 27.9 29.0 30.0 32.8 36.2 38.6
IT 7.5 13.0 17.1 17.5 8.2 15.6 18.9 19.2
CY 3.1 6.0 8.9 9.4 10.0 18.2 21.6 22.5
LV 32.3 30.4 38.7 37.6 42.7 40.7 52.2 51.8
LT 16.8 19.6 23.6 25.8 29.3 32.5 40.6 46.1
LU 1.4 2.9 4.5 5.0 3.6 4.7 7.2 6.9
HU 4.5 12.8 14.6 14.5 6.0 18.1 21.2 21.3
MT 0.2 1.0 4.7 5.0 2.2 7.8 14.5 14.1
NL 2.5 3.9 5.5 5.8 2.4 3.1 5.2 5.5
AT 23.9 30.4 32.8 33.0 22.3 29.5 32.0 32.0
PL 6.9 9.3 11.5 11.8 10.2 11.7 14.0 14.3
PT 19.5 24.2 27.0 28.0 32.1 33.9 34.0 33.4
RO 17.3 23.4 24.8 24.8 18.0 27.2 26.7 25.9
SI 16.0 20.4 21.5 22.0 18.9 28.1 32.4 34.1
SK 6.4 9.1 11.7 12.9 5.0 7.9 8.9 10.8
FI 28.8 32.4 38.7 39.3 39.1 44.2 51.9 52.8
SE 40.6 47.2 52.5 53.9 51.9 60.9 68.0 68.6
UK 1.3 3.7 7.1 8.2 0.8 2.7 4.7 5.5
* Of the Gross Final Energy.
** Break in Series between 2010 and 2011 due to the Application of the Biofuels Compliance Rules.
Source: Eurostat, April 2017
Methodology and Notes: See Appendix 13 – No 2
*

121
EU ENERGY IN FIGURES 2017
2.12.1 RES Shares
ELECTRICITY AND TRANSPORT
RES-E – Electricity Generation RES-T – Transport**
% 2005 2010 2014 2015 2005 2010 2014 2015
EU-28 14.8 19.7 27.5 28.8 1.8 5.2 6.5 6.7
BE 2.4 7.1 13.4 15.4 0.6 4.7 5.7 3.8
BG 9.3 12.7 18.9 19.1 0.8 1.4 5.8 6.5
CZ 3.7 7.5 13.9 14.1 0.9 5.1 6.9 6.5
DK 24.6 32.7 48.5 51.3 0.4 1.1 6.7 6.7
DE 10.5 18.1 28.2 30.7 4.0 6.4 7.3 6.8
EE 1.1 10.4 14.1 15.1 0.2 0.4 0.4 0.4
IE 7.2 14.6 22.9 25.2 0.1 2.4 5.8 6.5
EL 8.2 12.3 21.9 22.1 0.1 1.9 1.3 1.4
ES 19.1 29.8 37.8 36.9 1.3 5.0 0.8 1.7
FR 13.7 14.8 18.3 18.8 2.1 6.5 8.4 8.5
HR 35.6 37.6 45.3 45.4 1.0 1.1 4.1 3.5
IT 16.3 20.1 33.4 33.5 1.0 4.8 5.0 6.4
CY 0.0 1.4 7.4 8.4 0.0 2.0 2.7 2.5
LV 43.0 42.1 51.1 52.2 2.4 4.0 4.1 3.9
LT 3.8 7.4 13.7 15.5 0.6 3.8 4.3 4.6
LU 3.2 3.8 5.9 6.2 0.1 2.1 5.4 6.5
HU 4.4 7.1 7.3 7.3 0.9 6.0 6.9 6.2
MT 0.0 0.0 3.3 4.2 0.0 0.0 4.6 4.7
NL 6.3 9.6 10.0 11.1 0.5 2.6 6.2 5.3
AT 62.0 65.7 70.1 70.3 4.8 10.9 10.9 11.4
PL 2.7 6.6 12.4 13.4 1.6 6.6 6.2 6.4
PT 27.7 40.7 52.1 52.6 0.5 5.6 3.7 7.4
RO 26.9 30.4 41.7 43.2 1.6 3.8 4.7 5.5
SI 28.7 32.2 33.9 32.7 0.8 3.1 2.9 2.2
SK 15.7 17.8 22.9 22.7 1.6 5.3 7.6 8.5
FI 26.9 27.7 31.4 32.5 0.9 4.4 22.0 22.0
SE 50.9 56.0 63.2 65.8 6.2 9.2 21.1 24.0
UK 4.1 7.4 17.9 22.4 0.5 3.3 5.3 4.4
* Of the Gross Final Energy.
** Break in Series between 2010 and 2011 due to the Application of the Biofuels Compliance Rules.
Source: Eurostat, April 2017
Methodology and Notes: See Appendix 13 – No 2
*

122
PART 2 Energy in the EU
2.12.1 RES Shares
IN THE GROSS FINAL ENERGY CONSUMPTION – EU�28 �%�
RES-H&C – Heating and Cooling
RES-T – Transport
Overall RES with Aviation Cap – All Fuels
RES-E – Electricity Generation
* Break in Series between 2010 and 2011 due to the Application of the Biofuels Compliance Rules.
Source: Eurostat, April 2017
Methodology and Notes: See Appendix 13 – No 2
30 %
25 %
20 %
15 %
10 %
5 %
0 %2005 2006 2007 2008 2009 2010 2011 2012 2013 2014 2015
*

123
EU ENERGY IN FIGURES 2017
2.13 Energy Prices
2.13.1 Prices of Transport Fuels
AUTOMOTIVE DIESEL OIL – ALL TAXES INCLUDED
Current Prices (€/litre) 2007 2010 2014 2015 2016 2017*
BE 1.03 1.14 1.35 1.16 1.10 1.25
BG 0.98 1.30 1.13 0.95 1.03
CZ 1.03 1.21 1.32 1.15 1.01 1.12
DK 1.10 1.21 1.45 1.28 1.17 1.26
DE 1.16 1.20 1.36 1.18 1.08 1.17
EE 0.87 1.10 1.27 1.08 1.03 1.17
IE 1.08 1.22 1.46 1.26 1.15 1.26
EL 0.98 1.24 1.35 1.18 1.07 1.27
ES 0.97 1.07 1.31 1.12 1.01 1.11
FR 1.09 1.14 1.29 1.15 1.10 1.23
HR 1.16 1.07 1.18
IT 1.16 1.21 1.61 1.41 1.28 1.39
CY 0.91 1.00 1.42 1.23 1.13 1.21
LV 0.90 1.06 1.26 1.06 0.95 1.06
LT 0.88 1.02 1.27 1.07 0.95 1.04
LU 0.93 0.99 1.17 1.02 0.92 0.99
HU 1.05 1.16 1.35 1.16 1.06 1.17
MT 0.95 1.04 1.36 1.27 1.17 1.18
NL 1.10 1.15 1.41 1.24 1.13 1.22
AT 1.03 1.10 1.30 1.12 1.03 1.11
PL 0.99 1.06 1.25 1.08 0.94 1.05
PT 1.08 1.15 1.31 1.19 1.13 1.24
RO 1.03 1.37 1.20 1.07 1.03
SI 0.97 1.15 1.36 1.18 1.07 1.17
SK 1.11 1.11 1.34 1.14 1.03 1.14
FI 1.02 1.13 1.49 1.31 1.20 1.32
SE 1.13 1.25 1.54 1.37 1.34 1.43
UK 1.42 1.39 1.66 1.59 1.35 1.40
* Weekly prices, average 02/01/17-26/06/17.
Sources: DG Energy, Member States, Weekly Oil Bulletin
Methodology and Notes: See Appendix 13 – No 2

124
PART 2 Energy in the EU
2.13.1 Prices of Transport Fuels
EURO�SUPER 95 – ALL TAXES INCLUDED
Current Prices (€/litre) 2007 2010 2014 2015 2016 2017*
BE 1.32 1.40 1.53 1.37 1.26 1.37
BG 1.02 1.28 1.10 0.98 1.03
CZ 1.06 1.25 1.32 1.15 1.06 1.15
DK 1.30 1.44 1.65 1.50 1.41 1.50
DE 1.34 1.39 1.54 1.40 1.31 1.38
EE 0.88 1.11 1.28 1.11 1.06 1.18
IE 1.12 1.30 1.53 1.37 1.28 1.38
EL 1.01 1.43 1.65 1.48 1.39 1.52
ES 1.05 1.16 1.39 1.23 1.15 1.23
FR 1.27 1.34 1.49 1.36 1.30 1.39
HR 1.26 1.18 1.28
IT 1.30 1.36 1.72 1.54 1.44 1.54
CY 0.95 1.04 1.41 1.23 1.15 1.22
LV 0.91 1.09 1.29 1.13 1.07 1.16
LT 0.90 1.18 1.32 1.16 1.06 1.14
LU 1.12 1.16 1.30 1.18 1.09 1.16
HU 1.10 1.22 1.33 1.16 1.07 1.16
MT 1.04 1.19 1.44 1.36 1.29 1.31
NL 1.46 1.49 1.70 1.56 1.48 1.56
AT 1.12 1.19 1.35 1.20 1.11 1.18
PL 1.11 1.13 1.26 1.11 1.00 1.09
PT 1.32 1.37 1.53 1.43 1.38 1.47
RO 1.06 1.34 1.20 1.09 1.04
SI 1.03 1.20 1.45 1.29 1.19 1.28
SK 1.11 1.25 1.45 1.29 1.21 1.29
FI 1.30 1.43 1.61 1.47 1.38 1.48
SE 1.24 1.34 1.57 1.41 1.38 1.47
UK 1.38 1.36 1.59 1.54 1.33 1.37
* Weekly prices, average 02/01/17-26/06/17.
Sources: DG Energy, Member States, Weekly Oil Bulletin
Methodology and Notes: See Appendix 13 – No 2

125
EU ENERGY IN FIGURES 2017
* All Taxes Included, weekly prices.
Uncomplete EU-28 series for the period 2005-2013 due to later accession to the EU of Bulgaria,
Croatia and Romania.
Sources: DG Energy, Member States, weekly oil bulletin
Methodology and Notes: See Appendix 13 – No 2
1.8
1.6
1.4
1.2
1.0
0.8
0.6
0.4
0.2
02005 2006 2007 2008 2009 2010 2011 2012 2013 2014 2015 2016 2017
2.13.1 Prices of Transport Fuels
CONSUMER PRICES OF PETROLEUM PRODUCTS
EU�28 WEIGHTED AVERAGE * �€ per LITRE�
Automotive Gas Oil Heating Gas Oil
LPG
Euro-Super 95

126
PART 2 Energy in the EU
2.13.2 Fuel Prices – Domestic Consumers
GAS – BAND D2
20GJ < CONSUMPTION < 200GJ � 2ND SEMESTER**
€/GJ (GCV) 2009 2010 2013 2014 2015 2016
EU-28 14.60 15.85 19.65 19.96 19.75 17.67
BE 14.33 16.78 18.55 18.06 17.24 14.83
BG 9.67 11.98 14.39 13.44 10.86 8.65
CZ 13.11 14.35 15.98 15.63 16.21 15.65
DK 23.64 26.81 27.14 24.38 21.22 20.59
DE 16.35 15.86 19.13 18.93 18.93 17.83
EE 10.07 11.14 13.21 13.71 10.68 9.10
IE 15.29 14.63 20.07 20.70 20.11 18.83
EL 24.66 22.16 20.83 18.12
ES 14.88 15.00 24.78 26.64 26.57 23.82
FR 16.20 15.98 20.24 21.16 20.35 18.79
HR 9.10 10.54 13.00 13.20 12.76 10.28
IT 14.84 21.86 26.29 26.41 25.13 23.29
CY
LV 10.52 11.28 13.99 13.56 13.47 11.29
LT 11.29 12.59 17.05 13.87 12.12 10.76
LU 12.82 13.13 15.71 14.27 13.40 11.62
HU 13.23 15.38 11.67 9.74 9.78 9.99
MT
NL 18.73 19.99 23.97 22.79 22.30 22.45
AT 17.23 16.71 20.96 20.28 19.75 18.71
PL 12.78 14.04 14.14 13.90 13.84 12.26
PT 16.52 17.49 25.93 28.87 27.28 22.96
RO 7.45 7.73 8.52 8.85 9.45 8.98
SI 14.96 18.68 19.71 17.61 16.91 15.64
SK 13.21 12.39 14.39 14.42 13.74 12.37
FI
SE 26.12 29.48 34.01 31.63 32.58 31.73
UK 11.84 11.72 16.33 17.94 18.56 13.93
* All Taxes and Levies Included.
** Prices from second semester each year.
Source: Eurostat, June 2017
Methodology and Notes: See Appendix 13 – No 2
*

127
EU ENERGY IN FIGURES 2017
2.13.2 Fuel Prices – Domestic Consumers
ELECTRICITY – BAND DC
2 500 kWh < CONSUMPTION < 5 000 kWh
2ND SEMESTER**
€/100 kWh 2009 2010 2013 2014 2015 2016
EU-28 16.38 17.31 20.24 20.75 21.03 20.54
BE 18.64 19.74 22.15 20.43 23.52 27.45
BG 8.18 8.30 8.82 8.95 9.57 9.38
CZ 15.33 15.49 16.45 13.79 14.08 14.21
DK 25.55 27.08 29.36 30.35 30.42 30.84
DE 22.94 24.38 29.21 29.74 29.46 29.77
EE 9.20 10.04 13.67 13.25 12.91 12.38
IE 18.55 18.75 24.05 25.36 24.54 23.38
EL 10.32 12.11 16.97 17.85 17.71 17.23
ES 16.84 18.51 22.73 23.67 23.70 22.84
FR 12.07 13.50 15.96 17.02 16.82 17.11
HR 11.64 11.53 13.50 13.24 13.12 13.31
IT 19.97 19.20 23.23 23.38 24.28 23.40
CY 16.42 20.21 24.81 23.56 18.38 16.21
LV 10.54 10.48 13.58 13.01 16.50 16.24
LT 9.26 12.16 13.91 13.19 12.43 11.71
LU 18.82 17.47 16.46 17.38 17.67 16.98
HU 16.62 15.74 13.26 11.46 11.45 11.25
MT 15.13 16.53 16.89 12.48 12.69 12.74
NL 19.06 17.89 19.05 18.01 18.46 15.92
AT 19.09 19.30 20.18 19.87 19.83 20.10
PL 12.91 13.82 14.37 14.08 14.18 13.52
PT 15.94 16.66 21.31 22.31 22.85 23.64
RO 9.79 10.52 12.79 12.48 13.19 12.33
SI 13.41 14.26 16.57 16.32 16.31 16.29
SK 15.60 16.37 16.78 15.23 15.17 15.37
FI 12.89 13.70 15.59 15.38 15.30 15.45
SE 16.46 19.58 20.46 18.67 18.74 19.62
UK 14.07 14.49 17.97 20.13 21.83 18.31
* All Taxes and Levies Included.
** Prices from second semester each year.
Source: Eurostat, June 2017
Methodology and Notes: See Appendix 13 – No 2
*

128
PART 2 Energy in the EU
2.13.3 Fuel Prices – Industrial Consumers
GAS – BAND I3
10 000 GJ < CONSUMPTION < 100 000 GJ
2ND SEMESTER**
€/GJ (GCV) 2009 2010 2013 2014 2015 2016
EU-28 8.32 9.15 11.13 10.27 9.59 8.37
BE 8.50 8.20 9.54 8.13 7.94 7.15
BG 5.96 8.41 9.77 9.48 7.49 5.34
CZ 7.56 10.07 9.21 8.45 8.17 7.16
DK 6.85 10.72 12.23 10.27 9.54 8.37
DE 9.61 11.09 13.30 11.15 10.47 9.21
EE 6.39 7.85 9.80 10.24 7.54 6.50
IE 7.31 8.80 13.16 11.57 10.28 9.43
EL 14.11 12.96 10.00 7.85
ES 7.53 8.08 10.47 10.39 8.81 7.22
FR 8.80 9.69 10.79 10.52 10.19 10.51
HR 7.43 10.95 11.80 11.15 9.74 7.63
IT 7.83 8.34 10.44 9.58 8.87 7.58
CY
LV 7.69 8.84 10.31 9.89 8.17 6.89
LT 7.55 9.40 11.34 10.40 6.05 6.81
LU 10.03 11.72 12.49 10.94 10.33 9.17
HU 10.06 9.93 13.28 10.81 9.38 7.63
MT
NL 9.72 8.62 9.67 9.34 8.91 7.91
AT 9.07 9.78 11.90 11.13 10.50 9.48
PL 8.36 9.02 10.12 10.12 9.39 7.26
PT 7.22 9.28 11.66 12.33 10.52 7.67
RO 5.93 6.11 8.01 8.54 8.05 7.27
SI 9.61 11.81 13.33 12.16 10.57 9.07
SK 8.91 10.22 10.74 10.45 9.63 8.67
FI 8.00 9.13 13.01 12.98 11.73 12.21
SE 12.47 13.43 15.16 12.26 11.61 10.67
UK 6.06 6.33 9.95 9.65 9.75 6.91
* Excluding VAT and other recoverable Taxes and Levies.
** Prices from second semester each year.
Source: Eurostat, June 2017
Methodology and Notes: See Appendix 13 – No 2
*

129
EU ENERGY IN FIGURES 2017
2.13.3 Fuel Prices – Industrial Consumers
ELECTRICITY – BAND IC
2 000 MWh < CONSUMPTION < 20 000 MWh
2ND SEMESTER**
€/100 kWh 2009 2010 2013 2014 2015 2016
EU-28 10.24 10.51 11.82 12.06 11.87 11.40
BE 10.79 10.54 10.99 10.86 10.81 11.58
BG 6.39 6.64 7.26 7.57 7.82 7.88
CZ 11.22 10.81 9.90 8.19 7.83 7.32
DK 9.20 9.61 9.98 9.72 9.06 9.36
DE 11.34 11.90 14.44 15.20 14.93 14.92
EE 6.45 7.27 9.70 9.31 9.58 8.96
IE 11.75 11.31 13.72 13.57 13.57 12.45
EL 9.36 10.26 12.39 12.98 11.50 11.15
ES 11.20 10.93 12.02 11.67 11.33 10.29
FR 6.48 7.16 8.55 9.38 9.51 8.93
HR 9.04 9.04 9.44 9.18 9.28 8.77
IT 13.70 14.43 17.18 17.35 15.97 15.56
CY 14.94 17.30 20.13 19.03 14.12 12.95
LV 8.93 9.07 11.52 11.83 11.83 12.01
LT 7.90 10.46 12.27 11.71 9.97 8.82
LU 10.24 10.01 9.87 8.93 8.58
HU 12.97 10.53 9.80 8.99 8.70 7.96
MT 12.91 18.10 17.80 17.80 14.05 13.99
NL 10.61 9.70 9.45 8.88 8.46 8.05
AT 11.62 11.28 11.08 10.55 10.47 10.04
PL 9.33 9.87 8.78 8.33 8.61 8.15
PT 9.44 9.20 11.38 11.87 11.54 11.32
RO 8.28 8.08 8.20 8.07 8.02 7.71
SI 9.62 10.05 9.45 8.47 8.70 8.32
SK 14.03 11.98 12.69 11.74 11.22 11.12
FI 6.83 6.83 7.49 7.22 7.06 6.94
SE 6.89 8.41 7.47 6.66 5.90 6.56
UK 10.12 10.00 11.96 13.38 15.20 12.78
* Excluding VAT and other recoverable Taxes and Levies.
** Prices from second semester each year.
Source: Eurostat, June 2017
Methodology and Notes: See Appendix 13 – No 2
*

PART3
Socio-Economic
Indicators in the EU

PART 3 Socio-Economic Indicators in the EU

133
EU ENERGY IN FIGURES 2017
Summary
3.1 Classification of the Energy Sector . . . . . . . . . . . . . . . . . . . . . . . . . . . . . . . . . . . 134
3.1.1 Comparative Table . . . . . . . . . . . . . . . . . . . . . . . . . . . . . . . . . . . . . . . . . . . . . . . . . . . . . 134
3.2 Enterprises in the Energy Sector . . . . . . . . . . . . . . . . . . . . . . . . . . . . . . . . . . . . . . . . 135
3.2.1 Number of Enterprises in the Energy Sector . . . . . . . . . . . . . . . . . . . . . . . 135
3.2.2 Turnover in the Energy Sector . . . . . . . . . . . . . . . . . . . . . . . . . . . . . . . . . . . . . . . . 139
3.2.3 Number of Persons Declared as Employed in the Energy Sector 143
3.3 Economy . . . . . . . . . . . . . . . . . . . . . . . . . . . . . . . . . . . . . . . . . . . . . . . . . . . . . . . . . . . . . . . . . . . . . . . . . . 147
3.3.1 GDP at Current Market Prices . . . . . . . . . . . . . . . . . . . . . . . . . . . . . . . . . . . . . . . . . 147
3.3.2 GDP per Capita at Current Market Prices . . . . . . . . . . . . . . . . . . . . . . . . . . . 148
3.3.3 GDP at 2010 Market Prices . . . . . . . . . . . . . . . . . . . . . . . . . . . . . . . . . . . . . . . . . . . 149
3.3.4 GDP per Capita at 2010 Market Prices . . . . . . . . . . . . . . . . . . . . . . . . . . . . . . 150
3.4 Demography . . . . . . . . . . . . . . . . . . . . . . . . . . . . . . . . . . . . . . . . . . . . . . . . . . . . . . . . . . . . . . . . . . . . 151
3.4.1 Population . . . . . . . . . . . . . . . . . . . . . . . . . . . . . . . . . . . . . . . . . . . . . . . . . . . . . . . . . . . . . . . 151
3.5 Employment . . . . . . . . . . . . . . . . . . . . . . . . . . . . . . . . . . . . . . . . . . . . . . . . . . . . . . . . . . . . . . . . . . . . . 152
3.5.1 Total Persons Employed in the Energy Sector (15-64 years) . . . 152
3.5.2 Employment Rate in all Economic Sectors . . . . . . . . . . . . . . . . . . . . . . . . . . 153
3.5.3 Unemployment Rate in all Economic Sectors. . . . . . . . . . . . . . . . . . . . . . . . . . 154

134
PART 3 Socio-Economic Indicators in the EU
3.1 Classification of the Energy Sector
3.1.1 Comparative Table
EUROSTAT �NACE� AND UN �ISIC� CLASSIFICATIONS
NACE rev 2 ISIC 4
B05: Mining of Coal and Lignite
05.10: Mining of Hard Coal 05.10
05.20: Mining of Lignite 05.20
B06: Extraction of Crude Petroleum and Natural Gas
06.10: Extraction of Crude Petroleum 06.10
06.20: Extraction of Natural Gas 06.20
B07: Mining of Metal Ores
07.21: Mining of Uranium and Thorium Ores 07.21
B08: Other Mining and Quarrying
08.92: Extraction of Peat 08.92
B09: Mining Support Service Activities
09.10: Support Activities for Petroleum and Natural Gas Extraction 09.10
C19: Manufacture of Coke and Refined Petroleum Products
19.10: Manufacture of Coke Oven Products 19.10
19.20: Manufacture of Refined Petroleum Products 19.20
D35: Electricity, Gas, Steam and Air Conditioning Supply
35.11: Production of Electricity 35.10
Power Generation, Hydroelectric
Power Generation, Fossil Fuel
Power Generation, Nuclear
Electric Power Generation, Solar
Electric Power Generation, Wind
Electric Power Generation, Geothermal
Electric Power Generation, Biomass
Electric Power Generation, Tidal
35.12: Transmission of Electricity
35.13: Distribution of Electricity
35.14: Trade of Electricity
35.21: Manufacture of Gas 35.20
35.22: Distribution of Gaseous Fuels through Mains
35.23: Trade of Gas through Mains
35.30: Steam and Air Conditioning Supply 35.30
* Broad Definition, The Narrow Definition only Includes Division D35.
Sources: Eurostat, UN, June 2017
Methodology and Notes: See Appendix 13 – No 3
*

135
EU ENERGY IN FIGURES 2017
3.2 Enterprises in the Energy Sector
3.2.1 Number of Enterprises in the Energy Sector
ENTERPRISES SURVEY – EU�28
2013 2014 2015*
B05: Mining of Coal and Lignite 236 200 255
B06: Extraction of Crude Petroleum and Natural Gas
416 418 420
B07.21: Mining of Uranium and Thorium Ores 5 4 4B08.92: Extraction of Peat 917 961 950B09.1: Support Activities for Petroleum and
Natural Gas Extraction1 050 1 130 1 151
C19: Manufacture of Coke and Refined Petroleum Products
1 108 1 124 1 104
D35: Electricity, Gas, Steam and Air Conditioning Supply
78 601 87 465 92 200
D35.1: Electricity 71 720 80 466 85 000
35.11: Production of Electricity 65 958 74 147
35.12: Transmission of Electricity 226
35.13: Distribution of Electricity 2 070 2 196
35.14: Trade of Electricity 3 472 3 897
D35.2: Gas 1 857 1 900 1 900
35.21: Manufacture of Gas 341 34035.22: Distribution of Gaseous Fuels through Mains
726 722
35.23: Trade of Gas through Mains 785 838
D35.3: Steam and Air Conditioning 5 000 5 050 5 100
35.30: Steam and Air Conditioning Supply
5 000 5 050 5 100
Broad Sector – Total 82 333 91 302 96 084
* Provisional data.
Italics: DG Energy Estimations.
Sources: Eurostat, Structural Business Statistics Survey (SBS), July 2017
Methodology and Notes: See Appendix 13 – No 3

136
PART 3 Socio-Economic Indicators in the EU
* Provisional data.
Italics: DG Energy Estimations.
Sources: Eurostat, Structural Business Statistics Survey (SBS), July 2017
Methodology and Notes: See Appendix 13 – No 3
3.2.1 Number of Enterprises in the Energy Sector
ENTERPRISES SURVEY
Mining of Coal and Lignite (B05)Extraction of Crude Petroleum
and Natural Gas (B06)
2008 2013 2014 2015* 2008 2013 2014 2015*
EU-28 298 236 200 255 315 416 418 420
BE 0 0 0 0 0 0 0 0
BG 23 24 24 22 9 6 7 4
CZ 0 12 11 12 0 5 5 5
DK 0 0 0 0 10 10 11 19
DE 7 5 5 7 4 4 4 4
EE 0 0 0 0 1 2 2 2
IE
EL 4 0 0 3
ES 110 56 25 78 4 0 18 10
FR 10 0 0 0 61 58 50 0
HR 0 0 0 0 7 4 4 4
IT 5 12 13 0
CY 0 0 0 0 0 0 0 0
LV 3 0 0 0 0 1 1 2
LT 0 0 0 0 4 4 4 4
LU 0 0 0 0 0 0 0 0
HU 12 17 14 14 10 10 9 8
MT 0 0 0 0 0 0 0 0
NL 0 0 0 0 45 45 43 41
AT 0 0 0 0 2 2 3 0
PL 44 57 58 63 28 52 55 60
PT 0 0 0 0 0 0 0 0
RO 38 35 32 27 10 34 38 37
SI 2 1 1 1 1 1 1 1
SK
FI 0 0 0 0 0 0 0 0
SE
UK 22 20 0 0 105 158 145 98

137
EU ENERGY IN FIGURES 2017
* Provisional data.
Italics: DG Energy Estimations.
Sources: Eurostat, Structural Business Statistics Survey (SBS), July 2017
Methodology and Notes: See Appendix 13 – No 3
3.2.1 Number of Enterprises in the Energy Sector
ENTERPRISES SURVEY
Extraction of Peat (B08.92)Support Activities for Petroleum
and Natural Gas Extraction (B09.1)
2008 2013 2014 2015* 2008 2013 2014 2015*
EU-28 1 011 917 961 950 830 1 050 1 130 1 151
BE 0 0 0
BG 10 3 4 4 11 12 14
CZ 5 5 6
DK 7 2 3 47 52 55 55
DE 90 83 87 91
EE 38 42 41 41 0 0 0 0
IE 28 41 39 38
EL 0
ES 6 5 5 7 24 48 46
FR 21 19 45 52 54
HR 2 0 0 0 8 6 4 4
IT 0 4 5 42 39
CY 0 0 0 0
LV 54 50 65 0 1 1 2
LT 20 25 26 0 0 0 0
LU 0 0 0 0 0 0 0
HU 15 13 29 35 32 37
MT 0 0 0
NL 8 7 6 103 201 228 251
AT 7 6 5 6 8 9 8
PL 49 34 34 52 92 107 108
PT 1 0 0 1 1 2 3 4
RO 10 5 5 93 90 105 106
SI 0 0 0 3 4 2 2
SK
FI 519 473 467 0 0 0 0
SE 87 73 70 39 58 59 63
UK 24 21 20 19 267 286 284 251

138
PART 3 Socio-Economic Indicators in the EU
* Provisional data.
Italics: DG Energy Estimations.
Sources: Eurostat, Structural Business Statistics Survey (SBS), July 2017
Methodology and Notes: See Appendix 13 – No 3
3.2.1 Number of Enterprises in the Energy Sector
ENTERPRISES SURVEY
Manufacture of Coke and RefinedPetroleum Products (C19)
Electricity, Gas, Steam and Air Conditioning Supply (D35)
2008 2013 2014 2015* 2008 2013 2014 2015*
EU-28 1 274 1 108 1 124 1 104 33 758 78 601 87 465 92 200
BE 17 15 20 618 693 736
BG 21 10 13 11 583 1 784 1 743 1 745
CZ 22 33 33 25 1 264 8 446 10 414 10 887
DK 4 4 3 3 1 692 1 845 1 784 1 760
DE 86 80 85 54 1 589 1 974 2 058 2 059
EE 9 7 5 5 181 226 226 230
IE 204 485 483 535
EL 7 48 47 42 5 32 28 27
ES 13 14 10 14 12 004 13 867 14 244 14 044
FR 88 56 50 43 3 866 20 756 24 883 26 742
HR 19 15 14 14 133 513 560 573
IT 353 297 294 2 472 10 169 10 459
CY 1
LV 3 10 12 17 279 480 506 541
LT 5 7 8 8 213 1 214 1 434 1 428
LU 0 0 0 0 60 74 82 73
HU 10 14 10 8 542 675 668 610
MT
NL 37 38 43 45 558 950 1 191 1 130
AT 5 4 5 5 1 512 2 256 2 271 2 442
PL 158 175 175 176 1 788 2 546 2 583 3 132
PT 6 17 17 18 678 925 941 1 209
RO 33 42 47 44 506 1 345 1 501 1 460
SI 5 7 5 4 417 1 526 1 570 1 529
SK 203 430 487 465
FI 13 17 18 15 722 816 849 900
SE 44 40 38 1 528 2 287 2 470 4 233
UK 245 134 131 132 478 2 577 3 285 4 279

139
EU ENERGY IN FIGURES 2017
3.2.2 Turnover in the Energy Sector
ENTERPRISES SURVEY – EU�28
Mio EUR 2013 2014 2015*
B05: Mining of Coal and Lignite 13 282.4 11 783.6 11 196.9
B06: Extraction of Crude Petroleum and Natural Gas
172 599.5 146 325.6 127 389.2
B07.21: Mining of Uranium and Thorium Ores
B08.92: Extraction of Peat 1 749.8 1 749.4 1 700.0B09.1: Support Activities for Petroleum and
Natural Gas Extraction16 389.7 18 764.0 19 391.9
C19: Manufacture of Coke and Refined Petroleum Products
606 176.5 557 103.4 405 871.0
D35: Electricity, Gas, Steam and Air Conditioning Supply
1 539 990.8 1 478 875.8 1 510 000.0
D35.1: Electricity 1 233 856.6 1 185 837.6 1 221 650.3
35.11: Production of Electricity 335 039.1 325 816.4
35.12: Transmission of Electricity 68 751.2 69 990.7
35.13: Distribution of Electricity 237 541.8 241 043.1
35.14: Trade of Electricity 592 524.5 548 987.3
D35.2: Gas 265 273.3 256 721.0 256 668.8
35.21: Manufacture of Gas 5 794.6 5 779.6
35.22: Distribution of Gaseous Fuels through Mains
83 482.4 56 992.2
35.23: Trade of Gas through Mains 175 988.6 193 935.5
D35.3: Steam and Air Conditioning 40 860.9 36 317.2
35.30: Steam and Air Conditioning Supply
40 860.9 36 317.2
Broad Sector – Total 2 350 188.7 2 214 601.8 2 075 549.0
* Provisional data.
Italics: DG Energy Estimations.
Sources: Eurostat, Structural Business Statistics Survey (SBS), July 2017
Methodology and Notes: See Appendix 13 – No 3

140
PART 3 Socio-Economic Indicators in the EU
* Provisional data.
Italics: DG Energy Estimations.
Sources: Eurostat, Structural Business Statistics Survey (SBS), July 2017
Methodology and Notes: See Appendix 13 – No 3
3.2.2 Turnover in the Energy Sector
ENTERPRISES SURVEY
Mining of Coal and Lignite (B05)Extraction of Crude Petroleum
and Natural Gas (B06)
Mio EUR 2008 2013 2014 2015* 2008 2013 2014 2015*
EU-28 16 674.9 13 282.4 11 783.6 11 196.9 176 436.0 172 599.5 146 325.6 127 389.2
BE 0.0 0.0 0.0 0.0 0.0 0.0
BG 326.6 287.5 307.9 348.8 40.9 80.7 55.2 30.4
CZ 2 097.4 1 608.6 1 578.0
DK 0.0 0.0 0.0 0.0 9 239.9 6 823.6 5 669.7 3 925.0
DE 4 015.8 2 387.2 2 271.2 2 161.5 3 829.2 3 431.5 3 259.2 2 978.4
EE 0.0 0.0 0.0 0.0
IE
EL 82.0 58.1
ES 858.2 433.8 445.7 235.6 77.9 115.6 126.2
FR 47.6 0.0 851.0 729.1 372.1 282.1
HR 0.0 0.0 0.0 0.0
IT 48 042.4 63 194.3 56 552.5 56 651.2
CY 0.0 0.0 0.0 0.0 0.0 0.0 0.0 0.0
LV 0.0 0.0 0.0 0.0
LT 0.0 0.0 0.0 0.0 91.2 77.1 73.1 38.6
LU 0.0 0.0 0.0 0.0 0.0 0.0 0.0 0.0
HU 53.2 13.1 11.4 8.6 89.1 135.1 51.2 33.2
MT 0.0 0.0 0.0 0.0 0.0 0.0 0.0 0.0
NL 0.0 0.0 0.0 37 828.5 46 068.0 36 275.5 27 000.5
AT 0.0 0.0 0.0 0.0
PL 7 212.1 6 669.3 5 752.9 175.2
PT 0.0 0.0 0.0 0.0 0.0 0.0 0.0 0.0
RO 485.1 102.0 32.8 20.5 5 472.7 5 051.5 4 902.7 4 245.3
SI
SK
FI 0.0 0.0 0.0 0.0 0.0 0.0 0.0 0.0
SE 0.0 0.0 0.0 0.0
UK 1 024.8 65 153.9 41 147.4 33 686.0 28 916.7

141
EU ENERGY IN FIGURES 2017
* Provisional data.
Italics: DG Energy Estimations.
Sources: Eurostat, Structural Business Statistics Survey (SBS), July 2017
Methodology and Notes: See Appendix 13 – No 3
3.2.2 Turnover in the Energy Sector
ENTERPRISES SURVEY
Extraction of Peat (B08.92)Support Activities for Petroleum
and Natural Gas Extraction (B09.1)
Mio EUR 2008 2013 2014 2015* 2008 2013 2014 2015*
EU-28 1 651.4 1 749.8 1 749.4 1 700.0 13 587.4 16 389.7 18 764.0 19 391.9
BE 0.0 0.0 0.0
BG 1.7 1.1 1.2 1.2 0.2
CZ
DK 358.5 377.5 409.9 372.4
DE 348.8 413.4 412.6 399.6
EE 71.5 79.8 88.6 83.5 0.0 0.0 0.0 0.0
IE 49.5 38.1 5.9 6.8
EL 0.0
ES 11.6 9.1 9.2 9.9 60.1 226.1 98.6
FR 63.3 67.7 330.3 446.2
HR 0.0 0.0 0.0 256.3
IT 0.0 2.6 3.7 486.2 1 633.8 1 518.3
CY 0.0 0.0 0.0 0.0
LV 132.6 142.9 0.0
LT 32.5 58.5 57.0 0.0 0.0 0.0 0.0
LU 0.0 0.0 0.0 0.0 0.0 0.0 0.0
HU 3.0 5.3 146.1 130.0 116.2 133.4
MT 0.0 0.0 0.0
NL
AT 2.7 2.7 11.3 35.6 34.3 48.3
PL 39.3 49.3 213.9 424.9 420.7 319.3
PT 0.0 0.0
RO 1.1 0.7 0.8 973.4 796.4 757.6 596.7
SI 0.0 0.0 0.0
SK
FI 460.1 494.2 502.0 0.0 0.0 0.0 0.0
SE 38.3 40.8 36.5 168.6 121.5 108.7
UK 80.2 73.3 101.6 7 537.0 9 101.7 9 786.9 9 776.7

142
PART 3 Socio-Economic Indicators in the EU
* Provisional data.
Italics: DG Energy Estimations.
Sources: Eurostat, Structural Business Statistics Survey (SBS), July 2017
Methodology and Notes: See Appendix 13 – No 3
3.2.2 Turnover in the Energy Sector
ENTERPRISES SURVEY
Manufacture of Coke and Refined Petroleum Products (C19)
Electricity, Gas, Steam and Air Conditioning Supply (D35)
Mio EUR 2008 2013 2014 2015* 2008 2013 2014 2015*
EU-28 547 992.2 606 176.5 557 103.4 405 871.0 1 149 803.8 1 539 990.8 1 478 875.8 1 510 000.0
BE 60 047.0 56 368.4 42 260.8 44 457.8 39 494.2 39 372.2
BG 7 313.3 7 993.7 8 083.2 8 357.4
CZ 5 021.9 4 837.5 4 943.2 30 927.4 45 257.8 38 780.3 40 844.1
DK 20 410.1 26 655.8 24 828.6 24 426.0
DE 134 361.4 140 054.5 131 075.1 107 407.8 357 896.1 581 264.4 560 482.1 537 677.0
EE 179.9 297.0 280.8 253.8 1 542.3 2 245.2 2 013.6 1 764.7
IE 6 891.7 8 711.8 7 763.4 8 145.3
EL 17 296.6 19 688.0 21 585.2 17 677.4 5 977.0 12 353.6 11 420.1 11 472.0
ES 44 349.3 52 243.3 47 980.4 36 051.4 74 338.8 93 620.4 94 965.9 93 787.0
FR 69 128.4 53 048.3 47 136.7 39 385.2 106 500.6 119 162.0 112 204.8 110 714.7
HR 3 147.9 4 336.7 4 364.6 4 358.9
IT 48 947.8 51 131.3 38 791.9 33 417.8 156 801.7 212 610.2 205 223.7 201 396.0
CY 738.2
LV 6.6 7.4 2 390.8 2 819.9 2 313.5 2 090.6
LT 2 690.3 3 234.6 2 772.4 2 369.6
LU 0.0 0.0 0.0 0.0 2 252.1 4 133.7 3 844.5
HU 9 384.0 8 728.3 8 160.6 6 529.2 26 852.9 18 953.1 16 682.5 16 726.6
MT
NL 52 344.4 50 694.6 35 122.0 38 660.1 38 759.4 34 983.0 32 435.8
AT 9 698.2 8 938.3 7 219.2 27 553.5 38 505.7 34 508.0 35 307.0
PL 28 312.7 34 880.3 32 743.8 26 977.8 44 091.4 46 297.7 44 063.7 47 792.3
PT 7 841.7 9 659.7 8 510.9 7 130.6 18 485.1 21 552.4 21 669.9 21 119.1
RO 4 112.9 4 323.3 4 747.4 3 370.8 13 180.6 12 671.6 12 404.1 13 153.8
SI 14.6 8.1 3 580.0 5 949.9 5 535.5 6 075.6
SK 11 021.1 12 834.5 10 725.6 11 318.8
FI 6 520.6 12 012.3 13 630.5 13 074.4 12 340.4
SE 1 526.2 10 695.7 24 823.9 30 323.3 26 833.9 26 452.8
UK 49 837.4 57 903.5 52 334.0 40 197.8 107 875.7 130 805.0 138 730.6 148 344.2

143
EU ENERGY IN FIGURES 2017
3.2.3 Number of Persons Declared as Employed in the Energy Sector
ENTERPRISES SURVEY – EU�28
2013 2014 2015*
B05: Mining of Coal and Lignite 194 900 177 143 158 945
B06: Extraction of Crude Petroleum and Natural Gas
77 000 79 131 77 187
B07.21: Mining of Uranium and Thorium Ores
B08.92: Extraction of Peat 11 200 11 622 11 400B09.1: Support Activities for Petroleum and
Natural Gas Extraction56 100 57 497 56 570
C19: Manufacture of Coke and Refined Petroleum Products
119 600 117 892 111 946
D35: Electricity, Gas, Steam and Air Conditioning Supply
1 216 300 1 230 152 1 233 305
D35.1: Electricity 916 300 937 829
35.11: Production of Electricity 457 800 446 326
35.12: Transmission of Electricity 54 800 54 825
35.13: Distribution of Electricity 309 700 339 317
35.14: Trade of Electricity 94 000 97 360
D35.2: Gas 152 300 148 589
35.21: Manufacture of Gas 8 800 7 241
35.22: Distribution of Gaseous Fuels through Mains
102 700 99 993
35.23: Trade of Gas through Mains 40 800 41 344
D35.3: Steam and Air Conditioning 147 700 143 734
35.30: Steam and Air Conditioning Supply
147 700 143 734
Broad Sector – Employment Reported 1 675 100 1 673 437 1 649 353
* Provisional data.
Italics: DG Energy Estimations.
Sources: Eurostat, Structural Business Statistics Survey (SBS), July 2017
Methodology and Notes: See Appendix 13 – No 3

144
PART 3 Socio-Economic Indicators in the EU
* Provisional data.
Italics: DG Energy Estimations.
Sources: Eurostat, Structural Business Statistics Survey (SBS), July 2017
Methodology and Notes: See Appendix 13 – No 3
3.2.3 Number of Persons Declared as Employed in the Energy Sector
ENTERPRISES SURVEY
Mining of Coal and Lignite (B05)Extraction of Crude Petroleum
and Natural Gas (B06)
2008 2013 2014 2015* 2008 2013 2014 2015*
EU-28 253 883 194 900 177 143 158 945 88 205 77 000 79 131 77 187
BE 0 0 0 0 0 0
BG 13 905 12 534 12 132 11 995
CZ 21 595 19 972 18 715
DK 0 0 0 0 444 971 1 030 987
DE 38 415 22 511 20 164 17 468 3 544 3 764 3 972 3 927
EE 0 0 0 0
IE
EL 159 127
ES 7 311 4 012 3 666 1 684 215 355 368
FR 0 672
HR 0 0 0 0 7 852
IT 13 047 12 354 12 882 12 884
CY 0 0 0 0 0 0 0 0
LV 18 0 0 0 0 15 19 20
LT 0 0 0 0 351 269 255 212
LU 0 0 0 0 0 0 0 0
HU 121 243 143 124 36 82 80 68
MT 0 0 0 0 0 0 0 0
NL 0 0 0 3 076 3 627 3 831 3 913
AT 0 0 0 0
PL 138 338 116 760 95 973 714
PT 0 0 0 0 0 0 0 0
RO 20 804 5 758 2 213 1 843 38 538 25 680 25 246 23 485
SI 1
SK
FI 0 0 0 0 0 0 0 0
SE 0 0 0 0
UK 5 944 5 421 3 777 2 844 13 405 14 363 17 127
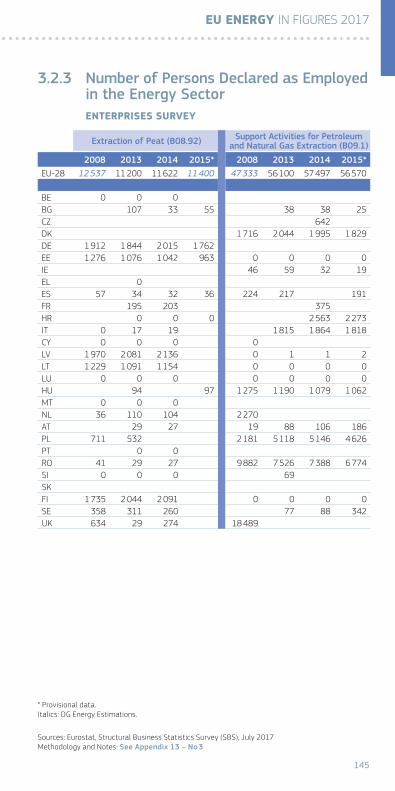
145
EU ENERGY IN FIGURES 2017
* Provisional data.
Italics: DG Energy Estimations.
Sources: Eurostat, Structural Business Statistics Survey (SBS), July 2017
Methodology and Notes: See Appendix 13 – No 3
3.2.3 Number of Persons Declared as Employed in the Energy Sector
ENTERPRISES SURVEY
Extraction of Peat (B08.92)Support Activities for Petroleum
and Natural Gas Extraction (B09.1)
2008 2013 2014 2015* 2008 2013 2014 2015*
EU-28 12 537 11 200 11 622 11 400 47 333 56 100 57 497 56 570
BE 0 0 0
BG 107 33 55 38 38 25
CZ 642
DK 1 716 2 044 1 995 1 829
DE 1 912 1 844 2 015 1 762
EE 1 276 1 076 1 042 963 0 0 0 0
IE 46 59 32 19
EL 0
ES 57 34 32 36 224 217 191
FR 195 203 375
HR 0 0 0 2 563 2 273
IT 0 17 19 1 815 1 864 1 818
CY 0 0 0 0
LV 1 970 2 081 2 136 0 1 1 2
LT 1 229 1 091 1 154 0 0 0 0
LU 0 0 0 0 0 0 0
HU 94 97 1 275 1 190 1 079 1 062
MT 0 0 0
NL 36 110 104 2 270
AT 29 27 19 88 106 186
PL 711 532 2 181 5 118 5 146 4 626
PT 0 0
RO 41 29 27 9 882 7 526 7 388 6 774
SI 0 0 0 69
SK
FI 1 735 2 044 2 091 0 0 0 0
SE 358 311 260 77 88 342
UK 634 29 274 18 489

146
PART 3 Socio-Economic Indicators in the EU
* Provisional data.
Italics: DG Energy Estimations.
Sources: Eurostat, Structural Business Statistics Survey (SBS), July 2017
Methodology and Notes: See Appendix 13 – No 3
3.2.3 Number of Persons Declared as Employed in the Energy Sector
ENTERPRISES SURVEY
Manufacture of Coke and Refined Petroleum Products (C19)
Electricity, Gas, Steam and Air Conditioning Supply (D35)
2008 2013 2014 2015* 2008 2013 2014 2015*
EU-28 135 372 119 600 117 892 111 946 1 243 616 1 216 300 1 230 152 1 233 305
BE 4 453 4 401 4 402 20 181 20 907 21 854
BG 2 208 2 129 2 078 36 197 32 809 32 573 31 751
CZ 2 926 2 173 2 053 32 652 33 495 33 849 34 307
DK 13 206 11 265 14 308 14 509
DE 19 611 19 269 22 593 22 302 221 450 219 936 228 179 224 669
EE 1 330 1 644 1 668 1 679 6 290 5 218 5 097 4 949
IE 9 235 8 246 8 496 8 569
EL 4 557 3 945 3 920 3 723 23 955 20 481 21 598 20 902
ES 8 823 8 855 8 644 8 453 47 622 38 974 38 514 39 764
FR 181 335 190 297
HR 262 16 849 15 472 14 739 14 893
IT 16 383 13 292 11 259 11 111 84 224 87 908 88 476 90 546
CY 2 347
LV 9 30 41 66 12 185 11 109 10 624 11 233
LT 18 303 13 781 13 912 13 849
LU 0 0 0 0 1 091 1 435 1 470
HU 6 538 6 106 5 923 5 691 27 387 24 608 24 782 24 601
MT
NL 6 652 5 213 5 422 5 354 23 869 27 056 27 153 27 753
AT 1 124 1 145 1 180 28 218 29 402 29 297 29 274
PL 16 606 13 220 13 224 13 476 153 286 139 998 136 068 128 386
PT 2 132 1 990 1 794 1 830 10 336 8 913 8 703 9 589
RO 5 017 2 516 2 657 2 560 89 511 77 393 76 016 72 307
SI 93 34 26 7 828 8 942 9 069 8 957
SK 21 641 17 885 18 104 17 950
FI 2 814 13 430 13 729 13 645 13 282
SE 2 748 2 817 31 151 31 264 31 811 32 027
UK 9 998 121 447 129 496 129 335 141 099

147
EU ENERGY IN FIGURES 2017
3.3 Economy
3.3.1 GDP at Current Market Prices
Mrd EUR* 1995 2000 2005 2010 2014 2015 2016
EU-28 7 345.9 9 648.9 11 590.7 12 817.6 14 010.9 14 728.5 14 824.7
BE 221.4 258.2 311.5 365.1 400.8 410.2 4 21.6
BG 11.0 14.3 23.9 38.2 42.8 45.3 47.4
CZ 45.5 66.6 109.4 156.4 156.7 167.0 1 74.4
DK 141.4 178.0 212.8 243.2 265.2 271.8 2 76.8
DE 1 982.1 2 116.5 2 300.9 2 580.1 2 923.9 3 032.8 31 34.1
EE 2.9 6.2 11.3 14.7 19.8 20.3 20.9
IE 52.9 108.4 170.2 167.1 193.2 255.8 265.8
EL 104.7 143.0 199.2 226.0 177.9 175.7 175.9
ES 468.9 646.3 930.6 1 080.9 1 037.0 1 075.6 1 113.9
FR 1 231.4 1 485.3 1 772.0 1 998.5 2 147.6 2 194.2 2 228.9
HR 17.1 23.6 36.5 45.0 43.0 43.8 45.6
IT 895.3 1 239.3 1 489.7 1 604.5 1 621.8 1 645.4 1 672.4
CY 7.6 10.8 15.0 19.3 17.6 17.6 17.9
LV 4.1 8.6 13.7 17.8 23.6 24.4 25.0
LT 5.1 12.5 21.0 28.0 36.6 37.3 38.6
LU 16.5 23.1 30.0 40.2 50.0 52.3 54.2
HU 35.4 51.2 90.6 98.3 105.0 109.7 112.4
MT 2.8 4.4 5.1 6.6 8.4 9.3 9.9
NL 341.6 448.1 545.6 631.5 663.0 676.5 697.2
AT 183.9 213.2 253.0 294.6 330.4 339.9 349.3
PL 108.7 186.4 246.2 361.8 411.0 430.0 424.3
PT 91.0 128.5 158.7 179.9 173.1 179.5 184.9
RO 28.8 40.8 80.2 126.7 150.4 160.0 169.6
SI 16.3 21.9 29.2 36.3 37.3 38.6 39.8
SK 15.3 22.3 39.3 67.6 75.9 78.7 81.0
FI 102.7 136.3 164.4 187.1 205.5 209.5 214.1
SE 201.8 281.9 313.2 369.1 432.7 447.0 462.1
UK 1 009.5 1 773.4 2 017.4 1 833.0 2 260.8 2 580.1 2 366.9
* Units in Milliard – Long Scale = 1 000 Million €.
Source: DG Economic and Financial Affairs, AMECO, June 2017
Methodology and Notes: See Appendix 13 – No 3

148
PART 3 Socio-Economic Indicators in the EU
3.3.2 GDP per Capita at Current Market Prices
Thousand EUR/cap* 1995 2000 2005 2010 2014 2015 2016
EU-28 15.2 19.8 23.4 25.5 27.6 29.0 29.1
BE 21.9 25.2 29.8 33.7 35.8 36.5 37.3
BG 1.3 1.7 3.1 5.2 5.9 6.3 6.6
CZ 4.4 6.5 10.7 14.9 14.9 15.8 16.5
DK 27.1 33.4 39.3 43.9 47.1 48.0 48.5
DE 24.3 25.8 27.9 31.5 36.2 37.4 38.1
EE 2.0 4.4 8.3 11.0 15.0 15.4 15.9
IE 14.7 28.7 41.4 36.7 41.9 55.3 56.3
EL 9.9 13.3 18.2 20.3 16.3 16.2 16.3
ES 11.8 16.0 21.5 23.3 22.3 23.2 24.0
FR 20.8 24.5 28.2 30.9 32.6 33.0 33.4
HR 3.7 5.2 8.5 10.5 10.1 10.4 10.9
IT 15.8 21.8 25.7 27.1 26.7 27.1 27.6
CY 11.8 15.6 20.5 23.6 20.5 20.8 21.1
LV 1.7 3.6 6.1 8.4 11.8 12.3 12.7
LT 1.4 3.6 6.3 8.9 12.4 12.8 13.4
LU 40.7 53.2 65.1 80.0 90.9 93.0 94.0
HU 3.4 5.0 9.0 9.8 10.6 11.1 11.4
MT 7.5 11.3 12.8 15.9 19.8 21.6 22.8
NL 22.1 28.2 33.5 38.1 39.4 40.0 41.1
AT 23.2 26.6 30.8 35.3 38.8 39.6 40.2
PL 2.8 4.9 6.4 9.5 10.8 11.3 11.2
PT 9.1 12.5 15.1 17.0 16.6 17.3 17.9
RO 1.3 1.8 3.8 6.2 7.5 8.1 8.6
SI 8.2 11.0 14.6 17.7 18.1 18.7 19.3
SK 2.8 4.1 7.3 12.5 14.0 14.5 14.9
FI 20.1 26.3 31.4 35.0 37.7 38.3 39.0
SE 22.9 31.8 34.8 39.5 44.9 45.9 46.9
UK 17.4 30.2 33.5 29.3 35.1 39.8 36.2
* 1 000 €' per Capita.
Source: DG Economic and Financial Affairs, AMECO, June 2017
Methodology and Notes: See Appendix 13 – No 3

149
EU ENERGY IN FIGURES 2017
3.3.3 GDP at 2010 Market Prices
Mrd EUR* 1995 2000 2005 2010 2014 2015 2016
EU-28 9 650.9 11 149.9 12 259.3 12 817.6 13 215.4 13 506.5 13 760.0
BE 270.1 311.5 340.8 365.1 378.1 383.6 388.2
BG 24.0 24.4 32.2 38.2 39.8 41.3 42.7
CZ 104.7 114.4 138.7 156.4 161.7 169.1 173.2
DK 194.1 225.2 240.6 243.2 253.5 257.5 260.8
DE 2 145.1 2 358.7 2 426.5 2 580.1 2 743.9 2 791.1 2 843.2
EE 7.9 10.7 15.0 14.7 17.2 17.5 17.7
IE 78.2 124.7 163.3 167.1 181.2 228.8 240.7
EL 158.8 189.9 229.8 226.0 184.9 184.5 184.5
ES 710.5 867.9 1 025.4 1 080.9 1 035.1 1 068.3 1 102.9
FR 1 535.1 1 771.7 1 923.2 1 998.5 2 075.0 2 097.2 2 122.1
HR 29.8 35.3 44.0 45.0 43.2 43.9 45.2
IT 1 409.1 1 555.6 1 629.9 1 604.5 1 542.9 1 555.0 1 568.7
CY 11.8 14.3 17.0 19.3 17.4 17.7 18.2
LV 9.6 12.3 18.2 17.8 20.6 21.2 21.6
LT 14.6 18.3 26.4 28.0 33.1 33.6 34.4
LU 23.1 30.8 35.6 40.2 45.1 46.9 48.9
HU 69.5 80.5 99.3 98.3 104.6 107.9 110.0
MT 4.3 5.4 6.0 6.6 7.8 8.3 8.8
NL 448.7 554.7 592.8 631.5 643.0 655.6 670.0
AT 218.6 253.7 276.3 294.6 307.5 310.5 315.1
PL 190.5 246.2 286.7 361.8 404.3 419.8 431.1
PT 136.9 167.1 174.5 179.9 169.1 171.8 174.2
RO 84.0 83.0 109.8 126.7 137.6 143.0 149.9
SI 22.6 27.9 33.3 36.3 36.2 37.1 38.0
SK 35.2 41.9 53.6 67.6 73.5 76.3 78.9
FI 123.4 158.1 179.6 187.1 186.6 187.1 189.6
SE 251.4 299.7 341.2 369.1 392.5 408.5 421.5
UK 1 339.4 1 566.2 1 799.6 1 833.0 1 980.1 2 023.6 2 060.1
* Units in Milliard – Long Scale = 1 000 Million €.
Source: DG Economic and Financial Affairs, AMECO, June 2017
Methodology and Notes: See Appendix 13 – No 3

150
PART 3 Socio-Economic Indicators in the EU
3.3.4 GDP per Capita at 2010 Market Prices
Thousand EUR/cap* 1995 2000 2005 2010 2014 2015 2016
EU-28 20.0 22.9 24.8 25.5 26.1 26.6 27.0
BE 26.7 30.4 32.6 33.7 33.8 34.1 34.3
BG 2.8 3.0 4.2 5.2 5.5 5.7 6.0
CZ 10.1 11.1 13.6 14.9 15.4 16.0 16.4
DK 37.2 42.3 44.5 43.9 45.0 45.5 45.7
DE 26.3 28.7 29.4 31.5 34.0 34.4 34.6
EE 5.5 7.6 11.1 11.0 13.1 13.3 13.5
IE 21.7 33.0 39.7 36.7 39.3 49.4 50.9
EL 15.1 17.6 20.9 20.3 16.9 17.0 17.1
ES 17.9 21.4 23.7 23.3 22.3 23.0 23.7
FR 25.9 29.3 30.6 30.9 31.5 31.5 31.8
HR 6.4 7.8 10.2 10.5 10.2 10.4 10.8
IT 24.8 27.3 28.2 27.1 25.4 25.6 25.9
CY 18.3 20.7 23.2 23.6 20.2 20.8 21.4
LV 3.8 5.2 8.1 8.4 10.3 10.7 11.0
LT 4.0 5.2 7.9 8.9 11.2 11.5 11.9
LU 56.9 71.0 77.2 80.0 82.0 83.3 84.8
HU 6.7 7.9 9.8 9.8 10.6 10.9 11.2
MT 11.5 13.9 14.8 15.9 18.3 19.4 20.2
NL 29.1 35.0 36.4 38.1 38.2 38.8 39.5
AT 27.5 31.7 33.7 35.3 36.1 36.2 36.3
PL 4.9 6.4 7.5 9.5 10.6 11.0 11.4
PT 13.7 16.3 16.6 17.0 16.2 16.6 16.8
RO 3.7 3.7 5.1 6.2 6.9 7.2 7.6
SI 11.4 14.0 16.7 17.7 17.6 18.0 18.4
SK 6.6 7.8 10.0 12.5 13.6 14.1 14.5
FI 24.2 30.6 34.3 35.0 34.2 34.2 34.6
SE 28.5 33.8 37.9 39.5 40.7 41.9 42.8
UK 23.1 26.6 29.9 29.3 30.8 31.2 31.5
* 1 000 €' 2010 per Capita.
Source: DG Economic and Financial Affairs, AMECO, June 2017
Methodology and Notes: See Appendix 13 – No 3

151
EU ENERGY IN FIGURES 2017
3.4 Demography
3.4.1 Population
ON 1ST JANUARY
Thousand Inhabitants 1995 2000 2005 2010 2014 2015 2016
EU-28 4 819 04.0 4 872 59.1 494 598.3 503 170.6 506 973.9 508 504.3 510 284.4
BE 10 130.6 10 239.1 10 445.9 10 839.9 11 180.8 11 237.3 11 311.1
BG 8 427.4 8 190.9 7 688.6 7 421.8 7 245.7 7 202.2 7 153.8
CZ 10 333.2 10 278.1 10 198.9 10 462.1 10 512.4 10 538.3 10 553.8
DK 5 215.7 5 330.0 5 411.4 5 534.7 5 627.2 5 659.7 5 707.3
DE 81 538.6 82 163.5 82 500.8 81 802.3 80 767.5 81 197.5 82 175.7
EE 1 448.1 1 401.3 1 358.9 1 333.3 1 315.8 1 314.9 1 315.9
IE 3 597.6 3 777.6 4 111.7 4 549.4 4 605.5 4 628.9 4 724.7
EL 10 536.0 10 775.6 10 969.9 11 119.3 10 926.8 10 858.0 10 783.7
ES 39 639.7 40 470.2 43 296.3 46 486.6 46 512.2 46 449.6 46 445.8
FR 59 315.1 60 545.0 62 772.9 64 658.9 65 942.1 66 488.2 66 760.0
HR 4 658.9 4 497.7 4 310.9 4 302.8 4 246.8 4 225.3 4 190.7
IT 56 844.4 56 923.5 57 874.8 59 190.1 60 782.7 60 795.6 60 665.6
CY 645.4 690.5 733.1 819.1 858.0 847.0 848.3
LV 2 500.6 2 381.7 2 249.7 2 120.5 2 001.5 1 986.1 1 969.0
LT 3 643.0 3 512.1 3 355.2 3 142.0 2 943.5 2 921.3 2 888.6
LU 405.7 433.6 461.2 502.1 549.7 563.0 576.2
HU 10 336.7 10 221.6 10 097.5 10 014.3 9 877.4 9 855.6 9 830.5
MT 376.4 388.8 402.7 414.0 425.4 429.3 434.4
NL 15 424.1 15 864.0 16 305.5 16 575.0 16 829.3 16 900.7 16 979.1
AT 7 943.5 8 002.2 8 201.4 8 351.6 8 506.9 8 576.3 8 690.1
PL 38 580.6 38 263.3 38 173.8 38 022.9 38 017.9 38 005.6 37 967.2
PT 10 008.7 10 249.0 10 494.7 10 573.5 10 427.3 10 374.8 10 341.3
RO 22 712.4 22 455.5 21 382.4 20 294.7 19 947.3 19 870.6 19 760.3
SI 1 989.5 1 987.8 1 997.6 2 047.0 2 061.1 2 062.9 2 064.2
SK 5 356.2 5 398.7 5 372.7 5 390.4 5 415.9 5 421.3 5 426.3
FI 5 098.8 5 171.3 5 236.6 5 351.4 5 451.3 5 471.8 5 487.3
SE 8 816.4 8 861.4 9 011.4 9 340.7 9 644.9 9 747.4 9 851.0
UK 57 943.5 58 785.2 60 182.1 62 510.2 64 351.2 64 875.2 65 382.6
Source: DG Economic and Financial Affairs, AMECO, June 2017
Methodology and Notes: See Appendix 13 – No 3

152
PART 3 Socio-Economic Indicators in the EU
3.5 Employment
3.5.1 Total Persons Employed in the Energy Sector (15-64 years)
MEMBER STATES DATA – EU�28
Thousands 2010 2013 2014 2015 2016
B05 Mining of coal and lignite
331.2 326.4 313.5 294.5 274.1
B06 Extraction of crude petroleum and natural gas
103.8 96.8 97.8 88.8 81.3
B0892 Extraction of peat*
12.5 11.2 11.6 11.4 11.4
B091 Support activities for petroleum and natural gas extraction*
47.3 56.1 57.5 56.6 56.6
C19 Manufacture of coke and refined petroleum products
218.7 207.9 198.5 190.0 186.4
D35 Electricity, gas, steam and air conditioning supply
1 645.4 1 616.3 1 581.9 1 550.3 1 551.8
Broad Sector Total Employment**
2 359.0 2 314.7 2 260.8 2 191.6 2 161.6
* According to the Structural Business Survey (SBS), July 2017, and DG ENERGY estimates.
** Estimate of total employment as a sum of available and uncomplete figures presented
in the table.
Italics: DG Energy Estimations
Sources: Eurostat, Labour Force Survey (LFS), July 2017
Methodology and Notes: See Appendix 13 – No 3

153
EU ENERGY IN FIGURES 2017
3.5.2 Employment Rate in all Economic Sectors
MEMBER STATES’ DATA – ALL SECTORS �15�64 YEARS�
% 2010 2012 2013 2014 2015 2016
EU-28 64.1 64.1 64.1 64.8 65.6 66.6
BE 62.0 61.8 61.8 61.9 61.8 62.3
BG 59.8 58.8 59.5 61.0 62.9 63.4
CZ 65.0 66.5 67.7 69.0 70.2 72.0
DK 73.3 72.6 72.5 72.8 73.5 74.9
DE 71.3 73.0 73.5 73.8 74.0 74.7
EE 61.2 67.1 68.5 69.6 71.9 72.1
IE 59.6 58.8 60.5 61.7 63.3 64.8
EL 59.1 50.8 48.8 49.4 50.8 52.0
ES 58.8 55.8 54.8 56.0 57.8 59.5
FR 64.0 64.0 64.0 64.2 64.3 64.6
HR 57.4 53.5 52.5 54.6 56.0 56.9
IT 56.8 56.6 55.5 55.7 56.3 57.2
CY 68.9 64.6 61.7 62.1 62.7 63.4
LV 58.5 63.0 65.0 66.3 68.1 68.7
LT 57.6 62.0 63.7 65.7 67.2 69.4
LU 65.2 65.8 65.7 66.6 66.1 65.6
HU 54.9 56.7 58.1 61.8 63.9 66.5
MT 56.2 59.1 60.8 62.4 63.9 65.7
NL 74.7 74.4 73.6 73.1 74.1 74.8
AT 70.8 71.4 71.4 71.1 71.1 71.5
PL 58.9 59.7 60.0 61.7 62.9 64.5
PT 65.3 61.4 60.6 62.6 63.9 65.2
RO 60.2 60.2 60.1 61.0 61.4 61.6
SI 66.2 64.1 63.3 63.9 65.2 65.8
SK 58.8 59.7 59.9 61.0 62.7 64.9
FI 68.1 69.4 68.9 68.7 68.5 69.1
SE 72.1 73.8 74.4 74.9 75.5 76.2
UK 69.4 69.9 70.5 71.9 72.7 73.5
Sources: Eurostat, Labour Force Survey (LFS), July 2017
Methodology and Notes: See Appendix 13 – No 3

154
PART 3 Socio-Economic Indicators in the EU
3.5.3 Unemployment Rate in all Economic Sectors
MEMBER STATES’ DATA – ALL SECTORS
% 2010 2012 2013 2014 2015 2016
EU-28 9.6 10.5 10.9 10.2 9.4 8.5
BE 8.3 7.6 8.4 8.5 8.5 7.8
BG 10.3 12.3 13.0 11.4 9.2 7.6
CZ 7.3 7.0 7.0 6.1 5.1 4.0
DK 7.5 7.5 7.0 6.6 6.2 6.2
DE 7.0 5.4 5.2 5.0 4.6 4.1
EE 16.7 10.0 8.6 7.4 6.2 6.8
IE 13.9 14.7 13.1 11.3 9.4 7.9
EL 12.7 24.5 27.5 26.5 24.9 23.6
ES 19.9 24.8 26.1 24.5 22.1 19.6
FR 9.3 9.8 10.3 10.3 10.4 10.1
HR 11.8 15.8 17.4 17.2 16.1 13.3
IT 8.4 10.7 12.1 12.7 11.9 11.7
CY 6.3 11.9 15.9 16.1 15.0 13.1
LV 19.5 15.0 11.9 10.8 9.9 9.6
LT 17.8 13.4 11.8 10.7 9.1 7.9
LU 4.6 5.1 5.9 6.0 6.5 6.3
HU 11.2 11.0 10.2 7.7 6.8 5.1
MT 6.9 6.3 6.4 5.8 5.4 4.7
NL 5.0 5.8 7.3 7.4 6.9 6.0
AT 4.8 4.9 5.4 5.6 5.7 6.0
PL 9.7 10.1 10.3 9.0 7.5 6.2
PT 12.0 15.8 16.4 14.1 12.6 11.2
RO 7.0 6.8 7.1 6.8 6.8 5.9
SI 7.3 8.9 10.1 9.7 9.0 8.0
SK 14.5 14.0 14.2 13.2 11.5 9.6
FI 8.4 7.7 8.2 8.7 9.4 8.8
SE 8.6 8.0 8.0 7.9 7.4 6.9
UK 7.8 7.9 7.5 6.1 5.3 4.8
* Percentage of active population.
Sources: Eurostat, Labour Force Survey (LFS), July 2017
Methodology and Notes: See Appendix 13 – No 3
*

4PART
Environment
Indicators in the EU

PART 4 Environment Indicators in the EU

157
EU ENERGY IN FIGURES 2017
Summary
4.1 Gases Emissions . . . . . . . . . . . . . . . . . . . . . . . . . . . . . . . . . . . . . . . . . . . . . . . . . . . . . . . . . . . . . . 158
4.1.1 GHGs Emissions . . . . . . . . . . . . . . . . . . . . . . . . . . . . . . . . . . . . . . . . . . . . . . . . . . . . . . . . . 158
EU-28 and Member States – Total . . . . . . . . . . . . . . . . . . . . . . . . . . . . . . . . . . . 158
EU-28 and Member States – Fuel Combustion . . . . . . . . . . . . . . . . . . . 159
EU-28 and Member States – Other Than Fuel Combustion . . . . . 160
EU-28 – Total and Fuel Combustion . . . . . . . . . . . . . . . . . . . . . . . . . . . . . . . . . 161
EU-28 – Other Than Fuel Combustion . . . . . . . . . . . . . . . . . . . . . . . . . . . . . . 162
4.1.2 CO2 Emissions . . . . . . . . . . . . . . . . . . . . . . . . . . . . . . . . . . . . . . . . . . . . . . . . . . . . . . . . . . . 163
EU-28 and Member States – Total . . . . . . . . . . . . . . . . . . . . . . . . . . . . . . . . . . . 163
EU-28 and Member States – Fuel Combustion . . . . . . . . . . . . . . . . . . . . 164
EU-28 and Member States – Other Than Fuel Combustion . . . . . 165
EU-28 – Total and Fuel Combustion . . . . . . . . . . . . . . . . . . . . . . . . . . . . . . . . . 166
EU-28 – Other Than Fuel Combustion . . . . . . . . . . . . . . . . . . . . . . . . . . . . . . 167
4.2 Main Emissions Indicators . . . . . . . . . . . . . . . . . . . . . . . . . . . . . . . . . . . . . . . . . . . . . . . . 168
4.2.1 CO2 per Capita . . . . . . . . . . . . . . . . . . . . . . . . . . . . . . . . . . . . . . . . . . . . . . . . . . . . . . . . . . 168
4.2.2 Carbon GDP Intensity . . . . . . . . . . . . . . . . . . . . . . . . . . . . . . . . . . . . . . . . . . . . . . . . . . 169

158
PART 4 Environment Indicators in the EU
4.1 Gases Emissions
4.1.1 GHGs Emissions
EU�28 AND MEMBER STATES – TOTAL
Million ton CO2 equiv. 1995 2000 2005 2010 2014 2015
EU-28 5 381.4 5 270.8 5 345.2 4 909.5 4 423.7 4 451.8
Index 1995 100.0 % 97.9 % 99.3 % 91.2 % 82.2 % 82.7 %
BE 157.3 154.2 148.7 136.6 118.1 121.6
BG 75.3 59.6 64.3 60.8 58.0 62.0
CZ 157.6 150.0 148.6 140.6 127.5 128.8
DK 80.1 73.1 68.9 65.6 53.5 51.0
DE 1 135.7 1 062.2 1 014.9 966.0 928.8 926.5
EE 20.3 17.4 19.3 21.3 21.2 18.1
IE 60.9 70.9 72.5 64.0 60.0 62.4
EL 111.8 128.9 138.9 120.9 102.2 98.6
ES 335.2 395.8 451.6 369.6 338.3 350.4
FR 554.6 566.4 569.1 527.7 470.0 474.6
HR 22.6 25.5 29.6 27.6 23.4 23.9
IT 536.8 560.9 588.3 514.1 432.5 442.8
CY 7.9 9.2 10.2 10.4 9.2 9.2
LV 12.8 10.4 11.5 12.6 11.5 11.6
LT 22.4 19.7 23.2 20.9 20.1 20.3
LU 10.6 10.6 14.3 13.5 12.0 11.7
HU 76.0 74.2 76.6 66.1 58.4 61.6
MT 2.9 3.0 3.3 3.3 3.3 2.6
NL 239.2 229.7 225.4 224.5 198.5 206.7
AT 81.2 82.2 94.6 87.1 78.4 81.0
PL 439.7 391.4 399.8 408.4 384.7 387.7
PT 71.7 84.5 88.6 72.1 67.4 72.1
RO 181.7 140.6 146.8 121.4 116.0 117.8
SI 18.8 19.2 20.6 19.7 16.7 16.9
SK 54.5 49.9 51.5 46.7 40.8 41.4
FI 72.7 71.1 70.9 77.3 61.1 57.5
SE 75.2 70.7 68.8 66.7 56.1 55.9
UK 765.8 739.8 724.5 643.9 555.8 536.9
* GHG emissions without LULUCF, with indirect CO2 and including international aviation.
Source: EEA_UNFCCC v_20 June 2017
Methodology and Notes: See Appendix 13 – No 4

159
EU ENERGY IN FIGURES 2017
4.1.1 GHGs Emissions
EU�28 AND MEMBER STATES – FUEL COMBUSTION
2015
Million ton CO2 equiv. F
uel
Com
bust
ion
Act
ivit
ies
Energ
y
Indust
ries
Manufa
cturi
ng
Indust
ries
and
Const
ruct
ion
Transp
ort
Com
merc
ial/
Inst
ituti
onal
Resi
denti
al
Agri
cult
ure
/ Fore
stry
/ Fis
heri
es
Oth
er
Sect
ors
Oth
er
Com
bust
ion
and F
ugit
ive
Em
issi
ons
EU-28 3 358.0 1 242.0 483.4 905.9 156.3 395.3 78.8 7.0 89.3
Share ( %) 75.43 % 27.90 % 10.86 % 20.35 % 3.51 % 8.88 % 1.77 % 0.16 % 2.01 %
BE 86.3 21.3 13.6 26.5 5.8 16.2 2.1 0.1 0.6
BG 45.6 30.3 2.9 9.4 0.3 1.0 0.5 0.1 1.2
CZ 98.0 53.6 9.9 17.7 2.6 8.1 1.2 0.4 4.4
DK 34.5 12.8 3.9 12.3 0.8 2.2 1.8 0.2 0.4
DE 762.2 335.4 127.1 160.8 34.6 86.4 6.3 1.0 10.7
EE 15.9 12.2 0.5 2.3 0.1 0.3 0.4 0.0 0.0
IE 36.5 11.8 4.5 11.8 1.7 6.0 0.6 0.0 0.0
EL 71.0 40.9 5.2 17.1 0.7 5.2 0.6 0.2 1.1
ES 255.5 86.2 41.2 83.4 11.2 17.2 11.4 0.3 4.6
FR 316.9 42.1 50.5 132.5 25.3 50.1 12.1 0.0 4.2
HR 16.7 4.8 2.2 6.0 0.6 1.9 0.7 0.0 0.5
IT 354.2 105.9 52.6 106.0 23.4 50.7 7.7 0.5 7.5
CY 6.0 3.0 0.5 1.9 0.1 0.4 0.1 0.0 0.0
LV 7.1 1.8 0.7 3.1 0.5 0.5 0.4 0.0 0.1
LT 11.1 3.2 1.2 5.1 0.3 0.8 0.2 0.0 0.3
LU 8.9 0.5 1.1 5.7 0.5 1.1 0.0 0.0 0.0
HU 43.3 13.9 4.3 12.2 3.1 7.6 1.4 0.0 0.8
MT 1.8 0.9 0.0 0.6 0.1 0.0 0.0 0.0 0.0
NL 161.0 68.4 24.1 31.2 7.6 16.8 10.0 0.2 2.8
AT 53.4 10.9 10.5 22.6 1.9 6.1 0.9 0.1 0.5
PL 316.1 163.6 28.1 46.6 8.0 36.6 10.4 0.0 22.9
PT 48.2 18.4 7.9 16.2 1.1 2.1 1.1 0.1 1.3
RO 80.1 29.7 12.5 15.7 2.0 7.3 1.0 0.5 11.4
SI 13.4 4.6 1.6 5.4 0.4 0.9 0.2 0.0 0.4
SK 27.4 7.7 6.8 6.7 1.5 2.9 0.3 0.0 1.6
FI 40.8 16.2 8.4 11.1 1.0 1.5 1.4 1.1 0.1
SE 39.0 9.0 7.6 18.2 0.7 1.0 1.4 0.2 0.9
UK 407.2 133.0 53.9 117.8 20.4 64.4 4.7 2.0 11.0
Source: EEA_UNFCCC v_20 June 2017
Methodology and Notes: See Appendix 13 – No 4

160
PART 4 Environment Indicators in the EU
4.1.1 GHGs Emissions
EU�28 AND MEMBER STATES –
OTHER THAN FUEL COMBUSTION
2015
Million ton CO2 equiv. Indust
rial
Pro
cess
es
and
Solv
ent
Use
Agri
cult
ure
Wast
e a
nd
Oth
ers
Indir
ect
CO
2
Inte
rnati
onal
avia
tion
EU-28 373.9 436.7 139.3 1.7 142.2
Share (%) 8.40 % 9.81 % 3.13 % 0.04 % 3.19 %
BE 19.5 10.0 1.6 0.0 4.2
BG 5.7 5.9 4.2 0.0 0.5
CZ 15.4 8.5 5.3 0.8 0.9
DK 2.0 10.3 1.2 0.4 2.7
DE 61.5 67.0 11.2 0.0 24.5
EE 0.5 1.3 0.3 0.0 0.1
IE 3.1 19.2 1.0 0.0 2.5
EL 11.9 8.3 4.5 0.0 2.9
ES 30.8 36.0 13.5 0.0 14.7
FR 44.5 78.4 17.4 0.0 17.5
HR 0.0 0.0 0.0 0.0 0.0
IT 30.0 30.0 18.8 0.0 9.8
CY 1.3 0.6 0.5 0.0 0.8
LV 0.8 2.7 0.7 0.0 0.3
LT 3.4 4.6 1.0 0.0 0.2
LU 0.6 0.7 0.1 0.0 1.4
HU 7.3 6.7 3.8 0.0 0.5
MT 0.2 0.1 0.1 0.0 0.4
NL 11.5 19.2 3.4 0.2 11.5
AT 16.7 7.2 1.7 0.0 2.1
PL 28.5 29.6 11.6 0.0 1.9
PT 7.6 6.6 6.4 0.2 3.2
RO 11.9 18.6 5.8 0.0 1.4
SI 1.2 1.7 0.5 0.0 0.1
SK 9.3 3.0 1.5 0.0 0.1
FI 6.1 6.5 2.1 0.1 2.0
SE 6.4 6.9 1.4 0.0 2.2
UK 33.5 44.6 18.2 0.0 33.4
Source: EEA, UNFCCC v_20 June 2017
Methodology and Notes: See Appendix 13 – No 4

161
EU ENERGY IN FIGURES 2017
6 000
5 000
4 000
3 000
2 000
1 000
0
19
90
19
91
19
92
19
93
19
94
19
95
19
96
19
97
19
98
19
99
20
00
20
01
20
02
20
03
20
04
20
05
20
06
20
07
20
08
20
09
20
10
20
11
20
12
20
13
20
14
20
15
4.1.1 GHGs Emissions
EU�28 – TOTAL AND FUEL COMBUSTION
Million ton CO2 equiv. G
HG
Em
issi
ons
-
Nati
onal To
tal
(incl
udin
g inte
rn)
Fuel
Com
bust
ion
Act
ivit
ies
Energ
y
Indust
ries
Manufa
cturi
ng
Indust
ries
and
Const
ruct
ion
Transp
ort
Com
merc
ial/
Inst
ituti
onal
Resi
denti
al
Agri
cult
ure
/ Fore
stry
/ Fis
heri
es
Oth
er
Sect
ors
1990 5 716 4 337 1 679.6 836.4 781.8 200.3 526.9 97.2 23.3
1991 5 614 4 295 1 642.3 789.4 789.3 210.3 569.3 96.2 19.4
1992 5 443 4 161 1 582.3 752.8 813.9 193.4 534.4 93.2 16.8
1993 5 347 4 082 1 515.2 724.0 818.9 191.9 550.1 96.3 14.7
1994 5 328 4 040 1 524.7 727.4 824.1 178.7 514.4 96.0 14.3
1995 5 381 4 071 1 520.7 743.5 837.5 181.8 517.6 95.5 13.6
1996 5 495 4 179 1 550.4 732.3 864.7 199.8 565.3 98.1 12.1
1997 5 399 4 077 1 503.5 724.2 876.4 184.7 530.8 95.1 12.2
1998 5 360 4 063 1 521.0 692.6 904.2 182.7 519.3 92.2 11.6
1999 5 256 3 998 1 478.3 671.7 923.1 182.2 505.4 92.0 10.5
2000 5 271 4 005 1 509.1 679.5 918.0 175.9 491.2 89.9 9.7
2001 5 325 4 086 1 550.5 656.1 931.4 190.8 527.7 90.0 8.9
2002 5 279 4 057 1 567.5 640.6 942.2 178.7 505.4 88.2 8.9
2003 5 367 4 137 1 618.0 648.9 951.5 179.9 517.8 88.6 9.6
2004 5 375 4 132 1 604.8 646.6 971.1 184.6 509.6 89.1 10.6
2005 5 345 4 108 1 597.9 635.1 970.7 185.1 506.1 89.7 10.7
2006 5 338 4 107 1 608.9 627.7 978.5 190.6 495.4 86.5 10.6
2007 5 294 4 052 1 623.2 629.5 988.4 169.3 442.8 83.4 10.9
2008 5 179 3 973 1 547.2 600.5 964.0 189.7 474.4 84.7 10.0
2009 4 804 3 691 1 421.1 503.4 936.8 181.2 461.1 82.7 8.8
2010 4 910 3 790 1 445.2 537.4 931.3 189.5 497.5 84.9 8.5
2011 4 759 3 643 1 422.3 523.4 919.2 170.3 421.6 83.3 8.2
2012 4 693 3 601 1 416.4 499.4 890.7 167.2 444.1 81.8 7.4
2013 4 599 3 513 1 342.1 489.4 883.9 168.8 447.8 81.8 7.2
2014 4 424 3 329 1 254.3 481.6 891.6 150.7 375.1 79.0 6.9
2015 4 452 3 358 1 242.0 483.4 905.9 156.3 395.3 78.8 7.0
GHGs EMISSIONS – EU�28 – TOTAL AND FUEL COMBUSTION
(MILLION ton CO2 EQUIV.�
Source: EEA, UNFCCC v_20 June 2017
Methodology and Notes: See Appendix 13 – No 4
Energy Industries
GHG’s Emissions - National Total (including intern)
Manufacturing Industries and Construction
Fuel Combustion Activities TransportAgriculture/ Forestry/Fisheries
Residential
Commercial/Institutional Other Sectors

162
PART 4 Environment Indicators in the EU
4.1.1 GHGs Emissions
EU�28 – OTHER THAN FUEL COMBUSTION
Million ton CO2 equiv. Indust
rial
Pro
cess
es
and
Solv
ent
Use
Agri
cult
ure
Wast
e a
nd
Oth
er
Indir
ect
CO
2
Inte
rnati
onal
avia
tion
1990 516.9 548.3 240.9 4.4 69.3
1991 482.9 518.3 245.5 4.3 68.2
1992 463.7 496.3 244.0 4.2 73.8
1993 455.0 483.6 244.1 4.0 78.1
1994 482.5 476.6 243.9 3.8 81.6
1995 497.2 478.1 245.3 3.7 86.1
1996 498.0 478.8 245.2 3.6 90.2
1997 504.2 477.2 241.8 3.5 94.6
1998 480.1 473.3 238.7 3.3 101.7
1999 440.6 470.8 233.6 3.0 109.8
2000 452.5 464.5 230.7 2.7 115.9
2001 437.1 457.9 227.0 2.6 114.1
2002 432.9 451.3 223.6 2.4 111.3
2003 446.5 447.1 217.7 2.4 115.8
2004 461.5 446.8 209.1 2.3 123.6
2005 460.0 439.8 203.0 2.4 131.7
2006 456.6 436.9 197.9 2.3 137.3
2007 467.3 439.1 191.4 2.2 141.9
2008 442.6 436.4 182.9 2.1 142.6
2009 371.1 431.2 176.2 2.0 132.0
2010 390.0 425.5 169.7 2.0 132.3
2011 386.7 426.3 164.0 1.9 136.6
2012 374.2 423.8 158.8 1.8 134.0
2013 371.6 426.7 150.6 1.7 135.2
2014 378.0 433.9 144.4 1.6 137.3
2015 373.9 436.7 139.3 1.7 142.2
GHGs EMISSIONS – EU�28 – OTHER THAN FUEL COMBUSTION
(MILLION ton CO2 EQUIV.�
Source: EEA, UNFCCC v_20 June 2017
Methodology and Notes: See Appendix 13 – No 4
600
500
400
300
200
100
0
19
90
19
91
19
92
19
93
19
94
19
95
19
96
19
97
19
98
19
99
20
00
20
01
20
02
20
03
20
04
20
05
20
06
20
07
20
08
20
09
20
10
20
11
20
12
20
13
20
14
20
15
Industrial Processes and Solvent Use AgricultureWaste and Others Indirect CO
2
International Aviation

163
EU ENERGY IN FIGURES 2017
4.1.2 CO2 Emissions *
EU�28 AND MEMBER STATES � TOTAL
Million ton CO2 1995 2000 2005 2010 2014 2015
EU-28 4 288.3 4 280.2 4 423.0 4 063.8 3 606.4 3 640.6
Index 1995 100.0 % 99.8 % 103.1 % 94.8 % 84.1 % 84.9 %
BE 128.7 131.2 128.9 117.5 100.6 104.4
BG 58.4 45.4 51.1 48.3 45.7 48.8
CZ 132.0 127.5 126.6 118.1 104.5 105.5
DK 64.6 57.5 54.8 52.1 40.6 38.2
DE 952.9 918.4 888.6 856.4 819.2 816.4
EE 18.3 15.4 17.3 19.1 19.0 16.0
IE 36.9 47.0 50.5 43.9 38.9 40.9
EL 89.6 105.5 116.5 99.9 81.5 77.8
ES 274.5 322.0 382.4 297.1 268.6 286.3
FR 408.4 429.0 439.9 404.0 348.1 353.9
HR 17.2 20.0 23.7 21.5 18.1 18.3
IT 453.2 474.2 500.4 434.3 356.2 366.9
CY 6.7 7.9 8.8 8.8 7.7 7.6
LV 9.3 7.2 8.0 8.9 7.5 7.6
LT 15.1 11.9 14.2 13.9 13.1 13.4
LU 9.7 9.7 13.4 12.5 11.0 10.7
HU 62.2 59.3 61.3 52.9 44.6 47.3
MT 2.7 2.8 3.0 2.9 2.8 2.1
NL 180.9 181.9 188.4 193.0 169.1 176.7
AT 65.5 68.0 81.3 74.6 66.2 68.9
PL 362.1 317.9 322.6 333.6 309.3 312.5
PT 56.4 67.9 71.6 55.4 50.9 55.3
RO 126.1 93.4 100.0 82.8 77.8 79.4
SI 15.3 15.5 17.0 16.4 13.6 13.7
SK 44.8 41.3 42.9 38.7 33.6 34.0
FI 59.2 58.2 58.4 65.7 49.7 46.4
SE 60.7 56.7 55.9 55.1 45.5 45.5
UK 577.0 587.7 595.5 536.2 463.2 446.2
* CO2 emissions without LULUCF, with indirect CO
2 and including international aviation.
Source: EEA, UNFCCC v_20 June 2017
Methodology and Notes: See Appendix 13 – No 4

164
PART 4 Environment Indicators in the EU
4.1.2 CO2 Emissions
EU�28 AND MEMBER STATES �
FUEL COMBUSTION
2015
Million ton CO2 F
uel
Com
bust
ion
Act
ivit
ies
Energ
y
Indust
ries
Manufa
cturi
ng
Indust
ries
and
Const
ruct
ion
Transp
ort
Com
merc
ial/
Inst
ituti
onal
Resi
denti
al
Agri
cult
ure
/ Fore
stry
/ Fis
heri
es
Oth
er
Sect
ors
Oth
er
Com
bust
ion
and F
ugit
ive
Em
issi
ons
EU-28 3 241.2 1 230.4 477.0 895.3 154.9 377.4 73.0 6.9 26.4
Share (%) 89.0 % 33.8 % 13.1 % 24.6 % 4.3 % 10.4 % 2.0 % 0.2 % 0.7 %
BE 84.5 21.1 13.4 26.2 5.7 16.0 2.0 0.1 0.1
BG 43.8 30.2 2.8 9.3 0.3 0.7 0.5 0.1 0.0
CZ 92.1 53.3 9.8 17.3 2.6 7.2 1.2 0.4 0.2
DK 33.7 12.7 3.8 12.2 0.8 2.0 1.8 0.2 0.2
DE 744.3 330.0 126.0 159.1 34.5 85.4 5.8 1.0 2.6
EE 15.6 12.2 0.5 2.3 0.1 0.2 0.3 0.0 0.0
IE 36.0 11.6 4.5 11.7 1.7 5.9 0.5 0.0 0.0
EL 69.2 40.8 5.2 16.8 0.7 5.1 0.5 0.2 0.0
ES 250.8 85.7 40.1 82.5 11.0 16.2 11.3 0.3 3.7
FR 310.2 41.8 50.0 130.7 25.2 48.4 11.1 0.0 3.0
HR 15.9 4.8 2.2 5.9 0.6 1.5 0.6 0.0 0.3
IT 341.7 105.3 51.5 104.8 22.9 47.1 6.9 0.5 2.6
CY 6.0 3.0 0.5 1.8 0.1 0.4 0.1 0.0 0.0
LV 6.7 1.7 0.6 3.1 0.4 0.4 0.4 0.0 0.0
LT 10.4 3.1 1.2 5.0 0.3 0.6 0.2 0.0 0.0
LU 8.8 0.5 1.1 5.6 0.5 1.1 0.0 0.0 0.0
HU 41.6 13.8 4.3 12.0 3.1 6.9 1.4 0.0 0.1
MT 1.8 0.9 0.0 0.6 0.1 0.0 0.0 0.0 0.0
NL 158.0 67.9 24.0 30.8 7.5 16.3 9.0 0.2 2.1
AT 52.2 10.8 10.3 22.4 1.8 5.8 0.8 0.0 0.2
PL 290.8 162.7 27.8 46.0 7.9 33.6 9.3 0.0 3.5
PT 47.2 18.2 7.7 16.0 1.1 1.8 1.0 0.1 1.2
RO 68.1 29.6 12.4 15.5 2.0 6.2 1.0 0.4 0.9
SI 12.8 4.5 1.6 5.3 0.4 0.7 0.2 0.0 0.1
SK 25.4 7.6 6.7 6.6 1.5 2.7 0.3 0.0 0.0
FI 40.0 16.0 8.3 11.0 0.9 1.3 1.3 1.1 0.1
SE 37.8 8.7 7.4 18.0 0.7 0.7 1.3 0.2 0.8
UK 395.7 131.7 53.0 116.5 20.4 63.4 4.1 2.0 4.6
Source: EEA, UNFCCC v_20 June 2017
Methodology and Notes: See Appendix 13 – No 4

165
EU ENERGY IN FIGURES 2017
4.1.2 CO2 Emissions
EU�28 AND MEMBER STATES �
OTHER THAN FUEL COMBUSTION
2015
Million ton CO2 Indust
rial
Pro
cess
es
and
Pro
duct
Use
Agri
cult
ure
Wast
e a
nd
Oth
ers
Indir
ect
CO
2
Inte
rnati
onal
avia
tion
EU-28 243.4 10.3 3.2 1.7 140.9
Share (%) 6.7 % 0.3 % 0.1 % 0.0 % 3.9 %
BE 15.3 0.2 0.3 0.0 4.2
BG 4.4 0.1 0.0 0.0 0.5
CZ 11.2 0.3 0.1 0.8 0.9
DK 1.2 0.2 0.0 0.4 2.6
DE 44.7 3.1 0.0 0.0 24.3
EE 0.3 0.0 0.0 0.0 0.1
IE 2.0 0.4 0.0 0.0 2.5
EL 5.7 0.0 0.0 0.0 2.9
ES 20.4 0.5 0.0 0.0 14.6
FR 22.9 2.0 1.5 0.0 17.3
HR 1.9 0.1 0.0 0.0 0.4
IT 15.0 0.4 0.1 0.0 9.7
CY 0.9 0.0 0.0 0.0 0.8
LV 0.5 0.0 0.0 0.0 0.3
LT 2.6 0.1 0.0 0.0 0.2
LU 0.5 0.0 0.0 0.0 1.4
HU 4.8 0.2 0.2 0.0 0.5
MT 0.0 0.0 0.0 0.0 0.3
NL 7.1 0.1 0.0 0.2 11.4
AT 14.4 0.1 0.0 0.0 2.1
PL 18.5 0.8 0.5 0.0 1.9
PT 4.7 0.1 0.0 0.2 3.1
RO 9.8 0.1 0.0 0.0 1.4
SI 0.7 0.0 0.0 0.0 0.1
SK 8.3 0.1 0.0 0.0 0.1
FI 4.2 0.2 0.0 0.1 2.0
SE 5.3 0.1 0.1 0.0 2.2
UK 15.9 1.2 0.3 0.0 33.1
Source: EEA, UNFCCC v_20 June 2017
Methodology and Notes: See Appendix 13 – No 4

166
PART 4 Environment Indicators in the EU
4.1.2 CO2 Emissions
EU�28 � TOTAL AND FUEL COMBUSTION
Million ton CO2 G
HG
Em
issi
ons
-
Nati
onal To
tal
(incl
udin
g inte
rn)
Fuel
Com
bust
ion
Act
ivit
ies
Energ
y
Indust
ries
Manufa
cturi
ng
Indust
ries
and
Const
ruct
ion
Transp
ort
Com
merc
ial/
Inst
ituti
onal
Resi
denti
al
Agri
cult
ure
/ Fore
stry
/ Fis
heri
es
Oth
er
Sect
ors
1990 4 530 4 111.6 1 669.9 828.9 767.4 197.7 503.4 92.1 22.8
1991 4 469 4 080.8 1 632.7 782.2 775.1 208.2 544.4 91.2 19.0
1992 4 332 3 954.7 1 573.0 745.8 799.3 191.8 511.8 88.2 16.4
1993 4 252 3 878.1 1 506.2 717.4 803.7 190.3 526.7 91.0 14.4
1994 4 243 3 848.3 1 515.6 720.7 808.4 177.4 493.4 90.6 14.1
1995 4 288 3 879.1 1 511.4 736.5 820.8 180.3 497.0 90.1 13.4
1996 4 395 3 989.0 1 540.9 725.3 847.1 198.3 543.2 92.4 11.9
1997 4 310 3 894.4 1 494.2 717.2 858.4 183.2 510.4 89.5 12.0
1998 4 309 3 889.9 1 511.7 685.4 885.8 181.3 500.1 86.8 11.4
1999 4 248 3 830.6 1 469.2 664.7 905.6 180.8 486.8 86.7 10.3
2000 4 280 3 844.6 1 499.8 672.3 902.9 174.5 473.7 84.6 9.6
2001 4 348 3 925.9 1 540.9 648.8 917.0 189.5 510.1 84.7 8.8
2002 4 323 3 904.6 1 557.7 633.2 928.6 177.5 489.3 82.9 8.8
2003 4 419 3 986.6 1 607.6 641.2 938.4 178.6 500.7 83.3 9.4
2004 4 439 3 988.0 1 594.3 638.6 958.3 183.3 493.2 83.8 10.4
2005 4 423 3 968.2 1 587.4 627.1 958.9 183.7 488.9 84.2 10.5
2006 4 435 3 972.0 1 598.0 620.0 966.9 189.2 477.9 81.1 10.3
2007 4 393 3 920.5 1 612.1 621.8 976.9 167.8 425.0 77.8 10.7
2008 4 294 3 841.5 1 536.2 593.0 952.9 188.2 455.2 78.9 9.8
2009 3 945 3 566.4 1 410.3 497.1 926.4 179.6 441.8 76.8 8.6
2010 4 064 3 663.4 1 433.8 530.7 920.9 187.9 476.8 78.8 8.3
2011 3 924 3 520.3 1 410.8 516.9 909.0 168.8 403.8 77.2 8.1
2012 3 865 3 476.6 1 404.5 493.0 880.5 165.7 424.9 75.7 7.3
2013 3 779 3 392.4 1 330.3 483.1 873.7 167.4 428.3 75.7 7.1
2014 3 606 3 212.6 1 242.8 475.4 881.2 149.4 357.9 73.2 6.8
2015 3 641 3 241.2 1 230.4 477.0 895.3 154.9 377.4 73.0 6.9
CO2 EMISSIONS – EU�28 – TOTAL AND FUEL COMBUSTION
(MILLION ton CO2�
Source: EEA, UNFCCC v_20 June 2017
Methodology and Notes: See Appendix 13 – No 4
5 000
4 000
3 000
2 000
1 000
0
19
90
19
91
19
92
19
93
19
94
19
95
19
96
19
97
19
98
19
99
20
00
20
01
20
02
20
03
20
04
20
05
20
06
20
07
20
08
20
09
20
10
20
11
20
12
20
13
20
14
20
15
Commercial/Institutional
Fuel Combustion Activities
Manufacturing Industries and Construction Other
Sectors
Agriculture/ Forestry/Fisheries
Transport
ResidentialEnergy Industries

167
EU ENERGY IN FIGURES 2017
4.1.2 CO2 Emissions
EU�28 � OTHER THAN FUEL COMBUSTION
Million ton CO2 Indust
rial
Pro
cess
es
and
Pro
duct
Use
Agri
cult
ure
Wast
e a
nd
Oth
ers
Indir
ect
CO
2
Inte
rnati
onal
avia
tion
1990 325.3 15.2 5.2 4.4 68.6
1991 298.4 12.9 5.2 4.3 67.6
1992 283.3 11.3 5.3 4.2 73.1
1993 277.0 10.7 5.1 4.0 77.4
1994 294.8 10.2 4.9 3.8 80.8
1995 304.2 11.3 4.6 3.7 85.4
1996 297.0 11.2 4.5 3.6 89.4
1997 302.9 11.6 3.9 3.5 93.7
1998 300.2 11.0 3.8 3.3 100.8
1999 291.6 10.7 3.4 3.0 108.7
2000 304.1 10.5 3.4 2.7 114.8
2001 292.5 10.2 3.5 2.6 113.1
2002 291.3 10.2 3.7 2.4 110.3
2003 301.5 10.1 4.0 2.4 114.8
2004 312.6 9.8 3.7 2.3 122.4
2005 308.8 9.4 3.8 2.4 130.5
2006 311.2 9.1 3.8 2.3 136.1
2007 316.7 9.4 3.8 2.2 140.6
2008 296.5 9.0 3.7 2.1 141.3
2009 233.2 9.3 3.6 2.0 130.8
2010 254.6 9.1 3.7 2.0 131.1
2011 253.7 9.5 3.6 1.9 135.3
2012 240.3 9.4 3.6 1.8 132.8
2013 237.5 10.1 3.5 1.7 134.0
2014 242.5 10.1 3.5 1.6 136.0
2015 243.4 10.3 3.2 1.7 140.9
CO2 EMISSIONS – EU�28 � OTHER THAN FUEL COMBUSTION
�MILLION ton CO2�
Source: EEA, UNFCCC v_20 June 2017
Methodology and Notes: See Appendix 13 – No 4
350
300
250
200
150
100
50
0
19
90
19
91
19
92
19
93
19
94
19
95
19
96
19
97
19
98
19
99
20
00
20
01
20
02
20
03
20
04
20
05
20
06
20
07
20
08
20
09
20
10
20
11
20
12
20
13
20
14
20
15
Industrial Processes and Product UseWaste and Others
International Aviation
Agriculture
Indirect CO2

168
PART 4 Environment Indicators in the EU
4.2 Main Emissions Indicators
4.2.1 CO2 per Capita
kg CO2/cap 1995 2000 2005 2010 2014 2015
EU-28 8 899 8 784 8 943 8 076 7 114 7 159
Index 1995 100.0 % 98.7 % 100.5 % 90.8 % 79.9 % 80.5 %
BE 12 701 12 815 12 344 10 843 8 996 9 293
BG 6 933 5 543 6 652 6 503 6 307 6 780
CZ 12 778 12 408 12 414 11 287 9 936 10 007
DK 12 381 10 785 10 125 9 418 7 206 6 747
DE 11 687 11 178 10 771 10 470 10 142 10 054
EE 12 607 11 009 12 717 14 345 14 464 12 137
IE 10 269 12 443 12 289 9 659 8 438 8 839
EL 8 503 9 791 10 622 8 987 7 458 7 168
ES 6 925 7 957 8 833 6 390 5 774 6 165
FR 6 885 7 085 7 008 6 249 5 278 5 323
HR 3 700 4 445 5 500 4 997 4 273 4 325
IT 7 972 8 330 8 646 7 338 5 860 6 035
CY 10 313 11 482 12 015 10 793 8 922 8 986
LV 3 702 3 015 3 552 4 198 3 749 3 818
LT 4 156 3 382 4 241 4 411 4 453 4 583
LU 23 922 22 267 28 987 24 896 20 083 19 018
HU 6 013 5 797 6 071 5 285 4 512 4 801
MT 7 147 7 161 7 379 7 108 6 621 4 907
NL 11 730 11 464 11 551 11 643 10 047 10 455
AT 8 250 8 503 9 917 8 932 7 780 8 028
PL 9 385 8 307 8 450 8 773 8 136 8 223
PT 5 631 6 625 6 822 5 241 4 882 5 333
RO 5 551 4 159 4 675 4 078 3 901 3 995
SI 7 691 7 797 8 505 8 028 6 591 6 628
SK 8 369 7 652 7 982 7 174 6 197 6 264
FI 11 601 11 253 11 154 12 283 9 123 8 479
SE 6 888 6 393 6 201 5 902 4 720 4 669
UK 9 959 9 997 9 896 8 577 7 198 6 878
Source: EEA_UNFCCC v_20 June 2017; Eurostat, June 2017
Methodology and Notes: See Appendix 13 – No 4

169
EU ENERGY IN FIGURES 2017
4.2.2 Carbon GDP Intensity
ton CO2/M€'10 1995 2000 2005 2010 2014 2015
EU-28 444 384 361 317 273 270
Index 1995 100.0 % 86.4 % 81.2 % 71.4 % 61.4 % 60.7 %
BE 476.4 421.3 378.4 321.9 266.1 272.2
BG 2 438.7 1 859.9 1 589.7 1 262.4 1 147.3 1 183.0
CZ 1 260.9 1 114.9 913.1 755.2 645.8 623.7
DK 332.6 255.2 227.7 214.4 160.0 148.3
DE 444.2 389.4 366.2 331.9 298.5 292.5
EE 2 301.1 1 446.8 1 150.7 1 299.7 1 105.0 913.4
IE 472.2 377.1 309.4 262.9 214.5 178.9
EL 564.2 555.6 507.1 442.1 440.8 421.9
ES 386.4 371.0 373.0 274.8 259.5 268.0
FR 266.0 242.1 228.7 202.2 167.7 168.7
HR 577.5 566.5 539.3 477.7 419.9 416.0
IT 321.6 304.8 307.0 270.7 230.9 235.9
CY 563.6 553.9 516.8 458.1 440.8 431.1
LV 969.3 585.0 439.1 500.4 363.8 357.9
LT 1 038.2 648.2 538.2 494.4 396.5 397.8
LU 420.6 313.6 375.5 311.1 244.8 228.3
HU 894.4 736.4 617.2 538.3 426.1 438.7
MT 623.1 516.4 497.6 445.9 362.5 252.4
NL 403.3 327.8 317.7 305.6 262.9 269.5
AT 299.8 268.2 294.4 253.2 215.2 221.8
PL 1 900.3 1 291.0 1 125.2 921.9 765.1 744.4
PT 411.8 406.2 410.3 308.0 301.0 322.1
RO 1 500.1 1 125.4 910.6 653.0 565.7 555.2
SI 676.1 555.8 510.6 453.3 375.1 369.0
SK 1 272.9 986.1 800.3 572.2 456.4 444.8
FI 479.3 368.1 325.1 351.3 266.6 248.0
SE 241.6 189.1 163.8 149.4 116.0 111.4
UK 430.8 375.2 330.9 292.5 233.9 220.5
Source: EEA_UNFCCC v_20 June 2017; DG ECFIN-AMECO database, June 2017
Methodology and Notes: See Appendix 13 – No 4

5PART
Country Profiles

PART 5 Country Profiles

173
EU ENERGY IN FIGURES 2017
Summary
5.0 European Union 28 . . . . . . . . . . . . . . . . . . . . . . . . . . . . . . . . . . . . . . . . . . . . . . . . . . . . . . . . . . . 174
5.1 Belgium . . . . . . . . . . . . . . . . . . . . . . . . . . . . . . . . . . . . . . . . . . . . . . . . . . . . . . . . . . . . . . . . . . . . . . . . . . . 176
5.2 Bulgaria . . . . . . . . . . . . . . . . . . . . . . . . . . . . . . . . . . . . . . . . . . . . . . . . . . . . . . . . . . . . . . . . . . . . . . . . . . . 178
5.3 Czech Republic . . . . . . . . . . . . . . . . . . . . . . . . . . . . . . . . . . . . . . . . . . . . . . . . . . . . . . . . . . . . . . . . 180
5.4 Denmark . . . . . . . . . . . . . . . . . . . . . . . . . . . . . . . . . . . . . . . . . . . . . . . . . . . . . . . . . . . . . . . . . . . . . . . . . . 182
5.5 Germany . . . . . . . . . . . . . . . . . . . . . . . . . . . . . . . . . . . . . . . . . . . . . . . . . . . . . . . . . . . . . . . . . . . . . . . . . 184
5.6 Estonia . . . . . . . . . . . . . . . . . . . . . . . . . . . . . . . . . . . . . . . . . . . . . . . . . . . . . . . . . . . . . . . . . . . . . . . . . . . 186
5.7 Ireland . . . . . . . . . . . . . . . . . . . . . . . . . . . . . . . . . . . . . . . . . . . . . . . . . . . . . . . . . . . . . . . . . . . . . . . . . . . . 188
5.8 Greece . . . . . . . . . . . . . . . . . . . . . . . . . . . . . . . . . . . . . . . . . . . . . . . . . . . . . . . . . . . . . . . . . . . . . . . . . . . . . 190
5.9 Spain . . . . . . . . . . . . . . . . . . . . . . . . . . . . . . . . . . . . . . . . . . . . . . . . . . . . . . . . . . . . . . . . . . . . . . . . . . . . . . . 192
5.10 France . . . . . . . . . . . . . . . . . . . . . . . . . . . . . . . . . . . . . . . . . . . . . . . . . . . . . . . . . . . . . . . . . . . . . . . . . . . . 194
5.11 Croatia . . . . . . . . . . . . . . . . . . . . . . . . . . . . . . . . . . . . . . . . . . . . . . . . . . . . . . . . . . . . . . . . . . . . . . . . . . . 196
5.12 Italy . . . . . . . . . . . . . . . . . . . . . . . . . . . . . . . . . . . . . . . . . . . . . . . . . . . . . . . . . . . . . . . . . . . . . . . . . . . . . . . . 198
5.13 Cyprus . . . . . . . . . . . . . . . . . . . . . . . . . . . . . . . . . . . . . . . . . . . . . . . . . . . . . . . . . . . . . . . . . . . . . . . . . . . . 200
5.14 Latvia . . . . . . . . . . . . . . . . . . . . . . . . . . . . . . . . . . . . . . . . . . . . . . . . . . . . . . . . . . . . . . . . . . . . . . . . . . . . . . 202
5.15 Lithuania . . . . . . . . . . . . . . . . . . . . . . . . . . . . . . . . . . . . . . . . . . . . . . . . . . . . . . . . . . . . . . . . . . . . . . . . 204
5.16 Luxembourg . . . . . . . . . . . . . . . . . . . . . . . . . . . . . . . . . . . . . . . . . . . . . . . . . . . . . . . . . . . . . . . . . . . . 206
5.17 Hungary . . . . . . . . . . . . . . . . . . . . . . . . . . . . . . . . . . . . . . . . . . . . . . . . . . . . . . . . . . . . . . . . . . . . . . . . . . 208
5.18 Malta . . . . . . . . . . . . . . . . . . . . . . . . . . . . . . . . . . . . . . . . . . . . . . . . . . . . . . . . . . . . . . . . . . . . . . . . . . . . . . . 210
5.19 The Netherlands . . . . . . . . . . . . . . . . . . . . . . . . . . . . . . . . . . . . . . . . . . . . . . . . . . . . . . . . . . . . . . . 212
5.20 Austria . . . . . . . . . . . . . . . . . . . . . . . . . . . . . . . . . . . . . . . . . . . . . . . . . . . . . . . . . . . . . . . . . . . . . . . . . . . . 214
5.21 Poland . . . . . . . . . . . . . . . . . . . . . . . . . . . . . . . . . . . . . . . . . . . . . . . . . . . . . . . . . . . . . . . . . . . . . . . . . . . . . 216
5.22 Portugal . . . . . . . . . . . . . . . . . . . . . . . . . . . . . . . . . . . . . . . . . . . . . . . . . . . . . . . . . . . . . . . . . . . . . . . . . . 218
5.23 Romania . . . . . . . . . . . . . . . . . . . . . . . . . . . . . . . . . . . . . . . . . . . . . . . . . . . . . . . . . . . . . . . . . . . . . . . . . . 220
5.24 Slovenia . . . . . . . . . . . . . . . . . . . . . . . . . . . . . . . . . . . . . . . . . . . . . . . . . . . . . . . . . . . . . . . . . . . . . . . . . . 222
5.25 Slovak Republic . . . . . . . . . . . . . . . . . . . . . . . . . . . . . . . . . . . . . . . . . . . . . . . . . . . . . . . . . . . . . . . . 224
5.26 Finland . . . . . . . . . . . . . . . . . . . . . . . . . . . . . . . . . . . . . . . . . . . . . . . . . . . . . . . . . . . . . . . . . . . . . . . . . . . . 226
5.27 Sweden . . . . . . . . . . . . . . . . . . . . . . . . . . . . . . . . . . . . . . . . . . . . . . . . . . . . . . . . . . . . . . . . . . . . . . . . . . . . 228
5.28 United Kingdom . . . . . . . . . . . . . . . . . . . . . . . . . . . . . . . . . . . . . . . . . . . . . . . . . . . . . . . . . . . . . . . 230
EU-28
BE
BG
CZ
DK
DE
EE
IE
GR
ES
FR
HR
IT
CY
LV
LT
LU
HU
MT
NL
AT
PL
PT
RO
SI
SK
FI
SE
UK
Sources: ESTAT – Database – June 2017; EEA – UNFCCC Database – June 2017; ECFIN – AMECO Database
– June 2017; ESTAT – SHARES – March 2016; ESTAT – CHP Survey – June 2015; ESTAT – Market Survey – Feb. 2017

5.0 European Union 28Mtoe, unless otherwise stated 1995 2000 2005 2010 2014 2015
Production 969.3 952.1 914.6 851.6 788.3 781.9
Solid Fuels 279.8 214.6 196.2 165.0 150.2 145.4
of which Hard Coal 174.9 120.7 100.2 75.0 61.7 58.2
Petroleum and Products 180.8 180.0 142.5 110.2 84.5 89.3
of which Crude and NGL 172.3 169.9 129.9 94.9 68.1 72.7
Gases 191.5 209.4 190.7 159.8 117.5 107.9
of which Natural Gas 191.0 209.2 190.6 159.8 117.5 107.9
Nuclear 227.3 243.8 257.5 236.6 226.1 221.2
Renewables 84.3 98.2 119.9 168.9 197.5 205.0
Wastes, Non-Renewable 5.7 6.1 7.8 11.1 12.5 13.0
Net Imports 736.8 827.1 980.2 953.7 881.2 902.1
Solid Fuels 78.4 98.3 125.3 111.7 123.0 112.4
of which Hard Coal 76.6 94.3 122.8 111.1 122.7 112.6
Petroleum and Products 510.8 533.0 597.9 557.5 519.5 534.9
of which Crude and NGL 471.4 501.0 563.7 522.3 498.0 528.0
Gases 145.6 193.5 254.1 278.0 231.3 247.3
of which Natural Gas 145.6 193.5 254.1 278.0 231.3 247.3
Renewables 0.3 0.3 1.5 5.8 5.9 6.0
Electricity 1.8 2.0 1.4 0.6 1.3 1.2
Gross Inland Consumption 1 675.0 1 730.1 1 830.9 1 764.4 1 607.8 1 627.5
Solid Fuels 365.0 321.3 318.3 283.3 269.0 262.7
of which Hard Coal 257.6 221.5 220.6 192.0 180.4 175.7
Petroleum and Products 654.5 662.2 679.4 610.9 551.8 560.1
of which Crude and NGL 645.5 673.5 693.7 617.6 566.6 597.0
Gases 336.1 396.2 445.2 447.1 343.5 357.9
of which Natural Gas 335.7 396.0 445.1 447.0 343.5 357.9
Nuclear 227.3 243.8 257.5 236.6 226.1 221.2
Renewables 84.6 98.5 121.3 174.8 203.1 211.0
Electricity 1.8 2.0 1.4 0.6 1.3 1.2
Wastes, Non-Renewable 5.7 6.1 7.8 11.1 12.8 13.3
Primary Energy Consumption 1 567.6 1 618.0 1 713.1 1 657.4 1 508.6 1 530.7
Available for Final Consumption 1 193.1 1 243.2 1 313.4 1 276.4 1 161.1 1 182.4
Final Non-Energy Consumption 107.4 112.2 117.8 106.9 99.1 96.8
Final Energy Consumption 1 082.8 1 132.9 1 192.3 1 164.5 1 061.7 1 084.0
by Fuel/Product
Solid Fuels 83.0 61.9 54.0 50.1 46.2 46.3
Petroleum and Products 466.1 490.5 503.8 458.5 422.4 429.6
Gases 247.5 267.6 282.0 272.3 229.1 236.3
Biomass and Renewable Wastes 43.6 48.3 57.8 80.9 80.5 84.3
Solar 0.3 0.4 0.7 1.5 1.9 2.0
Geothermal 0.4 0.4 0.4 0.4 0.5 0.5
Electricity 194.1 217.4 239.4 244.1 232.4 235.7
Derived heat 46.3 45.3 52.7 54.0 45.3 45.9
Wastes, Non-Renewable 1.6 1.0 1.5 2.7 3.4 3.5
by Sector
Industry 331.6 333.4 328.1 287.0 274.0 274.7
Transport 306.8 344.7 369.3 364.2 352.6 358.6
Residential 285.5 291.2 309.2 318.9 264.5 275.2
Services 114.3 121.4 144.2 157.8 141.8 146.9
Agriculture and Fishing 32.5 29.5 29.0 26.2 24.7 24.7
Other 12.2 12.7 12.5 10.4 4.1 3.8
174
PART 5 Country Profiles
Methodology, Sources and Notes: See Appendix 13 – No 5
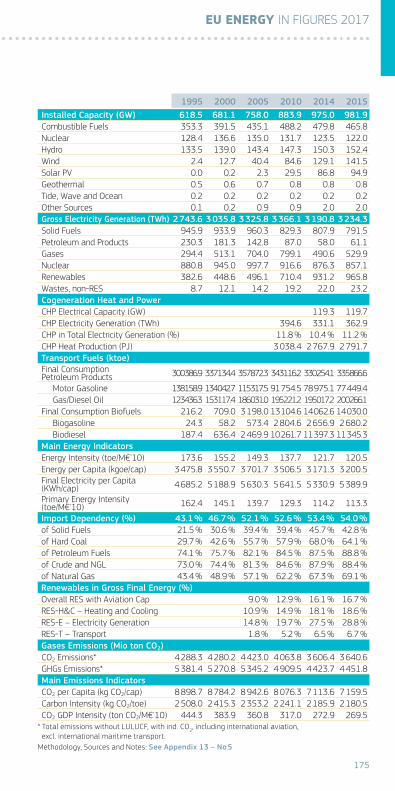
1995 2000 2005 2010 2014 2015
Installed Capacity (GW) 618.5 681.1 758.0 883.9 975.0 981.9
Combustible Fuels 353.3 391.5 435.1 488.2 479.8 465.8
Nuclear 128.4 136.6 135.0 131.7 123.5 122.0
Hydro 133.5 139.0 143.4 147.3 150.3 152.4
Wind 2.4 12.7 40.4 84.6 129.1 141.5
Solar PV 0.0 0.2 2.3 29.5 86.8 94.9
Geothermal 0.5 0.6 0.7 0.8 0.8 0.8
Tide, Wave and Ocean 0.2 0.2 0.2 0.2 0.2 0.2
Other Sources 0.1 0.2 0.9 0.9 2.0 2.0
Gross Electricity Generation (TWh) 2 743.6 3 035.8 3 325.8 3 366.1 3 190.8 3 234.3
Solid Fuels 945.9 933.9 960.3 829.3 807.9 791.5
Petroleum and Products 230.3 181.3 142.8 87.0 58.0 61.1
Gases 294.4 513.1 704.0 799.1 490.6 529.9
Nuclear 880.8 945.0 997.7 916.6 876.3 857.1
Renewables 382.6 448.6 496.1 710.4 931.2 965.8
Wastes, non-RES 8.7 12.1 14.2 19.2 22.0 23.2
Cogeneration Heat and Power
CHP Electrical Capacity (GW) 119.3 119.7
CHP Electricity Generation (TWh) 394.6 331.1 362.9
CHP in Total Electricity Generation (%) 11.8 % 10.4 % 11.2 %
CHP Heat Production (PJ) 3 038.4 2 767.9 2 791.7
Transport Fuels (ktoe)
Final Consumption Petroleum Products 300 386.9 337 134.4 357 872.3 343 116.2 330 254.1 335 866.6
Motor Gasoline 138 158.9 134 042.7 115 317.5 91 754.5 78 975.1 77 449.4
Gas/Diesel Oil 123 436.3 153 117.4 186 031.0 195 221.2 195 017.2 200 266.1
Final Consumption Biofuels 216.2 709.0 3 198.0 13 104.6 14 062.6 14 030.0
Biogasoline 24.3 58.2 573.4 2 804.6 2 656.9 2 680.2
Biodiesel 187.4 636.4 2 469.9 10 261.7 11 397.3 11 345.3
Main Energy Indicators
Energy Intensity (toe/M€'10) 173.6 155.2 149.3 137.7 121.7 120.5
Energy per Capita (kgoe/cap) 3 475.8 3 550.7 3 701.7 3 506.5 3 171.3 3 200.5
Final Electricity per Capita (KWh/cap) 4 685.2 5 188.9 5 630.3 5 641.5 5 330.9 5 389.9
Primary Energy Intensity (toe/M€'10) 162.4 145.1 139.7 129.3 114.2 113.3
Import Dependency (%) 43.1 % 46.7 % 52.1 % 52.6 % 53.4 % 54.0 %
of Solid Fuels 21.5 % 30.6 % 39.4 % 39.4 % 45.7 % 42.8 %
of Hard Coal 29.7 % 42.6 % 55.7 % 57.9 % 68.0 % 64.1 %
of Petroleum Fuels 74.1 % 75.7 % 82.1 % 84.5 % 87.5 % 88.8 %
of Crude and NGL 73.0 % 74.4 % 81.3 % 84.6 % 87.9 % 88.4 %
of Natural Gas 43.4 % 48.9 % 57.1 % 62.2 % 67.3 % 69.1 %
Renewables in Gross Final Energy (%)
Overall RES with Aviation Cap 9.0 % 12.9 % 16.1 % 16.7 %
RES-H&C – Heating and Cooling 10.9 % 14.9 % 18.1 % 18.6 %
RES-E – Electricity Generation 14.8 % 19.7 % 27.5 % 28.8 %
RES-T – Transport 1.8 % 5.2 % 6.5 % 6.7 %
Gases Emissions (Mio ton CO2)
CO2 Emissions* 4 288.3 4 280.2 4 423.0 4 063.8 3 606.4 3 640.6
GHGs Emissions* 5 381.4 5 270.8 5 345.2 4 909.5 4 423.7 4 451.8
Main Emissions Indicators
CO2 per Capita (kg CO2/cap) 8 898.7 8 784.2 8 942.6 8 076.3 7 113.6 7 159.5
Carbon Intensity (kg CO2/toe) 2 508.0 2 415.3 2 353.2 2 241.1 2 185.9 2 180.5
CO2 GDP Intensity (ton CO2/M€'10) 444.3 383.9 360.8 317.0 272.9 269.5* Total emissions without LULUCF, with ind. CO
2, including international aviation,
excl. international maritime transport.
175
EU ENERGY IN FIGURES 2017
Methodology, Sources and Notes: See Appendix 13 – No 5

5.1 BelgiumMtoe, unless otherwise stated 1995 2000 2005 2010 2014 2015
Production 11.83 13.61 13.72 16.19 13.32 11.59
Solid Fuels 0.31 0.21 0.06
of which Hard Coal 0.31 0.21 0.06 0.01 0.01 0.01
Petroleum and Products 0.00 0.00 0.01 0.80 0.99 1.22
of which Crude and NGL
Gases 0.00 0.00
of which Natural Gas 0.00 0.00
Nuclear 10.67 12.42 12.28 12.37 8.69 6.73
Renewables 0.44 0.53 0.88 2.27 2.95 2.96
Wastes, Non-Renewable 0.41 0.44 0.50 0.74 0.68 0.68
Net Imports 46.64 50.50 53.43 53.56 47.13 50.63
Solid Fuels 9.42 7.30 5.24 3.70 3.39 3.10
of which Hard Coal 8.90 6.56 4.96 3.72 3.10 2.64
Petroleum and Products 26.37 29.45 32.55 32.45 28.94 31.18
of which Crude and NGL 26.18 34.04 31.77 33.11 32.57 32.26
Gases 10.42 13.28 14.82 16.79 12.83 13.87
of which Natural Gas 10.42 13.28 14.82 16.79 12.83 13.87
Renewables 0.09 0.10 0.28 0.57 0.45 0.68
Electricity 0.35 0.37 0.54 0.05 1.51 1.81
Gross Inland Consumption 53.83 59.30 59.06 60.90 53.55 54.22
Solid Fuels 8.65 8.00 5.17 3.76 3.33 3.18
of which Hard Coal 8.21 7.26 4.91 3.69 3.00 2.74
Petroleum and Products 22.61 24.06 24.67 24.41 23.25 24.22
of which Crude and NGL 26.23 33.97 31.92 33.13 32.53 32.24
Gases 10.61 13.37 14.74 16.75 12.68 13.97
of which Natural Gas 10.61 13.37 14.74 16.75 12.68 13.97
Nuclear 10.67 12.42 12.28 12.37 8.69 6.73
Renewables 0.53 0.64 1.16 2.83 3.40 3.63
Electricity 0.35 0.37 0.54 0.05 1.51 1.81
Wastes, Non-Renewable 0.41 0.44 0.50 0.74 0.68 0.68
Primary Energy Consumption 47.91 52.32 51.33 53.54 45.15 45.70
Available for Final Consumption 39.93 44.83 44.42 45.66 42.73 44.46
Final Non-Energy Consumption 5.92 6.99 7.73 7.36 8.40 8.52
Final Energy Consumption 34.35 37.53 36.58 37.63 34.20 35.78
by Fuel/Product
Solid Fuels 3.33 3.40 2.03 1.63 1.68 1.61
Petroleum and Products 16.03 16.54 16.52 16.10 14.55 15.72
Gases 8.44 9.89 9.94 10.44 8.63 9.20
Biomass and Renewable Wastes 0.35 0.41 0.64 1.52 1.65 1.55
Solar 0.00 0.00 0.00 0.01 0.02 0.02
Geothermal 0.00 0.00
Electricity 5.89 6.67 6.90 7.16 6.98 7.03
Derived heat 0.23 0.49 0.43 0.64 0.53 0.51
Wastes, Non-Renewable 0.09 0.12 0.12 0.14 0.16 0.14
by Sector
Industry 11.91 14.10 11.71 12.06 11.92 11.89
Transport 8.57 9.66 9.95 10.35 9.90 10.44
Residential 9.30 9.47 9.93 9.41 7.40 8.14
Services 3.46 3.48 4.15 5.03 4.23 4.56
Agriculture and Fishing 1.10 0.78 0.81 0.76 0.71 0.72
Other 0.00 0.03 0.03 0.03 0.04 0.03
176
PART 5 Country Profiles
Methodology, Sources and Notes: See Appendix 13 – No 5

1995 2000 2005 2010 2014 2015
Installed Capacity (GW) 14.92 15.69 16.10 18.69 20.93 21.15
Combustible Fuels 7.88 8.55 8.71 9.52 8.60 8.51
Nuclear 5.63 5.71 5.80 5.93 5.93 5.91
Hydro 1.40 1.41 1.41 1.43 1.43 1.42
Wind 0.01 0.01 0.17 0.91 1.94 2.18
Solar PV 0.00 0.00 0.00 0.90 3.03 3.12
Geothermal 0.00 0.00
Tide, Wave and Ocean
Other Sources 0.00 0.00
Gross Electricity Generation (TWh) 74.41 84.01 87.03 95.19 72.67 70.65
Solid Fuels 16.52 12.92 8.20 4.20 2.23 2.21
Petroleum and Products 1.31 0.80 1.74 0.41 0.22 0.21
Gases 12.94 19.09 25.14 33.18 21.49 24.85
Nuclear 41.36 48.16 47.60 47.94 33.70 26.10
Renewables 1.56 2.28 3.42 7.85 13.38 15.57
Wastes, non-RES 0.72 0.77 0.66 1.36 1.25 1.25
Cogeneration Heat and Power
CHP Electrical Capacity (GW) 1.89 2.58 2.40 2.4
CHP Electricity Generation (TWh) 7.36 15.20 12.20 12.5
CHP in Total Electricity Generation (%) 8.5 % 16.0 % 16.8 % 17.7 %
CHP Heat Production (PJ) 75.86 0.00 107.36 104.4
Transport Fuels (ktoe)
Final Consumption Petroleum Products 8 439.9 9 536.5 9 802.7 9 747.7 9 316.7 9 996.1
Motor Gasoline 2 977.3 2 359.3 1 846.5 1 235.9 1 242.2 1 321.0
Gas/Diesel Oil 4 282.6 5 416.1 6 522.1 7 074.6 6 692.0 7 154.9
Final Consumption Biofuels 366.0 419.2 261.2
Biogasoline 57.1 39.2 40.6
Biodiesel 308.9 380.0 220.6
Main Energy Indicators
Energy Intensity (toe/M€'10) 199.3 190.4 173.3 166.8 141.6 141.3
Energy per Capita (kgoe/cap) 5 313.7 5 791.8 5 653.9 5 618.3 4 789.4 4 824.7
Final Electricity per Capita (KWh/cap) 6 756.6 7 573.1 7 677.9 7 685.6 7 258.2 7 271.7
Primary Energy Intensity (toe/M€'10) 177.4 168.0 150.6 146.7 119.4 119.1
Import Dependency (%) 80.8 % 78.1 % 80.1 % 78.2 % 80.0 % 84.3 %
of Solid Fuels 108.9 % 91.2 % 101.3 % 98.3 % 101.6 % 97.2 %
of Hard Coal 108.5 % 90.4 % 100.9 % 100.7 % 103.2 % 96.5 %
of Petroleum Fuels 99.6 % 100.2 % 100.8 % 101.4 % 101.1 % 103.8 %
of Crude and NGL 99.8 % 100.2 % 99.5 % 99.9 % 100.1 % 100.0 %
of Natural Gas 98.2 % 99.3 % 100.5 % 100.3 % 101.2 % 99.3 %
Renewables in Gross Final Energy (%)
Overall RES with Aviation Cap 2.3 % 5.7 % 8.0 % 7.9 %
RES-H&C – Heating and Cooling 3.4 % 6.1 % 7.7 % 7.6 %
RES-E – Electricity Generation 2.4 % 7.1 % 13.4 % 15.4 %
RES-T – Transport 0.6 % 4.7 % 5.7 % 3.8 %
Gases Emissions (Mio ton CO2)
CO2 Emissions* 128.67 131.21 128.94 117.53 100.59 104.42
GHGs Emissions* 157.27 154.19 148.68 136.64 118.15 121.64
Main Emissions Indicators
CO2 per Capita (kg CO2/cap) 12 701.2 12 815.0 12 343.6 10 842.6 8 996.5 9 292.6
Carbon Intensity (kg CO2/toe) 2 230.0 2 029.8 1 933.4 1 715.9 1 706.9 1 739.3
CO2 GDP Intensity (ton CO2/M€'10) 476.4 421.3 378.4 321.9 266.1 272.2* Total emissions without LULUCF, with ind. CO
2, including international aviation,
excl. international maritime transport.
177
EU ENERGY IN FIGURES 2017
Methodology, Sources and Notes: See Appendix 13 – No 5

5.2 BulgariaMtoe, unless otherwise stated 1995 2000 2005 2010 2014 2015
Production 10.27 9.87 10.70 10.53 11.31 12.13
Solid Fuels 5.29 4.30 4.18 4.94 5.12 5.87
of which Hard Coal 0.97 0.05 0.00 0.02 0.01 0.03
Petroleum and Products 0.06 0.07 0.13 0.06 0.06 0.14
of which Crude and NGL 0.04 0.04 0.03 0.02 0.03 0.02
Gases 0.04 0.01 0.38 0.06 0.16 0.09
of which Natural Gas 0.04 0.01 0.38 0.06 0.16 0.09
Nuclear 4.46 4.70 4.83 3.96 4.11 3.98
Renewables 0.42 0.78 1.12 1.50 1.84 2.03
Wastes, Non-Renewable 0.00 0.01 0.06 0.01 0.02 0.03
Net Imports 12.83 8.54 9.28 7.08 6.16 6.59
Solid Fuels 2.42 2.26 2.55 1.70 0.93 0.74
of which Hard Coal 2.35 2.25 2.49 1.67 0.89 0.70
Petroleum and Products 5.87 3.94 4.94 4.03 3.88 4.25
of which Crude and NGL 7.39 5.18 5.84 5.37 5.02 5.91
Gases 4.56 2.74 2.46 2.13 2.22 2.52
of which Natural Gas 4.56 2.74 2.46 2.13 2.22 2.52
Renewables -0.01 0.00 -0.03 -0.06 -0.06 -0.02
Electricity -0.01 -0.40 -0.65 -0.73 -0.81 -0.91
Gross Inland Consumption 22.69 18.52 19.75 17.77 17.74 18.51
Solid Fuels 7.62 6.43 6.90 6.89 6.40 6.62
of which Hard Coal 3.21 2.23 2.63 1.89 1.21 0.74
Petroleum and Products 5.63 4.07 4.72 3.89 3.88 4.20
of which Crude and NGL 7.41 5.25 5.98 5.41 5.07 5.88
Gases 4.58 2.93 2.80 2.30 2.36 2.60
of which Natural Gas 4.58 2.93 2.80 2.30 2.36 2.60
Nuclear 4.46 4.70 4.83 3.96 4.11 3.98
Renewables 0.41 0.78 1.10 1.46 1.79 1.99
Electricity -0.01 -0.40 -0.65 -0.73 -0.81 -0.91
Wastes, Non-Renewable 0.00 0.01 0.06 0.01 0.02 0.03
Primary Energy Consumption 21.46 17.54 18.91 17.35 17.23 17.90
Available for Final Consumption 12.93 9.99 10.56 8.79 8.95 9.65
Final Non-Energy Consumption 1.23 0.98 0.85 0.42 0.51 0.61
Final Energy Consumption 11.42 9.11 10.19 8.84 9.01 9.51
by Fuel/Product
Solid Fuels 1.26 0.88 0.98 0.41 0.32 0.33
Petroleum and Products 2.93 3.03 3.72 3.13 3.06 3.37
Gases 1.79 1.68 1.57 1.06 1.20 1.31
Biomass and Renewable Wastes 0.18 0.55 0.69 0.91 1.07 1.15
Solar 0.00 0.01 0.02 0.02
Geothermal 0.03 0.03 0.03 0.03
Electricity 2.47 2.09 2.21 2.33 2.38 2.44
Derived heat 2.80 0.88 0.94 0.96 0.90 0.82
Wastes, Non-Renewable 0.00 0.01 0.05 0.01 0.02 0.03
by Sector
Industry 6.01 3.97 4.04 2.56 2.62 2.71
Transport 1.85 2.01 2.90 2.86 3.11 3.40
Residential 2.47 2.16 2.12 2.25 2.17 2.20
Services 0.19 0.65 0.82 0.99 0.93 0.99
Agriculture and Fishing 0.38 0.31 0.30 0.19 0.19 0.19
Other 0.51 0.01 0.00 0.00 0.00 0.02
178
PART 5 Country Profiles
Methodology, Sources and Notes: See Appendix 13 – No 5

1995 2000 2005 2010 2014 2015
Installed Capacity (GW) 1.98 11.09 12.26 10.03 11.39 10.91
Combustible Fuels 0.00 5.67 6.68 4.58 4.47 3.99
Nuclear 0.00 3.53 2.72 1.89 1.98 1.98
Hydro 1.98 1.88 2.85 3.05 3.22 3.22
Wind 0.00 0.00 0.01 0.49 0.70 0.70
Solar PV 0.00 0.00 0.00 0.03 1.03 1.03
Geothermal
Tide, Wave and Ocean
Other Sources
Gross Electricity Generation (TWh) 41.79 40.92 44.37 46.65 47.49 49.23
Solid Fuels 17.32 16.94 18.46 22.61 21.31 22.52
Petroleum and Products 1.44 0.66 0.61 0.39 0.21 0.18
Gases 3.45 2.18 1.90 1.97 2.14 1.86
Nuclear 17.26 18.18 18.65 15.25 15.87 15.38
Renewables 2.31 2.95 4.74 6.42 7.95 9.25
Wastes, non-RES 0.00 0.02 0.02 0.00 0.00 0.00
Cogeneration Heat and Power
CHP Electrical Capacity (GW) 1.2 1.0 0.9 1.1
CHP Electricity Generation (TWh) 2.7 3.7 3.0 2.9
CHP in Total Electricity Generation (%) 6.1 % 8.0 % 6.2 % 6.0 %
CHP Heat Production (PJ) 50.4 40.4 33.4 31.9
Transport Fuels (ktoe)
Final Consumption Petroleum Products 1 775.7 1 803.5 2 624.4 2 607.7 2 702.4 2 987.3
Motor Gasoline 1 161.4 706.7 571.2 610.6 505.5 520.2
Gas/Diesel Oil 277.7 778.7 1 416.1 1 440.7 1 584.2 1 814.5
Final Consumption Biofuels 13.5 110.7 146.2
Biogasoline 14.8 32.2
Biodiesel 10.5 95.9 114.0
Main Energy Indicators
Energy Intensity (toe/M€'10) 947.0 758.8 614.0 464.9 445.5 448.5
Energy per Capita (kgoe/cap) 2 692.3 2 261.4 2 569.3 2 394.8 2 448.9 2 570.2
Final Electricity per Capita (KWh/cap) 3 404.2 2 960.7 3 344.7 3 651.8 3 819.4 3 933.0
Primary Energy Intensity (toe/M€'10) 895.5 718.7 587.6 453.9 432.6 433.8
Import Dependency (%) 55.9 % 46.0 % 46.7 % 39.6 % 34.5 % 35.4 %
of Solid Fuels 31.8 % 35.1 % 37.0 % 24.7 % 14.5 % 11.2 %
of Hard Coal 73.0 % 100.5 % 94.7 % 88.3 % 73.9 % 94.9 %
of Petroleum Fuels 99.6 % 95.4 % 102.2 % 101.1 % 97.9 % 99.1 %
of Crude and NGL 99.7 % 98.7 % 97.7 % 99.1 % 99.0 % 100.5 %
of Natural Gas 99.5 % 93.6 % 87.7 % 92.7 % 94.0 % 97.0 %
Renewables in Gross Final Energy (%)
Overall RES with Aviation Cap 9.4 % 14.1 % 18.0 % 18.2 %
RES-H&C – Heating and Cooling 14.3 % 24.4 % 28.3 % 28.6 %
RES-E – Electricity Generation 9.3 % 12.7 % 18.9 % 19.1 %
RES-T – Transport 0.8 % 1.4 % 5.8 % 6.5 %
Gases Emissions (Mio ton CO2)
CO2 Emissions* 58.43 45.40 51.15 48.26 45.70 48.83
GHGs Emissions* 75.32 59.61 64.26 60.81 58.02 62.02
Main Emissions Indicators
CO2 per Capita (kg CO2/cap) 6 933.0 5 543.1 6 652.3 6 503.0 6 307.2 6 779.5
Carbon Intensity (kg CO2/toe) 2 545.2 2 442.4 2 574.4 2 700.8 2 563.8 2 625.4
CO2 GDP Intensity (ton CO2/M€'10) 2 438.7 1 859.9 1 589.7 1 262.4 1 147.3 1 183.0* Total emissions without LULUCF, with ind. CO
2, including international aviation,
excl. international maritime transport.
179
EU ENERGY IN FIGURES 2017
Methodology, Sources and Notes: See Appendix 13 – No 5

5.3 Czech RepublicMtoe, unless otherwise stated 1995 2000 2005 2010 2014 2015
Production 32.69 30.81 33.17 32.03 29.81 29.05
Solid Fuels 27.57 25.05 23.57 20.83 16.98 17.06
of which Hard Coal 10.80 9.42 8.41 7.50 5.73 5.57
Petroleum and Products 0.30 0.39 0.59 0.30 0.33 0.28
of which Crude and NGL 0.15 0.17 0.31 0.18 0.15 0.13
Gases 0.20 0.17 0.15 0.20 0.21 0.21
of which Natural Gas 0.20 0.17 0.15 0.20 0.21 0.21
Nuclear 3.16 3.51 6.41 7.25 7.84 6.95
Renewables 1.43 1.61 2.27 3.25 4.20 4.28
Wastes, Non-Renewable 0.03 0.09 0.17 0.20 0.25 0.28
Net Imports 8.60 9.41 12.64 11.59 12.79 13.54
Solid Fuels -5.78 -4.72 -3.27 -2.83 -0.68 -0.29
of which Hard Coal -2.86 -3.52 -2.77 -2.73 -0.85 -0.46
Petroleum and Products 7.91 7.51 9.65 8.98 8.93 8.75
of which Crude and NGL 6.96 5.57 7.65 7.81 7.48 7.24
Gases 6.42 7.48 7.54 6.85 5.95 6.16
of which Natural Gas 6.42 7.48 7.54 6.85 5.95 6.16
Renewables 0.01 0.00 -0.19 -0.12 -0.02 -0.01
Electricity 0.04 -0.86 -1.09 -1.29 -1.40 -1.08
Gross Inland Consumption 41.94 41.37 45.43 45.43 42.24 42.44
Solid Fuels 22.66 21.64 20.25 18.77 16.04 16.58
of which Hard Coal 8.35 6.28 5.61 5.03 4.69 5.03
Petroleum and Products 8.08 7.88 9.90 9.30 9.15 8.96
of which Crude and NGL 6.95 5.85 7.70 8.01 7.62 7.35
Gases 6.55 7.50 7.70 8.07 6.18 6.48
of which Natural Gas 6.55 7.50 7.70 8.07 6.18 6.48
Nuclear 3.16 3.51 6.41 7.25 7.84 6.95
Renewables 1.43 1.62 2.09 3.13 4.18 4.28
Electricity 0.04 -0.86 -1.09 -1.29 -1.40 -1.08
Wastes, Non-Renewable 0.03 0.09 0.17 0.20 0.25 0.28
Primary Energy Consumption 39.63 39.27 42.48 42.50 39.29 39.93
Available for Final Consumption 28.09 27.50 29.55 29.01 26.58 27.37
Final Non-Energy Consumption 2.32 2.09 2.95 2.93 2.95 2.52
Final Energy Consumption 26.32 25.07 26.33 25.38 23.63 24.19
by Fuel/Product
Solid Fuels 6.12 5.13 3.77 2.67 2.40 2.33
Petroleum and Products 5.09 5.32 6.82 6.58 6.45 6.72
Gases 6.17 6.49 6.74 6.53 5.23 5.43
Biomass and Renewable Wastes 1.12 1.20 1.64 2.24 2.67 2.71
Solar 0.00 0.00 0.00 0.01 0.02 0.02
Geothermal 0.00 0.00
Electricity 4.13 4.25 4.75 4.66 4.59 4.68
Derived heat 3.66 2.62 2.48 2.53 2.08 2.08
Wastes, Non-Renewable 0.02 0.06 0.13 0.16 0.20 0.22
by Sector
Industry 12.51 10.13 9.68 7.97 7.41 7.47
Transport 2.84 4.37 6.10 6.23 6.24 6.49
Residential 6.58 6.42 6.65 7.40 6.49 6.69
Services 2.42 2.97 3.11 3.15 2.80 2.85
Agriculture and Fishing 1.23 0.66 0.55 0.55 0.62 0.61
Other 0.74 0.52 0.25 0.08 0.07 0.07
180
PART 5 Country Profiles
Methodology, Sources and Notes: See Appendix 13 – No 5

1995 2000 2005 2010 2014 2015
Installed Capacity (GW) 13.80 15.32 17.41 20.07 21.92 21.87
Combustible Fuels 10.64 11.47 11.46 12.04 13.03 12.96
Nuclear 1.76 1.76 3.76 3.90 4.29 4.29
Hydro 1.40 2.10 2.17 2.20 2.25 2.26
Wind 0.00 0.00 0.02 0.21 0.28 0.28
Solar PV 0.00 0.00 0.00 1.73 2.07 2.08
Geothermal
Tide, Wave and Ocean
Other Sources
Gross Electricity Generation (TWh) 60.85 73.47 82.58 85.90 86.15 83.89
Solid Fuels 44.34 52.75 49.52 46.90 40.73 41.14
Petroleum and Products 0.59 0.37 0.33 0.20 0.11 0.09
Gases 1.00 3.91 4.22 4.20 4.61 4.96
Nuclear 12.23 13.59 24.73 28.00 30.33 26.84
Renewables 2.68 2.84 3.78 6.49 10.22 10.70
Wastes, non-RES 0.00 0.01 0.01 0.03 0.07 0.08
Cogeneration Heat and Power
CHP Electrical Capacity (GW) 5.20 4.79 4.63 4.6
CHP Electricity Generation (TWh) 13.87 12.24 11.80 11.8
CHP in Total Electricity Generation (%) 16.8 % 14.2 % 13.7 % 14.0 %
CHP Heat Production (PJ) 150.67 135.67 105.63 106.0
Transport Fuels (ktoe)
Final Consumption Petroleum Products 2 601.5 4 076.4 5 865.9 5 783.8 5 728.9 5 986.7
Motor Gasoline 1 693.8 1 921.5 2 125.3 1 868.0 1 557.9 1 570.5
Gas/Diesel Oil 703.6 1 886.4 3 321.9 3 491.8 3 757.1 3 980.6
Final Consumption Biofuels 15.9 61.9 2.7 231.2 316.8 296.5
Biogasoline 0.0 0.0 0.0 58.0 65.8 63.2
Biodiesel 15.9 61.9 2.7 173.2 251.0 233.3
Main Energy Indicators
Energy Intensity (toe/M€'10) 400.5 361.6 327.6 290.5 261.2 251.0
Energy per Capita (kgoe/cap) 4 059.1 4 024.8 4 453.9 4 342.2 4 018.1 4 027.4
Final Electricity per Capita (KWh/cap) 4 653.2 4 804.5 5 421.3 5 182.8 5 081.6 5 169.2
Primary Energy Intensity (toe/M€'10) 378.4 343.3 306.3 271.8 242.9 236.1
Import Dependency (%) 20.5 % 22.8 % 27.8 % 25.5 % 30.3 % 31.9 %
of Solid Fuels -25.5 % -21.8 % -16.1 % -15.1 % -4.2 % -1.8 %
of Hard Coal -34.2 % -56.1 % -49.4 % -54.3 % -18.1 % -9.1 %
of Petroleum Fuels 98.0 % 95.3 % 97.5 % 96.5 % 97.6 % 97.8 %
of Crude and NGL 100.2 % 95.2 % 99.3 % 97.6 % 98.2 % 98.4 %
of Natural Gas 98.0 % 99.8 % 97.8 % 84.8 % 96.3 % 95.1 %
Renewables in Gross Final Energy (%)
Overall RES with Aviation Cap 7.1 % 10.5 % 15.1 % 15.1 %
RES-H&C – Heating and Cooling 10.9 % 14.1 % 19.6 % 19.8 %
RES-E – Electricity Generation 3.7 % 7.5 % 13.9 % 14.1 %
RES-T – Transport 0.9 % 5.1 % 6.9 % 6.5 %
Gases Emissions (Mio ton CO2)
CO2 Emissions* 132.04 127.53 126.61 118.08 104.45 105.46
GHGs Emissions* 157.62 149.97 148.59 140.56 127.50 128.82
Main Emissions Indicators
CO2 per Capita (kg CO2/cap) 12 778.3 12 408.2 12 414.4 11 286.8 9 936.1 10 006.9
Carbon Intensity (kg CO2/toe) 3 148.1 3 083.0 2 787.3 2 599.3 2 472.8 2 484.7
CO2 GDP Intensity (ton CO2/M€'10) 1 260.9 1 114.9 913.1 755.2 645.8 623.7* Total emissions without LULUCF, with ind. CO
2, including international aviation,
excl. international maritime transport.
181
EU ENERGY IN FIGURES 2017
Methodology, Sources and Notes: See Appendix 13 – No 5

5.4 DenmarkMtoe, unless otherwise stated 1995 2000 2005 2010 2014 2015
Production 16.26 28.77 30.78 22.92 15.75 15.72
Solid Fuels
of which Hard Coal
Petroleum and Products 9.99 19.28 18.46 12.04 8.09 7.66
of which Crude and NGL 9.29 18.09 18.46 12.04 8.08 7.65
Gases 4.73 7.43 9.40 7.36 4.15 4.16
of which Natural Gas 4.70 7.41 9.38 7.34 4.14 4.14
Nuclear
Renewables 1.29 1.74 2.51 3.11 3.13 3.53
Wastes, Non-Renewable 0.25 0.33 0.41 0.41 0.38 0.38
Net Imports 7.27 -7.37 -10.13 -3.25 2.15 2.30
Solid Fuels 7.66 3.78 3.51 2.64 2.53 1.47
of which Hard Coal 7.63 3.75 3.48 2.63 2.51 1.46
Petroleum and Products 1.17 -8.39 -9.07 -3.59 -0.68 0.42
of which Crude and NGL 0.62 -9.86 -10.87 -4.94 -1.33 -0.36
Gases -1.50 -2.88 -5.01 -3.02 -1.31 -1.38
of which Natural Gas -1.50 -2.88 -5.01 -3.02 -1.31 -1.38
Renewables 0.01 0.06 0.33 0.81 1.33 1.23
Electricity -0.07 0.06 0.12 -0.10 0.25 0.51
Gross Inland Consumption 20.20 19.74 19.56 20.04 16.80 16.77
Solid Fuels 6.50 3.99 3.71 3.81 2.41 1.73
of which Hard Coal 6.47 3.96 3.69 3.79 2.39 1.72
Petroleum and Products 9.03 9.10 8.06 7.57 6.44 6.47
of which Crude and NGL 9.77 8.18 7.70 7.18 6.88 7.22
Gases 3.20 4.47 4.41 4.44 2.82 2.87
of which Natural Gas 3.17 4.45 4.40 4.42 2.80 2.85
Nuclear
Renewables 1.30 1.80 2.84 3.92 4.47 4.76
Electricity -0.07 0.06 0.12 -0.10 0.25 0.51
Wastes, Non-Renewable 0.25 0.33 0.41 0.41 0.42 0.43
Primary Energy Consumption 19.88 19.44 19.27 19.78 16.55 16.51
Available for Final Consumption 15.03 15.02 15.47 15.67 13.71 14.10
Final Non-Energy Consumption 0.32 0.30 0.29 0.26 0.25 0.25
Final Energy Consumption 14.82 14.72 15.50 15.52 13.52 13.95
by Fuel/Product
Solid Fuels 0.38 0.29 0.25 0.14 0.13 0.12
Petroleum and Products 7.26 7.06 7.30 6.75 5.75 5.84
Gases 1.69 1.67 1.71 1.75 1.44 1.47
Biomass and Renewable Wastes 0.58 0.63 0.91 1.26 1.24 1.43
Solar 0.01 0.01 0.01 0.01 0.01 0.01
Geothermal 0.00 0.00 0.00
Electricity 2.66 2.79 2.88 2.76 2.63 2.64
Derived heat 2.24 2.25 2.42 2.84 2.29 2.42
Wastes, Non-Renewable 0.01 0.02 0.03 0.02 0.02 0.02
by Sector
Industry 3.00 2.92 2.85 2.41 2.09 2.11
Transport 4.54 4.82 5.32 5.18 4.90 4.95
Residential 4.48 4.16 4.45 4.91 3.96 4.25
Services 1.84 1.84 2.00 2.13 1.82 1.87
Agriculture and Fishing 0.94 0.96 0.86 0.88 0.74 0.76
Other 0.02 0.01 0.01 0.01 0.01 0.01
182
PART 5 Country Profiles
Methodology, Sources and Notes: See Appendix 13 – No 5

1995 2000 2005 2010 2014 2015
Installed Capacity (GW) 10.82 12.32 13.04 13.44 13.62 14.01
Combustible Fuels 10.21 9.92 9.89 9.62 8.12 8.14
Nuclear
Hydro 0.01 0.01 0.01 0.01 0.01 0.01
Wind 0.60 2.39 3.13 3.80 4.89 5.08
Solar PV 0.00 0.00 0.00 0.01 0.61 0.78
Geothermal 0.00 0.00
Tide, Wave and Ocean
Other Sources
Gross Electricity Generation (TWh) 36.76 36.05 36.25 38.86 32.18 28.95
Solid Fuels 27.36 16.67 15.46 17.01 11.06 7.11
Petroleum and Products 3.63 4.44 1.38 0.77 0.32 0.31
Gases 3.64 8.77 8.78 7.91 2.09 1.82
Nuclear
Renewables 1.85 5.57 9.81 12.43 17.99 18.96
Wastes, non-RES 0.27 0.56 0.82 0.75 0.72 0.75
Cogeneration Heat and Power
CHP Electrical Capacity (GW) 5.69 5.81 6.17 6.1
CHP Electricity Generation (TWh) 18.89 19.10 11.49 11.6
CHP in Total Electricity Generation (%) 52.1 % 49.2 % 35.7 % 40.0 %
CHP Heat Production (PJ) 118.98 124.74 91.12 93.3
Transport Fuels (ktoe)
Final Consumption Petroleum Products 4 521.7 4 785.8 5 292.1 5 117.9 4 635.3 4 681.4
Motor Gasoline 1 943.7 2 019.1 1 921.8 1 574.4 1 321.3 1 317.1
Gas/Diesel Oil 1 814.4 1 863.3 2 372.2 2 648.6 2 343.7 2 432.4
Final Consumption Biofuels 26.8 231.1 232.0
Biogasoline 26.8 0.0 0.0
Biodiesel 0.0 231.1 232.0
Main Energy Indicators
Energy Intensity (toe/M€'10) 104.1 87.6 81.3 82.4 66.3 65.1
Energy per Capita (kgoe/cap) 3 873.5 3 702.8 3 613.8 3 621.5 2 986.0 2 962.3
Final Electricity per Capita (KWh/cap) 5 921.5 6 089.5 6 183.6 5 792.1 5 425.4 5 424.3
Primary Energy Intensity (toe/M€'10) 102.4 86.3 80.1 81.3 65.3 64.1
Import Dependency (%) 33.4 % -35.0 % -49.8 % -15.7 % 12.2 % 13.1 %
of Solid Fuels 117.9 % 94.9 % 94.4 % 69.4 % 104.9 % 85.0 %
of Hard Coal 118.0 % 94.7 % 94.3 % 69.3 % 104.9 % 85.0 %
of Petroleum Fuels 11.0 % -80.8 % -102.7 % -43.4 % -9.5 % 5.8 %
of Crude and NGL 6.3 % -120.5 % -141.3 % -68.8 % -19.4 % -5.0 %
of Natural Gas -47.2 % -64.8 % -113.9 % -68.3 % -46.9 % -48.2 %
Renewables in Gross Final Energy (%)
Overall RES with Aviation Cap 16.0 % 22.1 % 29.3 % 30.8 %
RES-H&C – Heating and Cooling 22.8 % 31.0 % 37.9 % 39.6 %
RES-E – Electricity Generation 24.6 % 32.7 % 48.5 % 51.3 %
RES-T – Transport 0.4 % 1.1 % 6.7 % 6.7 %
Gases Emissions (Mio ton CO2)
CO2 Emissions* 64.58 57.48 54.79 52.13 40.55 38.18
GHGs Emissions* 80.12 73.12 68.93 65.64 53.51 50.98
Main Emissions Indicators
CO2 per Capita (kg CO2/cap) 12 380.9 10 784.7 10 125.1 9 418.3 7 206.3 6 746.8
Carbon Intensity (kg CO2/toe) 2 964.9 2 734.9 2 696.4 2 514.5 2 312.1 2 178.0
CO2 GDP Intensity (ton CO2/M€'10) 332.6 255.2 227.7 214.4 160.0 148.3* Total emissions without LULUCF, with ind. CO
2, including international aviation,
excl. international maritime transport.
183
EU ENERGY IN FIGURES 2017
Methodology, Sources and Notes: See Appendix 13 – No 5

5.5 GermanyMtoe, unless otherwise stated 1995 2000 2005 2010 2014 2015
Production 145.26 135.60 139.11 133.04 124.69 124.23
Solid Fuels 78.94 60.63 56.48 45.91 44.13 43.00
of which Hard Coal 38.10 24.16 18.03 9.25 5.50 4.60
Petroleum and Products 4.30 4.73 7.54 8.15 8.32 8.08
of which Crude and NGL 2.97 3.20 3.46 2.47 2.43 2.38
Gases 15.10 15.82 14.33 11.11 6.86 6.34
of which Natural Gas 15.10 15.80 14.33 11.11 6.86 6.34
Nuclear 39.51 43.75 42.06 36.26 25.06 23.68
Renewables 5.98 8.98 16.85 27.71 36.02 38.89
Wastes, Non-Renewable 1.44 1.68 1.85 3.91 4.30 4.25
Net Imports 195.18 204.71 208.19 201.99 194.75 196.02
Solid Fuels 10.27 21.66 25.97 31.65 35.66 36.17
of which Hard Coal 8.17 17.19 23.76 29.15 34.51 35.22
Petroleum and Products 131.60 125.92 120.32 110.13 105.94 105.86
of which Crude and NGL 101.60 101.44 111.12 91.91 89.26 89.77
Gases 52.90 56.87 61.94 61.65 56.67 58.68
of which Natural Gas 52.90 56.87 61.94 61.65 56.67 58.68
Renewables 0.00 0.00 0.36 -0.14 -0.61 -0.53
Electricity 0.42 0.26 -0.39 -1.29 -2.91 -4.15
Gross Inland Consumption 341.64 342.33 341.93 332.49 313.24 314.20
Solid Fuels 91.64 84.80 81.95 78.82 79.62 79.52
of which Hard Coal 47.71 43.80 41.30 39.57 39.89 40.19
Petroleum and Products 135.37 130.98 121.48 111.32 108.40 107.41
of which Crude and NGL 104.82 108.09 114.25 94.48 91.48 92.43
Gases 67.30 71.88 77.78 75.91 63.37 65.15
of which Natural Gas 67.30 71.85 77.78 75.91 63.37 65.15
Nuclear 39.51 43.75 42.06 36.26 25.06 23.68
Renewables 5.98 8.98 17.21 27.57 35.41 38.35
Electricity 0.42 0.26 -0.39 -1.29 -2.91 -4.15
Wastes, Non-Renewable 1.44 1.68 1.85 3.91 4.30 4.25
Primary Energy Consumption 318.02 317.27 317.26 309.91 291.11 292.94
Available for Final Consumption 244.01 247.33 247.18 242.63 229.87 233.14
Final Non-Energy Consumption 23.62 25.06 24.66 22.58 22.13 21.27
Final Energy Consumption 221.62 220.01 218.46 219.65 208.88 212.12
by Fuel/Product
Solid Fuels 13.89 10.96 8.24 9.38 9.73 10.40
Petroleum and Products 105.63 99.74 90.31 83.17 81.90 81.12
Gases 51.83 56.08 55.14 56.43 49.76 51.76
Biomass and Renewable Wastes 2.69 4.72 8.54 12.14 12.52 13.22
Solar 0.04 0.11 0.26 0.48 0.63 0.67
Geothermal 0.00 0.00 0.04 0.05 0.08 0.07
Electricity 38.80 41.57 44.91 45.78 44.10 44.26
Derived heat 8.75 6.83 10.75 11.27 9.15 9.59
Wastes, Non-Renewable 0.00 0.00 0.28 0.95 1.02 1.03
by Sector
Industry 60.14 57.57 59.09 60.56 60.72 60.95
Transport 63.66 66.77 62.32 61.10 63.47 63.17
Residential 66.25 65.24 63.50 62.45 51.53 53.17
Services 25.89 25.79 33.19 35.36 33.04 34.72
Agriculture and Fishing 1.99 0.29 0.02 0.00 0.00 0.00
Other 3.69 4.35 0.34 0.18 0.13 0.12
184
PART 5 Country Profiles
Methodology, Sources and Notes: See Appendix 13 – No 5

1995 2000 2005 2010 2014 2015
Installed Capacity (GW) 116.23 118.88 128.61 162.70 198.42 204.05
Combustible Fuels 83.36 80.79 76.38 85.82 97.20 96.97
Nuclear 22.83 22.40 20.38 20.47 12.07 10.80
Hydro 8.88 9.49 10.86 11.22 11.23 11.40
Wind 1.14 6.10 18.38 27.18 39.19 44.67
Solar PV 0.02 0.11 2.06 17.55 38.23 39.79
Geothermal 0.01 0.02 0.03
Tide, Wave and Ocean
Other Sources 0.00 0.00 0.57 0.45 0.45 0.40
Gross Electricity Generation (TWh) 537.28 576.54 622.58 632.98 627.80 646.89
Solid Fuels 289.14 296.69 288.14 262.90 274.41 272.20
Petroleum and Products 8.98 4.79 12.00 8.74 5.66 6.21
Gases 50.40 59.97 83.61 100.91 72.77 74.53
Nuclear 153.09 169.61 163.06 140.56 97.13 91.79
Renewables 30.40 39.71 69.28 111.21 168.37 193.29
Wastes, non-RES 5.26 5.79 3.25 6.35 7.43 7.06
Cogeneration Heat and Power
CHP Electrical Capacity (GW) 20.8 37.2 37.1
CHP Electricity Generation (TWh) 77.9 83.2 74.8 78.8
CHP in Total Electricity Generation (%) 12.5 % 13.2 % 11.9 % 12.2 %
CHP Heat Production (PJ) 652.5 675.8 651.4 669.9
Transport Fuels (ktoe)
Final Consumption Petroleum Products 62 229.4 65 139.3 58 489.5 56 660.0 59 231.5 59 204.6
Motor Gasoline 32 058.9 30 650.8 23 721.5 18 859.5 17 682.2 16 926.3
Gas/Diesel Oil 24 098.7 27 046.6 26 364.4 28 449.1 32 175.3 32 943.9
Final Consumption Biofuels 35.6 236.5 1 858.9 2 884.2 2 739.6 2 537.3
Biogasoline 153.0 749.0 779.1 744.2
Biodiesel 31.1 222.1 1 551.7 2 104.4 1 957.0 1 791.9
Main Energy Indicators
Energy Intensity (toe/M€'10) 159.3 145.1 140.9 128.9 114.2 112.6
Energy per Capita (kgoe/cap) 4 189.9 4 166.5 4 144.5 4 064.5 3 878.3 3 869.6
Final Electricity per Capita (KWh/cap) 5 533.7 5 884.0 6 330.4 6 508.7 6 349.5 6 339.2
Primary Energy Intensity (toe/M€'10) 148.3 134.5 130.7 120.1 106.1 105.0
Import Dependency (%) 56.8 % 59.4 % 60.5 % 60.3 % 61.7 % 61.9 %
of Solid Fuels 11.2 % 25.5 % 31.7 % 40.1 % 44.8 % 45.5 %
of Hard Coal 17.1 % 39.2 % 57.5 % 73.7 % 86.5 % 87.6 %
of Petroleum Fuels 95.8 % 94.6 % 97.1 % 96.5 % 95.7 % 96.4 %
of Crude and NGL 96.9 % 93.8 % 97.3 % 97.3 % 97.6 % 97.1 %
of Natural Gas 78.6 % 79.1 % 79.6 % 81.2 % 89.4 % 90.1 %
Renewables in Gross Final Energy (%)
Overall RES with Aviation Cap 6.7 % 10.5 % 13.8 % 14.6 %
RES-H&C – Heating and Cooling 6.8 % 9.8 % 12.2 % 12.9 %
RES-E – Electricity Generation 10.5 % 18.1 % 28.2 % 30.7 %
RES-T – Transport 4.0 % 6.4 % 7.3 % 6.8 %
Gases Emissions (Mio ton CO2)
CO2 Emissions* 952.90 918.39 888.58 856.43 819.16 816.37
GHGs Emissions* 1 135.75 1 062.24 1 014.86 965.97 928.83 926.48
Main Emissions Indicators
CO2 per Capita (kg CO2/cap) 11 686.5 11 177.6 10 770.6 10 469.5 10 142.2 10 054.1
Carbon Intensity (kg CO2/toe) 2 772.5 2 665.7 2 580.1 2 554.7 2 596.1 2 578.6
CO2 GDP Intensity (ton CO2/M€'10) 444.2 389.4 366.2 331.9 298.5 292.5
185
EU ENERGY IN FIGURES 2017
Methodology, Sources and Notes: See Appendix 13 – No 5
* Total emissions without LULUCF, with ind. CO2, including international aviation,
excl. international maritime transport.

5.6 EstoniaMtoe, unless otherwise stated 1995 2000 2005 2010 2014 2015
Production 3.89 3.55 4.39 5.60 6.58 6.50
Solid Fuels 3.06 2.67 3.18 3.94 4.53 4.20
of which Hard Coal
Petroleum and Products 0.48 0.37 0.52 0.67 0.80 0.95
of which Crude and NGL
Gases
of which Natural Gas
Nuclear
Renewables 0.35 0.51 0.69 0.99 1.19 1.29
Wastes, Non-Renewable 0.07 0.07
Net Imports 1.81 1.63 1.50 0.87 0.62 0.48
Solid Fuels 0.30 0.27 0.02 -0.02 0.01 -0.01
of which Hard Coal 0.05 0.06 0.04 0.05 0.05 0.01
Petroleum and Products 1.01 0.79 0.92 0.76 0.73 0.55
of which Crude and NGL
Gases 0.58 0.66 0.80 0.56 0.44 0.39
of which Natural Gas 0.58 0.66 0.80 0.56 0.44 0.39
Renewables -0.01 -0.01 -0.11 -0.15 -0.32 -0.37
Electricity -0.07 -0.08 -0.14 -0.28 -0.24 -0.08
Gross Inland Consumption 5.53 4.97 5.62 6.15 6.68 6.26
Solid Fuels 3.50 2.97 3.19 3.92 4.45 3.85
of which Hard Coal 0.05 0.06 0.04 0.04 0.05 0.02
Petroleum and Products 1.17 0.91 1.18 1.10 1.10 1.12
of which Crude and NGL
Gases 0.58 0.66 0.80 0.56 0.44 0.39
of which Natural Gas 0.58 0.66 0.80 0.56 0.44 0.39
Nuclear
Renewables 0.34 0.51 0.59 0.85 0.86 0.91
Electricity -0.07 -0.08 -0.14 -0.28 -0.24 -0.08
Wastes, Non-Renewable 0.00 0.00 0.00 0.00 0.07 0.07
Primary Energy Consumption 5.35 4.79 5.39 6.06 6.57 6.16
Available for Final Consumption 3.04 2.69 3.00 3.02 3.15 3.03
Final Non-Energy Consumption 0.18 0.18 0.23 0.09 0.11 0.10
Final Energy Consumption 2.56 2.43 2.88 2.91 2.82 2.77
by Fuel/Product
Solid Fuels 0.19 0.12 0.12 0.08 0.09 0.04
Petroleum and Products 0.85 0.77 0.98 0.94 0.97 0.99
Gases 0.25 0.18 0.26 0.21 0.22 0.22
Biomass and Renewable Wastes 0.28 0.43 0.45 0.55 0.48 0.48
Solar 0.00 0.00 0.00 0.00 0.00 0.00
Geothermal 0.00 0.00 0.00 0.00 0.00 0.00
Electricity 0.39 0.43 0.52 0.59 0.59 0.59
Derived heat 0.59 0.51 0.55 0.53 0.44 0.43
Wastes, Non-Renewable 0.00 0.00 0.00 0.00 0.02 0.01
by Sector
Industry 0.84 0.57 0.72 0.58 0.56 0.52
Transport 0.50 0.59 0.77 0.79 0.78 0.79
Residential 0.96 0.93 0.89 1.03 0.89 0.86
Services 0.17 0.29 0.39 0.42 0.46 0.47
Agriculture and Fishing 0.08 0.06 0.11 0.10 0.13 0.13
Other 0.00 0.00 0.00 0.00 0.00 0.00
186
PART 5 Country Profiles
Methodology, Sources and Notes: See Appendix 13 – No 5

1995 2000 2005 2010 2014 2015
Installed Capacity (GW) 0.00 2.80 2.56 2.75 3.03 2.86
Combustible Fuels 0.00 2.80 2.52 2.64 2.75 2.55
Nuclear
Hydro 0.00 0.00 0.01 0.01 0.01 0.01
Wind 0.00 0.00 0.03 0.11 0.28 0.30
Solar PV
Geothermal
Tide, Wave and Ocean
Other Sources
Gross Electricity Generation (TWh) 8.69 8.51 10.21 12.96 12.45 10.42
Solid Fuels 8.29 7.68 9.30 11.17 10.36 8.04
Petroleum and Products 0.10 0.06 0.03 0.04 0.04 0.13
Gases 0.30 0.76 0.76 0.71 0.58 0.62
Nuclear
Renewables 0.01 0.02 0.11 1.04 1.39 1.50
Wastes, non-RES 0.00 0.00 0.00 0.00 0.07 0.13
Cogeneration Heat and Power
CHP Electrical Capacity (GW) 0.38 0.45 0.47 0.43
CHP Electricity Generation (TWh) 1.04 1.34 1.24 1.24
CHP in Total Electricity Generation (%) 10.2 % 10.3 % 10.0 % 11.9 %
CHP Heat Production (PJ) 11.46 12.32 12.66 12.5
Transport Fuels (ktoe)
Final Consumption Petroleum Products 487.3 578.0 765.1 777.6 768.8 774.5
Motor Gasoline 263.8 299.2 308.9 289.0 241.7 240.7
Gas/Diesel Oil 203.9 257.2 407.8 450.6 486.0 509.2
Final Consumption Biofuels 5.8 3.2
Biogasoline 5.8 3.2
Biodiesel
Main Energy Indicators
Energy Intensity (toe/M€'10) 696.4 466.4 373.9 417.9 387.7 358.0
Energy per Capita (kgoe/cap) 3 815.4 3 549.0 4 132.2 4 612.6 5 074.4 4 757.1
Final Electricity per Capita (KWh/cap) 3 146.2 3 578.9 4 444.9 5 181.2 5 248.4 5 211.2
Primary Energy Intensity (toe/M€'10) 674.1 449.5 358.6 411.8 381.4 352.4
Import Dependency (%) 32.3 % 32.2 % 26.1 % 13.6 % 8.9 % 7.4 %
of Solid Fuels 8.4 % 9.1 % 0.8 % -0.6 % 0.2 % -0.3 %
of Hard Coal 101.9 % 116.4 % 97.2 % 117.9 % 103.9 % 26.3 %
of Petroleum Fuels 80.2 % 77.4 % 70.8 % 57.5 % 51.6 % 39.3 %
of Crude and NGL
of Natural Gas 100.0 % 100.0 % 100.0 % 100.0 % 100.0 % 100.0 %
Renewables in Gross Final Energy (%)
Overall RES with Aviation Cap 17.5 % 24.6 % 26.3 % 28.6 %
RES-H&C – Heating and Cooling 32.2 % 43.3 % 45.2 % 49.6 %
RES-E – Electricity Generation 1.1 % 10.4 % 14.1 % 15.1 %
RES-T – Transport 0.2 % 0.4 % 0.4 % 0.4 %
Gases Emissions (Mio ton CO2)
CO2 Emissions* 18.26 15.43 17.28 19.13 19.03 15.96
GHGs Emissions* 20.27 17.38 19.30 21.26 21.20 18.11
Main Emissions Indicators
CO2 per Capita (kg CO2/cap) 12 606.6 11 008.8 12 716.9 14 345.4 14 464.4 12 137.4
Carbon Intensity (kg CO2/toe) 3 251.7 3 037.8 3 013.2 3 004.0 2 720.5 2 438.7
CO2 GDP Intensity (ton CO2/M€'10) 2 301.1 1 446.8 1 150.7 1 299.7 1 105.0 913.4* Total emissions without LULUCF, with ind. CO
2, including international aviation,
excl. international maritime transport.
187
EU ENERGY IN FIGURES 2017
Methodology, Sources and Notes: See Appendix 13 – No 5

5.7 IrelandMtoe, unless otherwise stated 1995 2000 2005 2010 2014 2015
Production 4.10 2.16 1.65 1.88 2.12 2.00
Solid Fuels 1.70 0.97 0.82 0.98 0.97 0.76
of which Hard Coal 0.00
Petroleum and Products 0.00 0.00 0.00 0.04 0.11 0.09
of which Crude and NGL
Gases 2.25 0.96 0.46 0.22 0.12 0.11
of which Natural Gas 2.25 0.96 0.46 0.22 0.12 0.11
Nuclear
Renewables 0.16 0.24 0.37 0.62 0.85 0.98
Wastes, Non-Renewable 0.00 0.00 0.00 0.01 0.06 0.06
Net Imports 7.77 12.37 13.77 13.21 11.68 12.72
Solid Fuels 1.88 1.68 1.89 0.95 1.20 1.46
of which Hard Coal 1.87 1.67 1.87 0.95 1.19 1.46
Petroleum and Products 5.80 8.20 8.69 7.70 6.59 7.49
of which Crude and NGL 2.27 2.98 3.16 2.98 2.70 3.69
Gases 0.09 2.48 3.01 4.48 3.59 3.62
of which Natural Gas 0.09 2.48 3.01 4.48 3.59 3.62
Renewables 0.00 0.00 0.00 0.04 0.11 0.09
Electricity 0.00 0.01 0.18 0.04 0.18 0.06
Gross Inland Consumption 11.07 14.43 15.27 15.17 13.56 14.18
Solid Fuels 2.90 2.60 2.66 1.93 2.01 2.19
of which Hard Coal 1.76 1.80 1.86 1.19 1.23 1.42
Petroleum and Products 5.68 8.15 8.59 7.84 6.62 7.04
of which Crude and NGL 2.27 3.32 3.20 2.94 2.75 3.41
Gases 2.33 3.44 3.47 4.69 3.72 3.75
of which Natural Gas 2.33 3.44 3.47 4.69 3.72 3.75
Nuclear
Renewables 0.16 0.24 0.37 0.66 0.96 1.07
Electricity 0.00 0.01 0.18 0.04 0.19 0.06
Wastes, Non-Renewable 0.00 0.00 0.00 0.01 0.06 0.06
Primary Energy Consumption 10.49 13.75 14.75 14.82 13.35 13.96
Available for Final Consumption 8.30 11.05 12.02 12.20 11.07 11.63
Final Non-Energy Consumption 0.57 0.68 0.52 0.34 0.21 0.22
Final Energy Consumption 7.99 10.78 12.60 11.96 10.77 11.21
by Fuel/Product
Solid Fuels 0.94 0.67 0.75 0.60 0.51 0.51
Petroleum and Products 4.89 7.05 8.20 7.27 6.19 6.47
Gases 0.80 1.20 1.36 1.59 1.62 1.72
Biomass and Renewable Wastes 0.09 0.12 0.18 0.29 0.32 0.32
Solar 0.00 0.00 0.00 0.01 0.01 0.01
Geothermal
Electricity 1.28 1.75 2.09 2.19 2.08 2.16
Derived heat
Wastes, Non-Renewable 0.00 0.00 0.00 0.01 0.04 0.04
by Sector
Industry 1.95 2.50 2.58 2.15 2.24 2.41
Transport 2.39 4.09 5.08 4.72 4.47 4.62
Residential 2.22 2.51 2.95 3.30 2.59 2.71
Services 1.09 1.37 1.64 1.52 1.24 1.25
Agriculture and Fishing 0.34 0.32 0.34 0.28 0.22 0.22
Other 0.00 0.00 0.00 0.00 0.00 0.00
188
PART 5 Country Profiles
Methodology, Sources and Notes: See Appendix 13 – No 5

1995 2000 2005 2010 2014 2015
Installed Capacity (GW) 4.06 4.71 6.18 8.02 9.08 9.56
Combustible Fuels 3.54 4.06 5.13 6.41 6.34 6.59
Nuclear
Hydro 0.52 0.53 0.53 0.24 0.53 0.53
Wind 0.01 0.12 0.52 1.37 2.21 2.44
Solar PV 0.00 0.00 0.00
Geothermal
Tide, Wave and Ocean
Other Sources
Gross Electricity Generation (TWh) 17.86 23.98 25.97 28.35 26.09 28.39
Solid Fuels 9.04 8.59 8.84 5.73 6.45 7.39
Petroleum and Products 2.68 4.64 3.34 0.60 0.26 0.41
Gases 5.16 9.26 11.57 18.11 12.64 12.37
Nuclear 0.00 0.00 0.00 0.00 0.00 0.00
Renewables 0.98 1.49 2.22 3.91 6.67 8.15
Wastes, non-RES 0.00 0.00 0.00 0.00 0.07 0.07
Cogeneration Heat and Power
CHP Electrical Capacity (GW) 0.11 0.29 0.31 0.3
CHP Electricity Generation (TWh) 0.60 1.92 2.04 2.1
CHP in Total Electricity Generation (%) 2.3 % 6.7 % 7.4 % 7.5 %
CHP Heat Production (PJ) 4.40 11.96 11.56 12.6
Transport Fuels (ktoe)
Final Consumption Petroleum Products 2 385.9 4 082.4 5 075.4 4 617.8 4 381.4 4 531.9
Motor Gasoline 1 104.4 1 590.0 1 823.3 1 527.2 1 178.9 1 020.3
Gas/Diesel Oil 851.3 1 832.9 2 369.8 2 303.6 2 438.1 2 664.6
Final Consumption Biofuels 1.2 93.3 89.7 88.2
Biogasoline 30.4 24.7 24.1
Biodiesel 1.2 62.9 65.0 64.1
Main Energy Indicators
Energy Intensity (toe/M€'10) 141.4 115.7 93.5 90.7 74.9 62.0
Energy per Capita (kgoe/cap) 3 075.9 3 818.9 3 712.6 3 333.6 2 944.5 3 062.9
Final Electricity per Capita (KWh/cap) 4 127.7 5 370.9 5 922.7 5 587.5 5 240.7 5 415.9
Primary Energy Intensity (toe/M€'10) 134.1 110.3 90.3 88.7 73.7 61.0
Import Dependency (%) 69.5 % 84.8 % 89.6 % 86.6 % 85.3 % 88.7 %
of Solid Fuels 64.9 % 64.6 % 70.8 % 49.1 % 60.0 % 66.7 %
of Hard Coal 105.9 % 93.2 % 100.8 % 79.3 % 96.7 % 102.7 %
of Petroleum Fuels 100.1 % 98.8 % 100.0 % 97.2 % 97.6 % 103.9 %
of Crude and NGL 100.2 % 89.8 % 98.8 % 101.6 % 98.1 % 108.2 %
of Natural Gas 3.6 % 72.1 % 86.7 % 95.5 % 96.5 % 96.5 %
Renewables in Gross Final Energy (%)
Overall RES with Aviation Cap 2.9 % 5.6 % 8.7 % 9.2 %
RES-H&C – Heating and Cooling 3.5 % 4.5 % 6.6 % 6.4 %
RES-E – Electricity Generation 7.2 % 14.6 % 22.9 % 25.2 %
RES-T – Transport 0.1 % 2.4 % 5.8 % 6.5 %
Gases Emissions (Mio ton CO2)
CO2 Emissions* 36.94 47.00 50.53 43.95 38.86 40.92
GHGs Emissions* 60.94 70.90 72.51 64.03 60.01 62.43
Main Emissions Indicators
CO2 per Capita (kg CO2/cap) 10 269.0 12 442.8 12 289.3 9 659.5 8 438.2 8 839.0
Carbon Intensity (kg CO2/toe) 3 303.6 3 224.0 3 287.3 2 881.5 2 838.5 2 853.8
CO2 GDP Intensity (ton CO2/M€'10) 472.2 377.1 309.4 262.9 214.5 178.9* Total emissions without LULUCF, with ind. CO
2, including international aviation,
excl. international maritime transport.
189
EU ENERGY IN FIGURES 2017
Methodology, Sources and Notes: See Appendix 13 – No 5

5.8 GreeceMtoe, unless otherwise stated 1995 2000 2005 2010 2014 2015
Production 9.36 10.01 10.33 9.46 8.85 8.51
Solid Fuels 7.51 8.22 8.54 7.32 6.38 5.68
of which Hard Coal
Petroleum and Products 0.46 0.28 0.10 0.13 0.11 0.10
of which Crude and NGL 0.46 0.28 0.10 0.12 0.07 0.06
Gases 0.06 0.04 0.02 0.01 0.01 0.01
of which Natural Gas 0.04 0.04 0.02 0.01 0.01 0.01
Nuclear
Renewables 1.29 1.40 1.64 1.97 2.33 2.64
Wastes, Non-Renewable 0.04 0.06 0.03 0.03 0.02 0.09
Net Imports 18.29 22.15 23.50 21.72 17.36 18.81
Solid Fuels 0.92 0.77 0.36 0.40 0.19 0.16
of which Hard Coal 0.92 0.77 0.39 0.40 0.19 0.16
Petroleum and Products 17.30 19.70 20.48 17.44 13.83 15.02
of which Crude and NGL 14.86 19.60 17.99 19.54 21.04 22.26
Gases 0.00 1.69 2.33 3.23 2.47 2.67
of which Natural Gas 0.00 1.69 2.33 3.23 2.47 2.67
Renewables 0.00 0.00 0.00 0.16 0.12 0.13
Electricity 0.07 0.00 0.33 0.49 0.76 0.83
Gross Inland Consumption 23.87 28.29 31.41 28.72 24.37 24.45
Solid Fuels 8.39 9.04 8.94 7.86 6.69 5.61
of which Hard Coal 0.96 0.73 0.34 0.40 0.17 0.17
Petroleum and Products 14.02 16.09 18.12 14.97 11.98 12.48
of which Crude and NGL 15.05 19.70 18.90 19.64 20.96 21.94
Gases 0.06 1.71 2.35 3.24 2.48 2.68
of which Natural Gas 0.04 1.71 2.35 3.24 2.48 2.68
Nuclear
Renewables 1.29 1.40 1.64 2.13 2.45 2.78
Electricity 0.07 0.00 0.33 0.49 0.76 0.83
Wastes, Non-Renewable 0.04 0.06 0.03 0.03 0.02 0.09
Primary Energy Consumption 23.37 27.57 30.65 27.61 23.67 23.75
Available for Final Consumption 16.40 19.08 21.39 19.66 16.23 17.15
Final Non-Energy Consumption 0.49 0.72 0.76 1.11 0.71 0.70
Final Energy Consumption 15.81 18.68 20.96 19.00 15.52 16.50
by Fuel/Product
Solid Fuels 1.04 0.89 0.46 0.30 0.23 0.22
Petroleum and Products 10.84 12.74 14.41 12.11 8.81 9.39
Gases 0.01 0.26 0.59 0.78 0.84 0.97
Biomass and Renewable Wastes 0.90 0.95 0.96 0.99 1.14 1.23
Solar 0.08 0.10 0.10 0.18 0.19 0.20
Geothermal 0.00 0.00 0.01 0.02 0.01 0.01
Electricity 2.93 3.71 4.38 4.57 4.26 4.37
Derived heat 0.00 0.03 0.05 0.05 0.05 0.05
Wastes, Non-Renewable
by Sector
Industry 4.01 4.45 4.16 3.47 3.09 3.13
Transport 6.52 7.30 8.19 8.16 6.41 6.58
Residential 3.33 4.50 5.51 4.62 3.79 4.40
Services 0.94 1.31 1.95 1.95 1.71 1.87
Agriculture and Fishing 1.01 1.12 1.15 0.80 0.28 0.27
Other 0.00 0.00 0.00 0.00 0.24 0.25
190
PART 5 Country Profiles
Methodology, Sources and Notes: See Appendix 13 – No 5

1995 2000 2005 2010 2014 2015
Installed Capacity (GW) 8.94 10.90 13.31 15.31 18.90 18.94
Combustible Fuels 6.39 7.61 9.71 10.60 10.93 10.86
Nuclear 0.00 0.00 0.00 0.00 0.00 0.00
Hydro 2.52 3.07 3.11 3.22 3.39 3.39
Wind 0.03 0.23 0.49 1.30 1.98 2.09
Solar PV 0.00 0.00 0.00 0.20 2.60 2.60
Geothermal 0.00
Tide, Wave and Ocean
Other Sources
Gross Electricity Generation (TWh) 41.55 53.84 60.02 57.39 50.47 51.87
Solid Fuels 28.70 34.31 35.54 30.80 25.75 22.11
Petroleum and Products 8.86 8.89 9.21 6.09 5.54 5.66
Gases 0.08 5.92 8.17 9.83 6.78 9.09
Nuclear
Renewables 3.82 4.56 7.00 10.55 12.31 14.90
Wastes, non-RES 0.10 0.16 0.10 0.13 0.10 0.11
Cogeneration Heat and Power
CHP Electrical Capacity (GW) 0.24 0.59 0.55 0.6
CHP Electricity Generation (TWh) 1.02 2.48 1.89 2.0
CHP in Total Electricity Generation (%) 1.7 % 4.3 % 3.7 % 3.9 %
CHP Heat Production (PJ) 9.70 12.71 10.07 10.9
Transport Fuels (ktoe)
Final Consumption Petroleum Products 6 504.1 7 277.8 8 156.9 8 004.0 6 235.2 6 387.1
Motor Gasoline 2 921.3 3 463.9 4 169.6 3 867.4 2 643.1 2 573.7
Gas/Diesel Oil 2 037.0 2 247.1 2 482.7 2 729.9 2 155.0 2 253.7
Final Consumption Biofuels 123.9 134.5 141.5
Biogasoline
Biodiesel 123.9 134.5 141.5
Main Energy Indicators
Energy Intensity (toe/M€'10) 150.3 149.0 136.7 127.1 131.8 132.5
Energy per Capita (kgoe/cap) 2 265.2 2 625.6 2 863.3 2 582.7 2 230.3 2 251.7
Final Electricity per Capita (KWh/cap) 3 235.3 4 004.5 4 640.3 4 777.3 4 530.1 4 677.4
Primary Energy Intensity (toe/M€'10) 147.2 145.2 133.4 122.2 128.0 128.7
Import Dependency (%) 66.7 % 69.5 % 68.6 % 69.1 % 66.2 % 71.7 %
of Solid Fuels 11.0 % 8.5 % 4.1 % 5.1 % 2.9 % 2.8 %
of Hard Coal 95.2 % 105.9 % 112.5 % 100.3 % 109.8 % 91.4 %
of Petroleum Fuels 98.4 % 100.2 % 97.7 % 98.7 % 99.9 % 105.4 %
of Crude and NGL 98.8 % 99.5 % 95.2 % 99.5 % 100.4 % 101.5 %
of Natural Gas 0.0 % 99.1 % 99.1 % 99.9 % 99.3 % 99.9 %
Renewables in Gross Final Energy (%)
Overall RES with Aviation Cap 7.0 % 9.8 % 15.3 % 15.4 %
RES-H&C – Heating and Cooling 12.8 % 17.9 % 26.9 % 25.9 %
RES-E – Electricity Generation 8.2 % 12.3 % 21.9 % 22.1 %
RES-T – Transport 0.1 % 1.9 % 1.3 % 1.4 %
Gases Emissions (Mio ton CO2)
CO2 Emissions* 89.58 105.51 116.53 99.93 81.49 77.83
GHGs Emissions* 111.79 128.87 138.88 120.92 102.21 98.61
Main Emissions Indicators
CO2 per Capita (kg CO2/cap) 8 502.6 9 791.4 10 622.3 8 986.8 7 457.6 7 168.2
Carbon Intensity (kg CO2/toe) 3 267.4 3 310.9 3 401.7 3 179.6 3 106.1 2 967.1
CO2 GDP Intensity (ton CO2/M€'10) 564.2 555.6 507.1 442.1 440.8 421.9* Total emissions without LULUCF, with ind. CO
2, including international aviation,
excl. international maritime transport.
191
EU ENERGY IN FIGURES 2017
Methodology, Sources and Notes: See Appendix 13 – No 5

5.9 SpainMtoe, unless otherwise stated 1995 2000 2005 2010 2014 2015
Production 31.43 31.49 30.09 34.53 35.10 33.60
Solid Fuels 10.15 7.97 6.27 3.30 1.63 1.25
of which Hard Coal 8.28 6.46 5.09 3.30 1.63 1.25
Petroleum and Products 0.80 0.24 0.21 0.36 0.46 0.40
of which Crude and NGL 0.80 0.23 0.17 0.12 0.30 0.23
Gases 0.45 0.23 0.19 0.08 0.02 0.05
of which Natural Gas 0.38 0.15 0.14 0.05 0.02 0.05
Nuclear 14.31 16.05 14.84 15.99 14.78 14.78
Renewables 5.51 6.82 8.40 14.64 18.00 16.87
Wastes, Non-Renewable 0.21 0.19 0.19 0.17 0.20 0.25
Net Imports 75.42 99.34 123.83 106.34 90.66 94.43
Solid Fuels 8.61 12.84 14.42 6.98 8.85 10.36
of which Hard Coal 8.09 13.25 14.74 7.09 8.77 10.23
Petroleum and Products 58.91 70.65 79.28 68.70 57.76 60.70
of which Crude and NGL 55.34 57.70 59.94 52.69 58.81 64.87
Gases 7.52 15.47 30.25 30.95 24.50 23.78
of which Natural Gas 7.52 15.47 30.25 30.95 24.50 23.78
Renewables 0.42 -0.16 -0.40
Electricity 0.39 0.38 -0.12 -0.72 -0.29 -0.01
Gross Inland Consumption 102.08 123.64 144.22 130.25 116.68 121.42
Solid Fuels 18.99 20.94 20.57 8.16 11.49 13.24
of which Hard Coal 16.68 19.83 19.82 8.30 11.42 13.08
Petroleum and Products 54.89 63.97 70.46 60.44 49.07 52.00
of which Crude and NGL 55.82 57.33 59.91 53.04 58.79 65.17
Gases 7.79 15.31 29.89 31.16 23.67 24.54
of which Natural Gas 7.72 15.22 29.84 31.13 23.67 24.54
Nuclear 14.31 16.05 14.84 15.99 14.78 14.78
Renewables 5.51 6.82 8.40 15.05 17.77 16.62
Electricity 0.39 0.38 -0.12 -0.72 -0.29 -0.01
Wastes, Non-Renewable 0.21 0.19 0.19 0.17 0.20 0.25
Primary Energy Consumption 94.20 114.25 135.87 123.22 112.57 117.11
Available for Final Consumption 72.46 88.79 105.95 95.95 81.44 83.18
Final Non-Energy Consumption 7.87 9.40 8.35 7.03 4.11 4.31
Final Energy Consumption 64.03 79.90 97.77 89.08 79.23 80.46
by Fuel/Product
Solid Fuels 2.24 1.77 1.71 1.26 1.30 1.31
Petroleum and Products 39.51 46.31 53.46 46.79 38.80 40.47
Gases 6.84 12.14 17.98 14.65 14.52 13.45
Biomass and Renewable Wastes 3.23 3.43 3.72 5.14 4.83 4.99
Solar 0.03 0.03 0.06 0.18 0.26 0.28
Geothermal 0.00 0.01 0.01 0.02 0.02 0.02
Electricity 12.12 16.21 20.83 21.05 19.51 19.95
Derived heat
Wastes, Non-Renewable 0.08
by Sector
Industry 20.54 25.38 30.98 21.45 20.01 18.92
Transport 26.44 33.23 39.94 37.19 31.99 33.60
Residential 10.01 12.00 15.13 16.92 14.71 14.88
Services 4.33 6.71 8.42 9.80 8.85 10.04
Agriculture and Fishing 2.20 2.57 3.11 2.24 2.77 2.49
Other 0.51 0.00 0.19 1.49 0.91 0.55
192
PART 5 Country Profiles
Methodology, Sources and Notes: See Appendix 13 – No 5

1995 2000 2005 2010 2014 2015
Installed Capacity (GW) 45.62 53.92 76.57 101.79 106.47 106.90
Combustible Fuels 21.94 26.24 40.80 50.46 49.79 49.35
Nuclear 7.07 7.50 7.58 7.45 7.40 7.40
Hydro 16.51 17.96 18.22 18.54 19.22 20.05
Wind 0.10 2.21 9.92 20.69 22.98 22.94
Solar PV 0.01 0.01 0.06 3.92 4.79 4.86
Geothermal
Tide, Wave and Ocean
Other Sources
Gross Electricity Generation (TWh) 167.09 224.47 294.08 301.53 278.75 281.02
Solid Fuels 65.91 79.09 79.05 25.33 43.81 51.37
Petroleum and Products 14.62 22.58 24.42 16.56 14.12 17.24
Gases 4.92 21.94 80.73 95.84 48.76 53.81
Nuclear 55.46 62.21 57.54 61.99 57.31 57.31
Renewables 25.87 38.05 46.90 100.98 114.07 100.32
Wastes, non-RES 0.31 0.61 0.45 0.66 0.69 0.77
Cogeneration Heat and Power
CHP Electrical Capacity (GW) 3.05 3.38 3.91 3.5
CHP Electricity Generation (TWh) 22.88 22.42 23.29 22.7
CHP in Total Electricity Generation (%) 7.8 % 7.4 % 8.4 % 8.1 %
CHP Heat Production (PJ) 192.5 153.3 138.2 120.3
Transport Fuels (ktoe)
Final Consumption Petroleum Products 26 100.5 32 791.1 39 226.9 35 409.4 30 595.6 31 802.5
Motor Gasoline 9 152.0 9 141.3 7 785.8 5 695.6 4 596.4 4 623.2
Gas/Diesel Oil 13 372.7 18 858.7 25 976.9 24 171.5 20 577.0 21 383.4
Final Consumption Biofuels 70.3 255.7 1 411.7 950.8 958.2
Biogasoline 113.3 230.4 186.3 188.8
Biodiesel 70.3 142.4 1 181.3 764.5 769.4
Main Energy Indicators
Energy Intensity (toe/M€'10) 143.7 142.5 140.7 120.5 112.7 113.7
Energy per Capita (kgoe/cap) 2,575.1 3,055.1 3,331.1 2,801.9 2,508.6 2,614.0
Final Electricity per Capita (KWh/cap) 3,554.8 4,656.7 5,594.5 5,266.1 4,878.2 4,995.5
Primary Energy Intensity (toe/M€'10) 132.6 131.6 132.5 114.0 108.8 109.6
Import Dependency (%) 71.7 % 76.6 % 81.4 % 76.7 % 72.9 % 73.3 %
of Solid Fuels 45.4 % 61.3 % 70.1 % 85.5 % 77.1 % 78.3 %
of Hard Coal 48.5 % 66.8 % 74.4 % 85.4 % 76.8 % 78.2 %
of Petroleum Fuels 101.5 % 101.0 % 101.2 % 99.9 % 101.7 % 102.1 %
of Crude and NGL 99.1 % 100.6 % 100.1 % 99.3 % 100.0 % 99.5 %
of Natural Gas 97.4 % 101.6 % 101.4 % 99.4 % 103.5 % 96.9 %
Renewables in Gross Final Energy (%)
Overall RES with Aviation Cap 8.4 % 13.8 % 16.1 % 16.2 %
RES-H&C – Heating and Cooling 9.4 % 12.6 % 15.7 % 16.8 %
RES-E – Electricity Generation 19.1 % 29.8 % 37.8 % 36.9 %
RES-T – Transport 1.3 % 5.0 % 0.8 % 1.7 %
Gases Emissions (Mio ton CO2)
CO2 Emissions* 274.51 322.03 382.44 297.07 268.58 286.35
GHGs Emissions* 335.17 395.76 451.58 369.56 338.28 350.40
Main Emissions Indicators
CO2 per Capita (kg CO2/cap) 6,925.1 7,957.1 8,833.1 6,390.3 5,774.5 6,164.7
Carbon Intensity (kg CO2/toe) 2,608.6 2,484.6 2,514.9 2,143.3 2,158.6 2,222.5
CO2 GDP Intensity (ton CO2/M€'10) 386.4 371.0 373.0 274.8 259.5 268.0* Total emissions without LULUCF, with ind. CO
2, including international aviation,
excl. international maritime transport.
193
EU ENERGY IN FIGURES 2017
Methodology, Sources and Notes: See Appendix 13 – No 5

5.10 FranceMtoe, unless otherwise stated 1995 2000 2005 2010 2014 2015
Production 127.36 130.14 136.20 134.90 136.94 137.56
Solid Fuels 6.02 2.48 0.38 0.16 0.19 0.00
of which Hard Coal 5.44 2.36 0.38 0.16 0.19 0.00
Petroleum and Products 3.48 2.39 1.64 1.70 1.89 1.94
of which Crude and NGL 2.98 1.69 1.24 0.94 0.78 0.85
Gases 2.79 1.51 0.91 0.65 0.02 0.03
of which Natural Gas 2.79 1.51 0.91 0.65 0.02 0.03
Nuclear 97.31 107.09 116.47 110.54 112.59 112.84
Renewables 17.04 15.74 15.73 20.65 21.01 21.42
Wastes, Non-Renewable 0.72 0.93 1.06 1.20 1.24 1.35
Net Imports 117.06 134.08 143.96 131.95 115.33 116.84
Solid Fuels 9.14 13.01 13.51 12.19 9.21 8.69
of which Hard Coal 8.66 12.44 12.81 11.32 8.71 8.29
Petroleum and Products 86.44 91.27 94.97 82.69 77.74 78.65
of which Crude and NGL 78.65 86.84 85.22 64.95 54.90 58.18
Gases 27.49 35.78 40.72 39.55 33.79 34.59
of which Natural Gas 27.49 35.78 40.72 39.55 33.79 34.59
Renewables 0.00 0.01 -0.05 0.16 0.38 0.43
Electricity -6.01 -5.97 -5.19 -2.64 -5.78 -5.51
Gross Inland Consumption 241.78 257.54 276.38 266.89 248.45 252.62
Solid Fuels 16.08 15.05 14.30 12.08 9.34 8.83
of which Hard Coal 14.94 14.24 13.80 11.25 8.93 8.56
Petroleum and Products 87.06 88.94 93.04 82.37 77.11 78.26
of which Crude and NGL 82.08 88.19 86.80 66.13 56.02 58.91
Gases 29.58 35.77 41.03 42.54 32.60 35.05
of which Natural Gas 29.58 35.77 41.03 42.54 32.60 35.05
Nuclear 97.31 107.09 116.47 110.54 112.59 112.84
Renewables 17.04 15.74 15.68 20.80 21.35 21.81
Electricity -6.01 -5.97 -5.19 -2.64 -5.78 -5.51
Wastes, Non-Renewable 0.72 0.93 1.06 1.20 1.24 1.35
Primary Energy Consumption 225.92 241.36 260.27 252.94 234.59 239.27
Available for Final Consumption 156.87 166.22 177.09 170.66 157.05 160.34
Final Non-Energy Consumption 15.86 16.18 16.12 13.95 13.86 13.35
Final Energy Consumption 143.48 155.31 160.77 155.30 140.35 144.12
by Fuel/Product
Solid Fuels 6.49 5.78 5.22 4.55 3.27 4.11
Petroleum and Products 69.82 73.18 71.45 64.60 60.36 61.13
Gases 27.25 30.91 34.34 32.77 27.78 28.32
Biomass and Renewable Wastes 9.67 8.82 9.14 11.49 10.86 11.41
Solar 0.03 0.02 0.03 0.06 0.10 0.10
Geothermal 0.13 0.13 0.02 0.02 0.03 0.03
Electricity 29.48 33.10 36.35 38.19 35.67 36.54
Derived heat 0.55 3.24 4.16 3.53 2.16 2.35
Wastes, Non-Renewable 0.08 0.15 0.06 0.10 0.13 0.13
by Sector
Industry 36.20 37.35 33.48 28.46 27.33 28.64
Transport 45.70 50.41 50.26 49.47 49.34 50.08
Residential 35.79 40.79 43.07 43.10 36.24 37.66
Services 20.72 18.36 20.76 23.18 22.16 22.54
Agriculture and Fishing 4.07 4.28 4.68 4.52 4.49 4.43
Other 1.01 4.14 8.51 6.58 0.78 0.78
194
PART 5 Country Profiles
Methodology, Sources and Notes: See Appendix 13 – No 5

1995 2000 2005 2010 2014 2015
Installed Capacity (GW) 107.62 114.67 115.76 124.55 128.94 129.31
Combustible Fuels 23.87 26.07 26.45 28.82 24.41 22.55
Nuclear 58.52 63.18 63.26 63.13 63.13 63.13
Hydro 24.99 25.13 25.11 25.40 25.29 25.28
Wind 0.00 0.04 0.69 5.91 9.07 10.22
Solar PV 0.00 0.01 0.01 1.04 5.65 6.76
Geothermal 0.00 0.00
Tide, Wave and Ocean 0.24 0.24 0.24 0.24 0.24 0.24
Other Sources 1.14 1.13
Gross Electricity Generation (TWh) 494.27 539.95 576.06 569.10 563.69 568.45
Solid Fuels 24.18 27.00 27.52 23.36 9.52 9.65
Petroleum and Products 7.75 7.17 7.93 5.52 2.10 2.16
Gases 6.22 15.37 26.26 26.71 15.30 22.32
Nuclear 377.23 415.16 451.53 428.52 436.47 437.43
Renewables 78.53 74.17 61.18 83.01 97.60 94.32
Wastes, non-RES 0.37 1.08 1.66 1.97 2.15 2.25
Cogeneration Heat and Power
CHP Electrical Capacity (GW) 6.60 4.61 6.17 5.6
CHP Electricity Generation (TWh) 23.21 15.69 11.62 13.9
CHP in Total Electricity Generation (%) 4.0 % 2.8 % 2.1 % 2.5 %
CHP Heat Production (PJ) 209.20 173.95 132.04 154.9
Transport Fuels (ktoe)
Final Consumption Petroleum Products 44 879.4 49 275.8 48 778.9 46 118.7 45 441.8 46 103.9
Motor Gasoline 16 711.5 14 654.6 11 427.7 7 870.5 6 790.6 6 869.9
Gas/Diesel Oil 23 351.7 28 171.7 30 814.3 31 752.8 32 084.8 32 383.0
Final Consumption Biofuels 154.4 324.5 581.6 2 400.5 2 906.2 2 949.1
Biogasoline 24.3 58.2 99.9 395.6 406.5 421.2
Biodiesel 130.1 266.3 481.7 2 004.9 2 499.7 2 527.9
Main Energy Indicators
Energy Intensity (toe/M€'10) 157.5 145.4 143.7 133.5 119.7 120.5
Energy per Capita (kgoe/cap) 4 076.1 4 253.7 4 402.9 4 127.6 3 767.8 3 799.4
Final Electricity per Capita (KWh/cap) 5 780.1 6 357.3 6 734.9 6 868.2 6 290.5 6 390.9
Primary Energy Intensity (toe/M€'10) 147.2 136.2 135.3 126.6 113.1 114.1
Import Dependency (%) 48.0 % 51.5 % 51.6 % 49.0 % 46.1 % 46.0 %
of Solid Fuels 56.8 % 86.4 % 94.5 % 101.0 % 98.6 % 98.4 %
of Hard Coal 58.0 % 87.3 % 92.9 % 100.6 % 97.5 % 96.8 %
of Petroleum Fuels 96.9 % 99.5 % 99.3 % 97.7 % 98.5 % 98.5 %
of Crude and NGL 95.8 % 98.5 % 98.2 % 98.2 % 98.0 % 98.8 %
of Natural Gas 93.0 % 100.0 % 99.3 % 93.0 % 103.6 % 98.7 %
Renewables in Gross Final Energy (%)
Overall RES with Aviation Cap 9.5 % 12.5 % 14.7 % 15.2 %
RES-H&C – Heating and Cooling 12.2 % 15.8 % 18.8 % 19.8 %
RES-E – Electricity Generation 13.7 % 14.8 % 18.3 % 18.8 %
RES-T – Transport 2.1 % 6.5 % 8.4 % 8.5 %
Gases Emissions (Mio ton CO2)
CO2 Emissions* 408.37 428.96 439.89 404.02 348.05 353.90
GHGs Emissions* 554.63 566.36 569.14 527.68 470.04 474.61
Main Emissions Indicators
CO2 per Capita (kg CO2/cap) 6 884.8 7 085.0 7 007.7 6 248.5 5 278.1 5 322.7
Carbon Intensity (kg CO2/toe) 1 674.4 1 647.7 1 577.0 1 500.9 1 390.7 1 392.0
CO2 GDP Intensity (ton CO2/M€'10) 266.0 242.1 228.7 202.2 167.7 168.7* Total emissions without LULUCF, with ind. CO
2, including international aviation,
excl. international maritime transport.
195
EU ENERGY IN FIGURES 2017
Methodology, Sources and Notes: See Appendix 13 – No 5

5.11 CroatiaMtoe, unless otherwise stated 1995 2000 2005 2010 2014 2015
Production 5.00 4.26 4.75 5.16 4.43 4.47
Solid Fuels 0.05
of which Hard Coal 0.05
Petroleum and Products 1.80 1.35 1.03 0.77 0.68 0.76
of which Crude and NGL 1.80 1.35 1.03 0.76 0.61 0.69
Gases 1.61 1.36 1.87 2.22 1.44 1.47
of which Natural Gas 1.61 1.36 1.87 2.22 1.44 1.47
Nuclear
Renewables 1.54 1.56 1.86 2.17 2.29 2.23
Wastes, Non-Renewable 0.00 0.00 0.00 0.01 0.01 0.01
Net Imports 2.85 4.08 5.15 4.39 3.59 4.12
Solid Fuels 0.15 0.48 0.62 0.70 0.60 0.62
of which Hard Coal 0.07 0.44 0.57 0.66 0.56 0.59
Petroleum and Products 2.21 2.41 3.58 2.98 2.35 2.62
of which Crude and NGL 3.98 3.91 4.02 3.56 1.87 2.34
Gases 0.22 0.91 0.56 0.48 0.58 0.56
of which Natural Gas 0.22 0.91 0.56 0.48 0.58 0.56
Renewables -0.10 -0.27 -0.27
Electricity 0.27 0.29 0.38 0.34 0.34 0.58
Gross Inland Consumption 7.86 8.42 9.78 9.43 8.20 8.53
Solid Fuels 0.18 0.43 0.68 0.68 0.65 0.61
of which Hard Coal 0.09 0.39 0.63 0.64 0.61 0.57
Petroleum and Products 3.94 3.93 4.49 3.70 3.17 3.28
of which Crude and NGL 5.76 5.43 5.10 4.33 2.48 2.94
Gases 1.93 2.21 2.37 2.63 2.02 2.08
of which Natural Gas 1.93 2.21 2.37 2.63 2.02 2.08
Nuclear
Renewables 1.54 1.56 1.86 2.07 2.01 1.96
Electricity 0.27 0.29 0.38 0.34 0.34 0.58
Wastes, Non-Renewable 0.00 0.00 0.00 0.01 0.01 0.01
Primary Energy Consumption 7.05 7.77 9.11 8.83 7.66 8.00
Available for Final Consumption 6.10 6.66 7.91 7.81 6.78 7.12
Final Non-Energy Consumption 0.81 0.66 0.68 0.60 0.54 0.53
Final Energy Consumption 5.28 6.00 7.24 7.21 6.24 6.59
by Fuel/Product
Solid Fuels 0.11 0.07 0.15 0.15 0.10 0.08
Petroleum and Products 2.11 2.68 3.11 2.90 2.62 2.75
Gases 0.91 1.01 1.24 1.29 0.94 0.98
Biomass and Renewable Wastes 1.05 1.00 1.24 1.24 1.09 1.22
Solar 0.00 0.00 0.01 0.01 0.01
Geothermal 0.01 0.01 0.01
Electricity 0.85 1.02 1.24 1.36 1.28 1.32
Derived heat 0.25 0.21 0.26 0.25 0.19 0.21
Wastes, Non-Renewable 0.00 0.00 0.00 0.01 0.01 0.01
by Sector
Industry 1.25 1.38 1.56 1.37 1.10 1.09
Transport 1.20 1.55 1.92 2.07 2.02 2.11
Residential 2.19 2.30 2.82 2.76 2.22 2.42
Services 0.44 0.49 0.69 0.78 0.68 0.74
Agriculture and Fishing 0.20 0.29 0.24 0.25 0.24 0.23
Other
196
PART 5 Country Profiles
Methodology, Sources and Notes: See Appendix 13 – No 5

1995 2000 2005 2010 2014 2015
Installed Capacity (GW) 2.07 2.08 3.87 4.12 4.43 4.80
Combustible Fuels 1.80 1.90 1.86 2.12
Nuclear
Hydro 2.07 2.08 2.06 2.14 2.19 2.21
Wind 0.01 0.08 0.34 0.42
Solar PV 0.03 0.05
Geothermal
Tide, Wave and Ocean
Other Sources
Gross Electricity Generation (TWh) 9.28 11.28 13.16 14.90 13.55 11.40
Solid Fuels 0.24 1.55 2.33 2.39 2.37 2.31
Petroleum and Products 2.46 1.69 1.86 0.56 0.13 0.22
Gases 0.88 1.57 1.81 2.55 1.00 1.20
Nuclear
Renewables 5.69 6.47 7.17 9.40 10.06 7.68
Wastes, non-RES 0.00 0.00 0.00 0.00 0.00 0.00
Cogeneration Heat and Power
CHP Electrical Capacity (GW) 0.69 0.68 0.6
CHP Electricity Generation (TWh) 2.02 0.86 0.8
CHP in Total Electricity Generation (%) 14.3 % 6.3 % 7.1 %
CHP Heat Production (PJ) 14.92 11.32 10.0
Transport Fuels (ktoe)
Final Consumption Petroleum Products 1 186.2 1 525.8 1 900.9 2 042.0 1 962.3 2 058.6
Motor Gasoline 594.3 814.7 739.1 678.4 554.9 553.8
Gas/Diesel Oil 477.4 623.3 1 038.5 1 186.4 1 207.8 1 302.7
Final Consumption Biofuels 2.6 29.8 24.3
Biogasoline 0.0 0.0
Biodiesel 2.6 29.8 24.3
Main Energy Indicators
Energy Intensity (toe/M€'10) 263.2 238.7 222.5 209.5 189.6 194.1
Energy per Capita (kgoe/cap) 1 686.5 1 872.5 2 269.2 2 190.9 1 929.7 2 017.6
Final Electricity per Capita (KWh/cap) 2 129.5 2 630.9 3 344.3 3 686.4 3 492.7 3 631.2
Primary Energy Intensity (toe/M€'10) 236.0 220.1 207.2 196.2 177.1 182.0
Import Dependency (%) 36.1 % 48.4 % 52.5 % 46.6 % 43.8 % 48.3 %
of Solid Fuels 85.7 % 110.9 % 91.4 % 102.3 % 92.4 % 103.1 %
of Hard Coal 73.9 % 112.9 % 90.5 % 102.7 % 92.3 % 102.5 %
of Petroleum Fuels 55.6 % 61.0 % 79.4 % 80.4 % 74.0 % 79.7 %
of Crude and NGL 69.2 % 72.1 % 78.9 % 82.2 % 75.6 % 79.6 %
of Natural Gas 11.6 % 41.0 % 23.7 % 18.1 % 28.6 % 27.1 %
Renewables in Gross Final Energy (%)
Overall RES with Aviation Cap 23.8 % 25.1 % 27.9 % 29.0 %
RES-H&C – Heating and Cooling 30.0 % 32.8 % 36.2 % 38.6 %
RES-E – Electricity Generation 35.6 % 37.6 % 45.3 % 45.4 %
RES-T – Transport 1.0 % 1.1 % 4.1 % 3.5 %
Gases Emissions (Mio ton CO2)
CO2 Emissions* 17.24 19.99 23.71 21.50 18.15 18.27
GHGs Emissions* 22.56 25.46 29.57 27.63 23.42 23.86
Main Emissions Indicators
CO2 per Capita (kg CO2/cap) 3 700.0 4 444.5 5 500.0 4 996.5 4 272.7 4 324.6
Carbon Intensity (kg CO2/toe) 2 185.1 2 368.5 2 417.9 2 278.9 2 214.2 2 143.4
CO2 GDP Intensity (ton CO2/M€'10) 577.5 566.5 539.3 477.7 419.9 416.0* Total emissions without LULUCF, with ind. CO
2, including international aviation,
excl. international maritime transport.
197
EU ENERGY IN FIGURES 2017
Methodology, Sources and Notes: See Appendix 13 – No 5

5.12 ItalyMtoe, unless otherwise stated 1995 2000 2005 2010 2014 2015
Production 29.83 28.49 30.33 33.07 36.81 36.13
Solid Fuels 0.04 0.00 0.06 0.06 0.06 0.05
of which Hard Coal 0.06 0.06 0.06 0.05
Petroleum and Products 5.57 5.01 6.38 5.68 6.10 5.82
of which Crude and NGL 5.26 4.56 6.15 5.14 5.88 5.51
Gases 16.56 13.63 9.89 6.89 5.86 5.55
of which Natural Gas 16.35 13.62 9.89 6.89 5.86 5.55
Nuclear
Renewables 7.49 9.60 13.33 19.40 23.64 23.56
Wastes, Non-Renewable 0.16 0.26 0.67 1.04 1.16 1.15
Net Imports 134.50 152.07 160.37 149.46 116.12 121.83
Solid Fuels 13.00 13.13 16.37 13.79 12.90 12.32
of which Hard Coal 12.58 12.87 15.94 13.98 12.30 12.07
Petroleum and Products 89.52 87.60 79.15 67.78 51.14 52.83
of which Crude and NGL 73.67 83.27 89.10 79.21 54.54 62.15
Gases 28.53 47.01 59.84 61.60 45.47 50.00
of which Natural Gas 28.53 47.01 59.84 61.60 45.47 50.00
Renewables 0.23 0.52 0.78 2.50 2.85 2.69
Electricity 3.22 3.81 4.23 3.80 3.76 3.99
Gross Inland Consumption 161.77 174.22 190.08 177.93 151.03 156.17
Solid Fuels 12.28 12.55 16.46 13.66 13.07 12.30
of which Hard Coal 11.91 12.18 15.98 13.78 12.42 12.00
Petroleum and Products 93.52 89.54 83.96 69.51 55.83 57.16
of which Crude and NGL 79.35 87.52 94.76 83.87 60.14 67.43
Gases 44.87 57.95 70.65 68.06 50.71 55.30
of which Natural Gas 44.65 57.94 70.65 68.06 50.71 55.30
Nuclear
Renewables 7.72 10.11 14.11 21.86 26.51 26.27
Electricity 3.22 3.81 4.23 3.80 3.76 3.99
Wastes, Non-Renewable 0.16 0.26 0.67 1.04 1.16 1.15
Primary Energy Consumption 152.03 165.79 181.47 168.37 143.84 149.56
Available for Final Consumption 124.85 133.74 145.23 137.17 118.59 121.99
Final Non-Energy Consumption 9.73 8.43 8.61 9.56 7.19 6.61
Final Energy Consumption 114.58 124.72 137.15 128.46 113.35 116.44
by Fuel/Product
Solid Fuels 3.93 3.59 3.98 2.86 2.27 1.72
Petroleum and Products 54.06 57.84 59.01 48.73 44.33 44.34
Gases 34.65 38.02 40.61 38.50 31.08 33.18
Biomass and Renewable Wastes 1.14 1.52 4.30 8.81 7.16 8.06
Solar 0.01 0.01 0.03 0.13 0.18 0.19
Geothermal 0.21 0.21 0.21 0.13 0.11 0.11
Electricity 20.49 23.47 25.87 25.74 24.20 24.72
Derived heat 3.08 3.33 3.75 3.85
Wastes, Non-Renewable 0.08 0.06 0.06 0.22 0.27 0.27
by Sector
Industry 36.02 39.74 39.86 31.25 26.16 26.02
Transport 38.57 42.52 44.84 41.73 40.09 39.54
Residential 26.32 27.59 33.92 35.39 29.55 32.49
Services 9.82 11.54 15.05 16.98 14.67 15.39
Agriculture and Fishing 3.25 3.16 3.32 2.94 2.78 2.85
Other 0.59 0.17 0.16 0.16 0.11 0.14
198
PART 5 Country Profiles
Methodology, Sources and Notes: See Appendix 13 – No 5

1995 2000 2005 2010 2014 2015
Installed Capacity (GW) 65.92 75.51 85.50 106.61 121.75 116.96
Combustible Fuels 45.48 54.03 61.93 74.66 71.27 65.62
Nuclear
Hydro 19.84 20.35 20.99 21.52 22.10 22.22
Wind 0.02 0.36 1.64 5.79 8.68 9.14
Solar PV 0.02 0.02 0.03 3.59 18.59 18.89
Geothermal 0.47 0.59 0.67 0.73 0.77 0.77
Tide, Wave and Ocean
Other Sources 0.09 0.16 0.23 0.32 0.33 0.32
Gross Electricity Generation (TWh) 241.49 276.64 303.70 302.06 279.83 282.99
Solid Fuels 24.12 26.27 43.61 39.73 43.45 43.20
Petroleum and Products 120.80 85.88 47.12 21.71 14.16 13.38
Gases 50.44 105.61 155.08 157.44 96.71 113.05
Nuclear
Renewables 45.58 57.58 55.30 80.26 122.39 110.34
Wastes, non-RES 0.17 0.51 1.48 2.15 2.45 2.43
Cogeneration Heat and Power
CHP Electrical Capacity (GW) 5.89 7.35 8.57 9.0
CHP Electricity Generation (TWh) 27.39 34.71 36.65 39.5
CHP in Total Electricity Generation (%) 9.0 % 11.5 % 13.1 % 14.0 %
CHP Heat Production (PJ) 193.07 202.51 202.45 213.2
Transport Fuels (ktoe)
Final Consumption Petroleum Products 37 664.7 41 460.6 43 426.7 38 701.8 37 048.4 36 353.3
Motor Gasoline 18 278.7 17 555.7 14 174.8 10 275.9 8 494.6 8 191.9
Gas/Diesel Oil 15 237.8 18 415.4 23 792.8 22 703.1 22 773.3 22 089.6
Final Consumption Biofuels 176.7 1 419.4 1 065.2 1 166.6
Biogasoline 122.1 10.0 24.8
Biodiesel 176.7 1 297.3 1 055.2 1 141.8
Main Energy Indicators
Energy Intensity (toe/M€'10) 114.8 112.0 116.6 110.9 97.9 100.4
Energy per Capita (kgoe/cap) 2 845.8 3 060.6 3 284.4 3 006.0 2 484.7 2 568.8
Final Electricity per Capita (KWh/cap) 4 191.7 4 795.5 5 198.8 5 056.8 4 631.2 4 728.7
Primary Energy Intensity (toe/M€'10) 107.9 106.6 111.3 104.9 93.2 96.2
Import Dependency (%) 81.9 % 86.5 % 83.4 % 82.6 % 75.9 % 77.1 %
of Solid Fuels 105.9 % 104.6 % 99.4 % 101.0 % 98.7 % 100.2 %
of Hard Coal 105.6 % 105.7 % 99.7 % 101.5 % 99.0 % 100.5 %
of Petroleum Fuels 93.3 % 96.1 % 91.8 % 93.5 % 88.6 % 89.5 %
of Crude and NGL 92.8 % 95.1 % 94.0 % 94.5 % 90.7 % 92.2 %
of Natural Gas 63.9 % 81.1 % 84.7 % 90.5 % 89.7 % 90.4 %
Renewables in Gross Final Energy (%)
Overall RES with Aviation Cap 7.5 % 13.0 % 17.1 % 17.5 %
RES-H&C – Heating and Cooling 8.2 % 15.6 % 18.9 % 19.2 %
RES-E – Electricity Generation 16.3 % 20.1 % 33.4 % 33.5 %
RES-T – Transport 1.0 % 4.8 % 5.0 % 6.4 %
Gases Emissions (Mio ton CO2)
CO2 Emissions* 453.19 474.19 500.36 434.32 356.19 366.87
GHGs Emissions* 536.82 560.89 588.31 514.14 432.52 442.78
Main Emissions Indicators
CO2 per Capita (kg CO2/cap) 7 972.4 8 330.3 8 645.6 7 337.7 5 860.1 6 034.5
Carbon Intensity (kg CO2/toe) 2 760.2 2 696.3 2 601.7 2 400.9 2 329.0 2 321.0
CO2 GDP Intensity (ton CO2/M€'10) 321.6 304.8 307.0 270.7 230.9 235.9* Total emissions without LULUCF, with ind. CO
2, including international aviation,
excl. international maritime transport.
199
EU ENERGY IN FIGURES 2017
Methodology, Sources and Notes: See Appendix 13 – No 5

5.13 CyprusMtoe, unless otherwise stated 1995 2000 2005 2010 2014 2015
Production 0.04 0.04 0.05 0.09 0.12 0.13
Solid Fuels
of which Hard Coal
Petroleum and Products 0.00 0.01 0.01
of which Crude and NGL
Gases
of which Natural Gas
Nuclear
Renewables 0.04 0.04 0.05 0.08 0.11 0.12
Wastes, Non-Renewable 0.00 0.01 0.01 0.00
Net Imports 2.04 2.57 2.84 2.94 2.29 2.45
Solid Fuels 0.01 0.03 0.04 0.01 0.00 0.00
of which Hard Coal 0.01 0.03 0.04 0.01 0.00 0.00
Petroleum and Products 2.03 2.53 2.79 2.91 2.27 2.42
of which Crude and NGL 0.80 1.16
Gases
of which Natural Gas
Renewables 0.00 0.00 0.01 0.02 0.02 0.03
Electricity
Gross Inland Consumption 1.97 2.41 2.54 2.74 2.23 2.27
Solid Fuels 0.01 0.03 0.04 0.02 0.00 0.00
of which Hard Coal 0.01 0.03 0.04 0.02 0.00 0.00
Petroleum and Products 1.91 2.33 2.45 2.61 2.09 2.11
of which Crude and NGL 0.83 1.18
Gases
of which Natural Gas
Nuclear
Renewables 0.05 0.05 0.05 0.11 0.13 0.15
Electricity
Wastes, Non-Renewable 0.00 0.00 0.00 0.01 0.01 0.01
Primary Energy Consumption 1.90 2.33 2.47 2.66 2.21 2.25
Available for Final Consumption 1.48 1.75 1.80 1.97 1.65 1.67
Final Non-Energy Consumption 0.06 0.09 0.07 0.09 0.02 0.02
Final Energy Consumption 1.43 1.65 1.83 1.93 1.62 1.66
by Fuel/Product
Solid Fuels 0.01 0.03 0.04 0.02 0.00 0.00
Petroleum and Products 1.18 1.32 1.40 1.38 1.16 1.18
Gases
Biomass and Renewable Wastes 0.01 0.01 0.01 0.04 0.03 0.04
Solar 0.03 0.04 0.04 0.06 0.07 0.07
Geothermal 0.00 0.00 0.00 0.00 0.00 0.00
Electricity 0.19 0.26 0.34 0.42 0.34 0.35
Derived heat 0.00 0.00
Wastes, Non-Renewable 0.00 0.00 0.00 0.01 0.01 0.01
by Sector
Industry 0.39 0.44 0.32 0.24 0.22 0.20
Transport 0.76 0.86 0.98 1.05 0.84 0.87
Residential 0.14 0.18 0.32 0.33 0.29 0.32
Services 0.07 0.11 0.16 0.25 0.20 0.21
Agriculture and Fishing 0.01 0.01 0.04 0.04 0.04 0.04
Other 0.05 0.05 0.02 0.02 0.02 0.02
200
PART 5 Country Profiles
Methodology, Sources and Notes: See Appendix 13 – No 5

1995 2000 2005 2010 2014 2015
Installed Capacity (GW) 0.69 0.99 1.13 1.56 1.72 1.76
Combustible Fuels 0.69 0.99 1.12 1.47 1.51 1.52
Nuclear
Hydro
Wind 0.08 0.15 0.16
Solar PV 0.00 0.01 0.06 0.08
Geothermal
Tide, Wave and Ocean
Other Sources
Gross Electricity Generation (TWh) 2.50 3.37 4.38 5.32 4.35 4.53
Solid Fuels
Petroleum and Products 2.50 3.37 4.38 5.25 4.03 4.14
Gases
Nuclear
Renewables 0.00 0.00 0.00 0.07 0.32 0.40
Wastes, non-RES 0.00
Cogeneration Heat and Power
CHP Electrical Capacity (GW) 0.01 0.02 0.01 0.01
CHP Electricity Generation (TWh) 0.0 0.06 0.07 0.0
CHP in Total Electricity Generation (%) 0.3 % 1.0 % 1.5 % 0.1 %
CHP Heat Production (PJ) 0.1 0.1 0.2 0.2
Transport Fuels (ktoe)
Final Consumption Petroleum Products 760.2 859.7 982.5 1 034.8 833.1 857.6
Motor Gasoline 193.6 218.0 320.6 412.7 360.8 365.0
Gas/Diesel Oil 292.7 359.5 355.4 337.8 229.0 247.2
Final Consumption Biofuels 15.0 9.7 9.7
Biogasoline
Biodiesel 15.0 9.7 9.7
Main Energy Indicators
Energy Intensity (toe/M€'10) 166.4 168.6 149.0 142.0 128.4 128.7
Energy per Capita (kgoe/cap) 3 044.6 3 494.6 3 463.5 3 345.0 2 597.9 2 682.4
Final Electricity per Capita (KWh/cap) 3 444.4 4 338.9 5 402.0 5 959.9 4 621.2 4 829.9
Primary Energy Intensity (toe/M€'10) 161.1 162.6 144.7 137.6 127.0 127.3
Import Dependency (%) 100.5 % 98.6 % 100.7 % 100.8 % 93.2 % 97.7 %
of Solid Fuels 100.0 % 100.0 % 119.4 % 64.7 % 150.0 % 100.0 %
of Hard Coal 100.0 % 100.0 % 119.4 % 64.7 % 150.0 % 100.0 %
of Petroleum Fuels 102.6 % 100.3 % 102.3 % 104.2 % 97.9 % 102.9 %
of Crude and NGL 96.3 % 98.5 %
of Natural Gas
Renewables in Gross Final Energy (%)
Overall RES with Aviation Cap 3.1 % 6.0 % 8.9 % 9.4 %
RES-H&C – Heating and Cooling 10.0 % 18.2 % 21.6 % 22.5 %
RES-E – Electricity Generation 0.0 % 1.4 % 7.4 % 8.4 %
RES-T – Transport 0.0 % 2.0 % 2.7 % 2.5 %
Gases Emissions (Mio ton CO2)
CO2 Emissions* 6.66 7.93 8.81 8.84 7.65 7.61
GHGs Emissions* 7.86 9.17 10.16 10.42 9.21 9.19
Main Emissions Indicators
CO2 per Capita (kg CO2/cap) 10 312.6 11 482.3 12 014.7 10 792.7 8 921.6 8 986.3
Carbon Intensity (kg CO2/toe) 3 275.5 3 047.1 3 118.8 3 025.6 3 115.5 3 032.4
CO2 GDP Intensity (ton CO2/M€'10) 563.6 553.9 516.8 458.1 440.8 431.1* Total emissions without LULUCF, with ind. CO
2, including international aviation,
excl. international maritime transport.
201
EU ENERGY IN FIGURES 2017
Methodology, Sources and Notes: See Appendix 13 – No 5

5.14 LatviaMtoe, unless otherwise stated 1995 2000 2005 2010 2014 2015
Production 1.43 1.47 1.87 1.98 2.38 2.35
Solid Fuels 0.08 0.02 0.00 0.00 0.00 0.00
of which Hard Coal
Petroleum and Products 0.00 0.06 0.01 0.00 0.00 0.01
of which Crude and NGL
Gases
of which Natural Gas
Nuclear
Renewables 1.35 1.39 1.85 1.96 2.37 2.33
Wastes, Non-Renewable 0.00 0.01 0.01 0.01
Net Imports 3.36 2.36 3.10 2.22 1.90 2.37
Solid Fuels 0.17 0.06 0.08 0.11 0.05 0.04
of which Hard Coal 0.16 0.05 0.07 0.11 0.05 0.04
Petroleum and Products 2.09 1.24 1.78 1.67 1.54 1.79
of which Crude and NGL
Gases 1.00 1.11 1.43 0.90 0.78 1.08
of which Natural Gas 1.00 1.11 1.43 0.90 0.78 1.08
Renewables -0.09 -0.20 -0.38 -0.56 -0.72 -0.74
Electricity 0.19 0.15 0.18 0.08 0.20 0.16
Gross Inland Consumption 4.62 3.86 4.59 4.63 4.45 4.38
Solid Fuels 0.27 0.13 0.08 0.11 0.06 0.05
of which Hard Coal 0.17 0.07 0.08 0.11 0.06 0.05
Petroleum and Products 1.89 1.30 1.49 1.52 1.43 1.49
of which Crude and NGL
Gases 1.01 1.09 1.36 1.46 1.08 1.10
of which Natural Gas 1.01 1.09 1.36 1.46 1.08 1.10
Nuclear
Renewables 1.26 1.19 1.48 1.44 1.61 1.54
Electricity 0.19 0.15 0.19 0.08 0.20 0.16
Wastes, Non-Renewable 0.00 0.03 0.07 0.06
Primary Energy Consumption 4.58 3.79 4.50 4.56 4.36 4.27
Available for Final Consumption 3.94 3.28 4.11 4.17 3.99 3.89
Final Non-Energy Consumption 0.04 0.08 0.10 0.07 0.09 0.11
Final Energy Consumption 3.85 3.25 4.02 4.12 3.89 3.79
by Fuel/Product
Solid Fuels 0.13 0.06 0.07 0.09 0.05 0.04
Petroleum and Products 1.16 1.06 1.32 1.45 1.32 1.37
Gases 0.37 0.33 0.51 0.50 0.33 0.32
Biomass and Renewable Wastes 0.88 0.82 1.01 0.95 1.05 0.94
Solar
Geothermal
Electricity 0.38 0.39 0.49 0.53 0.57 0.56
Derived heat 0.93 0.60 0.60 0.58 0.51 0.50
Wastes, Non-Renewable 0.00 0.00 0.00 0.03 0.07 0.06
by Sector
Industry 0.70 0.58 0.70 0.77 0.79 0.79
Transport 0.72 0.75 1.07 1.20 1.09 1.15
Residential 1.60 1.33 1.50 1.39 1.24 1.11
Services 0.66 0.47 0.59 0.60 0.61 0.59
Agriculture and Fishing 0.17 0.13 0.15 0.16 0.15 0.16
Other 0.00 0.00 0.00 0.00 0.00 0.00
202
PART 5 Country Profiles
Methodology, Sources and Notes: See Appendix 13 – No 5

1995 2000 2005 2010 2014 2015
Installed Capacity (GW) 2.07 2.09 2.17 2.56 2.92 2.93
Combustible Fuels 0.56 0.58 0.60 0.95 1.27 1.28
Nuclear
Hydro 1.51 1.51 1.54 1.58 1.59 1.59
Wind 0.00 0.00 0.03 0.03 0.07 0.07
Solar PV
Geothermal
Tide, Wave and Ocean
Other Sources
Gross Electricity Generation (TWh) 3.98 4.14 4.91 6.63 5.14 5.53
Solid Fuels 0.10 0.08 0.00 0.00 0.00 0.00
Petroleum and Products 0.42 0.11 0.01 0.00 0.00 0.00
Gases 0.53 1.13 1.49 2.99 2.34 2.76
Nuclear
Renewables 2.94 2.82 3.41 3.64 2.80 2.78
Wastes, non-RES
Cogeneration Heat and Power
CHP Electrical Capacity (GW) 0.59 0.87 1.09 1.1
CHP Electricity Generation (TWh) 1.51 2.98 2.44 2.5
CHP in Total Electricity Generation (%) 30.7 % 45.0 % 47.5 % 44.7 %
CHP Heat Production (PJ) 11.91 10.45 11.78 12.4
Transport Fuels (ktoe)
Final Consumption Petroleum Products 699.3 734.3 1 049.7 1 163.3 1 059.3 1 113.1
Motor Gasoline 429.8 346.8 351.8 294.1 205.8 204.8
Gas/Diesel Oil 241.5 340.0 613.0 727.7 680.0 736.8
Final Consumption Biofuels 2.7 27.0 24.2 24.6
Biogasoline 0.0 8.3 6.4 7.7
Biodiesel 2.7 18.7 17.8 16.9
Main Energy Indicators
Energy Intensity (toe/M€'10) 484.0 314.8 252.3 260.2 215.8 206.7
Energy per Capita (kgoe/cap) 1 848.8 1 622.4 2 041.1 2 183.0 2 224.4 2 205.3
Final Electricity per Capita (KWh/cap) 1 785.6 1 879.7 2 546.5 2 930.9 3 288.6 3 253.1
Primary Energy Intensity (toe/M€'10) 479.7 308.7 247.0 256.1 211.3 201.4
Import Dependency (%) 70.4 % 61.0 % 63.9 % 45.5 % 40.6 % 51.2 %
of Solid Fuels 61.6 % 46.2 % 93.9 % 102.8 % 76.7 % 87.0 %
of Hard Coal 93.6 % 81.8 % 97.3 % 106.7 % 78.0 % 87.0 %
of Petroleum Fuels 102.6 % 94.8 % 102.2 % 94.4 % 92.4 % 102.9 %
of Crude and NGL
of Natural Gas 98.9 % 101.9 % 105.6 % 61.8 % 72.1 % 98.6 %
Renewables in Gross Final Energy (%)
Overall RES with Aviation Cap 32.3 % 30.4 % 38.7 % 37.6 %
RES-H&C – Heating and Cooling 42.7 % 40.7 % 52.2 % 51.8 %
RES-E – Electricity Generation 43.0 % 42.1 % 51.1 % 52.2 %
RES-T – Transport 2.4 % 4.0 % 4.1 % 3.9 %
Gases Emissions (Mio ton CO2)
CO2 Emissions* 9.26 7.18 7.99 8.90 7.50 7.58
GHGs Emissions* 12.81 10.44 11.49 12.58 11.55 11.65
Main Emissions Indicators
CO2 per Capita (kg CO2/cap) 3 702.0 3 014.8 3 552.1 4 197.9 3 749.3 3 817.9
Carbon Intensity (kg CO2/toe) 1 940.3 1 854.4 1 647.7 1 824.9 1 602.7 1 636.7
CO2 GDP Intensity (ton CO2/M€'10) 969.3 585.0 439.1 500.4 363.8 357.9* Total emissions without LULUCF, with ind. CO
2, including international aviation,
excl. international maritime transport.
203
EU ENERGY IN FIGURES 2017
Methodology, Sources and Notes: See Appendix 13 – No 5

5.15 LithuaniaMtoe, unless otherwise stated 1995 2000 2005 2010 2014 2015
Production 3.8 3.3 4.0 1.3 1.5 1.6
Solid Fuels 0.02 0.01 0.02 0.01 0.03 0.02
of which Hard Coal
Petroleum and Products 0.15 0.37 0.33 0.14 0.10 0.10
of which Crude and NGL 0.13 0.32 0.22 0.12 0.08 0.08
Gases
of which Natural Gas
Nuclear 3.11 2.22 2.71
Renewables 0.50 0.68 0.90 1.19 1.36 1.47
Wastes, Non-Renewable 0.02 0.02
Net Imports 5.54 4.25 5.03 5.67 5.23 5.48
Solid Fuels 0.16 0.08 0.18 0.20 0.21 0.16
of which Hard Coal 0.15 0.07 0.16 0.16 0.18 0.14
Petroleum and Products 3.58 2.22 2.62 2.61 2.28 2.69
of which Crude and NGL 3.10 4.55 8.90 9.05 7.51 8.68
Gases 2.03 2.07 2.49 2.49 2.15 2.06
of which Natural Gas 2.03 2.07 2.49 2.49 2.15 2.06
Renewables 0.00 -0.01 -0.01 -0.14 -0.07 -0.06
Electricity -0.23 -0.12 -0.26 0.52 0.66 0.62
Gross Inland Consumption 8.64 7.06 8.71 6.79 6.70 6.91
Solid Fuels 0.25 0.09 0.19 0.21 0.24 0.19
of which Hard Coal 0.22 0.07 0.15 0.17 0.19 0.15
Petroleum and Products 2.99 2.13 2.71 2.50 2.44 2.60
of which Crude and NGL 3.11 4.82 9.34 9.14 7.60 8.73
Gases 2.03 2.06 2.48 2.49 2.07 2.07
of which Natural Gas 2.03 2.06 2.48 2.49 2.07 2.07
Nuclear 3.11 2.22 2.71
Renewables 0.49 0.68 0.88 1.07 1.28 1.42
Electricity -0.23 -0.12 -0.26 0.52 0.66 0.62
Wastes, Non-Renewable 0.00 0.00 0.00 0.00 0.02 0.02
Primary Energy Consumption 8.10 6.40 7.98 6.13 5.69 5.80
Available for Final Consumption 5.13 4.28 5.39 5.48 5.90 5.99
Final Non-Energy Consumption 0.54 0.66 0.73 0.66 1.01 1.12
Final Energy Consumption 4.60 3.77 4.67 4.81 4.89 4.87
by Fuel/Product
Solid Fuels 0.23 0.08 0.18 0.21 0.23 0.18
Petroleum and Products 1.67 1.36 1.62 1.61 1.80 1.87
Gases 0.51 0.36 0.59 0.62 0.53 0.52
Biomass and Renewable Wastes 0.45 0.61 0.70 0.74 0.71 0.70
Solar
Geothermal
Electricity 0.55 0.53 0.69 0.72 0.79 0.80
Derived heat 1.19 0.83 0.91 0.92 0.84 0.80
Wastes, Non-Renewable
by Sector
Industry 1.02 0.78 1.06 0.95 1.03 0.98
Transport 1.04 1.06 1.43 1.55 1.74 1.83
Residential 1.64 1.37 1.51 1.60 1.41 1.37
Services 0.69 0.46 0.56 0.60 0.59 0.58
Agriculture and Fishing 0.20 0.10 0.11 0.11 0.11 0.10
Other 0.00 0.00 0.00 0.01 0.01 0.01
204
PART 5 Country Profiles
Methodology, Sources and Notes: See Appendix 13 – No 5

1995 2000 2005 2010 2014 2015
Installed Capacity (GW) 5.87 5.72 4.56 3.57 4.04 3.59
Combustible Fuels 2.46 2.46 2.47 2.54 2.78 2.18
Nuclear 2.73 2.37 1.18
Hydro 0.67 0.86 0.88 0.88 0.88 0.88
Wind 0.00 0.13 0.29 0.44
Solar PV 0.00 0.07 0.07
Geothermal
Tide, Wave and Ocean
Other Sources 0.01 0.03 0.03 0.03 0.03 0.03
Gross Electricity Generation (TWh) 13.90 11.43 14.78 5.75 4.40 4.93
Solid Fuels 0.00
Petroleum and Products 1.07 0.66 0.40 0.65 0.16 0.28
Gases 0.23 1.62 3.02 3.19 1.75 1.98
Nuclear 11.82 8.42 10.34
Renewables 0.75 0.64 0.83 1.67 2.20 2.35
Wastes, non-RES 0.04 0.06
Cogeneration Heat and Power
CHP Electrical Capacity (GW) 1.04 1.10 1.12 1.0
CHP Electricity Generation (TWh) 2.30 1.99 1.46 1.5
CHP in Total Electricity Generation (%) 15.5 % 34.6 % 33.2 % 31.3 %
CHP Heat Production (PJ) 19.90 19.34 13.14 12.4
Transport Fuels (ktoe)
Final Consumption Petroleum Products 1 030.8 1 050.1 1 405.3 1 469.4 1 641.7 1 728.2
Motor Gasoline 618.3 390.5 350.6 296.3 205.4 199.9
Gas/Diesel Oil 346.1 512.9 778.6 950.5 1 215.9 1 313.4
Final Consumption Biofuels 3.3 44.8 63.2 68.0
Biogasoline 0.6 10.3 5.8 9.7
Biodiesel 2.7 34.5 57.4 58.3
Main Energy Indicators
Energy Intensity (toe/M€'10) 592.4 385.5 329.5 242.2 202.5 205.4
Energy per Capita (kgoe/cap) 2 371.4 2 011.1 2 596.3 2 160.1 2 274.5 2 366.4
Final Electricity per Capita (KWh/cap) 1 744.4 1 764.5 2 377.5 2 651.8 3 138.1 3 197.9
Primary Energy Intensity (toe/M€'10) 555.1 349.4 301.8 218.5 172.0 172.3
Import Dependency (%) 63.1 % 59.4 % 56.8 % 81.8 % 78.0 % 78.4 %
of Solid Fuels 64.4 % 87.0 % 94.6 % 92.0 % 89.4 % 87.2 %
of Hard Coal 69.1 % 100.0 % 102.6 % 95.3 % 97.3 % 90.1 %
of Petroleum Fuels 114.5 % 100.4 % 91.9 % 98.7 % 93.0 % 100.7 %
of Crude and NGL 99.5 % 94.5 % 95.3 % 99.0 % 98.8 % 99.5 %
of Natural Gas 100.0 % 100.0 % 100.7 % 99.7 % 104.1 % 99.7 %
Renewables in Gross Final Energy (%)
Overall RES with Aviation Cap 16.8 % 19.6 % 23.6 % 25.8 %
RES-H&C – Heating and Cooling 29.3 % 32.5 % 40.6 % 46.1 %
RES-E – Electricity Generation 3.8 % 7.4 % 13.7 % 15.5 %
RES-T – Transport 0.6 % 3.8 % 4.3 % 4.6 %
Gases Emissions (Mio ton CO2)
CO2 Emissions* 15.14 11.88 14.23 13.86 13.11 13.39
GHGs Emissions* 22.44 19.67 23.21 20.93 20.11 20.34
Main Emissions Indicators
CO2 per Capita (kg CO2/cap) 4 156.3 3 381.6 4 240.6 4 410.6 4 453.4 4 582.6
Carbon Intensity (kg CO2/toe) 1 725.1 1 660.1 1 607.1 2 000.6 1 954.7 1 915.4
CO2 GDP Intensity (ton CO2/M€'10) 1 038.2 648.2 538.2 494.4 396.5 397.8* Total emissions without LULUCF, with ind. CO
2, including international aviation,
excl. international maritime transport.
205
EU ENERGY IN FIGURES 2017
Methodology, Sources and Notes: See Appendix 13 – No 5

5.16 LuxembourgMtoe, unless otherwise stated 1995 2000 2005 2010 2014 2015
Production 0.05 0.06 0.11 0.12 0.16 0.15
Solid Fuels
of which Hard Coal
Petroleum and Products
of which Crude and NGL
Gases 0.00 0.01
of which Natural Gas 0.00 0.01
Nuclear
Renewables 0.04 0.04 0.07 0.09 0.12 0.11
Wastes, Non-Renewable 0.01 0.03 0.04 0.03 0.03 0.03
Net Imports 3.25 3.64 4.68 4.51 4.07 4.01
Solid Fuels 0.49 0.11 0.08 0.07 0.05 0.05
of which Hard Coal 0.13 0.10 0.07 0.06 0.05 0.04
Petroleum and Products 1.77 2.37 3.14 2.85 2.69 2.62
of which Crude and NGL
Gases 0.56 0.67 1.18 1.20 0.84 0.77
of which Natural Gas 0.56 0.67 1.18 1.20 0.84 0.77
Renewables 0.04 0.07 0.09
Electricity 0.43 0.49 0.28 0.35 0.42 0.48
Gross Inland Consumption 3.32 3.65 4.80 4.64 4.22 4.18
Solid Fuels 0.49 0.11 0.08 0.07 0.05 0.05
of which Hard Coal 0.13 0.10 0.07 0.06 0.05 0.04
Petroleum and Products 1.80 2.32 3.16 2.87 2.68 2.63
of which Crude and NGL
Gases 0.56 0.67 1.18 1.20 0.85 0.77
of which Natural Gas 0.56 0.67 1.18 1.20 0.85 0.77
Nuclear
Renewables 0.04 0.04 0.07 0.13 0.19 0.21
Electricity 0.43 0.49 0.28 0.35 0.42 0.48
Wastes, Non-Renewable 0.01 0.03 0.04 0.03 0.03 0.03
Primary Energy Consumption 3.28 3.60 4.77 4.61 4.19 4.15
Available for Final Consumption 3.17 3.56 4.53 4.36 4.03 4.02
Final Non-Energy Consumption 0.05 0.06 0.03 0.03 0.04 0.03
Final Energy Consumption 3.11 3.50 4.48 4.32 4.00 3.99
by Fuel/Product
Solid Fuels 0.34 0.11 0.08 0.07 0.05 0.05
Petroleum and Products 1.75 2.26 3.11 2.84 2.65 2.60
Gases 0.58 0.61 0.63 0.68 0.58 0.60
Biomass and Renewable Wastes 0.02 0.02 0.04 0.09 0.12 0.13
Solar 0.00 0.00 0.00
Geothermal
Electricity 0.43 0.50 0.53 0.57 0.53 0.54
Derived heat 0.00 0.01 0.07 0.07 0.06 0.05
Wastes, Non-Renewable 0.00 0.01 0.02 0.01 0.02 0.01
by Sector
Industry 1.17 0.74 0.78 0.76 0.65 0.65
Transport 1.30 1.91 2.78 2.60 2.50 2.42
Residential 0.56 0.47 0.53 0.51 0.47 0.50
Services 0.07 0.36 0.37 0.43 0.36 0.40
Agriculture and Fishing 0.01 0.02 0.02 0.03 0.02 0.02
Other 0.01 0.01
206
PART 5 Country Profiles
Methodology, Sources and Notes: See Appendix 13 – No 5

1995 2000 2005 2010 2014 2015
Installed Capacity (GW) 1.25 1.22 1.68 1.71 2.02 2.02
Combustible Fuels 0.12 0.07 0.49 0.50 0.52 0.51
Nuclear
Hydro 1.13 1.13 1.13 1.13 1.33 1.33
Wind 0.01 0.04 0.04 0.06 0.06
Solar PV 0.02 0.03 0.11 0.12
Geothermal
Tide, Wave and Ocean
Other Sources
Gross Electricity Generation (TWh) 1.23 1.17 4.13 4.59 2.97 2.76
Solid Fuels
Petroleum and Products 0.01 0.00 0.00 0.00 0.00 0.00
Gases 0.34 0.22 3.11 2.92 1.45 0.83
Nuclear 0.00 0.00 0.00 0.00 0.00 0.00
Renewables 0.85 0.92 1.00 1.63 1.46 1.86
Wastes, non-RES 0.03 0.03 0.03 0.05 0.06 0.07
Cogeneration Heat and Power
CHP Electrical Capacity (GW) 0.10 0.12 0.12 0.1
CHP Electricity Generation (TWh) 0.42 0.44 0.38 0.4
CHP in Total Electricity Generation (%) 10.1 % 9.6 % 12.8 % 12.7 %
CHP Heat Production (PJ) 1.19 3.21 2.55 2.4
Transport Fuels (ktoe)
Final Consumption Petroleum Products 1 291.5 1 909.1 2 772.2 2 551.9 2 413.9 2 326.1
Motor Gasoline 529.5 595.3 514.1 359.8 313.6 293.0
Gas/Diesel Oil 569.3 990.4 1 823.5 1 759.6 1 693.6 1 573.9
Final Consumption Biofuels 0.5 42.0 71.6 82.7
Biogasoline 0.6 3.2 7.0
Biodiesel 41.0 68.3 75.6
Main Energy Indicators
Energy Intensity (toe/M€'10) 144.1 118.7 134.8 115.5 93.6 89.1
Energy per Capita (kgoe/cap) 8 194.3 8 427.1 10 407.0 9 243.8 7 680.8 7 419.7
Final Electricity per Capita (KWh/cap) 12 316.0 13 318.7 13 333.9 13 131.7 11 246.5 11 050.6
Primary Energy Intensity (toe/M€'10) 142.1 116.9 134.0 114.7 92.8 88.4
Import Dependency (%) 97.7 % 99.6 % 97.4 % 97.1 % 96.5 % 95.9 %
of Solid Fuels 100.0 % 100.0 % 100.0 % 100.0 % 100.0 % 100.0 %
of Hard Coal 100.0 % 100.0 % 100.0 % 100.0 % 100.0 % 100.0 %
of Petroleum Fuels 98.2 % 102.1 % 99.4 % 99.4 % 100.3 % 99.3 %
of Crude and NGL
of Natural Gas 100.0 % 100.0 % 100.0 % 100.0 % 99.5 % 99.4 %
Renewables in Gross Final Energy (%)
Overall RES with Aviation Cap 1.4 % 2.9 % 4.5 % 5.0 %
RES-H&C – Heating and Cooling 3.6 % 4.7 % 7.2 % 6.9 %
RES-E – Electricity Generation 3.2 % 3.8 % 5.9 % 6.2 %
RES-T – Transport 0.1 % 2.1 % 5.4 % 6.5 %
Gases Emissions (Mio ton CO2)
CO2 Emissions* 9.70 9.65 13.37 12.50 11.04 10.71
GHGs Emissions* 10.63 10.61 14.30 13.48 12.01 11.68
Main Emissions Indicators
CO2 per Capita (kg CO2/cap) 23 921.6 22 266.9 28 987.0 24 895.6 20 083.3 19 018.0
Carbon Intensity (kg CO2/toe) 2 919.3 2 642.3 2 785.3 2 693.2 2 614.7 2 563.2
CO2 GDP Intensity (ton CO2/M€'10) 420.6 313.6 375.5 311.1 244.8 228.3
* Total emissions without LULUCF, with ind. CO2, including international aviation,
excl. international maritime transport.
207
EU ENERGY IN FIGURES 2017
Methodology, Sources and Notes: See Appendix 13 – No 5

5.17 HungaryMtoe, unless otherwise stated 1995 2000 2005 2010 2014 2015
Production 13.90 11.60 10.37 11.92 11.09 11.28
Solid Fuels 3.27 2.89 1.75 1.59 1.59 1.52
of which Hard Coal
Petroleum and Products 2.33 1.70 1.46 1.18 0.93 0.94
of which Crude and NGL 2.33 1.69 1.39 1.06 0.82 0.84
Gases 3.79 2.48 2.33 2.24 1.44 1.37
of which Natural Gas 3.79 2.48 2.33 2.24 1.44 1.37
Nuclear 3.62 3.67 3.59 4.08 4.06 4.10
Renewables 0.87 0.83 1.19 2.74 2.98 3.24
Wastes, Non-Renewable 0.03 0.03 0.06 0.09 0.10 0.11
Net Imports 12.55 13.96 17.42 15.00 14.12 13.45
Solid Fuels 1.36 1.09 1.30 1.14 0.63 0.80
of which Hard Coal 1.23 1.12 1.30 1.39 1.03 1.05
Petroleum and Products 5.44 5.29 5.78 5.64 5.66 6.45
of which Crude and NGL 5.89 5.88 5.90 5.66 6.00 6.07
Gases 5.53 7.28 9.81 7.73 6.82 5.22
of which Natural Gas 5.53 7.28 9.81 7.73 6.82 5.22
Renewables 0.00 0.00 0.00 0.04 -0.14 -0.22
Electricity 0.21 0.30 0.54 0.45 1.15 1.18
Gross Inland Consumption 26.18 25.30 27.61 26.60 23.82 25.20
Solid Fuels 4.62 3.85 3.03 2.73 2.22 2.36
of which Hard Coal 1.19 1.13 1.24 1.40 1.02 1.05
Petroleum and Products 7.67 6.96 7.12 6.67 6.46 6.92
of which Crude and NGL 8.20 7.48 7.27 6.65 6.73 6.65
Gases 9.18 9.66 12.09 9.82 6.98 7.49
of which Natural Gas 9.18 9.66 12.09 9.82 6.98 7.49
Nuclear 3.62 3.67 3.59 4.08 4.06 4.10
Renewables 0.87 0.83 1.19 2.78 2.85 3.01
Electricity 0.21 0.30 0.54 0.45 1.15 1.18
Wastes, Non-Renewable 0.03 0.03 0.06 0.09 0.10 0.13
Primary Energy Consumption 24.55 23.71 25.44 24.63 21.99 23.28
Available for Final Consumption 18.16 17.72 20.37 19.41 17.71 19.10
Final Non-Energy Consumption 1.63 1.59 2.17 1.97 1.83 1.92
Final Energy Consumption 16.23 16.14 18.23 17.41 16.19 17.31
by Fuel/Product
Solid Fuels 1.16 0.67 0.71 0.50 0.35 0.43
Petroleum and Products 4.20 4.22 4.90 4.59 4.71 5.13
Gases 6.37 6.50 7.84 6.28 5.12 5.45
Biomass and Renewable Wastes 0.73 0.69 0.58 1.88 2.01 2.11
Solar 0.00 0.01 0.01 0.01
Geothermal 0.08 0.08 0.08 0.09 0.06 0.05
Electricity 2.39 2.53 2.78 2.94 2.99 3.11
Derived heat 1.30 1.45 1.31 1.09 0.91 0.97
Wastes, Non-Renewable 0.03 0.03 0.05 0.06
by Sector
Industry 3.85 3.51 3.38 2.91 3.96 4.24
Transport 2.70 3.31 4.31 4.32 4.04 4.35
Residential 6.26 5.60 6.46 6.65 5.48 5.96
Services 2.64 3.03 3.51 3.05 2.12 2.18
Agriculture and Fishing 0.66 0.67 0.56 0.49 0.60 0.58
Other 0.13 0.02 0.00 0.00 0.00 0.00
208
PART 5 Country Profiles
Methodology, Sources and Notes: See Appendix 13 – No 5

1995 2000 2005 2010 2014 2015
Installed Capacity (GW) 7.40 8.28 8.59 8.99 8.66 8.58
Combustible Fuels 5.52 6.38 6.65 6.65 6.18 6.01
Nuclear 1.84 1.85 1.87 2.00 2.00 2.00
Hydro 0.05 0.05 0.05 0.05 0.06 0.06
Wind 0.02 0.29 0.33 0.33
Solar PV 0.00 0.08 0.17
Geothermal
Tide, Wave and Ocean
Other Sources 0.01 0.01
Gross Electricity Generation (TWh) 34.02 35.19 35.76 37.37 29.39 30.34
Solid Fuels 9.08 9.59 7.02 6.23 6.00 5.79
Petroleum and Products 5.28 4.40 0.46 0.49 0.08 0.08
Gases 5.36 6.72 12.50 11.71 4.36 5.23
Nuclear 14.03 14.18 13.83 15.76 15.65 15.83
Renewables 0.22 0.24 1.87 3.02 3.14 3.21
Wastes, non-RES 0.05 0.06 0.07 0.15 0.12 0.14
Cogeneration Heat and Power
CHP Electrical Capacity (GW) 2.05 1.86 2.31 1.6
CHP Electricity Generation (TWh) 6.84 7.31 3.82 4.1
CHP in Total Electricity Generation (%) 19.1 % 19.6 % 13.0 % 13.5 %
CHP Heat Production (PJ) 47.42 42.18 25.94 24.4
Transport Fuels (ktoe)
Final Consumption Petroleum Products 2 608.7 3 220.4 4 208.3 4 020.8 3 716.4 4 047.2
Motor Gasoline 1 530.3 1 432.8 1 589.3 1 348.3 1 243.2 1 283.2
Gas/Diesel Oil 896.6 1 553.4 2 322.9 2 413.6 2 272.1 2 559.0
Final Consumption Biofuels 2.6 174.7 188.5 175.2
Biogasoline 2.6 56.5 60.4 42.6
Biodiesel 118.2 128.1 132.6
Main Energy Indicators
Energy Intensity (toe/M€'10) 376.8 314.4 278.0 270.5 227.7 233.6
Energy per Capita (kgoe/cap) 2 533.0 2 474.9 2 734.5 2 656.1 2 411.1 2 556.9
Final Electricity per Capita (KWh/cap) 2 684.0 2 880.3 3 202.6 3 415.8 3 516.8 3 672.3
Primary Energy Intensity (toe/M€'10) 353.3 294.7 256.2 250.5 210.2 215.8
Import Dependency (%) 47.9 % 55.2 % 63.1 % 56.4 % 59.3 % 53.4 %
of Solid Fuels 29.5 % 28.2 % 42.9 % 41.9 % 28.3 % 34.0 %
of Hard Coal 103.5 % 99.0 % 105.1 % 99.5 % 101.0 % 99.3 %
of Petroleum Fuels 71.0 % 76.0 % 81.2 % 84.7 % 87.7 % 93.2 %
of Crude and NGL 71.9 % 78.6 % 81.2 % 85.2 % 89.2 % 91.3 %
of Natural Gas 60.3 % 75.4 % 81.1 % 78.7 % 97.7 % 69.7 %
Renewables in Gross Final Energy (%)
Overall RES with Aviation Cap 4.5 % 12.8 % 14.6 % 14.5 %
RES-H&C – Heating and Cooling 6.0 % 18.1 % 21.2 % 21.3 %
RES-E – Electricity Generation 4.4 % 7.1 % 7.3 % 7.3 %
RES-T – Transport 0.9 % 6.0 % 6.9 % 6.2 %
Gases Emissions (Mio ton CO2)
CO2 Emissions* 62.16 59.25 61.30 52.93 44.57 47.32
GHGs Emissions* 76.03 74.17 76.59 66.12 58.41 61.64
Main Emissions Indicators
CO2 per Capita (kg CO2/cap) 6 013.3 5 796.7 6 070.6 5 285.2 4 511.8 4 801.4
Carbon Intensity (kg CO2/toe) 2 374.0 2 342.2 2 220.0 1 989.8 1 871.3 1 877.8
CO2 GDP Intensity (ton CO2/M€'10) 894.4 736.4 617.2 538.3 426.1 438.7* Total emissions without LULUCF, with ind. CO
2, including international aviation,
excl. international maritime transport.
209
EU ENERGY IN FIGURES 2017
Methodology, Sources and Notes: See Appendix 13 – No 5

5.18 MaltaMtoe, unless otherwise stated 1995 2000 2005 2010 2014 2015
Production 0.00 0.00 0.01 0.02
Solid Fuels
of which Hard Coal
Petroleum and Products 0.001
of which Crude and NGL
Gases
of which Natural Gas
Nuclear
Renewables 0.00 0.00 0.01 0.02
Wastes, Non-Renewable
Net Imports 0.84 1.46 1.63 2.37 2.05 2.23
Solid Fuels
of which Hard Coal
Petroleum and Products 0.84 1.46 1.63 2.36 2.05 2.13
of which Crude and NGL
Gases
of which Natural Gas
Renewables 0.00 0.01 0.01
Electricity
Gross Inland Consumption 0.76 0.80 0.97 0.94 0.89 0.76
Solid Fuels
of which Hard Coal
Petroleum and Products 0.76 0.80 0.97 0.93 0.87 0.65
of which Crude and NGL
Gases
of which Natural Gas
Nuclear
Renewables 0.00 0.01 0.02 0.02
Electricity
Wastes, Non-Renewable
Primary Energy Consumption 0.76 0.80 0.95 0.93 0.88 0.75
Available for Final Consumption 0.41 0.44 0.40 0.52 0.56 0.58
Final Non-Energy Consumption 0.00 0.00 0.02 0.01 0.00 0.01
Final Energy Consumption 0.46 0.44 0.38 0.50 0.55 0.57
by Fuel/Product
Solid Fuels
Petroleum and Products 0.35 0.31 0.22 0.34 0.36 0.38
Gases
Biomass and Renewable Wastes 0.00 0.01 0.01
Solar 0.00 0.00 0.00 0.00
Geothermal
Electricity 0.11 0.14 0.16 0.16 0.17 0.18
Derived heat
Wastes, Non-Renewable
by Sector
Industry 0.04 0.04 0.04 0.04 0.05 0.05
Transport 0.31 0.28 0.20 0.29 0.30 0.31
Residential 0.07 0.08 0.08 0.07 0.07 0.08
Services 0.03 0.04 0.05 0.09 0.12 0.13
Agriculture and Fishing 0.00 0.00 0.00 0.01 0.01 0.01
Other 0.00 0.00 0.02 0.00 0.00 0.00
210
PART 5 Country Profiles
Methodology, Sources and Notes: See Appendix 13 – No 5

1995 2000 2005 2010 2014 2015
Installed Capacity (GW) 0.57 0.68 0.67
Combustible Fuels 0.57 0.62 0.59
Nuclear
Hydro
Wind
Solar PV 0.00 0.06 0.07
Geothermal
Tide, Wave and Ocean
Other Sources
Gross Electricity Generation (TWh) 1.63 1.92 2.24 2.11 2.25 1.30
Solid Fuels 0.09
Petroleum and Products 1.54 1.92 2.24 2.11 2.17 1.20
Gases
Nuclear
Renewables 0.00 0.08 0.10
Wastes, non-RES
Cogeneration Heat and Power
CHP Electrical Capacity (GW)
CHP Electricity Generation (TWh)
CHP in Total Electricity Generation (%)
CHP Heat Production (PJ)
Transport Fuels (ktoe)
Final Consumption Petroleum Products 308.2 277.3 199.2 286.3 291.5 306.9
Motor Gasoline 128.7 76.1 72.9 73.9 73.9 77.0
Gas/Diesel Oil 105.5 77.9 37.9 107.8 103.7 110.9
Final Consumption Biofuels 0.5 4.9 4.5
Biogasoline
Biodiesel 0.5 4.9 4.5
Main Energy Indicators
Energy Intensity (toe/M€'10) 174.9 148.6 162.8 142.3 114.0 90.6
Energy per Capita (kgoe/cap) 2 005.7 2 060.4 2 413.9 2 268.0 2 082.8 1 760.8
Final Electricity per Capita (KWh/cap) 3 344.6 4 030.8 4 614.2 4 405.5 4 713.4 4 923.8
Primary Energy Intensity (toe/M€'10) 174.9 148.6 159.4 140.9 113.5 90.0
Import Dependency (%) 104.8 % 100.3 % 100.0 % 99.0 % 97.7 % 97.3 %
of Solid Fuels
of Hard Coal
of Petroleum Fuels 104.8 % 100.3 % 100.1 % 99.2 % 98.3 % 97.8 %
of Crude and NGL
of Natural Gas
Renewables in Gross Final Energy (%)
Overall RES with Aviation Cap 0.2 % 1.0 % 4.7 % 5.0 %
RES-H&C – Heating and Cooling 2.2 % 7.8 % 14.5 % 14.1 %
RES-E – Electricity Generation 0.0 % 0.0 % 3.3 % 4.2 %
RES-T – Transport 0.0 % 0.0 % 4.6 % 4.7 %
Gases Emissions (Mio ton CO2)
CO2 Emissions 2.69 2.78 2.97 2.94 2.82 2.11
GHGs Emissions 2.90 3.03 3.29 3.33 3.27 2.58
Main Emissions Indicators
CO2 per Capita (kg CO2/cap) 7 146.6 7 161.2 7 378.5 7 108.3 6 621.0 4 907.1
Carbon Intensity (kg CO2/toe) 3 367.0 1 914.7 1 822.8 1 232.4 1 341.8 918.8
CO2 GDP Intensity (ton CO2/M€'10) 623.1 516.4 497.6 445.9 362.5 252.4* Total emissions without LULUCF, with ind. CO
2, including international aviation,
excl. international maritime transport.
211
EU ENERGY IN FIGURES 2017
Methodology, Sources and Notes: See Appendix 13 – No 5

5.19 The NetherlandsMtoe, unless otherwise stated 1995 2000 2005 2010 2014 2015
Production 70.07 61.95 66.86 74.42 62.99 51.99
Solid Fuels
of which Hard Coal
Petroleum and Products 6.92 6.70 6.86 6.07 6.34 6.17
of which Crude and NGL 3.53 2.40 2.31 1.43 1.92 1.83
Gases 60.88 52.20 56.28 63.53 50.37 39.26
of which Natural Gas 60.88 52.20 56.28 63.53 50.37 39.26
Nuclear 1.04 1.01 1.03 1.02 1.06 1.05
Renewables 0.92 1.45 1.97 3.06 4.56 4.81
Wastes, Non-Renewable 0.32 0.58 0.72 0.73 0.68 0.69
Net Imports 17.32 34.67 37.58 29.91 29.60 46.79
Solid Fuels 8.74 7.92 8.22 9.18 9.81 12.30
of which Hard Coal 8.96 7.94 8.21 9.06 9.86 12.46
Petroleum and Products 33.97 42.40 48.43 44.58 40.79 44.17
of which Crude and NGL 59.45 60.24 60.97 59.52 54.19 59.60
Gases -26.37 -17.19 -20.94 -24.21 -21.23 -9.37
of which Natural Gas -26.37 -17.19 -20.94 -24.21 -21.23 -9.37
Renewables 0.00 -0.10 0.29 0.13 -1.19 -1.18
Electricity 0.98 1.63 1.57 0.24 1.27 0.75
Gross Inland Consumption 75.52 78.02 84.11 85.78 76.36 77.56
Solid Fuels 8.93 7.77 8.09 7.54 9.01 10.94
of which Hard Coal 9.20 7.82 8.19 7.40 9.03 11.04
Petroleum and Products 28.84 30.67 35.09 33.76 31.75 31.20
of which Crude and NGL 63.09 62.27 63.06 60.95 57.41 60.79
Gases 34.51 35.01 35.34 39.31 29.06 29.18
of which Natural Gas 34.51 35.01 35.34 39.31 29.06 29.18
Nuclear 1.04 1.01 1.03 1.02 1.06 1.05
Renewables 0.92 1.35 2.27 3.19 3.40 3.64
Electricity 0.98 1.63 1.57 0.24 1.27 0.75
Wastes, Non-Renewable 0.32 0.58 0.72 0.73 0.82 0.80
Primary Energy Consumption 64.46 66.04 68.89 70.45 62.23 64.59
Available for Final Consumption 64.32 67.80 72.28 72.69 63.61 64.59
Final Non-Energy Consumption 11.07 11.99 15.22 15.34 14.13 12.96
Final Energy Consumption 50.99 52.34 54.18 55.14 47.32 48.51
by Fuel/Product
Solid Fuels 1.45 1.38 1.55 1.36 1.50 1.53
Petroleum and Products 15.97 17.47 18.63 18.46 16.83 17.20
Gases 23.32 21.05 20.51 22.02 16.37 17.17
Biomass and Renewable Wastes 0.44 0.49 0.58 0.93 1.17 1.15
Solar 0.01 0.01 0.02 0.02 0.03 0.03
Geothermal 0.01 0.04 0.06
Electricity 6.96 8.21 9.00 9.29 8.74 8.87
Derived heat 2.83 3.70 3.85 3.00 2.61 2.46
Wastes, Non-Renewable 0.01 0.03 0.05 0.06 0.04 0.04
by Sector
Industry 16.08 16.51 17.02 15.43 14.32 14.27
Transport 12.60 14.16 15.24 15.10 13.91 14.27
Residential 11.79 10.83 10.74 12.46 9.12 9.56
Services 5.77 6.24 6.93 7.80 6.33 6.55
Agriculture and Fishing 4.63 4.50 4.17 4.22 3.55 3.76
Other 0.12 0.10 0.08 0.12 0.10 0.09
212
PART 5 Country Profiles
Methodology, Sources and Notes: See Appendix 13 – No 5

1995 2000 2005 2010 2014 2015
Installed Capacity (GW) 19.03 21.06 21.80 26.69 31.76 33.87
Combustible Fuels 18.20 20.07 19.97 23.74 27.29 28.40
Nuclear 0.51 0.45 0.45 0.51 0.49 0.49
Hydro 0.04 0.04 0.04 0.04 0.04 0.04
Wind 0.25 0.45 1.22 2.24 2.87 3.39
Solar PV 0.00 0.01 0.05 0.09 1.05 1.52
Geothermal
Tide, Wave and Ocean
Other Sources 0.05 0.05 0.07 0.07 0.04 0.04
Gross Electricity Generation (TWh) 81.17 89.63 99.92 119.27 103.42 110.07
Solid Fuels 27.40 24.28 23.50 22.59 29.49 38.44
Petroleum and Products 2.81 2.64 2.26 1.25 1.91 1.43
Gases 44.63 54.36 61.03 78.55 54.46 49.39
Nuclear 4.02 3.93 4.00 3.97 4.09 4.08
Renewables 1.41 2.97 7.45 11.20 11.71 13.70
Wastes, non-RES 0.60 1.21 1.43 1.56 1.63 1.63
Cogeneration Heat and Power
CHP Electrical Capacity (GW) 7.16 9.30 9.18 9.2
CHP Electricity Generation (TWh) 29.47 39.24 29.96 29.8
CHP in Total Electricity Generation (%) 29.4 % 33.2 % 29.0 % 27.1 %
CHP Heat Production (PJ) 220.28 233.61 196.28 189.6
Transport Fuels (ktoe)
Final Consumption Petroleum Products 12 471.7 14 017.3 15 097.4 14 711.6 13 379.2 13 788.4
Motor Gasoline 4 205.8 4 233.1 4 313.0 4 161.7 3 801.2 3 862.1
Gas/Diesel Oil 4 840.3 5 861.2 6 675.1 6 783.2 5 730.7 5 892.8
Final Consumption Biofuels 229.7 349.2 297.4
Biogasoline 135.1 128.3 141.9
Biodiesel 94.6 220.9 155.5
Main Energy Indicators
Energy Intensity (toe/M€'10) 168.3 140.6 141.9 135.8 118.7 118.3
Energy per Capita (kgoe/cap) 4 896.3 4 918.1 5 158.1 5 175.4 4 537.3 4 589.0
Final Electricity per Capita (KWh/cap) 5 244.7 6 020.1 6 419.1 6 515.8 6 038.9 6 101.0
Primary Energy Intensity (toe/M€'10) 143.7 119.0 116.2 111.5 96.8 98.5
Import Dependency (%) 20.1 % 38.1 % 37.8 % 30.1 % 33.3 % 52.1 %
of Solid Fuels 97.9 % 102.0 % 101.5 % 121.7 % 108.9 % 112.4 %
of Hard Coal 97.4 % 101.5 % 100.3 % 122.3 % 109.3 % 112.8 %
of Petroleum Fuels 85.7 % 97.4 % 96.2 % 94.2 % 91.9 % 101.5 %
of Crude and NGL 94.2 % 96.7 % 96.7 % 97.6 % 94.4 % 98.0 %
of Natural Gas -76.4 % -49.1 % -59.3 % -61.6 % -73.1 % -32.1 %
Renewables in Gross Final Energy (%)
Overall RES with Aviation Cap 2.5 % 3.9 % 5.5 % 5.8 %
RES-H&C – Heating and Cooling 2.4 % 3.1 % 5.2 % 5.5 %
RES-E – Electricity Generation 6.3 % 9.6 % 10.0 % 11.1 %
RES-T – Transport 0.5 % 2.6 % 6.2 % 5.3 %
Gases Emissions (Mio ton CO2)
CO2 Emissions* 180.93 181.86 188.35 192.99 169.08 176.70
GHGs Emissions* 239.18 229.68 225.36 224.45 198.50 206.71
Main Emissions Indicators
CO2 per Capita (kg CO2/cap) 11 730.1 11 464.0 11 551.3 11 643.4 10 046.7 10 455.4
Carbon Intensity (kg CO2/toe) 2 096.0 2 000.9 1 895.4 1 943.0 1 899.8 1 966.3
CO2 GDP Intensity (ton CO2/M€'10) 403.3 327.8 317.7 305.6 262.9 269.5* Total emissions without LULUCF, with ind. CO
2, including international aviation,
excl. international maritime transport.
213
EU ENERGY IN FIGURES 2017
Methodology, Sources and Notes: See Appendix 13 – No 5

5.20 AustriaMtoe, unless otherwise stated 1995 2000 2005 2010 2014 2015
Production 8.77 9.79 9.80 11.85 11.97 11.93
Solid Fuels 0.34 0.29
of which Hard Coal 0.00
Petroleum and Products 1.08 1.09 1.00 1.04 0.97 0.87
of which Crude and NGL 1.07 1.07 0.97 1.00 0.97 0.87
Gases 1.27 1.55 1.33 1.40 1.09 1.04
of which Natural Gas 1.27 1.55 1.33 1.40 1.09 1.04
Nuclear
Renewables 5.85 6.61 7.08 8.71 9.22 9.30
Wastes, Non-Renewable 0.23 0.25 0.39 0.70 0.69 0.73
Net Imports 18.02 19.01 24.52 21.57 21.48 20.21
Solid Fuels 2.64 3.02 3.97 3.36 3.06 2.71
of which Hard Coal 2.05 2.34 2.99 2.48 2.20 2.08
Petroleum and Products 10.10 10.84 13.21 11.50 10.91 11.25
of which Crude and NGL 7.56 7.22 7.88 6.70 7.62 8.02
Gases 5.46 5.31 7.15 6.12 6.24 4.99
of which Natural Gas 5.46 5.31 7.15 6.12 6.24 4.99
Renewables 0.04 -0.03 -0.04 0.39 0.47 0.41
Electricity -0.21 -0.12 0.23 0.20 0.80 0.87
Gross Inland Consumption 27.11 29.02 34.13 34.29 32.47 33.25
Solid Fuels 3.48 3.60 4.00 3.38 3.03 3.18
of which Hard Coal 2.32 2.56 2.80 2.54 2.16 2.51
Petroleum and Products 11.29 12.13 14.40 12.77 11.90 11.96
of which Crude and NGL 8.63 8.31 8.90 7.78 8.56 8.83
Gases 6.44 6.59 8.09 8.12 6.45 6.88
of which Natural Gas 6.44 6.59 8.09 8.12 6.45 6.88
Nuclear
Renewables 5.89 6.57 7.03 9.11 9.60 9.65
Electricity -0.21 -0.12 0.23 0.20 0.80 0.87
Wastes, Non-Renewable 0.23 0.25 0.39 0.70 0.69 0.73
Primary Energy Consumption 25.73 27.30 32.42 32.45 30.45 31.33
Available for Final Consumption 22.74 25.45 29.57 30.05 28.76 29.30
Final Non-Energy Consumption 1.38 1.72 1.71 1.84 2.02 1.92
Final Energy Consumption 21.37 23.69 27.84 28.17 26.74 27.37
by Fuel/Product
Solid Fuels 1.58 1.40 1.40 1.25 1.27 1.46
Petroleum and Products 8.83 9.78 12.04 10.50 9.69 9.84
Gases 3.79 4.50 5.19 5.32 4.88 4.88
Biomass and Renewable Wastes 2.15 2.34 2.67 3.54 3.47 3.64
Solar 0.04 0.06 0.09 0.16 0.18 0.18
Geothermal 0.00 0.01 0.01 0.01 0.01 0.01
Electricity 4.02 4.43 4.94 5.19 5.22 5.23
Derived heat 0.85 1.02 1.28 1.84 1.74 1.83
Wastes, Non-Renewable 0.12 0.15 0.22 0.36 0.29 0.30
by Sector
Industry 6.41 7.30 8.74 9.24 9.07 9.12
Transport 5.83 6.98 9.04 8.76 8.72 9.00
Residential 6.32 6.34 6.19 6.33 5.62 5.98
Services 2.27 2.55 3.33 3.34 2.80 2.73
Agriculture and Fishing 0.54 0.53 0.54 0.51 0.53 0.55
Other
214
PART 5 Country Profiles
Methodology, Sources and Notes: See Appendix 13 – No 5

1995 2000 2005 2010 2014 2015
Installed Capacity (GW) 17.40 17.80 18.90 21.19 24.05 24.44
Combustible Fuels 6.13 6.13 6.46 7.35 7.86 7.67
Nuclear
Hydro 11.26 11.61 11.63 12.71 13.29 13.35
Wind 0.00 0.05 0.78 0.98 2.11 2.49
Solar PV 0.00 0.01 0.03 0.15 0.79 0.94
Geothermal 0.00 0.00 0.00 0.00
Tide, Wave and Ocean
Other Sources
Gross Electricity Generation (TWh) 56.23 61.26 66.83 71.13 65.44 65.30
Solid Fuels 4.32 5.73 7.17 4.92 2.96 2.98
Petroleum and Products 2.12 1.70 1.64 1.27 0.60 0.86
Gases 9.76 8.86 14.35 16.14 7.36 9.88
Nuclear
Renewables 39.95 44.82 43.37 48.18 53.77 50.78
Wastes, non-RES 0.07 0.13 0.30 0.61 0.74 0.78
Cogeneration Heat and Power
CHP Electrical Capacity (GW) 2.17 3.16 3.99 2.8
CHP Electricity Generation (TWh) 7.68 10.96 8.49 9.0
CHP in Total Electricity Generation (%) 11.6 % 15.4 % 13.0 % 13.8 %
CHP Heat Production (PJ) 100.11 110.61 102.45 105.9
Transport Fuels (ktoe)
Final Consumption Petroleum Products 5 444.1 6 515.4 8 537.1 7 762.8 7 637.8 7 818.6
Motor Gasoline 2 429.1 2 015.6 2 108.7 1 700.3 1 529.6 1 545.5
Gas/Diesel Oil 2 537.4 3 891.7 5 720.7 5 330.1 5 398.7 5 516.2
Final Consumption Biofuels 10.3 15.7 48.9 495.4 587.0 645.2
Biogasoline 78.9 63.0 60.1
Biodiesel 10.3 15.7 48.9 416.5 524.0 585.1
Main Energy Indicators
Energy Intensity (toe/M€'10) 124.0 114.4 123.5 116.4 105.6 107.1
Energy per Capita (kgoe/cap) 3 413.0 3 626.9 4 161.3 4 106.0 3 816.7 3 877.0
Final Electricity per Capita (KWh/cap) 5 880.5 6 440.9 7 000.8 7 222.2 7 132.8 7 090.9
Primary Energy Intensity (toe/M€'10) 117.7 107.6 117.3 110.2 99.0 100.9
Import Dependency (%) 66.4 % 65.4 % 71.8 % 62.9 % 66.1 % 60.8 %
of Solid Fuels 75.7 % 83.9 % 99.3 % 99.4 % 100.9 % 85.2 %
of Hard Coal 88.3 % 91.6 % 107.1 % 97.5 % 101.7 % 82.9 %
of Petroleum Fuels 89.3 % 89.1 % 91.6 % 89.9 % 91.6 % 94.0 %
of Crude and NGL 87.6 % 86.9 % 88.5 % 86.2 % 89.0 % 90.8 %
of Natural Gas 84.8 % 80.6 % 88.5 % 75.3 % 96.8 % 72.5 %
Renewables in Gross Final Energy (%)
Overall RES with Aviation Cap 23.9 % 30.4 % 32.8 % 33.0 %
RES-H&C – Heating and Cooling 22.3 % 29.5 % 32.0 % 32.0 %
RES-E – Electricity Generation 62.0 % 65.7 % 70.1 % 70.3 %
RES-T – Transport 4.8 % 10.9 % 10.9 % 11.4 %
Gases Emissions (Mio ton CO2)
CO2 Emissions* 65.53 68.04 81.33 74.60 66.18 68.85
GHGs Emissions* 81.16 82.25 94.62 87.13 78.38 81.00
Main Emissions Indicators
CO2 per Capita (kg CO2/cap) 8 250.0 8 502.8 9 916.5 8 932.0 7 779.7 8 028.2
Carbon Intensity (kg CO2/toe) 2 415.5 2 342.5 2 381.2 2 174.0 2 037.1 2 069.7
CO2 GDP Intensity (ton CO2/M€'10) 299.8 268.2 294.4 253.2 215.2 221.8* Total emissions without LULUCF, with ind. CO
2, including international aviation,
excl. international maritime transport.
215
EU ENERGY IN FIGURES 2017
Methodology, Sources and Notes: See Appendix 13 – No 5

5.21 PolandMtoe, unless otherwise stated 1995 2000 2005 2010 2014 2015
Production 99.38 79.59 78.59 67.39 67.91 68.33
Solid Fuels 91.07 71.30 68.86 55.38 54.03 53.87
of which Hard Coal 78.19 59.18 56.12 43.82 41.60 41.57
Petroleum and Products 0.37 1.06 1.14 1.06 1.56 1.62
of which Crude and NGL 0.27 0.63 0.84 0.68 0.93 0.91
Gases 3.18 3.32 3.89 3.70 3.73 3.68
of which Natural Gas 3.17 3.31 3.88 3.69 3.73 3.68
Nuclear
Renewables 3.92 3.81 4.55 6.85 8.07 8.64
Wastes, Non-Renewable 0.84 0.10 0.16 0.40 0.52 0.52
Net Imports -1.16 8.77 15.94 31.53 27.05 28.02
Solid Fuels -21.25 -16.35 -13.04 -2.81 -4.29 -5.61
of which Hard Coal -18.94 -13.85 -9.70 1.80 0.43 -0.96
Petroleum and Products 14.52 19.07 21.47 25.16 20.97 23.35
of which Crude and NGL 11.95 17.36 17.54 22.28 22.83 25.85
Gases 5.81 6.61 8.53 8.87 9.65 9.95
of which Natural Gas 5.81 6.61 8.53 8.87 9.65 9.95
Renewables 0.00 0.00 -0.07 0.43 0.54 0.36
Electricity -0.24 -0.55 -0.96 -0.12 0.19 -0.03
Gross Inland Consumption 98.83 88.65 92.22 100.68 94.33 95.43
Solid Fuels 70.31 56.29 54.61 54.61 49.24 48.26
of which Hard Coal 59.72 46.35 45.55 47.94 41.39 40.69
Petroleum and Products 15.00 19.04 21.69 25.71 22.37 23.92
of which Crude and NGL 12.31 17.51 18.03 22.64 23.66 25.73
Gases 9.00 9.96 12.24 12.81 13.41 13.78
of which Natural Gas 9.00 9.96 12.24 12.81 13.40 13.78
Nuclear
Renewables 3.92 3.80 4.49 7.27 8.61 8.99
Electricity -0.24 -0.55 -0.96 -0.12 0.19 -0.03
Wastes, Non-Renewable 0.84 0.10 0.16 0.40 0.52 0.52
Primary Energy Consumption 95.12 84.29 87.65 95.72 89.17 90.00
Available for Final Consumption 67.25 58.57 62.71 71.09 66.19 66.52
Final Non-Energy Consumption 3.71 4.36 4.57 4.96 5.16 5.43
Final Energy Consumption 62.94 55.21 58.47 66.33 61.60 62.25
by Fuel/Product
Solid Fuels 22.58 13.22 12.21 13.77 12.03 11.69
Petroleum and Products 11.65 15.50 17.84 20.73 18.60 19.19
Gases 7.76 7.57 8.77 9.46 8.94 8.98
Biomass and Renewable Wastes 3.73 3.52 3.85 5.22 5.25 5.39
Solar 0.01 0.04 0.05
Geothermal 0.00 0.01 0.01 0.02 0.02
Electricity 7.71 8.43 9.03 10.21 10.78 10.99
Derived heat 8.82 6.89 6.63 6.55 5.45 5.46
Wastes, Non-Renewable 0.70 0.08 0.14 0.38 0.50 0.49
by Sector
Industry 23.03 18.45 15.32 14.10 15.03 15.05
Transport 8.30 9.92 12.54 17.70 16.37 17.24
Residential 22.67 17.19 19.45 21.97 18.97 18.84
Services 4.16 4.97 6.73 8.83 7.79 7.81
Agriculture and Fishing 4.78 4.64 4.43 3.73 3.43 3.31
Other 0.01 0.04 0.00 0.00 0.00 0.00
216
PART 5 Country Profiles
Methodology, Sources and Notes: See Appendix 13 – No 5

1995 2000 2005 2010 2014 2015
Installed Capacity (GW) 29.48 30.56 32.26 33.36 35.99 37.32
Combustible Fuels 27.42 28.37 29.78 29.91 29.76 29.96
Nuclear
Hydro 2.06 2.18 2.32 2.34 2.36 2.37
Wind 0.00 0.12 1.11 3.84 4.89
Solar PV 0.03 0.11
Geothermal
Tide, Wave and Ocean
Other Sources 0.04 0.00 0.00 0.00
Gross Electricity Generation (TWh) 139.01 145.18 156.94 157.66 159.06 164.94
Solid Fuels 131.77 135.89 141.88 136.51 129.52 130.52
Petroleum and Products 1.52 1.92 2.76 2.89 1.59 2.12
Gases 1.50 2.96 6.53 6.67 7.36 8.83
Nuclear
Renewables 3.92 4.34 5.42 11.46 20.39 23.29
Wastes, non-RES 0.30 0.08 0.04 0.05 0.05 0.08
Cogeneration Heat and Power
CHP Electrical Capacity (GW) 8.31 8.69 8.55 8.6
CHP Electricity Generation (TWh) 26.30 27.71 24.09 26.5
CHP in Total Electricity Generation (%) 16.8 % 17.6 % 15.1 % 16.1 %
CHP Heat Production (PJ) 275.43 277.10 237.65 238.6
Transport Fuels (ktoe)
Final Consumption Petroleum Products 7 890.9 9 459.2 11 911.1 16 319.9 15 044.0 15 834.6
Motor Gasoline 4 610.3 5 319.2 4 229.6 4 243.3 3 535.4 3 654.2
Gas/Diesel Oil 2 796.3 3 395.7 5 657.1 9 740.1 9 153.7 9 817.5
Final Consumption Biofuels 49.3 867.4 705.3 780.3
Biogasoline 33.9 169.6 132.8 153.5
Biodiesel 15.4 697.8 572.5 626.8
Main Energy Indicators
Energy Intensity (toe/M€'10) 518.7 360.0 321.7 278.3 233.3 227.3
Energy per Capita (kgoe/cap) 2 561.6 2 316.8 2 415.9 2 647.9 2 481.1 2 511.1
Final Electricity per Capita (KWh/cap) 2 324.8 2 563.1 2 750.7 3 121.5 3 297.1 3 363.2
Primary Energy Intensity (toe/M€'10) 499.2 342.3 305.8 264.6 220.6 214.4
Import Dependency (%) -1.2 % 9.9 % 17.2 % 31.3 % 28.6 % 29.3 %
of Solid Fuels -30.2 % -29.1 % -23.9 % -5.2 % -8.7 % -11.6 %
of Hard Coal -31.7 % -29.9 % -21.3 % 3.7 % 1.0 % -2.4 %
of Petroleum Fuels 95.9 % 98.7 % 97.5 % 97.0 % 93.1 % 96.8 %
of Crude and NGL 97.1 % 99.1 % 97.3 % 98.4 % 96.5 % 100.5 %
of Natural Gas 64.6 % 66.3 % 69.7 % 69.3 % 72.0 % 72.2 %
Renewables in Gross Final Energy (%)
Overall RES with Aviation Cap 6.9 % 9.3 % 11.5 % 11.8 %
RES-H&C – Heating and Cooling 10.2 % 11.7 % 14.0 % 14.3 %
RES-E – Electricity Generation 2.7 % 6.6 % 12.4 % 13.4 %
RES-T – Transport 1.6 % 6.6 % 6.2 % 6.4 %
Gases Emissions (Mio ton CO2)
CO2 Emissions* 362.06 317.87 322.56 333.56 309.29 312.51
GHGs Emissions* 439.70 391.37 399.84 408.42 384.68 387.73
Main Emissions Indicators
CO2 per Capita (kg CO2/cap) 9 384.6 8 307.4 8 449.7 8 772.7 8 135.5 8 222.8
Carbon Intensity (kg CO2/toe) 3 658.4 3 574.4 3 485.5 3 306.0 3 273.9 3 268.2
CO2 GDP Intensity (ton CO2/M€'10) 1 900.3 1 291.0 1 125.2 921.9 765.1 744.4* Total emissions without LULUCF, with ind. CO
2, including international aviation,
excl. international maritime transport.
217
EU ENERGY IN FIGURES 2017
Methodology, Sources and Notes: See Appendix 13 – No 5

5.22 PortugalMtoe, unless otherwise stated 1995 2000 2005 2010 2014 2015
Production 3.38 3.89 3.62 5.80 6.19 5.51
Solid Fuels
of which Hard Coal
Petroleum and Products 0.21 0.20
of which Crude and NGL
Gases 0.07 0.05
of which Natural Gas
Nuclear
Renewables 3.32 3.76 3.48 5.64 5.84 5.18
Wastes, Non-Renewable 0.09 0.14 0.16 0.15 0.12
Net Imports 18.02 22.07 24.85 18.59 16.15 18.30
Solid Fuels 3.81 3.91 3.23 1.63 2.60 3.21
of which Hard Coal 3.84 3.97 3.22 1.63 2.59 3.20
Petroleum and Products 14.14 16.04 17.14 12.44 10.29 11.01
of which Crude and NGL 13.04 11.63 13.46 11.39 10.61 14.18
Gases 0.00 2.04 3.89 4.51 3.48 4.07
of which Natural Gas 0.00 2.04 3.89 4.51 3.48 4.07
Renewables -0.21 -0.32 -0.21
Electricity 0.08 0.08 0.59 0.23 0.08 0.19
Gross Inland Consumption 20.64 25.29 27.48 24.28 22.09 23.00
Solid Fuels 3.60 3.81 3.35 1.66 2.68 3.21
of which Hard Coal 3.63 3.84 3.35 1.66 2.67 3.20
Petroleum and Products 13.57 15.48 16.17 12.29 10.17 10.40
of which Crude and NGL 13.04 11.76 13.44 11.53 10.86 14.06
Gases 0.07 2.08 3.75 4.49 3.47 4.07
of which Natural Gas 0.00 2.03 3.75 4.49 3.47 4.07
Nuclear
Renewables 3.32 3.76 3.48 5.46 5.51 4.97
Electricity 0.08 0.08 0.59 0.23 0.08 0.20
Wastes, Non-Renewable 0.00 0.09 0.14 0.16 0.17 0.16
Primary Energy Consumption 18.55 22.89 24.89 22.55 20.65 21.66
Available for Final Consumption 15.92 20.22 21.69 19.81 17.18 17.29
Final Non-Energy Consumption 2.08 2.39 2.59 1.73 1.44 1.34
Final Energy Consumption 13.85 17.92 19.01 18.10 15.77 16.04
by Fuel/Product
Solid Fuels 0.54 0.47 0.02 0.05 0.01 0.01
Petroleum and Products 8.27 10.71 10.81 9.28 7.83 7.96
Gases 0.11 0.87 1.31 1.56 1.55 1.64
Biomass and Renewable Wastes 2.40 2.41 2.51 2.48 2.05 2.10
Solar 0.02 0.02 0.02 0.05 0.08 0.08
Geothermal 0.00 0.00 0.00 0.00 0.00 0.00
Electricity 2.48 3.30 3.98 4.29 3.89 3.94
Derived heat 0.04 0.13 0.33 0.34 0.27 0.24
Wastes, Non-Renewable 0.03 0.06 0.09 0.06
by Sector
Industry 4.93 6.32 5.80 5.45 4.41 4.45
Transport 4.94 6.64 7.19 7.30 6.44 6.61
Residential 2.56 2.80 3.22 2.97 2.57 2.54
Services 0.91 1.40 2.20 1.88 1.90 1.96
Agriculture and Fishing 0.49 0.73 0.58 0.46 0.43 0.44
Other 0.03 0.04 0.03 0.03 0.03 0.04
218
PART 5 Country Profiles
Methodology, Sources and Notes: See Appendix 13 – No 5

1995 2000 2005 2010 2014 2015
Installed Capacity (GW) 9.38 10.91 13.37 18.93 19.13 19.63
Combustible Fuels 4.89 6.28 7.28 9.87 8.11 8.05
Nuclear
Hydro 4.48 4.54 5.02 5.11 5.72 6.17
Wind 0.01 0.08 1.06 3.80 4.86 4.94
Solar PV 0.00 0.00 0.13 0.42 0.45
Geothermal 0.01 0.01 0.01 0.03 0.03 0.03
Tide, Wave and Ocean 0.00
Other Sources
Gross Electricity Generation (TWh) 33.27 43.76 46.58 54.09 52.80 52.42
Solid Fuels 13.41 14.60 15.23 7.10 11.95 14.73
Petroleum and Products 10.31 8.42 8.79 3.01 1.36 1.31
Gases 0.05 7.23 13.61 14.90 6.83 10.56
Nuclear
Renewables 9.50 13.26 8.65 28.75 32.40 25.51
Wastes, non-RES 0.00 0.26 0.31 0.33 0.25 0.30
Cogeneration Heat and Power
CHP Electrical Capacity (GW) 1.08 1.31 1.38 1.3
CHP Electricity Generation (TWh) 5.42 6.36 6.80 6.5
CHP in Total Electricity Generation (%) 11.6 % 11.8 % 12.9 % 12.3 %
CHP Heat Production (PJ) 59.61 67.22 69.30 59.3
Transport Fuels (ktoe)
Final Consumption Petroleum Products 4 912.7 6 603.5 7 136.5 6 940.3 6 142.2 6 245.3
Motor Gasoline 2 022.4 2 271.7 1 934.6 1 450.3 1 144.5 1 099.3
Gas/Diesel Oil 2 272.7 3 522.9 4 285.6 4 366.0 3 824.1 3 885.9
Final Consumption Biofuels 309.1 261.2 327.6
Biogasoline 2.0 22.2
Biodiesel 304.9 254.5 302.2
Main Energy Indicators
Energy Intensity (toe/M€'10) 150.8 151.3 157.4 135.0 130.6 133.9
Energy per Capita (kgoe/cap) 2 061.7 2 467.1 2 618.0 2 296.5 2 118.0 2 216.6
Final Electricity per Capita (KWh/cap) 2 877.9 3 744.1 4 413.9 4 718.2 4 334.3 4 415.7
Primary Energy Intensity (toe/M€'10) 135.6 137.0 142.6 125.3 122.1 126.1
Import Dependency (%) 85.3 % 85.1 % 88.6 % 75.1 % 71.2 % 77.4 %
of Solid Fuels 105.8 % 102.9 % 96.3 % 98.3 % 96.9 % 100.0 %
of Hard Coal 105.9 % 103.4 % 96.3 % 98.2 % 96.9 % 100.0 %
of Petroleum Fuels 100.6 % 99.4 % 102.3 % 97.5 % 95.5 % 99.7 %
of Crude and NGL 100.0 % 99.0 % 100.2 % 98.8 % 97.7 % 100.9 %
of Natural Gas 100.2 % 103.8 % 100.4 % 100.1 % 99.8 %
Renewables in Gross Final Energy (%)
Overall RES with Aviation Cap 19.5 % 24.2 % 27.0 % 28.0 %
RES-H&C – Heating and Cooling 32.1 % 33.9 % 34.0 % 33.4 %
RES-E – Electricity Generation 27.7 % 40.7 % 52.1 % 52.6 %
RES-T – Transport 0.5 % 5.6 % 3.7 % 7.4 %
Gases Emissions (Mio ton CO2)
CO2 Emissions* 56.36 67.90 71.60 55.42 50.91 55.33
GHGs Emissions* 71.68 84.52 88.61 72.12 67.39 72.09
Main Emissions Indicators
CO2 per Capita (kg CO2/cap) 5 631.3 6 624.7 6 822.1 5 241.5 4 882.1 5 333.5
Carbon Intensity (kg CO2/toe) 2 668.7 2 616.7 2 552.4 2 240.1 2 243.6 2 340.8
CO2 GDP Intensity (ton CO2/M€'10) 411.8 406.2 410.3 308.0 301.0 322.1* Total emissions without LULUCF, with ind. CO
2, including international aviation,
excl. international maritime transport.
219
EU ENERGY IN FIGURES 2017
Methodology, Sources and Notes: See Appendix 13 – No 5

5.23 RomaniaMtoe, unless otherwise stated 1995 2000 2005 2010 2014 2015
Production 32.31 28.47 28.22 27.82 26.66 26.74
Solid Fuels 7.89 5.60 5.80 5.90 4.45 4.71
of which Hard Coal 0.65 0.16 0.02 0.00 0.04 0.01
Petroleum and Products 6.82 6.36 6.23 4.57 4.28 4.24
of which Crude and NGL 6.72 6.30 5.58 4.52 4.18 4.13
Gases 14.45 10.97 9.70 8.62 8.77 8.79
of which Natural Gas 14.45 10.97 9.70 8.62 8.77 8.79
Nuclear 0.00 1.41 1.43 3.00 3.01 3.00
Renewables 2.80 4.04 4.98 5.71 6.09 5.94
Wastes, Non-Renewable 0.37 0.09 0.09 0.03 0.07 0.07
Net Imports 14.03 7.99 10.84 7.83 5.50 5.54
Solid Fuels 2.86 1.92 2.94 1.23 1.00 1.03
of which Hard Coal 3.01 1.65 2.42 0.47 0.41 0.47
Petroleum and Products 6.36 3.42 3.96 4.84 4.61 4.89
of which Crude and NGL 8.31 4.76 8.86 6.03 6.86 6.72
Gases 4.79 2.71 4.19 1.82 0.47 0.16
of which Natural Gas 4.79 2.71 4.19 1.82 0.47 0.16
Renewables 0.00 0.00 0.00 0.14 0.04 0.04
Electricity 0.03 -0.06 -0.25 -0.20 -0.61 -0.58
Gross Inland Consumption 46.31 36.65 39.21 35.80 32.16 32.41
Solid Fuels 10.79 7.49 8.79 7.01 5.75 5.91
of which Hard Coal 3.69 1.72 2.37 0.47 0.47 0.49
Petroleum and Products 13.09 9.99 10.29 9.31 8.47 9.10
of which Crude and NGL 15.14 10.96 14.44 10.67 10.71 10.78
Gases 19.24 13.68 13.92 10.79 9.35 8.93
of which Natural Gas 19.24 13.68 13.92 10.79 9.35 8.93
Nuclear 1.41 1.43 3.00 3.01 3.00
Renewables 2.80 4.04 4.94 5.86 6.12 5.97
Electricity 0.03 -0.06 -0.25 -0.20 -0.61 -0.58
Wastes, Non-Renewable 0.37 0.10 0.09 0.03 0.07 0.07
Primary Energy Consumption 45.07 34.77 36.74 34.33 30.64 31.29
Available for Final Consumption 30.36 25.03 26.87 24.77 22.76 23.04
Final Non-Energy Consumption 1.24 1.88 2.47 1.47 1.52 1.13
Final Energy Consumption 26.97 22.77 24.71 22.59 21.72 21.89
by Fuel/Product
Solid Fuels 1.64 1.05 1.61 0.94 0.72 0.84
Petroleum and Products 5.70 5.53 6.63 6.19 6.80 7.01
Gases 10.34 6.91 7.75 6.19 5.64 5.47
Biomass and Renewable Wastes 1.28 2.74 3.17 4.02 3.60 3.51
Solar 0.00 0.00 0.00
Geothermal 0.00 0.01 0.02 0.02 0.02 0.02
Electricity 3.13 2.92 3.34 3.55 3.60 3.70
Derived heat 4.68 3.57 2.14 1.65 1.27 1.27
Wastes, Non-Renewable 0.20 0.06 0.06 0.03 0.07 0.07
by Sector
Industry 15.15 9.30 10.01 6.88 6.47 6.47
Transport 3.11 3.46 4.28 5.12 5.47 5.58
Residential 6.33 8.41 7.99 8.10 7.41 7.38
Services 0.51 0.67 1.67 1.88 1.77 1.76
Agriculture and Fishing 1.00 0.40 0.22 0.39 0.42 0.46
Other 0.87 0.54 0.56 0.21 0.18 0.25
220
PART 5 Country Profiles
Methodology, Sources and Notes: See Appendix 13 – No 5

1995 2000 2005 2010 2014 2015
Installed Capacity (GW) 6.00 6.12 18.95 19.91 23.88 23.83
Combustible Fuels 11.95 11.64 11.32 11.23
Nuclear 0.71 1.41 1.41 1.41
Hydro 6.00 6.12 6.29 6.47 6.61 6.73
Wind 0.00 0.39 3.24 3.13
Solar PV 1.29 1.33
Geothermal
Tide, Wave and Ocean
Other Sources
Gross Electricity Generation (TWh) 59.27 51.93 59.41 60.98 65.68 66.30
Solid Fuels 20.59 18.93 21.92 20.68 17.76 18.13
Petroleum and Products 5.80 3.40 1.89 0.69 0.49 0.47
Gases 15.97 9.00 9.83 7.32 8.15 9.48
Nuclear 5.46 5.56 11.62 11.68 11.64
Renewables 16.69 14.78 20.21 20.66 27.60 26.58
Wastes, non-RES 0.00 0.00 0.00 0.00 0.00 0.00
Cogeneration Heat and Power
CHP Electrical Capacity (GW) 5.25 4.58 1.82 1.8
CHP Electricity Generation (TWh) 15.55 6.54 6.10 5.6
CHP in Total Electricity Generation (%) 26.2 % 10.8 % 9.3 % 8.4 %
CHP Heat Production (PJ) 95.39 69.00 55.36 51.0
Transport Fuels (ktoe)
Final Consumption Petroleum Products 2 911.9 3 273.3 4 103.3 4 881.6 5 211.4 5 280.2
Motor Gasoline 1 082.1 1 321.2 1 599.8 1 412.3 1 354.1 1 268.9
Gas/Diesel Oil 1 583.1 1 756.2 2 298.3 3 172.3 3 567.7 3 676.1
Final Consumption Biofuels 115.3 166.6 202.5
Biogasoline 46.7 41.6 61.5
Biodiesel 68.6 125.0 141.0
Main Energy Indicators
Energy Intensity (toe/M€'10) 550.9 441.7 357.1 282.5 233.8 226.7
Energy per Capita (kgoe/cap) 2 038.8 1 632.1 1 833.6 1 764.0 1 612.1 1 631.2
Final Electricity per Capita (KWh/cap) 1 600.6 1 511.4 1 817.3 2 035.9 2 100.8 2 165.5
Primary Energy Intensity (toe/M€'10) 536.2 419.0 334.7 270.8 222.7 218.8
Import Dependency (%) 30.3 % 21.8 % 27.6 % 21.9 % 17.1 % 17.1 %
of Solid Fuels 26.5 % 25.6 % 33.4 % 17.6 % 17.4 % 17.4 %
of Hard Coal 81.7 % 96.0 % 102.2 % 100.9 % 87.0 % 95.3 %
of Petroleum Fuels 48.6 % 34.2 % 38.5 % 51.9 % 54.0 % 53.4 %
of Crude and NGL 54.9 % 43.5 % 61.3 % 56.5 % 64.1 % 62.4 %
of Natural Gas 24.9 % 19.8 % 30.1 % 16.8 % 5.0 % 1.8 %
Renewables in Gross Final Energy (%)
Overall RES with Aviation Cap 17.3 % 23.4 % 24.8 % 24.8 %
RES-H&C – Heating and Cooling 18.0 % 27.2 % 26.7 % 25.9 %
RES-E – Electricity Generation 26.9 % 30.4 % 41.7 % 43.2 %
RES-T – Transport 1.6 % 3.8 % 4.7 % 5.5 %
Gases Emissions (Mio ton CO2)
CO2 Emissions* 126.08 93.39 99.96 82.76 77.81 79.39
GHGs Emissions* 181.74 140.60 146.84 121.40 116.04 117.81
Main Emissions Indicators
CO2 per Capita (kg CO2/cap) 5 551.2 4 158.8 4 675.0 4 078.1 3 901.0 3 995.3
Carbon Intensity (kg CO2/toe) 2 722.9 2 548.1 2 549.7 2 310.8 2 413.7 2 445.9
CO2 GDP Intensity (ton CO2/M€'10) 1 500.1 1 125.4 910.6 653.0 565.7 555.2* Total emissions without LULUCF, with ind. CO
2, including international aviation,
excl. international maritime transport.
221
EU ENERGY IN FIGURES 2017
Methodology, Sources and Notes: See Appendix 13 – No 5

5.24 SloveniaMtoe, unless otherwise stated 1995 2000 2005 2010 2014 2015
Production 2.96 3.09 3.49 3.78 3.67 3.40
Solid Fuels 1.19 1.06 1.18 1.20 0.82 0.86
of which Hard Coal
Petroleum and Products 0.00 0.00 0.00 0.01 0.01 0.00
of which Crude and NGL 0.00 0.00
Gases 0.02 0.01 0.00 0.01 0.00 0.00
of which Natural Gas 0.02 0.01 0.00 0.01 0.00 0.00
Nuclear 1.23 1.23 1.52 1.46 1.64 1.46
Renewables 0.51 0.79 0.77 1.09 1.16 1.03
Wastes, Non-Renewable 0.00 0.00 0.01 0.02 0.04 0.04
Net Imports 3.09 3.41 3.86 3.58 2.99 3.23
Solid Fuels 0.19 0.24 0.32 0.28 0.22 0.20
of which Hard Coal 0.14 0.20 0.29 0.23 0.19 0.18
Petroleum and Products 2.26 2.46 2.63 2.60 2.33 2.34
of which Crude and NGL 0.49 0.13
Gases 0.75 0.82 0.93 0.86 0.62 0.66
of which Natural Gas 0.75 0.82 0.93 0.86 0.62 0.66
Renewables 0.03 0.00 0.00 0.03 0.05 0.03
Electricity -0.14 -0.11 -0.03 -0.18 -0.24 0.00
Gross Inland Consumption 6.07 6.45 7.33 7.34 6.65 6.58
Solid Fuels 1.38 1.31 1.54 1.45 1.05 1.07
of which Hard Coal 0.14 0.19 0.30 0.23 0.18 0.18
Petroleum and Products 2.32 2.42 2.58 2.60 2.33 2.29
of which Crude and NGL 0.51 0.14
Gases 0.75 0.83 0.93 0.86 0.63 0.66
of which Natural Gas 0.75 0.83 0.93 0.86 0.63 0.66
Nuclear 1.23 1.23 1.52 1.46 1.64 1.46
Renewables 0.54 0.79 0.77 1.12 1.20 1.06
Electricity -0.14 -0.11 -0.03 -0.18 -0.24 0.00
Wastes, Non-Renewable 0.00 0.00 0.01 0.02 0.04 0.04
Primary Energy Consumption 5.95 6.21 7.02 7.13 6.51 6.45
Available for Final Consumption 4.23 4.70 5.23 5.27 4.73 4.82
Final Non-Energy Consumption 0.12 0.24 0.31 0.21 0.14 0.13
Final Energy Consumption 4.09 4.46 4.90 5.04 4.59 4.69
by Fuel/Product
Solid Fuels 0.11 0.09 0.08 0.05 0.04 0.04
Petroleum and Products 2.13 2.26 2.41 2.47 2.18 2.17
Gases 0.58 0.57 0.67 0.62 0.52 0.56
Biomass and Renewable Wastes 0.26 0.44 0.44 0.62 0.54 0.57
Solar 0.01 0.01 0.01
Geothermal 0.03 0.04 0.04
Electricity 0.80 0.91 1.10 1.03 1.07 1.10
Derived heat 0.21 0.20 0.20 0.19 0.15 0.17
Wastes, Non-Renewable 0.00 0.00 0.01 0.02 0.04 0.04
by Sector
Industry 1.18 1.42 1.64 1.27 1.23 1.23
Transport 1.35 1.26 1.49 1.81 1.82 1.80
Residential 1.16 1.13 1.19 1.33 1.02 1.11
Services 0.40 0.53 0.48 0.53 0.43 0.46
Agriculture and Fishing 0.00 0.08 0.08 0.07 0.08 0.08
Other 0.00 0.04 0.02 0.03 0.02 0.02
222
PART 5 Country Profiles
Methodology, Sources and Notes: See Appendix 13 – No 5

1995 2000 2005 2010 2014 2015
Installed Capacity (GW) 2.52 2.61 2.99 3.19 3.45 3.36
Combustible Fuels 1.10 1.12 1.36 1.26 1.24 1.13
Nuclear 0.66 0.66 0.66 0.67 0.69 0.69
Hydro 0.76 0.84 0.98 1.25 1.30 1.30
Wind 0.00 0.01
Solar PV 0.01 0.22 0.24
Geothermal
Tide, Wave and Ocean
Other Sources
Gross Electricity Generation (TWh) 12.91 13.62 15.12 16.44 17.44 15.10
Solid Fuels 4.60 4.61 5.27 5.29 3.76 4.39
Petroleum and Products 0.26 0.06 0.04 0.01 0.04 0.02
Gases 0.02 0.29 0.34 0.55 0.37 0.40
Nuclear 4.78 4.76 5.88 5.66 6.37 5.65
Renewables 3.25 3.90 3.58 4.93 6.89 4.64
Wastes, non-RES 0.01 0.01 0.01 0.01
Cogeneration Heat and Power
CHP Electrical Capacity (GW) 0.34 0.33 0.37 0.4
CHP Electricity Generation (TWh) 1.10 1.14 1.17 1.2
CHP in Total Electricity Generation (%) 7.3 % 6.9 % 7.1 % 7.7 %
CHP Heat Production (PJ) 15.00 11.60 10.15 10.4
Transport Fuels (ktoe)
Final Consumption Petroleum Products 1 334.4 1 236.2 1 475.9 1 745.8 1 764.4 1 754.0
Motor Gasoline 880.5 860.1 698.1 600.1 447.2 436.7
Gas/Diesel Oil 433.4 350.4 754.1 1 111.1 1 276.9 1 275.9
Final Consumption Biofuels 45.7 43.7 29.4
Biogasoline 4.3 7.6 6.5
Biodiesel 41.4 36.1 22.9
Main Energy Indicators
Energy Intensity (toe/M€'10) 268.3 231.3 220.1 202.4 183.7 177.6
Energy per Capita (kgoe/cap) 3 052.1 3 245.4 3 666.9 3 584.3 3 227.9 3 189.2
Final Electricity per Capita (KWh/cap) 4 696.2 5 292.9 6 378.7 5 835.4 6 044.9 6 199.1
Primary Energy Intensity (toe/M€'10) 263.1 222.8 210.9 196.6 179.8 174.2
Import Dependency (%) 50.9 % 52.8 % 52.5 % 48.7 % 44.5 % 48.7 %
of Solid Fuels 13.6 % 18.7 % 21.0 % 19.2 % 21.4 % 18.9 %
of Hard Coal 100.0 % 100.5 % 93.8 % 100.9 % 103.8 % 96.7 %
of Petroleum Fuels 97.8 % 101.5 % 101.2 % 99.2 % 97.7 % 99.6 %
of Crude and NGL 95.9 % 87.5 %
of Natural Gas 100.5 % 99.3 % 99.6 % 99.3 % 99.5 % 99.7 %
Renewables in Gross Final Energy (%)
Overall RES with Aviation Cap 16.0 % 20.4 % 21.5 % 22.0 %
RES-H&C – Heating and Cooling 18.9 % 28.1 % 32.4 % 34.1 %
RES-E – Electricity Generation 28.7 % 32.2 % 33.9 % 32.7 %
RES-T – Transport 0.8 % 3.1 % 2.9 % 2.2 %
Gases Emissions (Mio ton CO2)
CO2 Emissions* 15.30 15.50 16.99 16.43 13.58 13.67
GHGs Emissions* 18.78 19.16 20.56 19.68 16.68 16.91
Main Emissions Indicators
CO2 per Capita (kg CO2/cap) 7 691.4 7 797.3 8 505.5 8 028.2 6 590.9 6 627.7
Carbon Intensity (kg CO2/toe) 2 520.1 2 402.6 2 312.9 2 234.3 2 025.1 2 058.8
CO2 GDP Intensity (ton CO2/M€'10) 676.1 555.8 510.6 453.3 375.1 369.0* Total emissions without LULUCF, with ind. CO
2, including international aviation,
excl. international maritime transport.
223
EU ENERGY IN FIGURES 2017
Methodology, Sources and Notes: See Appendix 13 – No 5

5.25 Slovak RepublicMtoe, unless otherwise stated 1995 2000 2005 2010 2014 2015
Production 5.06 6.39 6.68 6.35 6.72 6.74
Solid Fuels 1.02 1.02 0.64 0.61 0.58 0.50
of which Hard Coal
Petroleum and Products 0.13 0.17 0.38 0.39 0.42 0.43
of which Crude and NGL 0.07 0.06 0.04 0.02 0.01 0.01
Gases 0.26 0.13 0.13 0.09 0.08 0.08
of which Natural Gas 0.26 0.13 0.13 0.09 0.08 0.08
Nuclear 2.95 4.26 4.63 3.82 4.04 3.95
Renewables 0.50 0.50 0.86 1.40 1.44 1.59
Wastes, Non-Renewable 0.21 0.32 0.05 0.03 0.15 0.19
Net Imports 12.14 12.00 12.43 11.26 9.86 9.64
Solid Fuels 4.14 3.43 3.74 2.95 2.85 2.77
of which Hard Coal 3.10 3.15 3.48 2.57 2.59 2.53
Petroleum and Products 3.36 3.09 3.27 3.30 2.98 2.99
of which Crude and NGL 5.09 5.72 5.43 5.31 5.36 5.77
Gases 4.53 5.71 5.74 5.00 3.95 3.69
of which Natural Gas 4.53 5.71 5.74 5.00 3.95 3.69
Renewables -0.04 -0.08 -0.03 -0.02
Electricity 0.12 -0.23 -0.28 0.09 0.10 0.21
Gross Inland Consumption 17.72 18.30 19.03 17.86 16.18 16.43
Solid Fuels 5.39 4.28 4.23 3.90 3.42 3.28
of which Hard Coal 3.34 3.03 3.31 2.79 2.63 2.59
Petroleum and Products 3.34 3.42 3.71 3.68 3.28 3.34
of which Crude and NGL 5.01 5.86 5.56 5.32 5.30 5.81
Gases 5.22 5.78 5.88 5.01 3.77 3.88
of which Natural Gas 5.22 5.78 5.88 5.01 3.77 3.88
Nuclear 2.95 4.26 4.63 3.82 4.04 3.95
Renewables 0.50 0.49 0.81 1.33 1.42 1.58
Electricity 0.12 -0.23 -0.28 0.09 0.10 0.21
Wastes, Non-Renewable 0.21 0.32 0.05 0.04 0.15 0.19
Primary Energy Consumption 16.79 16.94 17.75 16.80 15.25 15.38
Available for Final Consumption 12.23 12.72 12.84 12.65 10.98 11.16
Final Non-Energy Consumption 0.93 1.37 1.28 1.05 0.93 1.05
Final Energy Consumption 11.03 10.98 11.56 11.55 9.98 10.08
by Fuel/Product
Solid Fuels 2.56 1.75 1.57 1.64 1.43 1.32
Petroleum and Products 1.61 1.70 2.18 2.30 2.11 2.12
Gases 4.07 4.70 4.54 4.12 3.11 3.09
Biomass and Renewable Wastes 0.08 0.09 0.33 0.54 0.51 0.63
Solar 0.00 0.01 0.01
Geothermal 0.00 0.00 0.00 0.00
Electricity 1.87 1.89 1.97 2.08 2.08 2.10
Derived heat 0.72 0.62 0.95 0.85 0.61 0.63
Wastes, Non-Renewable 0.12 0.23 0.02 0.02 0.14 0.17
by Sector
Industry 4.69 4.53 4.71 4.36 4.45 4.43
Transport 1.41 1.45 2.39 2.63 2.21 2.21
Residential 1.98 2.59 2.54 2.31 1.95 1.99
Services 2.66 2.20 1.75 2.11 1.23 1.30
Agriculture and Fishing 0.30 0.21 0.17 0.13 0.14 0.15
Other
224
PART 5 Country Profiles
Methodology, Sources and Notes: See Appendix 13 – No 5

1995 2000 2005 2010 2014 2015
Installed Capacity (GW) 7.24 7.45 8.26 7.87 8.09 7.78
Combustible Fuels 3.22 2.39 3.09 3.50 3.07 2.75
Nuclear 1.76 2.64 2.64 1.82 1.94 1.94
Hydro 2.26 2.42 2.51 2.52 2.52 2.52
Wind 0.01 0.00 0.00 0.00
Solar PV 0.02 0.53 0.53
Geothermal
Tide, Wave and Ocean
Other Sources 0.01 0.02 0.03 0.03
Gross Electricity Generation (TWh) 26.77 31.16 31.46 27.86 27.40 26.90
Solid Fuels 6.46 5.58 5.54 3.57 2.87 2.83
Petroleum and Products 0.74 0.20 0.74 0.60 0.30 0.38
Gases 2.92 3.87 2.63 2.72 2.10 2.11
Nuclear 11.44 16.49 17.73 14.57 15.50 15.15
Renewables 5.23 4.98 4.78 6.33 6.48 6.31
Wastes, non-RES 0.03 0.02 0.02 0.03 0.03
Cogeneration Heat and Power
CHP Electrical Capacity (GW) 5.41 2.82 - 3.7
CHP Electricity Generation (TWh) 4.80 4.43 - 21.1
CHP in Total Electricity Generation (%) 15.3 % 15.9 % - 78.5 %
CHP Heat Production (PJ) 33.68 20.06 - 27.3
Transport Fuels (ktoe)
Final Consumption Petroleum Products 1 294.1 1 371.5 1 731.1 2 092.9 1 936.3 1 924.3
Motor Gasoline 512.2 605.0 666.8 599.5 551.6 576.8
Gas/Diesel Oil 741.8 739.8 1 011.3 1 449.9 1 316.5 1 266.7
Final Consumption Biofuels 11.2 97.7 133.9 143.9
Biogasoline 23.8 24.6 22.9
Biodiesel 11.2 73.9 109.3 121.0
Main Energy Indicators
Energy Intensity (toe/M€'10) 503.1 436.9 355.1 264.2 220.1 215.2
Energy per Capita (kgoe/cap) 3 308.1 3 390.1 3 541.8 3 312.4 2 987.7 3 029.9
Final Electricity per Capita (KWh/cap) 4 057.0 4 076.9 4 253.0 4 477.4 4 460.3 4 495.4
Primary Energy Intensity (toe/M€'10) 476.8 404.3 331.2 248.6 207.4 201.4
Import Dependency (%) 68.5 % 65.6 % 65.3 % 63.1 % 60.9 % 58.7 %
of Solid Fuels 76.7 % 80.2 % 88.4 % 75.7 % 83.3 % 84.6 %
of Hard Coal 92.9 % 103.8 % 105.2 % 91.9 % 98.5 % 97.5 %
of Petroleum Fuels 100.6 % 90.5 % 88.2 % 89.5 % 91.0 % 89.4 %
of Crude and NGL 101.5 % 97.6 % 97.7 % 99.9 % 101.1 % 99.3 %
of Natural Gas 86.8 % 98.8 % 97.5 % 99.9 % 104.8 % 95.1 %
Renewables in Gross Final Energy (%)
Overall RES with Aviation Cap 6.4 % 9.1 % 11.7 % 12.9 %
RES-H&C – Heating and Cooling 5.0 % 7.9 % 8.9 % 10.8 %
RES-E – Electricity Generation 15.7 % 17.8 % 22.9 % 22.7 %
RES-T – Transport 1.6 % 5.3 % 7.6 % 8.5 %
Gases Emissions (Mio ton CO2)
CO2 Emissions* 44.83 41.31 42.89 38.67 33.56 33.96
GHGs Emissions* 54.46 49.91 51.54 46.69 40.80 41.42
Main Emissions Indicators
CO2 per Capita (kg CO2/cap) 8 369.2 7 652.5 7 982.4 7 173.5 6 196.7 6 264.3
Carbon Intensity (kg CO2/toe) 2 529.9 2 257.3 2 253.8 2 165.7 2 074.1 2 067.5
CO2 GDP Intensity (ton CO2/M€'10) 1 272.9 986.1 800.3 572.2 456.4 444.8* Total emissions without LULUCF, with ind. CO
2, including international aviation,
excl. international maritime transport.
225
EU ENERGY IN FIGURES 2017
Methodology, Sources and Notes: See Appendix 13 – No 5

5.26 FinlandMtoe, unless otherwise stated 1995 2000 2005 2010 2014 2015
Production 13.13 15.16 16.95 17.99 18.72 18.17
Solid Fuels 2.03 1.09 2.14 1.81 1.60 0.84
of which Hard Coal
Petroleum and Products 0.02 0.46 0.54 0.72 0.67 0.70
of which Crude and NGL
Gases 0.00 0.01
of which Natural Gas 0.00 0.01
Nuclear 4.96 5.80 6.00 5.88 6.08 6.00
Renewables 6.12 7.75 8.16 9.43 10.12 10.39
Wastes, Non-Renewable 0.01 0.07 0.11 0.15 0.24 0.24
Net Imports 15.91 18.22 18.95 17.84 17.06 15.66
Solid Fuels 3.83 3.51 3.31 3.95 3.59 2.46
of which Hard Coal 3.67 3.21 3.01 3.68 3.36 2.24
Petroleum and Products 8.51 10.26 10.65 9.23 9.21 9.46
of which Crude and NGL 8.67 11.56 10.57 11.21 12.08 11.10
Gases 2.84 3.43 3.61 3.84 2.51 2.24
of which Natural Gas 2.84 3.43 3.61 3.84 2.51 2.24
Renewables -0.08 -0.08 0.19 0.09
Electricity 0.72 1.02 1.46 0.90 1.55 1.41
Gross Inland Consumption 29.36 32.41 34.50 37.11 34.77 33.16
Solid Fuels 6.05 5.09 4.90 6.87 4.47 4.03
of which Hard Coal 4.12 3.28 2.93 4.31 2.84 2.49
Petroleum and Products 8.66 9.25 10.33 10.12 9.62 8.76
of which Crude and NGL 9.21 11.39 10.83 11.09 12.16 10.66
Gases 2.84 3.43 3.61 3.84 2.52 2.24
of which Natural Gas 2.84 3.43 3.61 3.84 2.52 2.24
Nuclear 4.96 5.80 6.00 5.88 6.08 6.00
Renewables 6.13 7.75 8.09 9.35 10.30 10.49
Electricity 0.72 1.02 1.46 0.90 1.55 1.41
Wastes, Non-Renewable 0.01 0.07 0.11 0.15 0.24 0.24
Primary Energy Consumption 28.24 31.37 33.35 35.88 33.57 31.95
Available for Final Consumption 21.92 24.76 26.44 27.50 26.39 25.43
Final Non-Energy Consumption 1.13 1.04 1.15 1.22 1.20 1.21
Final Energy Consumption 21.97 24.32 25.19 26.25 24.50 24.18
by Fuel/Product
Solid Fuels 1.30 1.03 0.89 0.85 0.66 0.60
Petroleum and Products 7.67 7.81 8.15 7.70 6.71 6.72
Gases 1.33 1.21 1.10 1.03 0.86 0.84
Biomass and Renewable Wastes 3.94 4.48 4.23 4.89 5.41 5.39
Solar 0.00 0.00 0.00
Geothermal
Electricity 5.61 6.51 6.94 7.18 6.81 6.75
Derived heat 2.13 3.27 3.85 4.55 3.99 3.83
Wastes, Non-Renewable 0.00 0.02 0.03 0.04 0.06 0.05
by Sector
Industry 9.86 12.20 11.88 11.34 10.70 10.70
Transport 4.18 4.28 4.65 4.84 4.76 4.79
Residential 5.44 4.49 5.02 5.81 5.07 4.90
Services 1.01 2.32 2.62 3.08 2.87 2.71
Agriculture and Fishing 0.76 0.77 0.75 0.81 0.75 0.72
Other 0.72 0.26 0.27 0.36 0.36 0.36
226
PART 5 Country Profiles
Methodology, Sources and Notes: See Appendix 13 – No 5

1995 2000 2005 2010 2014 2015
Installed Capacity (GW) 14.43 16.26 16.47 15.54 16.25 15.88
Combustible Fuels 9.34 10.70 10.68 9.46 9.61 8.85
Nuclear 2.31 2.64 2.67 2.72 2.75 2.75
Hydro 2.78 2.88 3.04 3.16 3.25 3.25
Wind 0.01 0.04 0.08 0.20 0.63 1.01
Solar PV 0.00 0.00 0.00 0.01 0.01 0.02
Geothermal
Tide, Wave and Ocean
Other Sources
Gross Electricity Generation (TWh) 64.04 69.98 70.58 80.67 68.09 68.60
Solid Fuels 16.62 12.45 11.00 20.83 11.33 8.21
Petroleum and Products 1.45 0.59 0.50 0.48 0.24 0.21
Gases 7.21 10.82 11.92 11.85 6.01 5.77
Nuclear 19.22 22.48 23.27 22.80 23.58 23.25
Renewables 19.55 23.38 23.47 24.20 26.27 30.53
Wastes, non-RES 0.00 0.07 0.18 0.21 0.38 0.39
Cogeneration Heat and Power
CHP Electrical Capacity (GW) 5.83 6.17 6.01 5.8
CHP Electricity Generation (TWh) 27.46 29.24 23.04 21.7
CHP in Total Electricity Generation (%) 38.9 % 36.2 % 33.8 % 31.7 %
CHP Heat Production (PJ) 249.98 272.84 247.58 242.4
Transport Fuels (ktoe)
Final Consumption Petroleum Products 4 127.2 4 212.9 4 569.0 4 624.1 4 188.3 4 226.9
Motor Gasoline 2 023.7 1 748.0 1 835.3 1 531.3 1 363.9 1 359.8
Gas/Diesel Oil 1 649.7 1 942.7 2 167.2 2 433.2 2 121.3 2 155.4
Final Consumption Biofuels 140.2 497.7 496.9
Biogasoline 77.6 70.0 64.9
Biodiesel 62.6 427.7 432.0
Main Energy Indicators
Energy Intensity (toe/M€'10) 237.9 205.0 192.1 198.3 186.4 177.2
Energy per Capita (kgoe/cap) 5 758.9 6 267.1 6 588.8 6 933.7 6 378.1 6 059.3
Final Electricity per Capita (KWh/cap) 12 790.8 14 635.6 15 420.1 15 603.3 14 518.3 14 340.2
Primary Energy Intensity (toe/M€'10) 228.8 198.4 185.6 191.8 179.9 170.8
Import Dependency (%) 53.6 % 55.1 % 54.1 % 47.8 % 48.9 % 46.8 %
of Solid Fuels 63.4 % 68.9 % 67.4 % 57.5 % 80.3 % 61.2 %
of Hard Coal 89.0 % 97.7 % 102.6 % 85.5 % 118.5 % 89.9 %
of Petroleum Fuels 94.6 % 103.5 % 98.4 % 89.4 % 94.8 % 104.5 %
of Crude and NGL 94.1 % 101.5 % 97.5 % 101.1 % 99.3 % 104.1 %
of Natural Gas 100.0 % 100.0 % 100.0 % 100.0 % 99.9 % 99.7 %
Renewables in Gross Final Energy (%)
Overall RES with Aviation Cap 28.8 % 32.4 % 38.7 % 39.3 %
RES-H&C – Heating and Cooling 39.1 % 44.2 % 51.9 % 52.8 %
RES-E – Electricity Generation 26.9 % 27.7 % 31.4 % 32.5 %
RES-T – Transport 0.9 % 4.4 % 22.0 % 22.0 %
Gases Emissions (Mio ton CO2)
CO2 Emissions* 59.15 58.19 58.41 65.73 49.73 46.40
GHGs Emissions* 72.71 71.08 70.88 77.32 61.06 57.54
Main Emissions Indicators
CO2 per Capita (kg CO2/cap) 11 601.0 11 253.0 11 153.5 12 282.6 9 122.8 8 479.3
Carbon Intensity (kg CO2/toe) 1 992.0 1 759.5 1 668.7 1 761.5 1 426.4 1 387.1
CO2 GDP Intensity (ton CO2/M€'10) 479.3 368.1 325.1 351.3 266.6 248.0* Total emissions without LULUCF, with ind. CO
2, including international aviation,
excl. international maritime transport.
227
EU ENERGY IN FIGURES 2017
Methodology, Sources and Notes: See Appendix 13 – No 5

5.27 SwedenMtoe, unless otherwise stated 1995 2000 2005 2010 2014 2015
Production 31.38 30.05 34.26 32.76 34.31 33.81
Solid Fuels 0.22 0.16 0.21 0.24 0.13 0.11
of which Hard Coal
Petroleum and Products 0.00 0.00 0.03 0.07 0.13 0.16
of which Crude and NGL 0.00
Gases 0.04 0.04 0.04 0.02 0.01 0.01
of which Natural Gas
Nuclear 18.04 14.79 18.67 14.92 16.74 14.54
Renewables 12.84 14.74 14.83 17.00 16.71 18.37
Wastes, Non-Renewable 0.24 0.32 0.48 0.52 0.59 0.62
Net Imports 20.43 20.44 19.46 19.29 15.99 14.24
Solid Fuels 2.75 2.41 2.56 2.55 1.99 1.95
of which Hard Coal 2.37 2.14 2.22 2.29 1.91 1.92
Petroleum and Products 17.07 16.85 16.70 15.10 13.94 12.68
of which Crude and NGL 19.22 21.97 19.49 19.62 18.61 19.95
Gases 0.76 0.78 0.84 1.47 0.79 0.72
of which Natural Gas 0.76 0.78 0.84 1.47 0.79 0.72
Renewables 0.61 0.83
Electricity -0.14 0.40 -0.64 0.18 -1.34 -1.94
Gross Inland Consumption 51.47 48.90 50.99 50.78 48.21 45.47
Solid Fuels 2.88 2.45 2.63 2.49 2.10 2.12
of which Hard Coal 2.33 1.98 2.12 1.99 1.84 1.93
Petroleum and Products 16.82 15.38 14.14 14.20 12.00 10.22
of which Crude and NGL 19.36 21.83 19.40 19.81 18.71 19.82
Gases 0.80 0.82 0.89 1.48 0.80 0.73
of which Natural Gas 0.76 0.78 0.84 1.47 0.79 0.72
Nuclear 18.04 14.79 18.67 14.92 16.74 14.54
Renewables 12.84 14.74 14.83 17.00 17.32 19.19
Electricity -0.15 0.40 -0.64 0.18 -1.34 -1.94
Wastes, Non-Renewable 0.24 0.32 0.48 0.52 0.59 0.62
Primary Energy Consumption 49.48 47.17 48.70 48.67 46.24 43.70
Available for Final Consumption 36.67 36.21 35.23 36.90 33.83 32.66
Final Non-Energy Consumption 1.99 1.73 2.29 2.11 1.97 1.77
Final Energy Consumption 35.05 34.97 33.66 34.08 31.19 31.76
by Fuel/Product
Solid Fuels 1.19 1.11 1.35 1.20 1.03 1.04
Petroleum and Products 13.93 13.27 11.42 10.04 8.65 8.52
Gases 0.61 0.67 0.76 0.73 0.72 0.75
Biomass and Renewable Wastes 5.07 5.29 4.71 5.67 6.10 6.52
Solar 0.01 0.01 0.01 0.01 0.01 0.01
Geothermal
Electricity 10.71 11.07 11.24 11.28 10.51 10.74
Derived heat 3.54 3.55 4.17 5.14 4.17 4.19
Wastes, Non-Renewable 0.00 0.00 0.00 0.00 0.00 0.00
by Sector
Industry 13.82 14.27 12.63 12.21 11.24 11.53
Transport 7.79 8.19 8.61 8.60 8.52 8.67
Residential 7.74 7.30 7.31 8.04 7.02 7.20
Services 4.86 4.41 4.30 4.55 4.03 4.00
Agriculture and Fishing 0.84 0.76 0.80 0.68 0.38 0.37
Other 0.01 0.05 0.02 0.01
228
PART 5 Country Profiles
Methodology, Sources and Notes: See Appendix 13 – No 5

1995 2000 2005 2010 2014 2015
Installed Capacity (GW) 33.63 33.72 33.39 36.45 38.74 39.71
Combustible Fuels 7.35 7.53 7.08 8.72 8.08 7.75
Nuclear 10.06 9.46 9.47 8.98 9.51 9.69
Hydro 16.15 16.53 16.35 16.73 16.00 16.33
Wind 0.07 0.21 0.49 2.02 5.10 5.84
Solar PV 0.00 0.00 0.00 0.01 0.06 0.10
Geothermal
Tide, Wave and Ocean
Other Sources
Gross Electricity Generation (TWh) 148.35 145.27 158.44 148.56 153.66 162.06
Solid Fuels 2.45 1.71 1.17 1.77 0.59 0.57
Petroleum and Products 3.95 1.53 1.38 1.77 0.30 0.25
Gases 1.34 1.29 1.34 3.78 0.93 1.12
Nuclear 69.94 57.32 72.38 57.83 64.88 56.35
Renewables 70.61 83.18 81.30 82.20 85.85 102.57
Wastes, non-RES 0.07 0.24 0.87 1.21 1.13 1.20
Cogeneration Heat and Power
CHP Electrical Capacity (GW) 3.49 5.10 5.01 4.9
CHP Electricity Generation (TWh) 10.67 18.53 12.12 13.7
CHP in Total Electricity Generation (%) 6.7 % 12.5 % 7.9 % 8.4 %
CHP Heat Production (PJ) 132.73 187.20 145.10 151.3
Transport Fuels (ktoe)
Final Consumption Petroleum Products 7 550.3 7 907.2 8 216.7 7 958.7 7 377.1 7 308.1
Motor Gasoline 4 558.8 4 265.0 4 141.7 3 320.2 2 850.5 2 568.4
Gas/Diesel Oil 2 099.5 2 671.3 3 153.9 3 652.9 3 668.2 3 847.6
Final Consumption Biofuels 134.4 376.3 788.3 1 005.0
Biogasoline 127.4 202.3 165.1 133.1
Biodiesel 7.0 174.0 623.2 871.9
Main Energy Indicators
Energy Intensity (toe/M€'10) 204.7 163.2 149.5 137.6 122.8 111.3
Energy per Capita (kgoe/cap) 5 837.9 5 518.1 5 658.7 5 436.8 4 998.4 4 665.2
Final Electricity per Capita (KWh/cap) 14 128.9 14 526.4 14 503.6 14 047.9 12 669.0 12 809.5
Primary Energy Intensity (toe/M€'10) 196.8 157.4 142.7 131.9 117.8 107.0
Import Dependency (%) 38.9 % 40.7 % 36.8 % 36.6 % 32.0 % 30.1 %
of Solid Fuels 95.4 % 98.3 % 97.2 % 102.2 % 94.7 % 92.3 %
of Hard Coal 101.6 % 107.7 % 104.3 % 115.2 % 103.9 % 99.5 %
of Petroleum Fuels 95.6 % 100.8 % 104.0 % 93.6 % 101.7 % 105.4 %
of Crude and NGL 99.3 % 100.6 % 100.4 % 99.0 % 99.4 % 100.7 %
of Natural Gas 100.0 % 100.0 % 100.0 % 100.0 % 100.0 % 100.0 %
Renewables in Gross Final Energy (%)
Overall RES with Aviation Cap 40.6 % 47.2 % 52.5 % 53.9 %
RES-H&C – Heating and Cooling 51.9 % 60.9 % 68.0 % 68.6 %
RES-E – Electricity Generation 50.9 % 56.0 % 63.2 % 65.8 %
RES-T – Transport 6.2 % 9.2 % 21.1 % 24.0 %
Gases Emissions (Mio ton CO2)
CO2 Emissions* 60.73 56.65 55.88 55.13 45.52 45.51
GHGs Emissions* 75.23 70.65 68.81 66.69 56.13 55.89
Main Emissions Indicators
CO2 per Capita (kg CO2/cap) 6 888.3 6 393.3 6 201.1 5 902.1 4 719.7 4 669.0
Carbon Intensity (kg CO2/toe) 1 156.6 1 127.6 1 056.1 1 045.6 912.0 962.4
CO2 GDP Intensity (ton CO2/M€'10) 241.6 189.1 163.8 149.4 116.0 111.4* Total emissions without LULUCF, with ind. CO
2, including international aviation,
excl. international maritime transport.
229
EU ENERGY IN FIGURES 2017
Methodology, Sources and Notes: See Appendix 13 – No 5

5.28 United KingdomMtoe, unless otherwise stated 1995 2000 2005 2010 2014 2015
Production 256.46 268.55 204.60 148.77 108.16 118.27
Solid Fuels 32.07 18.66 12.07 10.84 6.92 5.12
of which Hard Coal 32.07 18.66 12.07 10.84 6.92 5.12
Petroleum and Products 135.72 127.94 87.94 64.26 40.92 46.48
of which Crude and NGL 134.40 127.81 87.62 64.26 40.89 46.48
Gases 63.72 97.55 79.40 51.47 33.15 35.66
of which Natural Gas 63.72 97.55 79.40 51.47 33.15 35.66
Nuclear 22.95 21.94 21.05 16.03 16.44 18.15
Renewables 1.84 2.26 3.49 5.71 9.86 11.84
Wastes, Non-Renewable 0.16 0.19 0.66 0.47 0.86 1.04
Net Imports -36.83 -39.22 31.61 60.74 87.58 72.19
Solid Fuels 10.48 14.45 27.24 16.06 26.46 15.57
of which Hard Coal 10.26 14.43 26.71 16.33 25.90 14.88
Petroleum and Products -49.35 -45.58 -2.74 10.68 29.83 26.33
of which Crude and NGL -43.68 -41.82 -0.19 9.39 19.52 13.78
Gases 0.64 -9.31 5.97 32.20 26.99 25.60
of which Natural Gas 0.64 -9.31 5.97 32.20 26.99 25.60
Renewables 0.42 1.57 2.54 2.89
Electricity 1.40 1.22 0.72 0.23 1.77 1.80
Gross Inland Consumption 222.25 230.56 234.17 212.95 189.71 190.75
Solid Fuels 47.18 36.52 37.91 30.92 30.25 23.80
of which Hard Coal 47.09 36.60 37.48 31.33 29.83 23.07
Petroleum and Products 83.61 81.03 84.46 72.98 67.96 69.94
of which Crude and NGL 91.60 87.15 87.23 73.86 60.21 60.26
Gases 65.12 87.40 85.47 85.05 60.07 61.28
of which Natural Gas 65.12 87.40 85.47 85.05 60.07 61.28
Nuclear 22.95 21.94 21.05 16.03 16.44 18.15
Renewables 1.84 2.26 3.91 7.28 12.36 14.74
Electricity 1.40 1.22 0.72 0.23 1.76 1.80
Wastes, Non-Renewable 0.16 0.19 0.66 0.47 0.86 1.04
Primary Energy Consumption 209.76 219.23 222.81 205.04 183.05 183.04
Available for Final Consumption 157.11 163.83 164.16 151.59 136.74 139.19
Final Non-Energy Consumption 12.49 11.33 11.37 7.91 6.66 7.71
Final Energy Consumption 142.65 153.24 152.76 143.22 129.62 131.37
by Fuel/Product
Solid Fuels 8.22 5.95 4.57 4.08 4.80 4.28
Petroleum and Products 61.02 63.67 65.85 59.53 57.23 58.02
Gases 47.14 52.18 50.38 47.17 36.69 37.97
Biomass and Renewable Wastes 0.86 0.57 0.55 2.77 3.49 3.72
Solar 0.01 0.01 0.03 0.04 0.05 0.05
Geothermal 0.00 0.00 0.00 0.00 0.00 0.00
Electricity 25.34 28.36 30.00 28.29 26.06 26.04
Derived heat 0.00 2.44 1.27 1.27 1.16 1.15
Wastes, Non-Renewable 0.06 0.05 0.12 0.09 0.14 0.14
by Sector
Industry 34.87 36.93 33.33 26.78 25.11 24.73
Transport 47.67 52.90 55.49 51.49 51.13 51.77
Residential 39.34 43.03 44.24 45.47 35.29 36.48
Services 16.32 16.86 16.75 17.48 16.07 16.28
Agriculture and Fishing 1.27 1.15 0.94 0.92 0.94 1.02
Other 3.18 2.37 2.01 1.09 1.09 1.09
230
PART 5 Country Profiles
Methodology, Sources and Notes: See Appendix 13 – No 5

1995 2000 2005 2010 2014 2015
Installed Capacity (GW) 70.13 78.39 82.38 93.75 94.71 95.21
Combustible Fuels 52.94 61.22 64.66 73.00 61.84 57.74
Nuclear 12.76 12.49 11.85 10.87 9.94 9.49
Hydro 4.22 4.27 4.29 4.39 4.47 4.50
Wind 0.20 0.41 1.57 5.40 13.04 14.29
Solar PV 0.00 0.01 0.10 5.42 9.19
Geothermal
Tide, Wave and Ocean 0.00 0.00 0.00 0.00
Other Sources
Gross Electricity Generation (TWh) 334.04 377.07 398.36 381.77 338.18 339.10
Solid Fuels 153.84 119.95 134.64 107.69 100.23 75.63
Petroleum and Products 17.30 8.45 5.34 4.95 1.90 2.13
Gases 65.10 150.43 154.34 176.44 102.30 101.12
Nuclear 88.96 85.06 81.62 62.14 63.75 70.35
Renewables 8.42 12.66 19.87 28.97 67.47 86.29
Wastes, non-RES 0.41 0.52 2.56 1.59 2.53 3.58
Cogeneration Heat and Power
CHP Electrical Capacity (GW) 5.44 6.10 6.32 5.9
CHP Electricity Generation (TWh) 27.24 23.64 20.32 19.4
CHP in Total Electricity Generation (%) 6.8 % 6.2 % 6.0 % 5.7 %
CHP Heat Production (PJ) 185.24 155.52 143.25 124.2
Transport Fuels (ktoe)
Final Consumption Petroleum Products 46 974.7 52 154.0 55 071.6 49 963.4 49 569.3 50 439.3
Motor Gasoline 23 542.8 23 167.4 19 975.2 15 598.0 13 185.1 12 926.1
Gas/Diesel Oil 15 321.6 17 754.1 21 497.1 22 482.8 24 490.6 25 478.2
Final Consumption Biofuels 68.5 1 150.7 1 168.1 932.8
Biogasoline 42.7 321.0 413.9 404.3
Biodiesel 25.8 829.7 754.2 528.5
Main Energy Indicators
Energy Intensity (toe/M€'10) 165.9 147.2 130.1 116.2 95.8 94.3
Energy per Capita (kgoe/cap) 3 835.6 3 922.1 3 891.1 3 406.6 2 948.0 2 940.2
Final Electricity per Capita (KWh/cap) 5 086.4 5 610.7 5 797.0 5 262.5 4 708.8 4 668.2
Primary Energy Intensity (toe/M€'10) 156.6 140.0 123.8 111.9 92.4 90.5
Import Dependency (%) -16.4 % -16.9 % 13.4 % 28.2 % 45.5 % 37.4 %
of Solid Fuels 22.2 % 39.6 % 71.9 % 51.9 % 87.5 % 65.4 %
of Hard Coal 21.8 % 39.4 % 71.3 % 52.1 % 86.8 % 64.5 %
of Petroleum Fuels -57.4 % -54.9 % -3.2 % 14.1 % 42.1 % 36.4 %
of Crude and NGL -47.7 % -48.0 % -0.2 % 12.7 % 32.4 % 22.9 %
of Natural Gas 1.0 % -10.7 % 7.0 % 37.9 % 44.9 % 41.8 %
Renewables in Gross Final Energy (%)
Overall RES with Aviation Cap 1.3 % 3.7 % 7.1 % 8.2 %
RES-H&C – Heating and Cooling 0.8 % 2.7 % 4.7 % 5.5 %
RES-E – Electricity Generation 4.1 % 7.4 % 17.9 % 22.4 %
RES-T – Transport 0.5 % 3.3 % 5.3 % 4.4 %
Gases Emissions (Mio ton CO2)
CO2 Emissions* 577.04 587.68 595.53 536.16 463.22 446.21
GHGs Emissions* 765.80 739.77 724.50 643.93 555.85 536.90
Main Emissions Indicators
CO2 per Capita (kg CO2/cap) 9 958.6 9 997.1 9 895.6 8 577.1 7 198.3 6 877.9
Carbon Intensity (kg CO2/toe) 2 568.2 2 526.3 2 521.4 2 485.8 2 406.1 2 309.9
CO2 GDP Intensity (ton CO2/M€'10) 430.8 375.2 330.9 292.5 233.9 220.5
231
EU ENERGY IN FIGURES 2017
Methodology, Sources and Notes: See Appendix 13 – No 5
* Total emissions without LULUCF, with ind. CO2, including international aviation,
excl. international maritime transport.

Appendices

Appendices

235
EU ENERGY IN FIGURES 2017
Summary
Appendices Methodology . . . . . . . . . . . . . . . . . . . . . . . . . . . . . . . . . . . . . . . . . . . . . . . . . . . . . . . . . . . 236
Appendix 1 – Country Nomenclature . . . . . . . . . . . . . . . . . . . . . . . . . . . . . . . . . . . . . . . . . . . 236
Appendix 2 – Main Indicators – EN . . . . . . . . . . . . . . . . . . . . . . . . . . . . . . . . . . . . . . . . . . . . . . 237
Appendix 3 – Main Indicators – DE . . . . . . . . . . . . . . . . . . . . . . . . . . . . . . . . . . . . . . . . . . . . . . 238
Appendix 4 – Main Indicators – FR . . . . . . . . . . . . . . . . . . . . . . . . . . . . . . . . . . . . . . . . . . . . . . 239
Appendix 5 – Main Products – EN . . . . . . . . . . . . . . . . . . . . . . . . . . . . . . . . . . . . . . . . . . . . . . . 240
Appendix 6 – Main Products – DE . . . . . . . . . . . . . . . . . . . . . . . . . . . . . . . . . . . . . . . . . . . . . . . 241
Appendix 7 – Main Products – FR . . . . . . . . . . . . . . . . . . . . . . . . . . . . . . . . . . . . . . . . . . . . . . . . 242
Appendix 8 – Symbols and Abbreviations . . . . . . . . . . . . . . . . . . . . . . . . . . . . . . . . . . . . . . 243
Appendix 9 – SI Units – Prefixes . . . . . . . . . . . . . . . . . . . . . . . . . . . . . . . . . . . . . . . . . . . . . . . . . 244
Appendix 10 – Conversion Factors . . . . . . . . . . . . . . . . . . . . . . . . . . . . . . . . . . . . . . . . . . . . . . 245
Appendix 11 – Average Calorific Values . . . . . . . . . . . . . . . . . . . . . . . . . . . . . . . . . . . . . . . . 246
Appendix Glossary . . . . . . . . . . . . . . . . . . . . . . . . . . . . . . . . . . . . . . . . . . . . . . . . . . . . . . . . . . . . . . . . . . . . . 247
Appendix 12 – Glossary . . . . . . . . . . . . . . . . . . . . . . . . . . . . . . . . . . . . . . . . . . . . . . . . . . . . . . . . . . . 247
Appendix Notes . . . . . . . . . . . . . . . . . . . . . . . . . . . . . . . . . . . . . . . . . . . . . . . . . . . . . . . . . . . . . . . . . . . . . . . . . . 257
Appendix 13 – Notes . . . . . . . . . . . . . . . . . . . . . . . . . . . . . . . . . . . . . . . . . . . . . . . . . . . . . . . . . . . . . . . 257
Notes . . . . . . . . . . . . . . . . . . . . . . . . . . . . . . . . . . . . . . . . . . . . . . . . . . . . . . . . . . . . . . . . . . . . . . . . . . . . . . . . . . . . . . . . 262

236
Appendices
Appendices Methodology
Appendix 1 – Country Nomenclature
Inte
rinst
ituti
onal
Sty
le G
uid
e (
ISG
) Countr
y C
ode
ISG
Short
Nam
e
EN
ISG
Short
Nam
e,
Sourc
e
Language*
ISG
Pro
toco
l O
rder
ISO
31
66
A
lpha-2
Countr
y C
odes
ESTA
TPart
ner
Code
ESTA
T –
Energ
y
Num
eri
c Code
BE Belgium Belgique/België 1 BE 0012 09
BG Bulgaria Bulgaria* 2 BG 0068 82
CZ Czech Republic Česká republika 3 CZ 0061 22
DK Denmark Danmark 4 DK 0008 10
DE Germany Deutschland 5 DE 0004 04
EE Estonia Eesti 6 EE 0053 85
IE Ireland Éire/Ireland 7 IE 0007 12
EL Greece Elláda 8 GR 0009 11
ES Spain España 9 ES 0042 15
FR France France 10 FR 0001 06
HR Croatia Hrvatska 11 HR 0092 84
IT Italy Italia 12 IT 0005 07
CY Cyprus Kýpros 13 CY 0600 21
LV Latvia Latvija 14 LV 0055 24
LT Lithuania Lietuva 15 LT 0054 25
LU Luxembourg Luxembourg 16 LU 0022 13
HU Hungary Magyarország 17 HU 0064 23
MT Malta Malta 18 MT 0085 27
NL Netherlands Nederland 19 NL 0003 08
AT Austria Österreich 20 AT 0038 16
PL Poland Polska 21 PL 0060 87
PT Portugal Portugal 22 PT 0040 14
RO Romania România 23 RO 0066 83
SI Slovenia Slovenija 24 SI 0091 86
SK Slovakia Slovensko 25 SK 0063 26
FI Finland Suomi/Finland 26 FI 0032 18
SE Sweden Sverige 27 SE 0030 17
UK United Kingdom United Kingdom 28 GB 0006 05
* Latin transliterated.
EU Interinstitutional Style Guide (ISG): http://publications.europa.eu/code/
Eurostat Website: http://ec.europa.eu/eurostat/
ISO 3166 Country Codes Maintenance Agency: http://www.iso.org/iso/country_codes/iso_3166_code_lists.htm

237
EU ENERGY IN FIGURES 2017
Appendix 2 – Main Indicators – EN
ESTAT Energy Database – EN
Indicator Code
B_100100 Primary production
B_100200 Recovered products
B_100300 Imports
B_100400 Stock changes
B_100500 Exports
B_100600 Net imports
B_101700 Final energy consumption
B_100800 Bunkers
B_100900 Gross inland consumption
B_101000 Transformation input
B_101100 Transformation output
B_101200 Exchanges, transfers, returns
B_101300 Consumption in energy sector
B_101400 Distribution losses
B_101500 Energy available for final consumption
B_101700 Final energy consumption
B_101800 Final energy consumption – industry
B_101805 Iron and steel
B_101810 Non-ferrous metals
B_101815 Chemical and petrochemical
B_101820 Non-metallic minerals
B_101825 Mining and quarrying
B_101830 Food and tobacco
B_101835 Textile and leather
B_101840 Paper, pulp and print
B_101851 Wood and wood products
B_101852 Construction
B_101900 Final energy consumption – transport
B_101910 Final energy consumption – rail transport
B_101920 Final energy consumption – road transport
B_101930 Final energy consumption – air transport
B_101940 Final energy consumption – inland navigation
B_102000 Final energy consumption – Residential, commerce, etc.
B_102010 Residential
B_102030 Final energy consumption – agriculture
B_102035 Final energy consumption – services
B_102020 Final energy consumption – fisheries
B_102040 Final energy consumption – other sectors
B_102200 Statistical difference
Source: Coded, Eurostat’s Concepts and Definitions Database: http://ec.europa.eu/eurostat/ramon/

238
Appendices
Appendix 3 – Main Indicators – DE
ESTAT Energy Database – DE
Indicator Code
B_100100 Primärerzeugung
B_100200 Wiedergewinnung
B_100300 Gesamteinfuhren
B_100400 Bestandsveränderungen
B_100500 Gesamtausfuhren
B_100600 Nettoeinfuhren
B_101700 Energetischer Endverbrauch
B_100800 Bunker
B_100900 Bruttoinlandsverbrauch
B_101000 Umwandlungseinsatz
B_101100 Umwandlungsausstoß
B_101200 Austausch, Übertragung, Rückläufe
B_101300 Verbrauch des Produktionsbereichs Energie
B_101400 Netzverluste
B_101500 Für den Endverbrauch zur Verfügung stehende Energie
B_101700 Energetischer Endverbrauch
B_101800 Energetischer Endverbrauch der Industrie
B_101805 Energetischer Endverbrauch der Stahlindustrie
B_101810 Energetischer Endverbrauch der NE-Metallindustrie
B_101815 Energetischer Endverbrauch der chemischen Industrie
B_101820Energetischer Endverbrauch der Nichtmetallische Mineralstoffe
verarbeitenden Industrie
B_101825Energetischer Endverbrauch der Erzgewinnungsindustrie
(mit Ausnahme der Brenn- und Kraftstoffgewinnung)
B_101830 Energetischer Endverbrauch der Nahrungs- und Genussmittelindustrie
B_101835 Energetischer Endverbrauch der Textil-, Lederwaren- und Bekleidungsindustrie
B_101840 Energetischer Endverbrauch der Papier- und Druckindustrie
B_101851 Energetischer Endverbrauch der Holz
B_101852 Energetischer Endverbrauch – Baugewerbe
B_101900 Energetischer Endverbrauch im Verkehrssektor
B_101910 Energetischer Endverbrauch des Bahnverkehrs
B_101920 Energetischer Endverbrauch des Strassenverkehrs
B_101930 Energetischer Endverbrauch des Luftverkehrs
B_101940 Energetischer Endverbrauch der Binnenschifffahrt
B_102000 Energetischer Endverbrauch der Privathaushalte, des Handels usw..
B_102010 Energetischer Endverbrauch der Privathaushalte
B_102030 Energetischer Endverbrauch der Landwirtschaft
B_102035 Energetischer Endverbrauch des Dienstleistungssektors
B_102020 Energetischer Endverbrauch des Fischereisektors
B_102040 Energetischer Endverbrauch anderer Sektoren
B_102200 Statistische Differenz
Source: Coded, Eurostat Datenbank für Konzepte und Begriffe: http://ec.europa.eu/eurostat/ramon/

239
EU ENERGY IN FIGURES 2017
Appendix 4 – Main Indicators – FR
ESTAT Energy Database – FR
Indicator Code
B_100100 Production primaire
B_100200 Récupération
B_100300 Importations totales
B_100400 Variations de stocks
B_100500 Exportations totales
B_100600 Importations nettes
B_101700 Consommation finale énergétique
B_100800 Soutes maritimes
B_100900 Consommation intérieure brute
B_101000 Entrées en transformation
B_101100 Sorties de transformation
B_101200 Échanges, transferts, restitutions
B_101300 Consommation de la branche énergie
B_101400 Pertes sur les réseaux
B_101500 Disponible pour la consommation finale
B_101700 Consommation finale énergétique
B_101800 Consommation finale énergétique – industrie
B_101805 Consommation finale énergétique – sidérurgie
B_101810 Consommation finale énergétique – métaux non ferreux
B_101815 Consommation finale énergétique – chimie et pétrochimie
B_101820 Consommation finale énergétique – minéraux non métalliques
B_101825 Consommation finale énergétique – extraction
B_101830 Consommation finale énergétique – aliments, boissons
B_101835 Consommation finale énergétique – textile, cuir, habillement
B_101840 Consommation finale énergétique – papier, carton, imprimerie
B_101851 Consommation finale énergétique – bois
B_101852 Consommation finale énergétique – construction
B_101900 Consommation finale énergétique – transports
B_101910 Consommation finale énergétique – transports ferroviaires
B_101920 Consommation finale énergétique – transports routiers
B_101930 Consommation finale énergétique – transports aériens
B_101940 Consommation finale énergétique – navigation intérieure
B_102000 Consommation finale énergétique – foyers, etc.
B_102010 Consommation finale énergétique – ménages
B_102030 Consommation finale énergétique – agriculture
B_102035 Consommation finale énergétique – services
B_102020 Consommation finale énergétique – pêche
B_102040 Consommation finale énergétique – autres
B_102200 Écart statistique
Source: Coded, Base de Données de Concepts et Définitions d’Eurostat: http://ec.europa.eu/eurostat/
ramon/

240
Appendices
Appendix 5 – Main Products – EN
ESTAT Energy Database – EN
Indicator Code
0000 All products
2000 Solid fuels
2100 Hard coal and derivatives
2111 Hard coal
2112 Patent fuels
2120 Coke
2200 Lignite and derivatives
3000 Total petroleum and products
3100 Crude oil and feedstocks
3105 Crude oil
3110 Crude oil and NGL
3190 Feedstocks
3200 All petroleum product
3220 LPG
3230 Motor spirit
3234 Motor gasoline, unleaded motor spirit
3240 Kerosenes – jet fuels
3250 Naphtha
3260 Gas / diesel oil
3270A Residual fuel oil
4000 Gas
4100 Natural gas
4200 Derived gas
5100 Nuclear power
5200 Derived heat
5500 Renewable energies
5510 Hydro power
5520 Wind energy
5530 Solar energy
5535 Tide/wave/ocean energy
5540 Biomass and wastes
5541 Wood and wood waste
5542 Biogas
55431 Municipal solid wastes – RES
5545 Biofuels
5546 Biogasoline
5547 Biodiesel
5550 Geothermal energy
6000 Electrical energy
7100 Industrial waste
Source: Coded, Eurostat’s Concepts and Definitions Database: http://ec.europa.eu/eurostat/ramon/

241
EU ENERGY IN FIGURES 2017
Appendix 6 – Main Products – DE
ESTAT Energy Database – DE
Indicator Code
0000 Alle produkte
2000 Feste Brennstoffe
2100 Steinkohle und Nebenprodukte
2111 Steinkohle
2112 Steinkohlebriketts
2120 Koks
2200 Braunkohle und Nebenprodukte
3000 Rohöl und Mineralölerzeugnisse
3100 Rohöl und Feedstocks
3105 Rohöl
3110 Rohöl und Erdgaskondensate
3190 Feedstocks
3200 Alle Mineralölerzeugnisse
3220 Flüssiggas
3230 Motorenbenzin
3234 Unverbleites Benzin
3240 Petroleum und Flugturbinenkraftstoffe
3250 Rohbenzin
3260 Dieselkraftstoffe und Destillatheizöle
3270A Rückstandsheizöle
4000 Gas
4100 Naturgas
4200 Abgeleitete Gase
4100 Kernenergie
5200 Abgeleitete Wärme
5500 Erneuerbare Energien
5510 Wasserkraftenergie
5520 Windenergie
5530 Sonnenenergie
5535 Gezeiten-/Wellen-/Meeresenergie
5540 Biomasse und Abfälle
5541 Holz und Holzabfälle
5542 Biogas
55431 Hausmüll Erneuerbare
5545 Biotreibstoff
5546 Biobenzin
5547 Biodiesel
5550 Geothermische Energie
6000 Elektrizität
7100 Industrieabfälle
Source: Coded, Eurostat Datenbank für Konzepte und Begriffe: http://ec.europa.eu/eurostat/ramon/

242
Appendices
Appendix 7 – Main Products – FR
ESTAT Energy Database – FR
Indicator Code
0000 Tous produits
2000 Combustibles solides
2100 Houille et dérivés solides
2111 Houille
2112 Agglomérés de houille
2120 Coke
2200 Lignite et dérivés
3000 Pétrole brut et produits pétroliers
3100 Pétrole brut et feedstocks
3105 Pétrole brut
3110 Pétrole brut et liquides de gaz naturel
3190 Feedstocks
3200 Tous produits pétroliers
3220 GPL
3230 Essences moteurs
3234 Essences sans plomb
3240 Pétrole lampant et carburéacteurs
3250 Naphta
3260 Gasoil et fuel oil fluide
3270A Fuel oil résiduel
4000 Gaz
4100 Gaz naturel
4200 Gaz dérivés
5100 Énergie nucléaire
5200 Chaleur dérivée
5500 Énergies renouvelables
5510 Hydro-électricité
5520 Énergie éolienne
5530 Énergie solaire
5535 Énergie hydrocinétique/houlomotrice/marémotrice
5540 Biomasse/déchets
5541 Bois – déchets de bois
5542 Biogaz
55431 Déchets urbains solides renouvelables
5545 Biocarburants
5546 Bioessence
5547 Biodiesel
5550 Énergie géothermique
6000 Énergie électrique
7100 Déchets industriels
Source: Coded, Base de Données de Concepts et Définitions d’Eurostat: http://ec.europa.eu/eurostat/
ramon/

243
EU ENERGY IN FIGURES 2017
Appendix 8 – Symbols and Abbreviations% per cent
€ euro
0 zero or figure less than half of the unit represented
bbl barrel
bcm billion cubic meters
Blank data not available
CHP combined heat & power
CO2 carbon dioxide
DG Directorate-General of the European Commission
EEA European Environment Agency
equiv. equivalent
ESTAT Eurostat, Statistical Office of the European Union
GCV gross calorific value
GDP gross domestic product
GHG greenhouse gas
GJ gigajoule
IEA International Energy Agency
k thousand
kgoe kilogram of oil equivalent
ktoe kiloton of oil equivalent
kton kiloton
kWh kilowatt hour
LPG liquefied petroleum gas
M€ '2010 millions of euro, chain-linked volumes, reference year 2010,
at 2010 exchange rates
m3 cubic meter
Mio million
MS European Union Member State
MSW municipal solid waste
Mtoe million ton of oil equivalent
MW megawatt
MWh megawatt hour
NCV net calorific value
NGL natural gas liquid
p/cap per capita
PJ petajoule
PV photovoltaic
RES renewable energy
RES-E renewable energy – electricity generation
RES-H&C renewable energy – heating and cooling
RES-T renewable energy – transport
SI Units International System of Units
TJ terajoule
toe ton of oil equivalent
ton metric ton, metric tonne, mt
TPES Total Primary Energy Supply
TWh terawatt hour
UNFCCC United Nations Framework Convention on Climate Change
VAT value added tax

244
Appendices
Appendix 9 – SI Units – Prefixes
Standard Prefixes for the SI Units of Measure
Multiple Sub-Multiple
10 1 deca (da) 10 -1 deci (d)
10 2 hecto (h) 10 -2 centi (c)
10 3 kilo (k) 10 -3 milli (m)
10 6 mega (M) 10 -6 micro (μ)
10 9 giga (G) 10 -9 nano (n)
10 12 tera (T) 10 -12 pico (p)
10 15 peta (P) 10 -15 femto (f)
10 18 exa (E) 10 -18 atto (a)
10 21 zetta (Z) 10 -21 zepto (z)
10 24 yotta (Y) 10 -24 yocto (y)

245
EU ENERGY IN FIGURES 2017
Appendix 10 – Conversion Factors
ENERGY
TO: TJ Gcal Mtoe GWh
Multiply by
FR
OM
:
Terajoule �TJ� 1 238.8 2.388 x 10 -5 0.2778
Gigacalorie (Gcal) 4.1868 x 10 -3 1 1 x 10 -7 1.163 x 10 -3
Million ton of oil equivalent (Mtoe)
4.1868 x 10 4 1 x 10 7 1 11 630
Gigawatt-hour GWh 3.6 860 8.6 x 10 -5 1
VOLUME
TO: l bbl gal US gal UK
Multiply by
FR
OM
:
Litre (l) 1 0.6290 x 10 -2 0.2642 0.2200
Barrel (bbl) 158.99 1 42 34.9723
US gallon (gal US) 3.7854 0.2381 x 10 -1 1 0.8327
UK gallon (gal UK) 4.5461 0.2859 x 10 -1 1.2009 1
MASS
TO: t lt st
Multiply by
FR
OM
: Ton, Tonne (t) 1 0.9842 1.1023
Long ton (lt) UK 1.0160 1 1.1200
Short ton (st) US 0.9072 0.8929 1

246
Appendices
Appendix 11 – Average Calorific Values
Energy Content
kJ (NCV) kgoe (NCV)
Hard Coal 1 kg 17 200 – 30 700 0.411 – 0.733
Recovered Hard Coal 1 kg 13 800 – 28 300 0.330 – 0.676
Patent Fuels 1 kg 26 800 – 31 400 0.640 – 0.750
Hard Coke 1 kg 28 500 0.681
Brown Coal 1 kg 5 600 – 10 500 0.134 – 0.251
Black Lignite 1 kg 10 500 – 21 000 0.251 – 0.502
Peat 1 kg 7 800 – 13 800 0.186 – 0.330
Brown Coal Briquettes 1 kg 20 000 0.478
Tar 1 kg 37 700 0.900
Benzol 1 kg 39 500 0.943
Oil Equivalent 1 kg 41 868 1
Crude Oil 1 kg 41 600 – 42 800 0.994 – 1.022
Feedstocks 1 kg 42 500 1.015
Refinery Gas 1 kg 50 000 1.194
LPG 1 kg 46 000 1.099
Motor Spirit 1 kg 44 000 1.051
Kerosenes, Jet Fuel 1 kg 43 000 1.027
Naphtha 1 kg 44 000 1.051
Gas Diesel Oil 1 kg 42 300 1.010
Residual Fuel Oil 1 kg 40 000 0.955
White Spirit 1 kg 44 000 1.051
Lubricants 1 kg 42 300 1.010
Bitumen 1 kg 37 700 0.900
Petroleum Cokes 1 kg 31 400 0.750
Other Petro. Products 1 kg 30 000 0.717
Electrical Energy 1 kWh 3 600 0.086

247
EU ENERGY IN FIGURES 2017
Appendix Glossary
Appendix 12 – Glossary
In parenthesis EUROSTAT Energy database/EUROBASE, (Energy section)
codes for products (p:) and indicators (B_), as of May 2017.
ALL FUELS
The code ‘all fuels’, (p: 0000), covers all energy products. These consist of
hard coal and derivatives, lignite and derivatives, peat and derivatives, oil
shale and oil sands, petroleum (crude oil) and petroleum products (such
as LPG, refinery gas, motor spirit, kerosene, gas/diesel oil, residual fuel
oil), natural gas, manufactured gases, derived heat, renewable energies
(such as hydro power, wind energy, biomass, wastes, geothermal energy),
electrical energy and nuclear power.
ANNUAL INSTALLED CAPACITY
Annual installed or new installed capacity of a given source refers to the
capacity entering in operation, during a year period.
AUTOPRODUCER THERMAL POWER STATIONS
Autoproducer thermal power stations are defined as undertakings which
generate electricity wholly or partly for their own use as an activity which
supports their primary activity.
AVAILABLE FOR FINAL CONSUMPTION �ENERGY�
Energy available for final consumption covers the energy placed at the
disposal of final users. This code is calculated as follows: gross inland
consumption (B_100900) + transformation output (B_101100) - trans-
formation input (B_101000) + exchanges, transfers, returns (B_101200)
- consumption of the energy sector (B_101300) - distribution losses
(B_101400).
BIOFUELS
Liquid or gaseous fuels used primarily for transport, produced from bio-
mass, and wastes (p:5545). Liquid biofuels cover bioethanol (ethanol pro-
duced from biomass), biodiesel (diesel produced from biomass or used
fried oil), bio methanol, bio-dimethylether and bio-oil (a pyrolysis oil fuel
produced from biomass).
The code biofuels (p:5545), groups biogasoline (p:5546), biodiesel (p:5547),
bio jet kerosene (p:5549) and other liquid biofuels (p:5548).

248
Appendices
BIOMASS AND RES WASTES
Biomass and RES wastes (p: 5540), covers organic, non-fossil material of
biological origin, which may be used for heat production or electricity gener-
ation. They comprise wood and wood waste (p: 5541), biogas (p: 5542), mu-
nicipal RES solid waste (p:55431), charcoal (p:5544) and biofuels (p: 5545).
The non-renewable part of municipal waste (p: 55432) and the industrial
waste (p:7100) are included in Wastes non-RES (p:7200).
CAPACITY FACTOR – ANNUAL AVERAGE
It is a measure of efficiency, which is defined as the ratio of actual energy
output of a source against its annual maximum potential output, or in
other words, to the energy it would produce if operated at full rated power
for 24 hours per day during a year. It is equal to the total annual energy
production, divided by the cumulative capacity converted to average sta-
tistical year base.
CARBON ENERGY INTENSITY
This is the average emission rate of CO2 relative to the intensity of the
energy activity. It is calculated, in the tables, in kg CO2 emissions per ton of
oil equivalent of energy used.
CARBON GDP INTENSITY
This represents the average emission rate of CO2 emissions of an economy
relative to its GDP.
CHP – COMBINED HEAT AND POWER
A combined heat and power unit is an installation in which energy released
from fuel combustion is partly used for generating electrical energy and
partly for supplying heat for various purposes.
The definition of Combined Heat and Power (CHP) or ‘cogeneration’ implies
that heat and electricity are produced simultaneously in one process.
CO2 ENERGY INTENSITY
Vide Carbon Energy Intensity.
CONVENTIONAL THERMAL POWER
It is a technology for the production of electricity by fuel combustion. It will in-
clude biomass use, which is also considered a renewable source of electricity.
Thermal power stations cover conventional public utility power stations for
the production of electricity and heat, as well as in auto-producer power
stations for the generation of electricity and heat sold to third parties only.
CUMULATIVE INSTALLED CAPACITY
This represents the running sum for consecutive periods of a given installed
source. It indicates the total capacity availability in each of those periods.

249
EU ENERGY IN FIGURES 2017
ELECTRICITY MIX
The electricity mix is the proportion of different sources in electricity pro-
duction. While energy mix is measured at gross inland consumption level,
electricity mix is measured at energy transformation level.
ENERGY AVAILABLE FOR FINAL CONSUMPTION
Energy available for final consumption, (B_101500), covers the energy
placed at the disposal of final users. This code is calculated as follows:
gross inland consumption + transformation output - transformation input
+ exchanges, transfers, returns - consumption of the energy sector -
distribution losses. It includes final non energy consumption, (B_101600).
ENERGY IMPORT DEPENDENCY
Energy dependency shows the extent to which a country relies upon im-
ports in order to meet its energy needs. It is calculated using the following
formula: net imports (B_100300–B_100500)/(gross inland consumption
(B_100900) + bunkers (B_100800)).
ENERGY INTENSITY
Energy intensity gives an indication of the effectiveness with which energy
is being used to produce added value. It is defined as the ratio of gross
inland consumption of energy (B_100900), to gross domestic product.
ENERGY MIX
The energy mix is the proportion of different sources in energy production,
supply side, at gross inland consumption level.
ENERGY SECTOR BROAD DEFINITION
It includes the electricity, gas, steam, and air conditioning supply sector as
well as the energy commodities production activities, mining and extrac-
tion, support activities and manufacture of energy products.
ENERGY SECTOR NARROW DEFINITION
It includes the electricity, gas, steam, and air conditioning supply sector.
EUROBASE
The Eurostat, web based, dissemination database contains the full range
of publically available data from Eurostat.
FINAL ENERGY CONSUMPTION �FEC�
Final energy consumption covers energy supplied to the final consumer’s
door for all energy uses, (B_101700). It excludes deliveries to the energy
transformation sector (B_101000…) and to the energy industries them-
selves (B_101300…). It is the sum of final energy consumption by indus-
try (B_101800), transport (B_101900), household (B_102010), services
(B_102035), agriculture/forestry (B_102030), fishing (B_102020) and
other unspecified (B_102040).

250
Appendices
FINAL ENERGY CONSUMPTION � TRANSPORT
Final energy consumption – transport, (B_101900), covers the consumption in
all types of transportation, i.e., rail, road, air transport and inland navigation.
FINAL NON�ENERGY CONSUMPTION �FNEC�
Final non-energy consumption covers the use of energy products for non-
energy purposes (B_101600). It is the sum of final non-energy consump-
tion in the chemical industry, (B_101601) and in non-chemical industries
(B_101602).
GASES, GASEOUS FUELS
Gases covers fossil natural gas and derived gases, coke oven gas (p:4210),
blast furnace gas (p:4220), gas work gas (p:4230), and oxygen steel fur-
nace gas (p:4240). Gases (p:4000) is the sum of natural gas (p:4100) and
derived gases (p:4200).
GDP – GROSS DOMESTIC PRODUCT
The gross domestic product is the value of the output of all goods and
services produced within the borders of a country.
The income measure of gross domestic product (GDP) is derived as com-
pensation of employees plus gross operating surplus plus gross mixed in-
comes plus taxes less subsidies on both production and imports.
GDP AT CONSTANT MARKET PRICES
GDP values, used, were referenced to year 2010, in millions of euro, chain-
linked volumes, at 2010 exchange rates.
GHG – GREEN HOUSES GASES
GHG includes gases that contribute to the natural greenhouse effect. The
Kyoto Protocol covers a basket of six greenhouse gases (GHGs) produced
by human activities: Carbon dioxide, methane, nitrous oxide, hydro fluoro-
carbons, perfluorocarbons and sulphur hexafluoride.
GROSS CALORIFIC VALUE �GCV�
The gross calorific value is the total amount of heat released by a unit
quantity of fuel, when it is burned completely with oxygen, and when the
products of combustion are returned to ambient temperature. This quanti-
ty includes the heat of condensation of any water vapour contained in the
fuel and of the water vapour formed by the combustion of any hydrogen
contained in the fuel.
GROSS ELECTRICITY GENERATION
The gross electricity generation is measured at the outlet of the main
transformers, i.e. the consumption of electricity in the plant auxiliaries and
in transformers is included.

251
EU ENERGY IN FIGURES 2017
GROSS ELECTRICITY GENERATION PENETRATION LEVEL
Electricity penetration level refers to the fraction of gross electricity pro-
duction of a source, compared with the total gross electricity generation,
all sources.
GROSS FINAL CONSUMPTION OF ENERGY
Gross final consumption of energy means the energy commodities de-
livered for energy purposes, including the consumption of electricity and
heat, by the energy branch for electricity and heat production including
losses of electricity and heat in distribution. It excludes the final non en-
ergy use (FNEC).
The gross (overall) final consumption of energy from renewable sources
is calculated as the sum of: (a) gross final consumption of electricity from
renewable energy sources; (b) gross final consumption of energy from
renewable sources for heating and cooling; and (c) final consumption of
energy from renewable sources in transport.
GROSS HEAT PRODUCED
It is the total heat produced, including losses in the installations/network heat
exchanges, as well as heat from chemical processes used as primary energy
form. For auto-producers, the heat used by the undertaking for its own pro-
cesses is not included here. Only heat sold to third parties should be reported.
GROSS INLAND CONSUMPTION �GIC�
Gross inland consumption represents the quantity of energy necessary to
satisfy inland consumption of the geographical entity under consideration,
(B_100900). It is calculated using the following formula: indigenous pro-
duction (B_100100) + primary product receipts (B_100110)+ recovered
products from other sources (B_100200)+ recycled products (B_100210)
+ imports (B_100300) + stock changes (B_100400) - exports (B_100500)
- international marine bunkers (B_100800).
GROSS INSTALLED �ELECTRICITY� CAPACITY
This covers the gross installed electrical capacity of thermal, nuclear, hydro,
geothermal, wind and any other types of power plants.
ISIC
The International Standard Industrial Classification of All Economic Activi-
ties is a United Nations system for classifying economic activity data, in
the fields of production, employment, gross domestic product and other
statistical areas.
ISG
The Inter-institutional style guide is intended to serve as a reference tool
for written works for all European Union institutions, bodies and organisa-
tions, representing an achievement in linguistic harmonisation.

252
Appendices
INHABITANTS
This represents the group of persons fulfilling the requirements for legal
permanent residency in a region/country.
LFS
The EU Labour Force Survey (LFS) is a large sample survey among private
residential which provides detailed annual and quarterly data on: employ-
ment, unemployment and inactivity.
The LFS is an important source of information about the situation and
trends in the EU labour market, with a sample size is about 1.5 million
people every quarter.
The data can be broken down along many dimensions including age, sex,
educational attainment, and distinctions between permanent/temporary
and full-time/part-time employment. In terms of employment figures are
more representative of the total sector, but unfortunately not so disag-
gregated as the SBS survey.
LONG SCALE � SHORT SCALE
The long and short scales are two of several different large-number nam-
ing systems used for integer powers of ten.
Many countries, including most in continental Europe, use the long scale
whereas most English-speaking countries and Arabic-speaking countries
use the short scale.
In the long scale every new term greater than a million is a million times
the previous term. Thus, billion means a million millions, trillion means
a million billions, and so on.
In the short scale every new term greater than million is 1 000 times the
previous term. Thus, billion means a thousand millions, trillion means a thou-
sand billions.
NameLong Scale Value
in Scientific notation
Short Scale Value
in Scientific notation
million 10 6 10 6
billion 10 12 10 9
trillion 10 18 10 12
to the next: to the next:
multiply by 1 000 000 multiply by 1 000
Milliard, is used in several languages that use the long scale to represent a corresponding value to
billions in short scale, i.e. 109.
NACE
NACE is the acronym used to designate the various statistical classifica-
tions of economic activities developed since 1970 in the European Union.
It provides the framework for collecting and presenting a large range of
statistical data according to economic activity in the fields of economic
statistics (e.g. production, employment, national accounts) and in other
statistical domains.

253
EU ENERGY IN FIGURES 2017
NET CALORIFIC VALUE �NCV�
The net calorific value is the amount of heat released by a unit quantity
of fuel, when it is burned completely with oxygen, and when the products
of combustion are returned to ambient temperature. This quantity does
not include the heat of condensation of any water vapour contained in the
fuel nor of the water vapour formed by the combustion of any hydrogen
contained in the fuel.
NET IMPORTS
Net import is calculated as the difference between imports (B_100300)
and exports (B_100500).
NET ELECTRICITY GENERATION
It is the amount of gross generation a generator produces less the electric-
ity used to operate the plant.
PETROLEUM AND PRODUCTS
Petroleum and (petroleum) sub-products include crude oil (p: 3105), natu-
ral gas liquids (p:3106), feedstocks (p:3190) and all petroleum sub-prod-
ucts such as LPG (p:3220), refinery gas (p:3210), motor gasoline (p:3234)
aviation gasoline (p:3235), kerosene and jet fuels (p:3240), naphtha
(p:3250), gas/diesel oil (p:3260), residual fuel oil (p:3270A), white spirit,
lubricants, bitumen, petroleum coke (p:3280) and other petroleum prod-
ucts (p:3295). Petroleum and petroleum products (p:3000) is the sum of
Crude oil, NGL, feedstocks, and other hydrocarbon (p:3100) and all petro-
leum sub-products (p:3200).
PRIMARY ENERGY CONSUMPTION
Primary energy corresponds to the gross inland consumption minus the
energy included in the final non-energy consumption.
PRIMARY ENERGY INTENSITY
Primary energy intensity gives an indication of the effectiveness with which
primary energy consumption produces added value. It is defined as the
ratio of primary energy consumption to gross domestic product.
PRIMARY ENERGY PRODUCTION – INDIGENOUS PRODUCTION
Any kind of extraction of energy products from natural sources to a us-
able form is called primary production. Primary production takes place
when the natural sources are exploited, for example in coal mines, crude
oil fields, hydro power plants or fabrication of biofuels. Transformation of
energy from one form to another, such as electricity or heat generation in
thermal power plants, or coke production in coke ovens, is not included in
primary production (B_100100).

254
Appendices
The precise definition depends on the fuel involved:
> SOLID FOSSIL FUELS: HARD COAL, LIGNITE, PEAT…
Quantities of fuels extracted or produced, calculated after any operation for
removal of inert matter. In general, production includes the quantities con-
sumed by the producer during the production as well as any quantities sup-
plied to other on-site producers of energy for transformation or other uses.
> LIQUID FOSSIL FUELS: PETROLEUM AND PETROLEUM SUB PRODUCTS
Quantities of fuels extracted or produced within national boundaries, in-
cluding off-shore production. Production includes only marketable pro-
duction, and excludes any quantities returned to formation. Production
includes all crude oil, natural gas liquids (NGL), condensates and oil from
shale and tar sands, etc.
> GAS FOSSIL FUELS: NATURAL GAS AND DERIVED GAS
Quantities of dry gas, measured after purification and extraction of natural
gas liquids and sulphur. The production includes only marketable produc-
tion, and excludes any quantities re-injected, vented and flared, and any
extraction losses. The production includes all quantities used within the nat-
ural gas industry, in gas extraction, pipeline systems and processing plants.
> NUCLEAR HEAT
Quantities of heat produced in a reactor. Production is the actual heat pro-
duced or the heat calculated on the basis of the gross electricity generated
and the thermal efficiency of the nuclear plant.
> RENEWABLE ENERGY
> Hydropower, Wind energy, Solar thermal, Solar photovoltaic energy...
Quantities of electricity generated. Production is calculated on the basis of
the gross electricity generated and a conversion factor of 3 600 kJ/kWh.
> Geothermal energy
Quantities of heat extracted from geothermal fluids. Production is cal-
culated on the basis of the difference between the enthalpy of the fluid
produced in the production borehole and that of the fluid disposed of
via the re-injection borehole.
> Biomass/Wastes
In the case of municipal solid wastes (MSW), wood, wood wastes and
other solid wastes, production is the heat produced after combustion
and corresponds to the heat content (NCV) of the fuel. In the case
of anaerobic digestion of wet wastes, production is the heat content
(NCV) of the biogases produced. The production includes all quantities
of gas consumed in the installation for the fermentation processes,
and excludes all quantities of flared gases. In the case of biofuels, the
production is the heat content (NCV) of the fuel .In the case of biofuels,
the production is the heat content (NCV) of the fuel.

255
EU ENERGY IN FIGURES 2017
PUMPING, PUMPED STORAGE
Method for storing electrical energy at hydroelectric installations by
pumping water between reservoirs at different altitudes.
RENEWABLE ENERGY SOURCES �RES�
Vide Primary Energy Production.
PUBLIC SUPPLY THERMAL POWER STATIONS
Are defined as undertakings which generate electricity (and heat) for sale to
third parties as their primary activity. They may be privately or publicly owned.
SOLAR ENERGY
Solar radiation exploited for hot water production - solar thermal (p:5532)
and electricity generation – solar photovoltaic (p:5534). This energy pro-
duction (p:5530), is the heat available to the heat transfer medium, i.e. the
incident solar energy less the optical and collectors’ losses.
SOLID FUELS
Solid fuels cover solid fossil fuels such as hard coal (p: 2111), coal patent
fuels (p: 2112), coke (p: 2120), coal tar (p: 2130), lignite (p: 2210), brown-
coal briquettes and peat briquettes (p: 2230) and peat (p: 2310). Solid
fuels (p: 2000) is the sum of the codes hard coal and derivatives (p: 2100)
and lignite and derivatives (p: 2200).
SBS
Structural business statistics cover industry, construction, trade and services.
Presented according to the NACE activity classification, they describe the
structure, conduct and performance of businesses across the European Union.
TONNE OF OIL EQUIVALENT �toe�
The tonne of oil equivalent is a conventional standardised unit for measur-
ing energy, defined on the basis of a tonne of oil with a net calorific value
of 41 868 kilojoules/kg.
TPES
Total primary energy supply, an IEA definition, represents the quantity of
energy necessary to satisfy inland consumption of the geographical entity
under consideration. It corresponds to EUROSTAT gross inland consump-
tion. It is equal to the indigenous production + imports - exports - interna-
tional marine bunkers +/- stock changes.

256
Appendices
TRANSFORMATION INPUT
Covers all inputs into the transformation plants destined to be convert-
ed into derived products, (B_101000). Transformation is only recorded
when the energy products are physically or chemically modified to pro-
duce other energy products, electricity and/or heat. It is the sum of the
Input to conventional thermal power stations (B_101001), Input to nuclear
power stations (B_101002), Input to patent fuel and briquetting plants
(B_101003), Input to coke-oven plants (B_101004), Input to blast furnace
plants (B_101006), Input to gas-works (B_101007), Input to refineries
(B_101008), Input to district heating plants and (B_ 101009).
TRANSFORMATION OUTPUT
It is the result of the transformation process of energy, (B_101100). This
output covers derived products, namely: patent fuel, coke, brown-coal
and peat briquettes, pitch, tar, benzol, refined petroleum products, de-
rived gases, electricity from conventional thermal and nuclear power
stations and derived heat. Transformation output refers always to gross
production of derived products, i.e. the own consumption of the transfor-
mation plants is included. It is the sum of the Output from conventional
thermal power stations (B_101101), Output from nuclear power stations
(B_101102), Output from patent fuel and briquetting plants (B_101103),
Output from coke-oven plants (B_101104), Output from blast furnace
plants (B_101106), Output from gas-works (B_101107), Output from re-
fineries (B_101108) and Output from district heating plants (B_101109).
TRANSFORMATION LOSSES
The difference between transformation input and transformation output
constitutes transformation losses.
TURNOVER
Or Gross Premium Written comprises the totals invoiced by the observa-
tion unit during the reference period, and this corresponds to market sales
of goods or services supplied to third parties.
UNEMPLOYMENT RATE
The unemployment rate represents unemployed persons as a percentage
of the active population.

257
EU ENERGY IN FIGURES 2017
Appendix Notes
Appendix 13 – Notes
APPENDIX 13.1
1.1.1, 1.1.2 PAGES 10, 11
Energy production corresponds to the indigenous energy production
(IEA methodology). It does not include production from other sources.
Asia aggregation does not include China data.
1.1.2, 1.1.4, 1.1.6, 1.1.8, PAGES 11, 13, 15 AND 17
Solid fuels, includes hard coal, lignite and peat, as well as derived fuels.
Petroleum and (petroleum) sub-products comprises crude oil, NGL, feed-
stock, additives as well as other hydrocarbons.
RES (renewables) is equal to the sum of hydro, geothermal, solar PV, solar
thermal, tide, wind, municipal waste, primary solid biofuels, biogases, bio
gasoline, biodiesel, other liquid biofuels, non-specified biofuels and char-
coal energy. Industrial waste not included.
1.1.3, 1.1.4, PAGES 12, 13
Gross inland consumption, EUROSTAT methodology (see glossary), corre-
sponds to the Total primary energy supply (see glossary TPES), of the IEA
methodology.
Asia aggregation does not include China data.
1.1.5, 1.1.6, PAGES 14, 15
Final energy consumption covers energy supplied to the final consumer’s
door for all energy uses.
Asia aggregation does not include China data.
1.1.8, PAGE 17
It is the total heat produced, including losses in the installations/network
heat exchanges. However only autoproducers heat sold to third parties is
here included. Autoproducers heat, used by the undertaking for their own
processes, is excluded.
1.1.10, PAGE 19
CO2 Intensity refers to CO
2 emissions activity intensity, measured by its
energy gross inland consumption.
1.2.5, PAGE 25
Natural gas, crude oil and solid fuels (p:4100, p:3105 and p:2000).
1.3.1, PAGE 27
Overall RES share, measured against the total gross final energy consumption.

258
Appendices
APPENDIX 13.2
2.1.1, PAGES 35�37
Production comprises primary production and products recovered from
other sources, (B_100100 + B_100110+ B_100200+ B_100210).
2.1.2, PAGES 38�40
Net imports correspond to the total imports minus the total exports,
(B_100300 – B_100500).
2.1.3, PAGES 41�44
Gross inland consumption represents the quantity of energy necessary to
satisfy inland consumption of the geographical entity under consideration,
(B_100900).
2.2.1, PAGES 45�49
Solid fuels, (p:2000), cover solid fossil fuels such as hard coal, coal patent
fuels, coke, coal tar, lignite, brown-coal briquettes, peat briquettes, peat and
oil sands. Hard coal, (p:2111), comprises, only, coking coal and steam coal.
2.2.2, PAGES 50�54
Total Petroleum and sub-petroleum products, (p:3000), include crude oil
(p: 3105), natural gas liquids (p:3106), feedstock (p:3190) and all petro-
leum sub-products. Crude oil and NGL (p:3110) is a subgroup containing
only crude oil (p: 3105) and natural gas liquids (p:3106) codes.
2.2.3, PAGES 55�58
Gases, (p:4000), include natural gas (p:4100) and derived gases (p:4200).
2.2.5, PAGES 63�65
For products see former points 2.2.1 to 2.2.3.
2.3, PAGES 66�72
See, glossary energy import dependency, appendix 12.
Please note that hard coal dependency is a part of the solid fuels depend-
ency, natural gas, of the gases dependency, and crude and NGL of the to-
tal petroleum and petroleum sub-products dependency. The total import
dependency – covers all fuels, and it is not a simple average of the upper
mentioned products.
2.5.1, PAGE 79
Energy available for final consumption covers the energy placed at the
disposal of final users. It includes final non energy consumption.
2.5.2, PAGES 80�83
Final energy consumption covers energy supplied to the final consumer’s
door for all energy uses. It does not include final non-energy consumption.

259
EU ENERGY IN FIGURES 2017
2.5.3, PAGE 84
Final non-energy consumption covers the use of energy products in non-
energy purposes.
2.5.4, PAGE 85
Primary energy intensity corresponds to the gross inland consumption mi-
nus the energy included in the final non-energy consumption, (B_100900-
B_101600).
2.6.1, PAGES 86�88
Installed capacity represents the maximum active power that can be sup-
plied, continuously, with all systems running.
Please note that combustible fuels include not only fossil fuels, as well
as biomass and wastes, that are later included, also, in the renewables
installed capacity.
2.6.2, PAGES 89�93
The gross electricity generation is measured at the outlet of the main
transformers, i.e. the consumption of electricity in the plant auxiliaries and
in transformers is included.
2.7.1, PAGES 95�96
The share of the solar and wind energy is measured against to total in-
stalled capacity, all sources.
2.7.2�2.7.8, PAGES 97�105
Wind and solar energy generated by all producers. Annual installed capacity
includes new installations and replacement of former wind or solar systems.
2.7.3, 2.7.4, PAGES 100�101
Gross electricity production wind share measures the percentage of wind
produced electricity in the total production.
Average capacity factor it is the ratio of actual energy output of wind
sources against its annual maximum potential output. It is equal to the
total annual electricity production, divided by the cumulative capacity
converted to an average statistical year base.
2.7.8, PAGE 105
Gross electricity production solar share measures the percentage of solar
produced electricity in the total production.
2.8, PAGES 106�108
The data collection for CHP generation is not based in the annual Heat
survey, but instead in a specific survey in accordance with the Community
Directive 2004/8/EC.
Differences can appear between the two datasets, especially due to the
more restrictive methodology employed in the CHP Directive.

260
Appendices
While the Directive includes the production of all heat, sold to third parties,
under the Directive approach only heat/electricity obeying high-efficiency
criteria, is considered. However own heat used by the undertaking for its
own processes, is here included.
2.9, PAGES 109�111
Data is generated by the annual heat survey. Heat, in these tables, include
the total heat produced, including losses in the installations/network heat
exchanges, as well as heat from chemical processes used as primary en-
ergy form. Only heat sold to third parties is here reported.
2.10, PAGES 112�114
The tables include the total final energy consumption of petroleum prod-
ucts, and two of its main products: motor gasoline (p:3234), and gas diesel
(p:3260), and the total final energy consumption of biofuels (p:5545), and
its two main products: biogasoline (p:5546) and biodiesel (p:5547).
2.11.1, PAGE 115
Energy intensity gives an indication of the effectiveness with which energy
is being used (GIC) to produce an added value (GDP).
2.11.4, PAGE 118
Primary energy intensity gives an indication of the effectiveness with which
primary energy is being used (GIC-FNEC) to produce an added value (GDP).
2.13, PAGES 123�129
All available price data has been used in the calculation of EU-wide fuel price
averages. The overall EU price is an average of the prices in the individual
countries weighted by their consumption.
PETROLEUM PRODUCTS
Heating gasoil, low sulphur fuel oil, unleaded petrol and automotive diesel
prices are supplied to Energy DG by the Member States as those being
the most frequently encountered for the specific categories of sales. The
prices given are as of January 15th in each year.
The heating gasoil prices given are for deliveries of between 2 000 and
5 000 litres while those for low sulphur fuel oil are for monthly deliveries
of less than 2 000 tonnes or annual deliveries of less than 24 000 tonnes.
The average pump prices are given for motor fuels.
The EU average prices are calculated by weighting the prices from each
country by the corresponding final energy consumption.
ELECTRICITY AND GAS
The legal basis for the collection of industrial gas and electricity prices is
defined by EC Directive 2008/92/EC. The collection of prices includes na-
tional average prices of the last 6 months reported by different consumer
bands. All taxes are included in the current prices.

261
EU ENERGY IN FIGURES 2017
Consumption bands have been selected as the most representative for
the exercise.
APPENDIX 13.3
3.1.1, PAGE 134
Energy activities sector in its broad and narrow definition (sector d35), as
defined by EUROSTAT/NACE and UN/SIC nomenclatures.
3.2, PAGES 135�137
Data from the LFS survey. At employment level, this dataset presents
larger figures than the SBS, due to the difference of methodology, and its
sample size.
3.3, PAGES 138�149
Includes data on number of enterprises, turnover, and persons declared
as employed, as originated from the SBS survey that targets especially
enterprises business. At employment level is more disaggregated but less
complete than the LFS survey.
3.4, PAGES 150�154
Data is extracted from DG Economic and Financial Affairs, AMECO data-
base. Differences mainly due to data freshness, constant revisions, and
methodology can appear when comparing with Eurostat economic data.
APPENDIX 13.4
4.1.1, PAGES 158�162
GHG, greenhouse gases, are gases that contribute to the natural green-
house effect. GHG emissions aggregate includes Fuel combustion emissions
and other non-fuel linked emissions (Industrial processes, agriculture, etc.).
Fuel combustion emissions include combustion in Energy industries, Manu-
facturing Industries and construction, Transport, Commercial and Institu-
tional, Residential, Agriculture, Forestry/Fisheries and other combustion and
fugitive emissions.
4.1.2 PAGES 163�167
Structure of emissions similar to the GHG emissions.
4.2.2 PAGE 169
Carbon GDP intensity is the average emission rate of CO2 relative to the
total intensity of the economic activity, measured by its GDP.
APPENDIX 13.5
For products see appendices 5-7 and glossary appendix 12. For indicators
see appendices 2-4 and glossary appendix 12. For units see appendices
8-11.

262
Statistical pocketbook 2017
Notes

263
EU ENERGY IN FIGURES 2017

264
Statistical pocketbook 2017

Getting in touch with the EU
IN PERSON
All over the European Union there are hundreds of Europe Direct Information
Centres. You can find the address of the centre nearest you at: europa.eu/contact
ON THE PHONE OR BY E�MAIL
Europe Direct is a service that answers your questions about the European
Union. You can contact this service by freephone: 00 800 6 7 8 9 10 11
(certain operators may charge for these calls), or at the following standard
number: +32 22999696, or by electronic mail: europa.eu/contact
Finding information about the EU:
ONLINE
Information about the European Union in all the official languages of the EU
is available on the Europa website at: europa.eu
EU PUBLICATIONS
You can download or order free and priced EU publications from EU Bookshop
at: bookshop.europa.eu. Multiple copies of free publications may be obtained
by contacting Europe Direct or your local information centre: europa.eu/contact
EU LAW AND RELATED DOCUMENTS
For access to legal information from the EU, including all EU law since 1951 in
all the official language versions, go to EUR-Lex at: eur-lex.europa.eu
OPEN DATA FROM THE EU
The EU Open Data Portal (data.europa.eu/euodp/en/data) provides access to
datasets from the EU. Data can be downloaded and reused for free, both for
commercial and non-commercial purposes.

http://ec.europa.eu/energy/en/data-analysis/energy-statistical-pocketbook


![Pillars of Power Energy Power[1]](https://static.documents.pub/doc/80x56/577dac9c1a28ab223f8e1954/pillars-of-power-energy-power1.jpg)


