Page 1
1
Energy Absorption in Polymer Composite Materials forAutomotive Crashworthiness
George C. Jacob*
Material Science and Engineering DepartmentUniversity of Tennessee, Knoxville
434 Dougherty EngineeringKnoxville, TN 37996
USA
John F. Fellers
ProfessorMaterial Science and Engineering Department
University of Tennessee, Knoxville608 Dougherty Engineering
Knoxville, TN 37996USA
Srdan SimunovicGroup Leader, Computational Material Science
Computer Science and Mathematics DivisionOak Ridge National Laboratory
Post Office Box 2008, Bldg. 6025, MS-6359Oak Ridge, TN 37831-6359
USA
J. Michael StarbuckComposite Materials Technology Group
Engineering Technology DivisionOak Ridge National Laboratory
Post Office Box 2009Oak Ridge, TN 37831-8048
USA
*Author to whom correspondence should be addressed.Phone Number: 865 576 7361Fax Number: 865 574 8257E-mail: [email protected]
Page 2
2
ABSTRACT
The energy absorption capability of a composite material is critical to
developing improved human safety in an automotive crash. Energy absorption is
dependent on many parameters like fiber type, matrix type, fiber architecture, specimen
geometry, processing conditions, fiber volume fraction, and testing speed. Changes in
these parameters can cause subsequent changes in the specific energy absorption of
composite materials up to a factor of 2. This paper is a detailed review of the energy
absorption characteristics in polymer composite materials. An attempt is made to
draw together and categorize the work done in the field of composites energy
absorption that has been published in the literature in order to better understand
the effect of a particular parameter on the energy absorption capability of
composite materials. A description of the various test methodologies and crushing
modes in composite tubes is also presented. Finally, this paper raises certain design
issues by examining the work rate decay necessary to keep the deceleration below
20g during an impact crash.
KEY WORDS: Crashworthiness, Energy Absorption, Composite Materials, Crushing.
INTRODUCTION
In passenger vehicles the ability to absorb impact energy and be survivable
for the occupant is called the “crashworthiness” of the structure. There is an important
difference between crashworthiness and penetration resistance. Crashworthiness is
concerned with the absorption of energy through controlled failure mechanisms and
modes that enable the maintenance of a gradual decay in the load profile during
Page 3
3
absorption. However penetration resistance is associated with the total absorption
without allowing projectile or fragment penetration.
Current legislation for automobiles requires that vehicles be designed such
that, in the event of an impact at speeds up to 15.5 m/sec (35 mph) with a solid,
immovable object, the occupants of the passenger compartment should not experience a
resulting force that produces a net deceleration greater than 20g. US helicopter
requirements of safely surviving a descent, under no power; at 15 m/sec is another
example of crashworthiness legislation. Crashworthy structures should be designed to
absorb impact energy in a controlled manner, thereby bringing the passenger
compartment to rest without the occupant being subjected to high decelerations, which
can cause serious internal injury, particularly brain damage.
Vehicle size and mass provide a certain degree of protection but can have
negative inertial effects. Driven by the need to overcome these negative effects of both
size and mass coupled with mandates for increased fuel efficiency, an attempt is being
made to use composites in the development of energy dissipating devices. The ability to
tailor composites, in addition to their attributes of high stiffness-to-weight and strength-
to-weight ratios, fatigue resistance and corrosion resistance, makes them very attractive
in crashworthiness. The challenge is the use of specific features of geometry and
materials in enabling greater safety while simultaneously decreasing the weight, without
negatively affecting the overall economics of fabrication and production.
To reduce the overall weight and improve the fuel economy of vehicles,
more and more metal parts are being replaced by polymer composite materials. Contrary
to metals, especially in compression, most composites are generally characterized by a
Page 4
4
brittle rather than ductile response to load. While metal structures collapse under crush
or impact by buckling and/or folding in accordion (concertina) type fashion involving
extensive plastic deformation, composites fail through a sequence of fracture mechanisms
involving fiber fracture, matrix crazing and cracking, fiber-matrix de-bonding, de-
lamination and inter-ply separation. The actual mechanisms and sequence of damage are
highly dependent on the geometry of the structure, lamina orientation, type of trigger and
crush speed, all of which can be suitably designed to develop high energy absorbing
mechanisms.
The crashworthiness of a material is expressed in terms of its specific energy
absorption, ES, and interlaminar fracture toughness, GIC, which are characteristic to that
particular material. Specific energy absorption is defined as the energy absorbed per unit
mass of material. Mathematically ES=σ / ρ, where ρ is the density of the composite
material and σ is the mean crush stress. Interlaminar fracture toughness is defined as the
measure of the damage tolerance of a material containing initial flaws or cracks.
Mathematically GIC = π KIC2/E, Where E is the Young’s modulus and KIC is the fracture
toughness parameter. To get a proper command over the parameters and terms used in
this paper please refer to Table 1 on page 52.
MATERIAL PERFORMANCE REQUIREMENTS
Consider a midsize car of mass 1000 kg (2200 lbs) traveling at a velocity of
15.5 m/sec (35 mph). The kinetic energy of the car is equal to 0.5 m v2 =
0.5*1000*(15.5)2 = 120125 J, where m is the mass of the car = 1000 kg (2200 lbs) and v
is the velocity with which it is traveling = 15.5 m/sec (35 mph). In the event of an
impact, crashworthy materials would have work done on them to absorb this kinetic
Page 5
5
energy over a time frame that ensures the deceleration of the car to be less than 20g [1],
above which the passengers will experience irreversible brain damage because of the
relative movements of various parts of the brain within the skull cavity. Therefore 120 kJ
of work needs to be done on the crashworthy material. One can calculate the minimum
safe time frame over which this work needs to be done to ensure the safety of the
passengers using the basic equation of motion
v = u – at (1)
where v is the final velocity of the car which is equal to zero since the car comes to rest, u
is the initial impact speed and a is the maximum allowable deceleration which is equal to
20g. This minimum time was calculated to be equal to 0.079 seconds. Therefore the
maximum allowable rate of work decay that will ensure the safety of the passengers is
equal to 120125 / 0.079 = 1521 kJ/sec. So while testing materials in the lab to determine
the magnitude of energy absorbed by a specimen, it is also equally important to
determine the rate of this energy absorption. No discussion of energy absorption rates
was found in the literature on crashworthiness. The load increases very rapidly in the
initial stages of the load displacement curve for materials undergoing crushing to some
maximum value after which stable crushing takes place. Now it is in this initial stage of
the crash that the work decay rate might exceed the safe allowable limits. So though
these materials may record very high-energy absorption values they might still not ensure
the much needed passenger safety. It will be in the interest of improved safety to usefully
couple these materials with other materials which when crushed have a lower initial peak
load but not necessarily a high-energy absorption capability. This will smear the initial
peak load response of the coupled material over a wider range which in the process
Page 6
6
lowers the net initial peak load to a value that is well within the maximum allowable rate
of work decay. The specific energy absorption of unidirectional axial carbon/PEEK
composites is recorded to be 180 kJ/kg. Therefore to absorb 120 kJ of kinetic energy one
will only need 120125 / 180000 = 0.66 kg (1.45 lbs) of the carbon/PEEK composite
located in specific places in the car. This clearly leads to an important practical
conclusion that only a reasonable amount of composite is required to meet the necessary
impact performance standard. Please see Figure 1 on page 67 which shows the amount of
different crashworthy material that will be required in the event of a crash to ensure a safe
rate of work decay in a car of mass 1000 kg (2200 lbs) traveling at a particular velocity.
TEST METHODOLOGIES
Crush tests can be carried out in two conditions namely quasi-static and
impact conditions.
Quasi-static Testing
In quasi-static testing, the test specimen is crushed at a constant speed.
Quasi-static tests may not be a true simulation of the actual crash condition because in an
actual crash condition, the structure is subjected to a decrease in crushing speed, from an
initial impact speed, finally to rest. Many materials used in designing crashworthy
structures are rate sensitive. That means their energy absorption capability is dependent
on the speeds at which they are crushed. So the determination of materials as good
energy absorbers after quasi-statically testing them does not ensure their satisfactory
performance as crashworthy structures in the event of an actual crash.
The following are some advantages of quasi-static testing.
1. Quasi-static tests are simple and easy to control.
Page 7
7
2. Impact tests require very expensive equipment to follow the crushing
process because the whole crushing takes place in a split second. Hence
quasi-static tests are used to study the failure mechanisms in composites,
by selection of appropriate crush speeds.
The following is a major disadvantage of quasi-static testing.
• Quasi-static tests may not be a true simulation of the actual crash
conditions since certain materials are strain rate sensitive.
Impact Testing
The crushing speed decreases from the initial impact speed to rest as the
specimen absorbs the energy.
The following is a major advantage of impact testing
• It is a true simulation of the crash condition since it takes into account the
stress rate sensitivity of materials.
The following is a major disadvantage of impact testing.
• In impact testing, the crushing process takes place in a fraction of a
second. Therefore it is difficult to study the crushing unless provided
with expensive equipment like a high-speed camera.
CRUSHING MODES AND MECHANISMS
Catastrophic Failure Modes
Catastrophic failure modes are not of interest to the design of crashworthy
structures. It occurs
• When unstable intralaminar or interlaminar crack growth occurs.
• In long thin walled tubes because of column instability.
Page 8
8
• In tubes composed of brittle fiber reinforcement, when the lamina
bundles do not bend or fracture due to interlaminar cracks being less than
a ply thickness.
The following are the disadvantages of catastrophic failure in the design of
crashworthy structures.
1. Catastrophic failure is characterized by a sudden increase in load to a
peak value followed by a low post failure load. As a result of this the
actual magnitude of energy absorbed is much less and the peak load is
too high to prevent injury to the passengers.
2. Structures designed to react to loads produced by catastrophically failing
energy absorbers are heavier than structures designed to react to loads
produced by progressively failing energy absorbers.
Progressive Failure Modes
Progressive failure can be achieved by providing a trigger at one end of the
tube. A trigger is a stress concentrator that causes failure to initiate at a specific location
within the structure. From there on, the failure, in a controlled predictable manner,
progresses through the body at the loading speed. A trigger reduces the initial load peak
that accompanies failure initiation followed by stable collapse. The most widely used
method of triggering is to chamfer one end of the tube. A number of other trigger
geometries such as bevels, grooves and holes that have been investigated in laboratory
specimens are not as easy to use in vehicle structures.
The following are the advantages of progressive failure in the design of
crashworthy structures.
Page 9
9
1. The energy absorbed in progressive crushing is larger than the energy
absorbed in catastrophic failure.
2. A structure designed to react to loads produced by progressively failing
energy absorbers are lighter than structures designed to react to loads
produced by catastrophically failing energy absorbers.
Characteristic Types of Progressive Crushing Modes [2]
1. Transverse Shearing or Fragmentation Mode
• The fragmentation mode is characterized by a wedge-shaped laminate cross
section with one or multiple short interlaminar and longitudinal cracks that form
partial lamina bundles. Please see Figure 2 on page 68.
• Brittle fiber reinforcement tubes exhibit this crushing mode.
• The main energy absorption mechanisms is fracturing of lamina bundles
• When fragmentation occurs, the length of the longitudinal and interlaminar cracks
are less than that of the lamina.
• Mechanisms like interlaminar crack growth and fracturing of lamina bundles
control the crushing process for fragmentation.
2. Lamina Bending or Splaying Mode [3]
• Very long interlaminar, intralaminar, and parallel to fiber cracks characterizes the
splaying mode. The lamina bundles do not fracture. Please see Figure 3 on page
69.
• Brittle fiber reinforcement tubes exhibit this crushing mode.
Page 10
10
• The main energy absorbing mechanism is matrix crack growth. Two secondary
energy absorption mechanisms related to friction occur in tubes that exhibit
splaying mode.
• Mechanisms like interlaminar; intralaminar and parallel to fiber crack growth
control the crushing process for splaying.
3. Brittle Fracturing
• The brittle fracturing crushing mode is a combination of fragmentation and
splaying crushing modes. Please see Figure 4 on page 70.
• This crushing mode is exhibited by brittle fiber reinforcement tubes
• The main energy absorption mechanism is fracturing of lamina bundles.
• When brittle fracturing occurs, the lengths of the interlaminar cracks are between
1 and 10 laminate thickness.
4. Local Buckling or Progressive Folding
• The progressive folding mode is characterized by the formation of local buckles.
Please see Figure 5 on page 71.
• This mode is exhibited by both brittle and ductile fiber reinforced composite
material.
• Mechanisms like plastic yielding of the fiber and/or matrix control the crushing
process for progressive folding.
CALCULATION OF SPECIFIC ENERGY ABSORPTION ES
Specific energy absorption, ES, is defined as the energy absorbed per unit
mass of material. Figure 6 on page 72 is a typical load displacement curve obtained from
Page 11
11
progressive crushing of a composite tube specimen. The area under the load-
displacement curve is
dSS
PWb
∫=0
(2)
where W is the total energy absorbed in crushing of the composite tube specimen. A
more characteristic property of progressive crushing mode is
)( ib
b
i
SSPdSS
SPW −== ∫ (3)
where Sb and Si are the crush distances as indicated in figure 6 and P is the mean crush
load. The specific energy absorption capability, ES, of a composite material defined as
the energy absorbed per unit mass of material is given by
mW
ES = (4)
where m is the mass of the composite material.
Combining the above two equations we get
ρV
SSP
mW
E ibS
)( −== (5)
where V is the volume of the crushed portion of the composite tube specimen and ρ is the
density of the composite material. We can also write
ρρ AL
SSP
V
SSP
mW
E ibibS
)()( −=
−== (6)
where A and L are the cross sectional area and length of the crushed portion of the
composite tube specimen respectively.
Page 12
12
ρρ AL
SPAL
SSPE bib
S =−= )( (7)
if Si is much less than Sb. The ratio (Sb / L) = K is a measure of the collapsibility of the
composite tube. Substituting (Sb / L) = K in the above equation we have
ρ
σρ
KA
KPES == (8)
where σ is the mean crush stress. In the case of polymer composites some times it is
rather difficult to determine a specific value for the mean crush load, P , from the load
displacement curve because of the erratic changes in the magnitude of the load with
displacement. One does not get the typical load displacement curve obtained from
progressive crushing of a composite tube as shown in Figure 6. In that case an alternative
procedure followed for calculating the energy absorbed, W, is to just determine the area
under the whole load displacement curve.
LITERATURE SURVEY
Many researchers have conducted research on the energy absorption
capability of composite materials. Axi-symmetrical tubes, because they are easy to
fabricate and close to the geometry of the actual crashworthy structures, have been used
to carry out much of the experimental work on the energy absorption of composite
materials. More over composite tubes can be easily designed for stable crushing. They
can be designed to absorb impact energy in a controlled manner by providing a trigger to
initiate progressive crushing. This paper focuses on the experimental work conducted on
axi-symmetric tubes.
Page 13
13
The energy absorption characteristics of a crashworthy composite structure
can be tailored by controlling various parameters like fiber type, matrix type, fiber
architecture, specimen geometry, process conditions, fiber volume fraction and testing
speed. In this paper care has been taken to group the various research activities that have
been conducted to understand the effect of a particular parameter on the energy
absorption capability of a composite material.
Table 2 on pages 53 to 56 provides a summary view of the range of ES and
GIC values for materials that have been tested. Table 2 ranges over many parameters
namely fiber type, matrix type, fiber orientation, specimen dimension, fiber volume
fraction, processing conditions, test speed and trigger. Hence the range of values for the
specific energy absorption, ES, and interlaminar fracture toughness, GIC. An exhaustively
designed set of experiments to determine the effect of one parameter upon another for a
particular composite material would be the square of the number of parameters.
Considerable work needs to be done to meet this requirement.
Table 3 on pages 57 to 58 provides a summary view of the various composite
materials that have been researched to understand the effect of a particular parameter on
its energy absorption capability. One can see from Table 3 that the energy absorption
capabilities of carbon, glass and Kevlar fibers have been investigated the most. Epoxy,
polyetheretherkeetone, polyester and vinylester are the matrices whose energy absorption
capability has been most extensively studied. The succeeding paragraphs report the
detailed findings of the various individual studies.
The Effect of Reinforcing Fiber on the Energy Absorption Capability of
a Composite Material
Page 14
14
The type of reinforcing fiber used in a composite material determines to a
very large extent its energy absorption characteristics. The important findings are:
a) Decrease in the density of fiber causes an increase in specific energy
absorption capability of the fiber-reinforced tubes.
b) Higher the strain to failure of the fiber, greater the energy absorption
capabilities of the fiber reinforced tubes.
c) When the fiber reinforced tubes crush in similar modes, changes in the
fiber stiffness affect the energy absorption capability less than fiber
failure strain.
Farley [4, 5, 6, 7, 8], Thornton and Edwards [9] and Hull [3, 10] observed
that glass and carbon fiber reinforced thermoset tubes progressively crush in
fragmentation and splaying modes. Aramid (Kevlar and Dyneema) fiber reinforced
thermoset tubes, on the other hand, crush by a progressive folding mode [4, 11]. Similar
results were got when Schmuesser and Wickliffe [12] performed impact and static
compression tests on graphite/epoxy, Kevlar/epoxy and glass/epoxy composite tube
specimens respectively. The graphite/epoxy and glass/epoxy angle-ply tubes exhibited
brittle failure modes consisting of fiber splitting and ply delamination, whereas the
Kevlar/epoxy angle-ply tubes collapsed in an accordion buckling mode. The lower strain
to failure of the glass and carbon fibers, which fail at about 1% strain, compared to
aramid fibers, which fail at about 8% strain attributes to this difference in behavior.
Results of static crushing tests of graphite reinforced composite tubes conducted by
Farley [7] to study the effects of fiber and matrix strain failure on energy absorption
helped in drawing the following conclusion: “To obtain the maximum energy absorption
Page 15
15
from a particular fiber, the matrix material in the composite must have a greater strain at
failure than the fiber”. The graphite/epoxy tubes had specific energy absorption values
greater than that of Kevlar/epoxy and glass/epoxy tubes having similar ply constructions.
This is attributed to the lower density of carbon fibers compared to glass and Kevlar
fibers. The theoretical density of carbon is 2.1 g/cm3. But the actual density of carbon
fibers ranges from 1.3 g/cm3 to 1.9 g/cm3, which is lower than the theoretical value. This
is because in the act of creating the fiber, voids are also generated which causes a
decrease in the density of the fibers. Since the difference in energy absorption and crush
morphology are attributed to the differences in fiber properties Hamada, Ramakrishna,
Sato and Maekawa [13] investigated PEEK matrix composite tubes reinforced with AS4
carbon fiber, IM7 carbon fiber and S2 glass fiber respectively. The fibers were aligned
parallel to tube axis, i.e. θ = 0ο. The tubes crushed progressively by the splaying mode.
The S2/PEEK tubes displayed approximately 20% lower specific energy absorption than
the AS4/PEEK and IM7/PEEK tubes though the mean crush stress of S2/PEEK tubes is
comparable to that of AS4/PEEK and IM7/PEEK tubes. This is a direct result of the
lower density of carbon fiber reinforced materials than the glass reinforced material,
since the specific energy absorption is defined as the ratio of the mean crush stress and
density of the composite. Despite AS4 carbon fibers being more ductile than the IM7
carbon fibers, both AS4/PEEK and IM7/PEEK tubes displayed similar specific energies.
Hence they concluded, unlike the thermoset tubes, the fiber failure strain has little effect
on the energy absorption of the thermoplastic tubes, as the fiber failure strain is much
smaller than that of the thermoplastic matrix. Epoxy composite tubes reinforced with low
failure strain Thornel-300 carbon fibers and intermediate failure strain Hercules AS-4
Page 16
16
carbon fibers was investigated by Farley [4]. He observed that the tubes having greater
energy absorption properties were the ones reinforced with fibers having higher strain to
failure. Farley and Jones [14] established the modes of crushing and the controlling
mechanisms on continuous fiber-reinforced composite tubes. They suggested that the
crushing response of the composite tubes could be categorized into three basic modes:
transverse shearing, lamina bending, and local buckling. The mechanical properties of
the constituent materials and the structure of the specimen influence the mechanisms that
control these different crushing modes. In addition, they presented an analysis procedure
that can be used to determine the qualitative change in the sustained crushing load due to
a change in specimen material properties or geometry. The analysis procedure is similar
in form to the equation of buckling load of a column on an elastic foundation. This
procedure will be useful in preliminary design and in providing an insight in to the
crushing behavior of composite tubes. A finite element analysis was also conducted to
model the crushing process of continuous-fiber-reinforced tubes by Farley et al [15].
The analysis is compared with experiments on graphite/epoxy and Kevlar/epoxy tubes.
The method is based upon a phenomenological mode of the crushing process and
obtained a reasonable agreement between the analysis and the experiment. Thornton et
al [16] examined the energy absorption capability in graphite/epoxy, Kevlar/epoxy and
glass/epoxy composite tubes. The composite tubes collapsed by fracture and folding
mechanisms. The load/compression curves for the graphite/epoxy and the glass/epoxy
tubes had similar characteristics but the Kevlar/epoxy composite tubes collapsed by
buckling. For Kevlar composites, the collapse started progressively under essentially a
constant load until the collapse was complete, apart from a fine serrated structure
Page 17
17
superimposed upon the load curve. In addition, they showed that changes in the lay-up
that increased the modulus increased the energy absorption of the tube. These tubes
made from, or including Kevlar fiber, tended to collapse in an unstable mode by buckling
rather than by fracture, which led to low values for specific energy absorption. The
fracture collapse mechanism depends upon the geometry. Farley [6] demonstrated that
graphite/epoxy tubes which failed in a brittle mode had negligible post crush integrity,
where as Kevlar/epoxy tubes which failed in an accordion buckling mode similar to
aluminum tubes exhibited post crush integrity. This characteristic of the Kevlar/epoxy
tubes can be attributed to fiber splitting and fiber plasticity affects. He observed that
longitudinally oriented graphite fibers absorb more energy than longitudinally oriented
Kevlar or glass fibers. Static crushing tests were conducted by Chiu et al [17] on 3-D
carbon/epoxy and Kevlar/epoxy braided composite square tubes to investigate the energy
absorption capabilities of these materials. The 3-D carbon braided composite tube
displayed higher specific energy absorption than the Kevlar tubes. This revealed that
carbon tubes in crush tests are capable of absorbing more energy. However, the Kevlar
tubes demonstrated good post-crush structural integrity. Another study by Chiu et al [18]
revealed similar results as above where the specific energy absorption of the 3-D braided
carbon/epoxy composite square tube was 24% higher than that of the 3- braided
Kevlar/epoxy composite square tube.
To visualize how much of specific energy absorption, ES, is really
attributable to fiber type, please refer to Table 4 on page 59.
The Effect of the Matrix on the Energy Absorption Capability of a
Composite Material
Page 18
18
The following comments tell us about what was found with respect to matrix
type:
a) Higher interlaminar fracture toughness, GIC, of the thermoplastic matrix
material causes an increase in energy absorption capability of the
composite material.
b) An increase in matrix failure strain causes greater energy absorption
capabilities in brittle fiber reinforcements. Conversely, the energy
absorption in ductile fiber reinforcements decreases with increasing
matrix failure strain.
c) Changes in matrix stiffness have very little effect on the energy
absorption capability of composite materials with ductile fiber
reinforcement.
d) Further studies are essential to understand clearly the role of
thermosetting resin matrices in the energy absorption capability of the
composite material.
Carbon fiber reinforced composite tubes with different kinds of
thermoplastic matrices were studied by Ramakrishna et al [19]. Among all types of
tubes investigated carbon fiber/PEEK tubes exhibited the highest specific energy owing
to its higher fracture toughness (1.6 ~ 2.4 kJ/m2). These were in comparison to that of
carbon fiber/PEI (1.0 ~ 1.2 kJ/m2) and carbon fiber/PI (1.0 ~ 1.2 kJ/m2) composite
materials [20, 21]. The carbon fiber/PAS tubes displayed the lowest energy absorption
capability. The specific energy of thermoplastic tubes follow the order PAS< PI< PEI<
PEEK. In a similar study Satoh et al [22] investigated the energy absorption of
Page 19
19
carbon/polyetherimide (C/PEI), carbon/polyimide (C/PI), carbon/polyarylsulfone
(C/PAS), carbon/polyetheretherkeetone (C/PEEK), and compared it with that carbon
/epoxy and glass/polyester. Carbon/thermoplastic tubes demonstrated superior energy
absorbing capabilities (ES = 128 ~ 194 kJ/kg) than carbon/epoxy (ES = 110 kJ/kg) or
glass/polyester (ES = 80 kJ/kg) structures. Carbon/PEEK crushed progressively and
recorded a specific energy absorption value of 194 kJ/kg. The energy absorption
capability of carbon/epoxy and carbon/PEEK composite tubes made from unidirectional
prepreg materials was investigated by Hamada et al [23] by conducting axial
compressive tests on them. The superior energy absorption capability of carbon
fiber/PEEK tubes (180 kJ/ Kg) is attributed to the higher interlaminar fracture toughness
(GIC) of the thermoplastic PEEK matrix composite (1.56 to 2.4 kJ/m2). The carbon/epoxy
tube having an interlaminar fracture toughness in the range 0.12 to 0.18 kJ/m2 absorbed
only 53 kJ/Kg specific energy. Farley [8] based upon observation and a general
understanding of the crushing process concluded the following: The energy absorption of
materials that fail by transverse shearing or brittle fracturing is little affected by matrix
stiffness. However, materials that fail by lamina bending can be more significantly
affected by matrix stiffness. A change in matrix stiffness can cause brittle fiber
composites to fail in a different mode. However, changes in matrix stiffness have very
little effect on the energy absorption of ductile fiber reinforcements.
To visualize how much of specific energy absorption, ES, and interlaminar
fracture toughness, GIC, is really assignable to matrix type, please refer to Table 5 and
Table 6 respectively on page 60 and page 61 respectively.
Page 20
20
The Effect of Fiber Architecture on the Energy Absorption Capability
of a Composite Material
The following comments tell us what was found with respect to fiber
orientation.
The fiber orientations that enhance the energy absorption capability of the
composite material requires them to:
a) Increase the number of fractured fibers.
b) Increase the material deformation.
c) Increase the axial stiffness of the composite material.
d) Increase the lateral support to the axial fibers.
Work by Farley [4] on glass/epoxy, carbon/epoxy and Kevlar/epoxy
composite tubes with fiber architecture [0±θ]4, where θ varied from 0ο to 90ο, showed
significant differences in the energy absorption trends for these materials. The difference
in trends can be explained by examination of crushing modes. The specific energy of the
glass/epoxy and Kevlar/epoxy tubes remained constant with increasing θ up to 45ο and
above this value it increased. This trend is not consistent with the general mechanical
response of composites. The glass/epoxy and Kevlar/epoxy specimen crushed in a
lamina bending and local buckling mode respectively. This increase in energy is
attributed to the increased lateral support to the axial fibers with increasing θ. On the
other hand, the specific energy of the carbon/epoxy tubes initially decreased with
increasing θ up to 45ο and then remained constant. The carbon/epoxy specimens crushed
in brittle fracturing mode. This initial decrease in the energy absorption is attributed to
the reduction in axial stiffness of the composite material with increasing θ. Farley and
Page 21
21
Jones [24] in a later study quasi-statically crushed carbon/epoxy and glass/epoxy tube
specimens with fiber architecture [0±θ]S, to determine the influence of ply orientation on
the energy absorption capability. As θ increases, the energy absorption capability of the
carbon/epoxy tube decreases nonlinearly. The crushing mode is primarily brittle fracture.
The energy absorption capability of the glass/epoxy tube increases nonlinearly with θ.
The crushing mode of the glass/epoxy tube is lamina bending. Hull [3, 25] studied the
effect of fiber arrangement on progressive crushing in carbon fiber/epoxy unidirectional
laminate tubes, woven glass cloth/epoxy tubes, filament-wound angle ply glass
fiber/polyester tubes and in plane random chopped glass fiber polyester tubes. The
filament wound glass/polyester tubes were made by conventional filament winding with
winding angles φ between ±35ο and 90ο. Here φ is the angle between the direction and
the longitudinal axis of the tube. The tube had 4 layers of fibers and the volume fraction
of the fibers was about 0.45. These tubes were 50 mm in diameter and the wall thickness
was about 3-4 mm. All tests were conducted at a crushing speed of 0.2 mm/s with a
servo-hydraulic testing machine having a maximum static loading capacity of 180 kN. A
300 mm stroke was used for all the compression tests. The specific energy increased
with increasing φ up to ±65ο and after that it decreased. Hence the maximum value of
specific energy occurred at φ = ±65ο and there was a systematic change in the load
displacement curves and crush zone morphology with winding angle φ. These changes in
crush zone morphology (when φ = ±35ο to ±55ο, tubes crush in splaying mode and when
φ > ±65ο, tubes crush in fragmentation mode) cause the changes in specific energy. The
tube with axially aligned fibers showed very little progressive crushing before complete
failure by the formation and growth of longitudinal cracks. Hamada et al [11] studied
Page 22
22
the effect of fiber architecture on the energy absorption capability of hybrid composite
tubes reinforced with both carbon and dyneema (polyethylene) fibers. The resin fibers
used were that of epoxy. It was seen that the energy absorption capability decreased with
increasing fiber orientation with respect to the longitudinal axis of the tube. Berry [26]
investigated woven glass fabric/polyester tubes by varying the angle of the lay-up. The
energy absorption of the tubes with the warp and weft directions at 45ο to the tube axis is
observed to be 30% less than that for similar tubes with warp and weft direction parallel
to the axial (0ο) and hoop (90ο) directions respectively. This increase in the energy
absorption is due to more material deformation and fracture in the case of the latter tubes.
Carbon fiber reinforced composite tubes with different thermoplastic matrices:
polyetheretherkeetone (PEEK), polyetherimide (PEI), polyimide (PI) and polyarylsulfone
(PAS) were studied by Ramakrishna et al [19]. Fiber orientations of 0ο, ±5ο, ±10ο,
±15ο, ±20ο, ±25ο and ±30ο with respect to the axis of the tube were used. The specific
energy absorption capability of the progressively crushed tubes was found to be a
function of the θ value. In general, as θ increases, the length of the longitudinal cracks
decrease. This is due to the increase of fracture toughness with increasing θ. This
improved fracture toughness offers more resistance to the crack growth process, thus
resulting in an increased specific energy absorption value for the composite material.
Microfracture processes such as fiber fracture and frond splits were observed to increase
with increasing θ. Hence it was concluded that this increase in microfracture processes is
what causes an increase in the total energy absorbed.
To visualize how much of specific energy absorption, ES, is really assignable
to fiber architecture, please refer to Table 7 on page 62.
Page 23
23
The Effect of Geometry of the Specimen on the Energy Absorption
Capability of a Composite Material
The important findings are:
a) It is crush zone fracture mechanisms that determine the overall energy
absorption capability of a composite material and tube dimensions
largely influence these fracture mechanisms.
b) The specific energy absorption, ES, follows the order: circular> square>
rectangle, for a given fiber lay up and tube geometry.
Thornton and Edwards [9] conducted a study investigating the geometrical
effects in energy absorption of circular, square, and rectangular cross section tubes.
Although the range of geometrical parameters was large, the actual number of test
conditions was limited. The limited number of tests made it difficult to precisely define
certain trends. They concluded that for a given fiber lay up and tube geometry, the
specific energy follow the order, circular > square > rectangle. Specimens were
fabricated with graphite, Kevlar, glass, and hybrid combinations of these reinforcements
in an epoxy matrix. Tape and fabric prepregs were utilized to fabricate tubes with ply
orientations of [±45] and [0/90]. The tubes made from glass or graphite fibers collapsed
by fracture mode. Stable collapse with high-energy absorption occurred over a critical
range of tube geometry. Kevlar and Kevlar hybrid composites were found to generally
be unsuitable energy absorbers because of unstable crushing behavior, resulting in large
undulations in the crushing load. These results are in contrast with results for crushable
beams reported by Farley [27]. Farley found Kevlar reinforced beams to consistently
crush in a stable manner and graphite tubes of reference [9] exhibited combined brittle
Page 24
24
fracturing and lamina bending crushing modes. Crushing loads of glass and graphite
composite tubes were more uniform than the crushing loads for the Kevlar reinforced
composite tubes. Farley [5] investigated the geometrical scalability of graphite/epoxy
(Gr/E) and Kevlar/epoxy (K/E) [±45]N tubes by quasi-statically crush testing them. This
ply orientation is used in typical subfloor beam structures. In that study, the tube inside
diameter varied between 1.27 cm to 10.16 cm, the number of plies (N) varied between 2
and 24 and the tube inside diameter to wall thickness ratio (D/t) varied between 1.4 and
125. All circular cross section graphite/epoxy tubes exhibited a progressive brittle
fracturing mode. All Kevlar/epoxy tubes when crushed exhibited the characteristic local
buckling crushing mode. The buckle wavelength varied with tube diameter. Tube inside
diameter to wall thickness ratio (D/t) was determined to significantly affect the energy
absorption capability of the composite materials. Energy absorption was found to be a
decreasing nonlinear function of tube D/t ratio. That is, a reduction in D/t ratio results in
an increase in the specific energy. This increase is due to reduction in interlaminar
cracking in the crush region of the tube. Kevlar/epoxy tubes are reported to exhibit
similar trends. Their energy absorption capability is geometrically scalable but that of
graphite/epoxy tubes are not. Farley and Jones [28] reported carbon/epoxy and
Kevlar/epoxy tubes with elliptical cross section to also exhibit similar trends. When
statically crushed, the energy absorption capability was determined to be a decreasing
nonlinear function of the ratio of tube internal diameter to wall thickness (D/t).
Thornton et al [29] studied the effect of tube dimensions. It was found that
carbon/epoxy exhibited large changes in their energy absorption characteristics with a
range of values of tube diameter (D), tube wall thickness (t) and (D/t) ratio. Relative
Page 25
25
density, defined as the ratio of the volume of the tube to that of a solid of the same
external dimensions, was varied in the range 0.01 to 1.0. The tube crush length is
unstable and the critical size of the tube is dependent on the fiber type and fiber
architecture, below a relative density value of 0.025 for carbon/epoxy and 0.045 for
glass/epoxy. The specific energy is essentially independent of tube dimensions for the
tubes that crushed in a stable manner. A total of 28 graphite/epoxy flat plate specimens
and 6 graphite/epoxy tube specimens were crushed by Dubey and Vizzini [30] under
quasi-static conditions to provide a basis for the comparison of the measured energy
absorbency of these two geometry. The tube and flat plate specimens crushed in similar
failure modes with the flat plates absorbing 12% less energy per unit mass. It is
concluded that flat specimens can be used as a lower cost alternative to tube specimens or
in test programs requiring simpler geometry. Glass cloth/epoxy tubes and carbon
fiber/PEEK tubes with cross sectional shapes full circle, three quarter circle, half circle
and quarter circle were investigated by Hamada et al [31]. Two types of glass
cloth/epoxy composite tubes were tested. One type of tubes contained glass cloth treated
with an aminosilane-coupling agent and the other type of tubes used glass cloth treated
with acrylsilane-coupling agent. Quasi-static tests were performed by axial compression
between two flat platens. All the specimens crushed progressively from the chamfered
end. One of the important results of this study is that the mode of progressive crushing is
independent of the cross sectional shape of the composite tubes. The constituent
materials in the composite mainly determine it. The aminosilane-treated glass
cloth/epoxy specimens, owing to the good interfacial bonding of its fiber to the resin
matrix, crush by splaying mode whereas the acrylsilane-treated glass cloth/epoxy
Page 26
26
specimens, due to the presence of higher frictional forces in the crush zone, crush by
fragmentation mode. The carbon/PEEK specimens crush progressively by the splaying
mode, mainly due to the orientation of carbon fibers parallel to the tube axis. Another
important result of this study was that the cross-sectional shape of the tube influences the
specific energy absorption capability of composite tubes. In the case of the glass
cloth/epoxy specimens, the specific energy decreased by 20% with the change in tube
cross section from full circle to quarter circle. The specific energy of carbon fiber/PEEK
tube specimens decreased by only 5% for the same change in cross sectional shape.
Square tubes, circular tubes and circular cones made of glass fiber, polyester or vinylester
resin were tested by Mamalis et al [32] under static and dynamic crushing conditions in a
speed range of 18 - 24 m/sec. It was found that for specimens showing stable crushing,
greater thickness tends to reduce the specific energy absorption, square tubes have less
specific energy absorption than circular tubes, and greater cone angle results in lower
specific energy absorption. Fairfull [33] and Fairfull and Hull [34] studied the effects
of specimen dimensions on the specific energy of glass cloth/epoxy tubes. Five sets of
tubes with D ranging from 16 mm to 50 mm were studied. The specific energy decreased
with increasing D. The specific energy, for a given D, initially increased with decreasing
D/t ratio up to 5 below which, it decreased. It was concluded that there could not be a
universal relationship to predict energy absorption capability because the reason for this
variation of energy could not be clearly identified. Static crushing tests were conducted
by Farley [35] on graphite/epoxy and Kevlar/epoxy square cross section tubes to study
the influence of specimen geometry on the energy absorption capability and scalability of
composite materials. Tube ply orientations were [±45]N. The square cross section tube
Page 27
27
widths were between 1.27 cm and 7.62 cm. The width to wall thickness ratios (w/t) was
between 6 and 125. These tube geometry and materials are representative of helicopter
subfloor beam structure applications. The tube inside width to wall thickness ratio (w/t)
was determined to affect the energy absorption capability of composite materials. The
energy absorption capabilities of graphite/epoxy and Kevlar/epoxy tubes are non-linear
functions of tube ratios (w/t). Energy absorption generally increased with decreasing w/t
ratio. For graphite/epoxy tubes having w/t ratios in the range of 20 and 50, changes in
crushing mode occurred, resulting in a decrease in energy absorption capability as w/t
ratio decreased. Both graphite/epoxy tubes and Kevlar/epoxy tubes crushed in a
progressive and stable manner. All graphite/epoxy tubes exhibited a lamina bending
crushing mode while Kevlar/epoxy tubes exhibited a local buckling crushing mode. The
test results suggest that Kevlar/epoxy tubes are geometrically scalable where as that of
graphite/epoxy are not. Hamada and Ramakrishna [36] studied the crushing
performance of carbon fiber/PEEK tubes with different thickness t and diameter D
values. When t is in the range of 2mm and 3mm all the types of tube display their highest
specific energies. With increasing t up to this critical range, the specific energy
increased, above which it decreased. Changes in the crush zone morphology were the
cause of specific energy variation. Microfracture processes in the crush zone varied with
the thickness t though the tubes crushed progressively by splaying mode. With
increasing t up to critical range both the frond splits and fractured fibers increased. It was
confirmed after the above investigation that in the case of thermoplastic composite tubes,
the energy absorption characteristics are mainly influenced by the absolute value of t
rather than the (D/t) ratio. Static energy absorption tests were conducted on different
Page 28
28
geometry of 6 ply T300/934, graphite/epoxy sine web by Hanagud et al [37]. They
reported that the sine web composite material exhibit good energy absorption capabilities
when crushed in the web direction. They demonstrated that the energy absorption
efficiency of the web specimens with 180ο included angle is equal to corresponding tube
specimens. By reducing the included angle of the sine web from 90ο-60ο, the crushing
mode changed abruptly from stable progressive crushing to unstable global buckling.
To visualize how much of specific energy absorption, ES, is really assignable
to specimen geometry, please refer to Table 8 on pages 63 to 64.
The Effect of Processing Conditions on the Energy Absorption
Capability of a Composite Material
The following comments tell us what was found with respect to processing
conditions:
a) The cause for variation in energy absorption capability with cooling rate
is the cooling rate dependence of fracture toughness of semi-crystalline
thermoplastic composite materials. Fracture toughness increases with an
increase in cooling rate and hence causes an increase in the energy
absorption capability of the thermoplastic composite material.
b) There has been no systematic study reported in the literature on the effect
of processing conditions on the energy absorption characteristics of
thermoset composite tubes.
Hamada et al [38] investigated the effect of processing conditions on the
energy absorption capabilities of carbon fiber/PEEK composite tubes. The thermoplastic
tubes having the carbon fibers aligned parallel to the tube axis were fabricated using a
Page 29
29
thermally expandable PTFE mandrel technique. Three cooling rates were used: rapid
cooling by immersion in chilled water (95.5οC/min.), gradual cooling in air (8.2οC/min.)
and slow cooling in the oven with heater switched off (0.7οC/min). All the tubes crush
progressively by splaying mode when quasi-statically crush tested. The rapidly cooled
tubes have specific energy absorption of 226 kJ/kg, the highest recorded for any material,
which is 15% higher than the 197 kJ/kg, the specific energy absorbed by the gradually
and slow cooled tubes.
To visualize how much of specific energy absorption, ES, is really assignable
to processing conditions, please refer to Table 9 on page 65.
The Effect of Fiber Volume Fraction on the Energy Absorption
Capability of a Composite Material
The following comments tell us what was found with respect to fiber volume
fraction:
a) The effect of fiber volume fraction on the energy absorption has been
less extensively studied.
b) It is not always true, as one would normally think that an increase in the
fiber content would necessarily improve the specific energy absorption
capability of a composite material. A possible explanation for the above
statement is that as the fiber volume fraction increases, the volume of the
matrix between the fibers decrease. This causes an increase in the matrix
density. This further leads to a decrease in the interlaminar strength of
the composite. As interlaminar strength decreases, interlaminar cracks
form at lower loads, resulting in a reduction in the energy absorption
Page 30
30
capability. So the changes in the energy absorption trends with fiber
content are determined by the crushing response of the composite
material.
Ramakrishna and Hull [39] investigated the specific energy absorption
capability of knitted carbon fiber-fabric/epoxy tubes tested under axial compressive load.
Tubes with lower fiber content crushed irregularly where as progressive crushing took
place in tubes having fiber content above 15%. The specific energy absorption capability
increased with fiber content. Ramakrishna [40], a couple of years later, again
investigated the effect of fiber content on the specific energy absorption capability of
knitted carbon fiber fabric/epoxy and knitted glass fiber fabric/epoxy composite tubes.
The specific energy of both types of composite tubes increased with increasing fiber
content. One possible explanation for this is that a higher tube loading is associated with
generation of larger surfaces due to fiber/matrix debonding which results in increased
energy absorption capability. Contrary to the above finding, Farley [4] reported a
decrease in specific energy of carbon fiber/epoxy composite material with the increase in
fiber volume fraction from 40% to 70%. The decrease in specific energy is attributed to
the decrease in interlaminar shear strength of the composite with increasing fiber content.
In a later study Farley and Jones [24] again investigated carbon/epoxy composite tubes
with fiber volume fractions in the range 40% to 55% to get similar results. They reported
some specimens exhibit a large decrease in energy absorption capability with increasing
fiber volume fraction, where as other specimens exhibit a slight decrease. Hence, it
should be concluded that an increase in the fiber content might not always necessarily
improve the specific energy absorption capability. The crushing response is what
Page 31
31
determines the energy absorption trends. Work by Hull and Snowdon [41] on sheet
molding compounds based on polyester resins and glass fibers (SMC) showed an increase
in specific energy with an increase in fiber volume fraction. The tube specimens made by
hot press molding of SMC were subjected to axial compression at speeds up to 15 m/sec
(33 mph). Thornton et al [42] investigated glass fiber/vinyl ester rods with fiber volume
fraction in the range 10% to 50%. He reported an increase in specific energy with
increase in fiber volume fraction.
The Effect of Testing Speed on the Energy Absorption Capability of a
Composite Material
The important findings are:
a) The energy absorption capability is a function of testing speed when the
mechanical response of the crushing mechanisms is a function of strain
rate. The rate at which the structure is loaded has an effect on both the
material’s behavior and also the structural response of the target.
b) The strain energy absorbing capabilities of the fibers and the geometrical
configuration of the target are very important factors that determine the
impact resistance of composites at low rates of strain.
c) The strain energy absorbing capabilities of the fibers and the geometrical
configuration of the structure is less important at very high rates of strain
since the structure responds in a local mode. What is important is the
magnitude of energy dissipated in delamination, debonding and fiber pull
out.
Page 32
32
Bannerman and Kindervater [43] while investigating carbon/epoxy and
Kevlar/epoxy tubular and beam specimens reported an increase in energy absorption with
crushing speed. Thornton [16] reported very little change in the specific energy
absorption of 0/90 graphite/epoxy, Kevlar/epoxy and glass/epoxy composite tubes over a
wide range of compression rates (10-1 to 2*104 inches/min). Thornton [44] also
investigated the energy absorption behavior of Pultruded glass/polyester and glass/vinyl
ester tubes in the crushing speed range from 2.1 X 10⁻⁴ m/s to 15 m/s. He reported a 10%
decrease with increasing test speed in the case of glass/vinyl ester tubes and a 20%
increase in energy absorption in the case of glass/polyester tubes. This can be attributed
to the higher tensile strength and modulus of the vinylester. Thornton et al [42] later
investigated glass fiber/vinyl ester rods with testing speed in the range 0.13 to 2.54
mm/min. The specific energy was seen to increase essentially linearly with log (testing
rate). Farley [6] investigated Kevlar/epoxy, carbon/epoxy, and glass/epoxy and
composite tubes with fiber architecture [0±θ]4 at speeds of quasi-static and 7.6 m/sec
impact and found specific energy to be independent of crushing speed. When Farley
[45] investigated carbon/epoxy and Kevlar/epoxy tubes with [±θ]3 fiber architecture he
found a 35% increase in specific energy with the change in the crushing condition from
quasi-static to impact. The magnitude of effects of crushing speed on specific energy
was determined to be a function of the mechanism that controls the crushing process.
Static and dynamic crushing tests in a speed range of 18 – 24 m/sec were conducted by
Mamalis et al [32] on three different composite materials. Two of the composite
materials consisted of fiberglass and vinyl ester resins. The third was made up of fiber
glass and polyester resin. The specimens under investigation had different geometry:
Page 33
33
square, circular and circular cone. The specific energy of thin walled circular conical
specimen made of polyester resin and random chopped strand mat of glass fiber were
reduced by 35% under a crushing speed of about 21 m/sec. It was hence concluded that
crush speed interacts with cone angle and wall thickness of the specimen. Reduction in
specific energy caused by the increase of crush speed becomes more significant when
wall thickness or cone angle is larger. However the crushing speed was not observed to
have a significant effect on the specific energy absorption of thin walled circular or
square tubes made of the three kinds of composite materials. In another investigation
Kindervater [46] observed little difference between the quasi-static and dynamic energy
absorption of Kevlar/epoxy tubes. Schmueser and Wickliffe [12] reported a decrease of
up to 30% in energy absorption of impacted carbon/epoxy, glass/epoxy and Kevlar/epoxy
tubes with fiber architecture [02/±45]s, as compared to static test results. Ramakrishna
[40] studied the effect of testing speed on the specific energy absorption capability of
knitted glass fiber/epoxy and knitted carbon fiber fabric/epoxy composite tubes. The
specific energy of both types of composite tubes decreased by 20% with change in testing
condition from quasi-static to impact. This is attributed to the decrease in fracture
toughness (GIC) of composite materials with increasing test speeds. Decreased fracture
toughness means less resistance to the longitudinal cracking of the tube wall and
therefore lower energy absorption.
To visualize how much of specific energy absorption, ES, is really assignable
to testing speed, please refer to Table 10 on page 66. Note that of the two systems
reported, the ES for the glass/polyester system goes up with an increase in the testing
Page 34
34
speed while the ES for the glass/vinyl ester goes down with a similar increase in testing
speed.
SUMMARY OF FINDINGS
The effect of a particular parameter (such as fiber type, matrix type, fiber
orientation, specimen geometry, processing conditions, fiber content, test speed and test
temperature) on the energy absorption of a composite material is summarized below.
Fiber Type: The density of the reinforced fibers has a lot to do with the
energy absorption characteristics of a composite material. As the density of the fiber
decreased from a higher to a lower value, the specific energy of the fiber reinforced tubes
increased from a lower to a higher value respectively. Tubes reinforced with fibers
having higher strain to failure result in greater energy absorption properties. Changes in
fiber stiffness affect energy absorption capability less than changes in fiber failure strain,
provided the different materials crush in the same mode. Matrix Type: If one is
restricted to discussing the energy absorption capability of a reinforced fiber
thermoplastic matrix material it could be concluded that a higher interlaminar fracture
toughness, GIC, of the thermoplastic matrix material would increase the energy absorption
capability of the composite material. Also an increase in matrix failure strain causes
greater energy absorption capabilities in brittle fiber reinforcements. Conversely, the
energy absorption in ductile fiber reinforcements decreases with increasing matrix failure
strain. The role of thermosetting resin matrices in energy absorption is not clear and
further studies are essential. Fiber Orientation: Regarding the effects of fiber
orientation on the energy absorption capability of a composite material, the fiber
Page 35
35
orientations that enhance the energy absorption capability of the composite material
requires them to:
a) Increase the number of fractured fibers.
b) Increase the material deformation.
c) Increase the axial stiffness of the composite material.
d) Increase the lateral support to the axial fibers.
Specimen Geometry: Studying the effect of tube dimensions it can be said
that the crush zone fracture mechanisms are influenced by the tube dimensions and these
fracture mechanisms determine the overall energy absorption capability of the composite
tubes. For a given fiber lay up and tube geometry, the specific energy follows the order,
circular> square> rectangle. Processing Conditions: The cooling rate dependence of
fracture toughness of semi-crystalline thermoplastic composite materials is the cause for
variation in energy absorption capability with cooling rate. Fracture toughness increases
with increase in cooling rate and hence causes an increase in the energy absorption
capability. There has been no systematic study reported in literature on the effect of
processing conditions on the energy absorption characteristics of thermoset composite
tubes. Fiber Content: There has been no systematic study reported in literature on the
effect of fiber content on the energy absorption of composites. It should be noted that an
increase in the fiber content might not always necessarily improve the specific energy
absorption capability. As the fiber volume fraction increases, the volume of the matrix
between the fibers decreases. This causes the interlaminar strength of the composite to
decrease. As interlaminar strength decreases, interlaminar cracks form at lower loads,
resulting in a reduction in the energy absorption capability. Also, as fiber volume
Page 36
36
fraction increases, the density of the composite increases which results in a lower energy
absorption capability. Test Speed: Upon reviewing the literature there seems to be a lack
of consensus about the influence of test speed on the energy absorption. However it is
known that energy absorption capability is a function of testing speed when the
mechanical response of the crushing mechanism is a function of strain rate. The rate at
which the structure is loaded has an effect on both the material’s behavior and also the
structural response of the target. The strain energy absorbing capabilities of the fibers
and the geometrical configuration of the target are very important to the impact resistance
of composites at low rates of strain. However the strain energy absorbing capabilities of
the fibers and the geometrical configuration of the structure is less important at very high
rates of strain since the structure responds in a local mode. What is important is the
magnitude of energy dissipated in delamination, debonding and fiber pull out.
THE MOST EFFICIENT CRASHWORTHY COMPOSITE
MATERIAL
Carbon fiber reinforced tubes display higher strength than other fiber-
reinforced tubes. Its superior specific energy absorption is a direct result of the lower
density of carbon fiber reinforced materials, since energy absorption is defined as the
ratio of mean crush stress and density of the composite. The energy absorption capability
of the fiber reinforced thermoplastic PEEK tubes is higher than the other fiber reinforced
matrix materials due to its superior interlaminar fracture toughness (1.56–2.4 kJ/m2)
compared to other matrix materials. Because of their high strains to failure, they are the
only matrices presently available that allow the new intermediate modulus, high strength
(and strain) carbon fibers to use this full strain potential in the composite. The PEEK
Page 37
37
resin in carbon/PEEK is believed to have three phases: an amorphous phase, a trans-
crystalline growth from fiber surfaces and a sphere shaped crystal. The bond strength of
the carbon fibers to the matrix is enhanced by this kind of crystallinity. Therefore one
can conclude that the specific energy absorption (180 kJ/kg) of the semi crystalline 0ο
carbon fiber/PEEK tube should be much higher than other composite tubes [23]. The
damages they incur while absorbing energy are in very small amounts. The superior
performance of carbon fiber/PEEK tubes is attributed to mainly to:
a) Higher fracture toughness of PEEK matrix composites (Carbon
fiber/PEEK composites exhibit excellent static and dynamic toughness).
b) Splitting of fronds.
c) Large number of fiber fractures.
d) The PEEK matrix allows rapid repair using fusion techniques. For
example, if we adopt the hot press technique, simply treating the
component to a temperature above the melting point of the matrix,
reforming and cooling can reduce the impact damage.
The PEEK matrix leads to a much higher resistance to crack growth between
the fibers. This ensures that the tube does not fail before the onset of progressive
crushing mode. Measurements of the interlaminar Mode I fracture toughness, GIC,
parallel to the fibers of the unidirectional materials gave values of GIC in the range 1.56 to
2.4 kJ/m2 for carbon fiber/PEEK.
The success of the PEEK matrix as a superior energy absorbing material
suggests the high potential in thermoplastic matrix materials to be good energy absorbers.
The role of a thermoplastic resin matrix in energy absorption is extensively reported in
Page 38
38
the literature. However the same cannot be said with regard to thermosetting resin
matrices. Their role in the energy absorption characteristics of composites is not yet
clear. Considering the large number of cost efficient, low temperature processing
methods available to industry more work towards understanding the energy absorption
characteristics of these matrices is currently needed.
RATE EFFECTS
The ability of a structure to absorb impact energy and be survivable for the
occupant is called the “crashworthiness” of the structure. From this definition it is
understood that an ideal crashworthy material used in a car, in the event of a crash, must
do the following. One, absorb the kinetic energy of the car and two, dissipate this energy
over a time frame that ensures the deceleration of the car to be less than a critical value,
above which the passengers will experience irreversible brain damage because of the
relative movements of various parts of the brain within the skull cavity. So while testing
specimens in the lab one needs to measure the magnitude of the energy that it is capable
of absorbing and the length of time over which this energy will be absorbed. Both the
magnitude and the rate of energy absorption is characteristic to a particular material. If
there were two different types of materials with similar energy absorption capabilities,
the material that dissipated this energy over a longer period of time would be considered
more crashworthy. So in the course of evaluating the crashworthiness of a material,
measurement of time is important. The magnitude of the energy absorbed by the crash
elements in a car is the area under the load displacement curve where load is nothing but
the product of the mass of the car and its deceleration after impact. The rate of energy
Page 39
39
absorption in the car is dependent on the constituent materials the car is made of and
configuration of its structures.
Both quasi-static and impact testing can be carried out in the lab. Impact
testing is a true simulation of the actual crash condition. The magnitude of energy
absorbed by a material when impact tested and the rate at which this energy is dissipated
can be used to accurately interpret the material behavior in the event of an actual crash.
Here again the magnitude of energy absorbed by the specimen is the area under the load
displacement curve where load is the product of the mass of the impactor and its
deceleration after impact. The rate of energy transformation is solely a material property.
In quasi-static testing the tube specimen is crushed at a constant speed. Here
the energy absorbed is the area under the load displacement curve. However load in this
case is just the specimen’s reaction to it being crushed. It does not have a deceleration
term because the crushing process is taking place at a constant speed. The measurement
of the time quantity is not worthwhile because one actually controls the rate of energy
absorption rather than it being a material property as in the case of impact testing. Hence
it is inferred that quasi-static testing is not a true simulation of the actual crash conditions.
It can however be used to study the failure mechanisms that take place during the
crushing of a tube.
One can conclude from the above thoughts the following: 1) While
conducting impact tests on a composite material, it is equally important to determine the
rate of energy transformation as it is to record the magnitude of the energy being
absorbed by the specimen. 2) It is also important that when one reports the magnitude of
energy absorbed by a particular material when quasi-statically or impact tested, the speed
Page 40
40
at which the testing was done be also reported. Many materials are rate sensitive and can
absorb different magnitudes of energies at different testing speeds. 3) Quasi-static testing
is not a true simulation of real crash conditions and is used to study the failure
mechanisms that take place when composite tubes are crushed. However if a sample is
progressively crushed, its load displacement curve is characterized by the load rising to
some peak value followed by an initial failure and then a sustained crushing load (Mean
Crush Load) that cycles about some average value suggested to be at least 75% of the
peak load. Hence in this special case, the mean crush load is independent of the change
in displacement and time. The magnitude of the specific energy absorbed will give a
clear measure of its crashworthiness. Hence there is no need to calculate the rate of
energy absorption. But not all materials when crush tested exhibit ideal progressive
crushing. Therefore there is a need to measure the rate of energy absorption for these
materials in addition to recording the magnitude of energy they absorb before
determining their crashworthiness.
DESIGN FOR OPTIMUM WORK RATE DECAY
WVehicle + WStructure = 0 (9)
The above expression will always be true: The sum of the work done by the
vehicle and work done by the structure is always zero. Here WVehicle is the work done by
the vehicle moving at a particular velocity ‘v’ having a kinetic energy of 0.5 m v2.
During the crash event the structure does work to absorb this kinetic energy. It will be
desirable that this energy be absorbed over a large period of time rather than in a short
time duration. That is, the rate of work done by the structure is as low as possible. This
Page 41
41
can be accomplished by optimum design of structure geometry or by coupling different
material types while fabricating the structure.
Structure Geometry
Consider two specimens A and B having geometries as shown in Figure 7(a)
and 7(b) respectively on page 73. Axial compression of specimen A and B will yield
load displacement curves as shown in Figure 7(c) on page 73 when W1 is equal to W2.
Since the deformation of the specimen is proportional to the time taken by it to absorb
energy, the rate of energy absorption can be considered as the ratio of absorbed energy by
deformation. From Figure 7(c) the following conclusions can be drawn:
)()1(
)()2(
LntDisplacemeEEnergyAbsorbed
LLntDisplacemeEEnergyAbsorbed <∆+
)1()1(
)1()2(
LntDisplacemeInitialEEnergyAbsorbedInitial
LntDisplacemeInitialEEnergyAbsorbedInitial ∆<∆
Also obvious from Figure 7(c) is that the magnitude of energy absorbed by specimen B
deformed over length L is less than that of specimen A deformed over the same length.
Hence it can be concluded that the rate of energy absorption of specimen B is less than
that of specimen A. Consider Figure 7(d) on page 73, which exhibits the rate of
deformation experienced by specimens A and B when subjected to axial compression.
Now consider the case when the width of specimen B, W2, is greater than
the width of Specimen A, W1. Please see Figure 8(a) and 8(b) on page 74. Axial
compression of specimen A and B will yield load displacement curves shown in Figure
8(c) on page 74. The goal of crashworthiness is to absorb the kinetic energy possessed
by the car, at the time of impact, over as large a time frame as possible to ensure
passenger safety. It can been seen from Figure 8(c) that though F2 is greater than F1, the
Page 42
42
energy absorbed by specimen B when axially compressed has been stretched over a
larger time frame thus improving the crashworthiness of the structure. Consider Figure
8(d) on page 74, which exhibits the rate of deformation experienced by specimens A and
B when subjected to axial compression. From Figure 8(d) it can be seen that by setting
W2>W1 one has decreased the rate of deformation of specimen B when axially
compressed to a value less than that of specimen A when crushed in similar conditions.
The above arguments indicate that altering specimen shape reduces the rate of
deformation, thereby increasing the time frame over which energy is absorbed, hence on
the whole contributing to improved crashworthiness.
Coupling
The load increases very rapidly in the initial stages of the load displacement
curve for most materials undergoing crushing to some maximum value after which stable
crushing takes place. Though these materials might be good energy absorbers, it is in the
interest of passenger safety that the deceleration in this stage of the crash not exceed the
critical range above which the passengers will experience irreversible brain damage
because of the relative movements of various parts of the brain within the skull cavity.
To safe guard the interest of the passengers but still use these high energy absorbing
materials as crash elements they can be coupled with other materials that have a lower
peak load but not necessarily a high energy absorption capability. Please see Figure 9 on
page 75.
Consider two specimens C and D of width W and length L having
geometries as shown in Figure 10(a) and 10(b) respectively on page 76. Depending on
their material properties specimen C and D will generate load displacement curves as
Page 43
43
shown in Figure 10(c) on page 76. If these 2 materials are coupled together
homogeneously to form specimen E having a geometry similar to that of specimen C and
D, when axially compressed specimen E will yield a load displacement curve as shown in
Figure 10(d) on page 76. Figure 10(d) also exhibits the load displacement curves of
specimen C and D when axially compressed. This arrangement discussed above, as can
be seen in Figure 10(d), lowers the initial peak load to a value that is well within the safe
deceleration range that the passengers are allowed to experience at the time of impact. It
should also be noted that the coupling of the material C with D resulted in the lowering of
the magnitude of energy absorbed from E3 to E5. The specimen length of the coupled
material E can be increased by ∆L in order to raise the magnitude of the energy absorbed
from E5 to E3. Please refer to Figure 10(e) on page 76. Hence by increasing the length
of specimen E the reduction in the magnitude of energy absorbed that resulted from
coupling can be made up. Figure 10(e) also exhibits how by coupling material C with D,
its initial peak load value can be lowered and the rate of energy absorption decreased by
stretching it over a larger time frame, still not having to compromise on the magnitude of
energy that may be absorbed during its crushing.
CONCLUSION
Many criterions, in addition to a material being crashworthy, have to be met
before one can begin the use of a particular composite as a crash energy absorber in
automobiles. The primary ones are low costs involved in its manufacture and the
materials being readily available. Once a composite material is identified to meet the
above necessary requirements, one ought to know the effect all the controllable
parameters (like fiber arrangement, specimen geometry etc.) will have on its energy
Page 44
44
absorption capabilities, in an attempt to design the most crashworthy structure. Though
in the past several researchers have investigated the energy absorption capabilities of
composite materials, it is now time to have enough literature to understand the effect of
all the parameters on the energy absorption characteristics of each candidate composite
material. It will also be of interest to create a database on the specific energy of various
composite materials for the designer’s reference. A lot of this experimental data can be
used to support the analytical modeling efforts being conducted by several U.S. national
laboratories [47].
From Table 2 one sees a range of values for the specific energy absorption
ES and interlaminar fracture toughness GIC. This is because Table 2 ranges over all the
parameters namely fiber type, matrix type, fiber orientation, specimen dimensions,
volume fraction, processing condition, test speed and trigger. Consider a matrix to help
visualize how many experiments are needed to determine the effect of one parameter
upon the other.
Para-
meter
First
Exp.
Second
Exp.
Third
Exp.
Fourth
Exp.
Fifth
Exp.
Sixth
Exp.
Seventh
Exp.
Eighth
Exp.
Ninth
Exp.
Fiber
Type
Kevlar Carbon Kevlar Kevlar Kevlar Kevlar Kevlar Kevlar Kevlar
Matrix
Type
Epoxy Epoxy PEEK Epoxy Epoxy Epoxy Epoxy Epoxy Epoxy
Fiber
Arch.
[±45ο] [±45ο] [±45ο] [±55ο] [±45ο] [±45ο] [±45ο] [±45ο] [±45ο]
Volume
Fraction
15.75% 15.75% 15.75% 15.75% 22.75% 15.75% 15.75% 15.75% 15.75%
Proc.
Cond.
Slow
cooled
Slow
cooled
Slow
cooled
Slow
cooled
Slow
cooled
Rapidly
cooled
Slow
cooled
Slow
cooled
Slow
cooled
Test
Speed
10
m/sec
10
m/sec
10
m/sec
10
m/sec
10
m/sec
10
m/sec
15
m/sec
10
m/sec
10
m/sec
Page 45
45
Trigger Chamfer Chamfer Chamfer Chamfer Chamfer Chamfer Chamfer Bevel Chamfer
Spec.
Dim.
D/t = 25 D/t = 25 D/t = 25 D/t = 25 D/t = 25 D/t = 25 D/t = 25 D/t = 25 D/t = 45
ES
(kJ/kg)
80 90 70 75 76 67 78 65 78
GIC
(J/m2)
1130 1150 1230 1300 1430 1234 1342 1432 1236
An exhaustively designed set of experiments to determine the effect of each
parameter on the energy absorption capability of the composite material would thus be
the number of parameters plus one. The number of experiments required to explore the
effect of one parameter upon another, would be the square of the number of parameters.
This helps to show just how complicated the task is.
LIST OF REFERENCES
1. Hull D., “Energy Absorbing Composite Structures”, Sci. & Techn. Rev., University of
Wales, Vol. 3 (1988) p. 23-30.
2. Farley G. L., “Relationship Between Mechanical Property and Energy Absorption
Trends for Composite Tubes”, NASA TP-3284, ARL-TR-29, (December 1992).
3. Hull D., “A Unified Approach to Progressive Crushing of Fiber-Reinforced
Composite Tubes”, Comp. Sci. & Tech., Vol. 40 (1991) p. 377-421.
4. Farley G. L., “Energy Absorption of Composite Material and Structures”, Proc. 43rd
American Helicopter Society Annual Forum, St. Louis, USA, (1987) p. 613-627.
5. Farley G. L., “Effect of Specimen Geometry on the Energy Absorption Capability of
Composite Materials”, J. Comp. Mater., Vol. 20 (July 1986) p. 390-400.
Page 46
46
6. Farley G. L., “Energy Absorption of Composite Materials”, J. Comp. Mater., Vol. 17
(May 1983) p. 267-279.
7. Farley G. L., “Effect of Fiber And Matrix Maximum Strain on the Energy Absorption
of Composite Materials”, J. Comp. Mater., Vol. 20 ( July 1986) p. 322-334.
8. Farley G. L., “Energy Absorption in Composite Materials for Crashworthy
Structures”, Proc. Of ICCM 6, Edited by F. L. Matthews, N. C. R. Buskell, J. M.
Hodgkinson and J. Mortan, Elsevier Science Publishers Limited, London, UK, (1987)
p. 3.57-3.66.
9. Thornton P. H., Edwards P. J., “Energy absorption in composite tubes”, J. Comp.
Mater., Vol. 16 (November 1982) p. 521-545.
10. Hull D., “Axial Crushing of Fibre Reinforced Composite Tubes”, Structural
Crashworthiness, Editors N. Jones and T. Weirzbicki, Butterworths, London, UK,
(1983), p. 118-135.
11. Hamada H., Ramakrishna S., Maekawa Z., Nakamura M., “Energy Absorption
Behavior of Hybrid Composite Tubes”, Proc. 10th Annual ASM/ESD Advanced
Composite Conference, Dearborn, Michigan, USA, (7th–10th November 1994) p. 511-
522.
12. Schmuesser D. W., Wickliffe L. E., “Impact Energy Absorption of Continuous Fiber
Composite Tubes”, J. Engng. Mat. & Tech., Vol. 109 (January 1987) p. 72-77.
13. Hamada H., Ramakrishna S., “Effect of fiber material on the energy absorption
behavior of Thermoplastic composite tubes”, J. Thermoplastic Composite Materials,
Vol. 9, No. 3 (1996) p. 259-279.
Page 47
47
14. Farley G. L., Jones R. M., “Analogy for the Effect of Material and Geometrical
Variables on Energy Absorption Capability of Composite Tubes”, J. Comp. Mater.,
Vol. 26, No. 1 (1992) p. 78-89.
15. Farley G. L., “Prediction of the Energy Absorption Capability of Composite Tubes”,
J. Comp. Mater., Vol. 26, No. 3 (1992) p. 388-404.
16. Thornton P. H., “Energy Absorption in Composite Structures”, J. Comp. Mater., Vol.
13 (July 1979) p. 247-262.
17. Chiu C. H., Lu C. K., Wu C. M., “Crushing Characteristics of 3-D Braided
Composite SQUARE Tubes”, J. Comp. Mater., Vol. 31, No. 22 (1997) p. 2309-2327.
18. Chiu C. H., Lu C. K., Wu C. M., “Energy Absorption of Three-Dimensional Braided
Composite Tubes”, Proc. Of ICCM 10, Edited by B. C. Whistler, Canada, (August
1995) p. 4.187-4.194.
19. Ramakrishna S., Hamada H., Maekawa Z., Sato H., “Energy Absorption Behavior of
Carbon Fiber Reinforced Thermoplastic Composite Tubes”, J. Thermo. Comp.
Mater., Vol. 8 (July 1995) p. 323-344.
20. Chang I. Y., Lees J. K., “Recent Development in Thermoplastic Composites: A
Review of Matrix Systems and Processing Methods”, J. Thermo. Comp. Mater., Vol.
1 (1988) p. 277-295.
21. Chang I. Y., “Thermoplastic Matrix Continuous Filament Composites of Kevlar,
Aramid or Graphite Fiber”, Comp. Sci. & Techn., Vol. 24 (1985) p. 61-79.
22. Satoh H., Hirakawa H., Maekawa Z., Hamada H., Nakamura M., Hull D.,
“Comparison of Energy Absorption Among Carbon/Thermoplastic Tubes”, 38th
Page 48
48
International SAMPE Symposium, Science of Advanced Materials and Process
Engineering Series, Vol. 38 (10th–13th May, 1993) p. 952–966.
23. Hamada H., Coppola J. C., Hull D., Maekawa Z., Sato H., “Comparison of Energy
Absorption of Carbon/Epoxy and Carbon/PEEK Composite Tubes”, Composites, Vol.
23, No. 4 (1992) p. 245-252.
24. Farley G. L., Jones R. M., “Energy Absorption Capability of Composite Tubes and
Beams”, NASA TM-101634, AVSCOM TR-89-B-003, (1989).
25. Hull D., “Energy Absorption of Composite Materials Under Crash Conditions”, Proc.
Of ICCM-4, Edited by T. Hayashi, K. Kawata and S. Umekawa, Tokyo, Japan, (1982)
p. 861-870.
26. Berry J. P., “Energy Absorption and Failure Mechanisms of Axially Crushed GRP
Tubes”, Ph.D., Thesis, University of Liverpool, UK, (1984).
27. Farley G. L., “Crash Energy Absorbing Composite Sub-floor Structure”, 27th SDM
conference, (May 1986). Also submitted for publication to The American Helicopter
Society.
28. Farley G. L., Jones R. M., “Crushing Characteristics of Composite Tubes with ‘Near-
Elliptical’ Cross Sections”, J. Comp. Mater., Vol. 26, No. 12 (1992) p. 1741-1751.
29. Thornton P. H., Harwood J. J., Beardmore P., “Fiber Reinforced Plastic Composites
for Energy Absorption Purposes”, Comp. Sci. & Tech., Vol. 24 (1985) p. 275-298.
30. Dubey D. D., Vizzini J. A., “Energy Absorption of Composite Plates and Tubes”, J.
Comp. Mater., Vol. 32 (February 1998) p. 158-176.
31. Hamada H., Ramakrishna S., Maekawa Z., Nakamura M., Nishiwaki T., “Energy
Absorption Characteristics of Composite Tubes with Different Cross Sectional
Page 49
49
Shapes”, Proc. 10th Annual ASM/ESD Advanced Composite Conference, Dearborn,
Michigan, USA, (7th –10th November 1994), p. 523-534.
32. Mamalis A. G., Yuan Y. B., G. L. Viegelahn G. L., “Collapse of Thin Wall
Composite Sections Subjected to High Speed Axial Loading”, Int. J. of Vehicle
Design, Vol. 13:5/6 (1992) p. 564–579.
33. Fairfull A. H., “Scaling Effects in the Energy Absorption of Axially Crushed
Composite Tubes”, Ph.D., Thesis, University of Liverpool, UK, (1986).
34. Fairfull A. H., Hull D., “Effects of Specimen Dimensions on the Specific Energy
Absorption of Fibre Composite Tubes”, Proc. Of ICCM 6, Edited by F. L. Matthews,
N. C. R. Buskell, J. M.Hodgkinson, J. Morton, Elsevier Science and Publishers,
(1987) p. 3.36-3.45.
35. Farley G. L., “Energy Absorption Capability and Scalability Of Square Cross Section
Composite Tube Specimens”, U.S. Army Research and Technology Activity–
AVSCOM, p. 1–17.
36. Ramakrishna S., Hamada H., “Energy Absorption Characteristic of Crash Worthy
Structural Composite Materials”, Key Engineering Materials, Vol. 141–143 (1998) p.
585–620.
37. Hanagud S., Craig J. I., Sriram P., Zhou W., “Energy Absorption Behavior of
Graphite Epoxy Composite Sine Webs”, J. Comp. Mater., Vol. 23 (May 1989) p.
448-459.
38. Hamada H., Ramakrishna S., Maekawa Z., Sato H., “Effect of Cooling Rate on the
Energy Absorption Capability of Carbon Fibre/PEEK Composite Tubes”, J. Poly. &
Poly. Comp., Vol. 3,No. 2 (1995) p. 99-104.
Page 50
50
39. Ramakrishna S., Hull D., “Energy Absorption Capability of Epoxy Composite Tubes
With Knitted Carbon Fibre Fabric Reinforcement”, Comp. Sci. & Tech., Elsevier
Science Publishers Limited, Vol. 49 (1993) p. 349-356.
40. Ramakrishna S., “Energy Absorption Characteristics of Knitted Fabric Reinforced
Composite Tubes”, J. Reinf. Plast. & Comp., Vol. 14 (October 1995) p. 1121-1141.
41. Snowdon P., Hull D., “Energy Absorption of SMC Under Crash Conditions”, Proc.
Fiber Reinforced Composites Conference’84, Plastics and Rubber Institute, (3rd–5th
April 1984) p. 5.1-5.10.
42. Thornton P. H., Tao W. H., Robertson R. E., “Crash Energy Management: Axial
Crush of Unidirectional Fiber Composite Rods”, Advanced Composite Materials:
New Development and Applications Conference Proceedings, Detroit, Michigan,
USA, (30th September-3rd October 1991) p. 489-496.
43. Bannerman D. C., Kindervater C. M., “Crash Energy Absorption Properties of
Composite Structural Elements”, Proc. 4th International SAMPE European Chapter,
Bordeaux, France, (1984) p. 155-167.
44. Thornton P. H., “The Crush Behavior of Pultruded Tubes at High Strain Rate”, J.
Comp. Mater., Vol. 24 (June 1990) p. 594-615.
45. Farley G. L., “The Effects of Crushing Speed on the Energy Absorption Capability of
Composite Tubes”, J. Comp. Mater., Vol. 25 (October 1991) p. 1314-1329.
46. Kindervater C. M., “Energy Absorbing Qualities of Fiber Reinforced Plastic Tubes”,
National Specialists Meeting, Composite Structures of the American Helicopter
Society, Philadelphia, Pennsylvania, USA, (23rd–25th March 1983).
Page 51
51
47. Botkin M., Zywicz E., Simunovic S., Averill R., Plaskacz E., Lo D., Benner J., Kay
G., “Computational Analysis of Composite Structures for Crashworthiness”, Annual
Automotive Technology Development Customers’ Coordination Meeting, Advanced
Automotive Technologies, Vol. 1 (27th–30th October, 1997).
48. Ramakrishna S., “Knitted Fabric Reinforced Polymer Composites”, Ph.D., Thesis,
University of Cambridge, UK, (1992).
49. Ramakrishna S., Hamada H., Hull D., “Impact and dynamic fracture of polymers and
composites”, (ESIS19), Edited by J. G. Williams, A. Pavan, Mechanical Engineering
Publications, London, UK, (1995) p. 453-464.
50. Ramakrishna S., Hull D., “Energy Absorption in Knitted Fabric Reinforced Polymer
Matrix Composites”, Proc. International Conference on Advances in Structural
Testing, Analysis and Design, Bangalore, India, Edited by B. Dattaguru, Tata
McGraw-Hill, New Delhi, India, (1990), p. 69-74.
51. Hamada H., Nakai A., Nakatani T., “Energy Absorption Properties of Braided I-
Beam Workshop”, Proc. First Canada-Japan Seminar on Composite Materials,
Kyoto, Japan, (August 1996) p. 44.1-44.4.
52. Farley G. L., Jones R. M., “Crushing Characteristics of Continuous Fiber-Reinforced
Composite Tubes”, J. Comp. Mater., Vol. 26 (1992) p. 37-50.
Page 52
52
Table 1. Definition of terms and parameters appearing in thereport.
Parameter DetailsFiber Type Names the type of reinforcing fibers used. Their properties can be
related directly to the atomic arrangement and the defect content of thereinforcement, which must be controlled in the manufacturing process.
Matrix Type Matrix may be thermoset or thermoplastic. The choice of the matrix isrelated to the required properties, the intended application of thecomposite and the method of manufacture.
FiberOrientation
A simple convention is often used when describing the stackingsequences. For example, the angle ply laminate [0/+60/-60/0] isabbreviated to [0/±θ] where θ = 60ο.
SpecimenGeometryandDimensions
One of the variables, which affect the crushing behavior, is the geometryand dimensions of the specimen. The different cross sectional shapes ofthe specimen might be square, circular, or rectangular. ‘D’ refers to thetube diameter and ‘t’ to the tube thickness.
Trigger A trigger is a stress concentrator that causes failure to initiate at aspecific location within the structure. From there on the failure, in acontrolled predictable manner, progresses through the body at theloading speed.
ProcessingConditions
Materials are known for their cooling rate dependency of mechanicalproperties. Fabrication can be done using three kinds of cooling rates:Rapid cooling by immersion in chilled water (95.5οC/min), gradualcooling in air (8.2οC/min) and slow cooling in the oven with heaterswitched off (0.7οC/min).
Fiber VolumeFraction
Most calculations on composite materials are based on volume fractionsof the constituents.F = w ρf / (w ρf + wm ρm) where w and wm are the weight fractions andρf, ρm are the densities of the fiber and the matrix respectively and F isthe volume fraction of the fiber.
Test Speed The response of composite tubes subjected to constant speed, quasi-staticcrush tests and impact crush tests where the speed decreases from theinitial impact speed to rest have been studied.
ES Specific energy absorption defined as the energy absorbed per unit massof material. ES=σ / ρ where ρ is the density of the composite materialand σ is the mean crush stress
GIC Interlaminar fracture toughness defined as the measure of the damagetolerance of a material containing initial flaws or cracks.GIC = π KIC
2/E, where E is the Young’s modulus and KIC is the fracturetoughness parameter.
Page 53
53
Table 2. Specific Energy Absorption ES, and InterlaminarFracture Toughness G IC, Values of Materials That Have Been
Tested.Material Specific
EnergyAbsorptionES (kJ/kg)
InterlaminarFractureToughnessGIC
(kJ/m2)
Specifications
Carbon/PEEK 180Ref. [23]
1.56 - 2.4 Ref.[23]
Carbon/PEI 1.0 - 1.2 Ref. [20, 21]
Carbon/PI 0.8 - 0.9Ref. [20, 21]
Unidirectional Graphite/J polymer
2.02Ref. [21]
Unidirectional Graphite/Epoxy 53Ref. [23]
0.21 - 0.26Ref. [21]
Unidirectional Graphite/Polyphenylene sulfide 1.37Ref. [21]
Unidirectional Graphite/Polysulfone 1.13Ref. [21]
Knitted Carbon Fiber Fabric/Epoxy 85Ref. [39, 48,40, 49, 50]
Carbon fibervolumefraction:22.5%
Braided Glass Fiber Fabric/Epoxy 70Ref. [51]
Specimen hasI cross sectionwith fibervolumefraction 60%
Carbon Fiber/PEEK 226Ref. [38]
Fibers alignedparallel to thetube axis,rapidly cooled
Carbon Fiber/PEEK 197Ref. [38]
Fibers alignedparallel to thetube axis,gradually andslow cooled
S. M. C 39Ref. [41]
13% fibervolumefraction
S. M. C 54Ref. [41]
18% fibervolumefraction
Pultruded Glass Fiber Reinforced Vinyl ester ResinTubes
58Ref. [44]
Bevel trigger,25*3.1 sectionsize (mm)InitialVel:0.00021m/sec
Pultruded Glass Fiber Reinforced Polyester ResinTubes
41Ref. [44]
Bevel trigger,25*3.1 section
Page 54
54
size (mm)InitialVel:0.00021m/sec
Pultruded Glass Fiber Reinforced Vinyl ester ResinTubes
68Ref. [44]
Tulip trigger,25*3.1 sectionsize (mm)InitialVel:0.00021m/sec
Pultruded Glass Fiber Reinforced Polyester ResinTubes
39Ref. [44]
Tulip trigger,25*25*3.1section size(mm) InitialVel:0.00021m/sec
Glass Fiber/Polyester Resin Tubes 50Ref. [3]
Windingangle: 650
Crushed at 0.2mm/sec
Carbon Fiber/Epoxy 110Ref. [23]
Ratio of hoopto axial fibersof 1 to 3
Glass Fiber Reinforced Thermosetting ResinComposites
50 – 80Ref. [23]
Carbon/Epoxy 53Ref. [23]
Fiberarchitecture:±450
Carbon/PEEK 127Ref. [23]
Fiberarchitecture:±300
Graphite-Glass/Epoxy 44Ref. [6]
Orientation:[0Gr/±45Gl],number ofplies:6
Graphite-Kevlar/Epoxy 51Ref. [6]
Orientation:[0Gr/±45K],number ofplies:6
Kevlar-Graphite/Epoxy 35Ref. [6]
Orientation:[0K/±45Gr],number ofplies:6
6061 Aluminum 78Ref. [6]
Diameter:2.54 cm
6061 Aluminum 89Ref. [6]
Diameter:3.81cm
Glass/Epoxy 31Ref. [6]
Orientation[0/±θ],150<θ<450
Glass/Epoxy 47Ref. [6]
Orientation[0/±θ],600<θ<900
Kevlar/Epoxy 32 Orientation
Page 55
55
Ref. [6] [0/±θ], θ=450
Graphite/Epoxy 45Ref. [6]
Orientation[0/±θ], θ=450
Glass Cloth/Epoxy 60Ref. [39]
Mandreltrigger
Glass Cloth/Epoxy 62Ref. [39]
Chamfertrigger
Mono Layer Epoxy Composite Tube With KnittedCarbon Fiber Fabric Reinforcement
25Ref. [39]
15.75 volume% of fibers.Warp testedtubes
Mono Layer Epoxy Composite Tube With KnittedCarbon Fiber Fabric Reinforcement
15Ref. [39]
15.75 volume% of fibers.Weft testedtubes
Double Layer Epoxy Composite Tube With KnittedCarbon Fiber Fabric Reinforcement
85Ref. [39]
22.5 volume% of fibers.Weft testedtubes
Graphite/Epoxy 80Ref. [16]
0/90orientation
Glass/Epoxy 60Ref. [16]
0/90orientation
Kevlar/Epoxy 63Ref. [16]
45/45orientation
Glass Fiber/Polyester Protrusion 38Ref. [16]
Circularprotrusion
Glass Fiber/Polyester Protrusion 20Ref. [16]
Squareprotrusion
Graphite/Epoxy 65Ref. [16]
AtTemperature =100 0 C
Glass/Epoxy 40Ref. [16]
AtTemperature =100 0 C
Glass Fiber/Polyester Protrusion 25Ref. [16]
AtTemperature =100 0 C
Graphite/Epoxy 70Ref. [16]
CompressionRate (104
inches/min)t/D = 0.035
Glass/Epoxy 55Ref. [16]
CompressionRate (104
inches/min)t/D = 0.07
Kevlar/Epoxy 14Ref. [16]
D/t ratio = 25Inside tubediameter =3.81 cm,orientation ofthe fiber [±]N
Graphite/Epoxy 63Ref. [45]
Crushingspeed : 10
Page 56
56
m/secOrientation[±75]3
Kevlar/Epoxy 38Ref. [45]
Crushingspeed : 10m/secOrientation[±75]3
Abbreviations used in the Table 2
• PEEK: polyetheretherkeetone.
• PEI: polyetherimide.
• PI: polyimide.
• J polymer: A semi-crystalline polyamide copolymer resin.
• SMC: Sheet-molding compounds based on polyester resins and glass
fibers.
• Ref.: Reference.
• kJ: Unit of energy in kilo Joules.
• kg: Unit of mass in kilograms.
• m: Unit of length in meters.
• Vel.: Velocity.
• mm: millimeters.
• ES: Specific energy absorption defined as the energy absorbed per unit
mass of material.
• GIC: Interlaminar fracture toughness.
Page 57
57
Table 3. List of composite materials investigated.Compo-siteStudied
FiberType
MatrixType
FiberOrienta-tion
TubeGeome-try
TestingSpeed
CoolingRate
FiberVolumeFraction
Kevlar/Epoxy
ΧRef. [12,6, 7, 1618]
ΧRef. [4]
ΧRef. [9,5, 28,27, 35]
ΧRef. [6,16, 43,46]
Carbon/Epoxy
ΧRef. [12,4, 6, 7,16, 17]
ΧRef. [23,22]
ΧRef. [4,3, 11,24]
ΧRef. [9,5, 28,27, 29,37 35,30]
ΧRef. [6,16, 45,43, 40]
ΧRef. [4,39, 40,24]
Glass/Epoxy
ΧRef. [12,7, 16]
ΧRef. [4,3, 24]
ΧRef. [9,27, 29,33, 34,31, 32]
ΧRef. [6,16, 40]
ΧRef. [40]
Carbon/PEEK
ΧRef. [13]
ΧRef. [19,23, 22]
ΧRef. [19]
ΧRef.[31,36]
ΧRef. [38]
Glass/PEEK
ΧRef. [13]
Carbon/PEI
ΧRef. [19,22]
ΧRef. [19]
Carbon/PI
ΧRef. [19,22]
ΧRef. [19]
Carbon/PAS
ΧRef. [19,22]
ΧRef. [19]
Glass/Polyester
ΧRef. [22]
ΧRef. [3,26]
ΧRef. [32]
ΧRef. [44,48]
ΧRef. [41]
Glass/Vinyl ester
ΧRef. [32]
ΧRef. [44]
ΧRef. [41]
Abbreviations used in the Table 3.
• PEEK: polyetheretherkeetone.
• PEI: polyetherimide.
Page 58
58
• PI: polyimide.
• PAS: polyarylsulfone
• Ref.: Reference
Page 59
59
Table 4. Effect of Fiber on Specific Energy Absorption ES (kJ/kg).
Matrix Material: Polyetheretherkeetone, fibers are aligned parallel to the tube axis.Fiber Material Specific Energy
Absorption ES (kJ/kg)Reference
AS4 Carbon 194 [13]IM7 Carbon 202 [13]S2 Glass 143 [13]
Page 60
60
Table 5. Effect of Matrix on Specific Energy Absorption ES
(kJ/kg).
Fiber type: Carbon, axial compression at a constant rate of 1 mm/min, fiber orientation:0ο to the axis of the tube.Matrix Material Specific Energy
Absorption ES (kJ/kg)Reference
Polyetheretherkeetone 194 [22]Polyetherimide 155 [22]Polyimide 131 [22]Polyarylsulfone 128 [22]Epoxy 110 [22]
Page 61
61
Table 6. Effect of Matrix on Inter-laminar Fracture toughness GIC
(kJ/m2).
Fiber Type: Unidirectional carbon (AS-4) fiber, fiber volume fraction: 60%.Matrix Material Inter-laminar Fracture
Toughness GIC (kJ/m2)Reference
Polyetheretherkeetone 1.6 [20]Polyphenylenesulfide 0.9 [20]Polyetherimide 1.2 [20]Epoxy 0.2 [20]
Page 62
62
Table 7. Effect of Fiber architecture on Specific EnergyAbsorption ES (kJ/kg).
Carbon fiber/polyetheretherkeetone tubes, outer diameter: 55 mm, wall thickness: 2.65mm, length: 55 mm, trigger: 45ο chamfer.Fiber Architecture Specific Energy
Absorption ES (kJ/kg)Reference
0ο 194.1 [19]±5ο 205.3 [19]±10ο 225.3 [19]±15ο 226.8 [19]±20ο 202.3 [19]±25ο 181.1 [19]
Carbon fiber/polyetherimide tubes, outer diameter: 55 mm, wall thickness: 2.65 mm,length: 55 mm, trigger: 45ο chamfer.Fiber Architecture Specific Energy
Absorption ES (kJ/kg)Reference
0ο 155.4 [19]±5ο 162.4 [19]±10ο 187.9 [19]±15ο 167.5 [19]±20ο 162.4 [19]±25ο 135.6 [19]
Carbon fiber/polyimide tubes, outer diameter: 55 mm, wall thickness: 2.65 mm, length:55 mm, trigger: 45ο chamfer.Fiber Architecture Specific Energy
Absorption ES (kJ/kg)Reference
0ο 131.4 [19]±5ο 151.1 [19]±10ο 160.7 [19]±15ο 162.3 [19]±20ο 167.9 [19]
Carbon fiber/polyarylsulfone tubes, outer diameter: 55 mm, wall thickness: 2.65mm, length: 55 mm, trigger: 45ο chamfer.Fiber Architecture Specific Energy
Absorption ES (kJ/kg)Reference
0ο 128.1 [19]±5ο 148.4 [19]±10ο 147.2 [19]±15ο 147.7 [19]
Page 63
63
Table 8. Effect of specimen geometry on Specific EnergyAbsorption ES (kJ/kg).
Aminosilane treated glass cloth/epoxy tubes, fiber volume fraction: 43%, internaldiameter: 50 mm, wall thickness: 2.5 mm, trigger: 45ο chamfer.Sectional shape Specific Energy
Absorption ES (kJ/kg)Reference
Full Circle 66.6 [31]¾ Circle 60.6 [31]½ Circle 60.1 [31]¼ Circle 53.5 [31]
Acrylsilane treated glass cloth/epoxy tubes, fiber volume fraction: 43%, internaldiameter: 50 mm, wall thickness: 2.5 mm, trigger: 45ο chamfer.Sectional shape Specific Energy
Absorption ES (kJ/kg)Reference
Full Circle 53.0 [31]¾ Circle 41.3 [31]½ Circle 41.8 [31]¼ Circle 40.7 [31]
Carbon fiber/polyetheretherkeetone, fiber volume fraction: 65%, outer diameter: 55mm, wall thickness: 2.65 mm, length: 55 mm, trigger: 45ο chamfer.Sectional shape Specific Energy
Absorption ES (kJ/kg)Reference
Full Circle 194.1 [31]¾ Circle 192.9 [31]½ Circle 190.6 [31]¼ Circle 187.1 [31]
Carbon fiber/polyetheretherkeetone composite tubes.Diameter D(mm)
Thickness t(mm)
t/D Specific EnergyAbsorption ES
(kJ/kg)
Reference
35.5 0.80 0.023 171.7 [36]35.5 1.04 0.029 172.3 [36]35.5 2.20 0.062 205.9 [36]35.5 3.44 0.097 207.1 [36]35.5 4.58 0.130 154.9 [36]35.5 6.33 0.178 140.6 [36]55.0 1.09 0.020 189.0 [36]55.0 2.09 0.038 218.4 [36]55.0 2.66 0.048 228.3 [36]55.0 5.27 0.096 186.7 [36]55.0 6.43 0.117 186.0 [36]
Page 64
64
55.0 10.47 0.190 113.7 [36]96.0 1.64 0.017 194.0 [36]96.0 1.91 0.020 215.2 [36]96.0 2.14 0.022 195.6 [36]96.0 5.68 0.059 156.9 [36]96.0 10.54 0.110 147.8 [36]
Page 65
65
Table 9. Effect of processing conditions on Specific EnergyAbsorption ES (kJ/kg).
Carbon fiber/polyetheretherkeetone composite tube with fibers aligned parallel to thetube axis, tubes tested at a constant speed of 1 mm/min, outer diameter: 55 mm, wallthickness: 2.7 mm for rapidly cooled tubes and 2.8 mm for gradual and slow cooledtubes, trigger: 45ο chamfer.Processing condition Specific Energy
Absorption ES (kJ/kg)Reference
Rapidly Cooled(95.5 οC/min)
226 [38]
Gradually Cooled(8.2 οC/min)
197 [38]
Slow Cooled(0.7 οC/min)
196 [38]
Page 66
66
Table 10. Effect of testing speed on Specific Energy AbsorptionES (kJ/kg).
Section size of the test specimen: 25 mm * 3.1 mm.
Composite Initial Velocity Specific EnergyAbsorption ES
(kJ/kg)
Reference
2.1 * 10-4 m/sec 57.5Pultruded Glassfiber ReinforcedVinyl ester ResinTube
12 m/sec 53.5
[44]
2.1 * 10-4 m/sec 40.5Pultruded GlassFiber ReinforcedPolyester ResinTube
12 m/sec 47.5
[44]
Page 67
67
Figure 1. Graph Of Amount Of Crashworthy Material Required To RateOf Work Decay.
Page 68
68
Figure 2. Fragmentation Crushing Mode [52].
Page 69
69
Figure 3. Splaying Crushing Mode [52].
Page 70
70
Figure 4. Brittle Fracturing Crushing Mode [52].
Page 71
71
Figure 5. Progressive Folding Crushing Mode [52].
Page 72
72
Figure 6. Typical Load Displacement Curve for a Progressively CrushedComposite Tube [36].
Page 73
73
Figure 7. Design For Optimum Work Rate Decay-1.
Page 74
74
Figure 8. Design for Optimum Work Rate Decay-2.
Page 75
75
Figure 9. Design For Optimum Work Rate Decay-3.
Page 76
76
Figure 10. Design for Optimum Work Rate Decay-4.


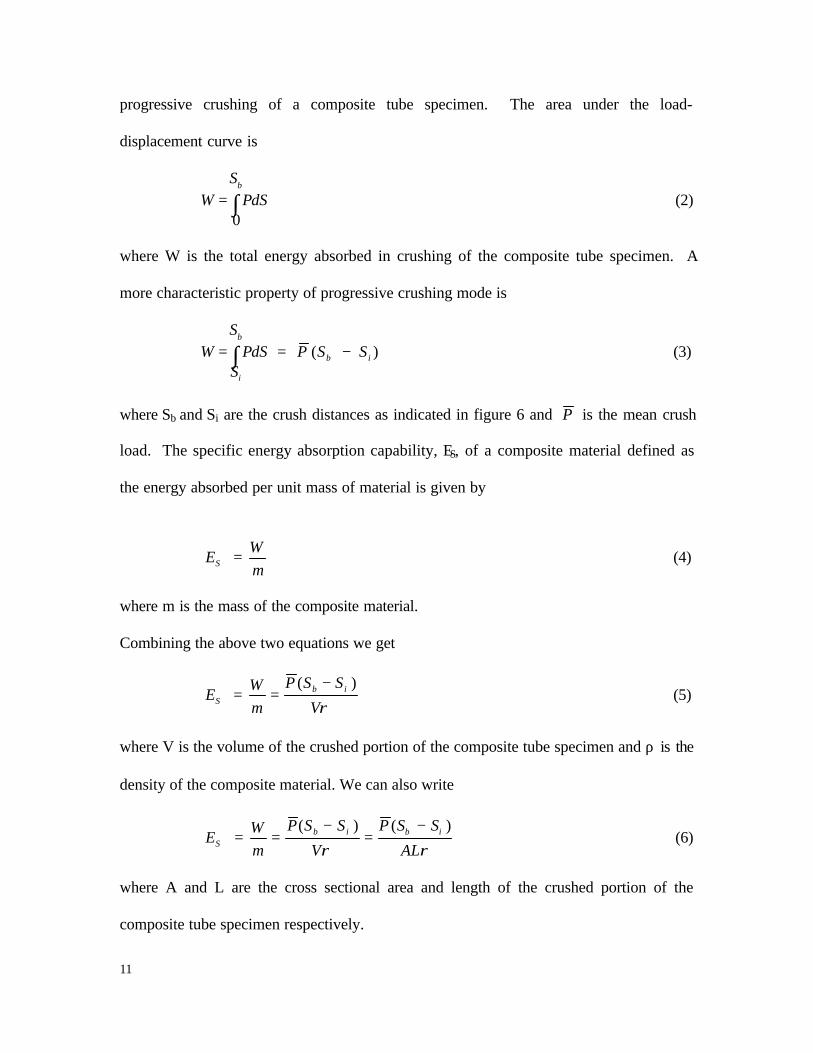
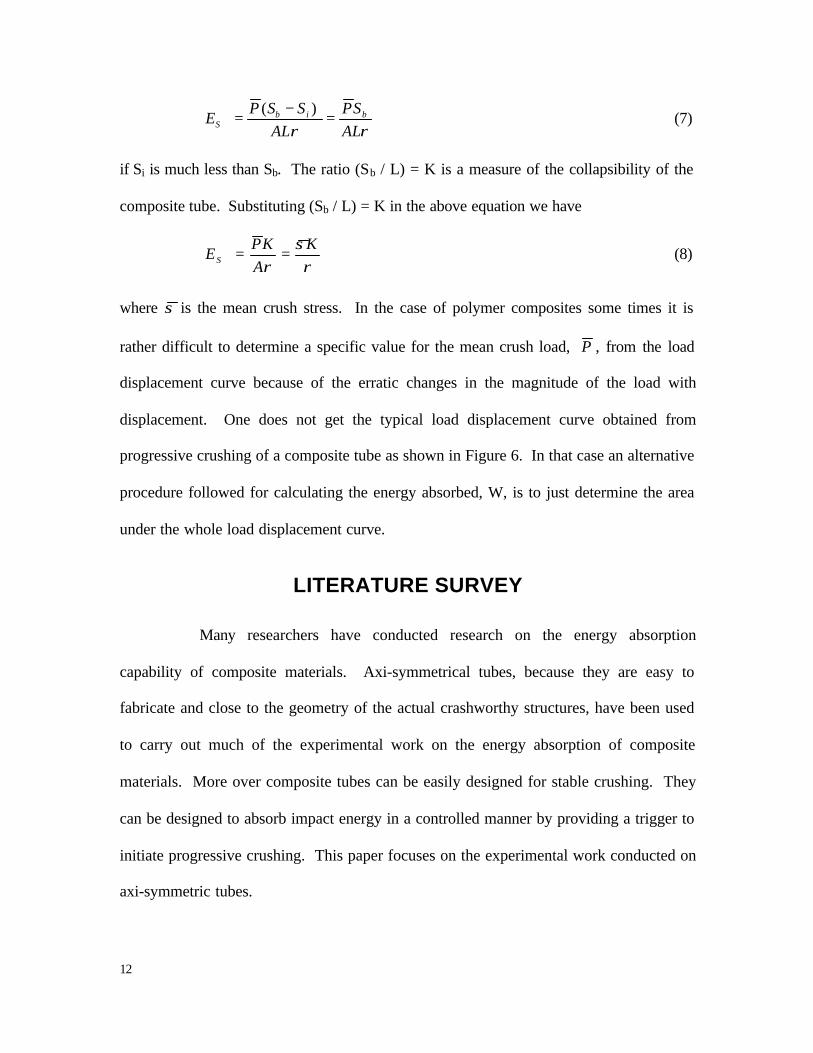


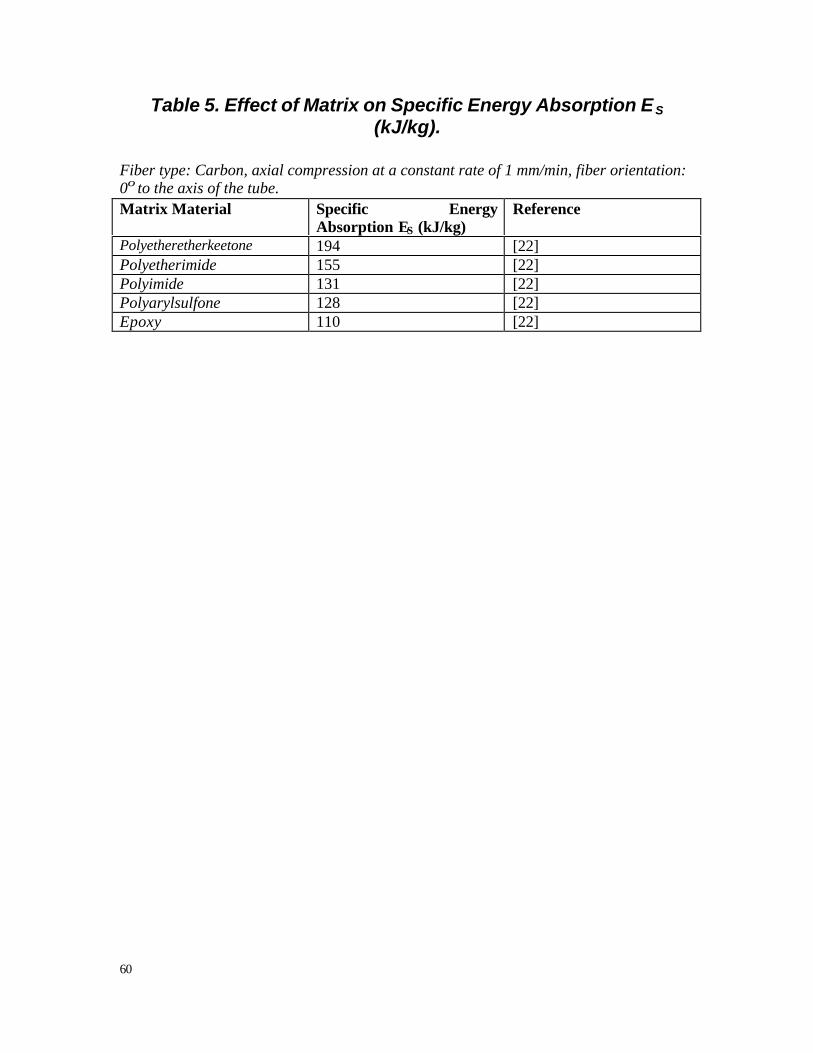


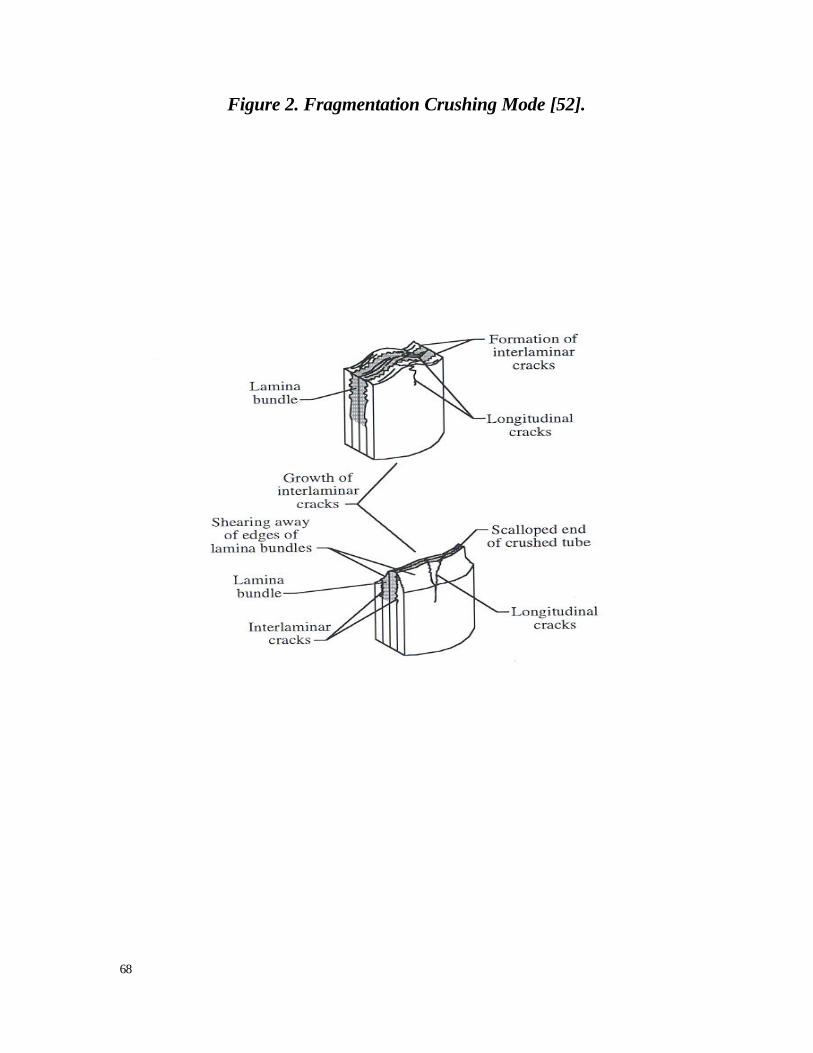


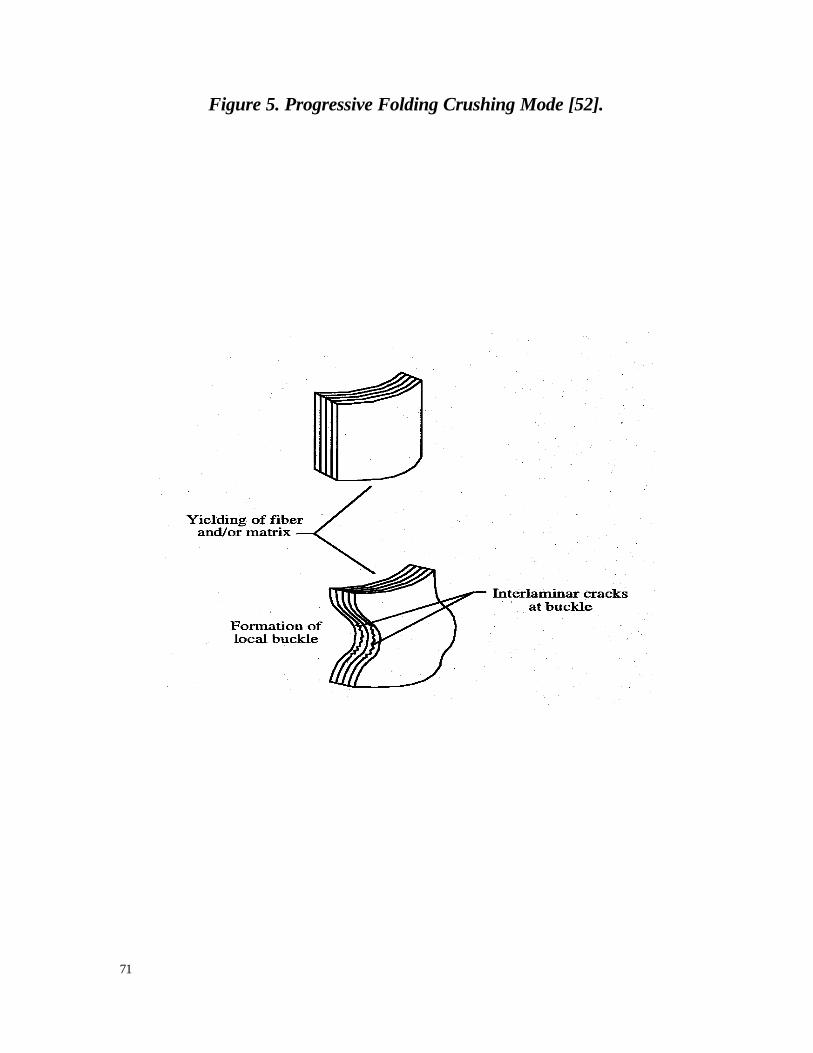


![Plant Fiber Reinforced Polymer Matrix Composite: A ...eprints.uthm.edu.my/id/...Fiber_Reinforced_Polymer_Matrix_Composite.pdf · materials in polymer matrix composite [1, 10-16].](https://static.documents.pub/doc/80x56/5e2eeabd37a603571643b069/plant-fiber-reinforced-polymer-matrix-composite-a-materials-in-polymer-matrix.jpg)


