41
Energy and Environment David Levinson
| Date post: | 01-Jan-2016 |
| Category: |
Documents |
| Upload: | sarah-cooper |
| View: | 76 times |
| Download: | 0 times |

Energy and Environment
David Levinson

World Energy Use
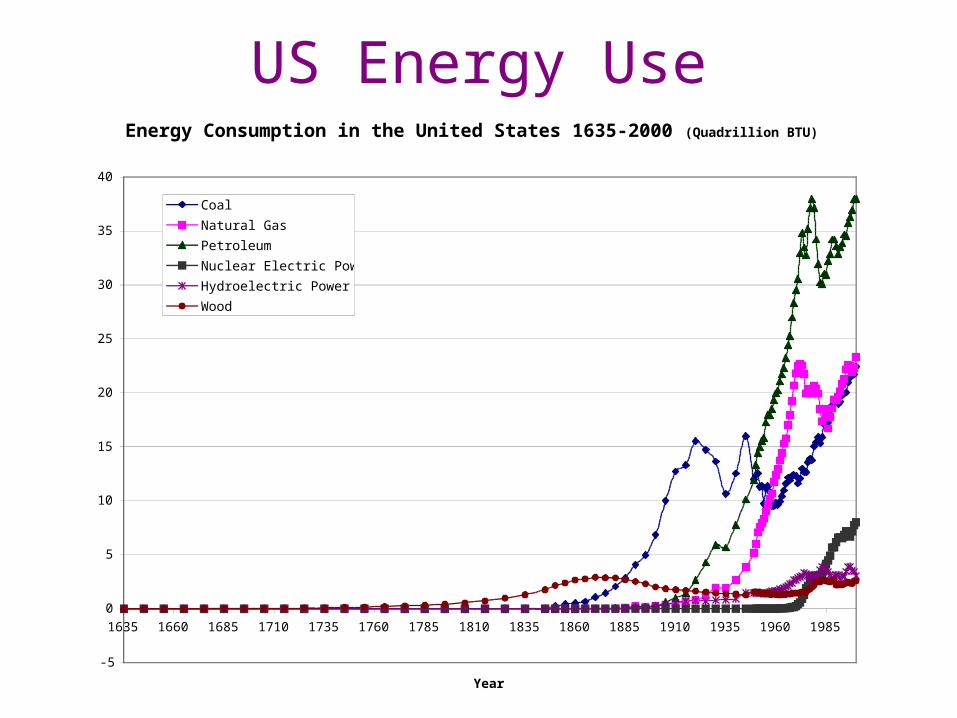
US Energy UseEnergy Consumption in the United States 1635-2000 (Quadrillion BTU)
-5
0
5
10
15
20
25
30
35
40
1635 1660 1685 1710 1735 1760 1785 1810 1835 1860 1885 1910 1935 1960 1985
Year
Coal
Natural Gas
Petroleum
Nuclear Electric Power
Hydroelectric Power
Wood

Relations Between Development and Energy Use
0
10
20
30
40
50
60
70
0 5000 10000 15000 20000 25000 30000 35000
Former Soviet Union/Eastern Europe
World Total
Middle East
China
South America
Western Europe
Other Asia
Africa
North America
Japan
Thousand BTU per 1999 Dollar of GDP
GDP Per Capita

Energy Use in United States (Millions of Barrels per Day)
0
5
10
15
20
25
1950 1955 1960 1965 1970 1975 1980 1985 1990 1995 2000
Total Transportation Industrial Residential Commercial Electricity

Energy Use by Mode (1999)
0 1,000 2,000 3,000 4,000 5,000 6,000 7,000 8,000 9,000 10,000
Automobiles
Light trucks
Motorcycles
Buses
Medium/heavy trucks
Construction
Agriculture
Air
Water
Pipeline
Rail
Trillion BTU

Energy Intensity
0 2,000 4,000 6,000 8,000 10,000 12,000 14,000
Automobile
Light Truck
Transit Bus
Intercity Bus
Air Carrier
General Aviation
Amtrak
Rail Transit
BTU Per Passenger Mile

Energy Intensity of Freight
0 500 1,000 1,500 2,000 2,500 3,000 3,500
Trucks
Waterborne commerce
Class I railroads
BTU/ton-mile

Energy is Required to Move Mass

Gas Stations are Everywhere

Energy Issues• “Energy Independence”
– Domestic Production, – Minimize Reliance on Foreign, unstable producers
• Environmental effects• Economic effects
0
100,000
200,000
300,000
400,000
500,000
600,000
700,000
1968 1970 1972 1974 1976 1978 1980 1982 1984 1986
Year
Crude Oil (thousands of metric tons)
Production Importation

Energy Policies
• Pricing– Gas Tax– Feebates– Pay at the Pump Insurance
• Technology – Alternative Fuels– Advanced Vehicle Design
• Standards– CAFE: Corporate Average Fuel Economy
Environmental Externalities of Transportation
• What is an externality?• Name some []
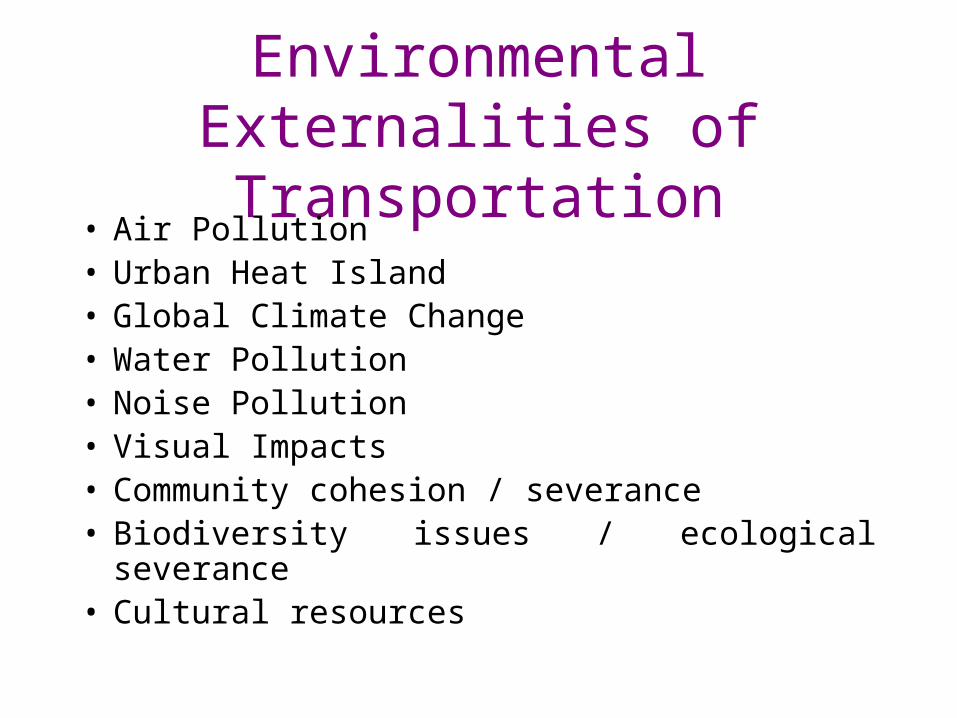
Environmental Externalities of Transportation
• Air Pollution• Urban Heat Island• Global Climate Change• Water Pollution• Noise Pollution • Visual Impacts• Community cohesion / severance• Biodiversity issues / ecological severance
• Cultural resources

Air Quality• Clean Air Acts 1970, 1977,1990.• Urban air quality improving or worsening?• Leaded Gas banned, vehicle catalytic converters and
improved pollution control devices fuel reformulation and vehicle inspection
• There is a technological solution. (There is a behavioral solution too which people are not willing to undertake)
• Collectively all behavioral TCMs have reduced pollution maybe 1-2%
• However pollution is still a bad thing• Autos improvement on previous technologies such as
horse, but ICE had problems compared w/steam or electric.
• Primary health, but also vegetation damage and material effects (building deterioration).
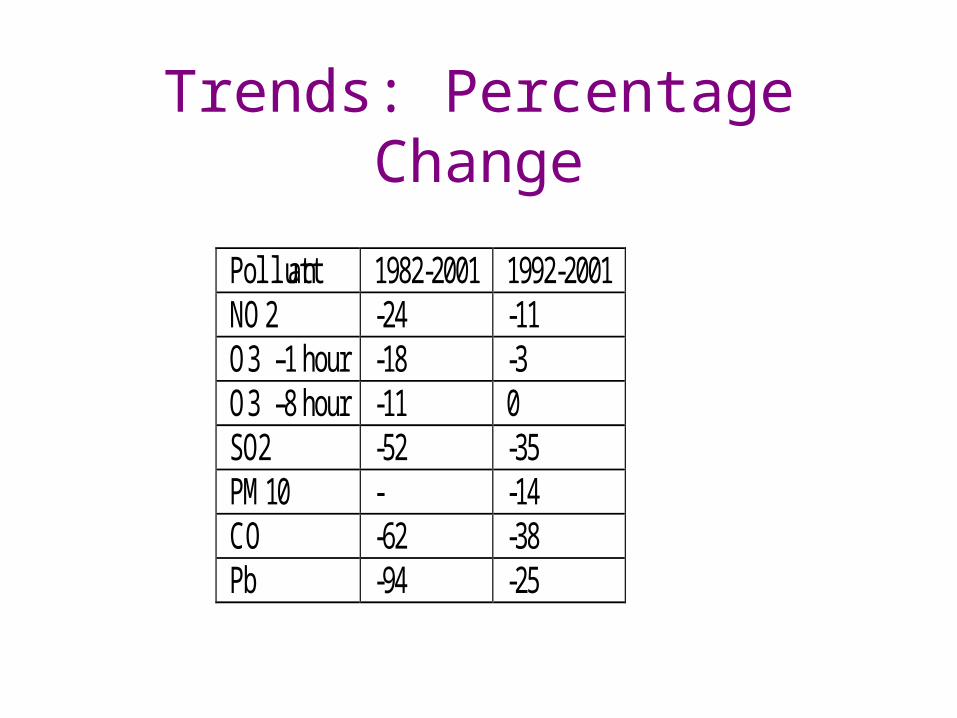
Trends: Percentage Change
Pollutant 1982-2001 1992-2001NO2 -24 -11O3 – 1 hour -18 -3O3 – 8 hour -11 0SO2 -52 -35PM10 - -14CO -62 -38Pb -94 -25

QuickTime™ and aTIFF (Uncompressed) decompressorare needed to see this picture.
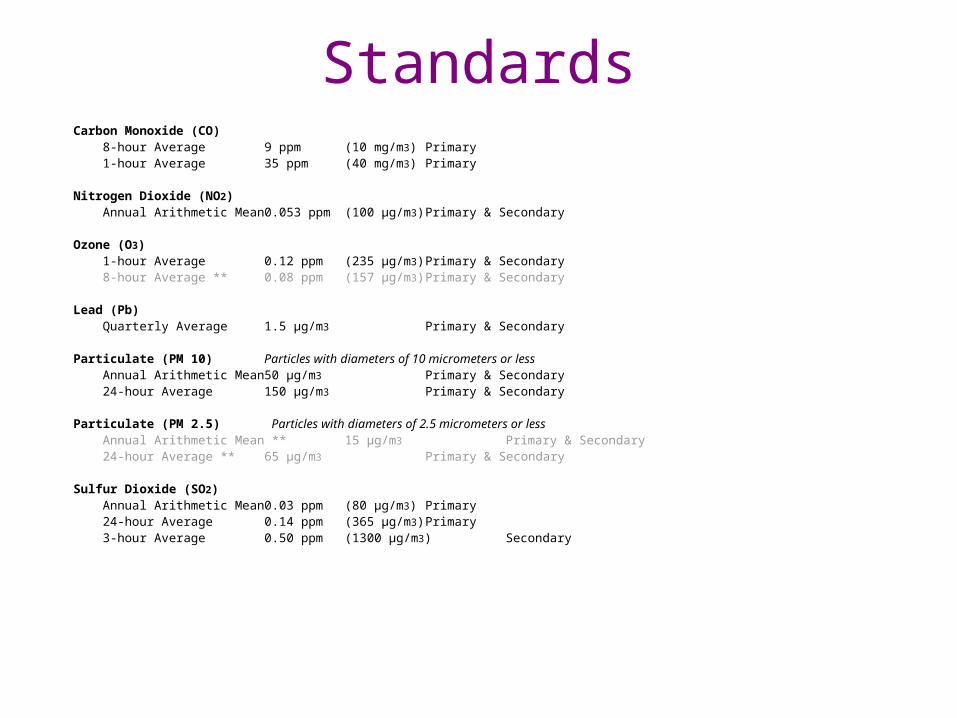
StandardsCarbon Monoxide (CO) 8-hour Average 9 ppm (10 mg/m3) Primary 1-hour Average 35 ppm (40 mg/m3) Primary
Nitrogen Dioxide (NO2) Annual Arithmetic Mean 0.053 ppm (100 µg/m3) Primary & Secondary
Ozone (O3) 1-hour Average 0.12 ppm (235 µg/m3) Primary & Secondary 8-hour Average ** 0.08 ppm (157 µg/m3) Primary & Secondary
Lead (Pb) Quarterly Average 1.5 µg/m3 Primary & Secondary
Particulate (PM 10) Particles with diameters of 10 micrometers or less Annual Arithmetic Mean 50 µg/m3 Primary & Secondary 24-hour Average 150 µg/m3 Primary & Secondary
Particulate (PM 2.5) Particles with diameters of 2.5 micrometers or less Annual Arithmetic Mean ** 15 µg/m3 Primary & Secondary 24-hour Average ** 65 µg/m3 Primary & Secondary
Sulfur Dioxide (SO2) Annual Arithmetic Mean 0.03 ppm (80 µg/m3) Primary 24-hour Average 0.14 ppm (365 µg/m3) Primary 3-hour Average 0.50 ppm (1300 µg/m3) Secondary

Non-Attainment CO
QuickTime™ and aTIFF (LZW) decompressorare needed to see this picture.
Non-Attainment Ozone (O3)
QuickTime™ and aTIFF (LZW) decompressorare needed to see this picture.
Non-Attainment: PM-10 (Ramsey Co.)
QuickTime™ and aTIFF (LZW) decompressorare needed to see this picture.

Non-Attainment: Lead (Pb)
QuickTime™ and aTIFF (LZW) decompressorare needed to see this picture.

Non-Attainment: SO2
QuickTime™ and aTIFF (LZW) decompressorare needed to see this picture.

Non-Attainment: NO2
• UNITED STATES has no Nitrogen Dioxide nonattainment areas.

Twin Cities (1998)
CO Pb NO2 O3 O3 PM10 PM10 SO2 SO2
8-hr QMax AM 1-hr 8-hr Wtd AM 2nd Max 24-hr
Arithmetic Mean
(ppm)
(µg/m3)
(ppm) (ppm)
(ppm)
(µg/m3)
(µg/m3)
(ppm)
(ppm)
5 0.47 0.022 0.09 0.08 35 88 0.004 0.030

Transportation Planning on Trial
(Garrett and Wachs)• Described Air Quality Conformity Process: New projects in metro area Transportation Improvement Programs must meet Air Quality Standards - determined through models.
• Environmental Groups believed MPO (Bay Area) was playing games, meeting outdated standards, achieving absolute rather than relative change.
• Went to courts, largely supported environmental groups.
• Failure to conform to Air quality conformity process will result in suspension of highway dollars (the so-called “Death Penalty”).

Greenhouse Gases (CO2)
QuickTime™ and aTIFF (Uncompressed) decompressorare needed to see this picture.
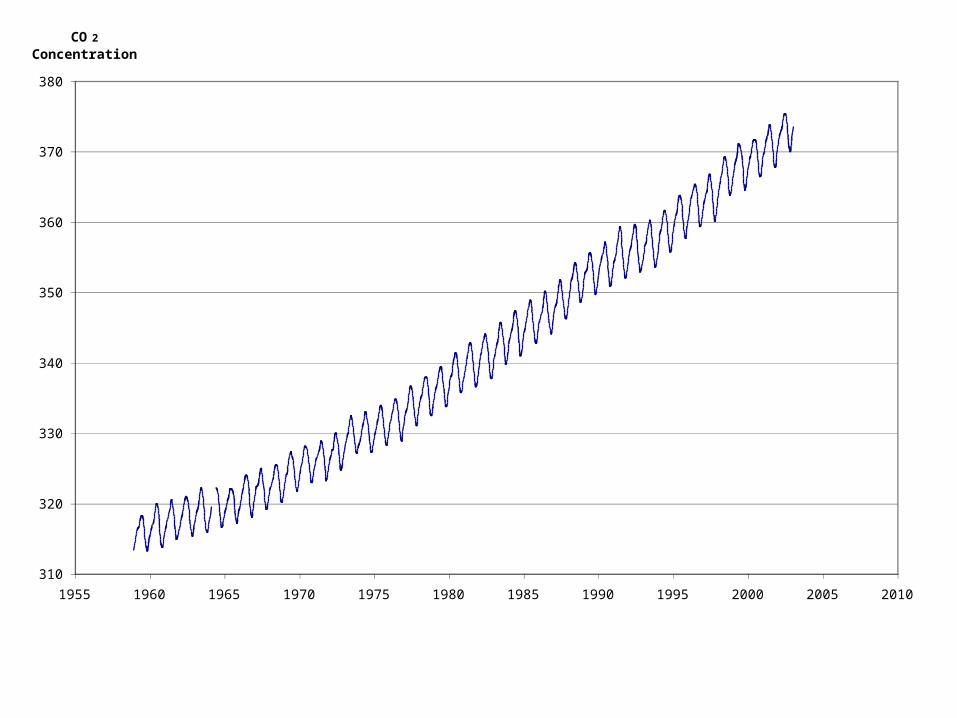
310
320
330
340
350
360
370
380
1955 1960 1965 1970 1975 1980 1985 1990 1995 2000 2005 2010
CO2
Concentration

Water Pollution Issues
• Run-off of polluted waters• Less pervious surface• Wetland destruction• Plant and animal injury.

Noise pollution:
• Problems: Sleep interference, speech interference, annoyance, hearing impairment, vibration
• Standards - % time noise level exceeded• Assessment - Measurement and models• Solutions– Prevention- mufflers, stage III aircraft,
antinoise– Protection-insulation, double windows, noise
wall– Buyout, change land use– Move noise generator – Containment

Environmental Impact Statement
• A written EIS is required for all federal projects• Just because there is an environmental effect does not necessarily stop project, BUT– Tends to slow development– Involves public and public – Increases awareness (can no longer plead ignorance).– More efficient use of infrastructure
• Project may be stopped if it violates environmental laws (wetlands, endangered species, Clean Air Act /TEA 21 rules).
• What is in EIS? – Purpose and Need for Project– Alternatives– Affected environment and consequences.

QuickTime™ and aTIFF (Uncompressed) decompressor
are needed to see this picture.
Battery• Batteries were developed in late 18th and early 19th century.
• Chemical reactions cause electrons (- charge) to build up at anode, which powers something (lightbulb, car), and then travels to the cathode, where they want to be.
• The electrons then travel from the cathode, through the electrolyte, to the anode.
• However, they use up the electrolyte on the way.
QuickTime™ and aTIFF (Uncompressed) decompressor
are needed to see this picture.
QuickTime™ and aTIFF (Uncompressed) decompressor
are needed to see this picture.

QuickTime™ and aTIFF (Uncompressed) decompressor
are needed to see this picture.
Steam, Electric, Gasoline
• In early years of automobile product (1890s, 1900s) Steam, Electric, and Gasoline power were competing.
• Electrics were backed by significant figures like Thomas Edison, as well as many entrepreneurs. Gasoline engines were backed by future significant individuals like Henry Ford (who had worked at Detroit Edison), and many other entrepreneurs. By 1913, Henry Ford was loaning money to Edison to develop EV.
• Clearly Electric won. Why?• Electrics had shorter range and lower speed. Could add more
batteries, but each additional battery added weight, which reduced the efficiency of other batteries.
• 1909 advent of self-starter in gasoline cars. Note self-starter was electrically (battery) powered. Gasoline-powered vehicles become huge market for batteries.
• This can be thought of as a type of Endo-symbiosis, like the chloroplasts in plants or mitochondria in animals become organelles in cells.

Hybrid-Electric Vehicles
QuickTime™ and aTIFF (Uncompressed) decompressor
are needed to see this picture.
QuickTime™ and aTIFF (Uncompressed) decompressor
are needed to see this picture.
1979Dave Arthurs of Springdale, Arkansas, spent $1,500 turning a standard Opel GT into a hybrid car that could get 75 miles per gallon, using a six-horsepower lawnmower engine, a four-hundred-amp electric motor, and an array of six-volt batteries. Mother Earth News used the Arthurs plan to build their own hybrid, which averaged 83.6 miles per gallon. Sixty thousand Mother Earth News readers wrote in for the plans, when the magazine published their results.
US Hybrid Sales
1905An American engineer named H. Piper filed a patent for a petrol-electric hybrid vehicle. His idea was to use an electric motor to assist an internal-combustion engine, enabling it to achieve 25 mph.1969The GM 512, a very lightweight experimental hybrid
car, ran entirely on electric power up to ten miles per hour. From ten to thirteen miles per hour, it ran on a combination of batteries and its two-cylinder gas engine. Above thirteen miles per hour, the GM 512 ran on gasoline. It could only reach 40 miles per hour.1976U.S. Congress enacted Public Law 94-413, the
Electric and Hybrid Vehicle Research, Development, and Demonstration Act of 1976. Among the law ユ s objectives were to work with industry to improve batteries, motors, controllers and other hybrid-electric components.
1997Toyota Prius went on sale to the public in Japan. First-year sales were nearly 18,000.1999Honda released the two-door Insight, the
first hybrid car to hit the mass market in the United States. The Insight wins numerous awards, and received EPA mileage ratings of 61 mpg city and 70 mpg highway.
2000Toyota released the Toyota Prius, the first hybrid four-door sedan available in the United States.

Advantages/ Disadvantages of Hybrid Technology
• What are the advantages and disadvantages of hybrid technology? []
QuickTime™ and aTIFF (Uncompressed) decompressor
are needed to see this picture.
Fuel Cells(How Stuff Works.com)
QuickTime™ and aTIFF (Uncompressed) decompressor
are needed to see this picture.
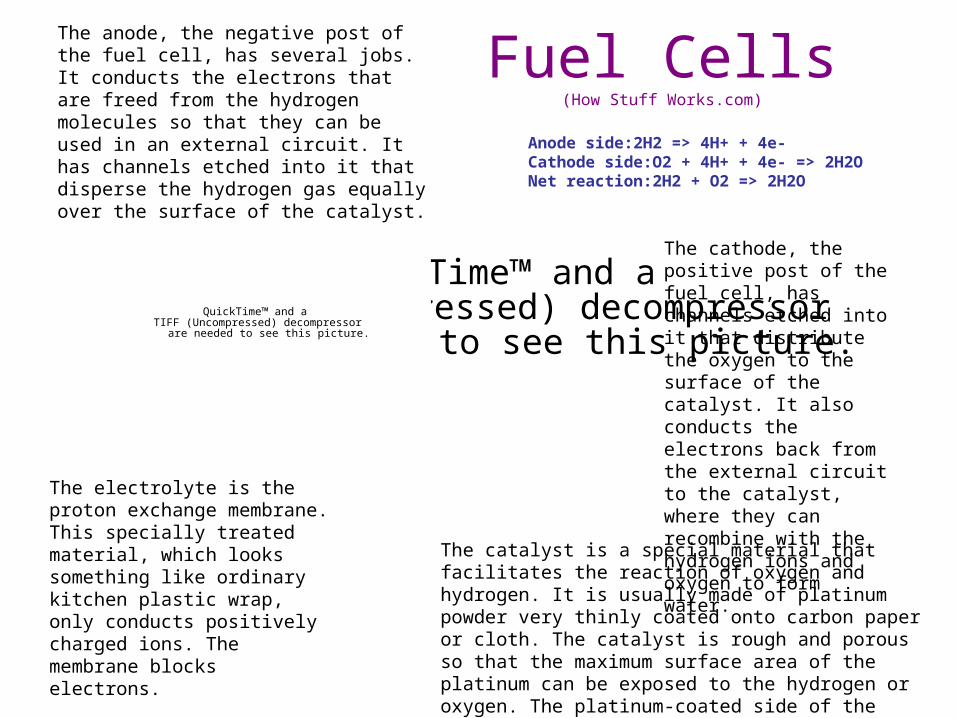
The anode, the negative post of the fuel cell, has several jobs. It conducts the electrons that are freed from the hydrogen molecules so that they can be used in an external circuit. It has channels etched into it that disperse the hydrogen gas equally over the surface of the catalyst.
The cathode, the positive post of the fuel cell, has channels etched into it that distribute the oxygen to the surface of the catalyst. It also conducts the electrons back from the external circuit to the catalyst, where they can recombine with the hydrogen ions and oxygen to form water.
The electrolyte is the proton exchange membrane. This specially treated material, which looks something like ordinary kitchen plastic wrap, only conducts positively charged ions. The membrane blocks electrons.
The catalyst is a special material that facilitates the reaction of oxygen and hydrogen. It is usually made of platinum powder very thinly coated onto carbon paper or cloth. The catalyst is rough and porous so that the maximum surface area of the platinum can be exposed to the hydrogen or oxygen. The platinum-coated side of the catalyst faces the PEM.
Anode side:2H2 => 4H+ + 4e-Cathode side:O2 + 4H+ + 4e- => 2H2ONet reaction:2H2 + O2 => 2H2O

QuickTime™ and aTIFF (Uncompressed) decompressor
are needed to see this picture.
Where Does the Hydrogen Come From?
• (The oxygen comes from the air)• We do not have a hydrogen
distribution system• We may need to produce hydrogen
on vehicle using a reformer, which transforms hydrocarbon or alcohol fuels (e.g. natural gas/methanol/gasoline) into hydrogen.
• They can be stored in tanks, but everyone fears the Hindenburg scenario.
• Alternatively, we may be able to store hydrogen packs on vehicles that can be easily replaced or recharged.
QuickTime™ and aTIFF (Uncompressed) decompressor
are needed to see this picture.

Difference between Battery and Fuel Cell
(And Capacitor)• Electrolyte in battery gets used up• Catalyst in fuel cell does not get used up.
• As long as fuel is supplied, fuel cell will continue to work.
• Capacitors (which pass alternating current but not direct current) release short bursts of energy (think lightning, or a water tower), and can be coupled with other energy sources (e.g. batteries) to provide peak energy (acceleration) when needed, while the battery can provide the steady energy.

QuickTime™ and aTIFF (Uncompressed) decompressor
are needed to see this picture.
Programs Pushing Fuel Cells
• FreedomCAR Partnership: A partnership between the U.S. Department of Energy and industry with the goal of developing emission- and petroleum-free cars and light trucks, including fuel cell vehicles.
• California Fuel Cell Partnership: A collaborative of auto makers, energy companies, fuel cell technology companies, and government agencies working together to advance fuel cell vehicle technology.
• Fuel Cells 2000: A non-profit educational organization formed to promote the development and early commercialization of fuel cells and related fuels and technologies.
• National Hydrogen Association: An organization designed as a catalyst for information exchange and cooperative projects among industry, government, and research/academic organizations.
• Hydrogen Fuel Cells & Infrastructure Technology Program: The lead Federal agency for directing and integrating activities in hydrogen and fuel cell research and development.

Questions?

Gasoline vs. Ethanol vs. Diesel


