June 2009 Truls Gundersen, EPT Master of Science in Energy and Environment Submission date: Supervisor: Norwegian University of Science and Technology Department of Energy and Process Engineering Energy and Environmental Aspects of an FPSO for LNG Production Lars Petter Rein Revheim
Transcript
June 2009Truls Gundersen, EPT
Master of Science in Energy and EnvironmentSubmission date:Supervisor:
Norwegian University of Science and TechnologyDepartment of Energy and Process Engineering
Energy and Environmental Aspects ofan FPSO for LNG Production
Lars Petter Rein Revheim
Problem DescriptionThe main objective of this Master thesis is to make an evaluation of the design solution FPSO-1proposed by Höegh LNG with focus on energy efficiency and environmental aspects. In particular,the improvement potential should be discussed and quantified. Consequences for the environmentin the form of emissions should be considered throughout the thesis.
Assignment given: 15. January 2009Supervisor: Truls Gundersen, EPT
- 1 -
- 2 -
- 3 -
- 4 -
Summary The floating production unit HLNG FPSO-1 has been evaluated with respect to its energy consumption and emissions to air, and improvement potentials within the same context have been suggested and discussed. The thesis describes theory of combustion of natural gas, emission calculations, energy consumption of compressors and theory of fuel gas consumption for gas turbines. A literature study of LNG processes suitable for offshore applications has also been included. The CO2 emissions from the HLNG FPSO-1 add up to about 6% of the CO2 emissions from the Norwegian oil and gas industry (2005), which is a noticeable amount. However the energy content in the LNG produced over one year from the FPSO-1 count for ca 35% of the energy consumed over one year related to oil and gas extraction on the Norwegian continental shelf. This illustrates that even though floating LNG production is energy intensive and the resulting amounts of greenhouse gas emissions (as CO2) are substantial, the LNG contains significant amounts of energy, which is a result of the 600-fold reduction in volume when the natural gas is liquefied. Two different availabilities of the topside processes FPSO-1 exist and are calculated by Det Norske Veritas. The lower availability is based on a no-flare philosophy, which is considered not to be relevant for the project in the further development. The reason for this is that a strict no-flaring philosophy is not desirable from an operational point of view, and that duplication of every equipment item which handles hydrocarbon streams is not a realistic design alternative. Therefore the higher availability which allows some flaring during normal production is used for all the suggested improvement potentials. Based on two different future oil prices (a high and low scenario), the value of the LNG produced, as well as the value of the additional LNG produced as a result of higher availability of the FPSO-1 are calculated. Two design changes of the LNG liquefaction process as a result of a lighter feed gas composition are described and discussed in the context of energy consumption and emissions to air. Both design changes have the possibility of saving more than 10 MW power in total. Also, the implications of eventual necessary compliance with the Equator Principles are discussed. The project may find that certain guidelines or philosophies given by institutions financing parts of the project must be followed (such as use of Best Available Technology), and should evaluate these eventual restrictions when financial institutions are selected for the project. The further development of the project with the goal of making the topside processes on the FPSO-1 as energy efficient as possible (thereby saving operational costs and reducing the impact on the environment), should evaluate the feasibility of implementing the design changes suggested in the thesis from a more extensive technical and economical point of view.
- 5 -
Preface During the work with the master thesis, some parts of the original assignment text have been more in focus than others. This has been discussed with my teaching supervisor at NTNU. The focus has mostly been on technical issues with respect to suggested changes in the design of the topside processes on the FPSO-1, and the thermodynamics that these changes build on. Calculations of the economic consequences of the suggested design changes have also been performed, although in a less extensive manner. The impacts for the environment with respect to NOx and CO2 emissions to air have been considered throughout the thesis. Point 4 in the assignment text has only been evaluated with respect to amounts of emissions during flaring at the initial start-up, due to time restrictions and the fact that dynamic simulation models of the topside processes have not been available. I would like to thank my teaching supervisor at NTNU, Professor Truls Gundersen for valuable and regular feedback during my work. Also, I would like to thank my contact at Höegh LNG AS, Vegard Hellekleiv for making this cooperation possible, and for good answers to technical questions. In addition, I thank also Thomas Larsen at Höegh LNG for even more extensive answers to technical questions and for fast feedback. Trondheim, 08.09.2009
_________________________________ Lars Petter Revheim
LIST OF FIGURES ..........................................................................................................................................- 8 -
LIST OF TABLES ............................................................................................................................................- 9 -
1 THEORY ............................................................................................................................................................ 1
1.2.1 NOx emissions ......................................................................................................................................3 1.2.2 CO2 emissions ......................................................................................................................................4
1.3 FUEL GAS CONSUMPTION GAS TURBINES....................................................................................................... 5 1.4 POWER CONSUMPTION OF COMPRESSORS......................................................................................................7
2.1 SHELL DUAL M IXED REFRIGERANT (DMR) LIQUEFACTION PROCESS......................................................... 12 2.2 NICHELNG LIQUEFACTION PROCESS........................................................................................................... 13 2.3 THE LIQUEFIED ENERGY CHAIN (LEC) ....................................................................................................... 14
3 HÖEGH LNG FPSO-1 AS DESIGNED......................................................................................................... 16
3.1 TOPSIDES – FROM TURRET TO OFFLOADING................................................................................................. 16 3.1.1 Gas treating, and fractionation of LPG and condensate .................................................................... 17 3.1.2 LNG Liquefaction ............................................................................................................................... 18 3.1.3 Power generation ............................................................................................................................... 18 3.1.4 Utility systems..................................................................................................................................... 19 3.1.5 Storage and offloading ....................................................................................................................... 19
3.2 DESIGN- AND OPERATION PHILOSOPHY....................................................................................................... 19 3.2.1 Flaring – safety and availability......................................................................................................... 20
3.3 CONSEQUENCES OF THE DESIGN AT END OF FEED ...................................................................................... 22 3.3.1 Energy Consumption – efficiency ....................................................................................................... 22 3.3.2 NOx Emissions – normal production.................................................................................................. 24 3.3.3 CO2 Emissions – normal production.................................................................................................. 25 3.3.4 Emissions – flaring ............................................................................................................................. 28 3.3.5 Emissions – costs ................................................................................................................................ 30 3.3.6 Availability – cost ............................................................................................................................... 30 3.3.7 NGL Extraction – robust but complicated.......................................................................................... 31 3.3.8 Generic gas composition and undetermined location......................................................................... 32
3.4 KEY FIGURES – END OF FEED DESIGN......................................................................................................... 33
4.1 COOLING WATER TEMPERATURE CHANGE................................................................................................... 35 4.1.1 CW temperature change – results....................................................................................................... 38
4.2 NGL EXTRACTION PROCESS CHANGE.......................................................................................................... 41 4.2.1 Case 1 ................................................................................................................................................. 42 4.2.2 Case 2 ................................................................................................................................................. 44 4.3.3 Case selection.....................................................................................................................................47
4.3 AVAILABILITY – FLARING AND COST REDUCTION........................................................................................ 47 4.3.1 Additional emissions during normal production................................................................................ 48 4.3.2 Flaring during production – enhanced LNG production.................................................................... 48 4.3.3 Flaring during production - emissions ............................................................................................... 49
4.4 EQUATOR PRINCIPLES – BEST AVAILABLE TECHNOLOGY........................................................................... 50
APPENDIX A, NOX AND CO2 EMISSION CALCULATIONS...... ............................................................. 61
Stud.techn Lars Petter Revheim - 8 -
List of Figures Figure 1.1 Nominal output and efficiency vs. turbine rotor speed Siemens SGT-700 [6],
page 6
Figure 1.2 Selection chart for compressors [9], page 7
Figure 1.3 Log p-h diagram methane [10], page 8
Figure 2.1 LNG liquefaction processes divided by type, page 10
Figure 2.2 Temperature profiles of refrigerant and natural gas during liquefaction, page 10
Figure 2.3 Representation of the Shell Dual Mixed Refrigerant liquefaction process [9],
page 12
Figure 2.4 The NicheLNG liquefaction process [19], page 14
Figure 2.5 The Liquefied Energy Chain [20], page 15
Figure 3.1 Topside processes on HLNG FPSO-1, page 17
Figure 3.2 Selected amounts of energy relative to energy content in LNG from
HLNG FPSO-1, page 24
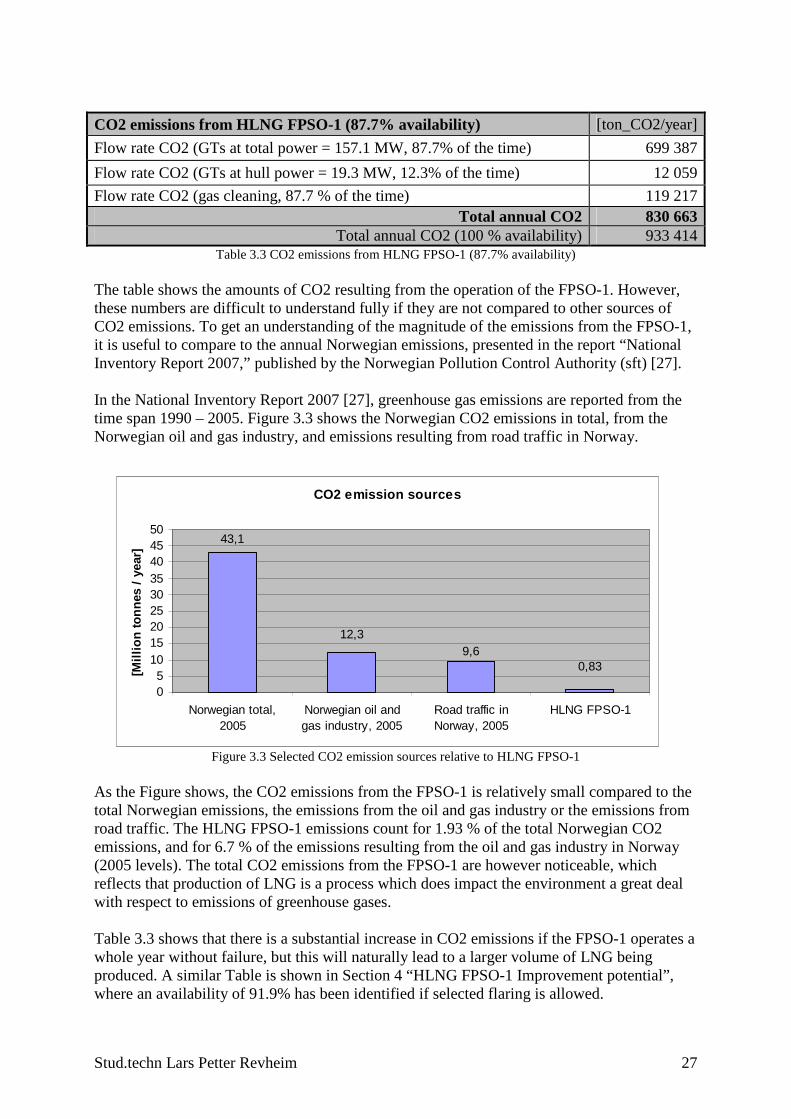
Figure 3.3 Selected CO2 emission sources relative to HLNG FPSO-1, page 27
Figure 4.1 Schematic set up of a simple LNG liquefaction process, page 37
Figure 4.2 Simplified flow sheet of the liquefaction process on HLNG FPSO-1, page 37
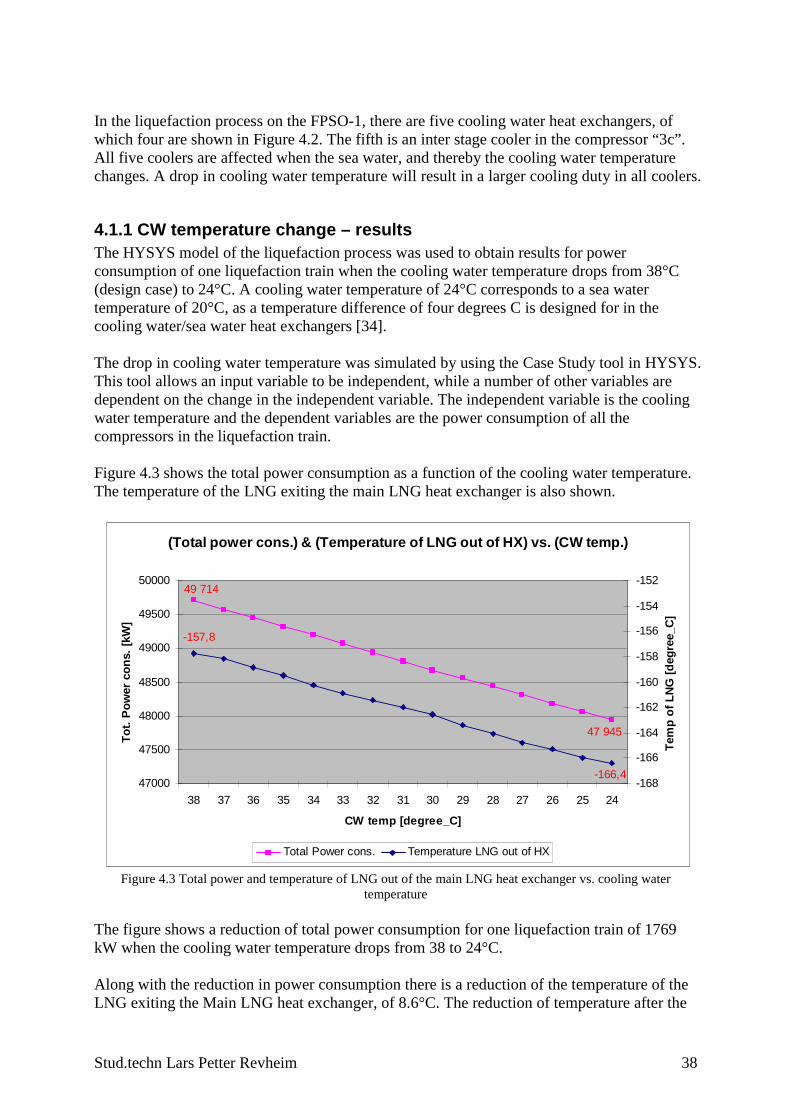
Figure 4.3 Total power and temperature of LNG out of the main LNG heat exchanger vs.
cooling water temperature, page 38
Figure 4.4 Total power consumption and temperature of LNG out of main LNG heat
exchanger vs. nitrogen refrigerant flow rate, page 39
Figure 4.5 Pressure profile for the natural gas through the topside processes on the
FPSO-1, page 41
Figure 4.6 Simplified flow sheet of the FPSO-1 liquefaction process, implemented design
change Case 1, page 42
Figure 4.7 Simplified flow sheet of the FPSO-1 liquefaction process, implemented design
change Case2, page 44
Stud.techn Lars Petter Revheim - 9 -
List of Tables Table 3.1 “Energy consumption of FPSO-1 – as designed at end of FEED”, page 23
Table 3.2 NOx emissions (as N2O) from DLE and SAC combustion systems, page 25
Table 3.3 CO2 emissions from HLNG FPSO-1 (87.7% availability), page 27
Table 3.4 Emission factors and Emissions per hour during initial start-up, page 29
Table 3.5 Total emissions for an initial start-up procedure of 24 hours, page 29
Table 3.6 Costs related to NOx emissions, relative to combustion system, page 30
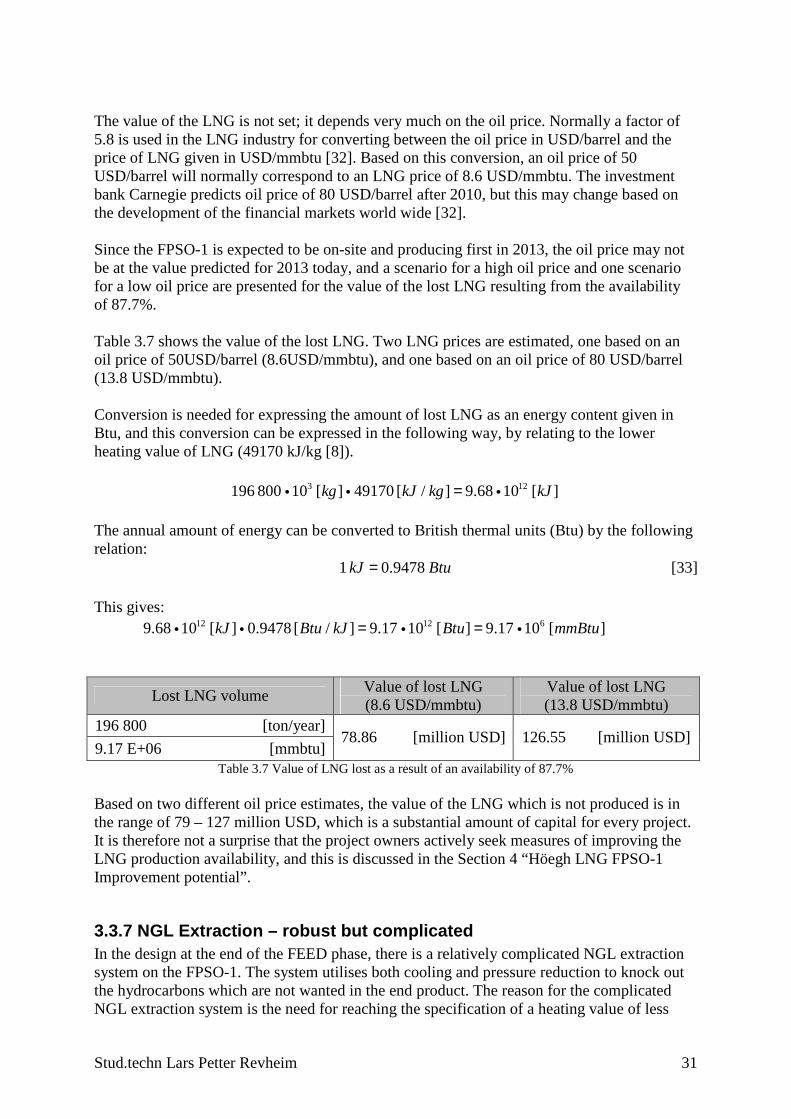
Table 3.7 Value of LNG lost as a result of an availability of 87.7%, page 31
Table 3.8 End of FEED design, Key figures, page 33
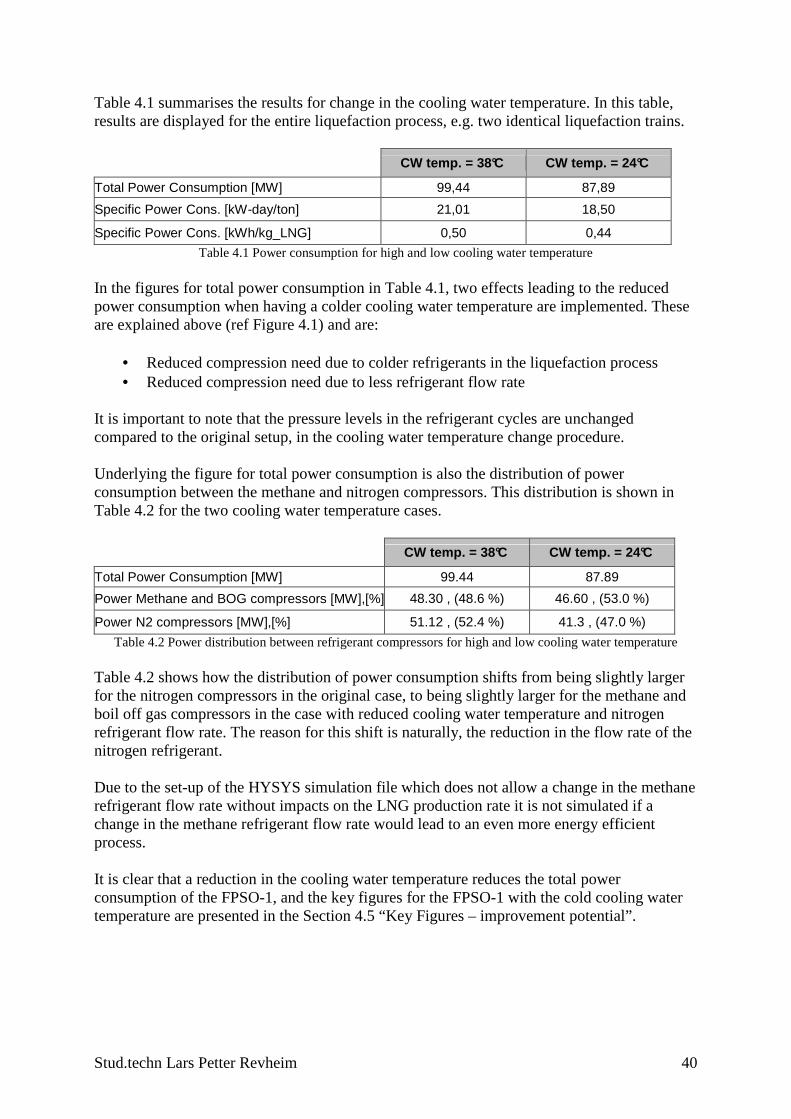
Table 4.1 Power consumption for high and low cooling water temperature, page 40
Table 4.2 Power distribution between refrigerant compressors for high and low cooling
water temperature, page 40
Table 4.3 Comparison End of FEED design and Case 1, page 43
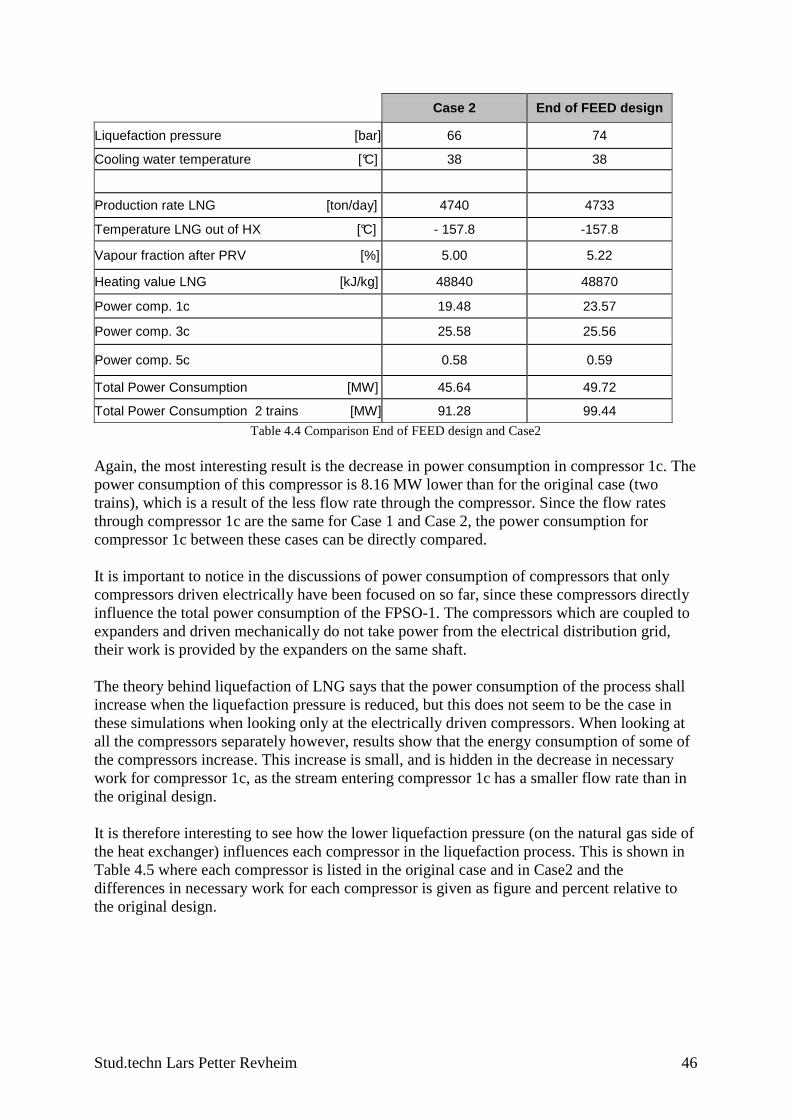
Table 4.4 Comparison End of FEED design and Case2, page 46
Table 4.5 Power for each compressor End of FEED design and Case 2, page 47
Table 4.6 CO2 emissions from HLNG FPSO-1, availability 91.9%, page 48
Table 4.7 Value of LNG produced, relative to availability of the FPSO-1, page 49
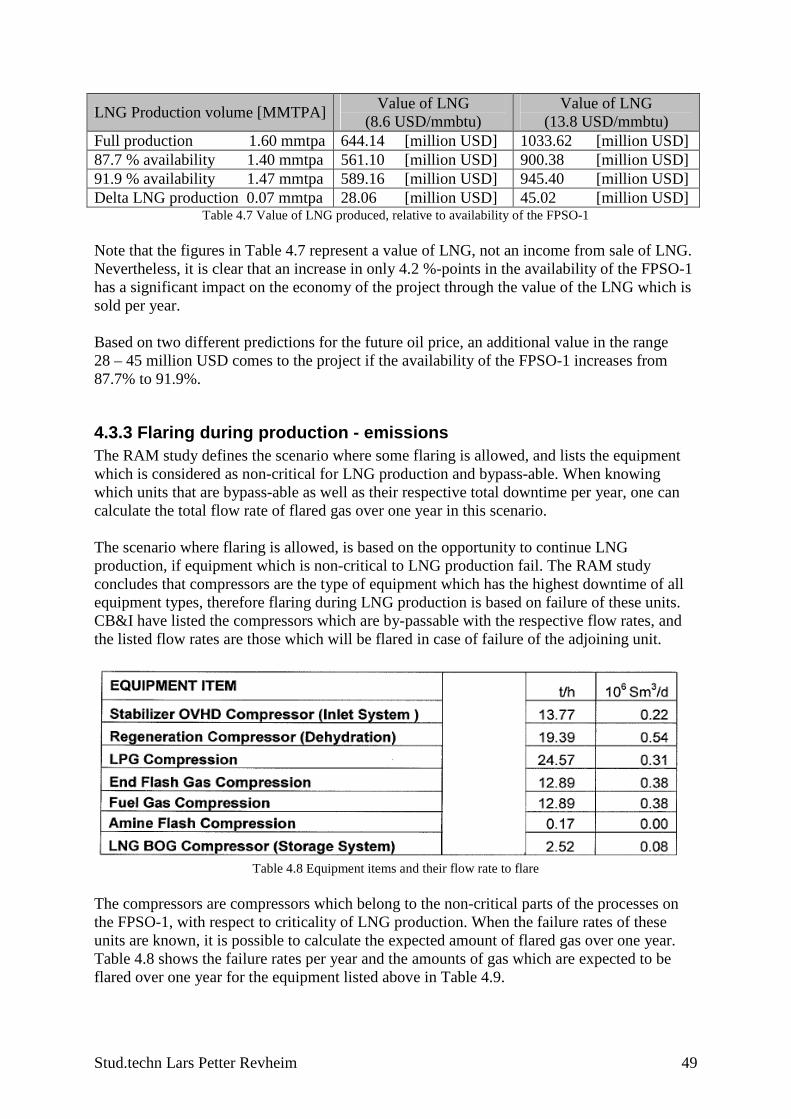
Table 4.8 Equipment items and their flow rate to flare, page 49
Table 4.9 Equipment items and their downtime and resulting flow rates to flare, page 50
Table 4.10 Total amounts of emissions from flaring during normal operation, page 50
Table 4.11 Key figures for end of FEED design and end of FEED design with higher
availability, page 52
Table 4.12 Key figures for Case 1 design change and for cooling water temperature
change, page 53
Stud.techn Lars Petter Revheim - 10 -
Nomenclature
Abbreviations BAT Best Available Technology BREF Best available technology Reference document C3-MR Propane (C3) Mixed Refrigerant CO2 Carbon dioxide CB&I Chicago Bridge & Iron Company CW Cooling Water DLE Dry Low Emission combustion system DMR Dual Mixed Refrigerant (Shell LNG Liquefaction process) DNV Det Norske Veritas EPFI Equator Principle Financial Institution FEED Front End Engineering Design FPSO Floating Production Storage and Offloading unit FPSO-1 The first of the series of FPSOs planned built by Höegh LNG AS GT Gas Turbine HFS Höegh Fleet Services HLNG Höegh LNG AS LEC (the) Liquefied Energy Chain LHV Lower Heating Value LNG Liquefied Natural Gas LPG Liquefied Petroleum Gas (butane and propane) MMTPA Million tonnes per annum NGL Natural Gas Liquids (LPG and condensate) NOx Nitrous oxides O&M Operation & Maintenance ppm parts per million RAM Reliability Availability and Maintainability rpm revolutions per minute SAC Single Annular Combustion system USD U.S. Dollars
Latin letters a moles of air in combustion reactant b moles of oxygen in combustion products h enthalpy kJ/kg
mi
mass flow rate kg/s
Vi
volumetric flow rate m3/s W work kW X mole fraction x equivalent number of carbon atoms in fuel gas y equivalent number of hydrogen atoms in fuel gas
Stud.techn Lars Petter Revheim - 11 -
Greek letters ρ density kg/m3 χ concentration ppm φ CO2 formation factor kgCO2/kwh_fuel
Subscripts act actual Stoich stoichiometric tot total x equivalent number of carbon atoms in fuel gas y equivalent number of hydrogen atoms in fuel gas
Prefixes k kilo 103 M Mega 106
G Giga 109 T Tera 1012 P Peta 1015
Stud.techn Lars Petter Revheim - 12 -
Introduction As one of the first in the LNG industry, Höegh LNG is developing the first of a series of FPSO’s for LNG production. The development of the first FPSO (FPSO-1) has by March 2009 reached the end of the FEED (Front End Engineering Design) phase. A relatively open design has been used throughout the FEED phase, as the final location of the FPSO-1 is not yet determined. Because of the unknown final destination of the facilities, the parameters used in some parts of the design are generic, for instance the composition of the natural gas from the gas well. The generic gas composition influences the design of the processes on the FPSO-1 to some extent, and it is probable that the final design of the FPSO-1 will differ from the design at the end of the FEED. The change in design as the project moves on to more detailed engineering brings with it some opportunities for improving the energy consumption on the FPSO-1, and thereby reducing the impact on the environment. It is however a wish to keep the design of the FPSO as simple as possible in order to be able to use the same design in parts of the process on future LNG FPSOs. The important safety aspect also favours a simple, but thereby not as energy efficient, design. This master thesis takes the design at the end of the FEED phase as a point of departure and looks into some areas of possible improvement in design, with respect to energy consumption and impact on the environment. The operation and design philosophies are also discussed in the same context. The thesis gives first an overview of the theory underlying combustion of natural gas and emission calculations, since all the power produced on the FPSO-1 origins from gas turbines. The theory behind energy consumption of compressors is also explained, as well as the method for calculating the fuel gas consumption of gas turbines. An overview of relevant LNG liquefaction processes is also given in the start of the thesis. Outline: Chapter 1: Theory of combustion of natural gas, emission calculations, fuel gas
consumption and energy consumption of compressors Chapter 2: Overview of LNG liquefaction processes relevant for offshore applications Chapter 3: Description of the HLNG FPSO-1 as it is at the end of the FEED phase Chapter 4: Suggested improvement potentials for the HLNG FPSO-1 Chapter 5: Discussion of the results obtained during the work with the thesis Chapter 6: Conclusions and suggestions for further work
Stud.techn Lars Petter Revheim 1
1 Theory During the work with the master thesis, a number of calculations have been performed on energy consumption, amount of emissions released to air, formation of combustion products, etc. The theory behind the most important calculations is described in this section.
1.1 Combustion of natural gas In the gas turbines providing the necessary power to the FPSO-1, natural gas is combusted. Combustion of any combustible material happens when three premises are fulfilled, the combustible material must be present, air (or only oxygen) must be present and the temperature where the combustion happens must be at a sufficient high level. The combustion is described here as it gives an understanding of the mechanisms forming CO2 and NOx, which are the two most important types of emissions from gas turbines. Combustion is defined as: “a usually rapid chemical process (as oxidation) that produces heat and usually light; also: a slower oxidation (as in the body) [1]. It is only the rapid oxidation part of the definition which is relevant for this thesis. Oxidation describes the process when a substance combines with oxygen, the substance being mainly carbon and hydrogen for combustion of natural gas. The chemical reactions taking place in the combustion chamber of a gas turbine form reaction products such as CO2, CO, H2O (gaseous), and NOx-compounds. Nitrogen and, depending on the conditions in the combustion chamber excess oxygen is also present in the exhaust gas. By “conditions in the combustion chamber”, essentially the ratio of fuel per air as well as the temperature is meant. The air to fuel ratio for gas turbines is generally quite large, as much as 60 times more air than fuel are fed to the combustion chamber in some configurations. For the purpose of explaining the combustion of natural gas, stoichiometric conditions may also be used. Stoichiometric conditions describe combustion where just enough air is present in the combustion chamber, so that the combustion is complete, and the products are only CO2, H2O and N2 (as inert gas). For combustion of a hydrocarbon fuel under stoichiometric conditions the combustion reaction can be expressed as: 2 2 2 2 2C H (O 3.76N ) CO ( / 2)H O+3.76 Nx y a x y a+ + → + (e1.1)
where / 4a x y= + It is here assumed that air consists of 21% O2 and 79% N2, for simplicity. The x and y in the equation refers to the number of carbon and hydrogen atoms present in a molecule of the fuel. For methane, x would be 1, and y would be 4. An important thing to notice is that all the carbon atoms in the fuel are bound in CO2 in the exhaust.
Stud.techn Lars Petter Revheim 2
For a fuel gas composition consisting of several types of hydrocarbon compounds, an equivalent fuel gas composition on the formC Hx y can be found. The equivalent fuel gas
composition is found by performing a balance of atoms over the combustion reaction. For the fuel gas on the FPSO-1, the equivalent fuel composition is 1.084 3.897C H , and the
combustion reaction under stoichiometric conditions, with inserted values becomes: 1.084 3.897 2 2 2 2 2C H 2.058(O 3.76N ) 1.084CO 1.949H O 7.739N+ + → + +
The stoichiometric air to fuel ratio then becomes:
28.844.76
4.76 2.058 13.881 20.35
air air air
fuelStoich fuel fuelStoich
kgm MWAir a kgkmole
kgkgFuel m MWkmole
= = = = i i (e1.2)
On the datasheet for one gas turbine which could be considered for the FPSO-1, a fraction of oxygen in the exhaust gas is given as an indication of the operating air to fuel ratio for the gas turbine. This oxygen content is 15mol-%, which means the gas turbine runs with an air to fuel ratio which is so large that the exhaust gas from the combustion chamber contains 15mol-% O2 (which has passed through the combustion zone without taking part in the combustion reactions) [2]. It is assumed that the exhaust consists of mainly CO2, H2O, O2 and N2, and that compounds such as NOx and traces of carbon and hydrogen which have not been combusted are only present in so small quantities that they are considered negligible. Based on the figure for oxygen content in the exhaust gas, the operational air to fuel ratio expressed in [kg_air/kg_fuel] can be found. The combustion reaction with O2 in the exhaust can be expressed as: 1.084 3.897 2 2 2 2 2 2C H (O 3.76N ) 1.084CO 1.949H O O 3.76 Na b a+ + → + + + (e1.3)
where a and b are related through a balance of oxygen atoms over the equation: 2 2 1.084 1.949 2a b= + +i or: 2.059b a= − The oxygen content in the exhaust gas is given in mol-%, which by dividing by 100 becomes the mole fraction of O2 in the exhaust. By the definition of mole fraction [3], one obtains:
2
2
OO
2.059
1.084 1.949 3.76 0.974 4.76Exhaust
N b aX
N b a a
−= = =+ + + +
By inserting the value for mole fraction of O2, the value of a is obtained:
2.059
0.150.974 4.76
a
a
−=+
Stud.techn Lars Petter Revheim 3
7.710a = Using Equation (e1.2):
28.844.76
4.76 7.71 52.011 20.35
air air air
fuelActual fuel fuelActual
kgm MWAir a kgkmole
kgkgFuel m MWkmole
= = = = i i
The operational air to fuel ratio is in other words more than three times as big as the stoichiometric air to fuel ratio.
1.2 Emission calculations Emissions from the gas turbines count for the majority of emissions to air from the FPSO-1, and a description of how the emission values are calculated is given in this section. There are two types of emissions to air which are covered in the thesis, CO2 and NOx emissions. CO2 emissions are considered important as there is in the public a rising concern about emissions of greenhouse gases to the atmosphere.
1.2.1 NOx emissions NOx emissions are nitrous oxides, which are formed when a nitrogen atom reacts with one or more oxygen atoms in high temperature zones in the combustion chamber. Nitrogen is at ambient temperatures an inert gas which does not take part in the reactions in the combustion chamber. However, in gas turbines the temperature is in some parts of the combustion chamber is higher than the limit for when nitrogen starts to react with oxygen. Measures for reduction of NOx emissions exist and vary to some extent from different gas turbine manufacturers. Two designs of gas turbines commonly used in the industry are the Single Annular Combustion (SAC) and the Dry Low Emission (DLE) combustion systems. These two designs of combustion systems are different with respect to the degree of NOx reducing measures incorporated in the design. The combustion chamber in a DLE-turbine is built on other principles than the combustion chamber of a SAC-turbine, and varies to some extent between turbine manufacturers [4]. The DLE combustion chambers are generally larger, and use more nozzles for feeding of the fuel to the chamber. Based on the report from the Norwegian Petroleum Directorate [4], SAC-turbines have been measured to emit 200ppm NOx, and the DLE-turbines report capabilities of operating with a NOx-emission of 25ppm. These figures for NOx-emissions are used in the thesis for calculating the NOx-emissions from the gas turbines, configured with and without NOx-reducing measures. The figures for NOx-emissions are given in ppm, a unit which relates to the flow rate of the exhaust gas from the gas turbine. Ppm is an abbreviation for parts per million and the conversion between ppm and a flow rate in m3/h is described.
Stud.techn Lars Petter Revheim 4
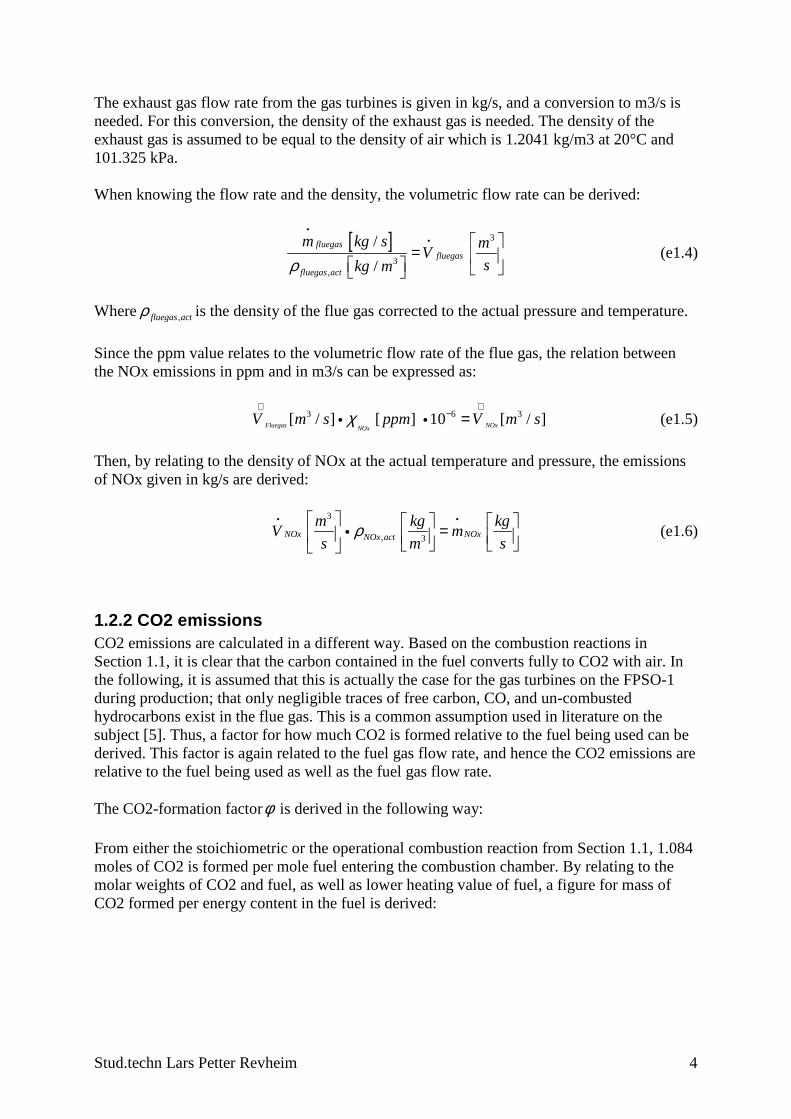
The exhaust gas flow rate from the gas turbines is given in kg/s, and a conversion to m3/s is needed. For this conversion, the density of the exhaust gas is needed. The density of the exhaust gas is assumed to be equal to the density of air which is 1.2041 kg/m3 at 20°C and 101.325 kPa. When knowing the flow rate and the density, the volumetric flow rate can be derived:
[ ] 3
3,
/
/
fluegasfluegas
fluegas act
m kg s mV
skg mρ
=
i
i
(e1.4)
Where ,fluegas actρ is the density of the flue gas corrected to the actual pressure and temperature.
Since the ppm value relates to the volumetric flow rate of the flue gas, the relation between the NOx emissions in ppm and in m3/s can be expressed as:
3 6 3 [ / ] [ ] 10 [ / ]Fluegas NOxNOxV m s ppm V m sχ
⋅ ⋅− =i i (e1.5)
Then, by relating to the density of NOx at the actual temperature and pressure, the emissions of NOx given in kg/s are derived:
3
, 3NOx NOxNOx act
m kg kgV m
s m sρ =
i i
i (e1.6)
1.2.2 CO2 emissions CO2 emissions are calculated in a different way. Based on the combustion reactions in Section 1.1, it is clear that the carbon contained in the fuel converts fully to CO2 with air. In the following, it is assumed that this is actually the case for the gas turbines on the FPSO-1 during production; that only negligible traces of free carbon, CO, and un-combusted hydrocarbons exist in the flue gas. This is a common assumption used in literature on the subject [5]. Thus, a factor for how much CO2 is formed relative to the fuel being used can be derived. This factor is again related to the fuel gas flow rate, and hence the CO2 emissions are relative to the fuel being used as well as the fuel gas flow rate. The CO2-formation factorφ is derived in the following way: From either the stoichiometric or the operational combustion reaction from Section 1.1, 1.084 moles of CO2 is formed per mole fuel entering the combustion chamber. By relating to the molar weights of CO2 and fuel, as well as lower heating value of fuel, a figure for mass of CO2 formed per energy content in the fuel is derived:
Stud.techn Lars Petter Revheim 5
2
2 2 2
441
1.084 0.208611.2420.35
CO
CO CO CO
fuelfuel fuel
fuelfuel
kg
kmole kmole kg
kg kWhkmole kWhkgkmole
φ = =i i (e1.7)
where the lower heating value of the fuel is expressed as 11.24 kWh/kg, which relates to the traditional unit for mass lower heating value (kJ/kg) in the following way:
40450
11.24 11.243600
kJkJ h kWhkg
s s kg kgh
= = (e1.8)
Formation of CO2 (given the assumption of full conversion of carbon in the fuel to CO2) is thus a function of the carbon content in the fuel (through the combustion reaction), molar weight of the fuel, and the energy content in the fuel. Once the flow rate of air is above what is required for stoichiometric combustion, the flow rate of air does not influence the formation of CO2.
1.3 Fuel gas consumption gas turbines During operation of the FPSO-1 it is likely that the total power consumption of the FPSO-1 will vary to some extent. The gas turbines are connected to control systems monitoring the power load at all times, and the control systems regulate the speed of the turbine rotor, thereby regulating the necessary flow of fuel to the gas turbine. Factors determining the fuel gas consumption of the gas turbine are ambient temperature, efficiency of the turbine, rotor speed and the lower heating value of the fuel gas. Figure 1.1 illustrates how these factors are related, and the fuel gas consumption is related to the given LHV and the output (on the y-axis). This diagram is for a Siemens SGT-700 gas turbine, and shows the nominal output and efficiency versus the speed of the Free Power Turbine [6]. The nominal speed of the turbine is 6500 rpm. In the diagram, lines for the ambient temperature are shown. Given an ambient temperature (30°C for the FPSO-1 project [7]) and the nominal speed for the turbine one can find the efficiency and the output in MW from the turbine (illustrated by the red arrows). The relation to fuel gas consumption is as mentioned, the lower heating value of the fuel gas, and the efficiency of the gas turbine at the operating conditions. At the nominal speed of 6500 rpm, the ambient temperature of 30°C, the turbine is operating with an efficiency of 36%. Thereby, the theoretical fuel gas consumption of the gas turbine, relative to the given lower heating value in kJ/kg, can be found:
Stud.techn Lars Petter Revheim 6
,Turbine output [ ]
LHV fuel gas fuel theoretical
kW kgm
skJ
kg
=
i
(e1.9)
When the figure for the theoretical fuel gas consumption is known, the real fuel gas flow rate can be found by relating to the efficiency of the gas turbine:
,theoretical
fuel real
gasturbine
mm
η=
i
i
(e1.10)
Figure 1.1 Nominal output and efficiency vs. turbine rotor speed Siemens SGT-700 [6]
Stud.techn Lars Petter Revheim 7
By using the Diagram in Figure 1.1, fuel consumption for the gas turbine can be found under different operating conditions, a reduction in power load on the FPSO-1 would result in a reduction of the output from each gas turbine, a new operating point (turbine speed and efficiency (blue lines in Figure 1.1)) can be found in the diagram, and a new fuel gas consumption can be calculated based on the new efficiency. For simplicity and because no vendor is chosen for the gas turbines, a fuel efficiency of 36% is assumed and used in calculations for fuel gas consumption and CO2 emissions in this thesis.
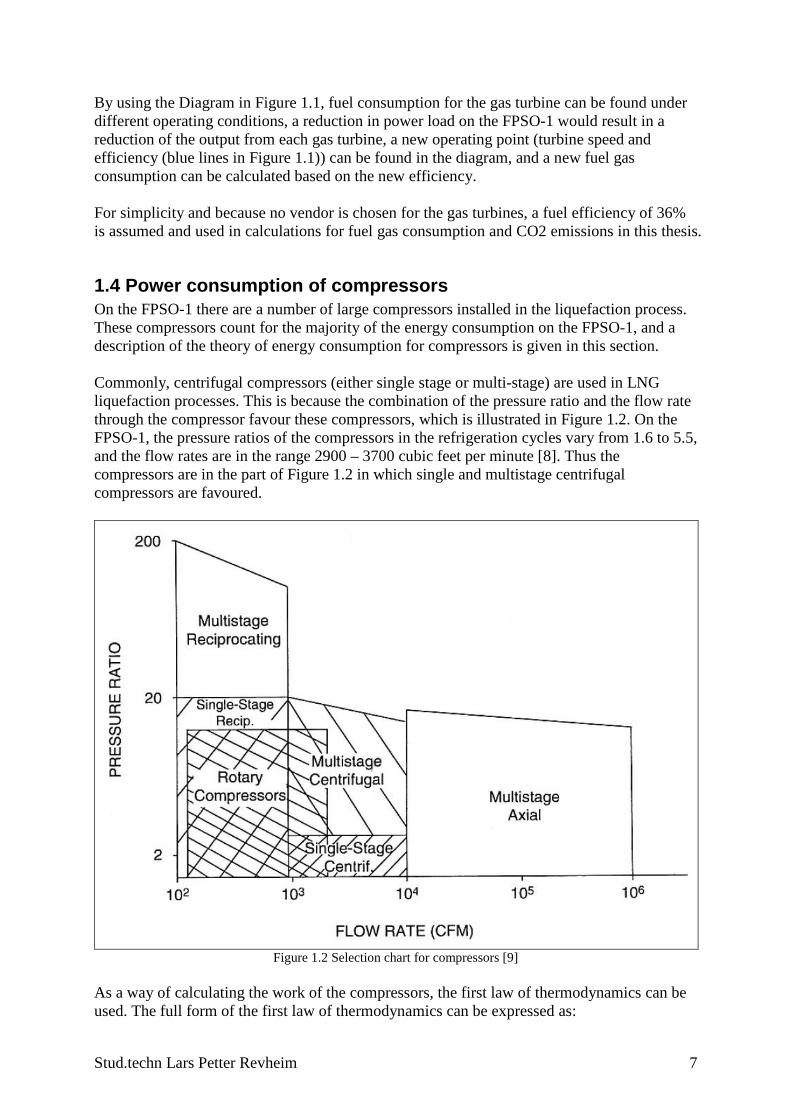
1.4 Power consumption of compressors On the FPSO-1 there are a number of large compressors installed in the liquefaction process. These compressors count for the majority of the energy consumption on the FPSO-1, and a description of the theory of energy consumption for compressors is given in this section. Commonly, centrifugal compressors (either single stage or multi-stage) are used in LNG liquefaction processes. This is because the combination of the pressure ratio and the flow rate through the compressor favour these compressors, which is illustrated in Figure 1.2. On the FPSO-1, the pressure ratios of the compressors in the refrigeration cycles vary from 1.6 to 5.5, and the flow rates are in the range 2900 – 3700 cubic feet per minute [8]. Thus the compressors are in the part of Figure 1.2 in which single and multistage centrifugal compressors are favoured.
Figure 1.2 Selection chart for compressors [9]
As a way of calculating the work of the compressors, the first law of thermodynamics can be used. The full form of the first law of thermodynamics can be expressed as:
Stud.techn Lars Petter Revheim 8
( ) ( )2 21/ 2 1/ 2outìn out in in outin out in out
dEQ W m h u gz m h u gz
dt= − + + + − + +∑ ∑ ∑ ∑
i i i i
(e1.11)
When discussing a compressor, the system over which the first law of thermodynamics is applied consists of one inlet and one outlet, therefore the summation signs cancel. Further by assuming the compressor is operating at steady state conditions and assuming negligible heat loss and contribution of potential and kinetic energy changes, the first law is reduced to:
dE
dt ìnin
Q= ∑i
21/ 2out inout in
W m h u− + +∑ ∑i i
gz+( ) 21/ 2outin out
m h u− +∑i
gz+( )out
This gives: ( )2 1 [W]W m h h= −i i
. Further, if the suction and discharge states of the fluid is
known (pressure and temperature), the actual work can be calculated, for instance by use of a software which can produce log-p h diagrams for the relevant fluids. CoolPack is one such program, and can produce log-p h diagrams with pressure and enthalpy ranges defined by the user. Figure 1.3 shows a log-p h diagram for methane, with a line drawn between suction and discharge states for the inlet compressor on one of the liquefaction trains.
Figure 1.3 Log p-h diagram methane [10]
By using the first law of thermodynamics, and the actual conditions of the gas at suction and discharge, the efficiency of the compressor is incorporated in the calculations. The efficiency of large centrifugal compressors with a given flow rate is a function of the pressure ratio over the compressor and typically rises from zero to its highest value at an optimal operating point defined by the flow rate and pressure ratio, before it decreases when the pressure ratio increases further. In the thesis, the simulation program HYSYS is used for obtaining values for the compressors’ energy consumption. The theory described in this section is still valid for the calculation performed by HYSYS.
Stud.techn Lars Petter Revheim 9
2 Offshore LNG liquefaction processes Although LNG production has been carried out over nearly fifty years, and thus the technology can be described as well proven, an LNG production facility on a floating structure has not yet been constructed. The concept of floating LNG is however not new, major oil and gas companies developed plans during mid to late 1990’s, but large scale land-based plants took much attention because of the economy of scale principle. In parallel during this period, the oil industry continued development of FPSOs for remote oil fields, taking advantage of improvements in riser technology and offshore oil transfer. Many of the technological improvements in the oil and gas industry can be applied to floating LNG projects, making these projects interesting now [11]. The LNG liquefaction process is actually a quite simple process, in that it in essence consists of one warm natural gas stream which is to be cooled. There are several methods for carrying out this cooling, and an absolute necessity of the process is that heat has to be transferred from the natural gas stream over a wide temperature gap. This implies exchange of heat with one or more other process streams, and essentially, this is where the differences are in liquefaction processes in use in the industry today. The main challenges of moving the liquefaction process offshore from a technical point of view is, naturally, the limited available space and the impacts from movement on the process equipment as well as safe operation of the process. On the basis of these challenges, some LNG liquefaction processes are better suited for offshore operation than others, and the following issues need to be given special care:
• Equipment count for the entire process • Amount of liquid hydrocarbon storage (safety) • Time of start-up (and shut-down) • Sensitivity to motion • Robustness with respect to change of feed gas composition • Necessary area for the process (footprint) • Thermal efficiency • Availability of the process
Liquefaction processes can be divided into different types as shown in Figure 2.1. The figure differentiates between number of refrigeration cycles and type of refrigerant used, and lists some industrial liquefaction processes by type.
Figure 2.1 LNG liquefaction processes divided by type The number of refrigeration cycles has great impact on the complexity of the process as more refrigeration cycles require more equipment to be installed (compressors, coolers, etc.). The choice of single component or mixed type refrigerant leads to the choice of heat transfer by latent heat of vaporization or by sensible heat, two different types of heat transfer with different characteristics. The two types of heat transfer are described in [12]. The purpose of using mixed refrigerants is the fact that different components have different evaporating temperatures, and thus the refrigerants evaporate at gliding temperatures, making a close temperature difference between the refrigerant and the natural gas possible over the entire temperature span of the liquefaction process. Close match between the refrigerant and the natural gas which is being cooled and liquefied, is desirable with respect to necessary work input to the liquefaction process. Another feature with evaporating refrigerants (mixed as well as single component types) is that the heat transfer rate during evaporation is much larger than when two adjacent fluids exchange heat through sensible heat. Figure 2.2 is a principle drawing of temperature profiles for natural gas being cooled (red) and refrigerants being heated (blue) for two different cases, one where mixed refrigerants are used (left) and one where single refrigerants not going through phase transition are used (right).
10°C10°C
- 160°C
10°C
- 160°C
T [°C]
Heat transferred [kW]
T [°C]
A B
Figure 2.2 Temperature profiles of refrigerant and natural gas during liquefaction
Stud.techn Lars Petter Revheim 11
The areas A and B in the figure represent the theoretical work necessary for each principal liquefaction process, and the area describing the necessary work input will always be smallest when the temperature curves are closely matched. Maintaining a small temperature difference in the LNG heat exchanger is increasingly important in the low temperature part of the heat exchanger, which explains the slopes of the temperature curves of the refrigerant in the right part of Figure 2.2. The extra power input needed to compensate for heat transfer across a constant temperature difference grows more than exponentially as the temperature level is reduced [13]. Heat transfer by latent heat of vaporization requires that the refrigerant undergoes a change in phase from liquid to gaseous phase; therefore there is a need for storage of liquid refrigerants, which consist of mainly hydrocarbons. This is a safety risk as a leakage of liquid hydrocarbons will lead to a significant risk of fire or explosion. Heat transfer by sensible heat only requires that the cold process stream has a lower temperature than the hot stream over the entire temperature span. The refrigerant may be in liquid or gaseous phase, but is not going through a phase transition. For offshore LNG liquefaction processes, a favourable feature would be gaseous refrigerant(s) since a gas is less likely to dispose unevenly in the heat exchangers because of hull movements. Use of gaseous refrigerants would lead to the principle of sensible heat being used for heat transfer. Some liquefaction processes are more suitable for offshore use than others, and a description of three such processes is given in the following. The three processes are the Shell Dual Mixed Refrigerant process, the NicheLNG process and a novel process for LNG liquefaction by using liquid nitrogen and liquid CO2, which is called the Liquefied Energy Chain (LEC).
Stud.techn Lars Petter Revheim 12
2.1 Shell Dual Mixed Refrigerant (DMR) liquefaction process This is a process which has been developed by Shell, originally for land based LNG liquefaction projects, but also for use on floaters for production of relatively large quantities of LNG. The process was considered for the Sunrise project, which was a project developing a floating LNG facility capable of producing 5 MMTPA (million tonnes per year1) placed in the Timor Sea [14]. The liquefaction process uses two refrigeration cycles, both with mixed refrigerants [9]. Thus both refrigeration cycles utilise latent heat of vaporization for heat transfer, and thereby benefit from the close matching of the temperature curves as shown in Figure 2.2. A principle flow sheet of the process is shown in Figure 2.3.
Figure 2.3 Representation of the Shell Dual Mixed Refrigerant liquefaction process [15]
Figure 2.3 is not particularly detailed, but illustrates a process using mixed refrigerants in both refrigeration cycles; the pre-cooling and the liquefaction cycle. The process uses spiral wound heat exchangers, which are more sensitive to motions than heat exchangers where the fluids are in gaseous phase. The motion sensitivity of this heat exchanger is a result of the tendency of liquid to dispose unevenly when the large heat exchanger is moving. It is important for the operation that the same amount of heat transfer takes place in each zone in the heat exchanger; therefore it is desirable to limit the movement of these large units as much as possible. ________________ 1 MMTPA = Mille Mille Tonnes Per Annum = 1000*1000 tonnes per year.
Stud.techn Lars Petter Revheim 13
The liquefaction plant was to be placed on a large barge about (400 x 70 m), built in concrete. This size of the barge would lead to relatively small motions compared to those of many oil FPSOs, and this may eliminate the potential problems with the liquid-filled spiral wound heat exchangers. The environmental conditions on the production site will also influence the motions of the barge a great deal [16], and a location where the sea states are benign and the wind conditions calm will also be beneficial with respect to utilisation of equipment units sensitive to motions. This process is quite similar to land based liquefaction processes in design, and even though the equipment units need to be suited for a marine environment, the efficiency and production rate of the liquefaction process is comparable to land based processes. The efficiency of the process is in the range of about 12 – 13 kW/ton_LNG/day (0.29 – 0.31 kWh/kg_LNG) [17] [18]. Shell’s solution for the Sunrise project was not completed as the field partners preferred a land based solution [8]. However, the DMR technology will probably still be an option when Shell develops new offshore LNG liquefaction projects.
2.2 NicheLNG liquefaction process The NicheLNG liquefaction process is designed for production rates of about 1.5 to 3 MMTPA and is therefore relevant for slightly different projects than for instance the DMR process [19]. The process uses gaseous refrigerants, one cycle which is tapped off from the main gas stream and one cycle using nitrogen as refrigerant. The use of gaseous refrigerants means sensible heat is the principle which drives the heat transfer, and thus no phase change in the refrigerants is necessary. This again makes the process more robust with respect to handling hull movements, since gases are not as sensible to movements as liquids, with respect to even disposal of heat transfer fluids in the heat exchangers. The efficiency of this process is not as good as fine tuned dual-cycle mixed refrigerant processes, because of the simpler design of the process. The design with single component refrigerants not going through phase change, makes matching of the composite curves for the natural gas and the refrigerants more difficult than if mixed refrigerants going through phase change were used. In that case the liquefaction process would utilise the better heat transfer rate with latent heat of vaporisation. During liquefaction, the temperature curves (refer to Figure 2.2) have generally larger temperature differences, compared to mixed refrigerant processes, which again requires a larger amount of work to be put into the process. The efficiency of the process is about of 16.5 kW/ton/day_LNG (0.40 kWh/kg_LNG) [17]. The higher specific energy consumption also means that this process has somewhat higher relative emission figures. If only the efficiency of the process were the decision driver for selecting offshore LNG liquefaction process, the NicheLNG process would probably not be the preferred choice. This process does however have the advantages of lower equipment count, non-flammable refrigerant (nitrogen cycle), shorter start-up time and smaller footprint, which are reasons why this process is well suited for offshore applications.
Stud.techn Lars Petter Revheim 14
Figure 2.4 the NicheLNG liquefaction process [19] Figure 2.4 shows a process flow diagram of the NicheLNG liquefaction process. The process uses one Brazed Aluminium Heat Exchanger for the liquefaction of natural gas. The two refrigeration cycles are shown, nitrogen which is closed and methane which is open. The process has received an approval in principle (AIP) from the American Bureau of Shipping (ABS), which is a major classification society similar to DNV, but has not yet been built for offshore applications.
2.3 The Liquefied Energy Chain (LEC) The liquefied energy chain describes a transport chain for gas from an offshore gas field which is used for power production with CO2 capture and storage, and thus the LEC requires the LNG liquefaction project to be extended to an entire value chain for natural gas and CO2. This may not be relevant for the FPSO-1 project, but is included in the master thesis as a new business development opportunity. The process starts at an offshore location where natural gas is liquefied by the cold exergy contained in an LNG vessel, which contains liquid nitrogen (LIN) and liquid CO2 (LCO2). After heat exchange with the natural gas, the nitrogen is vented to the atmosphere. The CO2 is transferred at high pressure to a nearby oil reservoir for use in a process for enhanced oil recovery. The CO2 is pumped into the oil reservoir as a way of keeping up the pressure, making oil extraction easier. Enhanced oil recovery is often performed by pumping natural gas into the oil reservoir, and it is envisaged in the Liquefied Energy Chain that the natural gas is liquefied and sold instead. By monetizing the natural gas which otherwise would have been re-injected in the reservoir, the LEC helps utilise so-called stranded gas.
Stud.techn Lars Petter Revheim 15
The LNG is transported to shore where the cold exergy is used for liquefying CO2 and nitrogen, the CO2 being supplied from a natural gas fired power plant with CO2-capture. The natural gas fired power plant may either be a conventional power plant where the reactants are natural gas and air, or it may be an oxyfuel power plant where the reactants are oxygen and air. The nitrogen to be liquefied may be supplied by an air separation unit, which feeds the oxyfuel power plant with oxygen [20]. If the natural gas fired power plant is conventional, the nitrogen must be supplied from another source than the air separation unit (which is needed in an oxyfuel power plant, regardless if the nitrogen is utilised or not). The offshore process is in a given configuration self-supported with power and hot and cold utilities, which will simplify the offshore liquefaction process a great deal since the power producing units can be avoided. The configuration does however set some assumptions, e.g. that the natural gas is delivered to the liquefaction process treated and at 70 bar [20]. These assumptions mean that the process could need external power in other configurations, but the overall power need for the process would be smaller than for conventional liquefaction processes because of the utilisation of the cold exergy in the arriving vessels.
Figure 2.5 The Liquefied Energy Chain [20]
This value chain also needs CO2 emissions to be priced at a level which makes storage of CO2 economically feasible. If that is the case, the LEC may be a profitable way of handling CO2 storage, because of the utilisation of the otherwise empty LNG carriers on the return voyage to the gas field, and because of utilisation of cold exergy for liquefaction of natural gas. A serious challenge related to completing the liquefied energy chain is the high degree of interaction between the different parts of the chain. A successful completion of an LEC project depends on an available gas field offshore, specialised ships being built, as well as an available power plant and an air separation unit onshore. This will require a great deal of commitment from the different actors in the chain, especially if the entire chain is to be built simultaneously.
Stud.techn Lars Petter Revheim 16
3 Höegh LNG FPSO-1 as designed Höegh LNG develops floating solutions for the LNG value chain. The first element in this chain is a floating LNG production facility. Given the nature of the production plant, i.e. the fact that it is placed on a floating structure, several challenges and practical restrictions will apply to an FPSO for LNG production. For instance, the limited space available on floating structures directly influences the maximum storage and production capacity of LNG. The Höegh FPSO for LNG production (referred to as FPSO-1) is being designed for a production capacity of 1.6 MMTPA, or 4600 ton/d [21]. The FPSO-1 project team finished the FEED phase (Front End Engineering Design) in March 2009, and this master thesis takes the design of FPSO-1 as presented at the end of the FEED phase as a point of departure. More detailed design will be carried out in the next phase of the project. The following section describes the processes onboard the FPSO-1, from the inlet of the main gas stream to the storage of LNG, LPG and condensate. The gas treating processes required for producing LNG and separating LPG and condensate are located on the deck of the FPSO, and are described as the topsides of the vessel.
3.1 Topsides – from turret to offloading The FPSO-1 has a number of different systems installed to treat the natural gas before liquefaction, storage and offloading, shown in Figure 3.1. The figure describes the systems on deck of the FPSO-1 as well as the storage facilities. The main flows are also shown. The systems in Figure 3.1 as well as power generation and utility systems are given a thorough description in the following 5 Sections (3.1.1 to 3.1.5).
Slug catcher/Inlet system
Acid gas removal
LPGStorage
LNG Storage
LiquefactionTrain 1
Hg Removal
DehydrationLiquefaction
Train 2
CondensateStorage
NGL Extraction
CO2 H2O Hg
AminRegen.
Fuel Gas
Figure 3.1 Topside processes on HLNG FPSO-1
Stud.techn Lars Petter Revheim 17
3.1.1 Gas treating, and fractionation of LPG and co ndensate The well stream of gas, condensate and water enters the FPSO-1 through an internal disconnect able turret. It is foreseen that the well stream has a pressure of 70 bar and a temperature of 24°C (the same as the cooling water temperature) when entering the turret. After the turret, the well stream is routed to a slug catcher which holds liquid slugs and separates liquid from gas. The slug catcher is designed as two vessels on top of each other with an open connection. The top vessel will separate the liquid from the gas, while the bottom vessel, which is filled with liquid, is a plate separator separating condensate and water. The main gas stream from the slug catcher is routed to an inlet filter coalescer which removes the last traces of free liquids in the main gas stream, and then to CO2 removal. The condensate from the slug catcher is heated and depressurized to flash off gas, before the condensate is stabilized, cooled and routed to the condensate storage tank [3, page 9]. The overhead gas streams from the condensate flash vessel and the condensate stabilizer are compressed and added to the main gas stream from the slug catcher. CO2 needs to be removed from the main gas stream as it will freeze out on the cold surfaces of the heat exchanger and thereby cause clogging, and this is handled in an amine contactor. Lean amine enters the top of the contactor, and rich amine in which the CO2 is bound leaves the contactor at the bottom. Rich amine is sent to the amine regeneration system. The cleaned gas from the amine contactor enters a water wash tower and then a dehydrator filter coalescer to reduce entrainment of amine. The bottom product of the water wash tower and the dehydrator filter coalescer contains some amine; these streams will be sent to the amine regenerator system, as will the rich amine from the amine contactor. The main gas stream, now satisfying CO2 specifications, enters two molecular sieves which reduce the water content of the gas to the amount which is allowed for liquefaction. After the molecular sieves, the gas enters a mercury guard bed, which removes any traces of mercury. Mercury reacts violently with aluminium, from which the liquefaction heat exchangers are fabricated, and thus needs to be removed. Only 0.01 microgram/normal cubic meter is allowed of mercury traces in the gas before entering the liquefaction process [3, page10]. After the mercury guard bed, the gas is routed to the NGL separation system. Some hydrocarbon components need to be separated from the main gas stream to satisfy the requirements of heating value of the LNG. This value may vary, for the FPSO-1 project the LNG is specified such that the lower heating value (LHV) shall not exceed 1070 btu/scf (gas for the American market). Separation of these components (propane and heavier hydrocarbons) takes place in a cryogenic turbo-expander process which produces lean LNG with a LHV below the specified value. The LHV decreases as propane and heavy hydrocarbons are removed from the gas. The cryogenic turbo-expander process utilises the fact that a gas going through expansion significantly reduces its temperature, and thereby will bleed off heavy hydrocarbons as necessary for reaching the higher heating value specification. The main gas stream prior to NGL extraction has a temperature of 38°C and a pressure of 66 bar. In the NGL extraction unit the turbo-expander reduces the pressure to 22 bar giving a temperature of -65.5°C. At this point the heavy hydrocarbons separate from the main gas stream. The turbo-expander is
Stud.techn Lars Petter Revheim 18
directly coupled to a compressor retrieving some of the mechanical energy produced in the expander. Downstream the directly coupled compressor, the temperature is 44°C and the pressure is 30 bar. Thus, the NGL extraction system leads to a reduction in pressure from 66 bar to 30 bar. This reduction in pressure will have to be made up for by compression at the inlet of the liquefaction process, as this process operates at 74 bar in the current design. The consequences of the pressure dip at the NGL extraction is discussed in the Section “FPSO-1 Improvement Potential.” The NGL extraction system is today designed for a generic feed gas composition. The actual feed gas composition may differ a great deal from the generic; therefore a possibility is identified for simplifying the NGL extraction system, which is quite complicated in the current design due to the wish to be able to handle a relatively wide range of feed gas compositions. This is also described in the Section “FPSO-1 Improvement Potential.”
3.1.2 LNG Liquefaction Lean gas from the NGL separation system is routed to the LNG liquefaction process. Two identical trains of Randall’s patented NicheLNG dual-expander process cool and liquefy the gas. This process is characterized by the use of gaseous refrigerants, and the use of expanders for acquiring the cooling duty. The lean gas from the NGL extraction is liquefied at 74 bar. The process uses two refrigeration cycles, one with methane as refrigerant and one with nitrogen. The methane is taken from the main gas stream, de-pressurized in an expander (thereby cooled), and sent through the main LNG heat exchanger for cooling the main gas stream to - 80°C. A nitrogen refrigeration cycle provides further cooling of the main gas stream to - 160°C. For a more detailed description of the thermodynamics of the LNG liquefaction process, see the theory section and [12]. The liquefied natural gas enters an LNG receiver, where some gas flashes off and is utilised as fuel gas for the gas turbines. The LNG flows by gravity to the LNG storage tanks. The NicheLNG dual-expander process has a very good inherent safety and a reasonably good efficiency, which were two reasons for selecting this process for liquefaction. The process is considered to be safer than for example the propane pre-cooled mixed refrigerant process because of the inflammable refrigerant nitrogen used in the process. The use of nitrogen means that there is no liquid hydrocarbon storage for refrigeration, which eliminates the risk of leakage of liquid hydrocarbons in the liquefaction process area. A leakage of liquid hydrocarbons, such as propane, would cause a severe risk of a fire or an explosion.
3.1.3 Power generation The FPSO-1 is equipped with seven gas turbines, of which six are providing all the necessary power for the topsides processes and the hull and one is in spare. The gas turbines are of aero derivative type and are coupled to electric generators, which in turn distribute the power to the topsides processes and the hull. The turbines are placed together as a separate module on the deck of the FPSO-1. Three of the turbines are connected to waste heat recovery units, of which one is in spare at all times. The overall electric power consumption on the FPSO-1 is calculated to be 157.1 MW under normal operating conditions [22]. At this stage of the project (the end of FEED) no vendor is selected for delivery of gas turbines, and therefore a choice has to be made for which gas
Stud.techn Lars Petter Revheim 19
turbines the calculations in this thesis are based on. The Siemens SGT-700 gas turbine is considered plausible for calculations performed in this thesis. This gas turbine has an average power output of 29 MW [23].
3.1.4 Utility systems Utility systems are systems which contribute to the overall performance of a process. Usually in thermal processes, cooling water and steam are considered the two most important utility systems. There are several places in the process where cooling water is needed. Cooling water is used to reject surplus heat in a process stream, when this stream needs to have its temperature reduced. The cooling water system is a utility system, since it is helping the main system (e.g. the liquefaction process) to perform according to design. The cooling water system on the FPSO-1 consists of two separate cooling water cycles; one is closed and uses oxygen free water as cooling media, the other is open and uses sea water as cooling media. The sea water dumps the heat taken up in the closed cycle to the sea. Steam at two pressure levels (medium and low pressure) as well as hot water is produced in the waste heat recovery units connected to the gas turbines. Medium pressure steam is used in the reboilers of the fractionator separating LPG and condensate, and the stabilizer stabilising the condensate coming from the slug catcher. Low pressure steam is used in the reboilers of the amine regenerator and in the “deethanizer” separating ethane and heavier hydrocarbons from methane, and hot water is used in a regeneration gas heater and a fuel gas make-up pre-heater.
3.1.5 Storage and offloading LNG is stored in the ships hull in tanks either of GTT No. 96-type or SPB-type tanks depending on which ship yard will be chosen for construction of the FPSO-1. Both tank types have flat tops, making the selection of these types of tanks over spherical Moss tanks obvious for an FPSO, where the deck area above the tanks is utilised for process equipment. A total of ten tanks are installed, eight for LNG, one for LPG and one for condensate. The majority of the storage volume is dedicated to LNG, 190 000 m3. LPG and condensate have storage volumes of 16 000m3 and 14 000m3, respectively. Offloading of LNG and LPG is carried out in side by side operations using flexible loading arms designed for cryogenic fluids. Condensate is offloaded in tandem operations by use of a floating hose, similar to offloading from oil-FPSOs.
3.2 Design- and Operation philosophy During the different phases in the project’s lifetime, from concept study to commissioning and operation, some philosophies are used as basis for the project’s way forward. The design of the FPSO-1 is carried out according to some company specific guidelines, which make up the design philosophy for the project. In the same way, when the FPSO-1 is on site and producing, the operation of the vessel is carried out according to the operation and maintenance philosophy of the company.
Stud.techn Lars Petter Revheim 20
In these philosophies issues such as the lifetime of the project (units need to be designed to last the entire lifetime), rotation of the crew, and implementation of emission reducing measures where this is possible are addressed. The design philosophy and the operation and maintenance philosophy are to an extent project specific, but are based on policies stated by the company. The environmental issues related to Höegh LNG’s vessels are managed by Höegh Fleet Services (HFS), which is responsible for the environmental policy of the company. In the HFS environmental policy it is stated that the company’s aspirational goal is “zero harm to people and the environment” and that the company seeks to “minimize and, where possible, eliminate our environmental impacts over time [24].” Further, the company states that “we take active measures seeking new technology and methods to reach beyond the requirements.” (International and national legislation and guidelines) [24] The environmental management system of Höegh Fleet Services is certified to the environmental standard ISO 14001. The environmental policy represents the organisation’s awareness that the operation of the vessels impacts the environment. When emerging to a new segment of the LNG market, the impact on the environment from Höegh LNG’s fleet will most probably increase, due to more vessels in operation and the particulars of the new vessels being built. The FPSO-1 is a vessel which will impact the environment in a substantially different way than a traditional LNG carrier. The HFS environmental policy may directly influence Höegh LNG’s operation philosophy for the FPSO-1, and impose restrictions on certain operating modes which for instance will require flaring. It is important to be aware of the consequences that will follow as a result of a certain design or operation and maintenance philosophy, and this is discussed with respect to flaring in the following section.
3.2.1 Flaring – safety and availability Flaring of natural gas is necessary in processes with hydrocarbons and acts as a safety measure when one or more parts of a process containing hydrocarbons are not functioning satisfactorily. When this is the case, the stream of hydrocarbons which can not be handled by the process is routed to the flare tower where the hydrocarbons are combusted. For natural gas processes, flaring eliminates the risk of pressure build-up in the process piping with risk of rupture of piping and leakage of explosive and flammable gases. Venting the gas to the atmosphere is not a desirable solution, since the gas in question is flammable, and causes more harm to people and the environment than the combustion gases from the flare. Flaring causes large amounts of emissions of CO2, NOx, and particles to the atmosphere and is becoming an increasing headache for oil and gas companies striving to impact the environment as little as possible. On the basis of the wish to minimize the company’s environmental impact, which is stated in the HFS environmental policy, Höegh LNG seeks to limit the amount of flaring on the FPSO-1. However, some flaring cannot be avoided, and the issue of limiting flaring is closely linked to the different operating modes of the vessel.
Stud.techn Lars Petter Revheim 21
In the Operation and Maintenance Philosophy issued for the front end engineering design phase, different operating modes are described [25]. Normal operating modes are defined as:
• Steady state production • Simultaneous production and offloading
It is further stated in the O&M Philosophy that: “The main objective of the production function is to utilize available systems for optimal production … while maintaining an acceptable safety level and causing minimal environmental impairment.” Also, it says that: “Offloading shall not interfere with production or require flaring.”[25] The two operating scenarios described are thus the only scenarios where flaring is restricted, based on Höegh’s O&M Philosophy for the FPSO-1. Steady state production describes the processes on the FPSO-1 running under conditions which result in LNG which meets the specifications being produced. These two operating scenarios are likely to be the dominating operating scenarios, which again should imply that most of the time the flare on the FPSO-1 should not be in operation. There are a number of other operating scenarios which will require flaring to some extent. In the event of failure of equipment which is non-critical for LNG production, one is given a choice of bypassing the equipment by flaring, or shutting down the gas stream. Equipment which is non-critical for LNG production and can be bypassed by flaring is for example selected equipment in the amine regeneration system (amine flash scrubbers and coolers). Shutting down the gas stream to the equipment unit which fails may include shutting down the entire topside process on the FPSO, because there is no alternative to flaring when there is a need for disposing of a part of the gas stream which no longer can be handled by its dedicated equipment. By shutting down the entire topside process on the FPSO-1, the environmental impact from the facilities will possibly be more severe than if flaring is allowed in certain cases. When shutting down cryogenic processes, the temperature in the cold units rise quickly and there is a limited time gap for when the processes can be started again without going through an extensive start-up procedure. During the start-up procedure, flaring is un-avoidable, and the start-up procedure may be longer than the time of flaring. Moreover, the flow rate of flared gas is most probably larger during a start-up of the entire topside process, than during flaring when selected equipment fails. Flaring when non-critical equipment fails will also increase the availability of the FPSO-1, because the LNG production is still running. This will result in a larger produced volume of LNG per year compared to if no flaring is allowed, and the liquefaction process has to be shut down more frequently. It is worth noting that a client for the project may want other guidelines to be followed with respect to flaring and environmental impact in general. Also the legislation of the area where the FPSO-1 will be situated will have to be taken into account when determining the final operation (and flaring) philosophy.
Stud.techn Lars Petter Revheim 22
3.3 Consequences of the design at end of FEED In this section some findings from the design at the end of the FEED phase are looked into. These are findings which are identified as having a possibility of improving the energy efficiency or the environmental impact for the FPSO-1, if the findings result in a change in design at a later stage of the project. This section discusses the consequences of continuing the project with the design as it is at the end of the FEED stage. Later in the thesis, Section 4, certain improvement potentials are discussed. The findings discussed here are:
• The energy consumption and the energy efficiency • The emissions to air during normal production • The emissions to air resulting from flaring during the initial start-up of the FPSO-1 • The availability of the FPSO-1, and the resulting loss in LNG production • The design of the NGL extraction resulting in a pressure dip of the main gas stream • The use of a generic feed gas composition
At the end of this section, key figures for the FPSO-1 as it is designed today are presented.
3.3.1 Energy Consumption – efficiency The main process contributing to the energy consumption on the FPSO-1 is the liquefaction process. Within the liquefaction process, the compressors installed count for the largest energy consumption. The liquefaction process is described in Section 2 and [12], and is considered a good choice for offshore LNG production due to its reasonably good efficiency, low equipment count and its level of safety. The energy consumption is presented in three different ways.
• Specific Energy Consumption is a measure of how much energy it takes to produce one ton of LNG. This quantity may be compared to other LNG processes, given certain assumptions which are explained further below.
• Total Liquefaction Power is the total power required for running the liquefaction
process. This quantity is presented as it gives a feeling of how much of the Total FPSO Power Load is used by the liquefaction process.
• Total FPSO Power Load is the total power consumption of the FPSO during normal
production. This quantity is presented because of the connection between this number and the CO2 emissions to air from the FPSO-1.
The numbers for Specific Energy Consumption and Total Liquefaction Power are based on HYSYS simulations. The HYSYS files are originally developed by SINTEF as a verification of the liquefaction process, and have been modified to fit the design at the end of the FEED phase [8]. The figure for Total FPSO Power is based on an electric load summary from CB&I [22].
Stud.techn Lars Petter Revheim 23
Specific Energy Consumption [kW/tonLNG/day] 21.01 Total Liquefaction Power [MW] 99.4 Total FPSO Power Load [MW] 157.1
Table 3.1 “Energy consumption of FPSO-1 – as designed at end of FEED” The efficiency of the liquefaction process is described by the specific energy consumption. The well known C3-MR process used in many plants worldwide has a specific energy consumption of 12.2 kW/tonLNG/day [17]. It is obvious that the process chosen for the FPSO-1 is not as efficient as base-load LNG plants. However, the process is more efficient than other simple LNG liquefaction processes which could be considered for offshore use, such as a single nitrogen expander process which has a specific energy consumption of 40.5 kW/tonLNG/day [17]. When comparing efficiencies of different LNG liquefaction processes it is very important to be aware of the conditions under which the efficiencies are calculated. These conditions are however often company specific information which is unavailable to the public, making a direct benchmark between liquefaction processes a difficult task. The main characteristics for the different liquefaction processes may nevertheless be extracted and used as input for describing tendencies in differences in energy efficiency between different processes. On this basis, it is safe to say that large base-load LNG plants (the C3-MR process for instance) are more efficient than the NicheLNG process, which again is more efficient than single nitrogen expander processes. The figures for energy efficiency should only be used as guidelines when the full list of assumptions underlying the calculations is unknown. When looking at the figures for energy consumption presented in Table 3.1, they might not tell the reader much about the real magnitude of energy which is being used, and what amount of energy which is bound in the product from the FPSO-1. Therefore it is useful to relate these figures to other sources of energy consumption. The FPSO-1 has an installed LNG production capacity of 1.6 MMTPA (1.6 million tonnes LNG per year). The LNG has a mass lower heating value of 49.17 MJ/kg. By relating the production capacity of the FPSO-1 to the lower heating value of LNG, a figure for the total energy content (in Joule) in the LNG produced at the FPSO-1 during one year is obtained. The energy content in the LNG produced at the FPSO-1 as well as other selected figures for amounts of energy is presented in Figure 3.2.
Stud.techn Lars Petter Revheim 24
Selected amounts of energy
82,6162,6
235,9
813,7
0100200300400500600700800900
Net inland energycons. Norway, 2007
Energy cons. Oil andgas extraction, 2007
Energy cons. Privatehouseholds, 2007
Energy content in oneyear's production of
LNG from HLNGFPSO-1
[Pet
a (1
0^15
) Jo
ule]
Figure 3.2 Selected amounts of energy relative to energy content in LNG from HLNG FPSO-1
This figure shows that the energy content in the LNG from the FPSO-1 produced during one year corresponds to 10.2 % of the net energy use in Norway (2007 level). This is a substantial amount of energy, considered that it origins from a single process plant. The energy content in the LNG produced during one year from the FPSO-1 could cover 35% of the yearly amount of energy consumed related to oil and gas extraction in Norway. These amounts of energy are comparable since they both consist of chemical energy which is transformed when LNG and natural gas (for gas turbines on platforms in the North Sea) is combusted. The figure for energy consumption of private households in Norway is also included in the figure for illustration. This figure is however not directly linked to the energy content in the LNG from the FPSO-1, as the energy consumed in Norwegian households is almost only electrical energy. There are losses connected to transforming thermal energy to electrical energy, which would have to be accounted for if the LNG were to be used for electricity production. The main purpose of Figure 3.2 is to give an understanding of the magnitude of the energy produced as LNG during one year from the FPSO-1. The FPSO-1 is after all a relatively small LNG production plant, but the yearly energy content bound in the LNG still makes up for a recognisable amount of energy compared to the total energy consumption in Norway. This illustrates one of the most important features of LNG the 600-fold reduction in volume when natural gas is liquefied. A substantial amount of energy is bound in a small volume.
3.3.2 NOx Emissions – normal production As part of the environmental impact from the FPSO-1, emissions to air during normal operation have been calculated. Focus has been on CO2 emissions, as there is rising concern about the impact of this green-house gas on the environment, and because CO2 is the major type of emission resulting from combustion of natural gas in a gas turbine. The most important other type is NOx emissions. Particles and sulphur oxides are not considered to be present in the exhaust gas flow because of the fuel being used. It is important to note that this
Stud.techn Lars Petter Revheim 25
assumption requires gas-operation of the gas turbines. The gas turbines are capable of running on liquid fuel as well, but this is only considered to occur under start up of the gas turbines when no natural gas is available for fuel, and is not considered further in the thesis. There are not set any limits on emissions to air from the gas turbines at this stage of the project [26]. It is however stated in the technical description for the gas turbines that: “All gas turbines are to be equipped with Dry Low Emission combustion systems…”, and: ” Note:…Seller is requested to investigate how far the application of Single Annular Combustors design could be selected, and to inform Buyer about impacts regarding GT design and emission value effects.” The Dry Low Emission combustion system used on the Siemens SGT-700 gas turbine results in NOx emissions of 15 ppm [23], whereas normal emission levels of NOx from Single Annular Combustion systems are 200 ppm [4]. NOx emissions are calculated by the given numbers in parts per million (ppm) for Dry Low Emission and Single Annular Combustion systems, and the given exhaust flow for the gas turbines. The NOx emissions are not dependent on the amount of fuel being consumed, as both compounds in the NOx molecule origins from air and not from the fuel. Thus the NOx emissions are considered constant once the gas turbines have reached their normal operating load. Due to this particularity of the NOx emissions from the gas turbines, the only relation between NOx emissions and produced amount of LNG or amount of fuel consumed would exist if one or more gas turbines were stopped due to less energy consumption in some operation modes. During the operation mode described as normal production, six gas turbines are running. For details on calculations, see Appendix A. The expected NOx emission values for the gas turbines during normal production are presented in Table 3.2. DLE SAC NOx emissions, normal prod. [kg/s] 0.00371 0.455 Total Annual NOx [ton/year] 116.99 14348.88
Table 3.2 NOx emissions (as N2O) from DLE and SAC combustion systems It is clear that a substantial amount of NOx emissions can be avoided if the Dry Low Emission system is chosen for the Siemens SGT-700 turbine. The FPSO-1 project will probably be subject taxation of NOx emissions, and this is discussed in Section 3.3.5 “Emissions – costs”.
3.3.3 CO2 Emissions – normal production CO2 emissions from the gas turbines are calculated by using a quantity which tells us how much CO2 is formed per kWh fuel consumed in the gas turbines. This quantity is dependent on the conditions at which the combustion of natural gas takes place. In the combustion chamber of a gas turbine, the chemical reactions forming combustion products from the streams of fuel and air are dependent on the amount of air supplied per amount of fuel.
Stud.techn Lars Petter Revheim 26
Typically for combustion in gas turbines the amount of air supplied per amount of fuel supplied is much larger than what is required for complete combustion, resulting in the dominating products being formed are CO2 and H2O. The air to fuel ratio is often in the range 30 – 60 kg_air/kg_fuel. Nitrogen acts mostly as an inert gas passing through the combustion chamber without taking part in the reactions. However, because of the high temperature zones in the combustion chamber, some of the nitrogen does react with oxygen, forming NOx-compounds. The formation of NOx-compounds is independent from the formation of CO2, and does hence not influence the amount of CO2 in the exhaust gas. Formation of NOx could influence formation of CO2 in the case that not enough oxygen atoms are present in the combustion chamber to ensure that two oxygen atoms attach to each carbon atom, but that in stead one oxygen atom reacts and CO is formed instead of CO2. In a gas turbine however, the air to fuel ratio is considered to be so large that the absolute majority of the carbon in the fuel is bound in CO2. The CO2 emissions from the FPSO-1 will differ in magnitude as the FPSO-1 is operated under different scenarios. For the calculations in this thesis, power consumption during production of LNG and power consumption of the hull when the liquefaction process is shut down is considered for emission calculations from the gas turbines. Also, the gas cleaning process where CO2 which is present in the gas stream from the well is removed contributes to the total CO2 emissions from the FPSO-1. It is assumed that the gas cleaning process is only operating when the liquefaction process is operating. Thus, the equation for emissions from the FPSO-1 consists of three parts:
• CO2 emissions when the turbines deliver the total power of the FPSO-1 • CO2 emissions when the turbines deliver the power required for the hull only • CO2 emissions from gas cleaning
The total flow rate of CO2 from the FPSO-1 can be expressed as:
2 2 2 2, ,CO tot CO LNGproduction CO hullpower CO gascleaningm m m m= + +i i i i
(e3.1) The availability of the FPSO-1 impacts the CO2 emissions since the availability says how much of the time power for LNG production is required and how much of the time only power for the hull is required. The power required for LNG production is 157.1 MW, when the LNG production s shut-down it is assumed that the entire topside on the FPSO-1 is shut down. With this assumption, the power required for the hull only is 19.3 MW [22]. This assumption is not unrealistic since a shut down of the LNG process in fact will lead to shut down of the entire topside process when no flaring is allowed, which is the basis for the availability of 87.7% (which is the availability of the topside processes on the FPSO-1 considered in this section before any improvement potentials are discussed). Emissions as a result of additional power consumption under simultaneous production and offloading to LNG shuttle tanker are not calculated. For details of the calculations of CO2, see Appendix A. Table 3.3 shows the different flow rates of CO2 emissions resulting from the FPSO-1, with an availability of 87.7 %. The total CO2 emission with availability of the FPSO-1 of 100% (in other words, full LNG production all days of the year) is also listed for comparison:
Stud.techn Lars Petter Revheim 27
CO2 emissions from HLNG FPSO-1 (87.7% availability) [ton_CO2/year]
Flow rate CO2 (GTs at total power = 157.1 MW, 87.7% of the time) 699 387
Flow rate CO2 (GTs at hull power = 19.3 MW, 12.3% of the time) 12 059
Flow rate CO2 (gas cleaning, 87.7 % of the time) 119 217 Total annual CO2 830 663
Total annual CO2 (100 % availability) 933 414 Table 3.3 CO2 emissions from HLNG FPSO-1 (87.7% availability)
The table shows the amounts of CO2 resulting from the operation of the FPSO-1. However, these numbers are difficult to understand fully if they are not compared to other sources of CO2 emissions. To get an understanding of the magnitude of the emissions from the FPSO-1, it is useful to compare to the annual Norwegian emissions, presented in the report “National Inventory Report 2007,” published by the Norwegian Pollution Control Authority (sft) [27]. In the National Inventory Report 2007 [27], greenhouse gas emissions are reported from the time span 1990 – 2005. Figure 3.3 shows the Norwegian CO2 emissions in total, from the Norwegian oil and gas industry, and emissions resulting from road traffic in Norway.
CO2 emission sources
43,1
9,60,83
12,3
05
101520253035404550
Norwegian total,2005
Norwegian oil andgas industry, 2005
Road traffic inNorway, 2005
HLNG FPSO-1
[Mill
ion
tonn
es /
yea
r]
Figure 3.3 Selected CO2 emission sources relative to HLNG FPSO-1
As the Figure shows, the CO2 emissions from the FPSO-1 is relatively small compared to the total Norwegian emissions, the emissions from the oil and gas industry or the emissions from road traffic. The HLNG FPSO-1 emissions count for 1.93 % of the total Norwegian CO2 emissions, and for 6.7 % of the emissions resulting from the oil and gas industry in Norway (2005 levels). The total CO2 emissions from the FPSO-1 are however noticeable, which reflects that production of LNG is a process which does impact the environment a great deal with respect to emissions of greenhouse gases. Table 3.3 shows that there is a substantial increase in CO2 emissions if the FPSO-1 operates a whole year without failure, but this will naturally lead to a larger volume of LNG being produced. A similar Table is shown in Section 4 “HLNG FPSO-1 Improvement potential”, where an availability of 91.9% has been identified if selected flaring is allowed.
Stud.techn Lars Petter Revheim 28
Another apparent comparison of CO2 emissions would be a similar LNG plant, equal in layout and production capacity, but using a different liquefaction process. Unfortunately, no such plant exists today, however Statoil’s Melkøya plant is quite similar in some ways. The liquefaction section was prefabricated in Spain and floated on a barge to northern Norway, which made footprint of the liquefaction process an issue on this plant as well, which probably, impacted the choice of power production system to some extent. The Melkøya plant has an installed production capacity of 4.1 MMTPA, which is about 2.5 times the capacity of Höegh LNG’s FPSO-1 [28]. The installed power production capacity on Melkøya is 215 MW, and StatoilHydro states that their CO2 emissions from the power production unit will be 920 000 ton/year [29]. These are emissions from the power production unit only, which feeds the liquefaction process as well as the gas cleaning and inlet systems (similar to Figure 3.1 for the FPSO-1). The comparable figure for the emissions from the FPSO-1 would be CO2 emissions relative to the power consumption of the systems in Figure 3.1, the topside, only. The total power consumption of the FPSO-1 (157.1 MW) is not comparable, as there are a number of systems taking power from the gas turbines on the FPSO-1, which take power from the power grid on Melkøya, such as housing, control systems, lighting etc. The relevant power consumption for the topside processes is 137.8 MW [22], and the resulting CO2 emissions relative to the topside processes are 613 403 ton/year (ref Appendix A). It is difficult to compare directly, the emissions from the FPSO-1 and the emissions from Melkøya, when the methodology for the emission calculations at Melkøya is not known. What is safe to say is that when relating to emissions per produced ton of LNG, the FPSO-1 impacts the environment more than the Melkøya plant. This is due to the less efficient liquefaction process in use, which influences the power consumption of the entire topside process.
3.3.4 Emissions – flaring Flaring is a safety measure for processes containing hydrocarbons in liquid or gas phase, and is necessary when certain failures occur or when the FPSO-1 is operated according to certain operating modes. When equipment which is not critical for the LNG production fails, there is a choice of bypassing the unit with failure thereby flaring the stream of hydrocarbons which would normally have been routed to the unit, or shutting down the gas stream to the unit. Shutting down the gas stream to the unit would eventually mean shutting down the entire topside process, as described in Section 3.2.1. During the initial start-up of the FPSO-1, flaring is required while different process units reach their operating conditions. To reduce the amount of flaring as much as possible, start-up is done with the liquefaction trains running at minimum turndown, which would lead to 50% of the production capacity being flared. The turndown states at which minimum flow rate the liquefaction process can operate, and this figure is 50% for the processes on the FPSO-1. There are many factors which will influence the duration of the start-up sequence, since there are a large number of units in the process whose performance must be measured and approved before the next step in the sequence is started. An estimate of about two days for the time of
Stud.techn Lars Petter Revheim 29
the initial start-up of the FPSO-1 is given by Thomas Larsen, Senior Project Manager in the HLNG FPSO-1 project [30]. A particularity of flaring is the relatively large flame at the flare boom tip, and the complicated combustion which takes place in the flame. As a way of calculating emissions from flaring in an easy manner, the Norwegian Pollution Control Authority has developed average emission factors from flaring of natural gas at offshore oil fields [23, page 114]. These factors are given in Table 3.4 and are used for the calculation of emissions from the FPSO-1. The amount of gas flared during the start-up is 50% of the design production capacity of the FPSO-1. The well stream to the FPSO has a flow rate of 8.47 million Sm3/day. Table 3.4 shows the emission quantities for flaring of 50% of the well stream. Emission factors for flaring CO2 [kg CO2/Sm3 gas] 2.43 N2O [kg N2O/Sm3 gas] 0.00002 CO [kg CO/Sm3 gas] 0.015 Emissions per hour from flaring during initial star t-up (50% of well stream) CO2 [kg CO2/h] 428 794 N2O [kg N2O/h] 3.5 CO [kg CO/h] 2 646.9
Table 3.4 Emission factors and Emissions per hour during initial start-up Given the expected time of two days for the initial start-up, the emissions during the initial start up become: Emissions from flaring during initial start-up (50% of well stream) CO2 [ton CO2] 20 582 N2O [ton N2O] 0.168 CO [ton CO] 127
Table 3.5 Total emissions for an initial start-up procedure of 24 hours However, these values are only estimates and it is assumed that the initial start-up proceeds without interruptions or failures of any kind. The time dependent emission figures give a better view of the emissions from the FPSO-1 during the initial start-up. These figures are relative to the amount of gas being flared, and for re-start procedures, the emission factors in Table 3.4 should be used together with the flow rate of gas to the flare and the duration of the flaring. In this section, it is assumed that flaring from the FPSO-1 only occur during the initial start-up procedure. This assumption is based on a RAM (Reliability and Maintainability) study performed by DNV (Det Norske Veritas), which concludes with two different availability figures for the facilities based on a no-flaring scenario and a selected-flaring scenario. The better availability from the RAM study, which will lead to some flaring, is discussed in Section 4 “HLNG FPSO-1 Improvement Potential.”
Stud.techn Lars Petter Revheim 30
3.3.5 Emissions – costs In most waters around the world, some sort of taxation of NOx emissions has to be paid to the shelf state. Since the FPSO-1 still has an undetermined location, only an indication of the cost related to NOx taxation is given in the thesis, based on the Norwegian NOx tax. The Norwegian NOx tax is 15.85 NOK/kgNOx, and Table 3.6 shows the annual cost for this NOx tax for the emissions from the FPSO-1. NOx tax = 15.85 [NOK/kgNOx] DLE SAC Total Annual NOx [ton/year] 43.20 573.96 NOx tax [NOK/year] 684 720 9 097 266
Table 3.6 Costs related to NOx emissions, relative to combustion system As the table shows, approximately 8.4 million NOK can be saved annually if the Dry Low Emission combustion system is chosen, this saving must then be evaluated against the additional investment cost related to the DLE combustion system. CO2 emissions may also be subject to taxation where the FPSO-1 is operating. The taxation of CO2 emissions is done by trade of CO2-quotas. In Europe companies that are subject to reporting of CO2 emissions, receive CO2 quotas corresponding to a certain amount of tonnes CO2 that the company is allowed to emit. Additional CO2 emissions must be paid for through purchase of CO2 quotas. The HLNG FPSO-1 may be subject to CO2 taxation, but will also most probably receive an amount of CO2 quotas, the magnitude of this received amount is difficult to predict and will be determined by the government of the country which legislation applies on the production location. The price for CO2-quotas is per 21.05.2009 EUR 15.15 per ton CO2, and the cost of the total CO2 emissions from the FPSO-1 as presented in Table 3.3 would be 12.6 billion Euros for an availability of 87.7%. It is however not realistic that the entire amount of CO2 emissions will be subject to taxation.
3.3.6 Availability – cost The RAM study performed for the Höegh LNG FPSO-1 project has included two different availability figures, relative to the amount of flaring allowed. In the original scenario no flaring is allowed, which leads to the result that the facilities have an availability of 87.7% or approximately 320 days per annum of production of LNG [31]. The yearly production of LNG given this availability is:
6 61.6 10 0.877 1.403 10LNG LNGton tonyear year
=
i i i
This figure corresponds to a reduction of 196 800 tonnes of LNG compared to full production all days of the year. In the following this amount is referred to as “Lost LNG” and has a value which, given an availability of 100% of the FPSO-1 would come to the project.
Stud.techn Lars Petter Revheim 31
The value of the LNG is not set; it depends very much on the oil price. Normally a factor of 5.8 is used in the LNG industry for converting between the oil price in USD/barrel and the price of LNG given in USD/mmbtu [32]. Based on this conversion, an oil price of 50 USD/barrel will normally correspond to an LNG price of 8.6 USD/mmbtu. The investment bank Carnegie predicts oil price of 80 USD/barrel after 2010, but this may change based on the development of the financial markets world wide [32]. Since the FPSO-1 is expected to be on-site and producing first in 2013, the oil price may not be at the value predicted for 2013 today, and a scenario for a high oil price and one scenario for a low oil price are presented for the value of the lost LNG resulting from the availability of 87.7%. Table 3.7 shows the value of the lost LNG. Two LNG prices are estimated, one based on an oil price of 50USD/barrel (8.6USD/mmbtu), and one based on an oil price of 80 USD/barrel (13.8 USD/mmbtu). Conversion is needed for expressing the amount of lost LNG as an energy content given in Btu, and this conversion can be expressed in the following way, by relating to the lower heating value of LNG (49170 kJ/kg [8]).
3 12196 800 10 [ ] 49170 [ / ] 9.68 10 [ ]kg kJ kg kJ=i i i The annual amount of energy can be converted to British thermal units (Btu) by the following relation: 1 0.9478kJ Btu= [33] This gives: 12 12 69.68 10 [ ] 0.9478 [ / ] 9.17 10 [ ] 9.17 10 [ ]kJ Btu kJ Btu mmBtu= =i i i i
Table 3.7 Value of LNG lost as a result of an availability of 87.7% Based on two different oil price estimates, the value of the LNG which is not produced is in the range of 79 – 127 million USD, which is a substantial amount of capital for every project. It is therefore not a surprise that the project owners actively seek measures of improving the LNG production availability, and this is discussed in the Section 4 “Höegh LNG FPSO-1 Improvement potential”.
3.3.7 NGL Extraction – robust but complicated In the design at the end of the FEED phase, there is a relatively complicated NGL extraction system on the FPSO-1. The system utilises both cooling and pressure reduction to knock out the hydrocarbons which are not wanted in the end product. The reason for the complicated NGL extraction system is the need for reaching the specification of a heating value of less
Stud.techn Lars Petter Revheim 32
than 1070 Btu/scf, and that a generic feed gas composition has been used. The feed gas composition is generic because the FPSO-1 does not yet have a client which would have contributed to the design process with a real gas composition. The generic feed gas composition has an ethane content of about 6 mol-%, propane counts for ca. 5 mol-%, and hydrocarbons from butane to n-octane count together for ca. 4 mol-%. The generic feed gas composition was chosen with these amounts of hydrocarbons (plus impurities such as CO2) to ensure that the design of the processes on the FPSO-1 could handle a wide range of feed gas compositions. As a result of the ability to handle the relatively heavy feed gas, the systems prior to the liquefaction process need to be quite robust, and due to the content of heavy hydrocarbons (butane etc.) in the generic feed gas it is decided to use both cooling and pressure reduction to remove enough of the heavy hydrocarbons to satisfy the heating value specification. If the feed gas was lighter, a simpler cooling system could have been sufficient. Apart from leading to a larger equipment count, the NGL extraction system as it is designed today leads to a reduction in pressure before the pressure is raised again prior to liquefaction. The pressure is raised prior to liquefaction as liquefaction at higher pressures requires less work. Since the energy consumption of compressors is by far the largest contributor to the total energy consumption on the FPSO-1, any unnecessary pressure reductions which need to be followed by a pressure increase should be avoided. This is further discussed in Section 4 “Höegh LNG FPSO-1 Improvement potential.” However, as the FPSO-1 project emerges into the next phase, a number of potential clients have made it clear that their gas composition may be considerably lighter than the generic, which would lead to a simplification of the NGL extraction system.
3.3.8 Generic gas composition and undetermined loca tion The use of a generic gas composition for the design of the processes on the FPSO-1 may lead to different choices for systems on the FPSO-1, than if the final gas composition was known. The NGL extraction system is one example of a process which is relatively complicated in design at this stage of the project. The relatively heavy feed gas composition also leads to relatively large quantities of LPG being produced. Production of LPG is a consequence from having heavy hydrocarbons in the feed gas and this product also needs to be stored onboard the FPSO-1. The storage volume for LPG is 16 000 m3, and could be utilised partly for LNG storage if the production of LPG was less. As the FPSO-1 project team not yet have signed a contract with a client for the FPSO-1, the location of the FPSO-1 is still unknown. The location of the FPSO-1 is important with respect to which environmental data the facilities is designed for, such as ambient air temperature and sea water temperature. These parameters have significant impact on the performance of the gas turbines and the cooling water system. Although the final destination is unknown, the FPSO-1 will probably be located in an area where the sea states are benign and the climate is warm. The design at the end of the FEED phase is based on air temperatures during operation in the range of 0 to 35°C, and sea water temperatures between 4 and 30°C. These temperatures are set as minimum and maximum
Stud.techn Lars Petter Revheim 33
criteria for the design of the FPSO-1. The actual ambient temperatures will most probably vary over a part of the max.-min. temperature span, and a detailed study should be performed to evaluate the performance of the FPSO-1 under different ambient temperatures. A cooling water temperature sensibility test is performed and discussed in Section 4 “FPSO-1 Improvement potential.”
3.4 Key figures – end of FEED design Table 3.8 show some key figure for the FPSO-1 with the design at the end of the FEED phase. It is assumed an availability of 87.7% and a time for initial start up of the topside process of 24 hours. It is further assumed that restarts after shut-down of the topside process can be done without flaring.
Table 3.8 End of FEED design, Key figures
The table summarises the findings related to power consumption and emissions to air from the design of the FPSO-1 at the end of the FEED phase. The figures of zero (0*) emissions under the heading “Emissions from flaring normal operation” in Table 3.8 relates to the somewhat unrealistic scenario that no flaring is allowed
Stud.techn Lars Petter Revheim 34
during operation of the FPSO-1, and that the topside process is shut down when any equipment units which handle streams of hydrocarbons fail. As explained in Section 3.2.1, shut down of the topside process may lead to larger amounts of gas to be flared than if some flaring is allowed when selected equipment units fail, but the amounts of gas to be flared after a shut down of the topside process and the number of re start procedures necessary over one year are difficult to determine. Based on possible differences in time for repair of the equipment with failure, the number of restarts necessary may vary from one, in the case that the time for repair matches the down-time of the process over a year (12.3% of the time), or it may be necessary to perform more restart procedures if the time for repair of the failed equipment is less. The different repair times for failed equipment have not been determined. The availability of the FPSO-1 used in this section is 87.7%, which is the availability of the FPSO-1 when no flaring is allowed. It is however not likely that the project will proceed with this availability figure as the official figure, it is more likely that the project will use the better availability of 91.9% when some flaring is allowed as the official availability of the FPSO-1. The specific energy consumption of the FPSO-1 is given in kW/ton_LNG/day, which is common in the industry, and in kWh/kg_LNG which relates to SI units. The value of the produced LNG is presented for one high and one low oil price scenario, and they are both relative to the availability of 87.7%. A similar table summarises the same parameters at the end of the section describing the improvement potential.
Stud.techn Lars Petter Revheim 35
4 Höegh LNG FPSO-1 improvement potential In this section, some areas of possible improvements in design of the topside process are looked into. Improvement in this context means reduction in energy consumption of the process and thereby reduction of the impact on the environment. Comments are made on the effect these changes have on the economy of the project and availability of the process. The areas where improvements are identified are:
• Change in cooling water temperature (location, depth) • Change in the NGL extraction process • Change in flaring philosophy • Change in operation/design philosophy
4.1 Cooling water temperature change Since the final location of the FPSO-1 still is unknown, certain changes in the environmental conditions may occur, relative to the design conditions. The temperature of the sea water is one of the variables which may change with the location of the FPSO-1, and this temperature may impact the total energy consumption of the FPSO-1. The sea water temperature may change with the location of the FPSO-1, but will also change with the depth of sea water suction. Generally, the sea water temperature drops with depth, and a configuration with riser systems providing the sea water to the open cooling water cycle from a greater depth, may be used if the savings when using a cold cooling water temperature are significant. In this section the impacts on energy consumption of the FPSO-1 with a colder sea water temperature than what is designed for at the end of the FEED phase, are discussed. A cold cooling water temperature will provide some extra cooling for the liquefaction trains, which otherwise would have to be supplied by the refrigeration circuits in the liquefaction system. The FPSO-1 has a cooling water system which consists of two separate cycles. One cycle is closed, uses oxygen free fresh water and takes up heat from the refrigeration circuits in the liquefaction process. The heat which is taken up by the closed cycle is rejected to the open cycle sea water system. Two main choices exist for benefiting from the additional cooling of a cold sea water temperature. A cold sea water temperature would lead directly to a colder temperature in the closed fresh water cooling cycle. When the original design of the cooling water system is designed for a higher temperature than the actual cooling water temperature, one can easily see that the dimensions of the cooling water system can be reduced. As the cold cooling water temperature leads to an additional cooling duty in the system, the diameter or the flow rate of the piping in the cooling water system could be reduced, with a following reduction in necessary installed cooling water pump capacity. This would be beneficial for the power consumption of the FPSO-1. Another choice is utilising the cold cooling water temperature in the liquefaction process, with the result of reduced compression duty in the refrigeration cycles. The compression duty is linked to the cooling water temperature in the following way:
Stud.techn Lars Petter Revheim 36
The compressors raise the pressure and the temperature of the refrigerant to given values before the refrigerant enters the LNG heat exchanger. Between the refrigerant compressors and the LNG heat exchanger there are installed a cooling water heat exchangers, which take the temperature of the refrigerant down to the cooling water temperature. The refrigerant then passes through a part of the LNG heat exchanger before entering the expander which provides most of the cooling duty. When the cooling water temperature upstream the LNG heat exchanger drops, so does the temperature of the refrigerant through the heat exchanger and upstream the expander. When the temperature before the expander drops so does the temperature after, and an additional cooling duty in the refrigeration cycle is achieved. Actually, all the temperatures in the refrigeration cycle from after the sea water cooler to immediately upstream the refrigeration compressor drop because of the colder cooling water temperature. The described temperature drops in the refrigeration cycle is the first reason for the reduced refrigeration compression duty, as compression requires less work if the fluid to be compressed is colder, given that the suction and discharge pressures are the same. Another reason for reduced refrigeration compression duty has also to do with the reduced temperatures in the refrigeration cycle. As mentioned before, the temperature of the refrigerant drops after the expander. When this happens, the LNG exiting from the heat exchanger also has its temperature reduced. The reduction of the LNG temperature is not necessary, and represents a potential for further savings on the compression duty. Instead of letting the additional cooling duty achieved by the cold cooling water temperature lower the temperature of the LNG, one can take advantage of the additional cooling duty while keeping the LNG-temperature constant. By doing this, a reduction of the mass flow in the refrigeration cycle can be achieved, and thereby further reduction of the refrigeration compression duty can be achieved as well. Figure 4.1 shows a principal set-up of a simple LNG liquefaction process, with one expander, one compressor and one cooling water heat exchanger. The liquefaction of natural gas is here thought to take place in two heat exchangers. The pressure-rise and -drop over the compressor end expander respectively, are constant. A drop in cooling water temperature would lead to reduced temperature of the refrigerant in the points 1, 2, 3 and 4. Consequently, the LNG in point b would also be colder. If the LNG temperature in point b is to be kept constant, the mass flow of nitrogen can be reduced.
Stud.techn Lars Petter Revheim 37
1
2
3
4a b
Nitrogenmi
LNGmi
Figure 4.1 Schematic set up of a simple LNG liquefaction process A cooling water temperature sensitivity study was performed for the liquefaction process on the FPSO-1. This was done in HYSYS, using a modified HYSYS file originally made by SINTEF for Höegh LNG as a verification of the operability of the NicheLNG process used on the FPSO-1. The HYSYS simulation file is a part of the work performed by the Höegh LNG FPSO-1 project team and is considered as confidential material. Therefore, a simplified flow sheet of the liquefaction process is shown in Figure 4.2.
4e2e1c
2c
4c
3c
5c
Figure 4.2 Simplified flow sheet of the liquefaction process on HLNG FPSO-1
The red streams represent the natural gas, which is cooled and liquefied through the process. The main LNG heat exchanger is shown as four separate exchangers. A part of the natural gas flow is tapped from the stream which is liquefied, and used as refrigerant in the first part of the liquefaction process. The black streams represent the nitrogen refrigerant, and the blue streams represent boil off gas from the LNG cargo tanks which is being re-liquefied. The compressors and expanders in the figure are named with number and a letter indicating if the unit is a compressor or an expander. Corresponding numbers indicate that the compressor and the expander are coupled on the same shaft.
Stud.techn Lars Petter Revheim 38
In the liquefaction process on the FPSO-1, there are five cooling water heat exchangers, of which four are shown in Figure 4.2. The fifth is an inter stage cooler in the compressor “3c”. All five coolers are affected when the sea water, and thereby the cooling water temperature changes. A drop in cooling water temperature will result in a larger cooling duty in all coolers.
4.1.1 CW temperature change – results The HYSYS model of the liquefaction process was used to obtain results for power consumption of one liquefaction train when the cooling water temperature drops from 38°C (design case) to 24°C. A cooling water temperature of 24°C corresponds to a sea water temperature of 20°C, as a temperature difference of four degrees C is designed for in the cooling water/sea water heat exchangers [34]. The drop in cooling water temperature was simulated by using the Case Study tool in HYSYS. This tool allows an input variable to be independent, while a number of other variables are dependent on the change in the independent variable. The independent variable is the cooling water temperature and the dependent variables are the power consumption of all the compressors in the liquefaction train. Figure 4.3 shows the total power consumption as a function of the cooling water temperature. The temperature of the LNG exiting the main LNG heat exchanger is also shown.
(Total power cons.) & (Temperature of LNG out of HX ) vs. (CW temp.)
49 714
47 945
-157,8
-166,447000
47500
48000
48500
49000
49500
50000
38 37 36 35 34 33 32 31 30 29 28 27 26 25 24
CW temp [degree_C]
Tot
. P
ower
con
s. [k
W]
-168
-166
-164
-162
-160
-158
-156
-154
-152
Tem
p of
LN
G [d
egre
e_C
]
Total Power cons. Temperature LNG out of HX
Figure 4.3 Total power and temperature of LNG out of the main LNG heat exchanger vs. cooling water temperature
The figure shows a reduction of total power consumption for one liquefaction train of 1769 kW when the cooling water temperature drops from 38 to 24°C. Along with the reduction in power consumption there is a reduction of the temperature of the LNG exiting the Main LNG heat exchanger, of 8.6°C. The reduction of temperature after the
Stud.techn Lars Petter Revheim 39
heat exchanger is not desired, but happens as a consequence of the extra cooling duty which the colder cooling water temperature represents. Instead of having a reduction of the temperature of the LNG after the main LNG heat exchanger, one could reduce the flow of the refrigerants, which would save compression power, and keep the temperature of the LNG after the main LNG heat exchanger constant. A reduction of the flow rates of the refrigerants will make up for the extra cooling duty represented by the cold cooling water temperature. Another case study is performed in HYSYS to simulate this change of refrigerant flow rate, while keeping the cooling water temperature at 24°C. The HYSYS model is set up in a way which makes change of the methane refrigerant flow rate difficult. The reason for this is that the methane refrigerant is tapped from the main gas stream, ref. Figure 4.2. A change in the methane refrigerant flow rate would lead to a change in the LNG production rate, and this is not beneficial when comparing different processes which use one particular LNG production rate as one of the constant inputs. Therefore, the change in refrigerant flow rate is simulated by changing the nitrogen refrigerant flow rate only. Figure 4.4 shows the total power consumption and the temperature of the LNG exiting the main LNG heat exchanger as functions of nitrogen refrigerant flow rate.
(Total Power cons.) & (Temp of LNG out of HX) vs. ( N2 refr flow rate)
43 943
47 945
-158,1
-166,4
41000
42000
43000
44000
45000
46000
47000
48000
49000
4044
00
4024
00
4004
00
3984
00
3964
00
3944
00
3924
00
3904
00
3884
00
3864
00
3844
00
3824
00
3804
00
3784
00
3764
00
3744
00
3724
00
3704
00
3684
00
3664
00
3644
00
3624
00
3604
00
3584
00
3564
00
3544
00
3524
00
3504
00
3484
00
3464
00
3444
00
3424
00
N2 refr flow rate [kg/h]
Tot
al P
ower
con
s. [k
W]
-168
-166
-164
-162
-160
-158
-156
-154
-152
Tem
p og
LN
G o
ut o
f HX
[d
egre
e_C
]
Total power Temp of LNG out of HX
Figure 4.4 Total power consumption and temperature of LNG out of main LNG heat exchanger vs. nitrogen refrigerant flow rate
As the flow rate of the nitrogen refrigerant is reduced the total power consumption is also reduced. The temperature of the LNG out of the LNG heat exchanger rises, and reaches its original value (-158°C) at a nitrogen flow rate of 342 ton/h. At this value for nitrogen flow rate, the total power consumption of the liquefaction train is 43 943 kW. This power consumption is 5 771 kW less than the original value, when the cooling water temperature and the flow rate of the nitrogen refrigerant had values which corresponded to the design at the end of the FEED phase.
Stud.techn Lars Petter Revheim 40
Table 4.1 summarises the results for change in the cooling water temperature. In this table, results are displayed for the entire liquefaction process, e.g. two identical liquefaction trains.
CW temp. = 38°C CW temp. = 24°C
Total Power Consumption [MW] 99,44 87,89
Specific Power Cons. [kW-day/ton] 21,01 18,50
Specific Power Cons. [kWh/kg_LNG] 0,50 0,44
Table 4.1 Power consumption for high and low cooling water temperature In the figures for total power consumption in Table 4.1, two effects leading to the reduced power consumption when having a colder cooling water temperature are implemented. These are explained above (ref Figure 4.1) and are:
• Reduced compression need due to colder refrigerants in the liquefaction process • Reduced compression need due to less refrigerant flow rate
It is important to note that the pressure levels in the refrigerant cycles are unchanged compared to the original setup, in the cooling water temperature change procedure. Underlying the figure for total power consumption is also the distribution of power consumption between the methane and nitrogen compressors. This distribution is shown in Table 4.2 for the two cooling water temperature cases.
CW temp. = 38°C CW temp. = 24°C
Total Power Consumption [MW] 99.44 87.89
Power Methane and BOG compressors [MW],[%] 48.30 , (48.6 %) 46.60 , (53.0 %)
Table 4.2 Power distribution between refrigerant compressors for high and low cooling water temperature Table 4.2 shows how the distribution of power consumption shifts from being slightly larger for the nitrogen compressors in the original case, to being slightly larger for the methane and boil off gas compressors in the case with reduced cooling water temperature and nitrogen refrigerant flow rate. The reason for this shift is naturally, the reduction in the flow rate of the nitrogen refrigerant. Due to the set-up of the HYSYS simulation file which does not allow a change in the methane refrigerant flow rate without impacts on the LNG production rate it is not simulated if a change in the methane refrigerant flow rate would lead to an even more energy efficient process. It is clear that a reduction in the cooling water temperature reduces the total power consumption of the FPSO-1, and the key figures for the FPSO-1 with the cold cooling water temperature are presented in the Section 4.5 “Key Figures – improvement potential”.
Stud.techn Lars Petter Revheim 41
4.2 NGL extraction process change Leading to a possible improvement of power consumption, and as a mean of simplification of the topside processes on the FPSO-1, the NGL extraction process is removed. This might seam like an unlikely change, but given that the feed gas to the FPSO-1 is much lighter than what is designed for today, the NGL extraction process may be removed entirely or replaced by a simple cooling cycle. Removing the NGL extraction process entirely or simplifying the process has one goal with respect to energy efficiency of the FPSO-1; to avoid the reduction in pressure after the turbo-expander NGL extraction process which is designed today. Figure 4.5 shows the pressure profile for the natural gas passing through all processes on the topside of the FPSO-1 with the standard design, and with two design cases where the NGL extraction unit is removed. The standard design is the design at the end of the FEED phase.
0102030405060708090
Gas Well
Turret in
let
Slug catcher inlet
CO2 removal in
let
Dehydration inlet
Mercury rem. outlet
NGL extraction inlet
NGL extraction upst. e
xp
NGL extraction downst. e
xp
Liquefaction inlet
Liquefaction downst inlet comp.
Liquefaction in heat exchanger
Liquefaction downst. JT valve
Bar
Standard Case1 Case2
Figure 4.5 Pressure profile for the natural gas through the topside processes on the FPSO-1 The cases 1 and 2 are not referring to two different NGL extraction processes; they refer to two possible changes in design of the liquefaction process when the NGL extraction process is removed. The current design at the end of the FEED phase results in a pressure profile for the natural gas through the processes on the FPSO-1 as shown in the dark blue line in Figure 4.5. It is worth noting that the highest pressure is found in the NGL extraction process upstream the expander which provides most of the cooling of the main gas stream in this process. At this point the main gas stream has been compressed from 66 to 78 bar in a compressor at the inlet of the NGL extraction process. This compressor will be removed, and the total energy consumption of the FPSO-1 will benefit from this, if the NGL extraction process is removed. The NGL extraction process is the only reason for the raise and fall in the pressure profile in the current design.
Stud.techn Lars Petter Revheim 42
4.2.1 Case 1 Case 1 describes a situation where The NGL extraction unit is removed and the liquefaction takes place at 74 bar, similar to today’s configuration. The gas enters the liquefaction process at 66 bar as opposed to 30 bar in the current design. This reduces the necessary compression of the inlet gas from 44 bar (raise from 30 bar) to 8 bar (raise from 66 bar), in order to reach the liquefaction pressure of 74 bar. A flow sheet of the liquefaction process which corresponds to the Case1 is shown in Figure 4.6.
4e2e1c
2c
4c
3c
1c_b
5c
Figure 4.6 Simplified flow sheet of the FPSO-1 liquefaction process, implemented design change Case 1
As indicated in the figure, an extra inlet compressor (1c_b) is necessary in this configuration, to raise the pressure of the main gas stream from 66 to 74 bar. This compressor is necessary as the main gas stream has a pressure of 66 bar and cannot be fed directly to any of the streams entering or exiting the compressor “1c”, as these streams have different pressures. The stream entering the compressor “1c” has a pressure of 30 bar. This pressure level is the same as for the stream exiting the expander “2e” and is controlled by the necessary cooling duty, which depends on the pressure drop over the expanders “2e” and “4e”. The boil off gas compressor 5c is identical as in the original design. When changing a simulation file, like the HYSYS file from the HLNG FPSO-1 project team in this case, it is important to ensure that the results from the changed file are comparable to the original results. To ensure that this is the case in the master thesis, a selection of variables were selected as variables which should vary as little as possible from case to case. These variables are:
• Production rate of LNG • Temperature of LNG out of the LNG heat exchanger • Vapour fraction of the main gas stream after the pressure relief (Joule-Thompson)
valve • Lower Heating value of LNG
The variables listed above together ensure that the same product is produced after the liquefaction process for both suggested design changes as for the original liquefaction process
Stud.techn Lars Petter Revheim 43
design. These variables are presented along with the results for power consumption for each case. Table 4.3 show the power consumption of the compressors in Case 1, the power consumption in the original case, and the listed variables in the original case and Case 1 for one liquefaction train. The total power consumption for liquefaction is presented for one train and for two trains.
Case 1 End of FEED design
Liquefaction pressure [bar] 74 74
Cooling water temperature [°C] 38 38
Production rate LNG [ton/day] 4732 4733
Temperature LNG out of HX [°C] -157.7 -157.8
Vapour fraction after PRV [%] 5.23 5.22
Heating value LNG [kJ/kg] 48860 48870
Power comp. 1c 18.38 23.57
Power comp. 1c_b 0.60 -
Power comp. 3c 25.56 25.56
Power comp. 5c 0.58 0.59
Total Power Consumption [MW] 45.12 49.72
Total Power Consumption 2 trains [MW] 90.24 99,44
Table 4.3 Comparison End of FEED design and Case 1 From the table, it is clear that the LNG of the same conditions is produced in the two cases. The most interesting result of this design change is the reduction in power consumption of 9.20 MW (99.44 – 90.24 MW), when reducing the flow in compressor 1c and adding compressor 1c_b. The reason for this reduction in power consumption is that the compressor 1c compresses the total flow of the methane refrigerant and the gas to be liquefied from 30 to 74 bar. After the design change the compressor 1c only compresses the methane refrigerant from 30 to 74 bar, whereas the compressor 1c_b compresses the feed gas to the liquefaction process from 66 to 74 bar. The savings in compressor work occur as a result of the reduction of flow rate through the compressor 1c, simultaneously with the higher inlet pressure of the feed gas to the liquefaction process. Installation of the extra compressor 1c_b represents an extra investment cost, as well as an additional risk of failure as this unit is one of the unit types identified as largest contributors to failures from the RAM study performed by DNV. A study of costs related to installation of compressor 1c_b versus savings in energy costs should be performed if the Case 1 design change suggestion is further investigated.
Stud.techn Lars Petter Revheim 44
It is worth noting that the reduction of 9.2 MW only relates to the change in the liquefaction process, given a removal of the inlet compressor in the NGL extraction process a reduction of 2.05 MW will also occur [22]. If the NGL extraction process is removed entirely, more equipment units than the inlet compressor will be removed, lowering the total power consumption further. These equipment units are however not shown in the Electric Load Breakdown [22], and are therefore not included in the calculations. The total savings in power consumption from this case is therefore 11.25 MW.
4.2.2 Case 2 Case 2 describes a situation where the NGL extraction unit is removed and the liquefaction takes place at 66 bar. This case differs from the original and Case 1 in two ways; the liquefaction takes place at a lower pressure and a closed methane refrigeration loop is used instead of the refrigeration loop which takes its cooling media from the main gas stream. This configuration is shown in Figure 4.7.
4e2e1c
2c
4c
3c
5c
Figure 4.7 Simplified flow sheet of the FPSO-1 liquefaction process, implemented design change Case2 This configuration of the liquefaction process eliminates the need for the extra inlet compressor (1c_b) from Case 1. With respect to energy consumption and investment costs, this may look as an obvious choice for liquefaction process, but the downside of this configuration is the lower liquefaction pressure. The necessary work put into the liquefaction system is among other variables, a function of the pressure on the natural gas side of the LNG heat exchanger, and a lower natural gas pressure leads to larger energy consumption. If the pressure of a fluid which is to be liquefied is low, the fluid has a larger internal energy than it has at a higher pressure. It is here assumed that the fluid has the same temperature for the high and the low pressure, referring to case 1 and case 2 (which is the case in the simulations, where the fluid is cooled by cooling water upstream the LNG heat exchanger). Liquefaction of any gaseous fluid happens when enough heat is removed for the fluid to change phase from gaseous to liquid phase. When heat is removed from the fluid the internal energy is reduced, hence liquefaction requires more energy to be removed from the fluid when the internal energy is large (low pressure) than when the internal energy is low (high pressure).
Stud.techn Lars Petter Revheim 45
The lower liquefaction pressure leads to the result that the refrigeration cycles can not remove the same amount of heat from the natural gas, when the refrigeration cycles are unchanged from the original case. Because of this result, LNG of a higher temperature is produced. To be able to compare the two cases of liquefaction process changes, a requirement is that the product has the same conditions with respect to temperature, pressure and heating value. A way of ensuring that LNG is produced with the corresponding conditions to Case 1 and to the original case is to gradually reduce the pressure after the expanders (which will increase the cooling duty) until LNG of the right temperature and heating value is produced. This reduction in pressure after the expanders can be achieved by changing the pressure drop over the expander “4e”, over the expander “2e” or over both expanders in combination. An important limitation to implement is that the liquefaction process shall operate with gaseous refrigerants, which means that single phase conditions after the compressors must be achieved. It is found through different simulation approaches in HYSYS that a pressure reduction of approximately one bar is necessary in either one of the methane or nitrogen refrigeration cycles to reach the desired conditions of LNG at the exit of the LNG heat exchanger. It is also found that a reduction of pressure after the methane expander (2e) leads to a more energy efficient process than if the necessary extra cooling duty was achieved by reducing the pressure after the nitrogen expander (4e) or over both compressors in combination. One reason for this result is the different pressure levels in the methane and nitrogen refrigeration cycles. The nitrogen refrigeration cycle in the original design operates between 10.30 and 83.08 bar; a pressure difference of 72.78 bar. The methane refrigeration cycle operates between 19.51 and 74.76 bar; a pressure difference of 55.25 bar. The compressor efficiency is a function of the pressure ratio and typically decreases when the pressure difference increases (after having reached a certain optimal operating point defined by pressure ratio and flow rate); therefore an increase of pressure difference influences the compression power to a larger extent at high pressure ratios than at low pressure ratios. The vapour fraction of methane after the expander 2e is reduced from 99.38 % to 99.08% by the pressure reduction after expander 2e, but the vapour fraction is still considered high enough to avoid potential problems which could occur when liquid is formed at the exit of the expander. Table 4.4 shows characteristics of the original design and the design of Case 2.
Stud.techn Lars Petter Revheim 46
Case 2 End of FEED design
Liquefaction pressure [bar] 66 74
Cooling water temperature [°C] 38 38
Production rate LNG [ton/day] 4740 4733
Temperature LNG out of HX [°C] - 157.8 -157.8
Vapour fraction after PRV [%] 5.00 5.22
Heating value LNG [kJ/kg] 48840 48870
Power comp. 1c 19.48 23.57
Power comp. 3c 25.58 25.56
Power comp. 5c 0.58 0.59
Total Power Consumption [MW] 45.64 49.72
Total Power Consumption 2 trains [MW] 91.28 99.44
Table 4.4 Comparison End of FEED design and Case2 Again, the most interesting result is the decrease in power consumption in compressor 1c. The power consumption of this compressor is 8.16 MW lower than for the original case (two trains), which is a result of the less flow rate through the compressor. Since the flow rates through compressor 1c are the same for Case 1 and Case 2, the power consumption for compressor 1c between these cases can be directly compared. It is important to notice in the discussions of power consumption of compressors that only compressors driven electrically have been focused on so far, since these compressors directly influence the total power consumption of the FPSO-1. The compressors which are coupled to expanders and driven mechanically do not take power from the electrical distribution grid, their work is provided by the expanders on the same shaft. The theory behind liquefaction of LNG says that the power consumption of the process shall increase when the liquefaction pressure is reduced, but this does not seem to be the case in these simulations when looking only at the electrically driven compressors. When looking at all the compressors separately however, results show that the energy consumption of some of the compressors increase. This increase is small, and is hidden in the decrease in necessary work for compressor 1c, as the stream entering compressor 1c has a smaller flow rate than in the original design. It is therefore interesting to see how the lower liquefaction pressure (on the natural gas side of the heat exchanger) influences each compressor in the liquefaction process. This is shown in Table 4.5 where each compressor is listed in the original case and in Case2 and the differences in necessary work for each compressor is given as figure and percent relative to the original design.
Stud.techn Lars Petter Revheim 47
Compressor Work Original Case Work Case 2 ∆W (MW) Specific Work (%) 1c 23.57 MW 19.48 MW - 4.09 MW 82.6 % 2c 10.72 MW 10.94 MW 0.22 MW 102.1 % 3c 25.56 MW 25.58 MW 0.02 MW 100.1 % 4c 6.76 MW 6.75 MW - 0.01 MW 99.9 % 5c 0.59 MW 0.58 MW - 0.01 MW 98.3 %
Table 4.5 Power for each compressor End of FEED design and Case 2 Table 4.5 shows that there is a small increase in the work consumed by compressor 2c, which is a result of the reduction in pressure in the methane refrigeration cycle, which again is a result of the lower liquefaction pressure of the natural gas. The other compressors have very small deviations in work. The largest deviation is however for compressor 1c, which is explained before. Since the pressure reduction for acquiring the extra needed cooling duty is done in the methane refrigeration cycle, only compressors 1c and 2c experience this change in pressure levels, and hence only these compressors should experience any noticeable change in work. The extra work of compressor 2c seems small, but the HYSYS simulation file does however solve the simulations, and LNG of corresponding quality to the original design is produced. Case 2 may turn out to be a good alternative to the original design of the liquefaction process, at least with respect to energy consumption, given that the NGL extraction process is removed or simplified to such an extent that the main gas stream enters the liquefaction process at 66 bar. In this case the extra compressor 1c_b from Case 1 is not necessary.
4.3.3 Case selection When looking at the two possibilities of changing the liquefaction process design after the NGL extraction process has been removed, the figure for energy consumption dictates which case to proceed with in this thesis. The energy consumption is less for Case 1, and hence this case is presented at the end of the thesis in Section 4.5 “Key Figures - improvement potential”. Case 1 does however require installation of an extra compressor, which will lead to a higher investment cost and probably also to a small reduction in availability of the topside process, since the compressors are the equipment units which count for the most of the failures on the FPSO-1. The impact of the increase in investment cost and reduction of availability should be evaluated if Case 1 is further considered as an alternative liquefaction process design. Similar if Case 2 is considered, a more detailed study of the impacts of reduction of liquefaction pressure should be performed, as well as an optimization of pressure levels in the refrigeration cycles. In the thesis it has been determined that implementation of the two design changes (Case 1 and Case 2) is feasible, but further studies need to be performed to further evaluate the two cases.
4.3 Availability – flaring and cost reduction The FPSO-1 has an installed LNG production capacity of 1.6 MMTPA. However, the equipment on the FPSO-1 is subject to failures during production. Different units have
Stud.techn Lars Petter Revheim 48
different failure frequencies, and these are the basis for calculating the overall down-time of the FPSO-1. When calculating the overall down-time of the FPSO-1, different operation scenarios also influence the down-time, such as flaring. Flaring during the initial start-up is discussed in Section 3.3.4, and this section discusses flaring during production from the FPSO-1. The RAM study performed by DNV gives two different availabilities of the FPSO-1, 87.7 % availability if no flaring is allowed and 91.9 % if flaring is allowed when selected units in processes fail.
4.3.1 Additional emissions during normal production As a result of the better availability, the gas turbines operate with a higher load a larger part of the year, and this impacts the CO2 emissions. Table 4.6 show the CO2 emissions for availability of 91.9% of the FPSO-1. Details of the calculations are given in Appendix A. CO2 emissions from HLNG FPSO-1 (91.9% availability) [ton_CO2/year]
Flow rate CO2 (GTs at total power = 157.1 MW, 91.9% of the time) 732 881
Flow rate CO2 (GTs at hull power = 19.3 MW, 8.1% of the time) 7 941
Flow rate CO2 (gas cleaning, 91.9 % of the time) 124 927 Total annual CO2 865 749
Total annual CO2 (100 % availability) 933 414 Table 4.6 CO2 emissions from HLNG FPSO-1, availability 91.9%
The Table shows the emissions resulting from operation of the entire FPSO-1, the emissions resulting from only the topside processes is 642 779 ton/year.
4.3.2 Flaring during production – enhanced LNG prod uction Given that flaring is allowed when selected equipment which is non-critical for LNG production fails, the availability of the FPSO-1 is calculated to 91.9% or approximately 335 days per year of LNG production [31]. This is an increase in availability of the LNG production of approximately 15 days per year from the scenario where no flaring was allowed with the availability of 87.7%. The increased availability has a direct implication on the economy of the project, since there is an “extra” amount of LNG which can be sold. Table 4.7 shows the values of the amounts of LNG produced, for full production, for an availability of 87.7%, for an availability of 91.9%, and the difference in LNG production for the two availabilities. The figures are calculated in the same way as in Section 3.3.6 “Availability - cost”, only inserted the relevant production volumes.
Table 4.7 Value of LNG produced, relative to availability of the FPSO-1 Note that the figures in Table 4.7 represent a value of LNG, not an income from sale of LNG. Nevertheless, it is clear that an increase in only 4.2 %-points in the availability of the FPSO-1 has a significant impact on the economy of the project through the value of the LNG which is sold per year. Based on two different predictions for the future oil price, an additional value in the range 28 – 45 million USD comes to the project if the availability of the FPSO-1 increases from 87.7% to 91.9%.
4.3.3 Flaring during production - emissions The RAM study defines the scenario where some flaring is allowed, and lists the equipment which is considered as non-critical for LNG production and bypass-able. When knowing which units that are bypass-able as well as their respective total downtime per year, one can calculate the total flow rate of flared gas over one year in this scenario. The scenario where flaring is allowed, is based on the opportunity to continue LNG production, if equipment which is non-critical to LNG production fail. The RAM study concludes that compressors are the type of equipment which has the highest downtime of all equipment types, therefore flaring during LNG production is based on failure of these units. CB&I have listed the compressors which are by-passable with the respective flow rates, and the listed flow rates are those which will be flared in case of failure of the adjoining unit.
Table 4.8 Equipment items and their flow rate to flare
The compressors are compressors which belong to the non-critical parts of the processes on the FPSO-1, with respect to criticality of LNG production. When the failure rates of these units are known, it is possible to calculate the expected amount of flared gas over one year. Table 4.8 shows the failure rates per year and the amounts of gas which are expected to be flared over one year for the equipment listed above in Table 4.9.
Stud.techn Lars Petter Revheim 50
Equipment Item Downtime per year [hours]
Amount of flared gas per year [103 Sm3/year]
Stabilizer OVHD Comp. (2x 100%) 5.00 45.8 Regeneration Comp. 79.35 1785.4 LPG Comp. 79.35 1024.9 End Flash Gas Comp. 79.35 1256.4 Fuel Gas Comp. 79.35 1256.4 Amine Flash Comp. (2 x 100%) 5.00 0.96 LNG BOG Comp. 52.45 174.8 SUM 5544.7
Table 4.9 Equipment items and their downtime and resulting flow rates to flare The figures for annual amounts of flared gas in Table 4.9 are based on the figures for flow rate of the different units in Table 4.8 and the expected downtime per year. Based on the total amount of flared gas and the emission factors from Table 3.4, Section 3.3.4, the emissions related to flaring during production are calculated.
Emissions from flaring during production CO2 [ton CO2/year] 13473.6 N2O [ton N2O/year] 0.1 CO [ton CO/year] 83.2
Table 4.10 Total amounts of emissions from flaring during normal operation These emission figures are only related to flaring, additional emissions from the gas turbines ensuring power production are presented in Table 3.4 Section 3.3.4. The CO2 emissions from flaring during production, correspond to 1.6% of the CO2 emissions from the gas turbines (865 749 ton).
4.4 Equator Principles – Best Available Technology During the FPSO-1 project lifetime, several choices have been made with respect to type of equipment used in the design. There are an extensive number of process units on the FPSO-1, and for each unit a choice of which type of equipment to use must be made. When making these choices, the possibility of choosing the so-called Best Available Technology exists. Best Available Technology (BAT) is a term describing technology which is best with respect to pollution prevention from installations which represent a significant pollution potential. The European IPPC Bureau collects and exchanges information on BAT from the member states, and composes reference documents (BREFs) which in detail describe the best available technology for different industrial sectors [36]. The use of best available technology is generally considered to lead to a more expensive system to be installed. This is due to the fact that BAT refers to technology which is best on pollution prevention, and that such technology often leads to a more complicated design of the single process unit. The process units with additional pollution reducing systems integrated in the design are generally more expensive than their not so environmentally friendly counterparts.
Stud.techn Lars Petter Revheim 51
One example of BAT is use of Dry Low Emission combustion systems in the gas turbines on the FPSO-1. This combustion system is described in Section 1.2 and reduces NOx emissions from the gas turbines. BAT may become a requirement for some or all processes on the FPSO-1 at a later stage, through for instance, the Equator Principles. The Equator Principles are a set of principles decided upon and adopted by a number of financial institutions, which impose certain management practises on the project. The financial institutions who have adopted these principles have done so to ensure that the projects they finance are developed in “…a manner that is socially responsible and reflect sound environmental management practises [35].” Being a capital intensive structure to build, the FPSO-1 will need external financing, which could be provided by a financial institution which has adopted the principles. It is worth noting that best available technology (BAT) is not a specific requirement to be used in all projects financed by Equator Principle Financial Institutions (EPFIs), the principles are meant to serve as a common baseline and are to be implemented by each EPFI in correlation with its own environmental and social policies [35]. Use of BAT could become necessary to ensure that the project is in compliance with the policies from the financial institution providing loans to the project. Other necessary means may be use of local manpower to some extent for operation, construction or commissioning of the FPSO-1. A number of the world’s largest financial institutions have adopted the Equator Principles, including Bank of America, Citigroup, JP Morgan Chase, Wells Fargo and Lloyds TSB [35]. Compliance with policies that implement the Equator Principles may become a criterion for the financing of the FPSO-1, and it should be carefully studied what implications this will have on the design of the processes and operation philosophies of the FPSO-1. This study must be done in the process of selecting the financial institution, since the Equator Principles does not dictate specific criteria common for all projects financed by EPFIs.
4.5 Key Figures – Improvement potential design After having identified some improvement potentials, the key figures which correspond to the figures in Section 3.4 “Key figures – end of FEED design” are presented. In this section, the key figures are presented for the original design at the end of the FEED phase, the end of the FEED phase design plus 91.9% availability, the case 1 design plus 91.9% availability and the end of FEED design plus 91.9% availability plus a cooling water temperature of 24°C. The availability of 91.9% is used in all the suggested improvement potential cases, since it is likely that the operation philosophy will allow flaring when selected units which are not critical for LNG production fail, and which improves the availability.
Stud.techn Lars Petter Revheim 52
Table 4.11 Key figures for end of FEED design and end of FEED design with higher availability
When looking at the differences between the end of FEED design, and the end of FEED design with improved availability, one can see that the specific energy consumption is the same for both configurations, but the emissions and the amount of produced LNG differ. The emissions are larger with the higher availability, which is because the gas turbines are running a larger part of the year with a higher load, and there is an additional emission source; emissions from flaring during normal production. The amount of produced LNG is naturally also larger.
Stud.techn Lars Petter Revheim 53
Table 4.12 Key figures for Case 1 design change and for cooling water temperature change
When looking at the case 1 design change plus 91.9% availability, one can see that the total power consumption and the specific power consumption is lower than the end of FEED design, the emissions from normal production are less, and the amount of produced LNG is larger. Emissions from flaring during normal production are present in this case as well. The case where the design is identical to the end of FEED design, but where the cooling water temperature is 24°C also has lower total and specific power consumptions, lower emissions from normal production and higher LNG production volume compared to the end of FEED design. The LNG production volume is the same for all the cases where the availability is 91.9%, and the specific power consumption is largest for the end of FEED design, is smaller for the case 1 design, and is smallest for the end of FEED design with colder cooling water temperature.
Stud.techn Lars Petter Revheim 54
5 Discussion The Höegh LNG FPSO-1 project has now reached the end of the Front End Engineering Design (FEED) phase, and faces some choices with respect to further development of the design. This master thesis has identified some improvement potentials with respect to energy consumption and environmental impact for the FPSO-1. The design as it is at the end of the FEED design has several areas where a change may benefit the project substantially. One rather obvious change is the use of 91.9% availability with some flaring allowed during normal production instead of 87.7% with no flaring allowed during normal production. The increased availability represents a larger production of LNG which would contribute positively to the economy of the project, and the additional value of the LNG produced with a higher availability of the FPSO-1 is related to the price of LNG, which again is closely linked to the oil price. High and low oil price scenarios have been presented for the value of LNG. Also, the scenario where the entire topside process is shut down each time a single process unit which handles a stream of hydrocarbons fails, is from an operational point of view not desirable. As described in Section 3.2.1, a strict no-flaring philosophy which will lead to more shut downs of the topside process may actually lead to more emissions to air due to more re-start procedures of the topside processes being necessary in such a scenario. When the availability of the FPSO-1 is 91.9%, shut down of the topside processes will only occur when equipment units which are critical for LNG production fails. Further, if the feed gas to the FPSO-1 is much lighter than what is designed for today, the NGL extraction process may be removed or simplified to such an extent that the reduction and raise in pressure of the main gas stream in the NGL extraction process can be avoided. In such a case, the FPSO-1 can benefit from this by changing the LNG liquefaction process, for example to designs corresponding to Case 1 or Case 2 in this thesis. Case 1 describes an LNG liquefaction process which has on extra compressor installed compared to the current design, and has a power consumption which is 11.25 MW less than the end of FEED design, where 9.2 MW results from the change in the liquefaction process, and 2.05 MW results from the removal of the inlet compressor in the NGL extraction system. It is worth noting that the total power consumption of the FPSO-1 is reduced even though an extra compressor is installed. An evaluation of investment cost for the extra compressor versus savings in operational costs because of the reduced total power consumption must of course be performed if this case is further investigated. Case 2 describes an LNG liquefaction process operating at 66 bar, as opposed to 74 bar in the FEED design. This configuration has a power consumption which is 10.21 MW less than the FEED design, where 8.16 MW results from the change in the liquefaction process and 2.05 MW results from the removal of the inlet compressor in the NGL extraction system. Another area for improvement with respect energy consumption is change in the cooling water temperature. It is established through simulations that a cooling water temperature of 24°C instead of 38°C would be able to save 11.5 MW compared to the FEED design. This results from a lower flow rate in the nitrogen refrigerant cycle as well as the reduced work necessary for compressing a colder fluid when the discharge state (temperature and pressure) after the compressor is unchanged (as explained in section 4.1).
Stud.techn Lars Petter Revheim 55
The presented key figures in tables 4.11 and 4.12 are valid for the simulations and calculations performed in this thesis, and should be treated as separate case studies. It is for example likely that a reduction in the cooling water temperature for the design change Case 1, would lead to additional savings in energy consumption, however the saved amount of energy may vary from the figures presented for reduction in total energy consumption corresponding to the change in cooling water temperature in Section 4.1.1. The CO2 emissions from the FPSO-1 are related to the amount of fuel consumed in the gas turbines, whereas the NOx emissions are only a result of reactions between species present in air, and are therefore only relative to the exhaust gas volumetric flow rate and the combustion system used in the gas turbines, given that the gas turbines are operated with sufficient excess air according to the design of combustion systems. The amount of emissions released to air is also related to the availability of the FPSO-1, higher availability would naturally lead to more CO2 released to the atmosphere during normal production, and some additional emissions related to flaring during normal production, which have to be accounted for when determining the total environmental impact from the FPSO-1. It is however not necessarily so that a lower availability would lead to lower emissions in total, as a low availability most probably will lead to a larger number of restarts of the topside processes, which requires extensive flaring. The specific CO2 emissions relative to produced amount of LNG are equal between the two availabilities of the FPSO-1 when looking only at CO2 emissions from the gas turbines, but when including emissions from flaring, the specific CO2 emissions may very well be higher for the low availability of the FPSO-1. The project will most probably be subject to taxation of NOx emissions and possibly also CO2 emissions, it is however not easy to determine the cost of environmental fees exactly until the final location of the FPSO-1 is known, and thereby the legislation of the relevant shelf state. Examples of costs related to emissions to air are given in Section 3.3.5 “Emissions - costs”. The project may also find that the financial institutions funding parts of the project want the Equator Principles or other types of guidelines regarding project execution to be followed. In such a case, the project needs to carry out the project execution and possibly implement certain design changes to comply with the relevant financial institution’s policies, for instance through use of local manpower during construction, or through use of Best Available Technology in some or all systems of the FPSO-1. There are uncertainties related to the figures for emissions, energy consumption and values of produced LNG. These uncertainties relate mostly to practical issues, such as the actual time over the year with full LNG production. Also the fuel gas composition influences the amounts of CO2 emissions to the atmosphere, through its lower heating value and carbon content. The HYSYS simulation files does also represent uncertainties (in that the calculations are not analytically solved), however the simulations have performed as expected, and once the files were set up correctly, convergence have been achieved for every iteration of the simulations.
Stud.techn Lars Petter Revheim 56
6 Conclusions and suggestions for further work The Höegh LNG FPSO-1 design as well as the governing policies regarding design and operation have been described and evaluated with respect to energy consumption and emissions to air. Suggestions for improvements have been described and discussed. The design at the end of the FEED phase leads to a total power consumption of 157.1 MW for the FPSO-1. The liquefaction process has a power consumption of 99.4 MW, and a specific power consumption of 21.01 kW/ton_LNG/day. The CO2 emissions during normal production are calculated to 830 663 ton/year, and the NOx emissions are calculated to 116.99 ton/year given an availability of 87.7% of the FPSO-1 and Dry Low Emission combustion systems used in the gas turbines. Cleaning of the exhaust gas from the gas turbines is not included in any of the designs presented in this thesis. Two main sources for savings in energy have been identified; drop in cooling water temperature and removal of the NGL extraction process with two following alternative designs of the liquefaction process. In addition, the increased availability of 91.9% is used in all the scenarios for improvement potential, resulting in a larger volume of LNG being produced. This implies that some flaring will take place during normal production. The resulting CO2 emissions when implementing the higher availability are 865 749 ton/year during normal production, and 13 474 ton/year from flaring. The increased availability represents an additional value of LNG in the range of 28 to 45 million USD, relative to prices of LNG of 8.6 USD/MMBTU and 13.8 USD/MMBTU, respectively. This additional value is valid for all design changes performed, since they all use 91.9% availability as basis. The drop in cooling water temperature is not only a result of a change in the surface water temperature (in other words the location of the FPSO-1), the cooling water temperature will also change with the depth of the sea water suction. This favours use of riser systems (sea water suction at greater depths than the draught of the FPSO-1) for providing colder sea water to the cooling water system. The benefit in terms of energy consumption when having a cooling water temperature of 24°C instead of 38°C is 11.5 MW saved total power consumption. The reduced power load of 11.5 MW also benefits the environment in that the CO2 emissions to the atmosphere during normal production is reduced with 61 697 ton, given an availability of the FPSO-1 of 91.9%. A removal of the NGL extraction process will lead to savings in power consumption of the FPSO-1 via two different ways, the inlet compressor in the NGL extraction process will be removed, saving 2.05 MW, and the two proposed design changes in the LNG liquefaction process will save 9.2 and 8.16 MW, relative to Case 1 and Case 2, respectively. Therefore, the removal of the NGL extraction process will lead to total savings of 11.25 MW or 10.21 MW, relative to Case 1 and Case 2 design change in the liquefaction process. During the next phases of the FPSO-1 project, it should be evaluated whether riser systems for sea water suction could be beneficial for the project with respect to investment costs versus savings in energy consumption and thereby operational costs. The two design changes in the liquefaction process should also be further evaluated in more detail, once the final feed gas composition is known. When this composition is known, the possible degree of simplification of the NGL extraction process can be determined. In addition, the project
Stud.techn Lars Petter Revheim 57
should keep the opportunity open for having to adapt its organisation and execution strategy as well as its design and operation philosophy in accordance with guidelines given by financial institutions which have adopted the Equator Principles.
Stud.techn Lars Petter Revheim 58
References [1] Merriam-Webster’s Online Dictionary. http://www.merriam-webster.com/dictionary/combustion , visited 13.05.2009 [2] Siemens SGT-700 “Introduction, Low weight heavy duty industrial gas turbine” Doc.No: 1CS26561 [3] Turns S.R. “An introduction to Combustion” 2nd edition, Eqn. (2.8), page 13. ISBN 0-07-116910-5 [4] Norwegian Petroleum Directorate “Utredning av mulige NOx-reduserende tiltak på sokkelen” 26.08.05 ISBN: 82-7257-657-0 Page 10-12. http://www.npd.no/NR/rdonlyres/80D2E282-23B9-42FE-8A3A-AB4BD86DA436/0/NOxrapport.pdf , visited 17.04.09 [5] Turns S.R. “An introduction to Combustion” 2nd edition, page 555. ISBN 0-07-116910-5 [6] Siemens Industrial Turbomachinery AB. Performance and Technical Information SGT-700 “Nominal Performance Mechanical Drive” Doc.No: 1CS26672 Rev. B [7] Höegh LNG FPSO-1: “Site and Utility Data” Doc.No: 04301-CLN-T00-SP-PR-00001 [8] Höegh LNG FPSO-1: HYSYS simulation files. [9] Brown R.N. Compressors Selection and Sizing 3rd edition ISBN: 0-7506-7545-4 [10] Coolpack. Free software for refrigeration utilities. [11] Höegh LNG FPSO Project, PA Resources presentation fecbruary 2009. “FPSO presentation PA resources_Feb 09.ppt” Slide 4, 5 [12] Revheim L.P. “Energy and Environmental Aspects of a Floating LNG Chain” EPT-P-2008-54, 2008, Page 3. [13] Pettersen. J. TEP 10 Gas Processing and LNG, Natural Gas Liquefaction lecture slides. [14] Sheffield J. A. “Offshore LNG Production – How to Make it Happen.” Business Briefing: LNG Review 2005, 2005, page 2,3. [15] Van de Graaf J.M., Pek B. ” Large-capacity LNG Trains – The Shell Parallel Mixed Refrigerant Process” Business Briefing: LNG Review 2005. [17] Barclay, Denton. “Selecting Offshore LNG Processes” LNG Journal October 2005, p. 36. [18] Nibbelke R.et al. “Double mixed refrigerant LNG process provides viable alternative for tropical conditions” Based on a presentation to 82nd Annual GPA Convention, Dallas, March 11-13, 2002.
Stud.techn Lars Petter Revheim 59
[19] Wijngarden W. Leo J. “Offshore NICHE LNG production – unlocking stranded gas” Presentation from KIVI NIRIA. [20] Aspelund A., Gundersen T., “A liquefied energy chain for transport and utilization of natural gas for power production with CO2 capture and storage – Part 1.” Appl Energy (2008), doi: 10.1016/j.apenergy.2008.10.010 Page 4. [21] CB&I Lummus B.V. for Höegh LNG AS: ”Process Description and Philosophies” Doc.No. 04301-CLN-T00-00-TR-PR-00007 Rev.0 [22] Höegh LNG FPSO-1: “Electrical Overall Load Summary (incl. load list and load summary per switchboard)” Doc.No 04301-CLN-G00-40-LS-EL-00012 Rev.1 [23] Siemens Technical Data SGT-700 http://www.powergeneration.siemens.com/products-solutions-services/products-packages/gas-turbines/small-scale/sgt-700/technical-data/sgt-700-technical-data.htm , visited 20.05.2009 [24] Höegh Fleet Services, Ship management, Environmental Policy http://www.hoegh.com/autoliners/ship_management/environment/ [25] Höegh LNG FPSO-1: “Operation and Maintenance Philosophy” Doc.No. FPSO1-HLNG-00010 Rev.C [26] Höegh LNG FPSO-1: “Design Basis” Doc.No FPSO1-HLNG-00001 Rev. 02
[27] Norwegian Pollution Control Authority. “National Inventory Report 2007” http://www.sft.no/publikasjoner/2257/ta2257.pdf , visited 21.04.09 [28] Statoil ASA. Facts on the Snøhvit project. http://www.statoil.com/statoilcom/snohvit/svg02699.nsf?opendatabase&lang=no , visited 21.04.09 [29] Norwegian Pollution Control Authority. “Tillatelse til energianlegget i Snøhvit LNG” http://www.sft.no/artikkel____31145.aspx , visited 21.04.09 [30] Thomas Larsen. Senior Project Manager Höegh LNG AS. Private conversation 03.04.09 [31] Det Norske Veritas. “Report on Höegh LNG FPSO RAM analysis.” Report no: 1/ 123SCDK-09 Rev 2, 2008-12-22 [32] Hasle N. Höegh LNG AS. Private e-mail, dated 04.05.2009 [33] OnlineConversion.com Energy conversion. http://www.onlineconversion.com/energy.htm [34] Höegh LNG FPSO-1: “Cooling Water Balance” Doc.No.: 04301-CLN-T00-00-TR-PR-00011 [35] The Equator Principles, preamble. http://www.equator-principles.com/principles.shtml , visited 07.05.2009.
Stud.techn Lars Petter Revheim 60
[36] The European IPCC Bureau (EIPPCB) http://eippcb.jrc.ec.europa.eu/ , visited 07.06.2009
Stud.techn Lars Petter Revheim 61
Appendix A NOx and CO2 Emission Calculations
Stud.techn Lars Petter Revheim 62
NOx calculations The calculations behind the figures in Table 3.2 are presented here. The basis for the calculations is the chosen combustion systems in the gas turbines, either the Single Annular Combustor (SAC) system or the Dry Low Emission (DLE) combustion system. The Siemens SGT-700 gas turbine is considered used on the FPSO-1, and is considered to be operated at steady state under conditions which correspond to the industrial standard for measurements of NOx, e.g. 15% O2 is present in the exhaust gas flow. NOx emissions SAC system [ppm]: 200 ppm [4] NOx emissions DLE system [ppm]: 15 ppm [23] Exhaust gas flow Siemens SGT-700 [kg/s]: 91 kg/s [23] Density exhaust gasfluegasρ : 1.2041 kg/m3 (20°C, 1.013 bar)
Density NOx (NO2) NOxρ : 1.9025 kg/m3 (20°C, 1.013 bar)
The universal gas constantR : 8.314 J/(K*mole) Actual density of the exhaust gas, by using the ideal gas law (a1):
( )
, 3
3
1013250.2605
8.314518 273.15
15.37 10
fluegas fluegasfluegas act
fluegas fluegasfluegas
fluegas
p p Pa kgJR T mR
TK moleMW K
kg
mole
ρ
−
= = = =
+i
i
ii
i
When knowing the actual density of the exhaust gas, the volume flow of the exhaust gas can be found:
[ ] 3
3
91 /349.33
0.2605 /fluegas
kg s mV
skg m
= =
i
(a2)
Then the NOx emissions in m3/s are calculated as follows:
3 6 3[ / ] [ ] 10 [ / ]exhaust NOxNOxV m s ppm V m sχ − =i i
i i (a3)
For 15 ppm NOx:
3 6 3349.33[ / ] 15 [ ] 10 0.00524 [ / ]NOxV m s ppm m s−= =i
i i (a4) For 200 ppm NOx:
Stud.techn Lars Petter Revheim 63
3 6 3349.33[ / ] 200 [ ] 10 0.0699 [ / ]NOxV m s ppm m s−= =i
i i (a5)
Further the actual density of NOx at 518°C and atmospheric pressure is found:
( )
, 3
3
1013250.7088
8.314518 273.15
46.01 10
NOx NOxNOx act
NOx NOxNOx
NOx
p p Pa kgJR T mR
TK moleMW K
kg
mole
ρ
−
= = = =
+i
i
ii
i
(a6)
Finally the flow rate of NOx in kg/s is found for 15 ppm and 200 ppm:
3
30.7088 0.00524 0.00371NOx
kg m kgm
m s s= =
i
i (a7)
3
30.7088 0.699 0.455NOx
kg m kgm
m s s= =
i
i (a8)
These figures are presented and discussed in Table 3.2 Section 3.3.2.
CO2 calculations The calculations behind the figures in Table 3.3, Section 3.3.3 are presented here. The theory of CO2 formation is presented in Section 1.2.2 “CO2 emissions”. The CO2 emissions are calculated based on three sources; emissions when the FPSO-1 produces LNG, the emissions when the topside processes are shut down due to failure and only the power consumption of the hull contributes to the load on the gas turbines and thereby CO2 emissions, and emissions from the gas cleaning process. It is assumed that the gas cleaning process is only operating when the liquefaction process is operating. It is also assumed that the fuel efficiency of the gas turbines is the same when the turbines deliver the total FPSO-1 power consumption as when the turbines deliver only the hull power consumption. Thus, the equation for CO2 emissions from the FPSO-1 consists of three parts:
2
2 2 2 2, ,CO
CO tot CO LNGproduction CO hullpower CO gascleaning
kgm m m m
year
= + +
i i i i
(a9)
Some factors make up the basis for the calculations; these are: CO2 formation factorφ : 0.2086 [kgCO2/kWh fuel]
Total FPSO-1 power loadingtotL : 157 114 [kW] [22]
Total hull power loadinghullL : 57 694 [kW] [22]
Stud.techn Lars Petter Revheim 64
Fuel efficiency gas turbinesGTη : 0.36 [-]
Availability of the FPSO-1α : 0.877 [-]
Flow rate CO2 from gas cleaning 2CO gascleaningmi
: 135 937 680 [kgCO2/year] The power load figurestotL and hullL are converted to energy consumption figures, as the gas
turbines consume a certain amount of energy over one year:
[ ]
[ ]
365 24
365 24
tot tot
hull hull
kWh days hE L kW
year year day
kWh days hE L kW
year year day
=
=
i i
i i
(a11)
Then the equation for total CO2 emissions becomes:
( )2 2, 1tot hullCO tot CO gascleaning
GT GT
E Em mφ α φ α α
η η = + − +
i i
i i i i i (a12)
The three separate parts of the equation (a12), are derived separately: (a13)
1 376 318 640 12 2 20.20859 0.877 6993870.36 1000
2
kg ton tonkWhCO CO COE fueltotkWh year kg yearGT COfuel
Then the total flow rate of CO2 from the FPSO-1 with an availability of 87.7% becomes:
22 , 699 387 12 059 119 217 830 663 CO
CO tot
tonm
year
= + + =
i
(a16)
CO2 emissions which corresponds to the higher availability of 91.9% are calculated in the same way, only the value for α is changed.
Stud.techn Lars Petter Revheim 65
CO2 emissions relative to liquefaction power: In Section 3.3.3 the CO2 emissions relative to liquefaction power consumption only are mentioned, for comparison to the Snøhvit LNG plant. These emissions are calculated in the following way:
2 ,liq
CO liq
GT
Em φ α
η
=
i
i i (a17)
Where,
[ ] 365 24liq liq
kWh days hE L kW
year year day
=
i i (a18)
And the total topside power loadingliqL = 137 798 [kW] [22].