Page 1
i
Energy and Exergy Based Performance Analysis of
Westinghouse AP1000 Nuclear Power Plant
This thesis is submitted to the University of Ghana, Legon
In partial fulfillment of the requirement for the award of
MPhil
Computational Nuclear Sciences and Engineering
By
Robert Benjamin Eshun
(10024406)
February, 2014
University of Ghana http://ugspace.ug.edu.gh
Page 2
ii
DECLARATION
I hereby declare that with the exception of references to other people’s work which
have been duly acknowledged, this compilation is the result of my own research work
and no part of it has been presented for another degree in this university or elsewhere.
…………………………. Date……………………………..
Robert Benjamin Eshun
I hereby declare that the preparation of this project was supervised in accordance with
the guidelines of the supervision of thesis work laid down by the University of Ghana.
………………………………. ………………………………….
NANA Prof. A. A. Gyeabour I Prof. E. H. K. Akaho
(Principal Supervisor) (Co-Supervisor)
Date………………………….. Date……………………………..
University of Ghana http://ugspace.ug.edu.gh
Page 3
iii
DEDICATION
I dedicate this thesis to my parents Madam Leticia Akuffo and Mr Jacob Kofi Eshun,
my siblings Fifi, Angie, Emelia (Ewuradwoa), Isaac (Owuraku), and Naa Ayele, and
also Mrs Nana Adwoa Eshun, and my colleagues Gadri, Nti-Agyemang, Djangmah,
Darko, Nunoo and Yaa-Takyiwaa.
University of Ghana http://ugspace.ug.edu.gh
Page 4
iv
ACKNOWLEDGEMENT
I am very grateful to God, the almighty who gave me the courage and understanding
to pursue this study. Thereafter, I am thankful to my supervisors, Prof. A. Ayensu
Gyeabour I and Prof. E. H. K Akaho for their generous support, encouragement,
suggestions and supervision.
University of Ghana http://ugspace.ug.edu.gh
Page 5
v
CONTENTS
DECLARATION ii
DEDICATION iii
ACKNOWLEDGEMENT iv
LIST OF TABLES ix
LIST OF FIGURES x
LIST OF SYMBOLS AND ABBREVIATIONS xii
ABSTRACT xvi
CHAPTER ONE: INTRODUCTION 1
1.1 Background of Research. 1
1.2 Research Problem Statement. 2
1.3 Justification. 2
1.4 Research Objectives. 3
1.5 Energy Analysis. 4
1.6 Exergy Analysis. 5
1.7 Nuclear Power Plants. 6
1.8 Description of AP1000 Plant. 8
University of Ghana http://ugspace.ug.edu.gh
Page 6
vi
1.9 Scope of the Research. 14
CHAPTER TWO: LITERATURE REVIEW 16
2.1 The First Law of Thermodynamics. 17
2.1.1 Energy and Work. 18
2.2.2 Energy Balance. 19
2.2 The Second Law of Thermodynamics and Entropy. 20
2.2.1 Entropy Analysis. 23
2.3 Exergy. 25
2.3.1 Exergy and Work. 27
2.3.2 Exergy, Heat Transfer and Work. 29
2.3.3 Exergy Destruction and Irreversibility. 30
2.3.4 Exergy Balance. 33
2.4 First and Second Law Efficiency Ratios. 34
2.5 Heat Engines. 35
2.5.1 Rankine and Brayton Cycles. 37
2.7 Nuclear Energy Production. 37
CHAPTER THREE: METHODOLOGY 41
University of Ghana http://ugspace.ug.edu.gh
Page 7
vii
3.1 Analysis of Energy and Exergy Loss in a Generic Nuclear Reactor. 41
3.1.1 Reactor EnergyAnalysis. 41
3.1.2 Reactor Exergy Analysis. 42
3.3 Analysis of Energy and Exergy loss in AP1000 reactor core. 46
3.4 Analysis of Energy and Exergy loss in Simulation Model of
AP100 Plant. 50
3.4.1 Energy Analysis of AP1000 Components. 51
3.4.2 Exergy Analysis of AP1000 Components. 56
3.5 Overall Energy and Exergy Efficiencies and Losses of AP1000 Plant. 61
3.6 Computation of Energy and Exergy Rates. 62
3.6.1 Solution Algorithm (Structured Program). 63
3.6.2 Numerical flow Chart of Solution Algorithm. 64
3.6.3 Matlab Program Development and Implementation. 65
3.7 Validation, Verification and Errors. 65
CHAPTER FOUR: RESULTS AND DISCUSSION 66
4.1 Results. 66
4.1.1 Energy and Exergy Losses in AP1000 Reactor Core. 66
4.1.2 Energy and Exergy Losses in AP1000 Power Cycle. 70
4.1.3 Error Analysis. 72
University of Ghana http://ugspace.ug.edu.gh
Page 8
viii
4.2 Discussion. 73
CHAPTER FIVE: CONCLUSIONS AND RECOMMENDATIONS 77
5.1 Conclusions. 77
5.2 Recommendations. 79
REFERENCES 81
APPENDICES 84
APPENDIX A. ExergyCalc_code. 84
University of Ghana http://ugspace.ug.edu.gh
Page 9
ix
LIST OF TABLES
Table 1.1 Thermal-hydraulic parameters of AP1000. 11
Table 2.1 Approximate energy distribution and deposition resulting
from a typical U-235 Fission. 40
Table 3.1 AP1000 plant data. 48
Table 4.1 Property data for flow streams listed in Fig. 3.4 (a). 67
Table 4.2 Energy balance (output and loss) rates of AP1000 reactor core. 69
Table 4.3 Exergy output and consumption values forAP1000 reactor core. 69
Table 4.4 Simulated energy and exergy loss rates in sections of
AP1000 power cycle. 71
University of Ghana http://ugspace.ug.edu.gh
Page 10
x
LIST OF FIGURES
Fig. 1.1 Components and cycles of a PWR nuclear power plant. 7
Fig. 1.2 Fuel rod schematic of AP1000 reactor. 10
Fig. 1.3 AP1000 reactor coolant system showing the reactor and
steam generator assembly. 13
Fig. 2.1 A fixed mass, isolated system with heat transfer 𝑑𝑄 from
region 1 at temperature 𝑇 and entropy S1, and region 2
at 𝑇(1 − 𝑏) and S2 respectively. 21
Fig. 2.2 T-S diagram of entropy change of internally reversible cycle. 23
Fig. 2.3 T-S diagram of the Carnot Cycle. 36
Fig. 2.4 Schematic and process diagrams of Rankine and Brayton cycle. 38
Fig. 3.1 Typical power reactor fuel. 42
Fig. 3.2 Energy (Q) and exergy (Ex) flows in a generic nuclear reactor. 43
Fig. 3.3 Schematic of energy and exergy flows in AP1000 reactor core. 47
Fig. 3.4 Simplified diagram of the AP1000 process cycle (a), and T-s
diagram of the regenerative vapour cycle (b). 52
Fig. 3.5 AP1000 steam and power conversion system with process data. 53
Fig. 3.5 Numerical flow chart algorithm for computation of energy
and exergy loss rates. 64
Fig. 4.1 Comparison of sectional energy and exergy losses within the
AP1000 plant. 75
University of Ghana http://ugspace.ug.edu.gh
Page 11
xi
Fig. 4.2 Energy and exergy balances for the entire AP1000 plant
indicating power output and sectional losses. 75
University of Ghana http://ugspace.ug.edu.gh
Page 12
xii
LIST of SYMBOLS and ABBREVIATIONS
𝑐 speed of light (m/s)
𝑐 common specific heat capacity (J/kg K) in Eqs. (2.32 and 3.6)
𝑐𝑤𝑖 , 𝑐𝑤𝑜 condenser cooling water inlet and outlet streams respectively
𝑒 specific energy (J/kg)
𝐸𝑐𝑣 energy transfer in a control volume (J)
𝐸𝑖𝑛 energy input (J)
𝐸𝑠𝑦𝑠 total energy of system (J)
𝐸𝑜𝑢𝑡 energy output (J)
𝐸𝑥 exergy (J)
𝐸 𝑓𝑢𝑒𝑙 fuel energy rate (W)
𝐸𝑥 𝑓𝑢𝑒𝑙 fuel exergy rate (W)
𝑔 acceleration due to gravity (m/s2)
specific enthalpy (J/kg)
𝑐𝑜 enthalpy of condenser cooling water outlet (J/kg)
𝑐𝑖 enthalpy of condenser cooling water inlet (J/kg)
𝐻 enthalpy (J)
𝐼𝑑 exergy destruction (J)
𝐼 irreversibility (J)
𝐼 𝑑 exergy destruction (irreversibility) rate (W)
𝐼 𝑓𝑖𝑠𝑠𝑖𝑜𝑛 irreversibility of fission (W)
𝐼 𝑓𝑢𝑒𝑙 Irreversibility in heating fuel centreline (W)
𝐼 𝑝𝑒𝑙𝑙𝑒𝑡 irreversibility rate of heating fuel pellet surface (W)
𝐼 𝑐𝑙𝑎𝑑 irreversibility rate of clad (W)
𝐼 𝑐𝑜𝑜𝑙𝑎𝑛𝑡 irreversibility rate of coolant (W)
University of Ghana http://ugspace.ug.edu.gh
Page 13
xiii
𝐼 𝑟𝑒𝑎𝑐𝑡𝑜𝑟 irreversibility rate of reactor core (W)
𝑘 Boltzmann constant (J/K)
𝑀 molecular weight (g/g mole)
𝑀′ molecular weight of fission fragments (g/g mole)
𝑚𝑠𝑦𝑠 mass of system (kg)
𝑚 𝑖 mass flow rate of inlet stream(kg/s)
𝑚 𝑐𝑤 mass flow rate of condenser cooling water stream
𝑃 pressure (Pa or atm)
𝑄 heat flow (J)
𝑄 𝑐𝑣 rate of heat flow in a control volume (W or J/s)
𝑄𝑗 rate of heat transfer rate at boundary j (W)
𝑄 𝑛𝑒𝑡 net heat flow rate (W)
𝑄 𝑙𝑜𝑠𝑠 rate of heat loss (W or J/s)
𝑠 specific entropy (entropy per unit mass) (J/kg. K)
𝑆 entropy (J/K)
𝑆𝑔𝑒𝑛 entropy generation (J/K)
𝑆𝑐𝑣 net entropy transfer in a control volume (J/K)
𝑇 temperature (K or oC)
𝑇𝑎 Temperature of fission fragments (K)
𝑈 internal energy of fluid (J)
𝑢𝑎 Internal energy of fission fragments (J)
𝑢𝑖 internal energy of inlet stream(J)
𝑢𝑒 internal energy of exit stream(J)
𝑣 velocity of stream (m/s)
𝑉 volume (m3)
𝑊 mechanical work (J)
University of Ghana http://ugspace.ug.edu.gh
Page 14
xiv
𝑊𝑐𝑣 net work output in a control volume (J)
𝑤𝑓𝑙𝑜𝑤 flow work (J)
𝑊𝑟𝑒𝑣 ,𝑜𝑢𝑡 reversible work (J)
𝑊𝑢 ,𝑜𝑢𝑡 useful work (J)
𝑊 𝑛𝑒𝑡 net work output rate (W)
𝑊𝑢 ,𝑡𝑜𝑡𝑎𝑙 total useful work(W)
𝑊 𝑢 ,𝑚𝑎𝑥 maximum useful work (W)
𝑊 𝑎𝑐𝑡𝑢𝑎𝑙 actual work rate (W)
(𝑊 𝑢 ,max )𝑓𝑖𝑠𝑠𝑖𝑜𝑛 maximum work obtainable from fission (W)
(𝑊 𝑢 ,max )𝑓𝑢𝑒𝑙 maximum work available from fuel centreline (W)
(𝑊 𝑢 ,max )𝑝𝑒𝑙𝑙𝑒𝑡 maximum work available from fuel pellet surface (W)
(𝑊 𝑢 ,max )𝑐𝑙𝑎𝑑 maximum work available from clad surface (W)
(𝑊 𝑢 ,max )𝑐𝑜𝑜𝑙𝑎𝑛𝑡 maximum work obtainable from coolant (W)
𝑊 𝐻𝑃𝑇 work output by high pressure turbine (W)
𝑊 𝐿𝑃𝑇 work output by low pressure turbine (W)
𝑊 𝑇 work rate 𝑊𝑟𝑒𝑣 ,𝑜𝑢𝑡 reversible work (J)
𝑥 specific exergy (J/kg)
𝑥𝑓 specific flow exergy (J/kg)
𝑧 elevation (m)
𝛿𝑊𝑠𝑢𝑟𝑟 differential change in surrounding work (J)
𝛿𝑊𝑢 differential change in useful work (J)
𝛿𝑊 differential change in work (J)
𝑑𝑠 differential change in entropy (J/K)
𝑑𝑄 differential change in heat (J)
𝑑𝑄𝑅 reversible heat transfer (J)
University of Ghana http://ugspace.ug.edu.gh
Page 15
xv
𝜙𝑡 thermal neutron flux (n/cm2s)
Ʃ𝑓 macroscopic fission cross-section (cm-1)
𝜂 energy efficiency (%)
𝜂𝑠 isentropic efficiency (%)
𝜂𝑡 Carnot efficiency (%)
𝜂𝑅 energy efficiency of reactor core (%)
𝜂𝑝𝑙𝑎𝑛𝑡 overall energy efficiency of plant (%)
𝜓 exergy efficiency (%)
𝜓𝑅 exergy efficiency of reactor core (%)
𝜓𝑝𝑙𝑎𝑛𝑡 overall exergy efficiency of plant (%)
FLT first law of thermodynamics
SLT second law of thermodynamics
𝑃𝐸 potential energy
𝐾𝐸 kinetic energy
int, rev internally reversible process
University of Ghana http://ugspace.ug.edu.gh
Page 16
xvi
ABSTRACT
Energy and exergy analyses of the performance of the Westinghouse Advanced Passive
1000-MWe Nuclear Plant (AP1000) was conducted with the primary objectives to
identify and quantify the operational locations having the largest energy and exergy
losses under normal operating conditions.
The energy and exergy losses in the reactor units were determined from formulations of
the energy and exergy rate balances based on the Gouy-Stodola theorem. The
performance of the overall AP1000 plant was estimated by component wise modeling
and detailed break-up of energy and exergy losses in the various plant sections.
Operating at maximum core power of 3400 MW, the AP1000 reactor core experienced
moderately small thermal loss of 125.1 MW and very substantial exergy consumption
of 1814.8 MW, achieving energy and exergy efficiencies of 96.3 % and 46.6 %
respectively.
For the entire AP1000 plant, energy losses occurred mainly in the condenser where
1849.8 MW was lost to the environment. Exergy analysis, however, revealed lost
energy in the condenser was thermodynamically insignificant due to the low quality
and that irreversible losses in the reactor and steam generator assembly (1868.4 MW)
were the major source of irreversibilities in the plant.
The study confirmed that the major heat transfer inefficiencies occurring in nuclear
reactor plants resided in the reactor cores, and efforts to increase the efficiency of the
station should concentrate on the design of the core components.
University of Ghana http://ugspace.ug.edu.gh
Page 17
1
CHAPTER ONE
INTRODUCTION
1.1 Background
The current emphasis on energy resource conservation and environmentally
sustainable developmental efforts in energy resource extraction, processing, and
production endeavours have generated increased interest and prompted both
researchers and industries to find high efficiency and low emission solutions to energy
related problems.
Conventional energy analysis is based on the first law of thermodynamics which
quantifies energy on quantity only. Energy, however, is fully quantified by the
quantity and quality (referred to as exergy). Generally, mathematical models based on
the first and second laws of thermodynamics are the foundations for any
comprehensive analysis of energy related engineering systems.
The exergy concept, derived from the second law of thermodynamics, is poorly
understood and applied for performance assessment of energy related systems. Exergy
analysis is a recent and rigorous technique that has found increasingly widespread
acceptance as a useful tool in the design, assessment, optimization and improvement
of energy systems [1].
Exergy is useful for providing a detailed breakdown of the losses for plants and
components, in terms of waste emissions and irreversible losses, and quantifies the
types, causes and locations of the losses, such that inefficiencies in processes are
better pinpointed. In exergy analysis, more meaningful efficiencies are evaluated
since exergy efficiencies are always a measure of the approach to the physically ideal
output.
University of Ghana http://ugspace.ug.edu.gh
Page 18
2
1.2 Research Problem
A complete energy analysis of thermal power and other energy intensive systems
requires a combination of the first and second laws of thermodynamics to account for
the quality and quantity of the energy flows [2].Various irreversible losses exist
within the systems, which transform part of the total energy to forms unavailable for
power production [3].
The research problem investigated was to develop a mathematical model of the
thermodynamic efficiency of the Westinghouse Advanced Passive 1000-MWe
Nuclear Plant (AP1000) using energy and exergy methods in order to quantify the
locations, types and magnitude of operational losses, and determine the overall
performance of the plant.
Mathematical formulations of energy and exergy balances were derived for the
primary circuit operating under steady state conditions, and for the individual
components of the steam supply system of the AP1000 plant.
1.3 Justification
This study of the energy and exergy characteristics of the nuclear power reactor will
contribute and offer a deeper insight into the energy and fuel use profile of nuclear
stations.
Further, the study will yield operational data on the sources and magnitude of losses
in the reactor systems, and the extent to which each component approaches the ideal
output. Thus sites of inefficiencies would be pinpointed to inform on future
improvement in the design of new systems for more efficient energy conversion and
reduced fuel usage.
University of Ghana http://ugspace.ug.edu.gh
Page 19
3
Facing a huge shortfall in the supply of energy, Ghana plans to augment its energy
production mix with nuclear power in the foreseeable future. With the AP1000 being
one of the likely choice of reactors [4], the study would serve as a fundamental
thermodynamic assessment of the various components of the reactor plant, and
provide the platform for conducting further performance and efficiency research on
the plant.
A comprehensive energy and exergy analyses of the Westinghouse AP1000
thermodynamic systems would provide valuable performance data as presently no
literature exists on the exergetics and performance levels of the AP1000 plant.
1.4 Research Objectives
The objectives of the research included:
Formulation of energy and exergy balances for the Westinghouse AP1000
power reactor system under steady state conditions.
Determination of the magnitude of energy losses and dissipations (or exergy
consumptions) in the energy conversion processes within the components of
the reactor assembly.
Identification of the locations and types of irreversibilities within the systems,
and specification of the sites or components that contribute significant losses
to the system.
Determination of the energy and exergy efficiency of the reactor components
and the overall operating efficiencies under nominal conditions.
Contributing to a comprehensive understanding of the thermodynamic
characteristics of reactor systems.
University of Ghana http://ugspace.ug.edu.gh
Page 20
4
1.5 Energy Analysis
Conventional energy analysis is based primarily on the first law of thermodynamics
(FLT), which stipulates the principle of energy conservation. Energy is conserved by
the amounts of energy of various forms (mass flows, heat and work) transferred
between a system and surroundings, and in the changes in the energy stored within the
system [5].
Energy analysis of thermal systems is essentially an accounting of the energies
entering and exiting the system. The exiting energy can be broken down into products
and wastes. The only inefficiencies detected by the energy analysis of a system are the
energy transfers out of the system that are not further used in the installation [6, 7].
Energy efficiencies thus emphasize reducing energy emissions or wastes to improve
efficiency. The thermodynamic losses which occur within systems due to the
irreversible nature of real processes are often not accurately identified and assessed.
Consequently, energy analysis provides no information on the degradation of energy
or resources during a process and does not quantify the usefulness of the various
energy and material streams flowing through a system and exiting as products and
wastes.
The results of energy analysis can therefore indicate the main inefficiencies to be
within the wrong sections of the system, and a state of technological efficiency
different than actually exists. Therefore, energy analysis does not always provide a
measure of how nearly the performance of a system approaches ideality [6].
University of Ghana http://ugspace.ug.edu.gh
Page 21
5
1.6 Exergy Analysis
Energy is conserved in all interactions. However, all real processes involve energy
losses. In real processes, energy is not destroyed but rather transformed into other
forms, less suitable for feeding and driving real processes. Hence beside energy, the
concept of exergy was introduced to characterize the quality of the energy under
consideration [8].The exergy method of analysis, based on the second law of
thermodynamics and the concept of irreversible production of entropy, overcomes the
limitations of energy analysis.
Exergy is the maximum work potential of energy in relation to the environment and is
a measure of the ability to do work by the variety of energy streams (mass, heat, and
work) that flow through a system [9].The key principle of exergy is the provision of
common grounds for the comparison of the various energy streams based on the
mechanical work obtainable from the energy stream.
The term exergy comes from the Greek words ‘ex’ and ‘ergon’, meaning ‘external’
work. Exergy is conserved only when all processes occurring in a system and the
environment are reversible. Exergy is destroyed whenever an irreversible process
occurs due to the generation of entropy in a system [6].
The elementary irreversible phenomena that generate entropy are mechanical or
hydraulic friction, heat transfer with a finite temperature gradient, diffusion with a
finite gradient of concentration, and the mixing of substances with different
parameters and chemical composition [8].
In systems analysis, the irreversibilities associated with combustion, heat transfer,
mixing and pressure losses are considered separately to estimate the contribution of
each to the total exergy destruction in a system [10].
University of Ghana http://ugspace.ug.edu.gh
Page 22
6
Exergy losses represent the true losses of potential that exist to generate a desired
energy output by accurately quantifying the entropy generation of the components
[11].Exergy efficiency therefore provides a measure of how nearly the operation of a
system approaches the ideal or theoretical upper limit and gives clear insights into
process performance, as energy flows are weighted according to exergy contents and
losses are separated into heat losses to surroundings and energy dissipations within
the system[6].
1.7 Nuclear Power Plants
Nuclear reactors produce and control the release of energy from fission chain
reactions. The energy released from continuous fission of the atoms of the fuel is
harnessed as heat in either a gas or water (which is used to produce steam). The steam
is used to drive the turbines which produce electricity, as in most fossil fuel plants.
Uranium is the basic fuel. Pellets of uranium oxide (UO2) are typically arranged in
long zirconium alloy (zircaloy) tubes to form fuel rods. The rods are arranged into
fuel assemblies in the reactor core. Moderator material in the core slows down the
neutrons released from fission so that they cause more fission. The material is usually
water, but may be heavy water or graphite.
Control rods made with neutron-absorbing material such as cadmium, hafnium or
boron, are inserted or withdrawn from the core to control the reaction rate, or to halt
it. A coolant fluid circulating through the core transfers the heat to the steam
generator where the heat from the core is used to make steam for the turbine.
The main power reactor designs are the pressurized water reactor (PWR) and boiling
water reactor (BWR). PWRs are the most common power reactor type. The PWR
University of Ghana http://ugspace.ug.edu.gh
Page 23
7
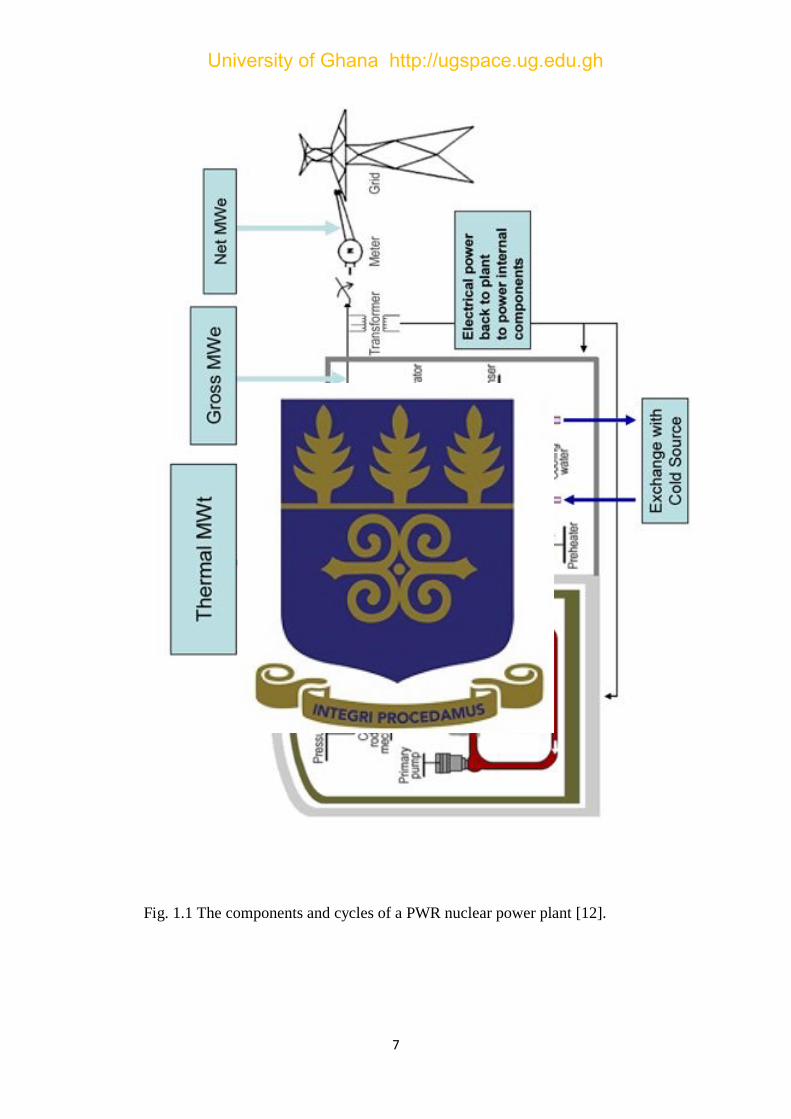
Fig. 1.1 The components and cycles of a PWR nuclear power plant [12].
University of Ghana http://ugspace.ug.edu.gh
Page 24
8
design (see Fig. 1.1) is distinguished by having a primary cooling circuit which flows
through the core of the reactor under very high pressure, and a secondary circuit in
which steam is generated to drive the turbine.
A PWR has fuel assemblies of 200-300 rods each, arranged vertically in the core, and
a large reactor would have about 150-250 fuel assemblies with 80-100 tonnes of
uranium. Water in the reactor core reaches about 325°C, hence it must be kept under
about 150 times atmospheric pressure (15 MPa) to prevent it boiling. Pressure is
maintained by steam in a pressurizer. In the primary cooling circuit the water is also
the moderator, and if any of it turned to steam the fission reaction would slow down.
The secondary circuit is under less pressure and the water here boils in the heat
exchangers which are thus steam generators. The steam drives the turbine to produce
electricity, and is then condensed and returned to the heat exchangers in contact with
the primary circuit.
The BWR design has many similarities to the PWR, except that there is only a single
circuit in which the water is at lower pressure (about 75 times atmospheric pressure)
so that it boils in the core at about 285°C.
The reactor is designed to operate with 12-15% of the water in the top part of the core
as steam, and hence with less moderating effect and thus efficiency there. The steam
passes through drier plates (steam separators) above the core and then directly to the
turbines, which are thus part of the reactor circuit [12].
1.8 Description of AP1000 Plant
The AP1000 is an advanced pressurized water reactor (PWR) plant developed by
Westinghouse Electric Company of USA. It is based on a conventional 2-loop, 2-
University of Ghana http://ugspace.ug.edu.gh
Page 25
9
steam generator primary system configuration. AP1000 is rated at 3400 MWt core
power and contains 157 fuel assemblies, similar to Doel 4 and Tihange 3[13].
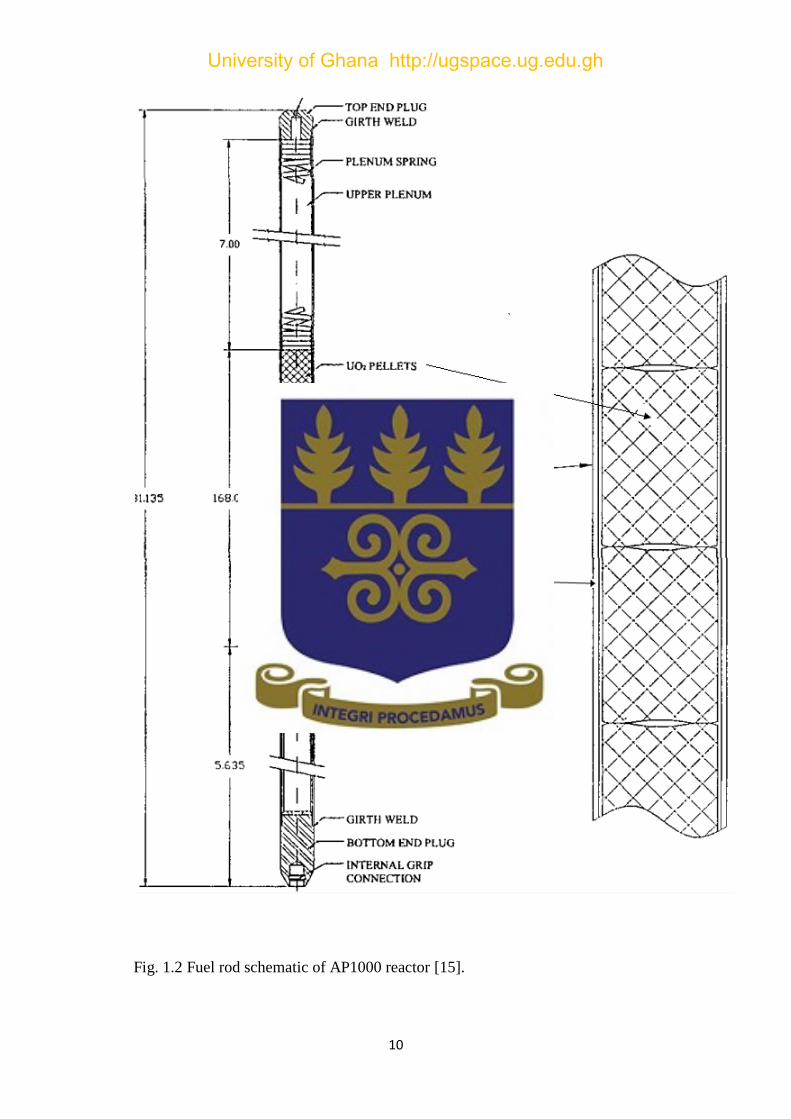
The fuel rods consist of enriched uranium, in the form of cylindrical pellets of
uranium dioxide (UO2), contained in ZIRLO™ tubing. The tubing is plugged and seal
welded at the ends to encapsulate the fuel.
The fuel rods in the AP1000 fuel assemblies contain additional gas space below the
fuel pellets, compared to other previous fuel assembly designs to allow for increased
fission gas production due to high fuel burnups. A cross-sectional view of the fuel rod
is shown in Fig. 1.2.
The thermal-hydraulic design parameters described in Table 1.1, establish that
adequate heat transfer is provided between the fuel clad and the reactor coolant. The
reactor core is cooled and moderated by light water at a pressure of 15.5 MPa. Soluble
boron in the moderator/coolant serves as a neutron absorber. The concentration of
boron is varied to control reactivity changes that occur relatively slowly, including the
effects of fuel burnup [14].
AP1000 features passive emergency core cooling and containment cooling systems.
The active systems required to mitigate design basis accident conditions have been
replaced by simpler, passive systems relying on gravity, compressed gases, or natural
circulation instead of pumps [13].
The reactor coolant system consists of two heat transfer circuits, each with a steam
generator, two reactor coolant pumps, and a single hot leg and two cold legs for
circulating reactor coolant. In addition, the system includes the pressurizer,
University of Ghana http://ugspace.ug.edu.gh
Page 26
10
Fig. 1.2 Fuel rod schematic of AP1000 reactor [15].
University of Ghana http://ugspace.ug.edu.gh
Page 27
11
Table 1.1 Thermal-hydraulic parameters of AP1000 [14].
Thermal and Hydraulic Design Parameters AP1000
Fuel assembly design 17x17 XL
Robust Fuel
Number of fuel assemblies 157
Uranium dioxide rods per assembly 264
Rod pitch (in.) 0.496 (1.26 cm)
Overall dimensions (in.) 8.426 x 8.426 ( 21.40 x
21.40 cm)
Fuel weight, as uranium dioxide (lb) 211,588 (95974.7 kg)
Clad weight (lb) 43,105 (19552.1 kg)
Number of grids per assembly
Top and bottom – (Ni-Cr-Fe Alloy 718)
Intermediate
Intermediate flow mixing
2
8 ZIRLOTM
4 ZIRLOTM
Loading technique, first cycle 3 region non uniform
Fuel Rods
Number 41,448
Outside diameter (in.) 0.374 (0.95 cm)
Diametral gap (non-IFBA) (in.) 0.0065 (0.016 cm)
Clad thickness (in.) 0.0225 (0.057 cm)
Clad material ZIRLOTM
Fuel Pellets
Material UO2 sintered
Density (% of theoretical) 95.5
Diameter (in.) 0.3225 (0.819 cm)
Length (in.) 0.387 (0.98 cm)
University of Ghana http://ugspace.ug.edu.gh
Page 28
12
Interconnecting piping, valves, and instrumentation for operational control and
safeguards actuation. All reactor coolant system equipment is located in the reactor
containment.
During operation, the reactor coolant pumps circulate pressurized water through the
reactor vessel then the steam generators. The water serves as coolant, moderator, and
solvent for boric acid (chemical shim control) and is heated as it passes through the
core. It is transported to the steam generators where the heat is transferred to the
secondary coolant. It is then returned to the reactor vessel by the pumps to repeat the
process [16].
The reactor coolant system pressure is controlled by operation of the pressurizer,
where water and steam are maintained in equilibrium by the activation of electrical
heaters or a water spray, or both. Steam is formed by the heaters or condensed by the
water spray to control pressure variations due to expansion and contraction of the
reactor coolant. The reactor coolant system arrangement is shown in Fig. 1.3.
The steam and power conversion system is designed to remove heat energy from the
reactor coolant system via the two steam generators and to convert it to electrical
power in the turbine-generator. The main condenser de-aerates the condensate and
transfers heat that is unusable in the cycle to the circulating water system. The
regenerative turbine cycle heats the feedwater, and the main feedwater system returns
it to the steam generators.
The steam generated in the two steam generators is supplied to the high-pressure
turbine by the main steam supply system. After expansion through the high-pressure
turbine, the steam passes through the two moisture separator/ reheaters (MSRs) and is
University of Ghana http://ugspace.ug.edu.gh
Page 29
13
Fig.1.3 AP1000 reactor coolant system showing the reactor and steam generator
assembly [16].
University of Ghana http://ugspace.ug.edu.gh
Page 30
14
then admitted to the three low-pressure turbines. A portion of the steam is extracted
from the high- and low-pressure turbines for six stages of feedwater heating.
Exhaust steam from the low-pressure turbines is condensed and deaerated in the main
condenser. The heat rejected in the main condenser is removed by the circulating
water system (CWS). The condensate pumps take suction from the condenser hotwell
and deliver the condensate through four stages of low-pressure closed feedwater
heaters to the fifth stage, open deaerating heater.
Condensate then flows to the suction of the steam generator feedwater booster pump
and is discharged to the suction of the main feedwater pump. The steam generator
feedwater pumps discharge the feedwater through one stage of high-pressure
feedwater heating to the two steam generators. The turbine-generator has an output of
about 1,199,500 kW for the Westinghouse nuclear steam supply system (NSSS)
thermal output of 3,415 MWt [17].
1.9 Scope of the Research
The research investigated the energy and exergy characteristics of the AP1000 power
reactor under normal operating conditions. Chapter 1 introduced the background to
the study, the distinction between energy and exergy methods and gave a brief
description of the AP1000 reactor system.
Chapter 2 provided the general definitions, basic principles and implications, and
practical applications of energy and exergy whilst Chapter 3 presented the
methodologies for the energy and exergy evaluation of water cooled nuclear reactors.
Chapter 4 presented the results of the energy and exergy analyses of AP1000, and
discussion of the findings in relation to other published works. Finally, Chapter 5
University of Ghana http://ugspace.ug.edu.gh
Page 31
15
summarized the research work as conclusions and presented recommendations for
further investigation of the processes and concepts.
University of Ghana http://ugspace.ug.edu.gh
Page 32
16
CHAPTER TWO
LITERATURE REVIEW
Normal energy analysis evaluates energy on quantity basis only [18]. However, the
concept of exergy complements and enhances an energetic analysis by calculating the
true thermodynamic value of an energy carrier, the real inefficiencies and variables
that unambiguously characterize performance of the system (or its components)
[7].Performing energy and exergy analyses therefore give a complete depiction of
system characteristics [19].
The energy and exergy methods stem from thermodynamics and are applicable to
divergent schemes of energy processes. For instance Mady et al. [20] applied exergy
analysis to the human body to assess the quality of the energy conversion processes
that take place in its several organs and systems and, Hepbasli [21] undertook an
exergetic analysis review and performance evaluation of solar, wind, geothermal and
other renewable energy resources.
In the literature, there exist a number of publications on the exergetic analysis of
thermal systems. Rashad & Maihy [1] analyzed the system components of the Shobra
El-Khima power plant in Cairo to quantify the sites having largest energy and exergy
losses. Ebadi & Gorji-Bandpy [11] performed a thermo-mechanical and chemical
exergy analysis for a116MW gas-turbine power plant located in Mahshahr, Iran.
Reddy et al. [5] performed thermodynamic analysis of coal based thermal power
plants and gas based cogeneration power plants using energy and exergy methods.
Lebele & Alawa [22] used energy and exergy models to evaluate the optimal
performance parameters of the 20MWgas turbine plant at Kolo-Creek power station,
and Kaushik et al. [19] presented a comparison between energy and exergy analysis of
University of Ghana http://ugspace.ug.edu.gh
Page 33
17
thermal power plants stimulated by coal and gas. In Ghana, Mborah and Gbadam [18]
evaluated the exergetic performance of the 500kW steam power plant operated at the
Benso Oil Palm plantation in Ghana.
The principles of using the second law of thermodynamics (SLT) and exergy methods
in the performance analyses of nuclear systems have been elaborated in literature
review. Lahey & Moody [3] used formulations of the SLT and entropy to analyze
energy processes found in BWRs in order to determine the loss of available power.
Todreas & Kazimi [23] developed working forms of the first law of thermodynamics
(FLT) and SLT to analyze control volume and control mass schemes and processes of
nuclear systems. Dincer [6] presented energy and exergy based comparison of coal
fired and nuclear steam power plants, detailing the stepwise breakdown of the energy
and exergy losses in the reactor core.
2.1 The First Law of Thermodynamics (FLT)
The first law of thermodynamics defines energy as a conserved quantity and is
expressed as:
𝐸𝑖𝑛 − 𝐸𝑜𝑢𝑡 = ∆𝐸𝑠𝑦𝑠 (2.1)
where𝐸𝑖𝑛 is the energy input, 𝐸𝑜𝑢𝑡 is the energy output and ∆𝐸𝑠𝑦𝑠 is the energy
change in the system.For a closed system, the only forms of energy that can be
supplied or removed from the system are heat and work. But the change in the total
energy of the system during a process is the sum of the changes in its internal, kinetic,
and potential energies. Therefore the closed system energy balance can be expressed
as:
𝑄 − 𝑊 = ∆𝑈 + ∆𝐾𝐸 + ∆𝑃𝐸 (2.2 )
University of Ghana http://ugspace.ug.edu.gh
Page 34
18
Where 𝑄 is thermal energy, 𝑊 is work, ∆𝑈 is change in internal energy,∆𝐾𝐸 and
∆𝑃𝐸 are respectively change in kinetic and potential energies. For a stationary system,
in which no velocity and elevation change during a process, the change of the total
energy of the system is due to the change of the internal energy only, i.e.
𝑄 − 𝑊 = ∆𝑈 (2.3)
In an open flow system there are three types of energy transfer across the control
surface, namely, work transfer, heat transfer, and energy associated with mass transfer
or flow [19].
2.1.1 Energy and Work
The fluid entering or leaving a control volume (𝑉) possess additional energy known
as flow work 𝑤𝑓𝑙𝑜𝑤 which is the work done due to pushing the entire fluid element
across the boundary into the control volume, and on a unit mass basis is given as,
𝑤𝑓𝑙𝑜𝑤 = 𝑃𝑉 (2.4)
where P is pressure. Thus the total specific energy (𝑒) of a flowing fluid becomes
[24],
𝑒 = 𝑃𝑉 + 𝑢 +𝑣2
2+ 𝑔𝑧 (2.5)
where𝑣 is velocity, 𝑔 is acceleration due to gravity and 𝑧 is elevation.
Since the specific enthalpy() is defined as,
= 𝑢 + 𝑃𝑉 (2.6)
University of Ghana http://ugspace.ug.edu.gh
Page 35
19
then,
𝑒 = +𝑣2
2+ 𝑔𝑧 (2.7)
2.1.2 Energy Balance
The conservation of energy principle applied to control volumes states that the time
rate of change in the total energy of a system 𝑑𝐸𝑐𝑣
𝑑𝑡 equals the net rate at which energy
is being transferred in by heat transfer and mass flow less the net rate at which energy
is being transferred out by work and is expressed as [25],
𝑑𝐸𝑐𝑣
𝑑𝑡= 𝑄 𝑐𝑣 − 𝑊
𝑐𝑣 + 𝑚 𝑖 𝑢𝑖 + 𝑝𝑖𝑉𝑖 +𝑣𝑖
2
2+ 𝑔𝑧𝑖
𝑖
− 𝑚 𝑒 𝑢𝑒 + 𝑝𝑒𝑉𝑒 +𝑣𝑒
2
2+ 𝑔𝑧𝑒
𝑒
(2.8)
where 𝑚 is mass flow rate, 𝑄 is heat transfer rate and 𝑊 is the rate of mechanical
energy transfer. Equation (2.8) is rewritten as
𝑑𝐸𝑐𝑣
𝑑𝑡= 𝑄 𝑐𝑣 − 𝑊
𝑐𝑣 + 𝑚 𝑖 𝑖 +𝑣𝑖
2
2+ 𝑔𝑧𝑖
𝑖
− 𝑚 𝑒 𝑒 +𝑣𝑒
2
2+ 𝑔𝑧𝑒 (2.9)
𝑒
For one dimensional flow through a single inlet and exit stream, the energy rate
balance reduces to:
𝑑𝐸𝑐𝑣
𝑑𝑡= 𝑄 𝑐𝑣 − 𝑊
𝑐𝑣 + 𝑚 𝑖 𝑖 +𝑣𝑖
2
2+ 𝑔𝑧𝑖 − 𝑚 𝑒 𝑒 +
𝑣𝑒2
2+ 𝑔𝑧𝑒 (2.10)
University of Ghana http://ugspace.ug.edu.gh
Page 36
20
The conservation of mass principle is therefore expressed as,
𝑑𝑚𝑠𝑦𝑠
𝑑𝑡 = 𝑚 𝑖
𝑖
− 𝑚 𝑒𝑒
(2.11)
At steady state there is no accumulation of mass within the control volume
(𝑑𝑚𝑐𝑣/𝑑𝑡 = 0). The mass rate balance takes the form
𝑚 𝑖 = 𝑚 𝑒 (2.12)
Further, at steady state 𝑑𝐸𝑐𝑣 /𝑑𝑡 = 0, therefore the energy rate balance can be written
as,
0 = 𝑄 𝑐𝑣 − 𝑊 𝑐𝑣 + 𝑚 𝑖 𝑖 +
𝑣𝑖2
2+ 𝑔𝑧𝑖 − 𝑚 𝑒 𝑒 +
𝑣𝑒2
2+ 𝑔𝑧𝑒 (2.13)
For the steady state flow from state 1→2, the mass flow balance reduces to,
𝑚 1 = 𝑚 2 (2.14)
and the energy rate balance becomes
𝑄 𝑐𝑣 − 𝑊 𝑐𝑣 = 𝑚 2 − 1 +
𝑣22 − 𝑣1
2
2 + 𝑔(𝑧2 − 𝑧1) (2.15)
2.2 The Second Law of Thermodynamics (SLT) and Entropy
Entropy is a randomized energy state that is unavailable to do work [6].According to
the SLT, it is impossible for any system to operate in a way that entropy is destroyed
[25].Entropy is an abstract property. However, its gradient, or change, can be used to
determine the loss of available power [3].
University of Ghana http://ugspace.ug.edu.gh
Page 37
21
The definition of entropy change (𝑑𝑆) for a system undergoing an internally
reversible process, expressed on a differential basis is [24]:
𝑑𝑆 = 𝑑𝑄
𝑇 𝑖𝑛𝑡𝑟𝑒𝑣
(2.16)
where 𝑑𝑄 is differential heat and 𝑇 is temperature.
For a fixed mass system, as shown in Fig. 2.1, which contains an amount of entropy,
S, with heat inflow 𝑑𝑄𝑅,𝑖𝑛 and outflow 𝑑𝑄𝑅,𝑜𝑢𝑡 at temperatures 𝑇𝑖𝑛 and 𝑇𝑜𝑢𝑡
respectively, the differential change of entropy is given as[3],
𝑑𝑆 =𝑑𝑄𝑅,𝑖𝑛
𝑇𝑖𝑛−
𝑑𝑄𝑅,𝑜𝑢𝑡
𝑇𝑜𝑢𝑡 (2.17)
where 𝑑𝑄𝑅 designates idealized reversible heat transfer without temperature gradients.
Fig. 2.1 A fixed mass, isolated system with heat transfer 𝑑𝑄 from region 1 at
temperature 𝑇and entropy S1, and region 2 at 𝑇(1 − 𝑏) and S2 respectively [3].
University of Ghana http://ugspace.ug.edu.gh
Page 38
22
If we assume one region of the isolated system is at uniform temperature 𝑇 , and the
other region is at 𝑇(1 − 𝑏) where 𝑏 is a small quantity, the temperature difference
causes a differential amount of heat transfer 𝑑𝑄 to occur from the region at higher
temperature to the lower one over an unspecified period of time. Since entropy is an
extensive property, the total system entropy is,
𝑆 = 𝑆1 + 𝑆2 (2.18)
Its differential 𝑑𝑆 is given as [3]
𝑑𝑆 = 𝑑𝑆1 + 𝑑𝑆2 = −𝑑𝑄
𝑇+
𝑑𝑄
𝑇(1 − 𝑏)=
𝑑𝑄
𝑇 𝑏 + 𝑏2 … ≥ 0 (2.19)
which shows that the system’s total entropy increases. Viewed from the microscopic
standpoint, the system becomes more disorderly as entropy increases.
As system undergoing a thermodynamic process from state 1→2 (See the
temperature-entropy diagram of Fig. 2.2) the increase of entropy principle states that,
∆𝑆 = 𝑆2 − 𝑆1 ≥ 𝛿𝑄
𝑇 (2.20)
2
1
The above expression can be expanded as:
∆𝑆 = 𝑆2 − 𝑆1 = 𝛿𝑄
𝑇
2
1
+ 𝑆𝑔𝑒𝑛 (2.21)
𝑒𝑛𝑡𝑟𝑜𝑝𝑦𝑐𝑎𝑛𝑔𝑒
𝑒𝑛𝑡𝑟𝑜𝑝𝑦𝑡𝑟𝑎𝑛𝑠𝑓𝑒𝑟
𝑒𝑛𝑡𝑟𝑜𝑝𝑦
𝑔𝑒𝑛𝑒𝑟𝑎𝑡𝑖𝑜𝑛
where 𝑆𝑔𝑒𝑛 is the entropy generated (or produced) within the system by the action of
irreversibilities [24]. Thus,
𝑆𝑔𝑒𝑛 = ∆𝑆𝑡𝑜𝑡𝑎 𝑙 = ∆𝑆𝑠𝑦𝑠 + ∆Ssurr (2.22)
University of Ghana http://ugspace.ug.edu.gh
Page 39
23
Fig. 2.2 T-S diagram of entropy change of internally reversible cycle.
2.2.1 Entropy Analysis
The elementary phenomena that generate entropy are: mechanical or hydraulic
friction, heat transfer with a finite temperature gradient, diffusion with a finite
gradient of concentration, and the mixing of substances with different parameters and
chemical composition [8].
Entropy is transferred by two mechanisms: heat transfer and mass flow. The entropy
transfer associated with heat transfer process is;
𝑆𝑒𝑎𝑡 = 𝛿𝑄
𝑇 (2.23)
2
1
With constant boundary temperature 𝑇, the above equation can be simplified as
University of Ghana http://ugspace.ug.edu.gh
Page 40
24
𝑆𝑒𝑎𝑡 = 𝑄
𝑇 (2.24)
The entropy transfer associated with mass flow is given by,
𝑆𝑚𝑎𝑠𝑠 = 𝑚𝑠 (2.25)
The general balance for entropy is stated as [6],
𝑒𝑛𝑡𝑟𝑜𝑝𝑦 𝑐𝑎𝑛𝑔𝑒 = 𝑒𝑛𝑡𝑟𝑜𝑝𝑦 𝑖𝑛𝑝𝑢𝑡 − 𝑒𝑛𝑡𝑟𝑜𝑝𝑦 𝑜𝑢𝑡𝑝𝑢𝑡 + 𝑒𝑛𝑡𝑟𝑜𝑝𝑦 𝑔𝑒𝑛𝑒𝑟𝑎𝑡𝑖𝑜𝑛,
ie. ∆𝑆 = 𝑆𝑖𝑛 − 𝑆𝑜𝑢𝑡 + 𝑆𝑔𝑒𝑛 (2.26)
For a control volume, the rate form of the entropy balance is derived as:
𝑑𝑆𝑐𝑣
𝑑𝑡=
𝑄𝑗
𝑇𝑗𝑗
+ 𝑚 𝑖𝑠𝑖
𝑖
− 𝑚 𝑒𝑠𝑒𝑒
+ 𝑆 𝑔𝑒𝑛 (2.27)
where the term 𝑄𝑗
𝑇𝑗 represents the time rate of entropy transfer through the portion of
the boundary whose instantaneous temperature is 𝑇𝑗 [25].
At steady state,𝑑𝑆𝑐𝑣
𝑑𝑡 = 0. For a control volume having a single inlet and outlet stream,
this leads to,
0 =𝑄
𝑇
+ 𝑚 𝑠𝑖 − 𝑠𝑒 + 𝑆 𝑔𝑒𝑛 (2.28)
The combined statement of the FLT and SLT, in differential form, for a closed system
undergoing an internally reversible process gives
𝑑𝑈 = 𝛿𝑄𝑟𝑒𝑣 − 𝛿𝑊𝑟𝑒𝑣 2.29
From equation (2.16) 𝛿𝑄𝑟𝑒𝑣 = 𝑇𝑑𝑠, and the only significant work in an internally
reversible process is associated with volume change and given as 𝛿𝑊𝑟𝑒𝑣 = 𝑝𝑑𝑉.
University of Ghana http://ugspace.ug.edu.gh
Page 41
25
Thus equation (2.29) can be rewritten on a unit mass basis as Gibbs equation:
𝑑𝑢 = 𝑇𝑑𝑠 − 𝑝𝑑𝑣 (2.30)
Introducing enthalpy, = 𝑢 + 𝑝𝑣, the differential yields
𝑑 = 𝑑𝑢 + 𝑝𝑑𝑣 + 𝑣𝑑𝑝
Replacing 𝑑𝑢 + 𝑝𝑑𝑣 with 𝑇𝑑𝑠 gives
𝑑 = 𝑇𝑑𝑠 + 𝑣𝑑𝑝 ( 2.31)
For the incompressible model, 𝑣 = 𝑐𝑜𝑛𝑠𝑡𝑎𝑛𝑡 and 𝑢 = 𝑢(𝑇). Thus,
𝑇, 𝑝 = 𝑢 𝑇 + 𝑝𝑣
Differentiating 𝑇, 𝑝 with respect to temperature at fixed pressure gives 𝑐𝑝 = 𝑐𝑣 =
𝑐, the common specific heat.
As equation (2.30) reduces to 𝑑𝑢 = 𝑇𝑑𝑠 and 𝑑𝑢 = 𝑐(𝑇)𝑑𝑇, the change in specific
entropy is [24]
∆𝑠 = 𝑐(𝑇)
𝑇
𝑇2
𝑇1
𝑑𝑇
= 𝑐 ln𝑇2
𝑇1 (2.32)
2.3 Exergy
Energy conservation, expressed by the energy balance, can determine energy supply
requirements in the form of streams of matter, heat and work, but fails to provide
accurate information on how efficiently the supplied energy is used in a system.
An entropy balance determines the entropy generation within a system which is a
University of Ghana http://ugspace.ug.edu.gh
Page 42
26
measure of the inefficiencies within it. However, entropy is an abstract concept which
does not allow us to develop objective measures of the efficiency with which energy
is used in a system.
In thermodynamics the true thermodynamic value (or quality) of an energy carrier is
characterized by its exergy. The ability to perform mechanical work has been
accepted as a measure of the quality of the energy form, characterizing its ability to be
transformed to into other kinds of energy. The concept of exergy is derived from the
SLT and defined as the maximum theoretical work obtainable from an overall system
consisting of a system and the environment as the system comes into equilibrium with
the environment [25].
In comparison with energy, exergy is a function of state of the considered matter and
of the environment [26], and identifies the loss of available energy in conversion
systems by accurately quantifying the entropy generation or irreversibilities within it.
There are many effects whose presence during a process renders it irreversible. These
include but are not limited to [24] (i) heat transfer through a finite temperature
difference, (ii) unrestrained expansion of a gas or liquid to a lower pressure, (iii)
spontaneous chemical reaction, (iv) mixing of matter at different compositions or
states, (v) friction, (vi) electric current flow through a resistance, (vii) magnetization,
(viii) inelastic deformation.
Exergy is evaluated with respect to a reference environment which acts as a sink for
heat and materials. The reference environment is a large equilibrium system, in which
the state variables(𝑇𝑜 and𝑃𝑜) and the chemical potential of the chemical components
contained in it remain constant [7]. Thus, the intensive properties of the reference
environment determine the exergy of a system. [6].
University of Ghana http://ugspace.ug.edu.gh
Page 43
27
2.3.1 Exergy and Work
A system will deliver the maximum possible work if it undergoes a reversible process
from the specified initial state to its dead state. This work represents the useful work
potential of the system at the specified initial state and is called exergy of the
specified initial state [27].
A system contains energy in numerous forms such as kinetic energy, potential energy,
internal energy, flow work and enthalpy. The exergy of a system is the sum of the
exergies of different forms of energy it contains. The relations between the exergy
associated with different energy forms are developed below.
Kinetic energy and potential energy are forms of mechanical energy and can be
completely converted to work regardless of the surroundings. Thus the specific exergy
(𝑥) of these forms is given by
𝑥𝑘𝑒 = 𝑘𝑒 = 𝑣2 2 (2.33)
𝑥𝑝𝑒 = 𝑝𝑒 = 𝑔𝑧 (2.34)
Useful work is defined as the difference between the actual work and the surrounding
work and expressed in differential form as,
𝛿𝑊𝑢 = 𝛿𝑊 − 𝛿𝑊𝑠𝑢𝑟𝑟 (2.35)
where,
𝛿𝑊𝑠𝑢𝑟𝑟 = 𝑃𝑜𝑑𝑉 (2.36)
From the entropy relation (equation 2.30),
University of Ghana http://ugspace.ug.edu.gh
Page 44
28
𝑇𝑑𝑆 = 𝑑𝑈 + 𝛿𝑊 (2.37)
This implies that,
𝛿𝑊𝑢 = 𝑇𝑑𝑆 − 𝑑𝑈 − 𝑃𝑜𝑑𝑉 (2.38)
Integrating from the initial to the final state gives the exergy associated with internal
energy as:
𝑊𝑢 ,𝑡𝑜𝑡𝑎𝑙 = 𝑈 − 𝑈𝑜 + 𝑃𝑜 𝑉 − 𝑉𝑜 − 𝑇𝑜 𝑆 − 𝑆𝑜 (2.39)
Flow work is essentially boundary work, and the exergy of flow work equals the
exergy of boundary work, which is the difference between the boundary work 𝑃𝑉 and
the surroundings work 𝑃𝑜𝑉. On a unit mass basis,
𝑥𝑝𝑣 = 𝑃𝑉 − 𝑃𝑜𝑉 (2.40)
where 𝑉 is the specific volume.
Enthalpy is defined as the sum of internal energy and flow work. The specific
enthalpy is given as
= 𝑢 + 𝑃𝑉 (2.41)
Thus the exergy associated with enthalpy is given as
𝐸𝑥 = 𝐸𝑥𝑢 + 𝐸𝑥𝑝𝑣 (2.42)
On a unit mass basis [27],
𝑥 = (𝑢 − 𝑢𝑜) + 𝑃𝑜(𝑉 − 𝑉𝑜) − 𝑇𝑜(𝑠 − 𝑠𝑜) + (𝑃𝑉 − 𝑃𝑜𝑉)
= − 𝑜 − 𝑇𝑜 𝑠 − 𝑠𝑜 (2.43)
The total exergy of a system is made up of four components namely physical exergy,
University of Ghana http://ugspace.ug.edu.gh
Page 45
29
kinetic exergy, potential exergy and chemical exergy [21].
𝐸𝑥 = 𝐸𝑥𝑝 + 𝐸𝑥𝑘𝑒 + 𝐸𝑥𝑝𝑒 + 𝐸𝑥𝑐 (2.44)
Neglecting chemical energy, the exergy of a steady flow stream of matter (𝐸𝑥𝑓) is the
sum of kinetic, potential and physical exergy respectively [19]. This is also known as
the thermo-mechanical exergy. The kinetic and potential energy are almost equivalent
to exergy, and were given from equations (2.33) and (2.34) as,
𝐸𝑥𝑘𝑒 = 𝐾𝐸 (2.45)
𝐸𝑥𝑝𝑒 = 𝑃𝐸 (2.46)
The physical exergy of a flow process is given from equation (2.43) as,
𝐸𝑥𝑝 = 𝐻 − 𝐻𝑜 − 𝑇𝑜 𝑆 − 𝑆𝑜 (2.47)
Thus the specific exergy (𝑥𝑓) of a steady flow stream is given as,
𝑥𝑓 = − 𝑜 − 𝑇𝑜 𝑠 − 𝑠𝑜 + 𝑣2 2 + 𝑔𝑧 (2.48)
2.3.2 Exergy, Heat Transfer and Work
Heat transfer is always accompanied by exergy transfer. The maximum work that can
be obtained from a heat source at constant temperature 𝑇 is the work output from a
Carnot heat engine which works between this heat source and the environment at 𝑇𝑜
[27]. The Carnot efficiency of the Carnot heat engine is given as,
𝜂𝑡 = 1 −𝑇𝑜
𝑇 (2.49)
Therefore, the exergy of the heat 𝑄 transferred is given as,
University of Ghana http://ugspace.ug.edu.gh
Page 46
30
𝐸𝑥𝑞 = 1 −𝑇𝑜
𝑇 𝑄 (2.50)
When the temperature at the location of heat transfer is not constant, the exergy
transfer accompanying heat transfer is
𝐸𝑥𝑞 = 1 −𝑇𝑂
𝑇 𝛿𝑄 (2.51)
Exergy transfer by shaft work or electric work is equal to the work itself and is given
as
𝐸𝑥𝑤 = 𝑊 (2.52)
The exergy transfer accompanying boundary or expansion work equals the difference
between the expansion work and the surrounding work. That is:
𝐸𝑥𝑤 ,𝑏 = 𝑊 − 𝑃𝑜 𝑉2 − 𝑉1 (2.53)
Mass contains exergy as well as energy and entropy. The rate of exergy transfers to or
from a system is proportional to the flow rate. When a mass m enters or leaves a
system, exergy m𝑥𝑓𝑙𝑜𝑤 enters or leaves a system as well. Thus
𝐸𝑥𝑚 = 𝑚𝑥𝑓𝑙𝑜𝑤 = 𝑚 − 𝑜 − 𝑇𝑜 𝑠 − 𝑠𝑜 + 𝑣2 2 + 𝑔𝑧 (2.54)
2.3.2 Exergy Destruction and Irreversibility
The exergy destruction represents the exergy destroyed 𝐼𝑑 due to irreversibilities
within a system. Irreversibilities are effects whose presence during a process renders it
irreversible. A process is irreversible if there is no way to restore the system and its
surroundings to their exact initial states [24].
There are many effects whose presence during a process renders it irreversible. These
University of Ghana http://ugspace.ug.edu.gh
Page 47
31
include mechanical or hydraulic friction, heat transfer with a finite temperature
gradient, diffusion with a finite gradient of concentration, and the mixing of
substances with different composition [8].
The exergy destruction (or irreversibility) 𝐼𝑑 within a system is related to the entropy
generation by the Gouy-Stodola theorem given as [19],
𝐼𝑑 = 𝑇𝑜𝑆𝑔𝑒𝑛 (2.55)
There are two types of irreversibilities created within a system. These are internal and
externally generated irreversibilities. Internal exergy losses appear inside the analyzed
process. The primary contributors to internal exergy destruction are irreversibilities
associated with chemical reaction, heat transfer, mixing of streams, and friction [10].
External exergy losses occur after the rejection of waste products of the process to the
environment [26]. When a material or energy stream is rejected to the surroundings
(eg. flue gas, cooling water and heat loss), the exergy associated with this stream is an
external exergy loss for the overall system.
For component analysis, the transfer of thermal exergy to the surroundings is the only
external exergy loss in the system. Let the term 𝑄 𝐿 denotes the heat transfer to the
surroundings and 𝑇𝐿 the temperature on the boundary where heat transfer occurs.
The control volume enclosing the system component can be selected to encompass the
system component and enough of its nearby surroundings so that the heat loss occurs
at the ambient temperature 𝑇𝑜 and the term 𝐸𝑥 𝑞 ,𝐿 in an exergy balance vanishes. Thus
the thermodynamic inefficiencies in a system component consist exclusively of
internal exergy destruction [10].
University of Ghana http://ugspace.ug.edu.gh
Page 48
32
𝐸𝑥 𝑞 ,𝐿 = 1 −𝑇𝑜
𝑇𝐿 𝑄 𝐿 (2.56)
Irreversibility (total exergy loss) is defined as the difference between the reversible
work and the useful work. It is expressed as [27]
𝐼 = 𝑊𝑟𝑒𝑣 ,𝑜𝑢𝑡 –𝑊𝑢 ,𝑜𝑢𝑡
= 𝑊 𝑢 ,𝑚𝑎𝑥 − 𝑊
𝑎𝑐𝑡𝑢𝑎𝑙 (2.57)
Where the useful work is defined as
𝑊𝑢 = 𝑊 − 𝑊𝑠𝑢𝑟𝑟
Alternatively exergy consumption (or destruction) is expressed as the difference
between the total exergy flows into and out of the system, less the exergy
accumulation in the system (or component) and given mathematically as [6].
Exergy consumption =Exergy input – Exergy output – Exergy accumulation
At steady state, the accumulation term vanishes and the irreversibility of a process can
be defined as the difference between the desired exergy outputs and the total exergy
inputs [28], i.e.
𝐼 = 𝐸𝑥𝑖𝑛 − 𝐸𝑥𝑜𝑢𝑡 (2.58)
The exergy destruction in the overall system is equal to the sum of the exergy
destruction in all system components [7]
University of Ghana http://ugspace.ug.edu.gh
Page 49
33
2.3.3 Exergy Balance
By combining the conservation law for energy and the non-conservation law for
entropy for a system with inlet 𝑖 and outlet 𝑒 streams, the exergy balance can be
expressed as:
∆𝐸𝑥 = 𝐸𝑥𝑄𝑗 −𝑗
𝐸𝑥𝑊 + 𝐸𝑥𝑚𝑖
𝑖
− 𝐸𝑥𝑚𝑒
𝑒
− 𝐼𝑑 (2.59)
The exergy balance is expanded in rate form for a control volume as [25],
𝑑𝐸𝑥𝑐𝑣
𝑑𝑡= 1 −
𝑇𝑜
𝑇𝑗 𝑄 𝑗 −
𝑗
𝑊 𝑐𝑣 − 𝑝𝑜
𝑑𝑉𝑐𝑣𝑑𝑡
+ 𝑚 𝑖𝑖
𝑥𝑓𝑖 − 𝑚 𝑒𝑒
𝑥𝑓𝑒 − 𝐼 𝑑
(2.60)
At steady state, 𝑑𝐸𝑥𝑐𝑣/𝑑𝑡 = 𝑑𝑉𝑐𝑣/𝑑𝑡 = 0, giving the steady-state exergy rate
balance as,
0 = 1 −𝑇𝑜
𝑇𝑗 𝑄 𝑗 −
𝑗
𝑊 𝑐𝑣 + 𝑚 𝑖
𝑖
𝑥𝑓𝑖 − 𝑚 𝑒𝑒
𝑥𝑓𝑒 − 𝐼 𝑑 (2.61)
For a single inlet and exit stream, denoted by process 1→2, the steady-state exergy
rate balance reduces to,
0 = 1 −𝑇𝑜
𝑇𝑗 𝑄 𝑗 −
𝑗
𝑊 𝑐𝑣 + 𝑚 (𝑥𝑓1 − 𝑥𝑓2) − 𝐼 𝑑 (2.62)
or,
1 −𝑇𝑜
𝑇𝑗 𝑄 𝑗
𝑗
= 𝑊 𝑐𝑣 + 𝑚 (𝑥𝑓2 − 𝑥𝑓1) + 𝐼 𝑑 (2.63)
University of Ghana http://ugspace.ug.edu.gh
Page 50
34
where the change in specific flow exergy is expanded as,
𝑥𝑓1 − 𝑥𝑓2 = 1 − 2 − 𝑇𝑜 𝑠1 − 𝑠2 +𝑣1
2 − 𝑣22
2+ 𝑔 𝑧1 − 𝑧2
Closed systems only have heat transfer and work interactions with no mass flow out
of the system. The exergy rate balance therefore reduces to
𝑊 = 1 −𝑇𝑜
𝑇𝑗 𝑄 𝑗
𝑗
− 𝐼 𝑑 (2.64)
2.4 First and Second Law Efficiency Ratios
The energy balance for a system undergoing a thermodynamic cycle with no net
change in its energy is given by,
𝑊 𝑐𝑦𝑐𝑙𝑒 = 𝑄 𝑖𝑛 − 𝑄 𝑜𝑢𝑡 (2.65)
where 𝑊 𝑐𝑦𝑐𝑙 𝑒 is the net work output by the cycle.
The thermal or energy efficiency 𝜂 of such a system is defined as [23],
𝜂 =𝑊
𝑐𝑦𝑐𝑙𝑒
𝑄 𝑖𝑛=
𝑊 𝑎𝑐𝑡𝑢𝑎𝑙
𝑄 𝑖𝑛 (2.66)
where 𝑄 𝑖𝑛 is the rate of heat addition to the system, and 𝑊 𝑎𝑐𝑡𝑢𝑎𝑙 is the useful, actual
work done by the cycle .
For adiabatic systems the thermal efficiency is not a useful measure of system
performance [23]. The thermodynamic or exergy efficiency of a system is defined as,
𝜓 =𝑊
𝑎𝑐𝑡𝑢𝑎𝑙
𝑊 𝑢 ,𝑚𝑎𝑥
(2.67)
University of Ghana http://ugspace.ug.edu.gh
Page 51
35
An adiabatic process is isentropic when the process is reversible. In this case the
quantity 𝑊 𝑢 ,𝑚𝑎𝑥 |𝑄 =0 represents the useful, maximum work associated with the
reversible adiabatic (and hence isentropic) process [23].
The isentropic efficiency 𝜂𝑠 of the process is therefore expressed as [23]:
𝜂𝑠 =𝑊
𝑎𝑐𝑡𝑢𝑎𝑙
𝑊 𝑢 ,𝑚𝑎𝑥 |𝑄 =0
(2.68)
2.5 Heat Engines
Heat engines are systems which convert heat to work. Operating on a cycle, heat
received from a high-temperature source is partially converted to work, while the
remaining energy is rejected as waste heat to a low-temperature sink [27].
A steam power plant is an example of a heat engine. The steam cycle of the plant
consists of the following processes.
Heat (𝑄𝑖𝑛 ) is transferred to the steam in the boiler orheat exchanger from a
furnace, which is the energy source;
The turbine produces work (𝑊𝑜𝑢𝑡 ) when steam passes through it;
A condenser transfers the waste heat (𝑄𝑜𝑢𝑡 ) from steam to the energy sink,
such as the atmosphere;
A pump is used to carry the water from the condenser back to the boiler. Work
(𝑊𝑖𝑛 ) is required to compress water to boiler pressure [27].
The Carnot Cycle is the most efficient cycle for any given source and sink
temperatures of a heat engine and represents a reversible power cycle in which heat is
University of Ghana http://ugspace.ug.edu.gh
Page 52
36
added from an external source at a constant temperature 𝑇𝐻 (process 2-3 of Fig. 2.3)
and rejected to the surroundings at a constant temperature 𝑇𝐶 (process 4-1of Fig. 2.3)
[24, 29].
The Carnot efficiency for a cycle operating between two thermal reservoirs at high
temperature 𝑇𝐻 and low temperature 𝑇𝐶 is obtained from equation (2.49) as,
Carnot efficiency, 𝜂𝑡 = 1 −𝑇𝐶
𝑇𝐻
Thus the Carnot efficiency can predict the operating characteristics of a plant since
efficiency of the cycle will be increased if the value of 𝑇𝐻 is increased or the value of
𝑇𝐶 is reduced [29].
Fig.2.3 T-S diagram of the Carnot Cycle [24].
University of Ghana http://ugspace.ug.edu.gh
Page 53
37
2.5.1 Rankine and Brayton Cycles
In their simplest configurations vapour and gas turbine power plants are represented
in terms of four components in series forming, respectively, the Rankine cycle and the
Brayton cycle shown schematically in Fig. 2.4.
The ideal cycle through the four components, devoid of irreversibilities and pressure
drops [27], consists of four internally reversible processes in series: two isentropic
processes in a turbine and pump alternated with two constant pressure processes in a
boiler and condenser as illustrated in Fig. 2.4.
2.7 Nuclear Energy Production
The energy released in a nuclear reactor is produced by exothermic nuclear reactions
in which an atomic nucleus of initial mass M is transformed into nuclei of mass M’
and the difference in mass is released as energy [30]. This is expressed
mathematically as:
𝐸 = 𝑀 − 𝑀’ 𝑐2
where 𝑐 is the speed of light.
A typical nuclear reaction equation for fission resulting from neutron absorption in U-
235 is represented by [30]:
𝑛 + 𝑈 𝑈∗92
23692
235 𝑋𝑒54 139 + 𝑆𝑟38
95 + 2𝑛 + 𝛾 (2.69)
The fission of U-235 yields about 200 MeV of energy (corresponding to a mass loss
of nearly 0.2 u). This appears as kinetic and decay energy of the fission fragments,
University of Ghana http://ugspace.ug.edu.gh
Page 54
38
Fig. 2.4 Schematic and process diagrams of Rankine (a) and Brayton (b) cycles [24].
University of Ghana http://ugspace.ug.edu.gh
Page 55
39
kinetic energy of the newborn neutrons, and energy of emitted𝛾-rays and neutrinos
[23].
The fission products moving through the reactor impart thermal energy to the core
through interactions with the surrounding matter. The distribution of energy released
over the reaction products, and the principal positions of energy deposition within the
various parts of the reactor is shown in Table 2.1.
The energy produced in a reactor core is expressed by the core power, which
represents the fraction of recoverable energy deposited in the fuel. In thermal reactors,
assuming average values for thermal flux 𝜙𝑡 and macroscopic fission Ʃf cross section
for fissile atoms in a reactor of volume 𝑉 𝑚3 [31],
𝑡𝑜𝑡𝑎𝑙 𝑛𝑢𝑚𝑏𝑒𝑟 𝑜𝑓𝑓𝑖𝑠𝑠𝑖𝑜𝑛𝑠 = 𝑉 𝜙𝑡𝑓
(2.70)
Given that a fission rate of 3.1*1010 𝑓𝑖𝑠𝑠𝑖𝑜𝑛𝑠/𝑠 is required to produce 1 watt of
thermal power, the thermal reactor power 𝑃𝑡 is expressed as [31]:
𝑃𝑡 =𝑉 𝜙𝑡𝑓
3.1 ∗ 1010 (2.71)
On the whole, the energy, entropy, exergy and nuclear principles and theorems
formulated thus far, form the foundations for the comprehensive analysis of energy
systems. The applications of these derivations in nuclear heat conversion systems and
other heat exchanger assemblies were pursued in subsequent chapters to determine the
energy and exergy utilization characteristics of nuclear power systems.
University of Ghana http://ugspace.ug.edu.gh
Page 56
40
Table 2.1 Approximate energy distribution and deposition resulting from a typical U-
235 fission [23, 30].
Energy Source
Energy Released
Energy Deposited in Core Principal Position of
Energy Deposition
(MeV) (MeV) (%)
Fission
I. Instantaneous Energy
Kinetic energy of lighter fission fragment
100 100 50 Fuel
kinetic energy of heavier fission fragment
67 67 33.5 Fuel
Kinetic energy of fission neutrons
5 5 2.5 Moderator
Energy of prompt gamma rays
6 6 3 Fuel and structures
II. Delayed Energy
Beta particle energy gradually released from fission products
22
8 4 Fuel
Gamma ray energy gradually released from fission products
6 3 Fuel and structures
Neutrinos - - Non-recoverable
Neutron Capture
III. Instantaneous and delayed Energy
Radiative capture of excess fission neutrons
- 8 4 Fuel and structures
Total 200 200 100
University of Ghana http://ugspace.ug.edu.gh
Page 57
41
CHAPTER THREE
RESEARCH METHODOLOGY
Analysis of the nuclear power plant was done in two stages. Firstly, analysis of the
reactor core was carried out to determine the efficiencies of the nuclear heat
conversion systems, and then the entire power cycle (steam cycle) of the power plant
was assessed to establish the efficiencies of various plant components.
3.1 Analysis of Energy and Exergy Loss in a Generic Nuclear Reactor Core
3.1.1 Reactor Energy Analysis
The steady state form of the energy rate balance for the reactor was derived from the
energy balance for an open flow system as,
0 = 𝑄 𝑛𝑒𝑡 − 𝑊 𝑛𝑒𝑡 + 𝑚 𝑖 𝑖 +
𝑣𝑖2
2+ 𝑔𝑧𝑖 − 𝑚 𝑒 𝑒 +
𝑣𝑒2
2+ 𝑔𝑧𝑒 (2.13)
The reactor core has zero shaft work. Thus the steady state form of the energy rate
balance for the reactor core was obtained by equating the net rate of heat transfer to
the coolant to the net rate of coolant mass transfer across the reactor, expressed as,
𝑄 𝑛𝑒𝑡 = 𝑚 𝑒 − 𝑖 (3.1)
where 𝑚 is the steady state coolant mass flow rate, and 𝑖 and 𝑒 are the inlet and
exit enthalpy values respectively. Operating at full power (𝑄 𝑓𝑖𝑠𝑠𝑖𝑜𝑛 ) the energy rate
balance was expressed as,
𝑄 𝑓𝑖𝑠𝑠𝑖𝑜𝑛 − 𝑄 𝑙𝑜𝑠𝑠 = 𝑚 𝑒 − 𝑖 (3.2)
where the energy loss rate was given by 𝑄 𝑙𝑜𝑠𝑠 . Thus,
𝑄 𝑙𝑜𝑠𝑠 = 𝑄 𝑓𝑖𝑠𝑠𝑖𝑜𝑛 − 𝑚 𝑒 − 𝑖 (3.3)
University of Ghana http://ugspace.ug.edu.gh
Page 58
42
From the definition of the first law of thermodynamics, the energy efficiency of the
reactor core (𝜂𝑅) was written as,
𝜂𝑅 =𝑚 𝑒 − 𝑖
𝑄 𝑓𝑖𝑠𝑠𝑖𝑜𝑛= 1 −
𝑄 𝑙𝑜𝑠𝑠
𝑄 𝑓𝑖𝑠𝑠𝑖𝑜𝑛 (3.4)
3.1.2 Reactor Exergy Analysis
The energy and exergy utilization processes that occur within a water cooled nuclear
reactor, assuming typical power reactor fuel meat of Fig. 3.1, are illustrated in Fig.
3.2. Ignoring fission heat deposition outside the fuel element, the process consists of
heating of the fuel pellets to their maximum temperature, transfer of the heat within
the fuel pellets to the surface of the pellets, transfer of heat from the surface of the fuel
pellets to the cladding outer surface, and the transfer of heat from the cladding surface
to the primary coolant. The breakdown of the energy and exergy losses in the reactor
core therefore is modelled according to flow schematic of Fig. 3.2.
Fig. 3.1 Typical power reactor fuel [23].
University of Ghana http://ugspace.ug.edu.gh
Page 59
43
Fig. 3.2 Energy (𝑄) and exergy (𝐸𝑥) flows in a generic nuclear reactor with inlet and
exit coolant temperatures given as 𝑇𝑖 and 𝑇𝑒 respectively [6].
University of Ghana http://ugspace.ug.edu.gh
Page 60
44
The total irreversible loss (𝐼 𝑟𝑒𝑎𝑐𝑡𝑜𝑟 ) experienced by the reactor core was derived as a
summation of the exergy losses at the various stages of energy transfer in the core.
Assuming a reference- environment temperature𝑇𝑜 , 𝐼 𝑟𝑒𝑎𝑐𝑡𝑜𝑟 was evaluated as follows:
Upon fissioning and with respect to fission products, each fission fragment at steady
was regarded as having a kinetic energy of about 100 MeV [23], and if considered a
perfect gas in a thermodynamic equilibrium state, the fragment would have a
temperature 𝑇𝑎 such that 3
2𝑘𝑇𝑎 = 100 𝑀𝑒𝑉 [23].
The maximum work done by the fragment in a reversible process brings the fragment
to a state of mutual equilibrium with the environment at 𝑇𝑜 = 298𝑜𝐾 or 𝑘𝑇𝑜 =
0.025 𝑒𝑉. At the environment state, the energy of the fragment is 𝑢𝑜 = 0.0375 𝑒𝑉.
The maximum work per unit mass of fission fragment was expressed as [23]:
𝑊𝑢 ,𝑚𝑎𝑥 = 𝑎 − 𝑜 − 𝑇𝑜 𝑠𝑎 − 𝑠𝑜 (3.5)
which was approximated as:
𝑊𝑢 ,𝑚𝑎𝑥 = 𝑢𝑎 − 𝑢𝑜 − 𝑐𝑇𝑜In𝑇𝑎
𝑇𝑜 (3.6)
Since 𝑇𝑎>>𝑇𝑜 ,
𝑊𝑢 ,𝑚𝑎𝑥 ≈ 𝑢𝑎 (3.7)
i.e.
(𝑊 𝑢 ,max )𝑓𝑖𝑠𝑠𝑖𝑜𝑛 ≈ 𝑄 𝑓𝑖𝑠𝑠𝑖𝑜𝑛 (3.8)
Thus the maximum useful power available as a result of fission equalled the
fission power and the irreversibility of fission 𝐼 𝑓𝑖𝑠𝑠𝑖𝑜𝑛 was zero.
University of Ghana http://ugspace.ug.edu.gh
Page 61
45
The maximum power available from the fuel rod at maximum operating temperature
𝑇𝑚𝑎𝑥 was obtained from equation (2.50) as:
(𝑊 𝑢 ,max )𝑓𝑢𝑒𝑙 = 𝑄 𝑓𝑖𝑠𝑠𝑖𝑜𝑛 1 −𝑇𝑜
𝑇𝑚𝑎𝑥 (3.9)
The irreversibility in heating the fuel rod was derived from equation (2.57) as,
𝐼 𝑓𝑢𝑒𝑙 = (𝑊 𝑢 ,max )𝑓𝑖𝑠𝑠𝑖𝑜𝑛 − (𝑊 𝑢 ,𝑚𝑎𝑥 )𝑓𝑢𝑒𝑙 = (𝑊 𝑢 ,𝑚𝑎𝑥 )𝑓𝑖𝑠𝑠 𝑖𝑜𝑛 𝑇𝑜
𝑇𝑚𝑎𝑥 (3.10)
The maximum useful work available from the outer surface of the fuel pellet surface
at temperature 𝑇𝑝was:
(𝑊 𝑢 ,max )𝑝𝑒𝑙𝑙𝑒𝑡 = 𝑄 𝑓𝑖𝑠𝑠𝑖𝑜𝑛 1 −𝑇𝑜
𝑇𝑝 (3.11)
The exergy loss or irreversibility in heating the fuel clad was given as,
𝐼 𝑝𝑒𝑙𝑙𝑒𝑡 = (𝑊 𝑢 ,max )𝑓𝑢𝑒𝑙 − (𝑊 𝑢 ,max )𝑝𝑒𝑙𝑙𝑒𝑡 (3.12)
The maximum useful work available from the outer surface of the fuel clad at
temperature 𝑇𝑐was:
(𝑊 𝑢 ,max )𝑐𝑙𝑎𝑑 = 𝑄 𝑓𝑖𝑠𝑠𝑖𝑜𝑛 1 −𝑇𝑜
𝑇𝑐 (3.13)
The irreversible loss in heating the fuel clad was given by,
𝐼 𝑐𝑙𝑎𝑑 = (𝑊 𝑢 ,max )𝑝𝑒𝑙𝑙𝑒𝑡 − (𝑊 𝑢 ,max )𝑐𝑙𝑎𝑑 (3.14)
University of Ghana http://ugspace.ug.edu.gh
Page 62
46
From the fuel rods, all the fission power was transferred to the coolant. The maximum
work available from the coolant was derived from equation (2.54), assuming
negligible kinetic and potential energy changes, as:
(𝑊 𝑢 ,max )𝑐𝑜𝑜𝑙𝑎𝑛𝑡 = 𝑚 𝑒 − 𝑖 − 𝑇𝑜 𝑠𝑒 − 𝑠𝑖 (3.15)
The exergy loss or irreversibility in heating the coolant was:
𝐼 𝑐𝑜𝑜𝑙 𝑎𝑛𝑡 = (𝑊 𝑢 ,max )𝑐𝑙𝑎𝑑 − (𝑊 𝑢 ,max )𝑐𝑜𝑜𝑙𝑎𝑛𝑡 (3.16)
Hence the total irreversibility of the reactor core was given as:
𝐼 𝑟𝑒𝑎𝑐𝑡𝑜𝑟 = 𝐼 𝑓𝑖𝑠𝑠𝑖𝑜𝑛 + 𝐼 𝑓𝑢𝑒𝑙 + 𝐼 𝑝𝑒𝑙𝑙 𝑒𝑡 + 𝐼 𝑐𝑙𝑎𝑑 + 𝐼 𝑐𝑜𝑜𝑙𝑎𝑛𝑡 (3.17)
Given the total reactor irreversibility, the exergy efficiency of the reactor core 𝜓𝑅
was derived as,
𝜓𝑅 = 1 −𝐼 𝑟𝑒𝑎𝑐𝑡𝑜𝑟
(𝑊 𝑢 ,max )𝑓𝑖𝑠𝑠𝑖𝑜𝑛
(3.18)
3.3 Analysis of Energy and Exergy Loss in AP1000 Reactor Core
Operating under full power conditions, the steady state fuel temperature distribution
within the AP1000 reactor core was assumed to be maximum at the fuel centerline at
Tmax (1339.9oC) [4], and fell to temperature Tc (315.75
oC) [4] at the fuel cladding
surface.Taking the coolant flow as a single inlet and single exit stream, denoted by
states 1 and 2 respectively, the AP1000 reactor core was modeled as depicted in Fig.
3.3, based on a simplification of the generic flow diagram of Fig. 3.2. The main
operational data for the AP1000 reactor core was presented in Table 3.1.
University of Ghana http://ugspace.ug.edu.gh
Page 63
47
Fig.3.3 Schematic of energy and exergy flows in AP1000 reactor core, where 𝑇1 ≠ 𝑇2
and 𝑃1 = 𝑃2.
University of Ghana http://ugspace.ug.edu.gh
Page 64
48
Table 3.1 AP1000 plant data [32]
University of Ghana http://ugspace.ug.edu.gh
Page 65
49
The energy rate balance for the AP1000 reactor operating at core power (𝑄 𝑓𝑖𝑠𝑠𝑖𝑜𝑛 )
was given by equation (3.2) as,
𝑄 𝑙𝑜𝑠𝑠 = 𝑄 𝑓𝑖𝑠𝑠𝑖𝑜𝑛 − 𝑚 2 − 1 (3.19)
From equation (3.4) the energy efficiency was derived as,
𝜂𝑅 = 1 −𝑄 𝑙𝑜𝑠𝑠
𝑄 𝑓𝑖𝑠𝑠𝑖𝑜𝑛 =
𝑚 2 − 1
𝑄 𝑓𝑖𝑠𝑠𝑖𝑜𝑛 (3.20)
The steady state form of the exergy rate balance for the AP1000 reactor core at the
clad-coolant boundary was derived from equation (2.62) as,
(𝑊 𝑢 ,𝑚𝑎𝑥 )𝑐𝑙𝑎𝑑 = 𝑚 (𝑥𝑓2 − 𝑥𝑓1) + 𝐼 𝑐𝑜𝑜𝑙𝑎𝑛𝑡 (3.21)
From equation (3.13) and equation (3.8),
1 −𝑇𝑜
𝑇𝑐 (𝑊 𝑢 ,𝑚𝑎𝑥 )𝑓𝑖𝑠𝑠𝑖𝑜𝑛 = 𝑚 (𝑥𝑓2 − 𝑥𝑓1) + 𝐼 𝑐𝑜𝑜𝑙𝑎𝑛𝑡 (3.22)
which was expanded as,
(𝑊 𝑢 ,𝑚𝑎𝑥 )𝑓𝑖𝑠𝑠𝑖𝑜𝑛 − 𝑇𝑜
𝑇𝑐 (𝑊 𝑢 ,𝑚𝑎𝑥 )𝑓𝑖𝑠𝑠𝑖𝑜𝑛 = 𝑚 (𝑥𝑓2 − 𝑥𝑓1) + 𝐼 𝑐𝑜𝑜𝑙𝑎𝑛𝑡 (3.23)
The irreversibility in heating the clad was given as,
𝐼 𝑐𝑙𝑎𝑑 = (𝑊 𝑢 ,max )𝑓𝑢𝑒𝑙 − (𝑊 𝑢 ,𝑚𝑎𝑥 )𝑐𝑙𝑎𝑑 (3.24)
and expanded as,
𝐼 𝑐𝑙𝑎𝑑 = 1 −𝑇𝑜
𝑇𝑚𝑎𝑥 (𝑊 𝑢 ,𝑚𝑎𝑥 )𝑓𝑖𝑠𝑠𝑖𝑜𝑛 − 1 −
𝑇𝑜
𝑇𝑐 (𝑊 𝑢 ,𝑚𝑎𝑥 )𝑓𝑖𝑠𝑠𝑖𝑜𝑛
which reduced to,
University of Ghana http://ugspace.ug.edu.gh
Page 66
50
𝐼 𝑐𝑙𝑎𝑑 = 𝑇𝑜
𝑇𝑐 (𝑊 𝑢 ,𝑚𝑎𝑥 )𝑓𝑖𝑠𝑠𝑖𝑜𝑛 − 𝐼 𝑓𝑢𝑒𝑙 (3.25)
Thus from equation (3.25), equation (3.23) was rewritten as,
(𝑊 𝑢 ,𝑚𝑎𝑥 )𝑓𝑖𝑠𝑠𝑖𝑜𝑛 = 𝑚 (𝑥𝑓2 − 𝑥𝑓1) + 𝐼 𝑐𝑜𝑜𝑙𝑎𝑛𝑡 + 𝐼 𝑐𝑙𝑎𝑑 + 𝐼 𝑓𝑢𝑒𝑙 (3.26)
and expanded as,
(𝑊 𝑢 ,𝑚𝑎𝑥 )𝑓𝑖𝑠𝑠𝑖𝑜𝑛 = 𝑚 2 − 1 − 𝑇𝑜 𝑠2 − 𝑠1 + 𝐼 𝑓𝑢𝑒𝑙 + 𝐼 𝑐𝑙𝑎𝑑 + 𝐼 𝑐𝑜𝑜𝑙𝑎𝑛𝑡 (3.27)
or,
𝐼 𝑟𝑒𝑎𝑐𝑡𝑜𝑟 = 𝑄 𝑓𝑖𝑠𝑠𝑖𝑜𝑛 − 𝑚 2 − 1 − 𝑇𝑜 𝑠2 − 𝑠1 (3.28)
where, 𝐼 𝑟𝑒𝑎𝑐𝑡𝑜𝑟 = 𝐼 𝑓𝑢𝑒𝑙 + 𝐼 𝑐𝑙𝑎𝑑 + 𝐼 𝑐𝑜𝑜𝑙𝑎𝑛𝑡
From equation (3.18) the exergy efficiency of the AP1000 reactor core was given as,
𝜓𝑅 = 1 −𝐼 𝑟𝑒𝑎𝑐𝑡𝑜𝑟
(𝑊 𝑢 ,max )𝑓𝑖𝑠𝑠𝑖𝑜𝑛
(3.29)
3.4 Analysis of Energy and Exergy Loss in Simulation Model of AP1000 Plant.
The AP1000 power plant utilizes a regenerative vapour cycle whereby steam produced
in the steam generation section was passed through a series of high and low pressure
turbine generators attached to a transformer. Extraction steam from several points on
the turbine preheats feedwater in several low and high pressure heat exchangers and
one open deaerating heat exchanger. The process cycle for the AP1000 power cycle
was idealized with the simulation model shown in Fig. 3.4, which was derived from the
complete heat balance presented in Fig. 3.5 [17].
University of Ghana http://ugspace.ug.edu.gh
Page 67
51
The thermodynamic modelling of the subsystems of the AP1000 plant was initiated by
considering in turns the major components working under steady state. The analyses
were performed based on the following assumptions and simplifications:
Kinetic and potential energy changes were negligible for all processes.
Pump work as a contribution to net work output was insignificant
Frictional irreversibilities in the turbines were ignored (i.e. turbines had
mechanical efficiencies of 100 %.)
The reference environment model used had the following property values:
temperature 𝑇𝑜 =32 oC and pressure 𝑃𝑜=1atm.
Thus the only irreversibilities considered for all the plant components were internal
irreversibilities due to heat transfer.
3.4.1 Energy Analysis of AP1000 Components
The energy rate balances used to determine the energy losses in the components were
developed as presented below.
(a) The Energy Balance for the Turbine:
The turbine was made up of two sections: a high pressure stage (HPT) and a low
pressure stage (LPT). The energy rate balance for the high pressure turbine was given
as,
𝑊 𝐻𝑃𝑇 = 𝑚 3 3 − 4 + (𝑚3
− 𝑚4 ) 4 − 5 + (𝑚3 − 𝑚4 − 𝑚5 ) 5 − 6
− 𝐸𝑛𝑒𝑟𝑔𝑦 𝑙𝑜𝑠𝑠𝑝𝑡
(3.30)
University of Ghana http://ugspace.ug.edu.gh
Page 68
52
(a)
(b)
Fig. 3.4 (a) Simplified model of the AP1000 process cycle (b) T-S diagram of the
regenerative vapour cycle. The property data for the flow streams are listed in Table
4.1.
University of Ghana http://ugspace.ug.edu.gh
Page 69
53
Fig. 3.5 AP1000 steam and power conversion system with process data [17].
University of Ghana http://ugspace.ug.edu.gh
Page 70
54
The energy rate balance for the low pressure turbine was given by:
𝑊 𝐿𝑃𝑇 = 𝑚 7 7 − 8 + (𝑚7
− 𝑚 8) 8 − 9 + (𝑚7 − 𝑚 8 − 𝑚 9) 9 − 10
− 𝐸𝑛𝑒𝑟𝑔𝑦 𝑙𝑜𝑠𝑠𝑙𝑝𝑡
(3.31)
The total turbine work rate 𝑊 𝑇was expressed as,
𝑊 𝑇 = 𝑊
𝐻𝑃𝑇 + 𝑊 𝐿𝑃𝑇
Combining equations (3.30) and (3.31), the energy rate balance for the entire turbine
was derived as,
𝑊 𝑇 = 𝑚 3 3 − 4 + (𝑚3
− 𝑚4 ) 4 − 5
+(𝑚3 − 𝑚4 − 𝑚5 ) 5 − 6 + 𝑚 7 7 − 8
+(𝑚7 − 𝑚 8) 8 − 9
+(𝑚7 − 𝑚 8 − 𝑚 9) 9 − 10 − 𝐸𝑛𝑒𝑟𝑔𝑦 𝑙𝑜𝑠𝑠
(3.32)
where 𝐸𝑛𝑒𝑟𝑔𝑦 𝑙𝑜𝑠𝑠 was the total energy loss for the turbines.
(b) Steam Generator Energy Balance:
The energy rate balance for the steam generator was deduced as:
0 = 𝑚 1 2 − 1 − 𝑚3 15 − 3 − Energy loss
and the
Energy loss = 𝑚 1 2 − 1 − 𝑚 3 15 − 3 (3.33)
University of Ghana http://ugspace.ug.edu.gh
Page 71
55
(c) Energy balance of Closed Feedwater Heater No. 1 (CFH1):
The energy rate balance for the low pressure closed feedwater heater (1) was given
by:
0 = 𝑚 99 + 𝑚 1717 − 𝑚 11′ 12 − 11′ − 𝑚 1818 − Energy loss
and the
Energy loss = 𝑚 99 + 𝑚 1717 − 𝑚 11′ 12 − 11′ − 𝑚 1818 (3.34)
(d) Energy Balance of Closed Feedwater Heater No. 2 (CFH2):
The energy rate balance for the low pressure closed feedwater heater (2) was given
by:
0 = 𝑚 8 8 − 17 − 𝑚 12 13 − 12 − Energy loss
and
Energy loss = 𝑚 8 8 − 17 − 𝑚 12 13 − 12 (3.35)
(e) Energy Balance of Open Feedwater Heater (OFH):
The energy rate balance for the open feedwater heater was given by:
0 = 𝑚 55 + 𝑚 1616 + 𝑚 1313 − 𝑚 1414 − Energy loss
This gives:
Energy loss = 𝑚 55 + 𝑚 1616 + 𝑚 1313 − 𝑚 1414 (3.36)
University of Ghana http://ugspace.ug.edu.gh
Page 72
56
(f) Energy Balance of Closed Feedwater Heater No. 3 (CFH3):
The energy balance for the high pressure closed feedwater heater was given by,
0 = 𝑚 4 4 − 16 − 𝑚 14 15 − 14′ − Energy loss
and the
Energy loss = 𝑚 4 4 − 16 − 𝑚 14 15 − 14′ (3.37)
(g) Condenser Energy Balance:
The energy rate balance for the condenser was given by:
0 = 𝑚 10 10 − 11 − 𝑚 𝑐𝑤 𝑐𝑜 − 𝑐𝑖 − 𝐸𝑛𝑒𝑟𝑔𝑦 𝑙𝑜𝑠𝑠
and the
Energy loss = 𝑚 10 10 − 11 − 𝑚 𝑐𝑤 𝑐𝑜 − 𝑐𝑖 (3.38)
where the quantity 𝑚 𝑐𝑤 𝑐𝑜 − 𝑐𝑖 + 𝐸𝑛𝑒𝑟𝑔𝑦 𝑙𝑜𝑠𝑠 represented the total energy
rejected by the condenser.
3.4.2 Exergy Analysis of AP1000 Components
The exergy rate balances were developed using the Gouy-Stodola relationship [19] to
determine the exergy losses in the components.
(a) Exergy Balance for the Turbine:
The total exergy consumed by the turbine was the sum of the exergy losses in the low
and high pressure stages. The exergy rate balance for the high pressure turbine (HPT)
was derived from the energy rate balance as:
University of Ghana http://ugspace.ug.edu.gh
Page 73
57
𝑊 𝐻𝑃𝑇 = 𝑚3 𝑥𝑓3 − 𝑥𝑓4 + (𝑚3
− 𝑚4 ) 𝑥𝑓4 − 𝑥𝑓5 + (𝑚3 − 𝑚4 − 𝑚5 ) 𝑥𝑓5 − 𝑥𝑓6
− 𝐼 𝑑
(3.39)
Where 𝑥𝑓 is the flow exergy of the listed stream, and 𝐼 𝑑 = 𝑇𝑜𝑆 𝑔𝑒𝑛
Equation (3.39) was expanded as,
𝑇𝑜𝑆 𝑔𝑒𝑛 = 𝑚3 3 − 4 − 𝑇𝑜 𝑠3 − 𝑠4 + (𝑚3 − 𝑚4 ) 4 − 5 − 𝑇𝑜 𝑠4 − 𝑠5
+(𝑚3 − 𝑚 4 − 𝑚 5) 5 − 6 − 𝑇𝑜 𝑠5 − 𝑠6 − 𝑊
𝐻𝑃𝑇
The irreversibility or exergy loss was represented as,
𝑇𝑜𝑆 𝑔𝑒𝑛 = 𝑇𝑜 𝑚3 𝑠4 − 𝑠3 + (𝑚3 − 𝑚4 𝑠5 − 𝑠4
+(𝑚3 − 𝑚4 − 𝑚5 ) 𝑠6 − 𝑠5 ] (3.40)
where the entropy generation rate was,
𝑆 𝑔𝑒𝑛 = 𝑚3 𝑠4 − 𝑠3 + (𝑚3 − 𝑚4 𝑠5 − 𝑠4
+(𝑚3 − 𝑚4 − 𝑚5 ) 𝑠6 − 𝑠5 ]
For the low pressure turbine (LPT) the exergy rate balance was given by:
𝑊 𝐿𝑃𝑇 = 𝑚7 𝑥𝑓7 − 𝑥𝑓8 + (𝑚7
− 𝑚8 ) 𝑥𝑓8 − 𝑥𝑓9 + (𝑚7 − 𝑚 8 − 𝑚 9) 𝑥𝑓9 − 𝑥𝑓10
− 𝑇𝑜𝑆 𝑔𝑒𝑛
and expanded as,
University of Ghana http://ugspace.ug.edu.gh
Page 74
58
𝑇𝑜𝑆 𝑔𝑒𝑛 = 𝑚7 7 − 8 − 𝑇𝑜 𝑠7 − 𝑠8 + (𝑚7 − 𝑚8 ) 8 − 9 − 𝑇𝑜 𝑠8 − 𝑠9
+(𝑚7 − 𝑚 8 − 𝑚 9) 9 − 10 − 𝑇𝑜 𝑠9 − 𝑠10 − 𝑊
𝐿𝑃𝑇
which gave the exergy loss rate as:
𝑇𝑜𝑆 𝑔𝑒𝑛 = 𝑇𝑜[𝑚7 𝑠8 − 𝑠7 + (𝑚7 − 𝑚8 ) 𝑠9 − 𝑠8 + (𝑚7
− 𝑚 8 − 𝑚 9) 𝑠10 − 𝑠9 ]
(3.41)
(b) Steam Generator Exergy Balance:
The exergy flow equation for the steam generator was given as,
0 = 𝑚1 𝑥𝑓2 − 𝑥𝑓1 − 𝑚3 𝑥𝑓15 − 𝑥𝑓3 − 𝑇𝑜𝑆 𝑔𝑒𝑛
and expanded as,
𝑇𝑜𝑆 𝑔𝑒𝑛 = [𝑚1 2 − 1 − 𝑚3 15 − 3 ] − 𝑇𝑜[𝑚1 𝑠2 − 𝑠1 − 𝑚3 𝑠15 − 𝑠3 ]
where irreversibility was rewritten as,
𝑇𝑜𝑆 𝑔𝑒𝑛 = 𝑇𝑜 𝑚1 𝑠1 − 𝑠2 − 𝑚3 𝑠15 − 𝑠3 (3.42)
(b) Exergy Balance of Closed Feedwater Heater No.1 (CFH1):
The exergy flow equation for the low pressure closed feedwater heater (1) was given
as,
0 = 𝑚 9𝑥𝑓9 + 𝑚 17𝑥𝑓17 − 𝑚 11′ 𝑥𝑓12 − 𝑥𝑓11′ − 𝑚 18𝑥𝑓18 − 𝑇𝑜𝑆 𝑔𝑒𝑛
University of Ghana http://ugspace.ug.edu.gh
Page 75
59
Since,
𝑚 18 = 𝑚 9 + 𝑚 17 𝑎𝑛𝑑 𝑚 12 = 𝑚 11′
this gave,
𝑇𝑜𝑆 𝑔𝑒𝑛 = 𝑚9 9 − 0 − 𝑇𝑜 𝑠9 − 𝑠0 + 𝑚 17 17 − 0 − 𝑇𝑜 𝑠17 − 𝑠0
− 𝑚 11′ 12 − 11′ − 𝑇𝑜 𝑠12 − 𝑠11′
− 𝑚 18 18 − 0 − 𝑇𝑜 𝑠18 − 𝑠0
and the entropy generation rate was:
𝑆 𝑔𝑒𝑛 = 𝑚 18𝑠18 + 𝑚 11′ 𝑠12 − 𝑠11′ − 𝑚 9𝑠9 − 𝑚 17𝑠17
The irreversibility or exergy loss becomes,
𝑇𝑜𝑆 𝑔𝑒𝑛 = 𝑇𝑜 𝑚 18𝑠18 + 𝑚 11′ 𝑠12 − 𝑠11′ − 𝑚 9𝑠9 − 𝑚 17𝑠17 (3.43)
(c) Exergy Balance of Closed Feedwater Heater No.2 (CFH2):
The exergy rate balance for the low pressure closed feedwater heater (2) was given as,
0 = 𝑚 8 𝑥𝑓8 − 𝑥𝑓17 − 𝑚 12 𝑥𝑓13 − 𝑥𝑓12 − 𝑇𝑜𝑆 𝑔𝑒𝑛
This gave the exergy loss as,
𝑇𝑜𝑆 𝑔𝑒𝑛 = 𝑚8 8 − 17 − 𝑚 12 13 − 12 − 𝑇𝑜 𝑚8 𝑠8 − 𝑠17 − 𝑚 12 𝑠13 − 𝑠12
(3.44)
(e) Exergy Balance of Open Feedwater Heater (OFH):
The exergy rate balance for the open feedwater heater system was expressed as:
0 = 𝑚 5𝑥𝑓5 + 𝑚 16𝑥𝑓16 + 𝑚 13𝑥𝑓13 − 𝑚 14𝑥𝑓14 − 𝑇𝑜𝑆 𝑔𝑒𝑛
University of Ghana http://ugspace.ug.edu.gh
Page 76
60
where,
𝑚 14 = 𝑚 5 + 𝑚 16 + 𝑚 13
giving
𝑇𝑜𝑆 𝑔𝑒𝑛 = 𝑚 5𝑥𝑓5 + 𝑚 16𝑥𝑓16 + 𝑚 13𝑥𝑓13 − 𝑚 14𝑥𝑓14
which was expanded as
𝑇𝑜𝑆 𝑔𝑒𝑛 = 𝑚 5 5 − 0 − 𝑇𝑜 𝑠5 − 𝑠0 + 𝑚 16 16 − 0 − 𝑇𝑜 𝑠16 − 𝑠0
+ 𝑚 13 13 − 0 − 𝑇𝑜 𝑠13 − 𝑠0 − 𝑚 14 14 − 0 − 𝑇𝑜 𝑠14 − 𝑠0
and the entropy generation rate was given as,
𝑆 𝑔𝑒𝑛 = 𝑚 14𝑠14 − 𝑚 5𝑠5 − 𝑚 16𝑠16 − 𝑚 13𝑠13
The irreversibility or exergy loss thus becomes,
𝑇𝑜𝑆 𝑔𝑒𝑛 = 𝑇𝑜 𝑚 14𝑠14 − 𝑚 5𝑠5 − 𝑚 16𝑠16 − 𝑚 13𝑠13 (3.45)
(f) Exergy Balance of Closed Feedwater Heater No.3 (CFH3):
The exergy rate balance for the high pressure closed feedwater heater was given as,
0 = 𝑚 4 𝑥𝑓4 − 𝑥𝑓16 − 𝑚 14 𝑥𝑓15 − 𝑥𝑓14 − 𝑇𝑜𝑆 𝑔𝑒𝑛
And the irreversibility was,
𝑇𝑜𝑆 𝑔𝑒𝑛 = [𝑚4 4 − 16 − 𝑚 14 15 − 14 ] − 𝑇𝑜[𝑚4 𝑠4 − 𝑠16 − 𝑚 14 𝑠15 − 𝑠14 ]
(3.46)
University of Ghana http://ugspace.ug.edu.gh
Page 77
61
(g) Condenser Exergy Balance:
The exergy rate balance for the condenser was derived as:
0 = 𝑚10 (𝑥𝑓10 − 𝑥𝑓11) − 𝑚 𝑐𝑤 𝑥𝑓𝑐𝑜 − 𝑥𝑓𝑐𝑖 − 𝑇𝑜𝑆 𝑔𝑒𝑛
which was expanded as,
𝑇𝑜𝑆 𝑔𝑒𝑛 = [𝑚10 (10 − 11) − 𝑚 𝑐𝑤 𝑐𝑜 − 𝑐𝑖 ] − 𝑇𝑜[𝑚10 (𝑠10 − 𝑠11)
− 𝑚 𝑐𝑤 𝑠𝑐𝑜 − 𝑠𝑐𝑖 ]
This gave the irreversibility as,
𝑇𝑜𝑆 𝑔𝑒𝑛 = 𝑇𝑜 𝑚10 𝑠10 − 𝑠11 − 𝑚 𝑐𝑤 𝑠𝑐𝑜 − 𝑠𝑐𝑖 (3.47)
3.5 Overall Energy and Exergy Efficiencies and Losses of AP1000 Plant
For the simplified model of AP1000 (Fig. 3.4 (a)), the net power output was
approximated as:
𝑊 𝑛𝑒𝑡 = 𝑊
𝐻𝑃𝑇 + 𝑊 𝐿𝑃𝑇 = 𝑊
𝑇 (3.48)
which was obtained from literature as the turbine generator power output and found
to be 1199.5 MW [17]. Thus,
𝑊 𝑇 = 1199.5 𝑀𝑊 (3.49)
The overall plant energy efficiency was expressed as:
𝜂𝑝𝑙𝑎𝑛𝑡 =𝑊
𝑛𝑒𝑡
𝐸 𝑓𝑢𝑒𝑙
(3.50)
where fission heat was treated as the only input source of energy. The overall
efficiency definition differentiates from thermal efficiency defined as the ratio of net
University of Ghana http://ugspace.ug.edu.gh
Page 78
62
electrical power to reactor thermal power or heat transferred from the fuel to the
coolant. Thus equation (3.49) was rewritten as,
𝜂𝑝𝑙𝑎𝑛𝑡 =𝑊
𝑇
𝑄 𝑓𝑖𝑠𝑠𝑖𝑜𝑛 (3.51)
The overall thermodynamic or exergy efficiency was expressed as [1, 6]:
𝜓𝑝𝑙𝑎𝑛𝑡 =𝑊
𝑛𝑒𝑡
𝐸𝑥 𝑓𝑢𝑒𝑙
(3.52)
where fission heat was taken as the only input source of fuel exergy. From equations
(3.8) and (3.48), the exergy efficiency was rewritten as,
𝜓𝑝𝑙𝑎𝑛𝑡 =𝑊
𝑇
(𝑊 𝑢 ,𝑚𝑎𝑥 )𝑓𝑖𝑠𝑠𝑖𝑜𝑛
=𝑊
𝑇
𝑄 𝑓𝑖𝑠𝑠𝑖𝑜𝑛 (3.53)
Equations (3.51) and (3.53) stated directly that the energy and exergy efficiency
values of the nuclear power cycle were similar.
The energy loss 𝜂𝑙𝑜𝑠𝑠 and exergy loss 𝜓𝑙𝑜𝑠𝑠 values for the entire plant were,
consequently, derived as,
𝜂𝑙𝑜𝑠𝑠 = 𝜓𝑙𝑜𝑠𝑠 = 𝑄 𝑓𝑖𝑠𝑠𝑖𝑜𝑛 − 𝑊 𝑇 (3.54)
3.6 Computation of Energy and Exergy Loss Rates
The energy and exergy rate balances for the AP1000 power cycle presented in
equations (3.30 - 3.47) were solved using a Matlab script named ExergyCalc (see
Appendix A) developed for the purpose of computing the energy and exergy loss rates
specified for the various plant components. The solution algorithm for the program
was specified according to the steps described below.
University of Ghana http://ugspace.ug.edu.gh
Page 79
63
3.6.1 Solution Algorithm (Structured Program)
Step 1 – Parameters and Initialization
𝑇𝑜 - temperature of reference environment = 32oC
𝑊 𝑇 – turbine output = 1199.5MW
– enthalpy value of streams, 𝑘𝐽/𝑘𝑔
𝑠 – entropy value of streams, 𝑘𝐽/𝑘𝑔 𝐾
𝑚 – mass flow rate of listed streams, 𝑘𝑔/𝑠
Step 2 – Computation of Energy Loss Values
For the energy loss values, the mass flow rates and enthalpy values listed in the
process streams were computed by substituting into the energy rate balances
formulated for the various components comprising the steam generator, turbine, pre-
heaters and condenser.
Step 3 – Computation of Exergy Loss Values
Computation of the exergy loss values were obtained by inputting flow rates, the
reference environment temperature, enthalpy and entropy values into the exergy rate
balances given by equations (3.30- 3.47).
Step 4 – Total Energy and Exergy Loss Values
The total energy and exergy loss values were obtained from an aggregation of the
energy and exergy loss values computed in Step 2 and Step 3 for the various plant
components.
University of Ghana http://ugspace.ug.edu.gh
Page 80
64
Step 5- Program Structure
The program structure consisted of declaration stage where the symbols were defined
and physical parameters declared. Program run consisted of initializing the parameters
and constants, calculating the energy and exergy loss values by section, and summing
the energy and exergy values obtained.
3.6.2 Numerical Flow Chart for Solution Algorithm
A diagrammatic representation of the numerical flow chart algorithm is shown below.
Fig. 3.6 Numerical flow chart algorithm for computation of energy and exergy loss
rates.
University of Ghana http://ugspace.ug.edu.gh
Page 81
65
3.6.3 Matlab Program Development and Implementation
The energy loss and exergy consumption Matlab computer code named ExergyCalc.m
(shown in Appendix A) was developed from the energy and exergy rate balances of
equations (3.30 - 3.47), implemented and executed using a high speed Dell Optiplex
780 series PC workstation in the Computational Laboratory of the School of Nuclear
and Allied Sciences, University of Ghana. The PC had the specifications: Intel(R)
Core(TM) 2 Quad CPU Q9400 processor @ 2.66 GHz (4 CPUs), 2.7 GHz,4096 MB
of Memory (RAM), 500 GB Hard Disk, and Windows7 professional64-bit Operating
System. After coding, the program was debugged and run to obtain the results, which
were checked for errors.
3.7 Validation, Verification and Errors
The mathematical formulations of overall plant energy efficiency developed for the
research were derived from simplifications of the original system based on indications
from operational data. The theoretical value of overall energy efficiency predicted for
the simulation model was comparable to the value specified from literature data.
The simulation values obtained from the ExergyCalc code were verified by
undertaking comprehensive manual calculations of a selection of energy and exergy
balances, and through rigorous testing of the ExergyCalc code with data from process
diagrams of similar systems (streams) reported in the literature.
The computational error estimated for the simulation results was obtained as the
percentage error calculated as,
% 𝑒𝑟𝑟𝑜𝑟 = 𝑡𝑒𝑜𝑟𝑒𝑡𝑖𝑐𝑎𝑙 𝑙𝑜𝑠𝑠 𝑣𝑎𝑙𝑢𝑒 − 𝑠𝑖𝑚𝑢𝑙𝑎𝑡𝑒𝑑 𝑙𝑜𝑠𝑠 𝑣𝑎𝑙𝑢𝑒
𝑡𝑒𝑜𝑟𝑒𝑡𝑖𝑐𝑎𝑙 𝑙𝑜𝑠𝑠 𝑣𝑎𝑙𝑢𝑒 100% (3.55)
University of Ghana http://ugspace.ug.edu.gh
Page 82
66
CHAPTER FOUR
RESULTS AND DISCUSSION
4.1 Results
The operational data used in the analysis of the processes within the AP1000 power
cycle have been presented in Table 4.1 [17]. The AP1000 plant was assessed
according to a reference environment temperature of 32oC taken as the approximate
mean temperature of the condenser cooling water.
4.1.1 Energy and Exergy Losses in AP1000 Reactor Core
The thermodynamic properties for the AP1000 reactor core operating at 3400 MWt
nominal power was given as,
𝑄 𝑓𝑖𝑠𝑠𝑖𝑜𝑛 = 3400 𝑀𝑊
𝑇𝑜 = 32𝐶 + 273.15 = 305.15 𝐾
𝑇𝑓 = 1339.9𝐶 + 273.15 = 1613.15 𝐾
𝑇𝑐 = 315.75𝐶 + 273.15 = 588.9 𝐾
𝑚 = 14275.8 𝑘𝑔/𝑠
1 = 1239.52 𝑘𝐽/𝑘𝑔, 2 = 1468.87 𝑘𝐽/𝑘𝑔
𝑠1 = 3.0731 𝑘𝐽/𝑘𝑔 𝐾, 𝑠2 = 3.45997 𝑘𝐽/𝑘𝑔 𝐾
The energy output and loss values for the reactor were calculated as follows:
𝑄 𝑙𝑜𝑠𝑠 = 3400𝑀𝑊 − 14275.8 1468.87 − 1239.52 = 125.1 𝑀𝑊
University of Ghana http://ugspace.ug.edu.gh
Page 83
67
Table 4.1.Property data for flow streams listed in Fig. 3.4 (a).
State Mass flow rate Enthalpy1 Entropy1 Temp Pressure Condition
Vapour fraction3
kg/s kJ/kg kJ/kg. K oC MPa
0 32.0 0.101
1 14275.82 1239.5 3.073 280.7 15.513 Subcooled liquid 0.0
2 14275.82 1468.9 3.503 321.1 15.513 Subcooled liquid 0.0
3 1886.7 2765.8 5.924 270.7 5.571 Saturated vapour 1.0
4 170.4 2688.6 7.257 232.2 2.916 Two phase mixture 0.56
5 113.4 2543.0 5.840 229.4 1.103 Two phase mixture 0.40
6 1464.1 2543.0 5.840 184.1 1.117 Two phase mixture 0.90
7 1290.9 2950.8 7.980 254.6 1.075 Saturated vapour 1.0
8 172.5 2695.4 6.901 152.3 0.191 Saturated vapour 1.0
9 94.8 2146.0 7.830 79.3 0.046 Two phase mixture 0.84
10 1025.9 2252.0 8.407 42.7 0.008 Two phase mixture 0.98
11 1293.1 178.4 0.606 42.7 0.008 Saturated liquid 0.0
11' 1293.1 180.7 0.570 43.1 0.043 Subcooled liquid 0.0
12 1293.1 315.2 1.070 95.7 0.247 Subcooled liquid 0.0
13 1293.1 612.9 1.795 145.6 1.068 Subcooled liquid 0.0
14 1886.7 776.0 2.166 182.9 1.068 Subcooled liquid 0.0
14' 1886.7 785.3 2.187 184.2 2.764 Subcooled liquid 0.0
15 1886.7 975.8 2.578 226.6 5.570 Subcooled liquid 0.0
16 306.9 806.9 2.900 189.8 1.068 Subcooled liquid 0.0
17 172.5 338.7 1.080 80.9 1.190 Subcooled liquid 0.0
18 267.2 327.0 1.081 78.1 0.043 Subcooled liquid 0.0
Cwin 37665.8 137.0 0.453 32.0 0.101 Subcooled liquid 0.0
Cwout 37665.8 185.0 0.663 46.8 0.101 Subcooled liquid 0.0
1 Enthalpy and entropy values were obtained by finding the mass weighted average enthalpy
and entropy values of streams specified for components in the AP1000 Design Control
Document [17].
2 The mass flow rate for the primary coolant was derived from the best estimate core flow
provided in AP1000 Design Control Document [16].
3 Vapour fraction is listed as 0.0 for liquids and 1.0 for superheated vapours.
University of Ghana http://ugspace.ug.edu.gh
Page 84
68
The energy efficiency of the reactor core was,
𝜂𝑅 = 1 −125.1 𝑀𝑊
3400 𝑀𝑊 100 % = 96.3 %
The exergy output and loss values were calculated as follows,
(𝑊 𝑢 ,max )𝑓𝑢𝑒𝑙 = 1 −305.15 𝐾
1613.15 𝐾 3400 𝑀𝑊 = 2756.8 𝑀𝑊
𝐼 𝑓𝑢𝑒𝑙 = 3400 𝑀𝑊 − 2756.8 𝑀𝑊 = 643.1 𝑀𝑊
(𝑊 𝑢 ,max )𝑐𝑙𝑎𝑑 = 1 −305.15
588.9 3400 = 1638.1 𝑀𝑊
𝐼 𝑐𝑙𝑎𝑑 = 2756.8 − 1638.2 = 1118.6 𝑀𝑊
(𝑊 𝑢 ,max )𝑐𝑜𝑜𝑙𝑎𝑛𝑡 = 14275.8 1468.87 − 1239.52 − 305.15 3.4599 − 3.0731
= 1585.1 𝑀𝑊
𝐼 𝑐𝑜𝑜𝑙𝑎𝑛𝑡 = 1638.2 𝑀𝑊 − 1585.1 𝑀𝑊 = 53.1 𝑀𝑊
The total irreversibility of the reactor was,
𝐼 𝑟𝑒𝑎𝑐𝑡𝑜𝑟 = 𝐼 𝑓𝑢𝑒𝑙 + 𝐼 𝑐𝑙𝑎𝑑 + 𝐼 𝑐𝑜𝑜𝑙𝑎𝑛𝑡 = 1814.8 𝑀𝑊
From the definition of the second law, the exergy efficiency of the reactor core was
calculated as,
𝜓𝑅 = 1 −1814.8 𝑀𝑊
3400 𝑀𝑊 100% = 46.6 %
University of Ghana http://ugspace.ug.edu.gh
Page 85
69
The results of the energy and exergy analysis of the AP1000 reactor core are
summarized in Table 4.2 and Table 4.3 respectively.
Table 4.2 Energy balance (input, output and loss rates) of AP1000 reactor core.
Table 4.3 Exergy output and consumption values for AP1000 reactor core.
Reactor core AP1000
(MW) (% of total exergy)
Exergy consumption rate
Heating of fuel centerline 643.2 18.9
Transfer of heat to cladding surface
1118.6 32.9
Heating of coolant 53.1 1.6
Total 1814.8 53.4
Exergy output rate
Exergy available from coolant
1585.2 46.6
General Total 3400.0 100.0
Reactor core (rate)
AP1000
(MW) (% of total energy)
Energy loss 125.1 3.7
Energy output rate (coolant)
3274.9 96.3
Fission heat input 3400.0 100.0
University of Ghana http://ugspace.ug.edu.gh
Page 86
70
4.1.2 Energy and Exergy losses in AP1000 Power Cycle
The energy and exergy values obtained for the power cycle of the AP1000 plant were
evaluated using the Matlab script ExergyCalc developed and implemented for the
analyses and presented in Appendix A. The energy loss and exergy consumption
values computed for the overall processes and process subsections with ExergyCalc
are presented in Table 4.4
From first law analysis, a large quantity of energy (1808MW) entered the
condensation section, of which close to 100% was rejected to the environment. In the
power production section of the AP1000 unit (consisting of the turbines), the
combined energy loss from the high and low pressure turbines was found to be very
small at 17.6 MW. The preheating sections consisting of two low pressure closed heat
exchangers, a high pressure closed heat exchanger and a de-aerating chamber, were
are found to have an aggregate energy loss of 31.2 MW.
The energy losses in the steam generation sections, consisting of the reactor core and
steam generator devices, were found to be moderate at 227.4 MW with the reactor
core contributing 125.1 MW of the total, and the steam generator device experiencing
the remaining 102.3 MW loss.
The exergy analysis of components revealed that, the condenser consumed only 28.4
MW of exergy during heat transfer to the cooling water. In the power production
section of the AP1000 unit, the total exergy losses were found to be moderate at 99.3
MW. Of this total, the low pressure turbine was observed to account for the highest
loss of 72.4 MW, with the high pressure turbine contributing a loss of 26.9 MW.
University of Ghana http://ugspace.ug.edu.gh
Page 87
71
Table 4.4 Simulated energy and exergy loss rates in sections of AP1000 power cycle.
Section/device
Energy loss rate Exergy loss rate
(MW) % of total
energy loss (MW)
% of total exergy loss
Steam generation section
Reactor
Fuel Centerline - 643.2 31.7
Cladding surface - 1118.6 55.1
Coolant - 53.1 2.6
Total 125.1 6.0 1814.8 89.4
Steam generator 102.3 4.9 53.6 2.6
Section Total 227.4 10.9 1868.4 92.0
Power production section
High-pressure turbine -
26.9 1.3
Low-pressure turbine - 72.4 3.6
Total 17.6 0.8 99.3 4.9
Condensation section
Condenser(rejected) 1808.0
28.5
Total 1808.0 86.7 28.5 1.4
Preheat section
Low-pressure heat exchanger (CFH1)
0.6 0.0 2.0 0.1
Low-pressure heat exchanger (CFH2)
21.5 1.0 1.2 0.1
Deaerating heat exchanger (OFH)
7.9 0.4 10.9 0.5
High-pressure heat exchanger (CFH3)
1.2 0.1 19.5 1.0
Total 31.2 1.5 33.6 1.7
General Total 2084.2 100.0
2029.8 100.0
University of Ghana http://ugspace.ug.edu.gh
Page 88
72
The preheating sections were found to have small exergy consumptions adding up to a
total loss of 33.6 MW. The exergy consumption associated with the reactor core and
steam generator assembly, collectively called the steam generation sections, was
substantial contributing 1868.4 MW of exergy loss, thereby accounting for 92% of the
total exergy consumed.
The main energy process in the steam generation sections was heat transfer, and of the
total exergy consumed, 1814.8 MW was consumed in the heat transfer processes of
the reactor core, and 53.6 MW internally consumed in the steam generator device.
The overall energy and exergy efficiency values were calculated using 𝑊 𝑇 =
1199.5 𝑀𝑊 and equations (3.51) and (3.53) respectively for the AP1000 plant, and
modeled as the theoretical energy and exergy efficiency values.
𝜂𝑝𝑙𝑎𝑛𝑡 =1199.5 𝑀𝑊
3400 𝑀𝑊 100% = 35.3 % (3.51)
𝜓𝑝𝑙𝑎𝑛𝑡 =1199.5 𝑀𝑊
3400 𝑀𝑊 100% = 35.3 % (3.53)
Consequently, the theoretical energy and exergy loss values calculated from equation
(3.54) were found to be same as
𝜂𝑙𝑜𝑠𝑠 = 𝜓𝑙𝑜𝑠𝑠 = 3400 𝑀𝑊 − 1199.5 𝑀𝑊 = 2200.5 𝑀𝑊 (3.54)
4.1.3 Error Analysis
Sources of error encountered in the research were the model assumptions, or
simplifications, computational errors and rounding off errors. The errors caused
deviations of the simulated total energy and exergy loss values from the theoretical
University of Ghana http://ugspace.ug.edu.gh
Page 89
73
loss values for the model. The computational error associated with the simulated
energy and exergy results was estimated as the percentage error calculated as follows:
From equation (3.55), the computational error estimated for total energy loss rate was,
% 𝑒𝑟𝑟𝑜𝑟 = 2200.5 − 2084.2 𝑀𝑊
2200.5 𝑀𝑊 100% = 5.3 % (3.55)
And the computational error estimated for the total exergy consumption rate was
obtained as,
% 𝑒𝑟𝑟𝑜𝑟 = 2200.5 − 2029.8 𝑀𝑊
2200.5 𝑀𝑊 100% = 7.8 % (3.55)
Thus, the simulated total energy loss and exergy consumption values fall within 10%
of the theoretically predicted values.
4.2 Discussion
The energy analysis of the AP1000 reactor core indicated that operating at nominal
core power of 3400 MW, energy was lost at the rate of 125.1 MW to the
surroundings, and transferred at the rate of 3274.9 MW to the primary coolant. On
percent basis, only 3.7 % of the total heat (energy) generated from the fuel was
wasted, yielding a reactor energy efficiency of 96.3 %.
The exergy consumption in the AP1000 reactor core was separated into irreversible
losses in heating the fuel centerline to the maximum temperature of 1339.9 oC,
transferring of heat to the cladding surface at 315.75 oC [4], and heating of the
primary coolant.
Of the 1814.8 MW total exergy consumption observed in the reactor core, 643.2 MW
was consumed in heating the fuel centerline to the maximum temperature, 1118.6
University of Ghana http://ugspace.ug.edu.gh
Page 90
74
MW in transferring heat to the cladding surface, and 53.1 MW was destroyed in
heating the primary coolant. The maximum work available from the coolant was
observed to be 1585.2 MW, thereby achieving exergy efficiency of 46.6 %.
The high thermal efficiency and moderate exergy efficiency achieved by the AP1000
reactor core was ascribed to the high temperatures of heat generation in the fuel, and
heat-transfer under high temperature and pressure to the coolant. By this mechanism,
the primary circuit maintained a high average temperature of heat addition to the
working fluid in the secondary circuit.
The exergy destruction profile of the AP1000 reactor, which detailed the sectional
contributions to total consumption within the core, showed that a substantial
proportion (97 %) of total exergy consumption in the core was associated with heat
transfer processes occurring within the fuel meat. This attribute was consistent with
the exergy consumption profile observed for the nuclear reactor of the Pickering
Nuclear Generating Station in Canada [6].
For the AP1000 power cycle, the theoretical values of the plant overall energy and
exergy efficiencies were found to be similar. However, the energy and exergy analysis
revealed that individual component contributions to the total energy and exergy losses
differed significantly for most plant sections as depicted in Fig. 4.1.
Although, from energy analysis, energy loss in the condensers seemed high (1808
MW), the losses were associated with emissions at a temperature very near that of the
environment. While the energy loss was large in quantity, it was thermodynamically
insignificant due to its low quality, indicated by the low exergy consumption of 28.5
MW.
University of Ghana http://ugspace.ug.edu.gh
Page 91
75
Fig. 4.1 Comparison of sectional energy and exergy losses within the AP1000 plant
Fig. 4.2 Energy and exergy balances for the entire AP1000 plant indicating power
input, output and sectional losses.
0
200
400
600
800
1000
1200
1400
1600
1800
2000
Condensation Section
Steam Generation
Section
Power Production
Section
Preheat Section
Loss
es
(MW
)
Comparison Chart
Energy loss
Exergy consumption
University of Ghana http://ugspace.ug.edu.gh
Page 92
76
The largest irreversible losses (1868.4 MW) occured in the steam generation sections
which experienced the largest exergy destruction (92 %) in the plant. The exergy
analysis, therefore, quantitatively demonstrated that condensers were responsible for
little of useful or quality energy losses. This discrepancy was highlighted in Fig. 4.2.
Energy analysis, thus, leads to the erroneous conclusion that almost all losses in net
work output were associated with heat rejected by the condensers. However, as
reported by Dincer [6], the sources for majority of useful losses were the steam
generation sections which experienced the largest irreversible losses or internal
consumptions.
The steam generation sections of the AP1000 unit appeared significantly more
efficient on an energy basis than on an exergy basis. The implication was that
although a large quantity of the input energy was transferred to the coolant, and
subsequently to the working fluid, the quality of energy was degraded as it was
transferred.
The overall energy efficiency value calculated for the AP1000 plant was observed to
be comparable to the value specified from literature [32]. The marginal deviation was
ascribed to the assumptions, simplifications and idealizations adopted for the study.
Generally, the energy loss and exergy consumption values obtained for the AP1000
plant were found to be in broad agreement with other published works on nuclear
power plants, and indicated the operational locations with the biggest potential for
efficiency improvements as reported by the researchers [6, 33].
University of Ghana http://ugspace.ug.edu.gh
Page 93
77
CHAPTER FIVE
CONCLUSIONS AND RECOMMENDATIONS
5.1 Conclusions
In this study, energy and exergy analysis of the Westinghouse Advanced Passive
1000-MWe Nuclear Plant (AP1000) was presented. The primary objectives of the
study were to analyze the AP1000 reactor core and power cycle separately, and to
identify and quantify the sites having the largest energy and exergy losses under
normal operating conditions.
Mathematical models of the energy and exergy rate balances for the AP1000 plant
were formulated under steady state normal operating conditions and evaluated using
process data sourced from literature and AP1000 design documents. A Matlab
software script called ExergyCalc was implemented to compute the energy loss and
exergy consumption rates in the various subsections of the AP1000 power cycle.
Of the 3400 MW core power generated by the AP1000, heat was lost at the rate of
125.1 MW to the environment, and transferred at a rate of 3274.9 MW to the reactor
coolant, yielding a thermal efficiency of 26.7 %. Exergy analysis, on the other hand,
revealed that of the total exergy (3400 MW) input to the reactor, 1814.8 MW was
consumed in the reactor core.
The total exergy consumption in the core consisted of 643.2 MW consumed in heating
the center of the fuel element, 1118.6 MW in transferring heat to the cladding surface,
and 53.1 MW of exergy destroyed in heating the primary coolant. The maximum
work obtainable from the primary coolant was found to be 1585.2 MW, resulting in
exergy efficiency of 46.6 %.
University of Ghana http://ugspace.ug.edu.gh
Page 94
78
The AP1000 core achieved very high energy efficiency and modest exergy efficiency
which was comparable to other power reactor cores. This was attributable to the high
temperatures associated with heat generation in the fuel and heat-transfer to the
coolant.
For the AP1000 plant, maximum energy loss was observed in the condenser where
close to 100 % of energy entering this section was rejected. The condenser alone
accounted for 86.7 % of the total energy loss by the power cycle to the environment.
The overall energy efficiency of the plant based on fission power generated was found
to be 35.3 %.
Exergy analysis of the AP1000 station showed that energy loss in the condenser was
thermodynamically insignificant due to the low quality of the ejected heat. In terms of
exergy consumption (or irreversible losses), major loss was found in the steam
generation sections (consisting of reactor core and steam generator assembly) where a
substantial 1868.4 MW of exergy, constituting 55 % of the fission exergy input, was
destroyed. In contrast, the percent exergy destruction in the condenser was 0.8 %,
with the turbines and pre-heaters consuming 2.9 % and 1.0 % respectively of total
exergy input.
From the definition of the second law, the overall exergy efficiency for the power
cycle was found to be the same as the overall energy efficiency at 35.3 %, while
energy and exergy analyses gave markedly different accounts of the component
contributions to the total losses in the plant. Thus, while energy analysis gave only the
energy emissions from processes without providing information about internal losses,
exergy analysis highlighted the degradations in energy quality as it was transferred.
University of Ghana http://ugspace.ug.edu.gh
Page 95
79
Generally, the energy and exergy loss and efficiency values evaluated for the process
subsections and overall plant were found to be comparable to modern power plants
and were in broad agreement with other published works on nuclear power reactors.
In conclusion, the exergy consumption rate of the nuclear reactor core was dominant
over all other irreversible losses in the nuclear power cycle. However, parts of this
irreversibility could not be avoided due to physical limitations. The study
demonstrated that nuclear reactor cores have the largest potential for efficiency
improvement in nuclear plants and, therefore, efforts to increase station efficiency
should concentrate on this section.
5.2 Recommendations
As a tool that has found increasingly widespread use in the design, assessment,
optimization, improvement and economic analysis of energy systems, the topic of
exergy analysis should be incorporated in the school’s engineering curriculum on
thermodynamic analysis of power plants.
Investigations of the complete, full scale model of the AP1000 power cycle was not
performed for reasons of time and scale of the work required. The simplified model
adapted for the study had inherent limitations in comprehensively accounting for the
energy and exergy losses in the various plant components. A holistic research would
involve group work and the use of thermodynamic process simulators (e.g. Aspen
Plus) which were not available for this study.
Subsequently, an advanced exergy analysis is envisaged, where the interactions
among components will be considered and the exergy destruction within each
University of Ghana http://ugspace.ug.edu.gh
Page 96
80
component is split to better reveal the sources in terms of endogenous/exogenous
exergy, and the potential for reduction in terms of avoidable and unavoidable exergy.
Finally, the exergy method should be applied to the Takoradi Thermal Power Station
(Aboadze) and other thermal power systems operational in Ghana in order to assess
the true thermodynamic performance of the energy conversion systems and determine
the sections that contribute to the greatest losses in energy quality.
University of Ghana http://ugspace.ug.edu.gh
Page 97
81
REFERENCES
[1] Rashad A., and El Maihy A., (2009), Energy and Exergy Analysis of a Steam
Power Plant in Egypt, In Proc. 13th
International Conference on Aerospace Science &
Aviation Technology, ASAT-13, May 26 – 28, Cairo, Egypt.
[2] Nikulshin V., Wu C. and Nikulshina V., (2002), Exergy efficiency calculation of
energy intensive systems, Exergy, An International Journal, Vol. 2, pp. 78-86.
[3] Lahey R. T. Jr. and Moody F J., (1993), The Thermal-Hydraulics of a Boiling
Water Nuclear Reactor, 2nd
Edition, American Nuclear Society, Illinois, USA.
[4] Ameh L., (2012), Numerical Modelling of the Transient Temperature Distribution
Within the Fuel Pin of the AP1000 Reactor During a Small Break Loss-of-Coolant
Accident, MPhil Thesis, University of Ghana, Legon.
[5] Reddy V. S., Kaushik S. C., Tyagi S. K. and Panwar N. L., (2010), An Approach
to Analyse Energy and Exergy Analysis of Thermal Power Plants: A Review, Smart
Grid and Renewable Energy, Vol. 1, pp. 143-152.
[6] Dincer I. and Rosen M. A., (2007), Exergy: energy, environment and sustainable
development. Elsevier B.V., Amsterdam, Netherlands.
[7] Tsatsaronis G. and Cziesla F., (2009), Exergy and Thermodynamic Analysis. In
Exergy, Energy System Analysis and Optimization (Frangopoulos, C. A., ed.), Vol. 1,
EOLSS Publishers, Oxford, UK.
[8] Szargut J., (2005), Exergy Analysis, The Magazine of the Polish Academy of
Sciences, Vol. 7, No. 3, Warsaw, Poland.
[9] Wall G. and Gong M., (2001), On Exergy and Sustainable Development – Part 1:
Conditions and Concepts, Exergy, An International Journal, Vol, 1, No. 3, pp. 128 -
145
[10] Tsatsaronis G. and Cziesla F., (2009), Exergy Analysis of Simple Processes, In
Exergy, Energy System Analysis and Optimization (Frangopoulos, C. A., ed.), Vol. 1,
EOLSS Publishers, Oxford, UK.
[11] Ebadi M. J. and Gorji-Bandpy M., (2005), Exergetic Analysis of Gas Turbine
Plants, Int. J. Exergy, Vol. 2, No. 1, pp. 31-39.
[12] Retrieved February 22, 2013 from World Nuclear Association on the world wide
web. http://world-nuclear.org/info/Nuclear-Fuel-Cycle/Power-Reactors/Nuclear-
Power-Reactors
[13] Gaio P., (2009), AP1000 The PWR Revisited, In Proc. IAEA International
Conference on Opportunities and Challenges for Water Cooled Reactors in the 21st
Century, IAEA-CN-164-3S05, USA.
University of Ghana http://ugspace.ug.edu.gh
Page 98
82
[14] Westinghouse Electric Co. LLC., (2002), AP1000 Design Control Document –
Chapter 4: Reactor, Tier-2 material 4.1, revision 14.
[15]Westinghouse Electric Co. LLC., (2002), AP1000 design control document –
Chapter 4: Reactor, Tier-2 material 4.2, revision 14.
[16] Westinghouse Electric Co. LLC., (2002), AP1000 Design Control Document –
Chapter 5: Reactor coolant system and connected systems, Tier-2 material 5.1,
Revision 15.
[17] Westinghouse Electric Co. LLC., (2002), AP1000 Design Control Document –
Chapter 10: Steam and power conversion, Tier-2 material 10.1.
[18] Mborah C. and Gbadam E. K., (2010), On the energy and exergy analysis of a
500kW steam power plant at Benso oil palm plantation, Research Journal of
Environmental and Earth Sciences, Vol. 2, No. 4, pp. 239-244.
[19] Kaushik S. C., Siva Reddy V. and Tyagi S. K., (2011), Energy and exergy
analyses of thermal power plants: A review, Renewable and Sustainable Energy
Reviews, Vol.15, pp. 1857 – 1872.
[20] Mady C. E. S., Ferreira M, S., Yanagihara J. I., Saldiva P. H. N. and Oliveira S.
Jr., (2012), Modeling the exergy behavior of human body, Energy, Vol. 45, pp. 546-
553.
[21] Hepbasli A., (2008), A Key Review on Exergetic Analysis and Assessment of
Renewable Energy Resources for a Sustainable Future, Renewable and Sustainable
Energy Reviews, Vol. 12, pp. 593–661.
[22] Lebele – Alawa B. T. and Asuo, J. M. (2013). Performance Analysis of 20 MW
Gas Turbine Power Plant by Energy and Exergy Methods. Journal of Applied Science
and Technology (JAST), Vol. 18, Nos. 1 & 2
[23] Todreas N. E. and Kazimi M. S., (1990), Nuclear Systems 1: Thermal Hydraulic
Fundamentals, Taylor & Francis, USA.
[24] Moran M. J. and Tsatsaronis G. (2000), Engineering Thermodynamics, In: The
CRC Handbook of Thermal Engineering (Kreith, F., ed), CRC Press LLC, Boca
Raton, FL., USA.
[25] Moran M. J., Shapiro H. N., Boettner D. D. and Bailey M. B., (2011),
Fundamentals of Engineering Thermodynamics, 7th
Edition, John Wiley & Sons, New
York, USA.
[26] Szargut J., (2005), Exergy Method: Technical and ecological applications, WIT
Press, Southampton, UK.
University of Ghana http://ugspace.ug.edu.gh
Page 99
83
[27] Retrieved November 8, 2012 from Ecourses on the world wide web.
https://ecourses.ou.edu/cgi-bin/ebook.cgi? doc=&topic=th& chap_sec=07.2& page=
theory
[28] Cooper S., Exergy and Energy Analysis. Retrieved December 7, 2012 from:
people.bath.ac.uk/en8sc
[29] Amir V., Alireza F., Sadegh V., Hasan N. E., Azam B. and Roya N. R., (2011),
Improvement power plant efficiency with condenser pressure, International journal of
multidisciplinary sciences and engineering, Vol. 2, No. 3.
[30] Canadian Nuclear Safety Commission, (2003), Training Manual: Science and
Reactor Fundamentals – Reactor Physics, CNSC, Technical Training Group.
[31] Jevremovic T., (2009), Nuclear Principles in Engineering, Second Edition,
Springer, N.Y, USA.
[32] Westinghouse Electric Co. LLC. (2003), The Westinghouse AP1000 Advanced
Nuclear Plant - Plant Description, Nuclear Engineering and Design, Vol. 236, pp.
1547–1557.
[33] Ahmet Durmayaz and Hasbi Yavuz, (2001), Exergy analysis of a pressurized-
water reactor nuclear-power plant, Applied energy, Vol. 69, issue 1, pp. 39-57.
University of Ghana http://ugspace.ug.edu.gh
Page 100
84
APPENDICES
Appendix A. ExergyCalc _ code.
%--------------------------------------------------------- %Matlab script 'ExergyCalc.m' to compute the energy %and exergy loss values in the simulation model of AP1000 power cycle %----------------------------------------------------------
%Parameters
%---------------------------------------------------------- To=32+273.15 Wt=1199500 %--------------------------------------- h1= 1239.5; h2= 1468.9; h3= 2765.8; h4= 2688.6; h4bar= 1981.8; h5= 2543.0; h5bar= 1506.1; h6= 2543.0; h7= 2950.8; h8= 2695.4; h9= 2146.0; h10= 2252; h11 =178.4; h11bar= 180.7; h12 =315.2; h13 =612.9; h14= 776.0; h14bar=785.3 h15 =975.8; h16 =806.9; h17 =338.7; h18= 327.0; hci =137; hco =185; %--------------- s1= 3.0731; s2= 3.503; s3= 5.9242; s4= 7.2574; s4bar = 5.2236; s4bar2 = 6.6; s5 = 5.84; s5bar= 4.7784; s5bar2=6.6; s6= 5.84; s7= 7.98; s8= 6.9; s9= 7.83; s10= 8.4071; s11 =0.6062; s11bar= 0.57; s12= 1.07; s13= 1.795; s14= 2.1667; s14bar= 2.1875 s15= 2.5785;
University of Ghana http://ugspace.ug.edu.gh
Page 101
85
s16= 2.9; s17= 1.08; s18= 1.08; sci= 0.453; sco= 0.663; %-------------------------------------- m1= 14275.8; m2= 14275.8; m3bar= 1886.7; m3= 1823.7; m4= 170.4; m4bar= 306.9; m5= 113.4; m5bar= 286.7; m6= 1464.1; m7= 1290.9; m8= 172.5; m9= 94.8; m10= 1025.9; m11= 1293.1; m11bar= 1293.1; m12= 1293.1; m13= 1293.1; m14= 1886.7; m15= 1886.7; m16= 306.9; m17= 172.5; m18= 267.2; mcwi= 37665.8; mcwo= 37665.8; clc %------------------------------------
% Energy and Exergy Analysis of Station Components %--------------------------------------------------
%Steam Generator Energy and Exergy Balance Analysis
RCoolantFlow = m1*(h2-h1 )
SGFlow = m15*(h3-h15)
ESG =RCoolantFlow - SGFlow
IdSG =To*(m15*(s3-s15)-m1*(s2-s1))
% Energy and Exergy Balance for HPT
EHPT = m3*(h3-h4)+(m3-m4)*(h4-h5 )+(m3-m4-m5)*(h5-h6)
Idhpt=To*(m3*(s4-s3 )+(m3-m4)*(s5-s4)+(m3-m4-m5 )*(s6-s5))
%Energy and exergy balance for LPT
ELPT = m7*(h7-h8 )+(m7 -m8)*(h8-h9)+(m7-m8-m9)*(h9-h10)
University of Ghana http://ugspace.ug.edu.gh
Page 102
86
IdLPT = To*(m7*(s8-s7)+(m7-m8)* (s9-s8)+(m7-m8-m9)*(s10-s11))
%Total Turbine Energy and Exergy Losses
IdTURB = IdLPT + IdHPT
ETUR = ELPT + EHPT
Wloss = ETUR - Wt
% Energy and Exergy balance of CFH1
ECFH1 = m9*h9 + m17*h17- m11* (h12-h11bar)- m18*h18
IdCFH1 = To*(m11*(s12-s11bar)+m18*s18-m9*s9-m17*s17)
% Energy and Exergy balance of CFH2
ECFH2 = m8*(h8-h17)- m12*(h13-h12)
IdCFH2 = m8*(h8-h17)-m12*(h13-h12)-To*(m8*(s8-s17)-m12*(s13-s12))
% Exergy balance of OFH
EOFH = m5bar*h5bar+ m16*h16 + m13*h13 - m14*h14
IdOFH = To*(m14*s14bar-m5bar*s5bar-m16*s16-m13*s13)
% Energy and Exergy balance of CFH3
ECFH3 = m4bar*(h4bar-h16) - m14*(h15-h14bar)
IdCFH3=m4bar*(h4bar-h16) - m14*(h15-h14bar)-To*(m16*(s15-s4bar)-
m14*s14+m14*s15)
% Energy and Exergy balance of Condenser
QCON = mcwi*(hco-hci)
IdCON=To*(m10*(s10-s11)-mcwi*(sco-sci))
% Total energy loss by components Wloss ECFH1 ECFH2 EOFH ECFH3 QCON
%--------total energy loss by pre-heaters----------
NTotal=ECFH1+ECFH2+EOFH+ECFH3
University of Ghana http://ugspace.ug.edu.gh
Page 103
87
%-------grand total of energy losses---------------
ETOTAL=Wloss+ECFH1+ECFH2+EOFH+ECFH3+QCON-ESG
%Total exergy loss in components IdCON IdCFH3 IdOF IdCFH2 IdCF1 IdHPT IdLPT IdSG
%-----grand total of losses--------------------------
IdTOTAL=IdLPT+IdHPT+IdCF1+IdCFH2+IdOF+Id3+IdCON+IdSG
University of Ghana http://ugspace.ug.edu.gh