Graduate eses and Dissertations Iowa State University Capstones, eses and Dissertations 2009 Energy and nutrient cycling in pig production systems Peter J. Lammers Iowa State University Follow this and additional works at: hps://lib.dr.iastate.edu/etd Part of the Animal Sciences Commons is Dissertation is brought to you for free and open access by the Iowa State University Capstones, eses and Dissertations at Iowa State University Digital Repository. It has been accepted for inclusion in Graduate eses and Dissertations by an authorized administrator of Iowa State University Digital Repository. For more information, please contact [email protected]. Recommended Citation Lammers, Peter J., "Energy and nutrient cycling in pig production systems" (2009). Graduate eses and Dissertations. 10622. hps://lib.dr.iastate.edu/etd/10622
Transcript
Graduate Theses and Dissertations Iowa State University Capstones, Theses andDissertations
2009
Energy and nutrient cycling in pig productionsystemsPeter J. LammersIowa State University
Follow this and additional works at: https://lib.dr.iastate.edu/etd
Part of the Animal Sciences Commons
This Dissertation is brought to you for free and open access by the Iowa State University Capstones, Theses and Dissertations at Iowa State UniversityDigital Repository. It has been accepted for inclusion in Graduate Theses and Dissertations by an authorized administrator of Iowa State UniversityDigital Repository. For more information, please contact [email protected].
Recommended CitationLammers, Peter J., "Energy and nutrient cycling in pig production systems" (2009). Graduate Theses and Dissertations. 10622.https://lib.dr.iastate.edu/etd/10622
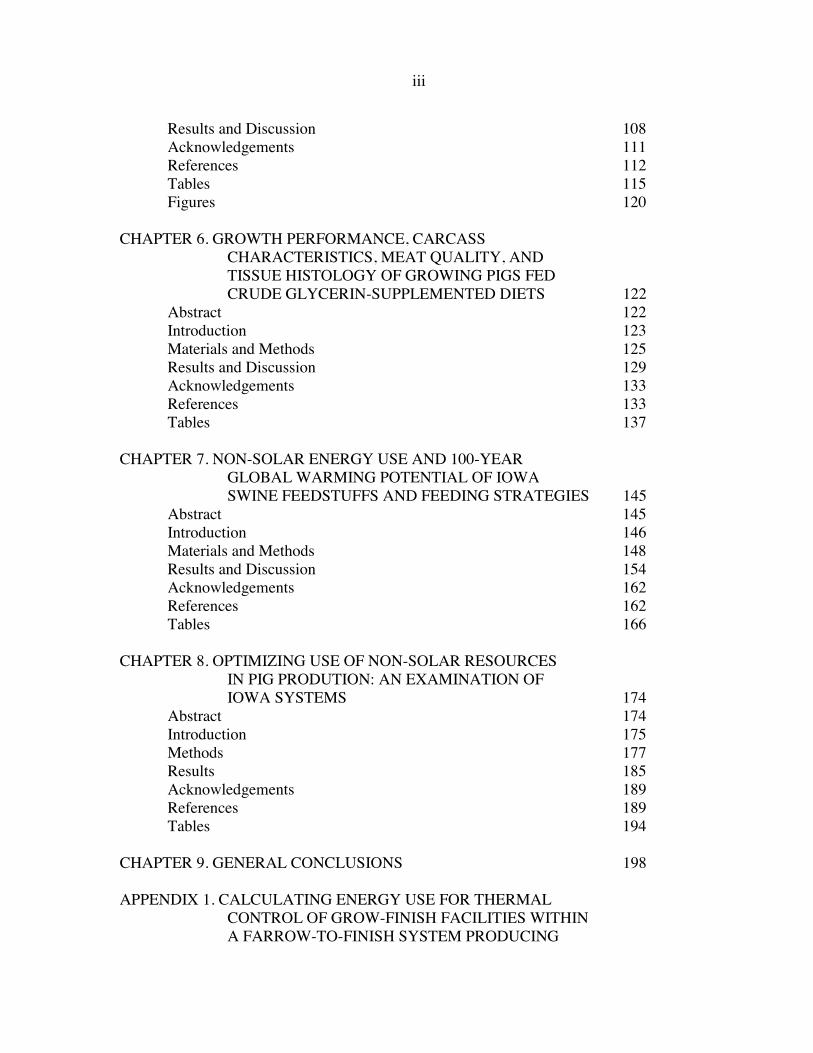
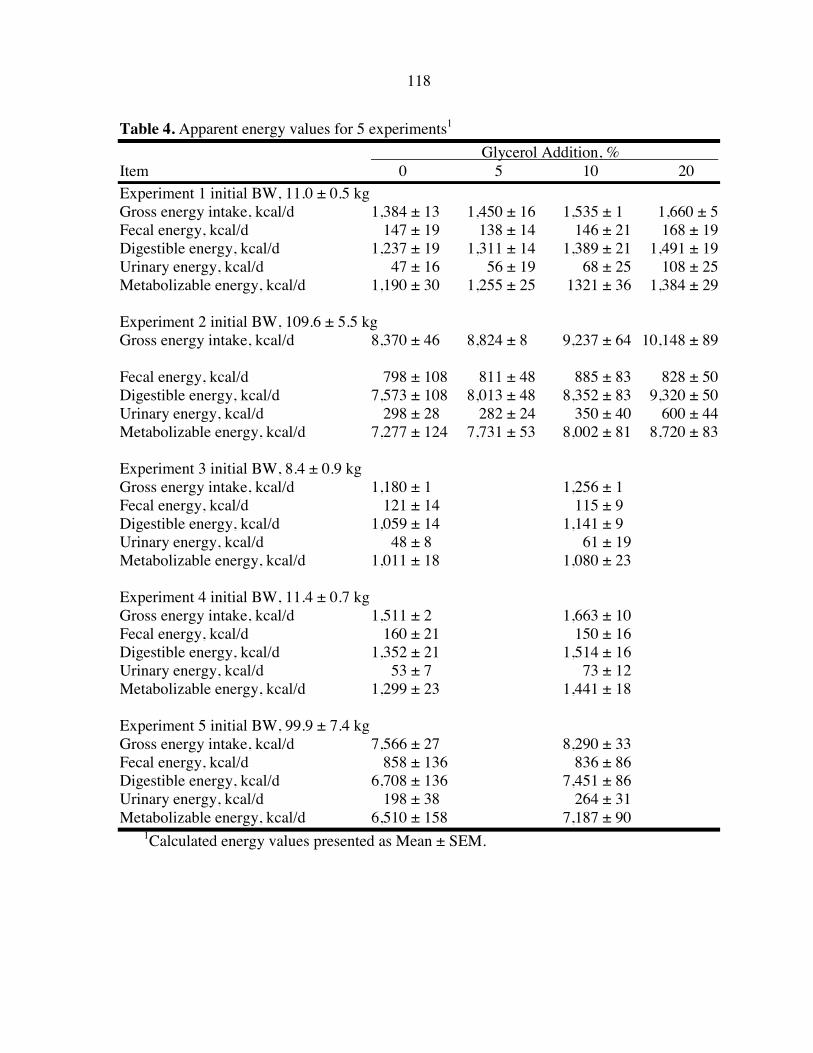
CHAPTER 1. GENERAL INTRODUCTION 1 Dissertation organization 4 CHAPTER 2. LITERATURE REVIEW 5 Energy 5 Carbon 6 Life Cycle Assessment 7 LCA of Swine Feed Ingredients 8 Energy in Pig Nutrition 14 Amino Acids 17 References 19 Tables 23 CHAPTER 3. CONSTRUCTION RESOURCE USE OF TWO DIFFERENT TYPES AND SCALES OF IOWA SWINE PRODUCTION FACILITIES 25 Abstract 25 Introduction 26 Methods 27 Results 34 Conclusions 40 Acknowledgements 41 References 41 Tables 43 Figures 49 CHAPTER 4. ENERGY AND CARBON INVENTORY OF IOWA SWINE PRODUCTION FACILITIES 54 Abstract 54 Introduction 55 Methods 57 Results 77 Discussion 86 Acknowledgements 88 References 88 Tables 92 CHAPTER 5. DIGESTIBLE AND METABOLIZABLE ENERGY OF CRUDE GLYCEROL FOR GROWING PIGS 103 Abstract 103 Introduction 104 Materials and Methods 105
iii
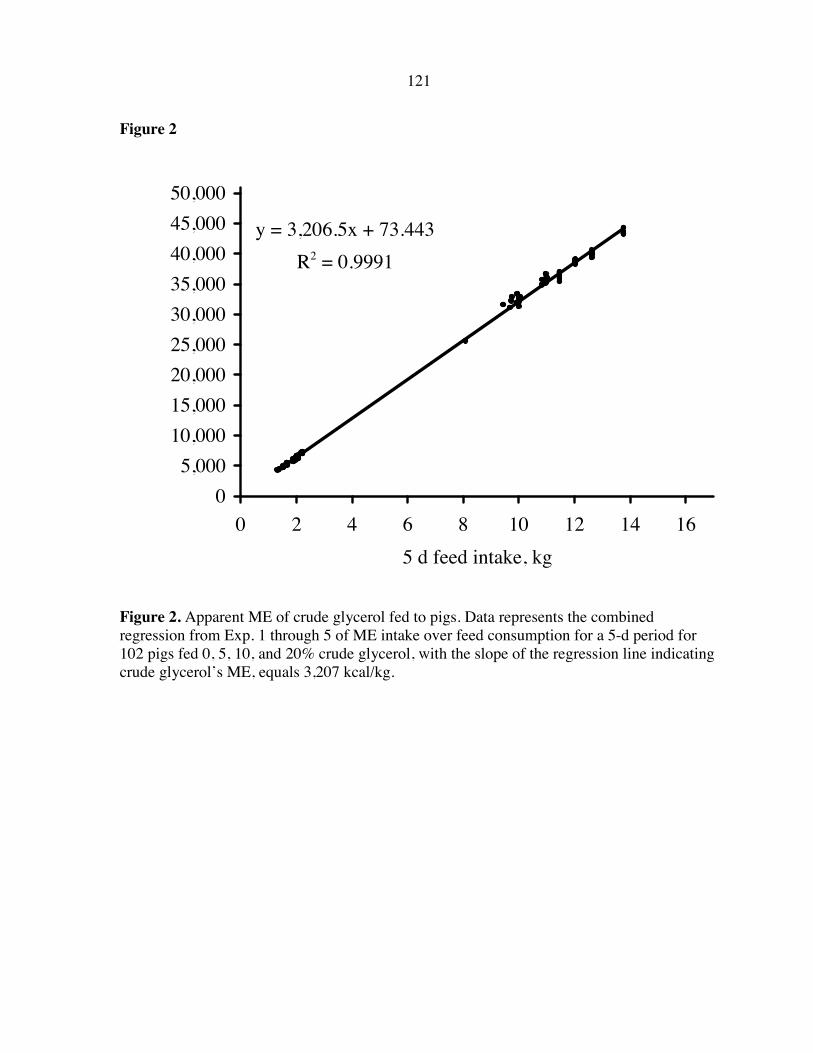
Results and Discussion 108 Acknowledgements 111 References 112 Tables 115 Figures 120 CHAPTER 6. GROWTH PERFORMANCE, CARCASS CHARACTERISTICS, MEAT QUALITY, AND TISSUE HISTOLOGY OF GROWING PIGS FED CRUDE GLYCERIN-SUPPLEMENTED DIETS 122 Abstract 122 Introduction 123 Materials and Methods 125 Results and Discussion 129 Acknowledgements 133 References 133 Tables 137 CHAPTER 7. NON-SOLAR ENERGY USE AND 100-YEAR GLOBAL WARMING POTENTIAL OF IOWA SWINE FEEDSTUFFS AND FEEDING STRATEGIES 145 Abstract 145 Introduction 146 Materials and Methods 148 Results and Discussion 154 Acknowledgements 162 References 162 Tables 166 CHAPTER 8. OPTIMIZING USE OF NON-SOLAR RESOURCES IN PIG PRODUTION: AN EXAMINATION OF IOWA SYSTEMS 174 Abstract 174 Introduction 175 Methods 177 Results 185 Acknowledgements 189 References 189 Tables 194 CHAPTER 9. GENERAL CONCLUSIONS 198 APPENDIX 1. CALCULATING ENERGY USE FOR THERMAL CONTROL OF GROW-FINISH FACILITIES WITHIN A FARROW-TO-FINISH SYSTEM PRODUCING
iv
15,600 MARKET PIGS ANNUALLY 203 References 209 Tables 211 APPENDIX 2. CROP PRODUCTION MODEL 216 Model Descriptions and Assumptions 216 Results 221 References 224 Tables 228 APPENDIX 3. PIG FEED INGREDIENT MANUFACTURING AND DELIVERY: PROCESS INVENTORY AND ASSUMPTIONS 234 Transportation and Diet Mixing 234 Primary Feed Ingredients 235 Bio-fuel Co-products 238 Micro-ingredients 241 Results 246 Conclusions 247 References 247 Tables 252 ACKNOWLEDGEMENTS 256
1
CHAPTER 1. GENERAL INTRODUCTION
Life depends on three inter-woven basics: energy, nutrients, and a supporting
environment. This dissertation is an examination of those three basics under the context of
complementary crop and pig production in Iowa. The ultimate goal is to provide useful
information to the general public, students, policy makers, and fellow academics about the
potential impacts of different pig production systems. An overarching assumption of this
dissertation is that pigs and crops will be raised in Iowa and that human society will not
spontaneously alter its modus operandi. It is my hope that with information based decision
making we can better address the mounting challenges we face and foster the advancement of
a more sustainable agriculture.
United States pig production is concentrated in Iowa, and is a major influence on the
economic and ecological condition of that community. A pig production system includes
buildings, equipment, feed ingredients, feed processing, and nutrient management at the
individual farm level. Energy is used in all aspects of pig production, from the manufacture
of materials used in building construction to the cultivation and processing of feedstuffs.
Historically the availability of fossil fuels has minimized pressure to consider all uses of non-
solar energy in pig production. Rising energy prices, uncertain access to petroleum supplies,
and recognition of the environmental impacts of using fossil fuels are increasing awareness
and incentives to reduce the use of limited non-solar energy resources. Comprehensive,
accurate information is critical to informed decision making. Analysis of non-solar energy
2
use by modern pig farms in the state of Iowa, the Midwest region, and the United States is
lacking.
Greenhouse gas emission by human activity impacts the supporting environment that
all Earth-based life relies on. The emission of greenhouse gases by agriculture is impacted by
both crop and livestock sectors. Consumption of energy results in emission of greenhouse
gases. If non-solar energy use in the construction and operation of a pig farm can be
minimized, greenhouse gas emissions may decline. Both carbon sequestration and soil
erosion potential is heavily influenced by cropping systems and indirectly affected by diets
fed to pigs. If a perennial crop such as alfalfa could be incorporated into the feeding regime
of pigs, there may be potential for decreasing losses of soil and soil bound nutrients due to
erosion and generation of soil organic matter through carbon sequestration.
Nutrient cycling within an agricultural system can greatly impact energy use by that
system. Internal cycling of nutrients such as occurs when pig manure is returned to fields
producing the crops that ultimately feed the growing pigs may lower the need for synthetic
sources of fertility. Synthetic forms of fertility typically require significant amounts of
energy to generate and transport. Thus utilizing locally produced, animal-based sources of
fertility can lower the non-solar energy use of crop production. Nutrients can also move from
a pig production system to air and water and thus impact the supporting environment.
Energy use, nutrient cycling, and ecological impacts on the global environment of
agricultural systems are not isolated events or entities. Rather they are interconnected
influences which must be considered simultaneously when evaluating the desirability of a
given production system, or when designing an agroecosystem suitable for a particular
landscape. Models are simplified representations of complex reality and as such allow
3
modelers to predict likely trends within a system as well as the magnitude of changes
resulting from management decisions. The utility of a model obviously relies to a great
extent on the accuracy of modeling assumptions used as well as correctly representing the
relationships and interactions that occur within a system. Although imperfect, models can be
powerful analytical tools. Thus to predict the comparative non-solar energy use and
ecological impacts of different pig production systems a series of complimentary and
interconnected models were developed and used.
This dissertation quantifies non-solar energy use in the construction and operation of
pig production systems in Iowa. A pig production system includes buildings, equipment, feed
ingredients, feed processing, and nutrient management at the individual farm level. Non-solar
energy use, nutrient cycling, and environmental impact by different phases of pig production,
under different diet and facility scenarios are modeled and compared using process analysis
methodology. All energy inputs (direct and indirect) into a pig production system are
considered based upon physical material flows. Direct energy is used within the system for
agricultural production. Diesel fuel, electricity, and feed use are examples of direct energy.
Energy used to produce farm inputs such as mineral fertilizers, seeds, gates, building
materials and equipment are examples of indirect or embedded energy. For this project,
indirect energy use one-step backwards from the farm is considered e.g. the energy used to
produce gates and feeders will be included but not the energy used to manufacture the
equipment to produce the gates and feeders. Energy and material flows within and out of a
pig production system are compared to energy and material flows into the system in order to
calculate energy use efficiency.
4
DISSERTATION ORGANIZATION
This thesis is divided into a literature review, six papers, a general summary, and
three appendices. The six manuscripts that comprise the bulk of this dissertation have been
published, accepted for publication, or are awaiting submission to an appropriate scientific
journal and are individually formatted according to the guidelines of each journal.
5
CHAPTER 2: LITERATURE REVIEW
ENERGY
There are two broad categories of energy—embodied and operating. Embodied
energy is the energy required to produce, manufacture, provide, or supply a product, material,
or service (Hammond and Jones, 2008b). In pig buildings, energy used to manufacture
facility components such as concrete, steel, and plastics are examples of embodied energy.
Operating energy is the energy directly used by a system to function on a daily basis. In pig
buildings, electricity to operate ventilation systems, liquefied petroleum gas to heat buildings,
and diets fed to pigs are examples of operating energy. To borrow terminology from
economics, operating energy can be considered analogous to variable costs—costs (energy
use) that are incurred only if pig production occurs. Alternatively, embodied energy can be
viewed as fixed costs—costs (energy use) that are incurred to create and maintain the means
of production even if no pigs are actually raised.
GREENHOUSE GASES
The emission of energy related pollutants is a major influence of global climate
alteration (IPCC, 2006, 2007). Global climate altering emissions (greenhouse gases) are
usually reported in terms of carbon equivalents (IPCC, 2006, 2007). Three greenhouse gases
are of primary importance when relating global climate change to energy use—carbon
dioxide (CO2), methane (CH4) and nitrous oxide (N2O) (IPCC, 2006, 2007). Global warming
potential (GWP) is a measure of how much a given mass of greenhouse gas contributes to
global climate change (IPCC, 2006, 2007). Global warming potential is calculated over a
period of time and so a time-scale must be reported in order for GWP’s of different processes
to be meaningfully compared. Reporting greenhouse gas emissions in terms of 100-year
6
GWP relative to CO2 is standard international practice (IPCC, 2007). Table 1 presents 100-yr
GWP of the three greenhouse gases of primary interest. As table 1 shows, all greenhouse
gases are not equal. For example 1.0 kg N2O has the 100-yr GWP of 298.0 kg CO2.
Caculating 100-yr GWP from energy consumption is simply a matter of converting emissions
of CO2, CH4, and N2O into CO2 equivalents and summing the results. Combusting 1 GJ of
liquefied petroleum gas (LP gas) on farms is reported to result in emission of 63,100 g CO2,
5.0 g CH4, and 0.1 g N2O per GJ of energy released (IPCC, 2006). Equation 1 presents the
calculation of the 100-yr GWP of burning 1 GJ LP gas.
Equation 163,100 g CO2
1 GJ LP gas 1 g CO2 equivalents
1 g CO2
63,100 g CO2 equivalents1 GJ LP gas
5.0 g CH41 GJ LP gas
25 g CO2 equivalents
1 g CH4
125 g CO2 equivalents1 GJ LP gas
0.1 g N2O1 GJ LP gas
298 g CO2 equivalents
1 g N2O 29.8 g CO2 equivalents
1 GJ LP gas
63,100 g 125 g 298 g 63,523 g CO2 equivalents 1 GJ LP gas
The energy density assumptions and calculated 100-yr global warming potential of
six sources of energy on Iowa farms is summarized as table 2.
CARBON
Linking greenhouse emissions with energy consumption gives rise to the notion of
embodied carbon (Hammond and Jones, 2008b) and operating carbon. For example the
embodied carbon of steel used in a pig building would be the greenhouse gas emissions
associated with consumption of energy during production of that steel. Similarly, the
7
operating carbon of a ventilation system in a pig barn would be the greenhouse gas emissions
that result from generation of electricity to operate fans.
LIFE CYCLE ASSESSMENT
Life cycle assessment (LCA) is a technique to analyze the environmental aspects and
impacts associated with a product, process or service (ISO, 2006; EPA, 2008b). The main
components of LCA include:
1) Inventory of all relevant energy and material inputs and environmental releases
2) Evaluation of the impacts associated with inputs and releases
(ISO, 2006; EPA, 2008b)
As the name implies LCA examines the life span of a product or service. This allows
more complete accounting of the environmental impact of goods and services, but also
necessitates clearly defining the beginning and end points of a product’s lifespan.
There are several approaches to LCA ranging from cradle-to-gate, cradle-to-grave,
and cradle-to-cradle (Hawken et al., 1999; Hammond and Jones, 2008a; Hammond and
Jones, 2008b). The main difference is in the endpoint of the examined life cycle. For clarity,
consider the basic example of a steel pig feeder. Cradle-to-grave LCA begins with extraction
of raw materials (including recycled materials if applicable) needed to produce a product and
ends with disposal of the product at the end of its use (Hammond and Jones, 2008a). Using
our steel feeder example, the cycle begins with mining of iron ore and ends with eventual
scrapping of the feeder after several years of use. Cradle-to-cradle LCA begins with
extraction of raw materials (including recycled materials if applicable) needed to produce a
product and ends with the recycling of the product into another product (Hawken et al.,
1999). In this case the LCA would end with the recycling of the steel feeder into another
8
metal product. Cradle-to-gate LCA begins with extraction of raw materials (including
recycled materials if applicable) and ends with delivery of the product to its point of use. In
this case the LCA would end when the feeder is delivered to a pig farm (Hammond and
Jones, 2008a; Hammond and Jones, 2008b). Because of the inherent difficulties in tracking
inputs and impacts after a product has been delivered to its point of use, many LCA reports
are technically cradle-to-gate analyses (LaHore and Croke, 1978; Ericksson et al., 2005;
Dalgaard et al., 2008; Hammond and Jones, 2008b).
LCA OF SWINE FEED INGREDIENTS
Because feed is the largest single input in swine production, the energy inputs and
associated environmental impacts of swine feed ingredients have received the most attention
(LaHore and Croke, 1978; Binder, 2003; Ericksson et al., 2005; Nielsen et al., 2006; Nielsen
and Wenzel, 2006; Dalgaard et al., 2008). LaHore and Croke reported support energy needed
to produce 19 feed ingredients for Australian pig production (LaHore and Croke, 1978). This
report excludes corn and does not provide nutritional analysis of the included ingredients
(LaHore and Croke, 1978).
Exogenous phytase and synthetic amino acids are an important part of consideration
in modern pig production and providing those products is a multi-billion dollar business for
ingredient manufacturers (Binder, 2003; Nielsen et al., 2006; Nielsen and Wenzel, 2006).
Assessments of exogenous phytase have reported that the key energetic advantage of feeding
phytase is reducing the amount of inorganic phosphorus in pig diets (Nielsen et al., 2006;
Nielsen and Wenzel, 2006). From a pig production standpoint, it has been demonstrated that
inclusion of exogenous phytase enables utilization of plant source phosphorus by pigs and
allows diets containing reduced amounts of inorganic phosphorus to be nutritionally adequate
9
(Veum et al., 2006; Veum and Ellersieck, 2008; Emiola et al., 2009). Literature on the LCA
of synthetic amino acids is less available. After an extensive search of multiple data bases,
published articles, and personal communications with ingredient manufactures, only one
publication presenting the production energy of synthetic amino acids could be found
(Binder, 2003). Binder (2003) reports that chemical synthesis of 1.0 kg DL-methionine
requires 88.0 MJ of primary energy. This value is considerably higher than the estimate of
50.0 MJ/kg for supplemental ingredients including synthetic amino acids reported by LaHore
and Croke (1978). The paucity of information in the published literature pertaining to the
energy required to produce L-lysine, the synthetic amino acid most commonly fed to pigs is
unfortunate and should be rectified.
Production of soybean meal in Argentina with subsequent delivery to Rotterdam
Habor, in the Netherlands has been reported (Dalgaard et al., 2008). Imported soybean meal
is a major source of amino acids for pigs in Europe (Ericksson et al., 2005; Dalgaard et al.,
2008). The application of information presented by Dalgaard et al. (2008) to Iowa swine
production must take into account the likelihood of substantial reductions in transportation
energy required. Dalgaard et al. (2008) estimate an ocean voyage of more than 12,000 km for
soybean meal from Argentina to the Netherlands. Given Iowa’s leadership in U. S. soybean
production (USDA, 2009) and processing (Hardy, 2009), it is reasonable to assume that
soybean meal fed in Iowa travels a much shorter distance.
ASSESSMENT OF PIG PRODUCTION INPUTS AND IMPACTS
Iowa pig production in 1975 was estimated to require input of 2,622 MJ non-solar
energy per 100 kg of liveweight (Reid et al., 1980). Approximately 65% of the energy input
was directly associated with swine feed (Reid et al., 1980). For every 100 kg of pigs
10
produced 809 m2 of cropland was required (Reid et al., 1980). United States pig production
has changed dramatically since 1975, but Reid et al (1980) provides a historic perspective of
Iowa pig production.
The efficiency of Swedish pork production reportedly increased by approximately
20% between the years 1972 and 1993 (Uhlin, 1998). Feed and fertilizers accounted for 60%
of the energy input in Swedish pork production in 1993 (Uhlin, 1998). Uhlin (1998) reported
the total energy use for pig production relative to energy output in pork. This is a unique
reporting strategy among the LCA literature pertaining to pig production. The researchers
reported that in 1993, Swedish pork required 4.10 MJ non-solar energy input for every 1.0
MJ of pork produced (Uhlin, 1998). The energy density of fresh pork carcass, excluding bone
and skin is reported as 15.73 MJ/kg (USDA, 2008). Assuming a reported dressing percentage
of 72% for pigs (Lammers et al., 2008), the non-solar energy input is calculated to be 46.4
MJ/kg live weight.
Indicators of resource use and environmental impact for 5 pig farms in Denmark were
collected for 3 years (1994–1997) (Halberg, 1999). The selected farms did not statistically
represent Danish farms, but they were typical pig farms for Denmark at that time (Halberg,
1999). Non-solar energy inputs of 13–20 MJ per 1.0 kg of live weight was reported with no
examination of the portion of non-solar energy committed to feed production presented
(Halberg, 1999).
Dutch researchers compared pork with pea-based protein for human nutrition and
assumed 3,783 MJ of non-solar energy input for every 112.2 kg pig (Zhu and van Ierland,
2004). The researchers included energy use for growing crops, manufacturing feed, pig
farming, harvest of the animal, and processing of meat products (Zhu and van Ierland, 2004).
11
Although their precise methodology is opaque, it is estimated that Zhu and van Ierland
(2004) attributed 70% of the total non-solar energy input to producing the pig or 2,650 MJ
per 112.2 kg live pig. A total of 741.7 kg of CO2 equivalents were attributed to each pig
through the entire pork chain (Zhu and van Ierland, 2004). Because greenhouse gas
emissions are closely tied to energy consumption, it is estimated that 70% of the total CO2
equivalents (519 kg) were allocated to producing the 112.2 kg market pig.
The estimated non-solar energy use for pig production under different production
schemes in France ranges from 15.9–22.2 MJ per kg of pig (Basset-Mens and van der Werf,
2005). The scenario most closely resembling commodity pork production in the United
States required 15.9 MJ of non-solar energy input and resulted in emission of 2.3 kg CO2
equivalents per 1.0 kg of pig live weight (Basset-Mens and van der Werf, 2005). The French
researchers estimated 2.7% of total non-solar energy use should be attributed to operation of
pig housing with 74% of the non-solar energy use being associated with crop and feed
production (Basset-Mens and van der Werf, 2005).
Researchers in Sweden focused on the impact of feed choice on energy use and
environmental impacts of pork production (Ericksson et al., 2005). Three scenarios for
protein supply were considered—imported soybean meal, locally produced peas and
rapeseed cake, and locally produced peas and rapeseed cake with synthetic amino acids
(Ericksson et al., 2005). Their analysis assumed soybean meal was imported from South
America, this resulted in the pigs fed soybean meal based diets requiring 6.8 MJ non-solar
energy input/kg pig growth (Ericksson et al., 2005). Pigs fed locally sourced peas and
rapeseed cake required the least non-energy input, 5.3 MJ/kg growth (Ericksson et al., 2005).
Adding synthetic amino acids to locally sourced peas and rapeseed cake dramatically reduced
12
predicted nitrogen excretion by the growing pigs, but resulted in use of 6.3 MJ non-solar
energy per kg of pig growth (Ericksson et al., 2005). The researchers focused exclusively on
the grow-finish stage of production and did not include energy use or environmental impacts
resulting from operation of pig housing (Ericksson et al., 2005). The three dietary scenarios
resulted in emission of 1.5, 1.3, and 1.4 kg CO2 equivalents/kg of pig growth (Ericksson et
al., 2005).
A 2006 United Kingdom report estimated the non-solar energy use for 1.0 kg of pork
as 17.0 MJ and the 100-yr GWP as 6.4 kg CO2 equivalents (Williams et al., 2006). The
purpose of this report was to compare many different commodities with each other rather
than methods for producing one particular product (Williams et al., 2006). Energy use for
building operation was not reported and no comparisons of different types of pig farms were
made (Williams et al., 2006).
Belgium researchers used a Flemish farm database of technical and economic records
to establish a representative specialized pig farm for modeling purposes (Meul et al., 2007).
They used this model farm to estimate energy use efficiency for different farm types using
process analysis methodology (Meul et al., 2007). This method calculates direct and indirect
energy inputs based on physical material flows and ignores solar energy and human labor
inputs (Jones, 1989). Although inclusion of human labor inputs would result in a more
complete evaluation of agricultural systems the difficulty in quantifying and allocating
human labor and the corresponding introduction of error into the analysis is generally
considered to outweigh the potential benefits (Jones, 1989). Meul et al. (2007) considered
energy input using the cradle-to-gate approach of LCA. They included embodied energy use
one step backwards from the farm—i.e. energy used to produce fertilizers was included,
13
energy used to manufacture the fertilizer plant was not (Meul et al., 2007). Non-solar energy
use of 17.2 MJ/kg carcass weight was reported for the average pig farm model with 70% of
the non-solar energy use being directly attributed to feed production (Meul et al., 2007). The
researchers also generated a model representing the 5% most energy efficient pig farms and
examined energy use for those operations (Meul et al., 2007). It is estimated that the most
energy efficient pig farms require10.6 MJ of non-solar energy use/kg carcass weight with
73% of non-solar energy use directly attributed to feed (Meul et al., 2007).
The most recent assessment of swine production was conducted in Denmark and
focuses exclusively on global warming, eutrophication, acidification, and photochemical
smog (Dalgaard et al., 2007). Resource use for grain, soybean meal, heat, and electricity are
stated and can be used to calculate non-solar energy consumption. If a barley-soybean meal
diet is assumed total non-solar energy inputs are 43.34 MJ/kg pork (Dalgaard et al., 2007).
This assumes a gross energy (GE) value for barley and soybean meal of 15.9 and 17.2 MJ/kg
respectively (Sauvant et al., 2004). Valuing feed inputs based on GE is problematic from a
nutritional standpoint, but is the most straightforward method to derive a non-solar energy
input estimate from the provided information. For every 1.0 kg pork produced under the
conditions of the Danish model, emission of 3.6 kg CO2 equivalents occurs (Sauvant et al.,
2004).
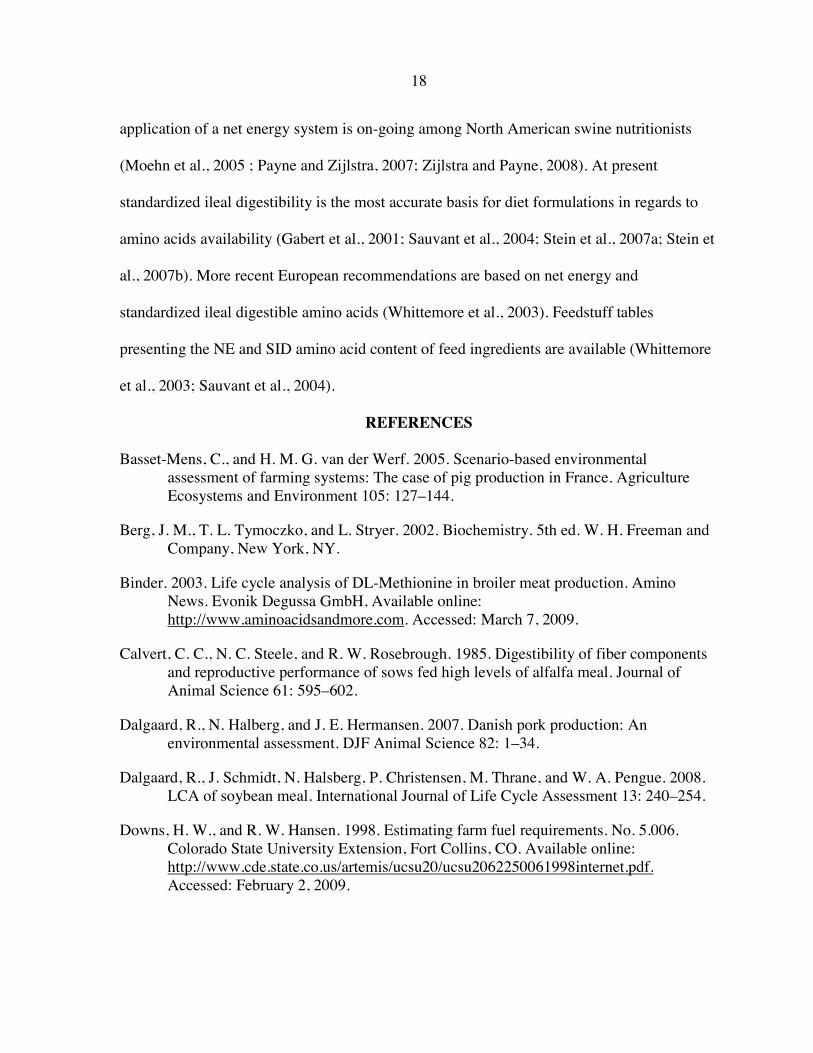
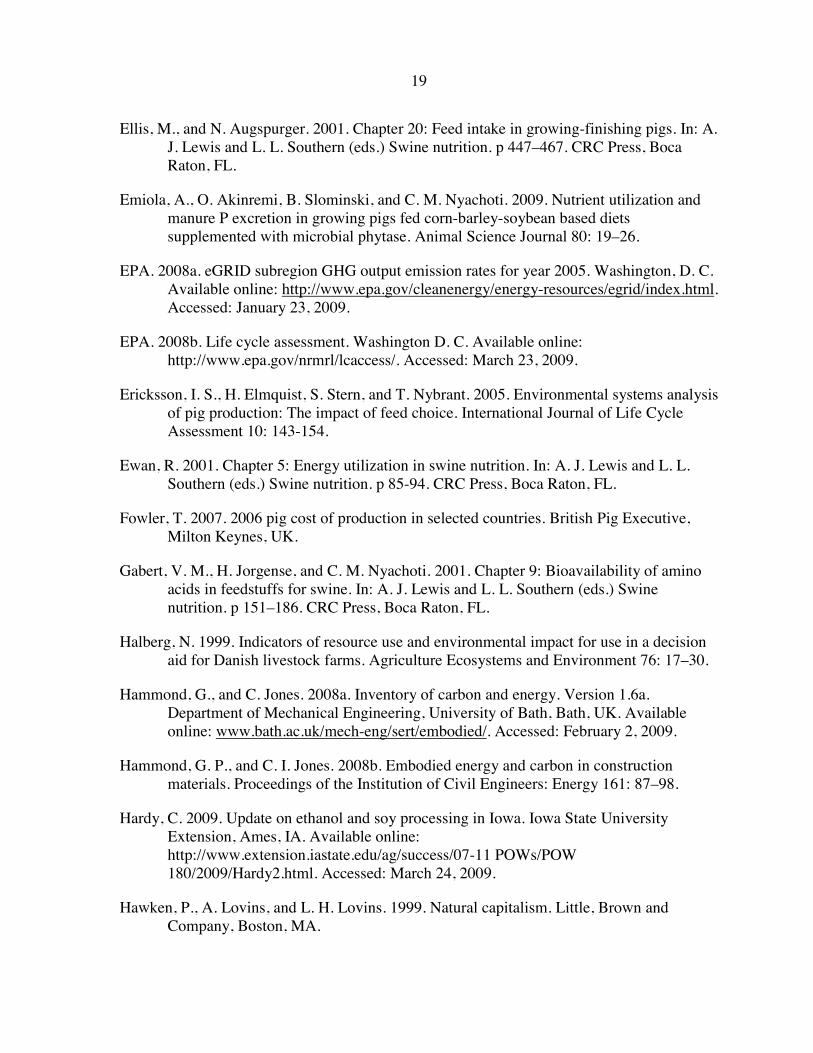
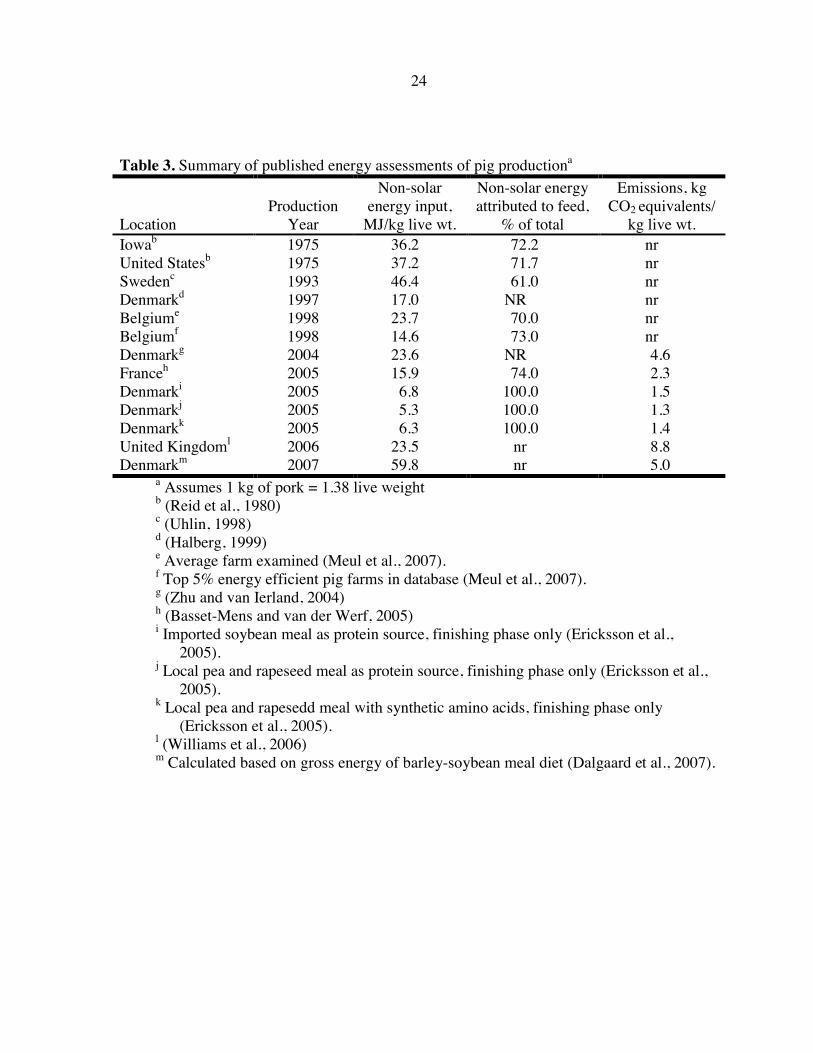
Table 3 summarizes nine reports of energy use and CO2 emissions for pork
production. Recent work in this area has focused in Europe and Denmark in particular. There
are fundamental differences between European and United State pigs production that limits
the application of European results to inform decision making by pig producers in Iowa.
European swine diets typically include more variety in feed ingredients and often include
14
high amounts of small grains such as barley. Peas, rapeseed cake, and soybean meal are all
commonly used as protein sources in European swine diets. Iowa swine diets are almost
entirely comprised of corn and soybean meal. Pigs are generally limit fed in Europe and fed
ad libitum Iowa. Diet form may also vary. Feeding pelleted or liquid feeds in Europe is
common while in the United States almost all diets are fed as dry mash. Some Iowa farms do
provide water at the feeder, encouraging consumption of a wet-dry feed, but this strategy is
very different from liquid feeding systems seen in Europe. Market weight in the United
States is also heavier than in Europe. Finally climate conditions and primary environmental
concerns are different between Europe and Iowa.
ENERGY IN PIG NUTRITION
Approximately 60-80% of the total cost of pork production can be attributed to
providing feed to the animal (Fowler, 2007). And energy components account for 80-90% of
pig diets by mass (Holden et al., 1996). Historically highly digestible starches have been the
primary source of energy in pig diets with fats and oils playing an important role particularly
in diets for young pigs. Forages and nonstarch polysaccharides are of limited use in modern
growing pig diets although these feedstuffs can be fed to pregnant sows without negative
effects on reproductive performance (Calvert et al., 1985; van der Peet-Schwering et al.,
2002). Proteins can be catabolized by the pig. Proteins are less energy dense than lipids and
have an energy density that is similar to carbohydrates (Berg et al., 2002; Salway, 2004).
Catabolism of proteins requires elimination of nitrogen from the body, an activity that lowers
the net gain in biologically useful energy from oxidation of proteins relative to carbohydrates
and lipids (Berg et al., 2002; Salway, 2004). Traditionally the price premium paid for
15
proteinaceous feedstuffs has been too high for widespread use of protein as a source of
energy for pigs.
Gross energy (GE) is the theoretical maximum energy that could be used by the pigs
and is defined as the energy releases as heat following total combustion of a feedstuff (NRC,
1998; Ewan, 2001). Although GE is the starting point for further calculations, it is not a good
measure of useful energy for pigs because it does not consider any of the losses of energy
during ingestion, digestion, and metabolism of a feedstuff (Moehn et al., 2005). For example
1.0 kg of starch has approximately the same amount of GE as 1.0 kg of straw (Moehn et al.,
2005) and 1.0 kg of corn has similar GE as 1.0 kg of soybean hulls (Sauvant et al., 2004).
Terms commonly used to describe dietary energy include DE, ME, and NE (Ewan,
2001; Moehn et al., 2005). Digestible energy (DE) is the GE of the feed consumed minus the
GE of the feces excreted (NRC, 1998; Ewan, 2001; Moehn et al., 2005). Metabolizable
energy (ME) is DE minus energy excreted in urine and combustible gases (NRC, 1998;
Ewan, 2001; Moehn et al., 2005). While DE and ME are relatively simple to determine, they
only express potential energy and do not take into consideration the pig’s ability to utilize
energy from different dietary sources (Moehn et al., 2005; Noblet, 2006, 2007). Given work
demonstrating pigs utilize energy present in consumed starch, protein, and lipid at different
efficiencies (van Milgen et al., 2001), DE and ME values for feedstuffs are limited. The
practical effect of using DE and ME systems is that they typically overestimate the energy
value of protein and underestimate the energy value of lipids (Noblet, 2007; Payne and
Zijlstra, 2007).
Net energy (NE) values of feedstuffs provide a more precise measure of the energy
available for use by the animal (Ewan, 2001; Moehn et al., 2005; Noblet, 2007). Net energy
16
is defined as ME minus the heat produced during digestion of feed, metabolism of nutrients,
and excretion of wastes (Ewan, 2001; Moehn et al., 2005). The energy left following those
losses—energy in feces, urine, and gaseous products of digestion, and heat produced during
digestion, metabolism, and excretion—is the energy actually used by the animal for
maintenance and production (Moehn et al., 2005; Noblet, 2006, 2007). Net energy is thus the
only system that expresses usable dietary energy by incorporating the efficiency of nutrient
use. Most North American swine nutritionists are most familiar with DE and ME systems.
Although DE or ME systems may have been sufficient when formulating simple diets
containing primarily corn and soybean meal, the advantages of the NE system are greater as
diet complexity increases. Discussion surrounding adoption and application of a net energy
system is on-going among North American swine nutritionists (Moehn et al., 2005 ; Payne
and Zijlstra, 2007; Zijlstra and Payne, 2008).
As noted by Payne and Zijlstra (2007) the efficacy of any energy system is dependent
upon the accuracy of the energy values assigned to a set of ingredients. The DE, ME, and NE
values of many ingredients can be readily obtained from feeding tables (NRC, 1998; Sauvant
et al., 2004) but use of those values are only appropriate for ingredients having chemical
characteristics similar to those in the tables (Noblet, 2007). As feed ingredients become
increasingly differentiated—DDGS from one particular ethanol plant, soybean meal from
presenting the NE and SID amino acid content of feed ingredients are available (Whittemore
et al., 2003; Sauvant et al., 2004).
REFERENCES
Basset-Mens, C., and H. M. G. van der Werf. 2005. Scenario-based environmental assessment of farming systems: The case of pig production in France. Agriculture Ecosystems and Environment 105: 127–144.
Berg, J. M., T. L. Tymoczko, and L. Stryer. 2002. Biochemistry. 5th ed. W. H. Freeman and Company, New York, NY.
Binder. 2003. Life cycle analysis of DL-Methionine in broiler meat production. Amino News. Evonik Degussa GmbH, Available online: http://www.aminoacidsandmore.com. Accessed: March 7, 2009.
Calvert, C. C., N. C. Steele, and R. W. Rosebrough. 1985. Digestibility of fiber components and reproductive performance of sows fed high levels of alfalfa meal. Journal of Animal Science 61: 595–602.
Dalgaard, R., N. Halberg, and J. E. Hermansen. 2007. Danish pork production: An environmental assessment. DJF Animal Science 82: 1–34.
Dalgaard, R., J. Schmidt, N. Halsberg, P. Christensen, M. Thrane, and W. A. Pengue. 2008. LCA of soybean meal. International Journal of Life Cycle Assessment 13: 240–254.
Downs, H. W., and R. W. Hansen. 1998. Estimating farm fuel requirements. No. 5.006. Colorado State University Extension, Fort Collins, CO. Available online: http://www.cde.state.co.us/artemis/ucsu20/ucsu2062250061998internet.pdf. Accessed: February 2, 2009.
19
Ellis, M., and N. Augspurger. 2001. Chapter 20: Feed intake in growing-finishing pigs. In: A. J. Lewis and L. L. Southern (eds.) Swine nutrition. p 447–467. CRC Press, Boca Raton, FL.
Emiola, A., O. Akinremi, B. Slominski, and C. M. Nyachoti. 2009. Nutrient utilization and manure P excretion in growing pigs fed corn-barley-soybean based diets supplemented with microbial phytase. Animal Science Journal 80: 19–26.
EPA. 2008a. eGRID subregion GHG output emission rates for year 2005. Washington, D. C. Available online: http://www.epa.gov/cleanenergy/energy-resources/egrid/index.html. Accessed: January 23, 2009.
EPA. 2008b. Life cycle assessment. Washington D. C. Available online: http://www.epa.gov/nrmrl/lcaccess/. Accessed: March 23, 2009.
Ericksson, I. S., H. Elmquist, S. Stern, and T. Nybrant. 2005. Environmental systems analysis of pig production: The impact of feed choice. International Journal of Life Cycle Assessment 10: 143-154.
Ewan, R. 2001. Chapter 5: Energy utilization in swine nutrition. In: A. J. Lewis and L. L. Southern (eds.) Swine nutrition. p 85-94. CRC Press, Boca Raton, FL.
Fowler, T. 2007. 2006 pig cost of production in selected countries. British Pig Executive, Milton Keynes, UK.
Gabert, V. M., H. Jorgense, and C. M. Nyachoti. 2001. Chapter 9: Bioavailability of amino acids in feedstuffs for swine. In: A. J. Lewis and L. L. Southern (eds.) Swine nutrition. p 151–186. CRC Press, Boca Raton, FL.
Halberg, N. 1999. Indicators of resource use and environmental impact for use in a decision aid for Danish livestock farms. Agriculture Ecosystems and Environment 76: 17–30.
Hammond, G., and C. Jones. 2008a. Inventory of carbon and energy. Version 1.6a. Department of Mechanical Engineering, University of Bath, Bath, UK. Available online: www.bath.ac.uk/mech-eng/sert/embodied/. Accessed: February 2, 2009.
Hammond, G. P., and C. I. Jones. 2008b. Embodied energy and carbon in construction materials. Proceedings of the Institution of Civil Engineers: Energy 161: 87–98.
Hardy, C. 2009. Update on ethanol and soy processing in Iowa. Iowa State University Extension, Ames, IA. Available online: http://www.extension.iastate.edu/ag/success/07-11 POWs/POW 180/2009/Hardy2.html. Accessed: March 24, 2009.
Hawken, P., A. Lovins, and L. H. Lovins. 1999. Natural capitalism. Little, Brown and Company, Boston, MA.
20
Hill, J., E. Nelson, D. Tilman, S. Polasky, and D. Tiffany. 2006. Environmental, economic, and energetic costs and benefits of biodiesel and ethanol biofuels. Proceedings of the National Academy of Sciences 103: 11206-11210.
Holden, P., R. Ewan, M. Jurgens, T. Stahly, and D. Zimmerman. 1996. Life cycle swine nutrition. PM-489. Iowa State University Extension, Ames, IA.
Huo, H., M. Wang, C. Bloyd, and V. Putsche. 2008. Life-cycle assessment of energy and greenhouse gas effects of soybean-derived biodiesel and renewable fuel. Argonne National Laboratory, Argonne, IL. Available online: http://www.transportation.anl.gov/pdfs/AF/467.pdf. Accessed: February 6, 2009.
IPCC. 2006. 2006 IPCC guidelines for national greenhouse gas inventories. Kamiyamaguchi, Japan. Available online: http://www.ipcc-nggip.iges.or.jp/public/2006gl/index.html. Accessed: January 14, 2009.
IPCC. 2007. Climate change 2007: The physical science basis. Intergovernmental Panel on Climate Change, Geneva, Switzerland.
ISO. 2006. Environmental management—life cycle assessment—requirements and guidelines. ISO 14044:2006. International Organization of Standardization, Switzerland.
Jones, M. R. 1989. Analysis of the use of energy in agriculture—approaches and problems. Agricultural Systems 29: 339–355.
LaHore, R., and B. Croke. 1978. Energetics of stockfeed production. Animal Feed Science and Technology 3: 1–14.
Lammers, P. J., B. J. Kerr, T. E. Weber, K. Bregendahl, S. M. Lonergan, K. J. Prusa, D. U. Ahn, W. C. Stoffregen, W. A. Dozier III, and M. S. Honeyman. 2008. Growth performance, carcass characteristics, meat quality, and tissue histology of growing pigs fed crude glycerol-supplemented diets. Journal of Animal Science 82: 2962–2970.
Lewis, A. J. 2001. Chapter 8: Amino acids in swine nutrition. In: A. J. Lewis and L. L. Southern (eds.) Swine nutrition. p 131–150. CRC Press, Boca Raton, FL.
Meul, M., F. Nevens, D. Reheul, and G. Hofman. 2007. Energy use efficiency in specialised dairy, arable, and pig farms in Flanders. Agriculture, Ecosystems and Environment 119: 135–144.
Moehn, S., J. Atakora, and R. O. Ball. 2005. Using net energy for diet formulation: Potential for the Canadian pig industry. Advances in Pork Production 16: 119-129.
Nielsen, P. H., K. M. Oxenbøll, and H. Wenzel. 2006. Cradle-to-gate environmental assessment of enzyme products produced industrially in Denmark by Novozymes
21
A/S. International Journal of Life Cycle Assessment OnlineFirst (DOI:http//dx.doi.org/10.1065/lca2006.265.2).
Nielsen, P. H., and H. Wenzel. 2006. Environmental assessment of Ronozyme® P5000 CT Phytase as an alternative to inorganic phosphate supplementation to pig feed used in intensive pig production. International Journal of Life Cycle Assessment OnlineFirst (DOI:http//dx.doi.org/10.1065/lca2006.08.265.1).
Noblet, J. 2006. Recent advances in energy evaluation of feeds for pigs. In: P. C. Garnsworthy and J. Wiseman (eds.) Recent advances in animal nutrition 2005. Nottingham University Press, Nottingham, UK.
Noblet, J. 2007. Recent developments in net energy research for swine. Advances in Pork Production 18: 149–156.
Noblet, J., H. Fortune, X. S. Shi, and S. Dubois. 1994. Prediction of net energy value in swine feeds for growing pigs. Journal of Animal Science 72: 344–354.
NRC. 1998. Nutrient requirements of swine. 10th rev. Ed. National Academy Press, Washington D. C.
Payne, R. L., and R. T. Zijlstra. 2007. A guide to application of net energy in swine feed formulation. Advances in Pork Production 18: 159–165.
Reid, J. T., P. A. Oltenacu, M. S. Allen, and O. D. White. 1980. Cultural energy, land and labor requirements of swine production systems in the U.S. In: D. Pimentel (ed.) CRC handbook of energy utilization in agriculture. p 393–403. CRC Press Inc., Boca Raton, FL.
Salway, J. G. 2004. Metabolism and a glance. 3rd ed. Blackwell Publishing, Ltd., Oxford, UK.
Sauvant, D., J. M. Perez, and G. Tran (eds). 2004. Tables of composition and nutrition value of feed materials: Pigs, poultry, cattle, sheep, goats, rabbits, horses, fish. 2nd edition. Wageningen Academic Publishers Wageningen, NL.
Stein, H. H., M. F. Fuller, P. J. Moughan, B. Sève, R. Mosenthin, A. J. M. Jansman, J. A. Fernández, and C. F. M. de Lange. 2007a. Definition of apparent, true, and standardized ileal digestibility of amino acids in pigs. Livestock Science 109: 282–286.
Stein, H. H., B. Sève, M. F. Fuller, P. J. Moughan, and C. F. M. de Lange. 2007b. Amino acid bioavailability and digestibility in pig feed ingredients: Terminology and application. Journal of Animal Science 85: 172–180.
Uhlin, H.-E. 1998. Why energy productivity is increasing: An I-O Analysis of Swedish agriculture. Agricultural Systems 56: 443–465.
22
USDA. 2008. USDA national nutrient database for standard reference. Release 21. USDA-ARS, Washington D. C. Available online: http://www.nal.usda.gov/fnic/foodcomp/search/. Accessed: March 24, 2009.
USDA. 2009. 2007 Census of agriculture. USDA-National Agricultural Statistics Service, Washington D. C. Available online: http://www.agcensus.usda.gov/Publications/2007/Full_Report/index.asp. Accessed: March 11, 2009.
van der Peet-Schwering, C. M. C., B. Kemp, G. P. Binnendijk, L. A. d. Hartog, A. M. Spoolder, and M. W. A. Verstegen. 2002. Performance of sows fed high levels of nonstarch polysaccharides during gestation and lactation over three parities. Journal of Animal Science 81: 2247–2258.
van Milgen, J., J. Noblet, and S. Dubois. 2001. Energetic efficiency of starch, protein, and lipid utilization in growing pigs. Journal of Nutrition 131: 1309–1318.
Veum, T. L., D. W. Bollinger, C. E. Buff, and M. R. Bedford. 2006. A genetically engineered Escherichia coli phytase improves nutrient utilization, growth performance, and bone strength of young swine fed diets deficient in available phosphorus. Journal of Animal Science 84: 1147–1158.
Veum, T. L., and M. R. Ellersieck. 2008. Effect of low doses of Aspergillus niger phytase on growth performance, bone strength, and nutrient absorption and excretion by growing and finishing swine fed corn-soybean meal diets deficient in available phosphorus and calcium. Journal of Animal Science 86: 858–870.
Whittemore, C. T. 2006. Chapter 11: Energy and protein requirements for maintenance, growth, and reproduction. In: I. Kyriazakis and C. T. Whittemore (eds.) Whittemore’s science and practice of pig production, 3rd edition. p 379–403. Blackwell Publishing, Oxford, UK.
Whittemore, C. T., M. J. Hazledine, and W. H. Close. 2003. Nutrient requirement standards for pigs. British Society of Animal Science, Penicuik, Scotland, UK.
Williams, A. G., E. Audsley, and D. L. Sandars. 2006. Determining the environmental burdens and resource use in the production of agricultural and horticultural commodities. Main Report. Defra Research Project ISO205. Cranfield University, Silsoe, UK.
Zhu, X., and E. C. van Ierland. 2004. Protein chains and environmental pressures: A comparison of pork and novel protein foods. Environmental Sciences 1: 254–276.
Zijlstra, R. T., and R. L. Payne. 2008. Practical application of the net energy system in swine nutrition. Journal of Animal Science 86 E-Suppl. 2: 606.
23
Table 1. One hundred year global warming potential of three primary greenhouse gasesa Common name Chemical Formula 100-yr GWP, CO2 equivalents Carbon dioxide CO2 1 Methane CH4 25 Nitrous oxide N2O 298 a (IPCC, 2007)
Table 2. Energy density and 100-yr global warming potential of common Iowa farm fuels Fuel Energy density, MJ/L 100-yr GWP, g CO2/MJ Corn grain 11.7a na Liquefied petroleum gas 25.73b 63.52c Number 2 diesel 38.46b 82.73c Electricity na 229.32d Ethanol 21.3e na Biodiesel 34.5f na
a Gross energy of corn grain is 16.2 MJ/kg (Sauvant et al., 2004) b (Downs and Hansen, 1998). c (IPCC, 2006). d Calculated from weighted average of fuels consumed for electricity generation and
transmission losses for Iowa (IPCC, 2006; EPA, 2008a) e (Hill et al., 2006). f (Hill et al., 2006; Huo et al., 2008)
24
Table 3. Summary of published energy assessments of pig productiona Location
Production
Year
Non-solar energy input,
MJ/kg live wt.
Non-solar energy attributed to feed,
% of total
Emissions, kg CO2 equivalents/
kg live wt. Iowab 1975 36.2 72.2 nr United Statesb 1975 37.2 71.7 nr Swedenc 1993 46.4 61.0 nr Denmarkd 1997 17.0 NR nr Belgiume 1998 23.7 70.0 nr Belgiumf 1998 14.6 73.0 nr Denmarkg 2004 23.6 NR 4.6 Franceh 2005 15.9 74.0 2.3 Denmarki 2005 6.8 100.0 1.5 Denmarkj 2005 5.3 100.0 1.3 Denmarkk 2005 6.3 100.0 1.4 United Kingdoml 2006 23.5 nr 8.8 Denmarkm 2007 59.8 nr 5.0
a Assumes 1 kg of pork = 1.38 live weight b (Reid et al., 1980) c (Uhlin, 1998) d (Halberg, 1999) e Average farm examined (Meul et al., 2007). f Top 5% energy efficient pig farms in database (Meul et al., 2007). g (Zhu and van Ierland, 2004) h (Basset-Mens and van der Werf, 2005) i Imported soybean meal as protein source, finishing phase only (Ericksson et al.,
2005). j Local pea and rapeseed meal as protein source, finishing phase only (Ericksson et al.,
2005). k Local pea and rapesedd meal with synthetic amino acids, finishing phase only
(Ericksson et al., 2005). l (Williams et al., 2006) m Calculated based on gross energy of barley-soybean meal diet (Dalgaard et al., 2007).
25
CHAPTER 3. CONSTRUCTION RESOURCE USE OF TWO DIFFERENT TYPES AND SCALES OF IOWA SWINE
PRODUCTION FACILITIES
A paper accepted by Applied Engineering in Agriculture
P. J. Lammers, M. S. Honeyman, J. D. Harmon, J. B. Kliebenstein, and M. J. Helmers1
ABSTRACT. As global populations and affluence rise, there is increasing demand for
energy, animal protein, and construction materials. In many cases, available resource pools
are insufficient to meet growing market demands, resulting in increased prices and
competition for limited resources. This study evaluates key construction resources needed to
build different types and scales of Iowa swine production facilities. Two types of facilities—
conventional confinement and hoop barn-based—within farrow-to-finish pig production
systems scaled to produce either 5,200 or 15,600 market pigs annually are examined.
Conventional confinement facilities are typical of pork industry practice in the United States
and are characterized by individual gestation stalls and 1,200 head grow-finish buildings with
slatted concrete floors and liquid manure systems. The hoop barn-based alternative uses
bedded group pens in hoop barns for gestation and finishing. Five building materials:
concrete, steel, lumber, thermoplastics, insulation, as well as crushed rock and diesel fuel
used for building site preparation are considered. Land surface area required for buildings
1 The authors are Peter J. Lammers, Research Assistant, Department of Animal Science, Mark S. Honeyman, Professor, Department of Animal Science, Jay D. Harmon, ASABE Member Engineer, Professor, Department of Agricultural and Biosystems Engineering, James B. Kliebenstein, Professor, Department of Economics, and Matt J. Helmers, ASABE Member Engineer, Assistant Professor, Department of Agricultural and Biosystems Engineering, Iowa State University, Ames, Iowa. Corresponding author: Mark S. Honeyman, Department of Animal Science, 32 Curtiss Hall, Iowa State University, Ames, Iowa 50011; phone: 515-294-4621, fax: 515-294-6210; email: [email protected].
26
and pig production infrastructure are also compared. Relative market costs of newly
constructed swine facilities are compared under several material price scenarios. Using hoop
barns for grow-finish and gestation results in lower construction costs. Increasing the scale of
pig production results in lower construction costs per pig space, however the construction
costs per pig space for a 5,200 head hoop barn-based complex is less than the construction
costs per pig space for a 15,600 head conventional confinement system. In terms of
construction resource use and cost, hoop barns for swine are a viable alternative that are less
dependent on the scale of production than conventional confinement facilities.
Keywords. Building materials, Construction costs, Hoop barn, Swine production.
INTRODUCTION
Global population is projected to reach 9.2 billion people in 2050 and if realized will
represent an increase of more than 360% over a 100 year time period (UN, 2007). Population
in China and the United States is also projected to increase dramatically (UN, 2007). Those
two countries lead the world in pork production and consumption, a trend that is likely to
continue (den Hartog, 2005; FAO, 2006). Increased population and rising incomes have
created increased market demand for energy, animal protein, and construction materials
globally. Over time, increased market demand for available resources typically results in
greater price competition for those resources. Thus it is appropriate to examine the relative
efficacy of using construction resources to build different types and scales of animal protein
production systems. This paper examines the material use for constructing different types and
scales of Iowa swine production facilities. Relative costs of building different types and
scales of Iowa swine production facilities are also compared under different pricing
27
scenarios. Information presented in this paper constitutes an inventory of construction
resources required for construction of pig production facilities. This inventory can be
combined with additional information to conduct a life cycle analysis of pig production,
however the present paper is not a complete life cycle analysis of pig production facilities.
METHODS
This project considers input of construction resources into different types and scales
of swine production facilities based upon physical material flows. Two types of facilities—
conventional confinement and hoop barn-based are considered within identically scaled
farrow-to-finish production systems. The conventional confinement system is typical of pork
industry practice in Iowa and is characterized by individual gestation stalls and 1,200 head
grow-finish buildings with slatted concrete floors and liquid manure systems. The hoop barn-
based alternative system uses group pens in bedded hoop barns for gestation and finishing.
Both systems will use farrowing crates and climate controlled nursery facilities and are
summarized in table 1. Resource use is related to volume of pig flow and so pig production
systems sized to produce batches of either 400 or 1,200 pigs every 28 d, or 5,200 and 15,600
pigs annually are compared.
PIG FLOW REQUIREMENTS
PigCHAMP is a production record system widely used in the United States pork
industry and summarized records of reproduction performance are available online
(PigCHAMP, 2008). Average reproductive performance benchmarks for PigCHAMP users
in 2004 and 2006 were used to calculate pig numbers and flow through breeding, gestation,
and farrowing. The latest USDA survey of pig producers in the U.S. (USDA, 2007) reports
days spent in a particular housing type as well as mortality rates during a specific growth
28
phase. This information was used to calculate pig numbers and flow through nursery and
grow-finish facilities. Pig flow parameters used to calculate space requirements are detailed
in table 2. Table 3 details pig space needs for annual production at the level of 5,200 and
15,600 market pigs annually. The hoop-based system will require the same type and number
of pig spaces as the conventional confinement system, although spaces will be distributed
across more individual buildings.
BUILDING MATERIALS
The buildings examined are simplified design models that were generated to provide
estimates of building material use. Building dimensions, layout, and material selection
decisions for the examined facilities were determined by interviewing construction firms,
facility managers, and industry consultants. Although the buildings are intended to be similar
to actual facilities currently being built in Iowa they are not engineered designs. Application
of the buildings or building components described should be limited to estimating material
use of similar buildings. Midwest Plan Service publications (MWPS, 1987, 1989a, b; Brumm
et al., 2004; Harmon et al., 2004; Koenig and Runestad, 2005) were used as a basis for all
designs. Table 4 provides a basic summary of building dimensions and layout. The farrowing
facility used by conventional confinement system and the hoop barn-based system is
identical in terms of size and room set-up. Both systems also use a pull-plug manure system.
However, in the conventional confinement system the pull-plug manure system is connected
through underground pipe to the gestation barn’s 2.4 m deep manure storage tank. This is
typical of conventional confinement facilities in the U.S. In the hoop barn-based system, the
gestation facilities are hoop barns and do not have pits for liquid manure storage. Thus in the
hoop barn-based system, farrowing facilities must include a 2.4 m deep pit appropriately
29
sized for liquid manure storage from the farrowing facility. For this comparison the hoop
barn-based system’s farrowing facility includes an exterior pit. The hoop barn-based
farrowing pit in this analysis is a 3.6 m wide, 2.4 m deep pit that runs the length of the
building (21.9 m long for the 5,200 market pig system and 73.2 m long for the 15,600 market
pig system).
Farrowing and nursery facilities consist of a 2.4 m high, framed wall around the entire
building. The exterior wall is sheeted with steel while the wall that is in contact with the pigs
is covered with commercially available high-density polyethylene sheeting. Appropriately
designed wood rafters sit on top of the walls. Steel sheeting is assumed for the roof and
ceiling of farrowing and nursery facilities.
The building shell for breeding and gestation and grow-finish within a facility type
are similar. The conventional system begins with a 2.4 m deep pit and concrete slats. On top
of the pit wall a 1.4 m high concrete sidewall is poured around the entire building. A 0.9 m
high framed wall is set on top of the concrete walls. The buildings described are rectangles,
the short sides of the rectangles are enclosed with exterior steel and interior high-density
polyethelene sheeting. The long walls of the buildings are covered by a 0.9 m tall curtain that
runs the length of the building. Above the curtain a 0.3 m header is assumed with
appropriately designed lumber rafters sitting on top of the building wall. Steel sheeting is
assumed to cover the roof and ceiling in conventional grow-finish and gestation facilities.
Hoop structures for swine are less complex in their construction. A hoop barn is a
QuonsetTM-shaped structure that has been previously described (Honeyman et al., 2001;
Brumm et al., 2004; Harmon et al., 2004). Hoop barn sidewalls are assumed to be 1.5 m high
and consist of wooden posts and sidewalls. Tubular steel arches are attached to the posts,
30
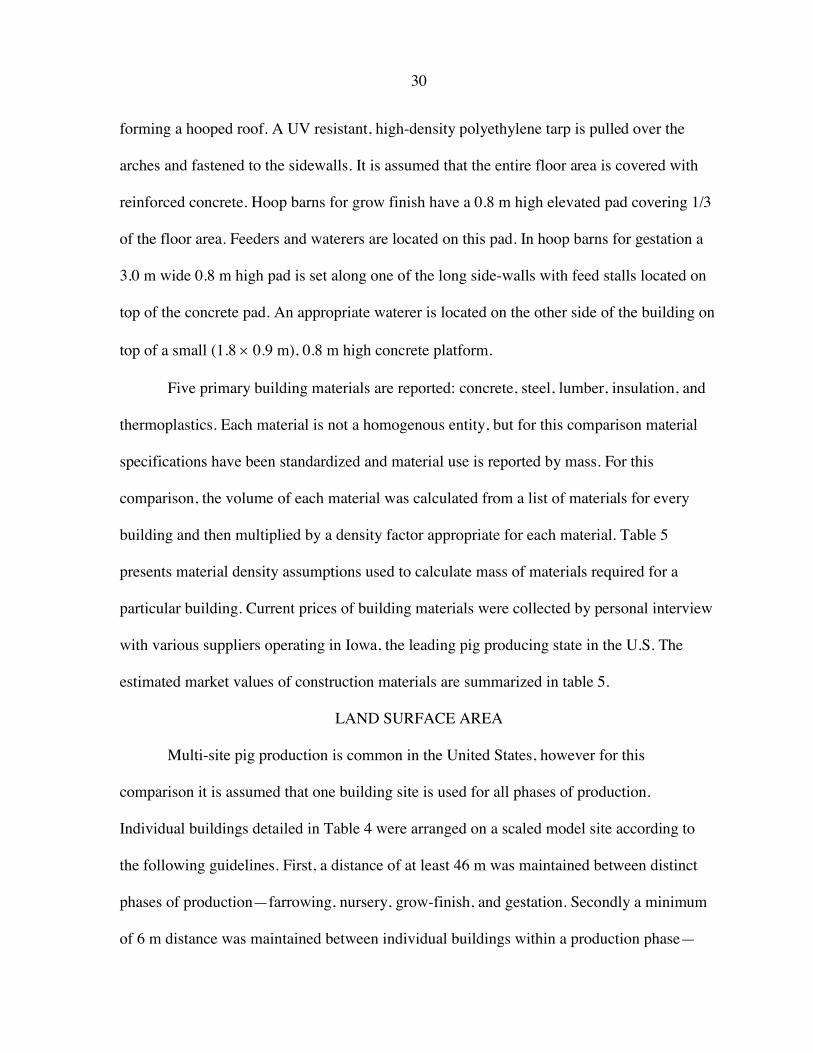
forming a hooped roof. A UV resistant, high-density polyethylene tarp is pulled over the
arches and fastened to the sidewalls. It is assumed that the entire floor area is covered with
reinforced concrete. Hoop barns for grow finish have a 0.8 m high elevated pad covering 1/3
of the floor area. Feeders and waterers are located on this pad. In hoop barns for gestation a
3.0 m wide 0.8 m high pad is set along one of the long side-walls with feed stalls located on
top of the concrete pad. An appropriate waterer is located on the other side of the building on
top of a small (1.8 0.9 m), 0.8 m high concrete platform.
Five primary building materials are reported: concrete, steel, lumber, insulation, and
thermoplastics. Each material is not a homogenous entity, but for this comparison material
specifications have been standardized and material use is reported by mass. For this
comparison, the volume of each material was calculated from a list of materials for every
building and then multiplied by a density factor appropriate for each material. Table 5
presents material density assumptions used to calculate mass of materials required for a
particular building. Current prices of building materials were collected by personal interview
with various suppliers operating in Iowa, the leading pig producing state in the U.S. The
estimated market values of construction materials are summarized in table 5.
LAND SURFACE AREA
Multi-site pig production is common in the United States, however for this
comparison it is assumed that one building site is used for all phases of production.
Individual buildings detailed in Table 4 were arranged on a scaled model site according to
the following guidelines. First, a distance of at least 46 m was maintained between distinct
phases of production—farrowing, nursery, grow-finish, and gestation. Secondly a minimum
of 6 m distance was maintained between individual buildings within a production phase—
31
between grow-finish barns for example. Finally, a 6 m buffer was added to the edge of all
buildings lining the perimeter of the building site. For the hoop barn-based building sites,
storage hoops for bedding were positioned near the gestation and grow-finish hoop barns.
Hoop barns used for storage were allowed a 6 m separation between other buildings, but
were not required to be separated by 46 m from buildings housing pigs. Access roads to
facilities were then outlined on the scaled model. A perimeter was drawn around the entire
building site to delineate total land surface area needed for buildings, access roads, and
buffers. The market value of land suitable for building swine facility complexes was assumed
to be $3,200/ha for initial analysis.
BUILDING SITE PREPARATION
It was assumed that the building site was previously furnished with sufficiently sized
wells, electrical mains, and a main entrance driveway. Building site preparation includes
den Hartog, L. A. 2005. Global perspectives on integrated pork production. In: Proceedings of the London Swine Conference: Production at the leading edge, London, ON, Canada. p 97-103.
FAO. 2006. World agriculture: Towards 2030/2050, interim report. Food and Agriculture Organization of the United Nations, Rome, Italy.
Hammond, G., and C. Jones. 2008. Inventory of carbon and energy. Version 1.6a. Department of Mechanical Engineering, University of Bath, Bath, UK. Available online: www.bath.ac.uk/mech-eng/sert/embodied/. Accessed: February 2, 2009.
Harmon, J. D., M. S. Honeyman, J. B. Kliebenstein, T. Richard, and J. M. Zulovich. 2004. Hoop barns for gestating swine. AED 44. MidWest Plan Service, Ames, IA.
42
Honeyman, M. S., J. D. Harmon, J. B. Kliebenstein, and T. L. Richard. 2001. Feasibility of hoop structures for market swine in Iowa: Pig performance, pig environment, and budget analysis. Appl. Eng. Agric. 17: 869–874.
Koenig, F. W. M., and J. Runestad. 2005. Rectangular concrete manure storages. 2nd ed. MidWest Plan Service, Ames, IA.
Lammers, P. J., M. S. Honeyman, J. B. Kliebenstein, and J. D. Harmon. 2008. Impact of gestation housing system on weaned pig production cost. Appl. Eng. Agric. 24: 245-249.
Mossman, M. J., and S. C. Plotner (eds). 2006. RSMeans facility construction cost data. 22nd edition. RSMeans Construction Publishers and Consultants, Kingston, MA.
MWPS. 1987. Structures and environment handbook. 11th Revised ed. MidWest Plan Service, Ames, IA.
MWPS. 1989a. Designs for glued trusses. 4th Revised ed. MidWest Plan Service, Ames, IA.
MWPS. 1989b. Farm and home concrete handbook. 1st ed. MidWest Plan Service, Ames, IA.
PigCHAMP. 2008. Benchmarking summaries: 2004 and 2006. Pig CHAMP, Ames. Available online: http://www.pigchamp.com/benchmarking.asp. Accessed: March 6, 2008.
Rao, J. 2008. Density of wood. Conceptualized Reference Database for Building Envelope Research. Building Envelope Performance Laboratory, Concordia University, Montreal, Canada. Available online: htttp://users.encs.concordia.ca/~raojw/crd/essay/essay002072.html. Accessed: June 6, 2008.
RES. 1990. Process plant construction estimating standards. Richardson Engineering Systems Inc., Mesa, AZ.
UN. 2007. World population prospects: The 2006 revision. United Nations, New York, NY.
USDA. 2007. Swine 2006, part 1: Reference of swine health and management in the United States, 2006. #N361.0902. USDA:APHIS:VS, CEAH, Fort Collins, CO.
USDOE. 2005. Types of loose fill insulation. United States Department of Energy, Washington, D. C. Available online: http://www/eere/energy.gov/consumer/your_home/insulation_airsealing/index.cfm/mytopic=11650. Accessed: April 21, 2008.
43
Table 1. Pork production systems compared. System Production phase Conventional Hoop barn-based Breeding and Gestation individual stalls with deep pit group pens in bedded hoop barns Farrowing[a] crates with pull plug system crates with pull plug system Nursery pens with shallow pit pens with shallow pit Grow-finish pens with deep pit pens in bedded hoop barns [a] Manure from farrowing building stored in gestation pit (conventional) or adjacent outside storage pit (hoop barn-based). Table 2. Pig flow parameters [a]. Weaned pigs per litter, pigs 9.2 Litters of weaned per mated female, litters/yr 2.3 Farrowing rate, litters born/sows mated 77.6% Nursery mortality rate 2.9% Grow-finish mortality rate 3.9% Sow herd replacement rate 60.0% Pig age at weaning, d 21.0 Maximum pig age at market, d 180.0 [a] Based on USDA (2007) and Pig CHAMP (2008). Table 3. Pig spaces needed by production phase for 2 levels of annual pig production. 5,200 pigs 15,600 pigs Production Phase spaces turns/yr spaces turns/yr Breeding and gestation 310 na 900 na Farrowing 48 13.0 140 13.0 Nursery 880 6.5 2,600 6.5 Grow-finish 1,600 3.3 4,800 3.3
Table 4. Summary of pig facilities examined. 44
Building Area/thermal Gross Net Production dimensions, resistance, Area[a] Area[b] level/phase m × m MJ/hr-°C m2/pig m2/pig Description 5,200 pigs/yr Farrowing[c] 21.9 × 13.4 0.56 6.1 3.3 4 rooms of 12 crates, pull plug gutter to 2.4 m pit Nursery 30.5 × 15.5 0.79 0.5 0.4 4 rooms of 22 pens, 1.2 m pit Grow-Finish Conventional 92.0 × 15.5 6.38 0.9 0.8 4 rooms of 8 pens, 2.4 m pit Hoop-based 21.9 × 9.1 1.0 1.0 8 hoop barns with 1 sort/load area, 1 pen/barn Gestation Conventional 52.4 × 13.4 3.72 2.3 1.3 individual gestation stalls, 2.4 m pit Hoop-based 21.9 × 9.1 5.8 5.2 9 hoop barns, 2 groups pens with 36 feed stalls/barn Storage 18.3 × 18.3 bedding storage, 65% of area allocated to storage 15,600 pigs/yr Farrowing[c] 73.2 × 13.4 1.55 7.0 3.3 10 rooms of 14 crates, pull plug gutter to 2.4 m pit Nursery 41.1 × 15.5 1.01 0.5 0.3 2 barns with 1.2 m pit, 4 rooms of 30 pens/barn Grow-Finish Conventional 61.3 × 15.5 4.43 0.8 0.7 4 barns with 2.4 m pit, 1 room of 20 pens/barn Hoop-based 21.9 × 9.1 1.0 1.0 24 hoop barns with 4 sort/load areas, 1 pen/barn Gestation Conventional 70.7 × 13.4 4.78 2.1 1.3 2 barns with 2.4 m pit, individual gestation stalls Hoop-based 21.9 × 9.1 5.5 5.0 25 hoop barns, 2 groups pens with 36 feed stalls/barn Storage 18.3 × 18.3 bedding storage, 2 entire hoop barns [a] Total area under cover. [b] Total area under cover minus walkways and alleys. [c] Manure storage for the farrowing facility in the conventional confinement system is the 2.4 m deep pit under the gestation facility. Manure storage for the farrowing facility in the hoop barn-based system is a separate 2.4 m deep pit adjacent to the farrowing facility.
45
Table 5. Density and estimated value of construction materials examined. Density Est.Value Material g/cm3 $/kg Examples and Uses Concrete[a] 2.40 $0.04 building foundations, walls, manure storage, slats Steel[b] 8.08 $1.14 concrete reinforcing bar, siding, gating, hoop trusses Lumber[c] 0.53 $0.23 building frame, trusses Thermoplastics[d,e] 0.95 $1.00 flooring, pens, building curtains, hoop barn tarps Insulation[f.g] 0.03 $0.59 ceiling and walls of non-hoop buildings Crushed rock[h] 2.75 $0.02 access roads [a] Koenig and Runestad (2005). [b] BSCI (2008). [c] Rao (2008). [d] High density polyethylene. [e] BT (2008). [f] Loose fill cellulose. [g] USDOE (2005). [h] Hammond and Jones (2008).
46
Table 6. Construction resource use for swine production facilities. Conventional Hoop barn-based Pigs sold annually 5,200 15,600 5,200 15,600 Farrowing[a] Concrete, kg 150,464 451,393 287,534 691,769
Steel, kg 20,508 32,092 22,499 38,404 Lumber, kg 6,651 19,561 6,651 19,561 Thermoplastics, kg 16,053 30,172 12,466 26,585 Insulation, kg 2,433 6,415 2,433 6,415
Diesel fuel, l 0 0 38 124 Nursery Concrete, kg 288,653 782,598 288,653 782,598
Steel, kg 27,093 64,662 27,093 64,662 Lumber, kg 12,468 26,238 12,468 26,238 Thermoplastics, kg 12,159 30,892 12,159 30,892 Insulation, kg 3,192 5,110 3,192 5,110
Diesel fuel, l 46 466 46 466 Grow-Finish Concrete, kg 1,237,294 3,435,800 678,191 2,074,200
Steel, kg 28,740 113,264 11,024 33,336 Lumber, kg 33,569 89,960 18,560 56,136 Thermoplastics, kg 3,084 4,792 1,074 3,216 Insulation, kg 6,759 17,576 0 0
Diesel fuel, l 802 2,146 0 0 Gestation Concrete, kg 696,669 1,709,790 606,078 1,683,550
Steel, kg 38,329 107,144 27,333 75,925 Lumber, kg 13,115 34,920 16,812 46,700 Thermoplastics, kg 711 1,610 1,350 3,750 Insulation, kg 3,402 9,116 0 0 Diesel fuel, l 281 468 0 0
Bedding storage Concrete, kg 0 0 56,296 173,218 Steel, kg 0 0 2,137 9,574 Lumber, kg 0 0 268 826 Thermoplastics, kg 0 0 124 380
Access Roads Crushed rock, kg 132,000 264,000 303,600 475,200 Diesel fuel, l 34 64 78 121 Site Preparation Diesel fuel, l 399 830 591 1,110 Total for all production facilities
Concrete, kg 2,373,080 6,379,581 1,916,752 5,405,335 Steel, kg 114,670 317,162 90,086 221,901 Lumber, kg 56,029 151,074 44,985 129,856 Thermoplastics, kg 32,007 67,466 37,123 64,823 Insulation, kg 19,361 51,017 9,210 24,325 Crushed rock, kg 132,000 264,000 303,600 475,200 Diesel fuel, l 1,562 3,910 753 1,700
[a] Manure storage for the farrowing facility in the conventional confinement system is the 2.4 m deep pit under the gestation facility. Manure storage for the farrowing facility in the hoop barn-based system is a separate 2.4 m deep pit adjacent to the farrowing facility.
47
Table 7. Estimated construction costs for swine production facilities.[a] Conventional Hoop barn-based Pigs sold annually 5,200 15,600 5,200 15,600
[a] Mossman and Plotner (2006). [b] Manure storage for the farrowing facility in the conventional confinement system is the
2.4 m deep pit under the gestation facility. Manure storage for the farrowing facility in the hoop barn-based system is a separate 2.4 m deep pit adjacent to the farrowing facility.
48
Table 8. Estimated construction costs for swine facility complexes based on material mass[a]. Conventional Hoop barn-based Pigs sold annually 5,200 15,600 5,200 15,600
[a] Calculated by multiply material masses reported in table 6 by estimated market values of materials presented in table 5. [b] Calculated by multiplying hours of labor reported in table 6 by $20/hr.
49
Figure 1. Construction cost sensitivity to change in concrete prices for different types and scales of pig production facilities[a].
1.60 1.621.65
1.701.75
1.84
1.16 1.18 1.201.24
1.281.20 1.22 1.24
1.291.33
1.41
1.00 1.02 1.041.08
1.111.18
1.36
0.90
1.00
1.10
1.20
1.30
1.40
1.50
1.60
1.70
1.80
1.90
Intitial 10 25 50 75 100
Concrete price increase, %
Relative construction costs per market pig sold, $/hd
CONV 5,200HOOP 5,200CONV 15,600HOOP 15,600
[a] HOOP or CONV and 15,600 or 5,200 represent hoop barn-based pig production or conventional confinement facilities scaled to produce 15,600 or 5,200 market pigs annually.
50
Figure 2. Construction cost sensitivity to change in steel prices for different types and scales of pig production facilities[a].
1.60 1.631.67
1.741.81
1.93
1.16 1.181.22
1.271.32
1.42
1.20 1.221.26
1.321.39
1.50
1.00 1.02 1.041.09
1.13
1.21
0.90
1.00
1.10
1.20
1.30
1.40
1.50
1.60
1.70
1.80
1.90
Intitial 10 25 50 75 100
Steel price increase %
Relative construction costs per market pig sold, $/hd
CONV 5,200HOOP 5,200CONV 15,600HOOP 15,600
[a] HOOP or CONV and 15,600 or 5,200 represent hoop barn-based pig production or conventional confinement facilities scaled to produce 15,600 or 5,200 market pigs annually.
51
Figure 3. Construction cost sensitivity to change in land values for different types and scales of pig production facilities[a].
1.60 1.61 1.62 1.63 1.64 1.66
1.16 1.17 1.18 1.20 1.211.25
1.20 1.20 1.21 1.22 1.22 1.24
1.00 1.00 1.01 1.02 1.03 1.05
0.90
1.00
1.10
1.20
1.30
1.40
1.50
1.60
1.70
Intitial 10 25 50 75 100
Increase in land value, %
Relative construction cost per market pig sold, $/hd
CONV 5,200HOOP 5,200CONV 15,600HOOP 15,600
[a] HOOP or CONV and 15,600 or 5,200 represent hoop barn-based pig production or conventional confinement facilities scaled to produce 15,600 or 5,200 market pigs annually.
52
Figure 4. Construction cost sensitivity to change in construction labor prices for different types and scales of pig production facilities[a].
1.001.05
1.14
1.27
1.41
1.66
1.161.22
1.31
1.46
1.61
1.88
1.201.26
1.36
1.52
1.68
1.96
1.601.70
1.84
2.08
2.32
2.76
0.80
1.00
1.20
1.40
1.60
1.80
2.00
2.20
2.40
2.60
2.80
Intitial 10 25 50 75 100Labor value increase, %
Relative construction cost per market pig sold, $/hd
HOOP 15,600HOOP 5,200CONV 15,600CONV 5,200
[a] HOOP or CONV and 15,600 or 5,200 represent hoop barn-based pig production or conventional confinement facilities scaled to produce 15,600 or 5,200 market pigs annually.
53
Figure 5. Construction cost sensitivity to change in energy prices for different types and scales of pig production facilities[a].
1.60
1.71 1.741.78
1.82
2.04
1.161.25 1.27
1.311.35
1.53
1.20
1.30 1.32 1.35 1.39
1.58
1.001.07 1.09 1.11 1.14
1.28
0.80
0.90
1.00
1.10
1.20
1.30
1.40
1.50
1.60
1.70
1.80
1.90
2.00
2.10
Intitial 10 25 50 75 100
Energy price increase, %
Relative construction cost per market pig sold, $/hd
CONV 5,200HOOP 5,200CONV 15,600HOOP 15,600
[a] HOOP or CONV and 15,600 or 5,200 represent hoop barn-based pig production or conventional confinement facilities scaled to produce 15,600 or 5,200 market pigs annually.
54
CHAPTER 4: ENERGY AND CARBON INVENTORY OF IOWA SWINE PRODUCTION FACILITIES
A paper to be submitted to Agricultural Systems
P. J. Lammersa, M. S. Honeymana**, J. D. Harmonb, and M. J. Helmersb
a Department of Animal Science, Iowa State University, Curtiss Hall, Ames Iowa 50011, US.
b Department of Agricultural and Biosystems Engineering, Iowa State University, Davidson
Hall, Ames, Iowa 50011, US.
ABSTRACT
Energy and carbon use by different types and scales of pig production systems are
assumed to be different, but have not been critically examined. This study evaluates energy
and carbon use by two types of facilities—conventional confinement and hoop barn-based—
within farrow-to-finish pig production systems scaled to produce 5,200 and 15,600 market
pigs annually in Iowa. Conventional confinement facilities are typical of pork industry
practice in the United States and are characterized by individual gestation stalls and 1,200
head grow-finish buildings with slatted concrete floors and liquid manure systems. The hoop
barn-based alternative uses group pens in bedded hoop barns for gestation and finishing. Both
systems use climate controlled farrowing facilities with individual farrowing crates as well as
climate controlled nursery facilities. Resources such as energy and carbon can be categorized
as embodied or operating based on how they are used. Embodied energy refers to the quantity
of energy required to manufacture, provide, or supply a product, material, or service.
* Corresponding author. Department of Animal Science, Iowa State University, 32 Curtiss
Table 13 presents performance adjusted operating energy and associated greenhouse
gas emissions of different pig production systems and scales by fuel type and activity. With
7.5% more pigs per sow in the hoop barn-based system, fewer sows must be maintained in
gestation and fewer litters need to be farrowed. This results in reductions in the amount of
electricity used for heat lamps in the farrowing facility and in diesel fuel used for cleaning
out hoop barns for gestating sows. Under this analysis, hoop barn-based pig production uses
37–39% less nonrenewable energy than conventional systems.
Our second analysis assumes that grow-finish pigs housed in bedded hoop barns
require 3.3% more feed per unit of gain, this translates into the 3% increase in renewable
energy as feed for the entire pig herd presented for hoop barn-based pig production in table
13. Because of increase feed consumption during the grow-finish phase of production,
systems using hoop barns for gestation and grow-finish at the two scales examined require
similar amounts (2% more) of operating energy/market pig as the conventional systems.
86
Incorporating improved sow reproduction reduces nonrenewable energy use for hoop
barn-based pig production and reduces emission of greenhouse gases. Under the assumption
of different performance between two general pig production systems, hoop-barn based
production results in 54–57% less greenhouse gas emission. The optimal system for
producing pigs in terms of minimizing greenhouse gas emissions is the hoop barn-based
system scaled to sell 15,600 market pigs annually. The conventional system scaled to
produce 5,200 market pigs annually uses the most nonrenewable energy of any system
examined and consequently emits the most greenhouse gas.
4.0 Discussion
Producing pigs using hoop barns for grow-finish and gestation requires less embodied
energy and carbon than using conventional confinement facilities. Hoop barn-based pig
production require similar quantities of total operating energy than conventional facilities but
results in less greenhouse gas emissions per market pig. Increasing the scale of production
from 5,200 to 15,600 market pigs annually lowers the embodied energy, embodied carbon,
nonrenewable energy use and greenhouse gas emissions per market pig. However the
reduction is less dramatic for the hoop barn-based system compared to the conventional
confinement system. Hoop barn-based production scaled to produce 5,200 market pigs
annually requires similar amounts of embodied energy and less embodied carbon compared
to conventional confinement facilities scaled to produce 15,600 market pigs annually. Using
hoop barns for grow-finish and gestation requires less nonrenewable energy and results in
lower emissions of greenhouse gas.
This analysis demonstrates that hoop barns for pigs have several energetic and
environmental advantages over conventional confinement facilities. Embodied energy and
87
carbon values are heavily dependent on the assumptions that are included in their calculation.
Using one database that includes all materials (Hammond and Jones, 2008) insures that
materials are compared on an equal basis. The listed values of embodied energy and carbon
for different pig production facilities may or may not be exact. However the relative
magnitude of the values, particularly when comparing different systems built and operated at
the same location, is expected to remain stable. Similarly operating energy use and the
thermal environment regime of a particular pig facility will depend on climate conditions.
The conditions assumed in this analysis are typical of historic averages for Iowa, the leader in
United States pig production. It is representative of the environment where the majority of
pigs in the United States are raised.
Hoop barn-based pig production is more dependent on operating energy from feed
and bedding than conventional confinement production. Alternatively conventional
confinement facilities rely more on nonrenewable fossil fuels to modify pig environment.
Hoop barns for grow-finish pigs and gestating sows have been successfully demonstrated and
performance of pigs in these facilities are similar to pigs in conventional confinement
(Honeyman and Harmon, 2003; Lammers et al., 2007). Historically the availability of fossil
fuels has minimized pressure to critically consider all uses of energy in pig production.
Rising energy prices, global conflicts, and recognition of the environmental impacts of using
fossil fuels are increasing awareness and incentive to optimize use of these limited resources.
Using hoop barns for grow-finish pigs and gestating sows is an effective strategy to reduce
direct use of fossil fuels for pork production and may minimize global climate altering
emissions.
88
Acknowledgments
This project was supported by the Hatch Act, State of Iowa Funds, USDA North
Central Regional SARE Graduate Student Grant Program, and the Leopold Center for
Sustainable Agriculture.
References APS. 2008. AP Flex-Flo™ Systems. Automated Production Systems, Assumption, IL.
Available online: http://www.automatedproduction.com/english/swine/delivery/flexflo.htm. Accessed: June 5, 2008.
ASAE. 2005. Ep344.3 lighting systems for agricultural facilities. In: ASABE (ed.) Asabe standards. p 686-697. American Society of Agricultural and Biological Engineers, St. Joseph, MI.
BESS. 2008. Agricultural ventilation fans, performance and efficiencies. University of Illinois, Department of Agricultural and Biological Engineering, Bioenvironmental and Structural Systems Laboratory.
Brown-Brandl, T. M., J.A. Nienaber, H. Xin, and R. S. Gates. 2004. A literature review of swine heat production. Transactions of the ASAE 47: 259-270.
Brumm, M. C., J. D. Harmon, M. S. Honeyman, J. B. Kliebenstein, S. M. Lonergan, R. Morrison, and T. Richard. 2004. Hoop barns for grow-finish swine. AED 44. MidWest Plan Service, Ames, IA.
Curtis, S. E. 1983. Chapter 6: Control and integration of thermoregulatory processes. In: S. E. Curtis (ed.) Environmental management in animal agriculture. p 59–70. Iowa State University Press, Ames, IA.
Delgado, C., M. Rosegrant, H. Steinfeld, S. Ehui, and C. Courbois. 1999. Livestock to 2020: The next food revolution. International Food Policy Research Institute/Food and Agriculture Organization of the United Nations/International Livestock Research Institute (IFPRI/FAO/ILRI), Washington D.C.
den Hartog, L. A. 2005. Global perspectives on integrated pork production. In: Proceedings of the London Swine Conference: Production at the leading edge, London, ON, Canada. p 97-103.
89
Downs, H. W., and R. W. Hansen. 2007. Estimating farm fuel requirements. Colorado State University Extension, Fort Collins, CO. Available online: http://www.ext.colostate.edu/PUBS/farmmgt/05006.html. Accessed: July 29, 2008.
EIA-DOE. 2009. State energy profiles: Iowa. Energy Information Administration, Washington D. C. Available online: http://tonto.eia.doe.gov/state/state_energy_profiles.cfm?sid=IA. Accessed: January 14, 2009.
EPA. 2008. eGRID subregion GHG output emission rates for year 2005. Washington, D. C. Available online: http://www.epa.gov/cleanenergy/energy-resources/egrid/index.html. Accessed: January 23, 2009.
Ericksson, I. S., H. Elmquist, S. Stern, and T. Nybrant. 2005. Environmental systems analysis of pig production: The impact of feed choice. International Journal of Life Cycle Assessment 10: 143-154.
FAO. 2006. World agriculture: Towards 2030/2050, interim report. Food and Agriculture Organization of the United Nations, Rome, Italy.
Fulhage, C., and J. Hoehne. 2001. Lesson 21: Sizing manure storage, typical nutrient characteristics. Livestock and poultry environment stewardship curriculum. MidWest Plan Service, Ames, IA.
Hammond, G., and C. Jones. 2008. Inventory of carbon and energy. Version 1.6a. Department of Mechanical Engineering, University of Bath, Bath, UK. Available online: www.bath.ac.uk/mech-eng/sert/embodied/. Accessed: February 2, 2009.
Harmon, J. D., M. S. Honeyman, J. B. Kliebenstein, T. Richard, and J. M. Zulovich. 2004. Hoop barns for gestating swine. AED 44. MidWest Plan Service, Ames, IA.
Holden, P., R. Ewan, M. Jurgens, T. Stahly, and D. Zimmerman. 1996. Life cycle swine nutrition. PM-489. Iowa State University Extension, Ames, IA.
Honeyman, M. S., and J. D. Harmon. 2003. Performance of finishing pigs in hoop structures and confinement during summer and winter. Journal of Animal Science 81: 1663-1670.
IPCC. 2006. 2006 IPCC guidelines for national greenhouse gas inventories. Kamiyamaguchi, Japan. Available online: http://www.ipcc-nggip.iges.or.jp/public/2006gl/index.html. Accessed: January 14, 2009.
IPCC. 2007. Climate change 2007: The physical science basis. Intergovernmental Panel on Climate Change, Geneva, Switzerland.
ISU. 2003. Managing manure nutrients for crop production. PM 1811. Iowa State University Extension, Ames, IA.
90
ISU. 2008. Iowa ag climate network. Iowa State University, Available online: http://mesonet.agron.iastate.edu/agclimate/index.phtml. Accessed: June 4, 2008.
Kjelgaard, M. J. 2001. Engineering weather data. McGraw-Hill, New York, NY.
Lammers, P. J. 2009. Energy and nutrient cycling in swine production systems. Appendix 1: Calculating energy use for thermal control of grow-finish facilities within a farrow-to-finish system producing 15,600 market pigs annually, Iowa State University, Ames, IA.
Lammers, P. J., M. S. Honeyman, J. D. Harmon, J. B. Kliebenstein, and M. J. Helmers. 2009. Construction resource use of two different types and scales of Iowa swine production facilities. Applied Engineering in Agriculture submitted.
Lammers, P. J., M. S. Honeyman, J. B. Kliebenstein, and J. D. Harmon. 2008a. Impact of gestation housing system on weaned pig production cost. Applied Engineering in Agriculture 24: 245-249.
Lammers, P. J., M. S. Honeyman, J. W. Mabry, and J. D. Harmon. 2007. Performance of gestating sows in bedded hoop barns and confinement stalls Journal of Animal Science 85: 1311-1317.
Lammers, P. J., B. J. Kerr, T. E. Weber, K. Bregendahl, S. M. Lonergan, K. J. Prusa, D. U. Ahn, W. C. Stoffregen, W. A. Dozier III, and M. S. Honeyman. 2008b. Growth performance, carcass characteristics, meat quality, and tissue histology of growing pigs fed crude glycerol-supplemented diets. Journal of Animal Science 82: 2962–2970.
Meul, M., F. Nevens, D. Reheul, and G. Hofman. 2007. Energy use efficiency in specialised dairy, arable, and pig farms in Flanders. Agriculture, Ecosystems and Environment 119: 135–144.
MWPS. 1987. Structures and environment handbook. 11th Revised ed. MidWest Plan Service, Ames, IA.
MWPS. 1990a. Heating, cooling, and tempering air for livestock housing. 1st ed. MidWest Plan Service, Ames, IA.
MWPS. 1990b. Mechanical ventilation systems for livestock housing. 1st ed. MidWest Plan Service, Ames, IA.
NEMA. 2009a. National association of electrical manufacturers. Washington DC. Available online: http://www.nema.org/about/. Accessed: January 23, 2009.
NEMA. 2009b. Nema premium motors. Washington DC. Available online: http://www.nema.org/gov/energy/efficiency/premium/. Accessed: January 23, 2009.
91
NRC. 1998. Nutrient requirements of swine. 10th rev. Ed. National Academy Press, Washington D. C.
NTTL. 2008. Tractor test reports. University of Nebraska Tractor Test Laboratory, Lincoln, NE. Available online: http://tractortestlab.unl.edu/testreports.htm. Accessed: January 23, 2009.
Pedersen, S. 2002. Paper no. 024178. Heat and moisture production for pigs on animal and house level. In: ASAE Annual International Meeting; CIGR XVth World Congress, Chicago IL.
Pordesimo, L. O., B. R. Hames, S. Sokhansanj, and W. C. Edens. 2005. Variation in corn stover composition and energy content with crop maturity. Biomass and Bioenergy 28: 366-374.
Sauvant, D., J. M. Perez, and G. Tran (eds). 2004. Tables of composition and nutrition value of feed materials: Pigs, poultry, cattle, sheep, goats, rabbits, horses, fish. 2nd edition. Wageningen Academic Publishers Wageningen, NL.
Thacker, P. A. 2001. Chapter 17: Water in swine nutrition. In: A. J. Lewis and L. L. Southern (eds.) Swine nutrition. CRC Press, Boca Raton, FL.
USDA. 2002a. Iowa state and county data. 2002 Census of Agriculture. USDA-National Agricultural Statistics Service, Washington, D. C. Available online: http://www.agcensus.usda.gov/Publications/2002/Census_by_State/Iowa/index.asp. Accessed: January 20, 2009.
USDA. 2002b. Table 12. Hogs and pigs- inventory and sales: 2002 and 1997. 2002 Census of Agriculture. USDA-National Agricultural Statistics Service, Washington, D. C. Available online: http://www.agcensus.usda.gov/Publications/2002/Volume_1,_Chapter_2_US_State_Level/index.asp. Accessed: December 5, 2008.
USGS. 2008. Usgs ground water level annual statistics for Iowa. United States Geological Survey, Reston, VA. Available online: http://waterdata.usgs.gov/ia/nwis/annual? Accessed: November 14, 2008.
Wathes, C., and C. T. Whittemore. 2006. Chapter 17: Environmental management of pigs. In: I. Kyriazakis and C. T. Whittemore (eds.) Whittemore’s science and practice of pig production, 3rd edition. p 533-592. Blackwell Publishing, Oxford, UK.
92
Table 1. Density, embodied energy, and embodied carbon for building materials examineda Material
Table 3. Building occupancy, pig size and heat production, target temperature and minimum ventilation rate assumptions for estimating energy use for thermal climate control of conventional swine facilities
93
Occupancy Room Temperaturea Ventilation rateb Building Pigs in
a Based on Holden et al. (1996), Carr (1998), and Wathes and Whittemore (2006). Min and max is the temperature at which heat must be added or removed, respectively, to maintain pig comfort and performance.
b From MWPS (1990b). c Calculated based on Pedersen (2002) and Brown-Brandl et al. (2004). d Minimum ventilation rate to maintain acceptable air quality and humidity inside building. e Maximum allowed ventilation rate, coupled with additional cooling strategies to reduce interior temperature of building f Lactating sows will be housed in the farrowing facility with their litter of pigs. Presented body weight and sensible heat
production is for the sow only.
94
Table 4. Water use by pig facilities Facility Drinking and coolinga Cleaningb Farrowing 30 L head-1d-1 1,083 L space-1 yr-1 Nursery 5 L head-1 d-1 60 L space-1 yr-1
Grow-finish 10 L head-1d-1 137 L space-1 yr-1 Gestation 16 L head-1d-1 138 L space-1 yr-1 a Based on Thacker (2001). b From Fulhage and Hoehne (2001). Table 5. Daily feed intake and growth efficiency assumptions for pigs housed in conventional confinementa Class of pig Body weight Feed level Gestating sow 157.0 kg 2.3 kg/d Lactating sow 142.9 kg 6.4 kg/d Growing pigs 5–23 kg 1.7 kg of feed/kg of body weight gain 23–45 kg 2.0 kg of feed/kg of body weight gain 45–91 kg 2.6 kg of feed/kg of body weight gain 91–136 kg 3.4 kg of feed/kg of body weight gain a Based on work reported by Lammers et al. (2007) and Lammers et al. (2008b).
Table 7. Embodied carbon of pig facilities per market pig by system and scale System Conventional Hoop barn-based Market pigs/yr 5,200 15,600 5,200 15,600 Grow-finish, kg CO2/market pig Concrete 30.8 28.4 16.7 17.2 Steel 9.8 12.8 3.8 3.8 Lumber 2.9 2.6 1.5 1.6 Thermoplastics 1.0 0.5 0.4 0.3 Diesel 0.5 0.4 0 0 Total 45.0 44.7 22.4 22.9 Gestation, kg CO2/market pig Concrete 17.3 14.2 15.0 13.9 Steel 13.1 12.2 9.2 8.8 Lumber 1.2 1.0 1.5 1.3 Thermoplastics 0.2 0.2 0.4 0.4 Diesel 0.2 0.1 0 0 Total 32.0 27.7 26.1 24.4 All buildings, kg CO2/market pig Concrete 58.8 52.8 47.5 44.7 Steel 39.0 36.0 30.6 25.2 Lumber 4.8 4.4 3.8 3.7 Thermoplastics 9.8 6.9 11.3 6.7 Diesel 1.0 0.8 0.5 0.3 Total 113.4 100.9 93.7 80.6
97
Table 8. Annual allotment of embodied energy and carbon for different lifespan scenarios of different pig facilities by system and scale System Conventional Hoop barn-based Market pigs/year 5,200 15,600 5,200 15,600 Embodied energy, MJ/market pig 15 year useful life 102.9 87.0 93.0 75.7 15 year useful life, replace thermoplastic tarps once 95.3 73.2 20 year useful life 77.2 65.2 69.7 53.2 20 year useful life, replace thermoplastic tarps once 71.5 54.9 Embodied carbon, kg/market pig 15 year useful life 7.6 6.7 6.2 5.4 15 year useful life, replace thermoplastic tarps once 6.3 5.4a 20 year useful life 5.7 5.0 4.7 4.0 20 year useful life, replace thermoplastic tarps once 4.7a 4.1 a In some case, the embodied carbon of additional thermoplastic tarps is so small
relative to other facility components replacing the thermoplastic tarps does not impact embodied carbon per market pig.
98
Table 9. Energy use per pig space for thermal environment control of different phases and scales
of conventional confinement facilities in Mason City, Iowaa Barn
Table 12. Greenhouse gas emissions from operation of different systems and phases of pig production within different types and scales of facilitiesa Electricity
Table 13. Performance adjusteda operating energy and associated greenhouse gas emissions of different pig production systems and scales by fuel type and activity
System Conventional Hoop barn-based Market pigs per year 5,200 15,600 5,200 15,600 Nonrenewable energy, MJ/market pig
Electricity Ventilation 26.9 26.6 5.3 5.1 Auxiliary heat 25.3 24.6 23.7 19.8 Water delivery 2.6 2.5 2.6 2.4 Pressure washing 3.4 3.3 0.9 0.9 Illumination 6.5 5.9 3.8 3.7 Feed delivery 2.6 1.0 0.2 0.3 Liquefied petroleum gas Building heat 109.7 102.9 72.9 66.8 Diesel fuel Heating wash water 16.8 15.9 4.6 4.4 Manure handling 2.9 2.7 10.6 10.5 Total nonrenewable energy 196.7 185.4 124.6 113.9 Renewable energy, MJ/market pig Feed 6,534.4 6,534.4 6,729.0 6,729.0 Bedding into barn 0 0 1,866.3 1,849.0 Bedding removed from barn (1,866.3) (1,849.0) Net renewable energy 6,534.4 6,534.4 6,729.0 6,729.0 Total energy, MJ/market pig 6731.1 6,719.8 6,853.6 6,842.9 Greenhouse gas emissions Electricity, kg CO2/market pig 15.46 14.60 8.37 7.38 LP Gas, kg CO2/market pig 6.94 6.53 1.34 1.25 Diesel, kg CO2/market pig 1.64 1.55 1.26 1.23 Total emissions, kg CO2/market pig 24.04 22.68 10.97 9.86 aGrow-finish pigs housed in hoop barns consume 3.3% more feed and sow herd reduced by 7% in hoop barn-based system to account for reproductive performance differences.
103
CHAPTER 5. DIGESTIBLE AND METABOLIZABLE ENERGY OF CRUDE GLYCEROL FOR GROWING PIGS
A paper published in the Journal of Animal Science2
P. J. Lammers,* B. J. Kerr,†3 T. E. Weber,† W. A. Dozier, III,‡
M. T. Kidd,§ K. Bregendahl,* and M. S. Honeyman*
*Department of Animal Science, Iowa State University, and the †USDA-ARS, Swine Odor and Manure Management Research Unit, Ames, IA 50011-3310; the ‡USDA-ARS Poultry
Research Unit, and the §Department of Poultry Science, Mississippi State University, Mississippi State, MS 39762-9665
ABSTRACT: The apparent DE and ME value of crude glycerol for growing pigs was
determined in 5 experiments using crude glycerol (86.95% glycerol) from a biodiesel
production facility with soybean oil used as the initial feedstock (AG Processing Inc.,
Sergeant Bluff, IA). Dietary treatments were 0, 5, or 10% glycerol addition to basal diets in
Exp. 1; 0, 5, 10, or 20% glycerol addition to basal diets in Exp. 2; and 0 and 10% crude
glycerol addition to the basal diets in Exp. 3, 4, and 5. Each diet was fed twice daily to pigs
in individual metabolism crates. After a 10-d adjustment period, a 5-d balance trial was
conducted. During the collection period, feces and urine were collected separately after each
meal and stored at 0°C until analyses. The GE of each dietary treatment and samples of urine
and feces from each pig were determined by isoperibol bomb calorimetry. Digestible energy
of the diet was calculated by subtracting fecal energy from the GE in the feed, whereas ME
was calculated by subtracting the urinary energy from DE. The DE and ME values of crude
glycerol were estimated as the slope of the linear relationship between either DE or ME
intake from the experimental diet and feed intake. Among all experiments, the crude glycerol
1Reprinted with permission of J. Anim. Sci. 2008.86:602-608 2Corresponding author: [email protected]
104
(86.95% glycerol) examined in this study was found to have a DE of 3,344 ± 8 kcal/kg and a
ME of 3,207 ± 10 kcal/kg when fed to growing pigs, thereby providing a highly available
Crude glycerol is the principal co-product of biodiesel production (Ma and Hanna,
1999; Van Gerpen, 2005; Thompson and He, 2006), with 79 g of crude glycerol generated
for every 1.0 L of biodiesel produced (Thompson and He, 2006). With current biodiesel
production capacity, approximately 4.16 × 10⁸ kg of crude glycerol could be generated
annually (NBB, 2007). Multiple reviews of the metabolic effects of glycerol have been
published (Lin, 1977; Tao et al., 1983; Brisson et al., 2001). Glycerol is absorbed by the
gastrointestinal tract of nonruminants (Tao et al., 1983) and is utilized as an energy source
(Cryer and Bartley, 1973). Glycerol is gluconeogenic with glycerol gluconeogenisis being
limited by the availability of glycerol (Cryer and Bartley, 1973; Tao et al., 1983; Baba et al.,
1995).
Studies examining the effects of supplementing crude glycerol to diets fed to swine
(Kijora and Kupsch, 2006; Kiljora et al., 1995, 1997; Mourot et al., 1994) and broilers
(Cerrate et al., 2006; Simon et al., 1996) have shown little to no effect on animal
performance. Research determining the energy value of crude glycerol is limited. Recently,
Bartelt and Schneider (2002) reported a decrease in the ME of glycerol as the level of dietary
glycerol was increased in swine and poultry diets. In contrast, Dozier et al. (2008) in broilers
and Lammers et al. (2008) in laying hens did not observe this effect. The objectives of the
105
current study were to determine the apparent DE and ME of crude glycerol at various levels
of supplementation and to determine if the apparent energy values differed between starter
and finisher pigs.
MATERIALS AND METHODS
General Pig Management. The Iowa State University Animal Care and Use
Committee approved all experimental protocols and all experiments utilized the same batch
of crude glycerol (86.95% glycerol). The crude glycerol was characterized through standard
techniques (AOAC, 1995; AOCS, 2000; ASTM 2006) and is detailed in Table 1. Crude
glycerol was obtained from biodiesel production using soybean oil as the initial feedstock
(AG Processing Inc., Sergeant Bluff, IA). Three experiments (Exp. 1, 3, and 4) examined
crude glycerol fed to starter pigs (average initial BW, 10.3 ± 1.4 kg) whereas 2 experiments
(Exp. 2 and 5) examined crude glycerol fed to finishing pigs (average initial BW, 104.7 ± 8.0
kg). In each experiment, 24 pigs were randomly assigned to individual metabolism crates
equipped with screens and trays that allowed total but separate collection of feces and urine.
Dimensions of individual metabolism crates were 0.53 × 0.71 m for starter pigs and 0.8 × 2.1
m for finishing pigs. Due to crate design, barrows were used in the starter pig metabolism
experiments while gilts were used in the finishing pig metabolism experiments.
Pigs were randomly assigned to dietary treatments after pen assignment. Dietary
treatments consisted of a common basal diet which met or exceeded NRC requirements
(NRC, 1998) mixed with 0, 5, 10, or 20% crude glycerol addition to the basal diet (Exp. 1
and 2) or 0 and 10% crude glycerol addition to the basal diet (Exp. 3, 4, and 5). Basal diet
formulations and calculated analyses are summarized in Table 2. A 10-d adjustment period
was used to adapt pigs to the metabolism crate and the dietary treatment.
106
Pigs were fed 2 equal daily meals. In Exp. 1, 2, 4 and 5, pigs were fed a set amount of
the basal diet with pigs on the glycerol treatments offered an increased feed allotment based
on the amount of glycerol addition to the basal diet (Adeola, 2001). In Exp. 3 pigs assigned
to 10% crude glycerol received 5% more feed than control pigs. In all experiments, pigs were
fed twice daily with feed consumption and refusal recorded at the end of the experimental
period. Table 3 details daily feed allowance and components for dietary treatments fed for
each of the 5 experiments. Following the adjustment period, urine was collected for the
following 5d into stainless steel buckets containing 30mL of 6 N HCl placed below the
collection drain of each crate. Urine was collected twice daily, diluted with water to a
constant volume, and thoroughly mixed, with a representative aliquot collected and stored at
0°C until subsequent analysis.
In Exp. 1 and 2, Fe2O3 (0.25% by weight) was thoroughly mixed with the initial feed
allocation and fed on the evening of d 10. The appearance of the marker in the feces signaled
the beginning of the fecal collection period. Feces were collected twice daily and stored at
0°C. A second pulse of Fe2O3 was thoroughly mixed and fed with the tenth subsequent meal
(5-d collection period). Upon appearance of the second pulse of marker in the feces,
collection was terminated. Because pigs seemed to have an aversion to the feed containing
the marker in Exp. 1 and 2, no marker was utilized in Exp. 3, 4, and 5. Rather, total fecal
collection was performed for a 120 h (5 d) time period beginning the morning of d 11 and
ending the morning of d 16.
Chemical Analyses. Feed samples were ground through a 1-mm screen before energy
determination. Fecal samples were thawed, dried at 70°C for 48 h, and weighed to determine
the DM content. Fecal samples were ground through a 1-mm screen in preparation for energy
107
determination. For urine energy determination, 2 mL of urine was added to 0.5 g of dried
cellulose and subsequently dried at 50°C for 24 h prior to energy determination. The GE of
feed, feces, and urine plus cellulose were determined using an isoperibol bomb calorimeter
(model number 1281; Parr Instrument Co., Moline, IL) with benzoic acid used as a standard.
Duplicate analyses were performed on all diets and samples of feces from each pig whereas
triplicate analysis was performed on diluted urine plus cellulose from each pig. Urinary
energy was determined by subtracting the energy contained in cellulose from the combined
urine plus cellulose energy.
Calculations and Statistical Analysis. Observations from 108 pigs of the 120 pigs
assigned to dietary treatments across all experiments were used for analysis. Observations
from 9 pigs were not possible to quantify due to diarrhea, constipation, or feed refusal.
Observations from 3 pigs exceeded their treatment group mean by more than 2 SD and were
considered outliers. The authors do not have an explanation why all but 1 pig excluded from
analysis received experimental diets containing crude glycerol.
Gross energy consumed was calculated by multiplying the GE value of the diet fed by
feed intake over the 5-d collection period. Apparent DE values were calculated by
subtracting fecal energy from intake energy. Apparent ME values were calculated by
subtracting urinary energy from apparent DE. The apparent DE and ME values of crude
glycerol fed to pigs were estimated as the slope of the linear relationship between the
apparent DE or ME intake from the experimental diet, dependent variable, and feed intake,
independent variable, (Adeola, 2001) using JMP 6.0 (SAS Institute, Inc. Cary, NC). A
regression model was used to test for effect of feed intake, experiment number, fecal
108
collection method, type of pig, and type of pig × feed intake interaction on apparent DE and
ME.
RESULTS AND DISCUSSION
Production of biofuels is increasing due to rising energy prices, uncertain access to
petroleum supplies, and recognition of the environmental impacts of fossil fuel use (Ma and
Hanna, 1999; Hill et al., 2006; Kurki et al., 2006). Consequently, increased production of co-
products from biofuels industries will necessitate livestock producers to be flexible in
feedstuff choice. Crude glycerol, being a readily available energy source, may play an
important role in meeting the energy needs of pigs as biodiesel production expands.
The ME of the basal diet used in the starter experiments was 3,165, 3,199, and 3,248
kcal/kg for Exp 1, 3, and 4 respectively. The ME of the basal diets used in the finisher
experiments were 3,174 and 3,255 kcal/kg for Exp 2 and 5 respectively. These values are
within 5% of the calculated contents for the starter and finisher basal diets and reflect good
collection and analytical techniques in all experiments. The GE of crude glycerol evaluated
in these experiments was determined to be 3,625 ± 26 kcal/kg. This is close to expectations
relative to pure glycerol (in house GE analysis of 4,305 kcal/kg), given that our sample of
crude glycerol evaluated contained 86.95% glycerol with low levels of methanol (0.028%)
and free fatty acid (0.29%). Based upon our data in broilers (Dozier et al., unpublished data)
and laying hens (Lammers et al., 2008) we did not expect the level of crude glycerol to affect
ME determination. However, when data from Exp. 1 was analyzed separately the ME of
crude glycerol declined with increasing levels of supplementation, with estimated ME values
of 3,601, 3,239, and 2,579 kcal/kg crude glycerol for 5, 10, and 20% inclusion levels,
respectively (quadratic, P = 0.05). Bartelt and Schneider (2002) also showed a decrease in
109
the ME of glycerol (99.9% glycerol) with increasing levels of glycerol fed to 34-kg barrows,
with ME/kg being 4,177, 3,436, and 2,524 kcal/kg at 5, 10, and 15% inclusion levels,
respectively. In Exp. 1, the decrease in ME of glycerol appears to be due to pigs fed the 20%
crude glycerol. Removing the 20% inclusion level data from Exp. 1 showed no such
difference in ME estimation with the remaining levels of crude glycerol tested (0, 5, and
10%), resulting in a ME value of 3,463 kcal/kg (linear, P = 0.001). In contrast, there was no
effect of crude glycerol inclusion level on ME determination when determined with finishing
pigs in Exp. 2.
Apparent energy values for all 5 experiments are detailed in Table 4. Among all
treatments, digestibility ranges between 89 and 92% while ME values are between 86 and
88% of the GE intake. The only exception is found in the starter pigs fed 20% crude glycerol
(Exp. 1). The digestibility of the fed diet is 90% in those 6 pigs, however, the ME value is
83% of the GE intake. This further highlights a potential decline in the ability of 11.0-kg pigs
to metabolize more than 10% crude glycerol. We do not have an explanation for this effect as
enzyme kinetics involved in glycerol metabolism have not been studied in the pig and this
experiment was not designed to evaluate tissue utilization or metabolism of glycerol in the
pig. With 6 starter pigs fed 20% crude glycerol it is difficult to draw conclusions about the
small pig’s ability to utilize crude glycerol, although the question should be examined
further. Given the fact that pigs fed the 20% crude glycerol in Exp. 1 had reduced utilization
of crude glycerol, as determined by a lower ME estimate, we chose to exclude the pigs from
subsequent analysis.
Markers such as Fe2O3 have long been used in nutritional studies (Kotb and Luckey,
1972). In Exp. 1 (starter) and 2 (finisher), Fe2O3 seemed to affect palatability of the diet
110
through visual evaluation of feed acceptance at the initiation of the collection period. This is
supported by Jagger et al. (1992) who reported that 57-kg pigs had some initial reluctance to
consume feed when the level of marker was increased from 0.1% to 0.5% TiO2. We chose
not to use a marker in Exp. 3, 4, and 5 because acceptance of feed is critical in short-term
metabolic studies.
Table 5 presents the apparent DE and ME values as determined by linear regression
(Adeola, 2001) for Exp. 1 to 5. Apparent DE and ME were not influenced by experiment
(Exp. 1 to 5), use of marker to determine fecal collection time points (Exp. 1 and 2 versus
Exp. 3, 4, and 5), type of pig (starter, Exp. 1, 3, and 4 versus finisher, Exp. 2 and 5), or by
type of pig × feed intake interaction. As expected, feed intake affected both apparent DE and
ME intake (P 0.001).
In the current experiments, the ratio of DE:GE for the crude glycerol examined
equaled 92% indicating that crude glycerol was well digested by pigs. In comparison to corn
and soybean oil, 2 common feedstuffs used to provide energy in pig diets, the ratio of
ME:DE for the crude glycerol examined was 96%, which is identical to the ME:DE ratio for
soybean oil and is comparable to the ratio of ME:DE for corn which is 97% (NRC, 1998).
These relationships support the assertion that the crude glycerol used in these experiments
was well utilized by the pig as a source of energy. This is agreement with Bartelt and
Schneider (2002) who reported that > 97% of the glycerol is digested prior to the cecum.
The results of combined regressions indicate that the DE value of the examined crude
glycerol (86.95%) was 3,344 ± 8 kcal/kg (Figure 1) and that the ME was 3,207 ± 10 kcal/kg
(Figure 2). Recent work with the same crude glycerol sample estimated an apparent ME
(corrected for nitrogen) to be 3,805 kcal/kg for laying hens (Lammers et al. 2008) and 3,684
111
kcal/kg for broilers (Dozier et al., 2008) which are not different from the GE for this sample
of crude glycerol (3,625 ± 26 kcal/kg). Tao et al. (1983) indicated that the oxidation of
glycerol to carbon dioxide releases 4,320 kcal/kg. Rosebrough et al. (1980) assumed a ME
value of 4,200 kcal/kg for dietary glycerol in turkeys while Cerrate et al. (2006) estimated a
ME value of 3,528 kcal/kg in broilers. Until now, no work has reported an actual
determination of ME of crude glycerol in swine. When placed on an equivalent glycerol
basis, our ME determination would be marginally higher than the 3,436 kcal ME/kg
determined for pure glycerol (Bartelt and Schneider, 2002).
With an ME of 3,207 ± 10 kcal/kg, crude glycerol can be used as an excellent source
of energy for growing pigs. Levels of other compounds in crude glycerol (i.e., methanol,
sodium- or potassium chloride, and free fatty acids), however, must be monitored to prevent
excessive amounts in pig diets and for potential impacts on ME determination of this
feedstuff.
AKNOWLEDGEMENTS
This project was supported by the Hatch Act, State of Iowa funds, USDA Special
Grants, USDA-ARS, and the Leopold Center for Sustainable Agriculture. The authors
gratefully acknowledge the assistance of the staff at the ISU Swine Nutrition Research Farm
for data collection and the ISU Agriculture Experiment Station Consulting Group for
statistical assistance. Mention of trade names or commercial products in this publication is
solely for the purpose of providing specific information and do not imply recommendation or
endorsement by Iowa State University, Mississippi State University, or the USDA.
112
REFERENCES
Adeola, O. 2001. Digestion and balance techniques in pigs. Pages 903–916 in Swine Nutrition. A. J. Lewis and L. L. Southern., 2nd ed. CRC Press, New York.
AOAC. 1995. Official Methods of Analysis of AOAC International. 16th ed. Association of
Official Analytical Chemists. Arlington, VA.
AOCS. 2000. Official Methods and Recommended Practices of the AOCS. 5th ed. American Oil Chemists’ Society, Champaign, IL.
ASTM. 2006. Annual Book of American Society for Testing and Materials Standards International, Vol. 05.04, Petroleum Products and Lubericants (IV): D6557. ASTM International, West Conschohocken, PA.
Baba, H., X.-J. Zhang, and R. R. Wolfe. 1995. Glycerol gluconeogenesis in fasting humans. Nutrition. 11:149–153.
Bartelt, J., and D. Schneider. 2002. Investigation on the energy value of glycerol in the feeding of poultry and pig. Pages 15-36 in Union for the Promotion of Oilseeds-Schriften Heft 17. Union Zur Förderung Von Oel-Und Proteinplafalzen E.V. Berlin, Germany.
Brisson, D., M.-C. Vohl, J. St-Pierre, T. J. Hudson, and D. Gaudet. 2001. Glycerol: A neglected variable in metabolic processes? BioEssays 23:534-542.
Cerrate, S., F. Yan, Z. Wang, C. Coto, P. Sacakli, and P. W. Waldroup. 2006. Evaluation of glycerine from biodiesel production as a feed ingredient for broilers. Int. J. Poult. Sci. 5:1001-1007.
Cryer, A., and W. Bartley. 1973. Studies on the adaptation of rats to a diet high in glycerol. Int. J. Biochem. 4:293-308.
Dozier, W. A., III, B. J. Kerr, A. Corzo, M. T. Kidd, T. E. Weber, and K. Bregendahl. 2008. Apparent metabolizable energy of glycerin for broiler chickens. Poult. Sci. 87:317–322.
113
Hill, J., E. Nelson, D. Tilman, S. Polasky, and D. Tiffany. 2006. Environmental, economic, and energetic costs and benefits of biodiesel and ethanol biofuels. PNAS 103:11206-11210.
Jagger, S., J. Wiseman, D.J.A. Cole, and J. Craigon. 1992. Evaluation of inert markers for the determination of ileal and faecal apparent digestibility values in the pig. Br. J. Nutr. 68:729-739.
Kijora, C., and S.-D. Kupsch. 2006. Evaluation of technical glycerols from "biodiesel" production as a feed component in fattening of pigs. Lipid-Fett 98:7:240-245.
Kijora, C., R.-D. Kupsch, H. Bergner, C. Wenk, and A. L. Prabucki. 1997. Comparative investigation on the utilization of glycerol, free fatty acids, free fatty acids in combination with glycerol and vegetable oil in fattening of pigs. J. Anim. Physiol. Anim. Nutr. 77:127-138.
Kiljora, C., H. Bergner, R.-D. Kupsch, and L. Hageman. 1995. Glycerol as feed component in diets of fattening pigs. Arch. Anim. Nutr. 47:345-360.
Kotb, A. R., and T. D. Luckey. 1972. Markers in nutrition. Nutr. Abstr. Rev. 42:813-845.
Kurki, A., A. Hill, and M. Morris. 2006. Biodiesel: The sustainability dimensions. National Center for Appropriate Technology, Fayetteville, AR.
Lammers, P. J., B. J. Kerr, M. S. Honeyman, K. Stalder, W. A. Dozier III, T. E. Weber, M.T. Kidd, and K. Bregendahl. 2008. Nitrogen-corrected metabolizable energy value of crude glycerol for laying hens. Poult. Sci. 87:104–107.
Lin, E.C.C. 1977. Glycerol utilization and its regulation in mammals. Ann. Rev. Biochem. 46:765-795.
Ma, F., and M. A. Hanna. 1999. Biodiesel production: A review. Biores. Tech. 70:1-15.
Mourot, J., A. Aumaitre, A. Mounier, P. Peiniau, and A. C. Fracois. 1994. Nutritional and physiological effects of dietary glycerol in the growing pig. Consequences on fatty tissues and post mortem muscular parameters. Livest. Prod. Sci. 38:237-244.
114
National Biodiesel Board. 2007. Official Site of the National Biodiesel Board. http://www.biodiesel.org/, Accessed May 10, 2007.
NRC. 1998. Nutrient Requirements of Swine. 10th rev. ed. Natl. Acad. Press, Washington DC.
Rosebrough, R. W., E. Geis, P. James, H. Ota, and J. Whitehead. 1980. Effects of dietary energy substitutions on reproductive performance, feed efficiency, and lipogenic enzyme activity on large white turkey hens. Poult. Sci. 59:1485-1492.
Simon, A., H. Bergener, and M. Schwabe. 1996. Glycerol- feed ingredient for broiler chickens. Arch. Anim. Nutr. 49:103-112.
Tao, R. C., R. E. Kelley, N. N. Yoshimura, and F. Benjamin. 1983. Glycerol: Its metabolism and use as an intravenous energy source. J. Parenteral and Enteral Nutr. 7:479-488.
Thompson, J. C., and B. B. He. 2006. Characterization of crude glycerol from biodiesel production from multiple feedstocks. Appl. Eng. Agric. 22:261-265.
Van Gerpen, J. 2005. Biodiesel processing and production. Fuel Processing Technology. 86:1097-1107.
115
Table 1. Characterization of crude glycerol Item Value Analytical method Total glycerol1, % 86.95 ASTM2 D 6584-00E01 Methanol1, % 0.028 Gas chromatography (proprietary method) pH1 5.33 Orion 230A pH meter with 9107 BN probe Total fatty acid1, % 0.29 AOCS3 G 4.40 modified for glycerin Moisture4, % 9.22 AOAC5 984.20 Crude protein4, % 0.41 AOAC 990.03 Crude fat4, % 0.12 AOAC 920.39 (A) Ash4, % 2 3.19 AOAC 942.05 Sodium4, %2 1.26 AOAC 956.01 Chloride4, %2 1.86 AOAC 9.15.01, 943.01 Potassium4, %2 < 0.005 AOAC 956.01 Color4 < 1 AOCS Cc 13a-43 Gross energy6, kcal/kg 3625 ± 26 Isoperibol bomb calorimeter
1Values reported by AGP, Inc. Sergeant Bluff, IA, Lot # GB605-03. 2American Society for Testing Materials (2006) 3American Oil Chemists’ Society (2000). 4Analysis by University of Missouri-Columbia Experiment Station Chemical
Laboratories, Columbia, MO. 5Association of Official Analytical Chemists (1995). 6Analysis by USDA, National Swine Research and Information Center, Ames, IA; Model
number 1281, Parr Instrument Co. Inc., Moline, IL.
116
Table 2. Ingredient and calculated content of basal diets fed to starter and finisher pigs, as-fed basis Item Starter1 Finisher2
1Mean initial BW, 10.3 ± 1.4 kg. 2Mean initial BW, 104.7 ± 8.0 kg. 3Provided the following per kg of diet: Cu, 26.3 mg as Cu oxide; Fe, 263 mg as Fe
sulfate; I, 3.0 as Ca iodate; Mn, 90.0 mg as Mn oxide; and Zn, 225 mg as Zn oxide. 4Provided the following per kg of diet: Cu, 15.8 mg as Cu oxide; Fe, 158 mg as Fe
sulfate; I, 1.8 as Ca iodate; Mn, 54.0 mg as Mn oxide; and Zn, 135 mg as Zn oxide. 5Provided the following per kg of diet: vitamin A, 8,157 IU; vitamin D3, 2,039 IU;
6Provided the following per kg of diet: vitamin A, 4,409 IU; vitamin D3, 1,102 IU; vitamin E, 22 IU; vitamin B12, 0.02 mg; riboflavin, 6.6 mg; niacin, 33.1 mg; d-panothentic acid, 17.6 mg.
Figure 1. Apparent DE of crude glycerol fed to pigs. Data represents the combined regression from Exp. 1 through 5 of DE intake over feed consumption for a 5-d period for 102 pigs fed 0, 5, 10, and 20% crude glycerol, with the slope of the regression line indicating crude glycerol’s DE equals 3,344 kcal/kg.
Figure 2. Apparent ME of crude glycerol fed to pigs. Data represents the combined regression from Exp. 1 through 5 of ME intake over feed consumption for a 5-d period for 102 pigs fed 0, 5, 10, and 20% crude glycerol, with the slope of the regression line indicating crude glycerol’s ME, equals 3,207 kcal/kg.
122
CHAPTER 6. GROWTH PERFORMANCE, CARCASS CHARACTERISTICS, MEAT QUALITY, AND TISSUE HISTOLOGY OF GROWING PIGS FED CRUDE
GLYCERIN-SUPPLEMENTED DIETS
A paper published in the Journal of Animal Science4
P. J. Lammers,* B. J. Kerr,†5 T. E. Weber,† K. Bregendahl,* S. M. Lonergan,*
K. J. Prusa,‡ D. U. Ahn,*, W. C. Stoffegen,§ and M. S. Honeyman*
*Department of Animal Science, Iowa State University; ‡Department of Food Science and Human Nutrition, Iowa State University;
†USDA-ARS, Swine Odor and Manure Management Research Unit; §USDA-ARS, Bacterial Diseases of Livestock Research Unit; Ames, IA 50011-3150.
ABSTRACT: The effects of dietary crude glycerin on growth performance, carcass
characteristics, meat quality indices, and tissue histology of growing pigs fed crude glycerin
were determined in a 138-d feeding trial. Crude glycerin utilized in the trial contained
84.51% glycerin, 11.95% water, 2.91% sodium chloride, and 0.32% methanol. Eight days
post-weaning, 96 pigs (48 barrows, 48 gilts, average BW of 7.9 ± 0.4 kg) were allotted to 24
pens (4 pigs/pen), with sex and BW balanced at the start of the experiment. Dietary
treatments were 0, 5, and 10% crude glycerin inclusion into corn-soybean meal based diets
and were randomly assigned to pens. Diets were offered ad libitum in meal form and
formulated to be equal in ME, sodium, chloride, and Lys, with other AA balanced on an ideal
AA basis. Pigs and feeders were weighed every other week to determine ADG, ADFI, and
G:F. At the end of the trial, all pigs were scanned using real time ultrasound and
subsequently processed at a commercial abattoir. Blood samples were collected pretransport
and at the time of harvest for plasma metabolite analysis. In addition, kidney, liver, and eye
4Reprinted with permission of J. Anim. Sci. 2008.86:2962–2970 5Corresponding author: [email protected]
123
tissues were collected for subsequent examination for lesions characteristic of methanol
toxicity. After an overnight chilling of the carcass, loins were removed for meat quality,
sensory evaluation, and fatty acid profile analysis. Pig growth, feed intake, and G:F were not
affected by dietary treatment. Dietary treatment did not affect 10th-rib backfat, LM area,
percent fat free lean, meat quality, or sensory evaluation. Loin ultimate pH was increased (P=
0.06) in pigs fed the 5 and 10% crude glycerin compared with pigs fed no crude glycerin
(5.65 and 5.65 versus 5.57 respectively). Fatty acid profile of the LM was slightly changed
by diet with the LM from pigs fed 10% crude glycerin having less linoleic acid (P < 0.01)
and more eicosapentaenoic acid (P = 0.02) than pigs fed the 0 or 5% crude glycerin diets.
Dietary treatment did not affect blood metabolites or frequency of lesions in the examined
tissues. This experiment demonstrated that pigs can be fed up to 10% crude glycerin with
little to no effect on pig performance, carcass composition, meat quality, or lesion scores.
Samples were subsequently centrifuged at 900 g for 20 min and stored at -80°C pending
analysis. Blood urea nitrogen was determined enzymatically as described previously (Kerr et
al., 2004). Plasma cortisol was determined using a commercially available kit (Active
Cortisol EIA, Diagnostic Systems Laboratories, Inc., Webster, TX) that has been previously
validated for porcine serum (Weber and Spurlock, 2004). Commercially available kits
(Sigma Chemical Co. St. Louis, MO) were used to measure plasma glucose and glycerol
(GAHK20 and F6428 respectively). In addition, commercially available kits (Pointe
Scientific Inc., Canton MD) were used to measure plasma lactate concentrations and creatine
kinase activity (L7596 and C7512, respectively). All of the plasma metabolites were
measured in duplicate.
Tissue Histology. From all pigs, 1 eye, liver, and kidney per pig were collected at the
time of slaughter and placed in neutral-buffered 10% formalin. They were subsequently
processed by routine paraffin embedding techniques, cut in 4 m sections, and stained with
hematoxylin and eosin and Masson’s trichrome techniques. All sections were read for lesions
(Maxie, 2007) twice by a single person versed in lesion evaluation.
Statistical Analysis. Data were subjected to ANOVA (SAS Inst. Inc., Cary, NC) and
differences between means were tested using the PDIFF option. Pig performance (ADG,
ADFI, and G:F) was evaluated in each dietary phase and for the entire 138-d feeding period
with the pen used as the experimental unit. Carcass composition and meat quality traits were
evaluated to test for effect of dietary treatment, pig gender, and diet × gender interaction.
Plasma metabolites pre-transport and immediately post-exsanguination, and differences in
the frequency of histological lesions were evaluated for the effect of dietary treatment.
129
Individual pigs were the experimental unit for analysis of carcass composition, meat quality,
plasma metabolites and lesion data.
RESULTS AND DISCUSSION
Average daily gain, ADFI, and G:F were not affected by dietary treatment in any
phase (data not shown) or over the entire growing 138 d period (Table 3). These results agree
with results from previous studies examining growth and performance of pigs fed crude
glycerol in barley-soybean meal (Kiljora et al., 1995; Kijora et al., 1997; Kijora and Kupsch,
2006) and wheat-soybean meal diets (Mourot et al., 1994). This is also supported by work in
broilers that demonstrated up to 5% glycerin can be fed without affecting growth or feed
conversion (Simon et al., 1996; Cerrate et al., 2006).
The effects of diet, gender, and their potential interaction on carcass characteristics
are described in Table 4. There was no diet × gender interaction on any trait examined. In
agreement with other reports (Mourot et al., 1994; Kiljora et al., 1995; Kijora et al., 1997;
Kijora and Kupsch, 2006) dietary treatment did not effect 10th rib backfat, LM area, fat free
lean, daily lean gain, or carcass lean percentage. As expected 10th rib backfat was thicker in
barrows than gilts (Cline and Richert, 2001; Renaudeau and Mourot, 2007).
Diet did not affect HCW, percent loin lean, moisture content, or chop lipid percentage
(Table 5). These results agree with other reports (Mourot et al., 1994; Kiljora et al., 1995,
1997; Kijora and Kupsch, 2006). Inclusion of glycerin in the diet did not affect chop drip
loss, with is in agreement with Kijora and Kupsch (2006) and Airhart et al. (2002) but
contrary to the findings of Mourot et. al (1994). As expected, carcasses from gilts weighed
less and were leaner than the carcasses from barrows (P 0.05).
130
Loin tissue from pigs fed 10 % crude glycerin had less concentrations of linoleic acid (18:2)
than the other dietary treatments (P < 0.01; Table 5) which agrees with the work of Morout
et al. (1994) and Kijora et al. (1997). Eicosapentaenoic acid (20:5) increased with increasing
crude glycerin supplementation (P = 0.02). Morout et al. (1994) did not report eicosapentoic
acid (20:5) concentrations but reported declines in myristic acid (14:0) in backfat and
linolenic acid (18:2) in backfat and semimembranosus muscle when pigs were fed 5%
glycerin. Kijora et al. (1997) did not find these changes in backfat from pigs fed 10%
glycerin. There is no clear consensus on the effect feeding crude glycerin may have on fatty
acid profile of pork lipid (Mourot et al., 1994; Kijora et al., 1997). The apparent
disagreement on the effect feeding glycerin has on fatty acid profile of pork fat may be due to
differences in amount and profile of fatty acids remaining in the crude glycerin, or in our
case, the reduction in corn (and consequently corn oil) due to the addition of crude glycerin.
The relative differences in amount and profile of fatty acids in other feedstuffs included in
the experimental diets may also limit comparisons across studies.
Dietary glycerin may reduce water loss from the carcass and cooking if slaughter
follows and overnight fast (Mourot et al., 1994). In the current experiment however, pork
loin quality and sensory characteristics were not affected by diet or sex and there was no diet
sex interaction (Table 6) Furthermore, data presented here indicate that cooking loss is not
affected by crude glycerin supplementation, which is in contrast with the findings of Mourot
et al. (1994) who reported less carcass drip loss and cooking loss from muscle of pigs fed 5%
glycerin. The lack of a change in drip and cooking loss in the current study may be due to the
30-h feed withdrawal time compared with the overnight fast in the study by Mourot et al.
(1994). Other workers have demonstrated that removing feed 24 h before slaughter will
131
reduce drip loss and lessens decline in muscle pH (Jones et al., 1985; Eikenlenboom et al.,
1990). Eikenlenboom et al. (1990) also reported reduced cooking loss in pigs fasted 24 h
before slaughter. This is the first report of sensory evaluation of loin chops from pigs fed
crude glycerol. Diet did not impact pork quality traits evaluated by a trained sensory panel.
There was no diet × time interaction or diet effect on any plasma metabolite measured
(Table 7). Plasma urea nitrogen is an indicator of body protein status (Kohn et al., 2005) and
has been used to determine protein requirements and lean tissue growth rates in pigs (Chen et
al., 1995; Coma et al., 1995). Plasma urea nitrogen was not affected by time of collection or
diet, supporting the conclusion that lean tissue mobilization was not altered by feeding up to
10% crude glycerin. Glycerin is absorbed by the gastrointestinal tract of nonruminants (Tao
et al., 1983) and crude glycerin has been shown to be a source of energy in both pigs
(Lammers et al. 2008b) and chickens (Dozier et al. 2008; Lammers et al. 2008a). The
absence of a dietary treatment effect on plasma glycerol concentrations indicates metabolism
of dietary glycerin was not affected at levels less than or equal to 10% of the diet.
Concentrations of most plasma metabolites were different between pre-transport and at the
time of slaughter (P < 0.01). Transporting pigs has been shown to cause stress in pigs (Pérez
et al., 2002; Apple et al., 2005). Increases in plasma cortisol, glucose, lactate, and creatine
phosphokinase are correlated with increased stress in pigs (Brown et al., 1998; Pérez et al.,
2002; Apple et al., 2005). Our results indicate a stress response in pigs were following
transport to the abattoir and that feeding crude glycerol did not reduce this effect.
Current biodiesel processing techniques utilize methanol which is not completely
recovered, and thus, methanol is found in crude glycerol at very low concentrations (Table
1). Intermediates in the metabolism of methanol to carbon dioxide and water are
132
formaldehyde and formate. The toxic effects of methanol poisoning are actually due to the
formation, accumulation, and slow metabolism of formate in some species (Medinsky and
Dorman, 1995; Skrzydlewska, 2003). Clinical consequences of methanol poisoning are
central nervous system depression, vomiting, severe metabolic acidosis, blindness, and
Parkinsonian-like motor disease (Roe, 1982; Dorman et al., 1993; Skrzydlewska, 2003).
During the course of this study, no pig demonstrated any clinical symptoms of methanol
toxicity. The 6 animals that were removed during the trial were removed for respiratory
disease or lameness, with no attribution to a specific dietary treatment. Of the 89 pigs
harvested, no gross lesions were observed at the time of collection. In addition, the frequency
of histological lesions in kidney, liver, and eye, the pharmacological targets for methanol
toxicity, were not influenced by dietary treatment (Table 8). This agrees with an earlier study
in which no pathological changes in liver or kidney in response to consumption of crude
glycerin during finishing (Kiljora et al., 1995).
Provided diets are formulated on an equal energy basis, the results from this study
demonstrate that up to 10% crude glycerin can be fed to growing-finishing pigs with little to
no effect on pig performance, carcass composition, meat quality, or lesion scores in the eye,
liver, or kidney tissue. Although we noted only small effects on ultimate pH and fatty acid
profiles of the LM, the decline in drip and cooking losses as reported by Mourot et al. (1994)
may warrant further examination of crude glycerin supplementation on meat quality through
evaluation of the amount, method, or length of administration. Combined with our previous
work evaluating the energy value of crude glycerin in nonruminants (Lammers et al., 2007;
Dozier III et al., 2008; Lammers et al., 2008), we conclude that crude glycerin is a viable
source of dietary energy that is well utilized by pigs. Lastly, although this study was not
133
designed to specifically examine the toxicology of methanol fed to pigs, the results indicate
that the levels of methanol in these diets did not negatively affect pig performance or
frequency of histological lesions in tissues assocated with methanol metabolism.
AKNOWLEDGEMENTS
This project was supported by the Hatch Act, State of Iowa funds, USDA Special
Grants, USDA-ARS, and the Leopold Center for Sustainable Agriculture. The authors
gratefully acknowledge the assistance of the staff at the ISU Swine Nutrition Research Farm
for data collection, the ISU Agricultural Experiment Station Consulting Group for statistical
assistance, and J. Cook for laboratory assistance. Mention of trade names or commercial
products in this publication is solely for the purpose of providing specific information and do
not imply recommendations or endorsement by Iowa State University or the USDA.
REFERENCES
Airhart, J. C. , T. D. Bidner, and L. L. Southern. 2002. Effect of oral glycerol administration with and without dietary betaine on carcass composition and meat quality of late-finishing barrows. J. Anim. Sci. 80(Supple. 2):71 (Abstr.).
AOAC. 1990. Official Methods of Analysis. 15th ed. Association of Official Analysitical
Chemists, Arlington, VA. AOCS 2000. Official Methods and Recommended Practices of the AOCS. 5th ed. Am. Oil
Chem. Soc., Champagne, IL. Apple, J. K., E. B. Kegley, C. V. Maxwell Jr., L. K. Rakes, D. Galloway, and T. J. Wistuba.
2005. Effects of dietary magnesium and short-duration transportation on stress response, postmortem muscle metabolism, and meat quality of finishing swine. J. Anim. Sci. 83:1633-1645.
Brown, S. N., P. D. Warriss, G. R. Nute, J. E. Edwards, and T. G. Knowles. 1998. Meat
quality in pigs subjected to minimal preslaughter stress. Meat Sci. 49:257-265. Cerrate, S., F. Yan, Z. Wang, C. Coto, P. Sacakli, and P. W. Waldroup. 2006. Evaluation of
glycerine from biodiesel production as a feed ingredient for broilers. International Journal of Poultry Science. 5:1001-1007.
134
Chen, H. Y., P. S. Miller, A. J. Lewis, C. K. Wolverton, and W. W. Stroup. 1995. Changes in
plasma urea concentration can be used to determine protein requirements of two populations of pigs with different protein accretion rates. J. Anim. Sci. 73:2631-2639.
Cline, T. R., and B. T. Richert. 2001. Chapter 32: Feeding Growing-Finishing Pigs. In: A. J.
Lewis and L. L. Southern (eds.) Swine Nutrition 2nd Edition. Pages 717-723. CRC Press, Boca Raton, FL.
Coma, J., d. Carrion, and D. R. Zimmerman. 1995. Use of plasma urea nitrogen as a rapid
response criterion to determine the lysine requirement of pigs. J. Anim. Sci. 73:472-481.
Dorman, D. C., J. A. Dye, M. P. Nassise, J. Ekuta, B. Bolon, and M. A. Medinsky. 1993.
Acute methanol toxicity in minipigs. Fund. Appl. Toxicol. 20:341-347. Dozier III, W. A., B. J. Kerr, A. Corzo, M. T. Kidd, T. E. Weber, and K. Bregendahl. 2008.
Apparent metabolizable energy of glycerin for broiler chickens. Poult. Sci. in press. Du, M., D. U. Ahn, and J. L. Sell. 1999. Effect of dietary conjugated linoleic acid on the
composition of egg yolk lipids. Poult. Sci. 78:1639-1645. Eikelenboom, G., A. H. Bolink, and W. Sybesma. 1990. Effects of feed withdrawal before
delivery on pork quality and carcass yield. Meat Sci. 29:25-30. Folch, J., M. Lees, and G. H. Sloane Stanley. 1957. A simple method for the isolation and
purification of lipids from animal tissues. J. Biol. Chem. 226:497-509. Gardner, M. A., E. Huff-Lonergan, L. J. Rowe, C. M. Schultz-Kaster, and S. M. Lonergan.
2006. Influence of harvest process on pork loin and ham quality. J. Anim Sci. 84:178-184.
Hill, J., E. Nelson, D. Tilman, S. Polasky, and D. Tiffany. 2006. Environmental, economic,
and energetic costs and benefits of biodiesel and ethanol biofuels. Proceedings of the National Academy of Sciences. 103:11206-11210.
Jones, S. D. M., R. E. Rompala, and C. R. Haworth. 1985. Effects of fasting and water
restriction on carcass shrink an pork quality. Can. J. Anim. Sci. 65:613-618. Kerr, B. J., M. T. Kidd, J. A. Cuaron, K. L. Bryant, T. M. Parr, C. V. Maxwell, and J. M.
Campbell. 2004. Isoleucine requirements and ratios in starting (7 to 11 kg) pigs. J. Anim. Sci. 82:2333-2342.
Kijora, C., and R.-D. Kupsch. 2006. Evaluation of technical glycerols from “biodiesel”
production as a feed component in fattening pigs. Lipid-Fett. 98:240-245.
135
Kijora, C., R.-D. Kupsch, H. Bergner, C. Wenk, and A. L. Prabucki. 1997. Comparative
investigations on the utilization of glycerol, free fatty acids, free fatty acids in combination with glycerol and vegetable oil in fattening pigs. J. Anim. Physiol. Anim. Nutr. 77:127-138.
Kiljora, C., H. Bergner, R.-D. Kupsch, and L. Hageman. 1995. Glycerol as feed component
in diets of fattening pigs. Arch. Anim. Nutr. 47:345-360. Kohn, R. A., M. M. Dinneen, and E. Russek-Cohen. 2005. Using blood urea nitrogen to
predict nitrogen excretion and efficiency of nitrogen utilization in cattle, sheep, goats, horses, pigs, and rats. J. Anim. Sci. 83:879-889.
Kurki, A., A. Hill, and M. Morris. 2006. Biodiesel: The Sustainability Dimensions. National
Center for Appropriate Technology Fayetteville, AR. Lammers, P. J., B. J. Kerr, M. S. Honeyman, K. J. Stalder, W. A. Dozier III, T. E. Weber, M.
T. Kidd, and K. Bregendahl. 2008a. Nitrogen-corrected apparent metabolizable energy value of crude glycerol for laying hens. Poult. Sci. 87:104-107.
Lammers, P. J., B. J. Kerr, T. E. Weber, W. A. Dozier III, M. T. Kidd, K. Bregendahl, and
M. S. Honeyman. 2008b. Digestible and metabolizable energy of crude glycerol fed to pigs. J. Anim. Sci. 86:602–608.
Lonergan, S. M., E. Huff-Lonergan, L. J. Rowe, D. L. Kuhlers, and S. B. Jungst. 2001.
Selection for lean growth efficiency in Duroc pigs influences pork quality. J. Anim. Sci. 79:2075-2085.
Ma, F., and M. A. Hanna. 1999. Biodiesel production: a review. Bioresource Tech. 70:1-15. Maxie, M. G., ed. 2007. Jubb, Kennedy, and Palmer’s Pathology of Domestic Animals.
volume 1 to 3. 5th ed. Elsevier Health Services, Philadelphia, PA. Medinsky, M. A., and D. C. Dorman. 1995. Recent developments in methanol toxicity.
Toxicol. Letters. 82/83:707-711. Melody, J. L., S. M. Lonergan, L. J. Rowe, T. W. Huiatt, M. S. Maynes, and E. Huff-
Lonergan. 2004. Early postmortem biochemical factors influence tenderness and water-holding capacity of three porcine mucsles. J. Anim Sci. 82:1195-1205.
Mourot, J., A. Aumaitre, A. Mounier, P. Peiniau, and A. C. Fracois. 1994. Nutritional and
physiological effects of dietary glycerol in the growing pig: Consequences on fatty tissues and post mortem muscular parameters. Livest. Prod. Sci. 38:237-244.
136
National Biodiesel Board. 2007b. Official website of the national biodiesel board. Available: http://www.biodiesel.org. Accessed August 22, 2007.
NPPC. 2000. Pork Composition and Quality Assessment Procedure. National Pork Producers
Council, Des Moines, IA. NRC. 1998. Nutrient Requirements of Swine. 10th rev. edi. Natl. Acad. Press, Washington
D.C. Pérez, M. P., J. Palacio, M. P. Santolaria, M. C. Aceña, G. Chacón, M. Gascón, J. H. Calvo,
P. Zaragoza, J. A. Beltran, and S. García-Belenguer. 2002. Effect of transport time on welfare and meat quality in pigs. Meat Sci. 61:425-433.
Renaudeau, D., and J. Mourot. 2007. A comparison of carcass and meat quality characteristics of Creole and Large White pigs slaughtered at 90 kg BW. Meat Sci. 76:165-171. Roe, O. 1982. Species differences in methanol poisoning. CRC Crit. Rev. Toxicol. 10:275-
286. Simon, A., H. Bergener, and M. Schwabe. 1996. Glycerol—feed ingredient for broiler
chickens. Arch. Anim. Nutr. 49:103-112. Skrzydlewska, E. 2003. Toxicological and metabolic consequences of methanol poisoning.
Toxicol. Mech. Meth. 13:277-293. Soffritti, M., F. Belpoggi, D. Cevolani, M. Guarino, M. Padovani, and C. Maltoni. 2002.
Results of long-term experimental studies on the carcinogenicity of methyl alcohol and ethyl alcohol in rats. Ann. N.Y. Acad. Sci. 982:46–69.
Sullivan, Z. M., M. S. Honeyman, L. R. Gibson, and K. J. Prusa. 2007. Effects of triticale-
based diets on finishing pig performance and pork quality in deep-bedded hoop barns. Meat Sci. 76:428-437.
Tao, R. C., R. E. Kelley, N. N. Yoshimura, and F. Benjamin. 1983. Glycerol: its metabolism
and use as an intravenous energy source. J. of Parenter. and Enteral Nutr. 7:479-488. Thompson, J. C., and B. B. He. 2006. Characterization of crude glycerol from biodiesel
production from multiple feedstocks. Appl. Eng. Agric. 22:261-265. Weber, T. E., and M. E. Spurlock. 2004. Leptin alters antibody isotype in the pig in vivo, but
does not regulate cytokine expression or stimulate STAT3 signaling in peripheral blood monocytes in vitro. J. Anim Sci. 82:1630-1640.
137
Table 1. Characterization of crude glycerin Item Value Analytical method Total glycerin1, % 84.51 Determined by difference2 Methanol1, % 0.32 Gas chromatography (proprietary method) pH1 5.67 Orion 230A pH meter with 9107 BN probe Total fatty acid1, % 0.00 AOCS3 G 4.40 modified for glycerin Moisture,4 % 11.95 AOAC5 984.20 Crude protein, 4 % 0.82 AOAC 990.03 Crude fat, 4 % 0.23 AOAC 920.39 (A) Ash,4 %2 2.98 AOAC 942.05 Sodium,4 %2 1.20 AOAC 956.01 Chloride,4 %2 1.71 AOAC 9.15.01, 943.01 Potassium,4 %2 < 0.005 AOAC 956.01 Color4 < 1 AOCS Cc 13a-43 Metabolizable energy,6 kcal/kg 3,638 Predicted value3
1Values reported by AGP, Inc. Sergeant Bluff, IA, Lot # GB608-25. 2Determined within the AGP Inc. laboratory as: 100 - % methanol - % total fatty acid - %
moisture - % NaCl. 3AOCS (2000). 4Analysis by University of Missouri-Columbia Experiment Station Chemical Laboratories,
Columbia, MO. 5AOAC (1995). 6ME of crude glycerin = GE of pure glycerin × purity of crude glycerin = 4,305 kcal/kg ×
1Dietary treatments 5 and 10 consisted of the above diets formulated to include 5 or 10% crude glycerin respectively while remaining constant in terms of calculated ME, listed amino acid content, available phosphorus, sodium, and chlorine. Crude glycerin replaced 7 to 10% corn and 40 to 60% sodium chloride at 5% level and 15 to 17% corn and 80 to 100% sodium chloride at 10% level.
2Provided the following per kilogram in phase I and II diets: vitamin A, 7,718 IU; vitamin E, 40 IU; niacin, 57 mg; D-panothenic acid, 31 mg; riboflavin, 12 mg.
3Provided the following per kilogram in phase III through V diets: vitamin A, 5,513 IU; vitamin E, 29 IU; niacin, 42 mg; D-panothenic acid, 22 mg; riboflavin, 8 mg.
4Provided the following per kilogram in phase I diet: Zn, 156 mg as ZnO; Fe, 280 mg as Fe2SO4; Cu, 1.4 mg as CuO; Mn, 73 mg as MnO2; I, 3.2 mg as CaI.
5Provided the following per kilogram of phase II through V diets: Zn, 146 mg as ZnO; Fe, 263 mg as Fe2SO4; Cu, 1.3 mg as CuO; Mn, 68 mg as MnO2; I, 3.0 mg as CaI.
139
Table 3. Growth and performance of growing pigs fed crude glycerin1 Diet2 0 5 10 SEM P-value Replicates, pen3 8 8 8 Start weight, kg 7.9 8.0 7.8 0.2 0.60 End weight, kg 132.9 134.0 132.8 2.3 0.92 ADG, g/d 905 913 906 16 0.93 ADFI, g/d 2,333 2,385 2,400 52 0.66 G:F 0.39 0.38 0.38 0.01 0.12
1138-d feeding trial. 2Dietary treatments were 0, 5, or 10% crude glycerol inclusion in corn-
soybean meal diets fed in 5 phases. 34 pigs were initially assigned to each pen, over the course of the experiment
6 pigs were removed with no pen having more than 1 pig removed.
Table 4. Effect of crude glycerin on estimated carcass characteristics1 140
Diet2 Gender P-value
0 5 10 SEM Barrow Gilt SEM Diet Gender D × G Pigs, number 30 29 31 44 46 Initial BW, kg 8.0 8.0 7.9 0.2 7.9 8.0 0.2 0.80 0.78 0.69 Final BW, kg 133 134 133 2.0 137 129 2.0 0.93 0.01 0.92 10th rib backfat, mm 18.8 21.0 20.7 0.8 22.0 18.3 0.7 0.14 0.01 0.13 LM area, cm2 48.6 49.0 46.6 0.9 48.0 48.1 0.7 0.12 0.92 0.33 Fat free lean, % 52.0 51.8 50.6 0.8 51.9 51.1 0.6 0.37 0.34 0.78 Lean gain, g/d 365 363 355 5.0 364 358 4.0 0.37 0.30 0.70
1From ultrasound scan data. 2Dietary treatments were 0, 5, or 10% crude glycerin inclusion in corn-soybean meal diets fed in 5
phases over a 138-d feeding trial.
Table 5. Carcass characteristics and fatty acid profile of loin chops from pigs fed crude glycerin
1Dietary treatments were 0, 5, or 10% crude glycerin inclusion in corn-soybean meal diets fed in 5 phases over a 138-d feeding trial.
2Evaluated 12 d postmortem according to National Pork Board Standards (NPPC, 2000). The marbling standards correspond to % intramuscular lipid.
3Japanese color bar 1 – 6 scale, 1 = extremely light, 6 = extremely dark (Sullivan et al. 2007). 4Higher L* values indicate a lighter color, higher a* values indicate a redder color, and higher b* values
indicate a more yellow color (Sullivan et al. 2007). 5Average of 3 maximum force peaks. 6Scores on a 1 – 10 scale. Lower scores represent low degrees of characteristics, high scores represent high
degrees of characteristics (Sullivan et al. 2007).
Table 7. Effect of crude glycerin on plasma metabolites pre-transport and at the time of harvest
1 Blood samples for plasma analysis were collected prior to transport to the abattoir and at the time of harvest immediately after electrical stunning.
2Dietary treatments were 0, 5, or 10% crude glycerin inclusion in corn-soybean meal diets fed in 5 phases over the 138-d feeding trial.
3 D T = interaction between diet and time 4 BUN = blood urea nitrogen 5 CPK = creatine phosphokinase
1 No gross lesions were observed in tissues harvested. One eye, liver, and kidney were collected from 29, 29, and 31 pigs for Diet 0, 5, and 10, respectively.
2 Dietary treatments were 0, 5, or 10% crude glycerin inclusion in corn-soybean meal diets fed in 5 phases over a 138-d feeding trial.
145
CHAPTER 7. NON-SOLAR ENERGY USE AND 100-YEAR GLOBAL WARMING POTENTIAL OF IOWA SWINE FEEDSTUFFS AND
FEEDING STRATEGIES
A paper to be submitted to the Journal of Animal Science
P. J. Lammers*, M. D. Kenealy*, J. B. Kliebenstein†, J. D. Harmon‡, M. J. Helmers‡, and M. S. Honeyman*6,
* Department of Animal Science, † Department of Economics,‡ Department of Agricultural
and Biosystems Engineering, Iowa State University, Ames IA 50011-1050 ABSTRACT: Demand for non-solar energy and concern about the implications of fossil fuel
combustion have encouraged examination of energy use associated with agriculture. The
United States is a global leader in pig production and the U. S. swine industry is centered in
Iowa. Feed is the largest individual input in pig production, but the energy consumption of
the Iowa swine feed production chain has yet to be critically examined. This anlysis
examines non-solar energy use and resulting 100-yr global warming potential (GWP)
associated with the entire swine feed production chain, beginning with cultivation of crops
and concluding with diet formulation. Five cropping sequences are considered and the non-
solar energy use and accompanying 100-yr GWP associated with production of 13 common
swine feed ingredients is estimated. A cropping sequence of corn-soybean-corn-oats under
seeded with alfalfa delivers more NE and starch/MJ non-solar energy input than a corn-
soybean or corn-corn-soybean sequence despite producing less total NE and starch/m2. Two
diet formulation strategies are considered for four crop sequence diet type scenarios. The
first formulation strategy (SIMPLE) does not include synthetic amino acids or phytase. The
second (COMPLEX) reduces crude protein content of the diet by using L-lysine to meet SID
lysine requirements of pigs and includes the exogenous enzyme phytase. Regardless of crop 6 Corresponding author: [email protected]
146
sequence diet type scenario including the enzyme phytase is energetically favorable and
reduces the potential excretion of phosphorus by reducing or removing inorganic phosphors
from the complete diet. Including L-lysine reduces the crude protein content of the diet but
requires more non-solar energy to deliver adequate SID lysine than simply feeding soybean
meal. Replacing soybean meal with full-fat soybeans is not energetically beneficial under
Iowa conditions. Swine diets including DDGS and crude glycerol require approximately 50%
more non-solar energy inputs than corn-soybean meal diets or corn-soybean meal diets
including oats. This study is not a complete life cycle assessment of pig production in Iowa
but provides essential information on cultivation, processing, and manufacture of swine feed
ingredients in Iowa that can be coupled with other models to estimate the non-solar energy
use and 100-yr global warming potential of pig production in Iowa.
presenting the NE and SID amino acid content of feed ingredients are available (Whittemore
et al., 2003; Sauvant et al., 2004).
148
With increasing attention being paid to energy in all aspects of agriculture, it is
appropriate to re-examine the production of different swine feed ingredients and the potential
impacts of different diet formulation strategies. This analysis examines the non-solar energy
use and greenhouse gas emissions associated with the entire pig feed production chain. This
begins with cultivation of crops and includes ingredient processing and manufacture, diet
formulation, and diet metabolism within the pig. The crop–pig diet cycle is completed with
return of nutrients in pig manure back to cropland. This analysis examines different crop
production scenarios, processes for preparing diet ingredients, and efficacy of various
formulation strategies to minimize non-solar energy use, optimize nutrient cycling, and
minimize 100-year global warming potential from emissions associated with pig feed
production.
MATERIALS AND METHODS
Crop production. A crop production model representative of conditions seen in Iowa
was developed and used to evaluate different crop rotation scenarios (Lammers, 2009a).
Models are simplifications of reality and thus are inherently imprecise. Models can be useful
for predicting trends and relative differences between several systems. The purpose is not to
detail every input and variable that may affect crop production and resulting environmental
impact. Rather simplifying assumptions are made with the goal of developing a functional
representation of crop production and resulting environmental impacts under the context of
pig production in Iowa. The crop production model is not designed to accurately predict
absolute impacts. Rather the model is intended to predict the relative magnitude and direction
of outcomes resulting from different actions and choices.
149
Five crop sequences were selected for examination. They are: continuous corn (C-C),
corn-soybean (C-S), corn-corn-soybean (C-C-S), corn-soybean-corn-oat under seeded with
alfalfa (C-S-C-O), and corn-soybean-corn-oat under seeded with alfalfa-alfalfa (C-S-C-O-A).
The first 3 sequences are currently typical in Iowa and across the Midwest United States. The
last 2 rotations are proven alternatives that may reduce total non-solar energy use and better
facilitate nutrient cycling within crop production. Initial conditions and model assumptions
for cultivation of the different crop rotations were developed in consultation with Iowa
farmers, Iowa State University researchers, extension publications, and peer-reviewed
research articles. In practice alfalfa may be planted once and harvested for a period of 3–5
years. However alfalfa hay is not a common diet component in pig diets, nor is it well
utilized by swine. The purpose of this model is to examine crop production in the context of
pig production and as such it was assumed that only 1 year of alfalfa hay would be produced
on a given area before it returns to production of grain or oilseeds more commonly fed to
pigs. Both the C-C and C-S-C-O-A sequences may not be practical for total and complete
swine feed production, however we included these two sequences in our anlayis in order to
more fully examine and compare the C-S, C-C-S, and C-S-C-O sequences.
Three main types of non-solar energy inputs were considered: diesel fuel, liquefied
petroleum gas, and electricity. Emission of 3 greenhouse gases— CO2, CH4, and N2O—were
estimated based on fuel type (IPCC, 2006; EPA, 2008). Standardized 100-yr GWP for the
three gases were used to calculate 100-year global warming potential by energy type
expressed in terms of CO2 equivalents (IPCC, 2007). Diesel fuel is the most commonly used
energy source for operating crop production equipment and transporting grain. Diesel fuel
use is often reported in terms of volume per time, volume per area, or volume per distance.
150
To calculate the energy consumed as diesel fuel, an energy density of 38.46 MJ/L was
assumed for diesel fuel (Downs and Hansen, 1998). For every GJ of diesel fuel combusted by
agricultural equipment, an estimated emission of 82.73 kg CO2 equivalents occurs (IPCC,
2006, 2007). Liquefied petroleum gas is used as a major feedstock and source of energy in
the manufacture of synthetic fertilizers and pesticides (Bhat et al., 1994). It is also commonly
used to dry grain on-farm (Bern, 1998; Wilcke, 2004). It is estimated that 63.15 kg CO2
equivalents are released for every GJ of energy originating as liquefied petroleum gas (IPCC,
2006, 2007). Domestic electricity generation emission factors for Iowa (EPA, 2008) were
used to estimate the 100-yr global warming potential resulting from use of electricity. It is
estimated that 229.32 kg CO2 equivalents are released for every GJ of electrical energy used
(IPCC, 2007; EPA, 2008).
Gross energy (GE) of all production represents the energy that could be gained by
simply combusting all grain, oilseed, and biomass produced by a given crop sequence. Net
energy (NE) represents the portion of gross energy that is available for a pig to use for
growth and maintenance from a particular feedstuff (Ewan, 2001; Whittemore, 2006). Net
energy most closely represents the true energy value of a feedstuff relative to pig production
and is the energy value of most interest to swine nutritionists (Ewan, 2001; Whittemore et al.,
2003; Whittemore, 2006). Starch concentration is another important measure of a product’s
suitability for human food (Quezada-Cavillo et al., 2006) or pig feed (Sauber and Owens,
2001; Whittemore, 2006). Sauvant et al. (2004) presents the GE, NE available to pigs, and
the starch content of many feed ingredients. The GE of wheat straw is 16.9 MJ/kg, (91.4%
dry matter) (Sauvant et al., 2004) and our analysis assumes oat straw is equivalent to wheat
straw. Corn stover was assumed to have a GE value of 14.2 MJ/kg at 15% moisture
151
(Pordesimo et al., 2005). It was assumed that oat straw and corn stover are of very limited
value as food or feedstuffs and that NE and starch content is effectively zero. Crop
production model results and literature values were used to calculate GE, NE available to
growing pigs, and total starch production for each crop production sequence.
Feed ingredient processing and manufacture. Feed ingredients such as corn require
little manipulation beyond grinding. Alternatively, converting raw soybeans into soybean
meal and soy oil requires multi-step processes. An inventory of raw material inputs,
processing activities, estimated transportation distances of material inputs and finished
ingredients, and non-solar energy use for 13 feed ingredients was prepared and has been
detailed elsewhere (Lammers, 2009b). This inventory is summarized in table 1 and was used
in combination with diet formulations to calculate non-solar energy use and 100-yr GWP
associated with manufacturing swine feed adequate to produce one, 136.0 kg market pig.
Primary feed ingredients—grains, soybean meal, biofuel co-products—typically account for
95% of the mass of pig diets. The remaining mass of the diet includes minerals, vitamins,
synthetic amino acids, and enzymes. Our examination of the micro-feed ingredients focuses
on ground limestone, salt, and monocalcium phosphate (MCP) because these three
ingredients account for most of the mass among micro-ingredients. The enzyme phytase and
synthetic amino acids L-lysine and DL-methionine are also included because they have an
impact on phosphorus and nitrogen utilization and cycling within pig production systems that
is disproportionate to their relative mass.
Diet formulation and metabolism. Diet formulations that have been demonstrated to
be nutritionally adequate according to NRC recommendations (Holden et al., 1996; NRC,
1998; Lammers et al., 2008) were entered into a spreadsheet that recalculated nutritional
152
content based on feed ingredient tables presented by Sauvant et al. (2004). Two reference
diets were for adult animals—one for gestating sows and one for lactating sows (Holden et
al., 1996). Five reference diets were for growing pigs and matched the corn-soybean meal
control diets fed in a previous study (Lammers et al., 2008). Reference diets and estimated
nutrient intake associated with production of one 136.0 kg market pig is presented as table 2.
The ratio of SID lysine to NE as well as the ratio of available phosphorus to NE were
calculated from the reference diets and used to formulate a set of baseline diets (SIMPLE) for
this analysis. This set of diets does not include synthetic amino acids or exogenous enzymes.
Including synthetic amino acids and the enzyme phytase affects nitrogen and
phosphorus utilization by the pig and impacts the overall nutrient cycling of pig feed
production. A second set of diets (COMPLEX) were formulated to include phytase and
synthetic amino acids. The desired ratio of threonine to NE and tryptophan to NE for a given
diet were calculated based on the ideal amino acid ratio concept (NRC, 1998; Lewis, 2001;
Whittemore et al., 2003). COMPLEX Diets were first formulated to provide adequate
threonine and tryptophan. The synthetic amino acids DL-methionine and L-lysine were then
added as needed to provide adequate methionine and lysine. Feeding the enzyme phytase
enables utilization of plant source phosphorus by pigs and allows diets containing reduced
amounts of inorganic phosphorus to be nutritionally adequate. Based on previous reports
(Veum et al., 2006; Veum and Ellersieck, 2008; Emiola et al., 2009), MCP was excluded
from diets containing phytase unless the total phosphorus provided by the final diet (g total
phosphorus : kJ NE) was not 100% of the available phosphorus presented by the reference
diets.
153
Within each general formulation scheme (SIMPLE and COMPLEX) four different
strategies were considered. The first (Corn-SBM) represents what is typical practice in Iowa
and consists primarily of corn and soybean meal. The second (Oat-SBM) is a corn-soybean
meal diet that includes oats. Diets for growing pigs were formulated to include 4% oats and
sow diets included up to 80% oats by mass for the Oat-SBM strategy. The third diet strategy
(Oat-FFSB) is a corn-based diet that includes oats and replaces soybean meal with full-fat
soybeans. An earlier study in Denmark reported replacing soybean meal with peas and
rapeseed cake reduced non-solar energy inputs for swine diet manufacture by 22%
(Ericksson et al., 2005). The Oat-FFSB diet strategy was designed to examine the efficacy of
alternative sources of protein-feed ingredients in Iowa. Full-fat soybeans were used as the
primary source of amino acids and soybean meal was removed from all diets. Diets for
growing pigs and sows were allowed to include up to 10 and 80% oats respectively. The final
diet strategy (Co-products) is a corn-soybean meal diet that includes maximal amounts of
DDGS and crude glycerol. Diets for growing pigs were allowed to include up to 25% DDGS
and diets for sows included 35–40% DDGS. All diets under the Co-products formulation
strategy included 10% crude glycerol.
Diet formulation strategies were then considered under the context of selected crop
sequences. Ingredient lists from each formulation strategy were combined with non-solar
energy and 100-yr GWP values associated with processing feed ingredients and non-solar
energy and 100-yr GWP associated with cultivation of different crops in selected sequences.
For each cropping sequence diet formulation scenario, the non-solar energy and 100-yr
GWP required to grow, manufacture, and deliver adequate feed (approximately 4,300 MJ
154
NE, 2.8 kg SID lysine, and 1.2 kg available phosphorus) to produce one 136.0 kg market pig
was determined.
RESULTS AND DISCUSSION
Table 1 reports the non-solar energy use and resulting 100-yr GWP associated with
producing and delivering 13 swine feed ingredients in Iowa. This inventory is not a complete
life cycle assessment of swine feed but can be linked with crop and pig production models to
estimate the ecological impacts of raising pigs. The last compilation of multiple swine feed
ingredients was published in 1978 and was specific to Australia (LaHore and Croke, 1978).
More recent examinations have considered 1 or 2 individual ingredients under European
conditions (Binder, 2003; Nielsen et al., 2006; Nielsen and Wenzel, 2006; Dalgaard et al.,
2008). The feed table included in this report is not a complete listing of all ingredients
commonly fed in Iowa, however it is starting point for future examinations of non-solar
energy use associated with other swine feed ingredient production in Iowa and the United
States and can be used for life cycle analysis of pig production in the Midwest United States.
Tables 3 and 4 summarize the non-solar energy and 100-yr GWP of individual crops
within different cropping sequences in Iowa. Production of corn grain requires the most
energy per unit of land area but also produces the largest quantity of grain of any crop
examined (Lammers, 2009a). This results in corn requiring less non-solar energy per kg grain
than soybeans and oats in most cropping sequences. Increasing the complexity of cropping
sequences allows reduction in synthetic fertilizers applied to corn while maintaining or
enhancing productivity. This results in corn grain grown in the C-S-C-O-A sequence
requiring 29% less non-solar energy compared to corn grain grown in the C-C sequence. A
155
similar but less pronounced trend is seen in soybeans. As expected, the 100-yr GWP of
individual crops within different crop sequences closely follows non-solar energy use.
Increasing crop sequence complexity reduces non-solar energy use and 100-yr GWP
for individual crops within a sequence while maintaining or increasing crop output/m2
(Lammers, 2009a). This advantage requires foregoing the opportunity to maximizing
production of a single crop per total land area. For example, the crop production model
assumes that corn raised in C-C produces 1.13 kg/m2 while corn raised in C-S produces 1.26
kg/m2 (Lammers, 2009a). If 100 m2 is managed as C-C, 113 kg corn grain will be produced,
alternatively if the same 100 m2 is managed as C-S only 63 kg corn grain will be produced.
This illustrates the importance of not only considering individual crops within a sequence,
but the sum productivity of entire crop sequences.
The total non-solar energy inputs, 100-yr GWP, and productivity of 5 complete crop
sequences in Iowa are summarized as table 5. Continuous corn delivers the most GE, NE and
starch/m2, but also requires the most non-solar energy input of any sequence examined. The
most complex sequence—C-S-C-O-A—requires the least non-solar energy input/m2 but also
delivers the least total GE, NE, and starch. The C-S sequence results in the most NE/ MJ
non-solar energy input. Our analysis assumes no NE is gained from alfalfa by pigs. Despite
this assumption, the complex C-S-C-O-A sequence produces more MJ NE/ MJ non-solar
energy input than continuous corn. Alfalfa hay certainly has value, particularly as feed for
horses or ruminants, however expanding our analysis to include other species of livestock is
beyond the scope of this report. The C-C-S sequence produces the second most Starch/MJ
non-solar energy. The C-C-S and C-S-C-O-A sequences produce similar amounts of NE/MJ
156
non-solar energy. The C-S-C-O sequence produces more starch/MJ non-solar energy but less
NE/MJ non-solar energy than the C-S sequence.
The calculated analysis of four formulation strategies without the use of synthetic
amino acids and phytase (SIMPLE) is summarized in table 6. The diet analysis presented is a
weighted average of all feed associated with production of one 136.0 kg market pig. This
includes 5 diets fed to growing pigs as well as the lactation and gestation feed required to
produce 1 pig. Table 7 details the same formulation strategies but allows use of synthetic
amino acids and the exogenous enzyme phytase (COMPLEX). As expected the inclusion of
L-lysine reduces g crude protein intake/ MJ NE. Intake of crude protein content from diets
containing L-lyisne is 83–91% of the crude protein intake from the SIMPLE diet
formulations. Including the exogenous enzyme phytase consistently enables reduction of
total phosphorus in diet formulations. The benefits of phytase are less pronounced when
formulating diets with 25% DDGS. This is because DDGS has sufficient available
phosphorus to exclude most MCP from the SIMPLE diet formulation. The advantage of
including phytase is the ability to reduce the amount of MCP and other inorganic sources of
phosphorus in the diet. Because the SIMPLE, Co-products diet formulation already has < 1%
MCP, adding phytase does not reduce MCP inclusion as much as in other diet formulation.
Eight crop sequence diet formulation scenarios are presented in table 8. Our
analysis did not compare every possible crop sequence diet formulation combination.
Rather we focused our analysis on combinations of most interest. The baseline scenario is a
corn-soybean meal diet and a C-S cropping sequence. This combination is representative of
current Iowa practice. A slight modification of current practice would be adoption of the C-
S-C-O sequence with an accompanying inclusion of oats in the diets fed to pigs. A third
157
alternative considers the potential of feeding full-fat soybeans to pigs. Full-fat soybeans are
not typically fed to pigs. However there is interest in increasing on-farm processing of
feedstuffs and roasting soybeans is a method of processing soybeans that can easily be done
on-farm in Iowa. The diet that includes full-fat soybeans is nested within the C-S-C-O
sequence rather than the C-S sequence because producers most interested in on-farm roasting
of soybeans are assumed to also be more interested in diversifying cropping sequences than
others. The final crop sequence diet formulation combination is a C-C-S sequence that
includes production of the biofuels and feeding of biofuel co-products.
Inclusion of L-lysine and exogenous phytase is typical of conventional pig production
in the United States. The COMPLEX formulation strategy incorporates this practice. The
COMPLEX formulation strategy requires less non-solar energy input/ MJ NE delivered to
pigs for most crop sequence diet scenarios. The COMPLEX formulation strategy reduces
non-solar energy input/ MJ NE by 3–7% for each diet type. The exception is the Co-product
diet type. The COMPLEX formulation of the Co-product diet requires 1.8% more non-solar
energy input than the SIMPLE formulation of the Co-product diet. As expected 100-yr GWP
follows input energy. Including phytase and L-lysine reduces 100-yr GWP associated with
pig diet production by 40–90% depending on the diet type.
The COMPLEX corn-soybean meal diet requires less non-solar energy input/ MJ NE
delivered to pigs than the SIMPLE formulation. Adding L-lysine to a corn-soybean meal diet
allows removal of approximately 25% of the soybean meal in the diet. This results in a
reduction of energy needed to produce soybeans, but an increase in energy to produce L-
lysine. For the corn-sbm baseline, removing some soybeans and adding L-lysine was not
energetically favorable. The SIMPLE diet requires expenditure of 30.5 kJ of non-solar
158
energy to provide adequate SID lysine as soybean meal. The COMPLEX diet requires
expenditure of 30.7 kJ of non-solar energy to provide adequate SID lysine as soybean meal
and L-lysine. Although not energetically advantageous, adding L-lysine to the diet allows
dramatic reduction in the total crude protein delivered to the animal. This in turn reduces the
potential for nitrogen excretion by pigs into the environment. Increasing pork production per
unit of feed nitrogen delivered to pigs has been a goal of United States pork producers and
the inclusion of L-lysine supports that. However inclusion of L-lysine comes at an energetic
cost that is not offset by equal or more reductions in energy expended to provide soybean
meal or other protein sources. This may ultimately limit the utility of diets formulated to
include synthetic amino acids when considered from a crop livestock systems perspective.
Feeding phytase allows nearly complete removal of MCP from pig diets. Because
MCP requires a large amount of non-solar energy to produce, its near elimination from diet
formulations greatly reduces non-solar energy inputs for complete diet production. Phytase
also requires a large amount of non-solar energy to produce, but the benefits of phytase can
be achieved by including very small amounts of the exogenous enzyme in the diet. For
example, the SIMPLE Oat-SBM diet contains 0.92% MCP by mass at an energetic cost of
13.0 kJ non-solar energy input/MJ NE. Adding 0.01% phytase to the diet allows removal of
all MCP and only requires 0.4 kJ non-solar energy input/MJ NE. This translates into a
savings of 12.6 kJ non-solar energy/ MJ NE pig diet for the Oat-SBM diet type. Inclusion of
phytase in pig diets enables diets lower in total phosphorus to be nutritionally adequate and
may lower phosphorus excretion by pigs (Veum et al., 2006; Veum and Ellersieck, 2008;
Emiola et al., 2009). The additional energetic cost of including phytase is more than off-set
159
by reductions in the non-solar energy input required if providing adequate available
phosphorus as MCP.
The Oat-SB diet type required 8% more non-solar energy input/MJ NE than the Corn-
SBM diet type for both formulation strategies. As in the Corn-SBM diet type, the main
energetic advantage of the COMPLEX formulation strategy was removal of MCP from the
diet. Adding L-lysine reduced the crude protein content of the diet, but also increased the
energy cost of supplying SID lysine as compared to the SIMPLE formulation strategy.
The Oat-FFSB diet type is not energetically favorable compared to the Corn-SBM
and Oat-SBM approaches. Roasting of soybeans requires large inputs of non-solar energy
and does not deliver proportional benefits in terms of total non-solar energy input/MJ NE
delivered to pigs. Previous European examinations of pig production have suggested that
avoidance of soybean meal in pig diets is energetically and environmentally beneficial
(Ericksson et al., 2005). Our results disagree with those conclusions. Soybean meal used in
the Danish study was imported from South America (Ericksson et al., 2005) but our study
assumed soybean processing occurs within the state of Iowa (Lammers, 2009b). Imported
soybean meal is a major source of amino acids for European swine diets (Ericksson et al.,
2005; Dalgaard et al., 2008). Given Iowa’s leadership in U. S. soybean production (USDA,
2009) and processing (Hardy, 2009) some of the previously reported advantages of
displacing soybean meal with alternative protein sources (Ericksson et al., 2005) may not
apply to Iowa. Including L-lysine in the Oat-FFSB diet was energetically favorable due to
reduced inputs of full-fat soybeans. The SIMPLE diet formulation required 73.1 MJ non-
solar energy input to provide adequate SID lysine in the form of full-fat soybeans. The
160
COMPLEX diet formulation required 64.6 MJ non-solar energy input to provide adequate
SID lysine as full-fat soybeans and L-lysine.
Diets containing 25% DDGS and 10% crude glycerol required more non-solar
energy input/MJ NE than any other diet scenario. The production energy of co-product feeds
is larger then the non-solar energy needed to grow and process other major feed ingredients.
For example if we assume a C-S sequence, 1.0 kg of ground corn requires 1,894 kJ and 1.0
kg of soybean meal require 2,394.4 kJ non-solar energy input. Alternatively DDGS requires
4,700 kJ/kg and crude glycerol requires 2,200 kJ/kg. The NE of the four ingredients is also
different—11.1, 8.4, 7.0, and 9.9 MJ/kg— for corn grain, soybean meal, DDGS, and crude
glycerol respectively. Thus each MJ of NE from corn grain and soybean meal requires 171
and 285 kJ non-solar energy respectively while each MJ of NE from DDGS and crude
glycerol require 671 and 224 kJ non-solar energy respectively. If return of NE for pigs/kJ
non-solar energy input is the only concern, feeding biofuel co-products is not favorable.
However if biofuels are produced, including co-products in swine diets might be economical
for individual producers.
Unlike the other diet types, the COMPLEX formulation strategy required 1.8% more
non-solar energy/MJ NE than the SIMPLE formulation. This is a result of 2 factors. The first
is the COMPLEX diet includes L-lysine. L-lysine reduces the crude protein content of the
diet but increases the non-solar energy needed to provide adequate SID lysine compared to
soybean meal. The second factor has to do with the nature of DDGS. Fermentation of corn
grain results in the phosphorus present in DDGS being more available to pigs than
phosphorus in corn. Increasing the availability of plant-source phosphorus means little MCP
is needed in the SIMPLE diet formulation of the Co-product diet type. The main energetic
161
advantage of the COMPLEX diet formulation for the other diet types was removal of
approximate 13.0 kJ non-solar energy input associated with providing available phosphorus
as MCP. With less MCP in the SIMPLE Co-product diet to remove the energetic benefits
achieved by adding phytase and removing MCP are overcome by the increase in non-solar
energy used to deliver SID lysine.
Including DDGS and crude glycerol may require more non-solar energy than simply
feeding corn grain and soybean meal, but for individual operations adding biofuel co-
products may be economical. Adding phytase to diets and reducing or removing MCP
reduces the non-solar energy cost of swine feed and may reduce phosphorus excretion from
the pig. This is clearly a double benefit of phytase. The net effect of feeding L-lysine is less
clear cut. Adding L-lysine reduces the crude protein content of diets while providing
adequate SID lysine to pigs and might reduce excretion of nitrogen by pigs. However this
environmental benefit is achieved at a cost of increased non-solar energy inputs—first to
provide SID lysine in as L-lysine to pigs and secondly by increasing the need for synthetic
nitrogen for crop production. Further examination of the interactions among non-solar energy
use for synthetic fertilizers and different strategies to deliver adequate SID lysine to pigs is
warranted and should be a high priority for individuals considering the non-solar energy use
and environmental impacts of pig production systems.
The current study is not a complete life cycle assessment of pig production in Iowa.
However the presented inventory of non-solar energy and 100-yr GWP associated with
growing and processing swine feed ingredients provides essential information for life cycle
assessment of pig production. Results from this project can be combined with other studies to
more fully understand the non-solar energy use and 100-yr GWP of Iowa swine production.
162
ACKNOWLEDGEMENTS
This project was supported by the Hatch Act, State of Iowa Funds, USDA Special
Grants, USDA SARE program, and the Leopold Center for Sustainable Agriculture.
REFERENCES
Bern, C. J. 1998. Preserving the Iowa corn crop: Energy use and CO2 release. Applied Engineering in Agriculture 14: 293-299.
Bhat, M. G., B. C. English, A. F. Turhollow, and H. O. Nyangito. 1994. Energy in synthetic fertilizers and pesticides: Revisited. ORN/Sub/90-99732/2. Oak Ridge National Laboratory, Oak Ridge, TN. U. S. Department of Energy, Washington D. C.
Binder. 2003. Life cycle analysis of DL-Methionine in broiler meat production. Amino News. Evonik Degussa GmbH, Available online: http://www.aminoacidsandmore.com. Accessed: March 7, 2009.
Dalgaard, R., J. Schmidt, N. Halsberg, P. Christensen, M. Thrane, and W. A. Pengue. 2008. LCA of soybean meal. International Journal of Life Cycle Assessment 13: 240–254.
Downs, H. W., and R. W. Hansen. 1998. Estimating farm fuel requirements. No. 5.006. Colorado State University Extension, Fort Collins, CO. Available online: http://www.cde.state.co.us/artemis/ucsu20/ucsu2062250061998internet.pdf. Accessed: February 2, 2009.
Emiola, A., O. Akinremi, B. Slominski, and C. M. Nyachoti. 2009. Nutrient utilization and manure P excretion in growing pigs fed corn-barley-soybean based diets supplemented with microbial phytase. Animal Science Journal 80: 19–26.
EPA. 2008. eGRID subregion GHG output emission rates for year 2005. Washington, D. C. Available online: http://www.epa.gov/cleanenergy/energy-resources/egrid/index.html. Accessed: January 23, 2009.
Ericksson, I. S., H. Elmquist, S. Stern, and T. Nybrant. 2005. Environmental systems analysis of pig production: The impact of feed choice. International Journal of Life Cycle Assessment 10: 143-154.
Ewan, R. 2001. Chapter 5: Energy utilization in swine nutrition. In: A. J. Lewis and L. L. Southern (eds.) Swine nutrition. p 85-94. CRC Press, Boca Raton, FL.
Gabert, V. M., H. Jorgense, and C. M. Nyachoti. 2001. Chapter 9: Bioavailability of amino acids in feedstuffs for swine. In: A. J. Lewis and L. L. Southern (eds.) Swine nutrition. p 151–186. CRC Press, Boca Raton, FL.
163
Hardy, C. 2009. Update on ethanol and soy processing in Iowa. Iowa State University Extension, Ames, IA. Available online: http://www.extension.iastate.edu/ag/success/07-11 POWs/POW 180/2009/Hardy2.html. Accessed: March 24, 2009.
Holden, P., R. Ewan, M. Jurgens, T. Stahly, and D. Zimmerman. 1996. Life cycle swine nutrition. PM-489. Iowa State University Extension, Ames, IA.
IPCC. 2006. 2006 IPCC guidelines for national greenhouse gas inventories. Kamiyamaguchi, Japan. Available online: http://www.ipcc-nggip.iges.or.jp/public/2006gl/index.html. Accessed: January 14, 2009.
IPCC. 2007. Climate change 2007: The physical science basis. Intergovernmental Panel on Climate Change, Geneva, Switzerland.
LaHore, R., and B. Croke. 1978. Energetics of stockfeed production. Animal Feed Science and Technology 3: 1–14.
Lammers, P. J. 2009a. Energy and nutrient cycling in swine production systems. Appendix 2: Crop production model, Iowa State University, Ames, IA.
Lammers, P. J. 2009b. Energy and nutrient cycling in swine production systems. Appendix 3: Pig feed ingredient manufacturing and delivery: Process inventory and assumptions, Iowa State University, Ames, IA.
Lammers, P. J., M. S. Honeyman, J. D. Harmon, J. B. Kliebenstein, and M. J. Helmers. 2009. Construction resource use of two different types and scales of Iowa swine production facilities. Applied Engineering in Agriculture submitted.
Lammers, P. J., B. J. Kerr, T. E. Weber, K. Bregendahl, S. M. Lonergan, K. J. Prusa, D. U. Ahn, W. C. Stoffregen, W. A. Dozier III, and M. S. Honeyman. 2008. Growth performance, carcass characteristics, meat quality, and tissue histology of growing pigs fed crude glycerol-supplemented diets. Journal of Animal Science 82: 2962–2970.
Lewis, A. J. 2001. Chapter 8: Amino acids in swine nutrition. In: A. J. Lewis and L. L. Southern (eds.) Swine nutrition. p 131–150. CRC Press, Boca Raton, FL.
Moehn, S., J. Atakora, and R. O. Ball. 2005. Using net energy for diet formulation: Potential for the Canadian pig industry. Advances in Pork Production 16: 119-129.
NBB. 2008. Commercial biodiesel production plants. National Biodiesel Board, Washington D. C. Available online: http://www.biodiesel.org/buyingbiodiesel/producers_marketers/Producers%20Map-Existing.pdf. Accessed: March 11, 2009.
164
Nielsen, P. H., K. M. Oxenbøll, and H. Wenzel. 2006. Cradle-to-gate environmental assessment of enzyme products produced industrially in Denmark by Novozymes A/S. International Journal of Life Cycle Assessment OnlineFirst (DOI:http//dx.doi.org/10.1065/lca2006.265.2).
Nielsen, P. H., and H. Wenzel. 2006. Environmental assessment of Ronozyme® P5000 CT Phytase as an alternative to inorganic phosphate supplementation to pig feed used in intensive pig production. International Journal of Life Cycle Assessment OnlineFirst (DOI:http//dx.doi.org/10.1065/lca2006.08.265.1).
Noblet, J. 2007. Recent developments in net energy research for swine. Advances in Pork Production 18: 149–156.
NRC. 1998. Nutrient requirements of swine. 10th rev. Ed. National Academy Press, Washington D. C.
Payne, R. L., and R. T. Zijlstra. 2007. A guide to application of net energy in swine feed formulation. Advances in Pork Production 18: 159–165.
Pordesimo, L. O., B. R. Hames, S. Sokhansanj, and W. C. Edens. 2005. Variation in corn stover composition and energy content with crop maturity. Biomass and Bioenergy 28: 366-374.
Quezada-Cavillo, R., C. C. Robayo, and B. L. Nichols. 2006. Chapter 8: Carbohydrate digestion and absorption. In: M. H. Stipanuk (ed.) Biochemical, physiological, and molecular aspects of human nutrition. p 168-199. Saunders, St. Louis, MO.
RFA. 2009. Ethanol industry statistics. Renewable Fuels Association, Washington D. C. Available online: http://www.ethanolrfa.org/industry/statistics/. Accessed: March 11, 2009.
Sauber, T. E., and F. N. Owens. 2001. Chapter 35: Cereals and by-products for swine. In: A. J. Lewis and L. L. Southern (eds.) Swine nutrition. p 785-802. CRC Press, Boca Raton, FL.
Sauvant, D., J. M. Perez, and G. Tran (eds). 2004. Tables of composition and nutrition value of feed materials: Pigs, poultry, cattle, sheep, goats, rabbits, horses, fish. 2nd edition. Wageningen Academic Publishers Wageningen, NL.
Stein, H. H., M. F. Fuller, P. J. Moughan, B. Sève, R. Mosenthin, A. J. M. Jansman, J. A. Fernández, and C. F. M. de Lange. 2007a. Definition of apparent, true, and standardized ileal digestibility of amino acids in pigs. Livestock Science 109: 282–286.
Stein, H. H., B. Sève, M. F. Fuller, P. J. Moughan, and C. F. M. de Lange. 2007b. Amino acid bioavailability and digestibility in pig feed ingredients: Terminology and application. Journal of Animal Science 85: 172–180.
165
USDA. 2009. 2007 Census of agriculture. USDA-National Agricultural Statistics Service, Washington D. C. Available online: http://www.agcensus.usda.gov/Publications/2007/Full_Report/index.asp. Accessed: March 11, 2009.
Veum, T. L., D. W. Bollinger, C. E. Buff, and M. R. Bedford. 2006. A genetically engineered Escherichia coli phytase improves nutrient utilization, growth performance, and bone strength of young swine fed diets deficient in available phosphorus. Journal of Animal Science 84: 1147–1158.
Veum, T. L., and M. R. Ellersieck. 2008. Effect of low doses of Aspergillus niger phytase on growth performance, bone strength, and nutrient absorption and excretion by growing and finishing swine fed corn-soybean meal diets deficient in available phosphorus and calcium. Journal of Animal Science 86: 858–870.
Whittemore, C. T. 2006. Chapter 8: Energy value of feedstuffs for pigs. In: I. Kyriazakis and C. T. Whittemore (eds.) Whittemore’s science and practice of pig production, 3rd edition. p 317-342. Blackwell Publishing, Oxford, UK.
Whittemore, C. T., M. J. Hazledine, and W. H. Close. 2003. Nutrient requirement standards for pigs. British Society of Animal Science, Penicuik, Scotland, UK.
Wilcke, B. 2004. Energy costs for corn drying and cooling. P102-2004-09. University of Minnnesota Extension, St. Paul MN.
Zijlstra, R. T., and R. L. Payne. 2008. Practical application of the net energy system in swine nutrition. Journal of Animal Science 86 E-Suppl. 2: 606.
166
Table 1. Energy use and resulting 100-yr global warming potential associated with producing and delivering swine feed ingredients to feed mill and mixing formulated swine diets in Iowa1. Ingredient
Production Energy2 kJ/kg
100-yr GWP2 g CO2 equivalents/kg
Ground corn 24.0 4.3 Ground oats 24.0 4.3 Full-fat roasted soybeans 597.9 46.7 Soybean meal 501.0 39.9 Soy oil 421.0 33.6 DDGS3 4,700.0 86.4 Crude glycerol4 2,200.0 168.3 Ground limestone5 2,545.0 173.4 Salt5 1,635.0 279.8 Monocalcium phosphate6 13,800.0 1,104.4 Phytase7 40,000.0 2,000.0 L-Lysine 52,170.0 1,642.2 DL-Methionine8 88,000.0 5,557.2 Mixing and delivery of diet 10.5 1.2 1 Values from Lammers (2009b) unless otherwise noted. 2 Does not include energy use or 100-yr global warming potential (GWP) associated with
cultivation and storage of grains and oilseeds. 3 Values include energy and 100-yr GWP required to produce 3.3 kg corn grain in C-S
sequence. Values exclude NE of 3.3 kg corn grain not fed to pigs, the gross energy of 1.4 L ethanol that is co-produced, and the potential displacement of other transportation fuels by ethanol. Values assume 0% capture of CO2 produced by fermentation.
4 Values include energy and 100-yr GWP required to production 14.2 kg soy oil from C-S sequence. Values exclude NE of 14.2 kg soy oil not fed to pigs, the gross energy of 12.7 L of biodiesel that is co-produced, and the potential displacement of other transportation fuels by biodiesel.
5 (LaHore and Croke, 1978). 6 (Nielsen and Wenzel, 2006). 7 (Nielsen et al., 2006). 8 (Binder, 2003).
167
Table 2. Nutrient content of reference diets and estimated nutrient intake associated with production of one, 136.0 kg market pig1. Diet
Feed intake2, kg
Net Energy MJ/kg
Standardized ileal digestible Lysine, g/kg
Available Phosphorus, g/kg
Phase 1 10.2 10.15 12.21 6.11 Phase 2 16.8 9.99 10.77 5.42 Phase 3 57.8 10.16 9.54 4.04 Phase 4 92.3 10.27 7.57 3.29 Phase 5 181.4 10.52 5.90 2.49 Gestation 37.0 10.72 4.29 5.06 Lactation 15.6 10.29 8.59 5.49 Totals3 411.1 4.27 2.80 1.28 1 Reference diets from Lammers et al. (2008) and Holden et al. (1996). 2 Feed intake assumptions from Lammers et al. (2009), includes death loss of 2.9 and 3.9% in
nursery and grow-finish respectively. 3 Total kg feed intake; GJ net energy; kg standardized ileal digestible lysine, and kg available
phosphorus associated with production of one 136.0 kg market pig.
168
Table 3. Calculated non-solar energy use and associated with production of grains, oilseeds, and biomass from different cropping sequences in Iowa1. Cropping Sequence2 Product C-C C-S C-C-S C-S-C-O C-S-C-O-A Corn grain, kJ/kg 2,116.8 1,870.0 1,975.7 1,785.5 1,510.7 Corn stalks, kJ/kg 55.6 53.4 53.4 53.4 53.4 Soybeans, kJ/kg na 1,893.4 1,878.7 1,878.7 1,849.7 Soybean meal3, kJ/kg na 1,079.2 1,070.9 1,070.9 1,054.3 Soy oil3, kJ/kg na 814.2 807.8 807.8 795.4 Oat grain, kJ/kg na na na 2,754.2 2,754.2 Oat straw, kJ/kg na na na 37.1 37.1 Alfalfa hay, kJ/kg na na na na 1,355.0 1 Based on Lammers (2009a). 2 C-C = continuous corn; C-S = corn, soybean; C-C-S = corn, corn, soybean, C-S-C-O =
corn, soybean, corn, oat under seeded with alfalfa; C-S-C-O-A = corn, soybean, corn, oat under seeded with alfalfa, alfalfa hay.
3 Assumes soybeans are processed into soybean meal (80% of soybean mass) with NE of 8.4 MJ/kg and 17% soybean oil (17% of soybean mass) with NE of 29.8 MJ/kg. A processing loss of 3% soybean mass is also assumed. Soybean cultivation energy allocated based on NE of final product mass (57% attributed to soybean meal, 43% attributed to soy oil) (Lammers, 2009b).
169
Table 4. Calculated 100-yr global warming potential (g CO2 equivalents/kg) associated with production of grains, oilseeds, and biomass from different cropping sequences in Iowa1. Cropping Sequence2 Product C-C C-S C-C-S C-S-C-O C-S-C-O-A Corn grain, g CO2/kg 151.7 133.5 140.6 127.8 109.4 Corn stalks, g CO2/kg 4.6 4.3 4.3 4.3 4.3 Soybeans, g CO2/kg na 140.8 139.5 139.5 137.4 Soybean meal3, g CO2/kg na 80.3 79.5 79.5 78.3 Soy oil3, g CO2/kg na 60.5 60.0 60.0 59.1 Oat grain, g CO2/kg na na na 216.0 216.0 Oat straw, g CO2/kg na na na 2.9 2.9 Alfalfa hay, g CO2/kg na na na na 104.0 1 Based on Lammers (2009a). 2 C-C = continuous corn; C-S = corn, soybean; C-C-S = corn, corn, soybean, C-S-C-O =
corn, soybean, corn, oat under seeded with alfalfa; C-S-C-O-A = corn, soybean, corn, oat under seeded with alfalfa, alfalfa hay.
3 Assumes soybeans are processed into soybean meal (80% of soybean mass) with NE of 8.4 MJ/kg and 17% soybean oil (17% of soybean mass) with NE of 29.8 MJ/kg. A processing loss of 3% soybean mass is also assumed. Soybean cultivation energy allocated based on NE of final product mass (57% attributed to soybean meal, 43% attributed to soy oil) (Lammers, 2009b).
170
Table 5. Summary of production, non-solar energy inputs, and 100-year global warming potential for 5 crop sequences1.2. Sequence C-C C-S C-C-S C-S-C-O C-S-C-O-A Gross energy, MJ/m2 31.25 21.25 25.81 22.06 20.62 Net energy, MJ/m2 12.27 8.89 10.52 8.79 7.76 Starch, g/m2 708.40 394.95 526.60 432.94 346.35 Non-solar energy, MJ/m2 2.44 1.57 1.94 1.66 1.43 100-yr GWP3, g CO2 equivalents/m2
175.70 113.10 139.3 119.8 105.1
Output Ratios Gross energy : non-solar energy 12.81 13.54 10.95 13.29 14.42 Net energy : non-solar energy 5.03 5.66 5.42 5.29 5.43 Starch : non-solar energy 290.33 251.56 271.44 260.81 242.20 Gross energy : 100-yr GWP 0.18 0.19 0.19 0.18 0.20 Net energy : 100-yr GWP 0.07 0.08 0.07 0.07 0.07 Starch : 100-yr GWP 4.03 3.49 3.78 3.61 3.30 1 From Lammers (2009a). 2 CC= continuous corn, C-S = corn-soybean; C-C-S = corn-corn-soybean; C-S-C-O = corn,
soybean, corn, oat under seeded with alfalfa; C-S-C-O-A = corn, soybean, corn, oat under seeded with alfalfa, alfalfa hay
3 100-yr GWP = 100-year global warming potential
171
Table 6. Calculated analysis and ingredients for 4 SIMPLE1 diet formulations required for production of one, 136.0 kg market pig. Formulation strategy Ingredient Corn-SBM Oat-SBM Oat-FFSB Co-products Corn,% 76.84 63.12 45.64 44.04 Soybean meal, % 19.85 18.03 0 15.89 Oats, % 0 15.57 20.93 0 Full-fat soybeans, % 0 0 29.66 0 DDGS, % 0 0 0 26.88 Crude glycerol, % 0 0 0 10.00 Ground limestone, % 2.02 2.14 2.57 2.98 Salt, % 0.29 0.22 0.28 0 Monocalcium phosphate, % 1.00 0.92 0.92 0.21 Total 100.00 100.00 100.00 100.00 Estimated feed intake, kg 417.35 435.31 425.25 465.73 Analysis NE, MJ/kg 10.24 9.81 10.05 9.17 SID Lysine : NE, g/MJ 0.66 0.66 0.66 0.66 Available P : NE, g/MJ 0.30 0.30 0.30 0.31 Crude protein : NE, g/MJ 15.24 15.44 16.11 19.26 Total P : NE, g/MJ 0.54 0.55 0.55 0.53 1 Diets formulated to have equal ratios of standardized ileal digestible (SID) lysine to NE and
available phosphorus (available P) to NE. No synthetic amino acids or exogenous enzymes included.
172
Table 7. Calculated analysis and ingredients for COMPLEX1 diet formulations required for production of one, 136.0 kg market pig. Formulation strategy Ingredient Corn-SBM Oat-SBM Oat-FFSB Co-products Corn,% 83.17 68.04 52.34 51.99 Soybean meal, % 14.91 14.16 0 8.98 Oats, % 0 15.88 21.15 0 Full-fat soybeans, % 0 0 24.34 0 DDGS, % 0 0 0 26.66 Crude glycerol, % 0 0 0 10.00 Ground limestone, % 1.49 1.53 1.75 2.12 Salt 0.22 0.24 0.30 Monocalcium phosphate, % 0.03 0 0 0 L-lysine, % 0.17 0.14 0.11 0.24 Exogenous phytase2, % 0.01 0.01 0.01 0.01 Total 100.00 100.0 100.0 100.0 Estimated feed intake, kg 405.19 423.83 417.01 450.31 Analysis NE, MJ/kg 10.54 10.08 10.24 9.49 SID Lysine : NE, g/MJ 0.66 0.66 0.66 0.66 Available P : NE, g/MJ 0.30 0.30 0.30 0.30 Crude protein : NE, g/MJ 13.22 13.77 14.64 16.06 Total P : NE, g/MJ 0.32 0.31 0.32 0.44 1 Diets formulated to have adequate threonine. Synthetic lysine and methionine added as
needed to meet requirements. 2 Exogenous phytase assumed to have phytase activity of 5,000 U/g material.
Table 8. Non-solar energy inputs1 and 100-yr global warming potential associated with feeding one 136.0 kg market pig from select crop sequence diet formulation strategies.
173
Crop sequence2 C-S C-S-C-O C-S-C-O C-C-S Diet Type3 Corn-SBM Oat-SB Oat-FFSB Co-product Formulation strategy4 S C S C S C S C Corn, kJ/MJ NE 142.2 149.4 116.4 122.1 82.2 92.5 96.0 109.5 Oats, kJ/MJ NE 0 0 44.1 43.8 57.9 57.3 0 0 Soybean meal, Kj/MJ NE 30.5 22.2 28.9 22.1 0 0 27.2 15.0 Full-fat soybeans, kJ/MJ NE 0 0 0 0 73.1 58.8 0 0 L-lysine, kJ/MJ NE 0 8.6 0 7.1 0 5.8 0 13.1 DDGS, kJ/MJ NE 0 0 0 0 0 0 137.7 132.1 Crude glycerol, kJ/MJ NE 0 0 0 0 0 0 24.0 23.2 Limestone, kJ/MJ NE 5.0 3.6 5.6 3.9 6.5 4.4 8.3 5.7 Salt, kJ/MJ NE 0.5 0.3 0.4 0.4 0.5 0.5 0 0 Monocalcium phosphate, kJ/MJ NE 13.4 0.4 13.0 0 12.6 0 3.2 0 Phytase, kJ/MJ NE 0 0.4 0 0.4 0 0.4 0 0.4 Mix and deliver, kJ/MJ NE 1.0 1.0 1.1 1.0 1.0 1.0 1.1 1.1 Total input energy, kJ/MJ NE 192.6 185.9 209.4 200.8 233.8 220.7 297.5 300.1 Total 100-yr GWP5, g CO2/MJ NE 14.3 13.3 38.9 10.0 17.7 15.4 23.5 13.8
174
CHAPTER 8. OPTIMIZING USE OF NON-SOLAR RESOURCES IN PIG PRODUCTION: AN EXAMINATION OF IOWA SYSTEMS
A paper to be submitted to Agricultural Systems
P. J. Lammersa, M. D. Kenealya, J. B. Kliebensteinb, J. D. Harmonc, M. J. Helmersc, and M. S. Honeymana*,
a Department of Animal Science, b Department of Economics,c Department of Agricultural
and Biosystems Engineering, Iowa State University, Ames IA 50011-1050
ABSTRACT
Most published research concerning non-solar energy use by swine production
systems has been conducted in Europe and does not extensively examine different housing
scenarios. This paper compares non-solar energy use for pig production options in Iowa. The
baseline system produces 15,600 pigs annually using confinement facilities and a corn-
soybean cropping sequence. Diet formulations for the baseline system include synthetic
amino acid L-lysine and exogenous phytase. The baseline system represents the majority of
current pork production systems in Iowa and the Upper Midwest where the majority of U.S.
swine are produced. The baseline system is designed to minimize land-surface area
requirements and encourage maximal pork production per unit of feed net energy and
standardized ileal digestible lysine fed to pigs. Selected combinations of facility type diet
formulation crop sequence scenarios were examined and compared. The baseline system
for swine production in Iowa is estimated to require 7.1 MJ non-solar energy/kg of live
weight pig produced. Emissions of 587 g CO2 equivalents/kg live weight are also associated
with the Iowa swine production systems. An alternative system that uses hoop barns for
Phosphorus excretion was estimated based on results of 2 studies examining phytase
in nursery (Veum and Ellersieck, 2008) and finishing (Veum et al., 2006) pigs. Both studies
examined the efficacy of exogenous phytase by comparing P retention in pigs fed graded
181
levels of exogenous phytase in diets formulated to be low in available P (Veum et al., 2006;
Veum and Ellersieck, 2008). Both studies also included a positive control diet that was
adequate in available P by inclusion of inorganic phosphorus sources (Veum et al., 2006;
Veum and Ellersieck, 2008). The intake and excretion of P by pigs fed the negative and
positive control diets in previous studies (Veum et al., 2006; Veum and Ellersieck, 2008) are
the basis for the following equation used to predict phosphorus excretion by pigs in our
assessment.
Equation 2. Phosphorus excretion by pigsPex = 0.79 Pin 1.0593
WherePex Total phosphorus excreted, g
Pin Total phosphorus intake, g
Diet formulation affects energy density of the diets fed to pigs and pigs consume feed
based on energy density of the diet. Because not all feed consumed is utilized by the pig, it is
necessary to estimate relative differences in fecal mass when comparing different dietary
strategies. Pigs fed Corn-Soy diets with synthetic amino acids were assumed to produce
waste at rates found in tables used for developing manure management plans (ISU, 2003).
For other diet formulations, for every 5% increase in feed intake over the baseline Corn-Soy
scenario a 1% increase in waste volume was assumed.
2.3.2 Nutrient losses during storage and application
Loss of N from pig wastes during storage and application is a major concern (ISU,
2003; IPCC, 2006; Wathes and Whittemore, 2006). Losses from different types of storage
systems vary (Arogo et al., 2003; Nicks et al., 2004; Phillippe et al., 2006; Phillippe et al.,
2007). Previous examinations of nitrogen loss from swine manure storage units have focused
182
on liquid manure systems or deep-litter systems that use sawdust. Only 1 study has examined
the characteristics of cornstalk bedding packs in hoop barns (Tiquia et al., 2002). Using a
mass balance approach, N losses of 35–45% were reported. European researchers have
reported N losses of only 28% from deep-litter pens when using straw (Nicks et al., 2004).
Others report N losses of up to 75% from deep-litter pens using straw bedding (Phillippe et
al., 2006). No published studies have specifically examined N loss from liquid manure stored
in deep pits compared to N loss from bedded hoop barns. For our analysis we assume
nitrogen losses of 25% from liquid manure storage and 50% from bedded hoop barns (IPCC,
2006).
Liquid manure is often direct injected into cropland. Our model assumes liquid
manure is directly injected into cropland after removal from storage and that 98% of the N in
the stored manure is delivered to crop fields and that it 100% is available to crops in the year
of application (ISU, 2003). For every 100 kg N excreted by pigs and handled as liquid
manure, our analysis assumes 73.5 kg of N is available to crops with 25 kg N lost during
storage and 1.5 kg lost during application.
Manure and bedding from hoop barns is often composted prior to application. The
ratio of C:N in the composting material, moisture content, and frequency of turning have all
been shown to influence reduction of material mass, total losses of N , and type of N
emission from composting pig manure (Huang et al., 2001; Tiquia et al., 2002; Huang et al.,
2004). Our analysis assumes no turning of compost and that a 40% reduction in material
mass occurs (Tiquia et al., 2002). Our analysis assumes that the 50% N loss reported
previously includes all N loss during storage and composting (IPCC, 2006). Our analysis
assumes 0% loss of N from stable compost that is applied and incorporated to crop fields and
183
that 60% of the delivered N is available to plants during the year of application with the
remaining 40% available to plants in the following year (Shaffer, 2001). For every 100 kg of
N excreted by pigs housed in bedded hoop barns, our analysis assumes 50 kg of N is
available to crops over a 2-year period.
Phosphorus does not volatilize and under most manure storage and handling scenarios
most of the excreted P is delivered to crop fields (Fulhage and Hoehne, 2001). Our analysis
assumes 100% of the excreted P is delivered to crop fields and is available for plant growth
in the year of application. We also assume that cropland has a P-index of 2–5 which allows
N-based manure management but prohibits P application rates exceeding two times the P
removal rates of the crop schedule (USDA-NRCS, 2004; IADNR, 2006).
2.3.2.1 Land application of manure slurry or compost
Our model assumes swine waste is returned to cropland that was used to grow crops
fed to pigs. Application rates of swine manure were based on nutrient removal rates by the
crops with application of synthetic fertilizers reduced accordingly (Lammers et al., 2009b).
Concentration of nutrients in swine manure slurry or compost were calculated for liquid
manure systems and the bedded hoop barns. For liquid pig manure, the mass of N and P after
taking into account storage and application losses were divided by the calculated slurry
volume. Non-solar energy use for transporting and injecting liquid pig manure into cropland
is reported as 20.8 kJ/L (Wiens et al., 2008). Application rate was calculated based on
manure slurry nutrient concentration and nutrient removal rates by crops. We assume non-
solar energy use of 20.8 kJ/L of liquid swine manure applied.
For swine manure compost, the mass of N and P after taking into account storage and
composting losses were divided by the mass of the finished compost. Application rate was
184
calculated based on nutrient concentration of the compost and nutrient removal rates by
crops. It was assumed that compost would be loaded onto a trailer with a capacity of 22,000
kg and hauled an average of 3.2 km with an average fuel efficiency of 3.0 km/L. Energy
density of diesel fuel is assumed to be 38.46 MJ/L. Thus transportation energy cost of
delivering compost to fields was calculated as 1.9 kJ/kg. Energy use for spreading the
compost across the field was estimated based on reported diesel fuel use for field operations
(Downs and Hansen, 1998; Hanna, 2001).
Use of diesel fuel for transporting, injecting or spreading liquid swine manure or
compost results in emission of greenhouse gases. The 100-yr global warming potential of
diesel fuel consumption is reported as 63.52 g CO2 equivalents/MJ non-solar energy as
diesel fuel (IPCC, 2006). Diesel fuel consumption for manure handling was totaled and used
to calculated greenhouse gas emissions associated with non-solar energy use for manure
handling for each diet housing comparison.
2.5 Reporting
The baseline system—conventional confinement housing, pigs fed a COMPLEX
Corn-Soy diet, C-S cropping sequence—was first modeled and summarized. Selected
combinations of facility type diet formulation crop sequence scenarios were also
examined and compared. For each facility type diet formulation crop sequence scenario
examined the land area, non-solar energy use, and 100-yr GWP for the entire pig production
system was calculated and divided by the number of 136.0 kg market pigs produced. Not all
grains, oilseeds, and biomass produced within a crop sequence are necessarily consumed by
pigs. Crop products not consumed by pigs are assumed to be exported from the farm.
Exported crop production for each housing diet formulation crop sequence scenario were
185
calculated and reported. All scenarios are designed to provide adequate corn and oats. As
needed soybean meal is imported to the farm. Imports and exports of crop products were
totaled and compared for each facility type diet formulation crop sequence scenario
considered.
3. Results
3.1 Baseline scenario
Table 1 presents the baseline scenario for pig production in Iowa. In the baseline
scenario each market pig is estimated to require 967.6 MJ non-solar energy and result in 79.8
kg CO2 equivalents. Approximately 60% of the non-solar energy use for pig production is
associated with growing and processing feed ingredients. Fifty percent of the non-solar
energy use is due to cultivation of crops. Feed ingredient manufacture and processing of feed
accounts for just over 9% of total energy. Although 19% of the non-solar energy use results
from facility operation, 28% of the 100-yr GWP results from that activity. Nearly 30% of
non-solar energy use is associated with construction and operation of facilities, and 37% of
the 100-yr GWP associated with pig production can be attributed to facility construction and
operation in the Corn-Soy baseline scenario. The baseline scenario assumes a C-S cropping
sequence and results in export of 20.9 kg soybean meal and 17.3 kg soy oil per market pig
sold. The total crop land area needed to produce feed grown on farm is 535 m2/market pig or
a total of 834.6 hectares for the 15,600 pig system.
Table 2 details two additional crop sequence and diet type scenarios for the
conventional confinement facilities. The SIMPLE Oat-Soy diet formulation does not include
L-lysine and requires almost 25% less energy for processing feed ingredients compared to
the baseline scenario. However energy used to cultivate crop is 35% more for the SIMPLE
186
Oat-Soy option compared to the baseline. Including synthetic amino acids increases the
processing energy required for pig diets and decreases the CP content of the feed and
ultimately the amount of N excreted by the pig. Removing synthetic amino acids from diets
should increase N excretion, increasing N delivery to fields, and reduce the need for synthetic
N fertilizers. However the benefits of feeding higher CP to pigs and reducing application of
N fertilizers to cropland is not energetically favorable in the conventional systems compared.
Cultivation energy for the COMPLEX Co-product diet formulation was less than any
other scenario, however the processing energy is 5–7 times greater. This is because of the
way DDGS and crude glycerol were assessed. Our analysis assumes DDGS and crude
glycerol are imported to the farm and that cultivation of the corn and soybeans required to
produce those biofuel co-products are attributed to the processing energy of those feed
ingredients. The different crop sequence diet formulations result in differing crop
surpluses. The baseline scenario assumes a C-S sequence and results in export of 20.9 kg
soybean meal and 17.3 kg soy oil per market pig respectively. The SIMPLE Oat-Soy
scenario assumes a C-S-C-O sequence and results in export of 121.3 kg corn grain, and 10.43
kg soy oil/market pig but requires the importing of 29.47 kg of soybean meal/market pig. The
COMPLEX Co-product scenarios with a C-C-S sequence imports 19.30 kg soybean meal and
exports 6.78 kg soy oil/market pig.
A hoop-based pig production system requires less non-solar energy for operation of
facilities, but also requires more feed. Because liquid pig manure from conventional facilities
and swine manure compost from hoop barns have different release rates of crop available
nutrients, different cropping sequences may be more effective in a hoop barn-based system
than in the conventional confinement system. Table 3 details three diet formulation
187
cropping sequence scenarios for farrow-to-finish swine production using hoop barns for
gestation and grow-finish. Feeding pigs housed in hoop barns a COMPLEX Corn-Soy diet
from C-S cropping sequence require 939.8 MJ non-solar energy and results in 79.8 kg CO2
equivalents per market pig sold. This is 3% less than the non-solar energy use associated with
the same diet crop sequence scenario when pigs are housed in conventional confinement.
The hoop barn system results in 12% less 100-yr global warming potential compared to the
conventional system. The hoop barn-based system’s advantage is in reduced operating
energy requirements and manure handling. Injecting liquid pig manure using an umbilical
cord systems requires a 20.8 MJ/L (Wiens et al., 2008). Loading, hauling, and surface
spreading finished swine manure compost requires less energy per unit of fertility delivered
to crop fields. Operating the hoop barn-based complex requires 39% less non-solar energy
than a conventional confinement system. This dramatic difference more than offsets the
additional energy needed to grow feedstuffs and process feed ingredients in the hoop barn-
based system.
A SIMPLE Oat-Soy diet fed to pigs housed in hoop barns requires 19% more total
non-solar energy input compared to the baseline conventional system. Feeding a SIMPLE
Oat-Soy diet to pigs in hoop barns requires similar energy as feeding the same diet to pigs
housed in conventional systems, once again because of the effects of different manure
handling systems and facility operating requirements. The COMPLEX Co-product diet
strategy required the most non-solar energy input in both the hoop barn-based and
conventional confinement systems. In terms of non-solar energy use per market pig produced
feeding biofuel co-products to pigs may not be the optimal use for those co-products,
188
although comparative pricing of various feed ingredients at different locations may make
feeding biofuel co-products economical for individual producers.
Although the main product of swine production systems is obviously pigs, not all
crop products grown within a particular sequence are necessarily consumed by pigs. Table 4
summarizes the mass of crop products potentially exported from each facility diet type
formulation strategy. Because the focus of this examination is energy, the NE value of the
exported feedstuffs when fed to pigs is totaled. We also present the NE of any feedstuffs that
need to be imported. From those two values a net NE can be calculated. The C-S-C-O
sequences produce an abundance of corn and this results in those systems exporting NE as
feedstuffs from the farm despite the need to import soybean meal. All sequences examined
export soy oil, which ultimately leads to a positive balance of exported - imported feedstuffs
in terms of NE for pigs.
For all scenarios considered, growing and processing swine feed was the largest
contributors to total non-solar energy and 100-yr global warming potential associated
production of one 136.0 kg market pig in Iowa farrow-to-finish swine systems. The energy
and 100-yr global warming potential of facility construction and operation is not
inconsequential and should be included in future assessments of swine production systems.
As expected the impact of non-solar energy use required to construct and operate different
swine production systems influences the total balance of the system. Despite using more non-
solar energy for production and delivery of feed, farrow-to-finish systems using hoop barns
for grow-finish pigs and gestating sows use similar or less non-solar energy as comparable
conventional systems.
189
Current reports from Europe of non-solar energy use for pig production range from
5.3–23.5 MJ/kg live weight (Basset-Mens and van der Werf, 2005; Ericksson et al., 2005;
Williams et al., 2006). Previous reports have been conducted in Europe and have likely
assumed very different crop production and feed processing scenarios than what we have
presented. Others have not included facility operation, focusing exclusively on feeding
strategies. With nearly 30% of the non-solar energy use required to produce a pig resulting
from facility construction and operation reports that do not include this aspect of pig
production are incomplete. We estimate that raising pigs in conventional confinement
systems operating in Iowa uses 7.1 MJ non-solar energy per kg of live weight pig. The
alternative system using hoop barns for grow-finish pigs and gestating sows may reduce the
non-solar energy use by 3% to 6.9 MJ/kg of live weight. Hoop barn-based swine production
systems can be managed to use similar or less resources than conventional systems. Although
the conventional system did not develop within a vacuum, as we strive to optimally allocate
non-solar energy reserves and reduce the global warming potential of pig production, support
for alternative systems such as hoop barns is warranted.
Acknowledgements
This project was supported by Hatch Act, State of Iowa funds, USDA Special Grants, USDA
SARE program, and the Leopold Center for Sustainable Agriculture. Mention of trade names
or commercial products in this publication is solely for the purpose of providing specific
information and do not imply recommendation or endorsement by Iowa State University.
References
Arogo, J., P. W. Westerman, and A. J. Heber. 2003. A review of ammonia emissions from confined swine feeding operations. Transactions of the ASAE 46: 805–817.
190
Basset-Mens, C., and H. M. G. van der Werf. 2005. Scenario-based environmental assessment of farming systems: The case of pig production in France. Agriculture Ecosystems and Environment 105: 127–144.
Brumm, M. C., J. D. Harmon, M. S. Honeyman, J. B. Kliebenstein, S. M. Lonergan, R. Morrison, and T. Richard. 2004. Hoop barns for grow-finish swine. AED 44. MidWest Plan Service, Ames, IA.
Canh, T. T., A. J. A. Aarnink, J. B. Schutte, A. Sutton, D. J. Langhout, and M. W. A. Verstegen. 1998. Dietary protein affects nitrogen excretion and ammonia emissions from slurry of growing-finishgin pigs. Livestock Production Science 56: 181–191.
Crenshaw, T. D. 2001. Chapter 10: Calcium, phosphorus, vitamin D, and vitamin K in swine nutrition. In: A. J. Lewis and L. L. Southern (eds.) Swine nutrition. p 187–212. CRC Press, Boca Raton, FL.
Dalgaard, R., N. Halberg, and J. E. Hermansen. 2007. Danish pork production: An environmental assessment. DJF Animal Science 82: 1–34.
Downs, H. W., and R. W. Hansen. 1998. Estimating farm fuel requirements. No. 5.006. Colorado State University Extension, Fort Collins, CO. Available online: http://www.cde.state.co.us/artemis/ucsu20/ucsu2062250061998internet.pdf. Accessed: February 2, 2009.
Emiola, A., O. Akinremi, B. Slominski, and C. M. Nyachoti. 2009. Nutrient utilization and manure P excretion in growing pigs fed corn-barley-soybean based diets supplemented with microbial phytase. Animal Science Journal 80: 19–26.
Ericksson, I. S., H. Elmquist, S. Stern, and T. Nybrant. 2005. Environmental systems analysis of pig production: The impact of feed choice. International Journal of Life Cycle Assessment 10: 143-154.
Fulhage, C., and J. Hoehne. 2001. Lesson 21: Sizing manure storage, typical nutrient characteristics. Livestock and poultry environment stewardship curriculum. MidWest Plan Service, Ames, IA.
Halberg, N. 1999. Indicators of resource use and environmental impact for use in a decision aid for Danish livestock farms. Agriculture Ecosystems and Environment 76: 17–30.
Hanna, M. 2001. Fuel required for field operations. PM 709. Iowa State University Extension, Ames, IA.
Hardy, C. 2009. Update on ethanol and soy processing in Iowa. Iowa State University Extension, Ames, IA. Available online: http://www.extension.iastate.edu/ag/success/07-11 POWs/POW 180/2009/Hardy2.html. Accessed: March 24, 2009.
191
Harmon, J. D., M. S. Honeyman, J. B. Kliebenstein, T. Richard, and J. M. Zulovich. 2004. Hoop barns for gestating swine. AED 44. MidWest Plan Service, Ames, IA.
Honeyman, M. S., and J. D. Harmon. 2003. Performance of finishing pigs in hoop structures and confinement during summer and winter. Journal of Animal Science 81: 1663-1670.
Honeyman, M. S., J. D. Harmon, J. B. Kliebenstein, and T. L. Richard. 2001. Feasibility of hoop structures for market swine in Iowa: Pig performance, pig environment, and budget analysis. Applied Engineering in Agriculture 17: 869–874.
Honeyman, M. S., P. J. Lammers, and S. Hoyer. 2007. Distillers dried grains with solubles. IPIC 11a. Iowa State Univeristy, Ames, Iowa.
Huang, G. F., M. Fang, Q. T. Wu, L. X. Zhou, X. D. Liao, and J. W. C. Wong. 2001. Co-composting of pig manure with leaves. Environmental Technology 22: 1203–1212.
Huang, G. F., J. W. C. Wong, Q. T. Wu, and B. B. Nagar. 2004. Effect of C/N on composting pig manure with sawdust. Waste Management 24: 805-813.
IADNR. 2006. The Iowa phosporus index. Iowa Department of Natural Resources, Des Moines, IA. Available online: http://www.iowadnr.gov/afo/files/pindex_fs.pdf. Accessed: March 28, 2009.
IPCC. 2006. 2006 IPCC guidelines for national greenhouse gas inventories. Kamiyamaguchi, Japan. Available online: http://www.ipcc-nggip.iges.or.jp/public/2006gl/index.html. Accessed: January 14, 2009.
ISU. 2003. Managing manure nutrients for crop production. PM 1811. Iowa State University Extension, Ames, IA.
Jones, M. R. 1989. Analysis of the use of energy in agriculture—approaches and problems. Agricultural Systems 29: 339–355.
Kerr, B. J., M. S. Honeyman, P. J. Lammers, and S. Hoyer. 2007. Crude glycerol. IPIC 11b. Iowa State Univeristy, Ames, Iowa.
Lammers, P. J. 2006. Gestation housing for sows: A comparison of individual gesation stalls within confinement facilities and group pens in deep-bedded hoop barns, Iowa State Univeristy, Ames.
Lammers, P. J., M. S. Honeyman, J. D. Harmon, and M. J. Helmers. 2009a. Energy and nutrient cycling in pig production systems. Chapter 4: Energy and carbon inventory of swine production facilities, Iowa State University, Ames, IA.
Lammers, P. J., M. S. Honeyman, J. D. Harmon, and M. J. Helmers. 2009b. Energy and nutrient cycling in pig production systems. Chapter 7: Non-solar energy use and 100-
192
yr global warming potential of Iowa swine feed ingredients, Iowa State University, Ames, IA.
Lammers, P. J., M. S. Honeyman, J. D. Harmon, J. B. Kliebenstein, and M. J. Helmers. 2009c. Construction resource use of two different types and scales of Iowa swine production facilities. Applied Engineering in Agriculture submitted.
Lammers, P. J., M. S. Honeyman, J. B. Kliebenstein, and J. D. Harmon. 2008. Impact of gestation housing system on weaned pig production cost. Applied Engineering in Agriculture 24: 245-249.
Meul, M., F. Nevens, D. Reheul, and G. Hofman. 2007. Energy use efficiency in specialised dairy, arable, and pig farms in Flanders. Agriculture, Ecosystems and Environment 119: 135–144.
NBB. 2008. Commercial biodiesel production plants. National Biodiesel Board, Washington D. C. Available online: http://www.biodiesel.org/buyingbiodiesel/producers_marketers/Producers%20Map-Existing.pdf. Accessed: March 11, 2009.
Nicks, B., M. Laitat, F. Farnir, M. Vandenheede, A. Désiron, C. Verhaeghe, and B. Canart. 2004. Gaseous emissions from deep-litter pens with straw or sawdust for fattening pigs. Animal Science 78: 99–107.
Phillippe, F.-X., M. Laitat, B. Canart, F. Frédéric, L. Massart, M. Vandenheede, and B. Nicks. 2006. Effects of reduction of crude protein content on gaseous emissions from deep-litter pens for fattening pigs. Animal Research 55: 397–407.
Phillippe, F.-X., M. Laitat, B. Canart, M. Vandenheede, and B. Nicks. 2007. Gaseous emissions during the fattening of pigs kept either on fully slatted floors or on straw floor. Animal 1: 1515–1523.
Reid, J. T., P. A. Oltenacu, M. S. Allen, and O. D. White. 1980. Cultural energy, land and labor requirements of swine production systems in the U.S. In: D. Pimentel (ed.) CRC handbook of energy utilization in agriculture. p 393–403. CRC Press Inc., Boca Raton, FL.
RFA. 2009. Ethanol industry statistics. Renewable Fuels Association, Washington D. C. Available online: http://www.ethanolrfa.org/industry/statistics/. Accessed: March 11, 2009.
Sauvant, D., J. M. Perez, and G. Tran (eds). 2004. Tables of composition and nutrition value of feed materials: Pigs, poultry, cattle, sheep, goats, rabbits, horses, fish. 2nd edition. Wageningen Academic Publishers Wageningen, NL.
Shaffer, K. 2001. Lesson 31: Manure utilization plans. Livestock and poultry environment stewardship curriculum. MidWest Plan Service, Ames, IA.
193
Tiquia, S. M., T. L. Richard, and M. S. Honeyman. 2002. Carbon, nutrient, and mass loss during composting. Nutrient cycling in agroecosystems 62: 15–24.
USDA. 2009. 2007 Census of agriculture. USDA-National Agricultural Statistics Service, Washington D. C. Available online: http://www.agcensus.usda.gov/Publications/2007/Full_Report/index.asp. Accessed: March 11, 2009.
USDA-NRCS. 2004. The Iowa phosphorus index. USDA-NRCS, Des Moines, IA. Available online: ftp://ftp-fc.sc.egov.usda.gov/IA/technical/Technot25Aug04.pdf. Accessed: March 27, 2009.
Veum, T. L., D. W. Bollinger, C. E. Buff, and M. R. Bedford. 2006. A genetically engineered Escherichia coli phytase improves nutrient utilization, growth performance, and bone strength of young swine fed diets deficient in available phosphorus. Journal of Animal Science 84: 1147–1158.
Veum, T. L., and M. R. Ellersieck. 2008. Effect of low doses of Aspergillus niger phytase on growth performance, bone strength, and nutrient absorption and excretion by growing and finishing swine fed corn-soybean meal diets deficient in available phosphorus and calcium. Journal of Animal Science 86: 858–870.
Wathes, C., and C. T. Whittemore. 2006. Chapter 17: Environmental management of pigs. In: I. Kyriazakis and C. T. Whittemore (eds.) Whittemore’s science and practice of pig production, 3rd edition. p 533-592. Blackwell Publishing, Oxford, UK.
Wiens, M. J., M. H. Entz, C. Wilson, and K. H. Ominski. 2008. Energy requirements for transport and surface application of liquid pig manure in manitoba, Canada. Agricultural Systems 98: 74–81.
Williams, A. G., E. Audsley, and D. L. Sandars. 2006. Determining the environmental burdens and resource use in the production of agricultural and horticultural commodities. Main Report. Defra Research Project ISO205. Cranfield University, Silsoe, UK.
Zhu, X., and E. C. van Ierland. 2004. Protein chains and environmental pressures: A comparison of pork and novel protein foods. Environmental Sciences 1: 254–276.
194
Table 1. Assessment of non-solar energy and 100-yr global warming potential associated with farrow-to-finish pig production in Iowa in the baseline system1. Non-solar
Energy, MJ/pig 100-yr GWP kg CO2
equivalents/pig Facility construction 87.0 6.7 Facility operation 185.4 22.7 Cultivation of crops 512.6 38.1 Processing of feed 99.5 7.0 Manure application 83.1 5.3 Total 967.6 79.8
1 Conventional confinement facilities scaled to produce 15,600 market pigs annually. Requires 535 m2 cropland/market pig and results in surplus production of 20.9 kg soybean meal and 17.3 kg soy oil.
195
Table 2. Alternative crop sequences and diet formulation strategies for Iowa farrow-to-finish systems using conventional confinement scaled to produce 15,600 market pigs annually. Non-solar
energy, MJ/pig
100-yr GWP, kg CO2
equivalents/pig
Non-solar energy, MJ/pig
100-yr GWP, kg CO2
equivalents/pig Building construction 87.0 6.7 87.0 6.7 Building operation 185.4 22.7 185.4 22.7 Cultivation of crops 694.2 51.4 425.1 31.0 Processing of ingredients 74.9 6.8 561.6 20.0 Manure application 84.1 5.3 84.3 5.4 Total 1,125.6 92.9 1,343.4 85.8 System Characteristics Crop sequence C-S-C-O C-C-S Diet type Simple Oat-Soy Complex Co-product On-farm feed production area 629.2 m2/pig 306.8 m2/pig Off-farm feed production area 96.9 m2/pig 277.6 m2/pig Imported soybean meal 29.47 kg/pig 19.30 kg/pig Surplus corn grain 121.30 kg/pig 0 Surplus soy oil 10.43 kg/pig 6.78 kg/pig
Table 3. Assessment of non-solar energy and 100-yr global warming potential associated with Iowa farrow-to-finish pig production systems using bedded hoop barns for gestating sows and grow-finish pigs.
Balance point temperature and long-term climate data can be used to estimate the
number of hours a particular facility will need additional heat added or removed during a
year. The number of hours that the exterior temperature is less then the balance point
204
temperature is the number of hours in a year that additional heat must be added. Alternatively
the number of hours that the exterior temperature is greater than the balance point
temperature is the number of hours in a year that additional heat removal strategies are
needed. The grow-finish building houses 1,200 pigs, each pig has a body weight of 85.3 kg
and produces 531.4 kJ of sensible heat. Assuming a minimum room temperature of 15.5°C
and minimum ventilation rate of 283 L min-1 hd-1, the balance temperature is -9.2°C.
Step 3. Determine number of hours that heat will be need to be added to the building and the least square mean exterior temperature for that time frame.
The balance point temperature for the grow-finish building example is -9.2°C. A sub-
set of temperature time data points from table 1 can now be identified. All temperature
time data points -9.2 °C are included in the subset and all temperature time data points >
-9.2°C are excluded. Table 2 Summarizes the number of hours pigs occupy the building at
temperatures -9.2°C. This information can be used to calculate the least square mean
temperature for the 1,063.2 hr when exterior temperatures are -9.2°C. The exterior
temperature is calculated as -16.3°C for the 1,063.2 hr when additional heat is needed.
Step 4. Calculate heat inputs required.
The thermal balance of a pig building is calculated following the general equation:
Thermal balance (Btu/hr) = Hin - Hout (Equation 2)
Where Hin = Sensible heat production by pigs, Btu/hr Hout= Heat loss from building surfaces, Btu/hr + Heat loss from ventilation, Btu/hr
205
If the thermal balance is negative, additional heat must be added to the building to
maintain interior temperature at a given set-point. If thermal balance is positive, additional
heat must be removed from the building to prevent interior temperature from increasing.
Heat production by pigs is calculated using equations based on Pedersen (2002) and
Brown-Brandl et al. (2004). Heat production by growing pigs is calculated using the
appropriate equation based on body weight:
Total heat production by pigs 10 kg: HP = 4.3 BW0.15 BW Head 3.41214 (Equation 3a) Total heat production by pigs > 10 kg
HP = 14.11 BW-0.38 BW Head 3.41214 (Equation 3b) Where HP = Heat production, Btu/hr BW = Body weight, kg Head = Number of pigs in building 3.41214 = Conversion factor W to Btu/hr Heat production by adult pigs is influenced by body weight as well as production
phase. Heat production by gestating sows or lactating sows with litters is calculated using
one of the following production phase specific equations:
Total heat production by gestating sows HP = (4.85 BW0.75 + 2 10-0.5 DP3 + 76 0.18) Head 3.41214 (Equation 4a) Total heat production by lactating sows HP = (4.85 BW0.75 + 28 6 + 76 0.18) Head 3.41214
(Equation 4b) Where HP = Heat production, Btu/hr BW = Body weight, kg DP = Days of pregnancy, d Head = Number of sows in building 3.41214 = Conversion factor W to Btu/hr
206
The amount of heat produced as sensible heat is then calculated as a temperature
dependent percentage of the total heat production based on Pedersen (2002) and Brown-
Brandl et al. (2004).
Heat loss from the building is calculated using equations presented by MWPS
publications (MWPS, 1987, 1990a, b). Heat loss from each building surface is calculated
using the general equation:
BSL = (AS/RS) (ti-to) (Equation 5a) Where
BSL = Heat loss through a surface, Btu/hr AS = Surface area, ft2
RS = Total resistance of the surface to heat flow, °F•ft2•hr/Btu ti = Inside temperature, °F to = Outside temperature, F
Heat loss through the floor perimeter is calculated using the following equation:
HLFP = (AP/RP) (ti-to) (Equation 5b) Where
HLFP = Heat loss through floor perimeter, Btu/hr AP = Building perimeter, ft RP = Resistance of perimeter to heat flow, °F•ft•hr/Btu ti = Inside temperature, °F to = Outside temperature, F
The losses from each surface are added together to calculate the total heat loss from
surfaces of the building. Heat loss from ventilation necessary to maintain air quality is
calculated using the following equation:
HLVMIN = 1.1 cfmMIN (ti-to) Head (Equation 6)
Where HLVMIN = Heat loss from minimum ventilation, Btu/hr 1.1 = Conversion factor cfmMIN = Minimum ventilation rate, ft3 min-1 pig-1 ti = Inside temperature, °F to = Outside temperature, F Head = Number of pigs in building
207
Table 3 summarizes the value of key variables in equations 1-6 for the grow-finish
building example. By manipulating variables presented in table 3 and equations 1-6 we find
that 194.3 MJ/hr additional heat must be added to the building in order to maintain an interior
temperature of 15.5°C when exterior temperatures are -16.3°C. Calculating the additional
heat input is then simply a matter of multiplying heat input/hr by the number of hours
modeled. In this example:
194.3 MJ/hr 1,063.2 hr = 206.6 GJ/building
Assuming a heater efficiency of 98% approximately 210.8 GJ of heat must be added
to the described grow-finish building annually when pigs are housed in the building.
Steps 2–4 are then repeated for when no pigs are housed in the building. When no
pigs are present, heat production is zero, ventilation is reduced to 650 L/min for the entire
building and interior temperature is maintained at 10°C. This results in a balance temperature
of 10°C. A second sub-set of temperature time data points was then drawn from table 1 and
is summarized as table 4. The least square mean temperature for hours that require additional
heat inputs when no pigs are present is -3.1°C. Table 5 summarizes the value of key variables
in equations 1-6 for the empty grow-finish building example. By manipulating variables
presented in table 5 and equations 1-6 we find that 34.3 MJ/hr additional heat must be added
to the building in order to maintain an interior temperature of 10°C when exterior
temperatures are -3.1°C. Calculating the additional heat input is then simply a matter of
multiplying heat input/hr by the number of hours modeled. In this example:
34.3 MJ/hr 47.8 hr = 1.6 GJ/building
Assuming a heater efficiency of 98%, 1.7 GJ of heat must be added to the described
grow-finish building annually when the building is empty. The total heat required by this
208
grow-finish building for 1 year is thus 212.5 GJ. With 4 grow-finish buildings in the system
producing 15,600 market pigs annually a total of 850 GJ of heat input is needed for thermal
climate control of grow-finish buildings.
Step 5. Calculate energy used for maintaining air quality
Pigs are housed in the grow-finish building 8,672.4 hr/yr. The ventilation rate needed
to maintain air quality (minimum ventilation) for the 85.3 kg pig in our model is 283 L
min-1 head-1. With a fan efficiency of 339.8 L min-1 W-1 operating the minimal
ventilation fans requires 999.4 W. Thus a total of 8,667.2 kW•hr or 31.2 GJ of electricity is
required to operate minimal ventilation fans when pigs are housed in one grow-finish
building. Therefore a total of 124.8 GJ electricity is needed to maintain air quality inside 4
grow-finish buildings in the 15,600 market pigs/year system when pigs are present.
The grow-finish building is empty of pigs for 87.6 hours. When the barn has no pigs
in it, the minimal ventilation rate is 650 L/min. Fan efficiency is 339.8 L min-1 W-1, thus
maintaining air quality when no pigs are present requires a total of 0.2 kW•hr or 0.7 MJ per
building. The total electricity needed for maintaining minimal air quality in the 4 grow-finish
buildings for the 15,600 market pig/year system is slightly more than 124.8 GJ/year.
Step 6. Calculate the energy used to reduce interior temperature of barns
If exterior temperature is greater than the balance point temperature but less than the
maximum allowable interior temperature, increasing the ventilation rate will remove heat
from the building and maintain interior temperatures within the accepted range. Additional
ventilation to remove heat from a building is calculated using the following equation from
Tables 5 and 6 summarizes the different temperature hour data used to calculate
cooling of pig buildings with and without pig present respectively. Equations 1-7 and fan
efficiency assumptions can then be manipulated to calculate the energy used for cooling pigs.
Table 8 summarizes energy use for thermal control of 1 grow-finish building in a farrow-to-
finish swine production system producing 15,600 market pigs annually.
REFERENCES Brown-Brandl, T. M., J.A. Nienaber, H. Xin, and R. S. Gates. 2004. A literature review of
swine heat production. Transactions of the ASAE 47: 259-270. Kjelgaard, M. J. 2001. Engineering weather data. McGraw-Hill, New York, NY. Lammers, P. J., M. S. Honeyman, J. D. Harmon, J. B. Kliebenstein, and M. J. Helmers. 2009.
Construction resource use of two different types and scales of Iowa swine production facilities. Applied Engineering in Agriculture submitted.
210
MWPS. 1987. Structures and environment handbook. 11th Revised ed. MidWest Plan Service, Ames, IA.
MWPS. 1990a. Heating, cooling, and tempering air for livestock housing. 1st ed. MidWest
Plan Service, Ames, IA. MWPS. 1990b. Mechanical ventilation systems for livestock housing. 1st ed. MidWest Plan
Service, Ames, IA. Pedersen, S. 2002. Paper no. 024178. Heat and moisture production for pigs on animal and
house level. In: ASAE Annual International Meeting; CIGR XVth World Congress, Chicago IL.
211
Table 1. Historic exterior temperature for Mason City, IA (43.1°N, 93.2°W)a Temperature,
Total 8,760 8672.4 87.6 a 1961–1990 based on (Kjelgaard, 2001)
212
Table 2. Hours and least square mean temperature below balance temperature for grow-finish building example when pigs are inside building. Temperature,
Total 1,063.2 -17,348.5 LS Mean Temperature, °C -16.3 Table 3. Values of key variables needed to calculate energy use for heating example grow-finish buildings when pigs are present. Variable Value Pigs 1,200 hd Body weight 85.3 kg Heat production 531.4 kJ/hd Minimum ventilation 283 L min-1 hd-1
AT/RT 4.43 MJ/hr-°C Exterior temperature -16.3°C Interior temperature 15.5°C
213
Table 4. Hours and least square mean temperature below balance temperature for grow-finish building example when pigs not in building. Temperature,
Total 47.8 -149.5LS Mean Temperature, °C -3.1 Table 5. Values of key variables needed to calculate energy use for heating example grow-finish building with no pigs present. Variable Value Pigs 0 Heat production 0 Minimum ventilation 650 L min-1
AT/RT 4.43 MJ/hr-°C Exterior temperature -3.1°C Interior temperature 10.0°C
214
Table 6. Hours and least square mean temperature for different cooling scenarios with pigs in barn
Ventilation Rate Increased to Maintain Room Temperature Temperature,
Total 13.2 185.7 LS Mean Temperature °C 14.1 Table 8. Summary of annual non-solar energy use for controlling thermal environment of a 1,200 head grow-finish swine facility in Mason City, Iowa Process Duration, hr Heat, GJ Electricity, GJ Heat for pigs 1,063.2 210.8 0 Maintain air quality for pigs 8,672.3 0 31.2 Cooling pigs 7,609.2 0 21.2 Maintain temperature of empty barn 47.8 1.7 0 Maintain air quality when barn empty 87.6 0 0.6 Totals for year 212.5 53.0
216
APPENDIX 2. CROP PRODUCTION MODEL
Corn grain is the single largest input into modern Iowa pig production. Marketing
grain through livestock has been and continues to be the primary destination for Iowa grain
crops (ICPB/ICGA, 2009). It is apparent that Iowa pig and crop production are linked.
However, crop production is rarely considered within the context of pig feed production. Pig
production decisions are often made without full consideration of the potential for crop pig
synergy. The following model was designed to evaluate crop management choices as they
pertain to production of pig feed. The crop production model was used to estimate non-solar
energy use and 100-yr global warming potential (GWP) of selected crops and cropping
sequences. Results from the crop production model are summarized and included for
reference purposes. Results from the described model can be linked with other information
on feed ingredient processing to generate life cycle assessments of Iowa pork production
systems as well as help evaluate crop management decisions within the context of pig feed
production.
MODEL DESCRIPTION AND ASSUMPTIONS
Table 1 presents initial conditions of the soil, annual inputs, and expected crop
production assumptions for the crop production model. The model assumes that growing
conditions for the various crops are ideal except for the absences of abundant nitrogen,
phosphorus, and potassium. Initial buffer pH of the soil was set at 6.5 with calcium carbonate
as limestone to be applied as needed to support crop production. The soil was assumed to
have an initial nitrate-nitrogen concentration (NO-3–N) of 0 ppm with additional synthetic
nitrogen applied to fields according to Iowa State University recommendations (ISU, 2003).
The crop production model assumed that soil began at the optimal concentration of
217
phosphorus and potassium and that those nutrients are applied at crop removal rates (Sawyer
et al., 2002). Anhydrous ammonia (NH3), diammonium phosphate (DAP), and muriate of
potash (MOP) were the primary synthetic source of nitrogen, phosphorus, and potassium
considered (Bhat et al., 1994). Diammonium phosphate delivers both phosphorus and
nitrogen. Credit was given for any nitrogen applied as DAP and subtracted from the amount
to be applied as NH3.
Chemical herbicide was used to address weeds in corn and soybeans. Annually, two
separate applications of herbicide were assumed for both corn and soybeans with application
rate and specific active ingredient used for each crop taken directly from USDA reports for
the state of Iowa (NASS, 2007). Chemical herbicide use by state is reported by the National
Agricultural Statistics Service of USDA (NASS, 2007). The most recent year compiled for
corn was 2005, during that year 4 active ingredients—atrazine, acetochlor, s. metolachlor,
and glyphosate—accounted for 87% of all herbicide applied to corn in Iowa (NASS, 2007).
The model assumes 1 application of a weighted-average mix of atrazine, acetochlor, and s.
metolachlor and a second application of glyphosate in corn. Soybean herbicide use in Iowa
was most recently compiled for 2006, during that year, glyphosate was applied to 97% of all
soybean acres receiving herbicide (NASS, 2007). The model assumes 2 applications of
glyphosate in soybeans. It is assumed that both corn and soybeans are glyphosate resistant
varieties. Application rates of specific active ingredients for each crop were taken directly
from USDA reports for Iowa (NASS, 2007) and scaled to the modeled area.
Average fuel requirements for farming tasks under typical conditions were the basis
for estimating diesel fuel use for field operations (Downs and Hansen, 1998; Hanna, 2001).
Road transportation of grain, oilseed, alfalfa hay, oat straw, and corn stover were also
218
estimated. It was assumed that a semi-tractor truck with appropriate trailer would be used to
haul harvest products an average of 3.2 km with an average fuel efficiency of 3.0 km/L of
diesel fuel. The model assumed a grain trailer with a volume of 33.3 m3 (Edwards and
Clarahan, 2008). A flat-bed trailer with usable cargo area of 7.3 3.0 3.0 m was modeled
for transporting large (2.4 1.2 0.9 m) square bales of hay, straw, and stover. All
calculations assume a trailer that is filled to capacity. Given standardized densities of
different grain crops (ASABE, 2008) and reported densities of various plant materials
(Börjesson, 1996; Peterolia, 2007) the mass of the loaded semi-tractor and trailer were within
Iowa legal weight limits (IDOT, 2007).
Transportation energy for all materials was calculated using mass at harvest moisture
content. With the exception of corn grain, all material was harvested at storage moisture
contents presented in table 1. As modeled, corn grain was harvested at an average moisture
content of 19.5% (grain production = 1.18 kg/m2) and transported to the on-farm grain
processing location. Corn grain typically requires additional drying following harvest. A 4%
reduction in mass through drying of corn using typical drying technology was included in the
model. The drying system is assumed to require 6.5 MJ/kg of mass reduction with 97% of the
energy coming from liquefied petroleum gas and the other 3% from electricity (Bern, 1998;
Wilcke, 2004).
The quality of stored grain is maintained by timely aeration to control temperature
and moisture content of the grain (MWPS, 1987; Wilcke and Morey, 2002). Grain is
consumed throughout the year and so less grain will need to be aerated in April compared to
December. Annual energy use for maintenance of stored grain quality for a commercial
(3,523.9 m3 or 100,000 bushel) grain storage unit was estimated taking into consideration
219
linearly decreasing grain stocks (MWPS, 1987; Wilcke and Morey, 2002). The model
assumes that each kg of grain produced requires 0.45 kJ of electricity to provide adequate
aeration for storage throughout the year.
It is well known that rotating crops affects production. Based on reports from Iowa
(Al-Kaisi et al., 2006b, a; Mallarino et al., 2006; Al-Kaisi and Licht, 2007b, a; Mallarino and
Licht, 2007; Al-Kaisi, 2008b, a) the crop model assumed growing corn in any of the 4 non-
continuous corn scenarios will result in an 11% increase in corn production compared to
continuous corn. The crop model also assumed growing soybeans in any rotation would
result in a 4% increase over growing soybeans continuously. For the rotations where
soybeans are grown less than every other year, annual production was assumed to increase by
8% over continuous soybeans (Mallarino and Licht, 2007).
The model assumes that oats will always be under seeded with alfalfa and that oat
production will not be affected by any of the examined rotations. The model assumes no
harvestable production of alfalfa during the establishment year. Production in the following
year is listed in table 1. Nitrogen fixing legumes can influence soil NO-3–N concentrations
experienced by following crops. It is assumed that a nitrogen credit of 4.5, 8.4, and11.2 g/m2
are provided to the subsequent crop of corn by soybeans, alfalfa planted with oats, and
established alfalfa. Complex crop rotations may encourage reduction of herbicide by
reducing the total area requiring a specific time-sensitive task such as cultivation of corn and
soybeans for early season weed control. Based on Leibman et al. (2008) the weed control
regime for the C-S-C-O-A rotation will include herbicide application on corn and soybean at
18% of the rate that is used otherwise accompanied by 1 rotary hoeing operation and 2 field
crop cultivations.
220
The energy used to manufacture a product or service can be referred to as the
embodied energy of that product of service. Embodied energy values of seed (Börjesson,
1996; Nagy, 1999; Hill et al., 2006), ground limestone (Hammond and Jones, 2008),
synthetic fertilizers and herbicides (Bhat et al., 1994) were used to estimate non-solar energy
use for crop inputs. These values were combined with fuel use for field operations,
transportation, and crop drying to calculate the total non-solar energy use of the different
crop sequences. Emission of greenhouse gases are directly linked to energy use but are
influenced by the mix of fuel types. Table 2 presents fuel use distribution and 100-year
global warming potential for crop production inputs.
Gross energy (GE) of all production represent the energy that could be gained by
simply combusting all grain, oilseed, and biomass produced by a given crop sequence. Net
energy (NE) represents the portion of GE that a pig actually uses for growth and maintenance
from a particular feedstuff (Ewan, 2001; Whittemore, 2006). Net energy most closely
represents the true energy value of a feedstuff relative to pig production and is the energy
value of most interest to swine nutritionists (Ewan, 2001; Whittemore et al., 2003;
Whittemore, 2006). Starch concentration is another important measure of a product’s
suitability for human food (Quezada-Cavillo et al., 2006) or pig feed (Sauber and Owens,
2001; Whittemore, 2006). Sauvant et al. (2004) presents the GE, NE available to growing
pigs, and the starch content of corn, oats, roasted soybeans, alfalfa hay, and wheat straw.
Wheat straw was assumed to be equivalent to oat straw in terms of GE for this analysis. Corn
stover was assumed to have a GE value of 14.2 MJ/kg at 15% moisture (Pordesimo et al.,
2005). It was assumed that oat straw and corn stover were of very limited value as food or
feedstuffs and that NE value and starch content was effectively zero. Crop production model
221
results and literature values were used to calculate GE, NE available to growing pigs, and
total starch production for each crop production sequence.
RESULTS
Table 3 presents the estimated annual inputs and crop production parameters for
individual crops within different crop sequences. Adding soybeans to the crop sequence
reduces anhydrous ammonia needs by 15% and increases grain and stover production relative
to continuous corn. With increasing crop production, diammonium phosphate and muriate of
potash use also increases. More complex crop rotations drastically reduce the amount of
anhydrous ammonia needed by corn. Although rotations that include oats and alfalfa also
require additional crop inputs, the total inputs per square meter of farmland in the more
complex rotations are less than the combinations of corn and soybeans. Production of corn
within more complex rotations increases the productivity of corn as compared to
monoculture, but productivity per area of total cropland decreases. For example, if 100 m2 of
cropland is available and it is managed as continuous corn, 70.84 kg of starch will be
produced. Alternatively if the 100 m2 of available cropland is managed under the corn-
soybean sequence starch production per m2 of corn planted increases, but total area planted to
corn decreases and only 39.49 kg of starch is produced. This illustrates the importance of
considering not only individual crops within a rotation, but also the total impact of a specific
crop sequence.
Calculated non-solar energy use and 100-year global warming potential for individual
crops within different crop sequences is presented as tables 4 and 5. Reducing crop inputs
reduces non-solar energy use and production of greenhouse gases. As expected growing corn
in more complex rotations reduces non-solar energy use and 100-year global warming
222
potential for corn production as compared to monoculture. Corn is the most energy intensive
crop considered. Thus as corn’s relative contribution to a sequence decreases, the non-solar
energy use for the entire crop sequence also decreases. For example, 100% of cropland in the
C-C sequence is devoted to corn production and the non-solar energy use of cropland
managed as continuous corn is 2.44 MJ/m2. Alternatively the C-C-S, C-S, and C-S-C-O-A
sequences assume 66, 50, and 40% of the total cropland area being devoted to corn
production. Non-solar energy use of managed cropland is 1.94, 1.56, and 1.43 MJ/m2 for the
C-C-S, C-S, and C-S-C-O-A sequences, respectively. One hundred-year global warming
potential follows the same trend of decreasing impacts per m2 of managed cropland for the
more complex sequences as compared to corn managed as a monoculture.
Information about individual crops managed within different crop sequences
presented in tables 3–5 is summarized in table 6. Table 6 presents production, non-solar
energy inputs, and 100-year global warming potential of 5 different crop sequences. Corn
delivers large amounts of material that is high in GE, NE, and starch content. Reducing
corn’s portion of available cropland by adding other crops to the sequence reduces overall
production of GE, NE, and starch. Corn is also the most non-solar energy intensive crop
examined and reducing the percentage of area devoted to corn production reduces non-solar
energy use and 100-year global warming potential of the entire cropping sequence.
Of greatest interest are the output ratios or yield results presented in table 6. Yield is
calculated by simply dividing a measure of output by a measure of input. Within industrial
agriculture, the concept of crop yield described as bushel/acre is strongly entrenched, but
may give a false sense of productivity. Although farmland is a limited resource that must be
considered, non-solar energy requirements for crop production may be even more finite.
223
Similarly, if financial incentives are offered or regulations are imposed to better manage
greenhouse gas emissions, a practical calculation of yield should relate production of
desirable end-products (NE or starch) per unit of undesirable co-products (greenhouse gas
production). Table 6 includes output ratios which relate GE, NE, and starch production to
non-solar energy use and 100-year global warming potential.
Gross energy is a measure of potential energy production that may be particularly
important for those focused on bio-fuels or production of other renewable energy resources.
However the focus of this paper is crop production in the context of producing feedstuffs for
pigs. Net energy is the reported measure of productivity that is of greatest interest to swine
nutritionists. Although pigs are not thought to have a starch requirement per se, starch is
often used as a measure of grain quality and suitability for nonruminant animals and is of
interest to nutritionists who work with livestock as well as human nutritionists.
Continuous corn produces the least NE per unit of non-solar energy or 100-year
global warming potential. The C-S sequence produces the most net energy per unit non-solar
energy. Continuous corn produces the most starch/MJ non-solar input and g CO2 equivalents.
Other than starch production, C-C is not as effective as the other sequences considered. The
C-S-C-O-A sequence produces the least amount of starch/ MJ non-solar energy and g CO2
equivalents. Management of alfalfa requires large amounts of energy-intensive field
operations and produces very little NE and no starch for pigs. The C-S-C-O sequence
captures many of the energetic benefits of the C-S-C-O-A sequence without devoting any
space to production of alfalfa. Because alfalfa is considerably less desirable as a feedstuff for
pigs compared to the other crops, the rotational benefits of alfalfa do not outweigh its
drawbacks in this analysis. Perennial crops such as alfalfa provide valuable services and
224
should be included in generalized crop sequences. However deriving maximal benefit from
forage crops requires inclusion of ruminant animals in the equation. Such analysis and
discussion is beyond the scope of this paper. It is important to note that the C-S and C-S-C-
O-A sequences perform similarly and that both are superior to C-C in terms of producing
both NE and GE/ MJ non-solar energy and g CO2 equivalents.
The C-S sequence produces the most NE/MJ non-solar energy input and g CO2
equivalents. The C-S-C-O sequence is the best alternative sequence in terms of starch and net
energy production per unit of non-solar energy input and g CO2 equivalents. A C-S-C-O-A
sequence may offer several advantages for systems that include ruminants, but in terms of
producing pig feed it is not as well suited as the C-S or C-S-C-O sequences.
REFERENCES
Al-Kaisi, M. 2008a. Long-term tillage and crop rotation effects on yield and soil carbon. Annual Progress Reports-2008, McNay Memorial Research and Demonstration Farm. Iowa State University, Ames, IA. Available online: http://www.ag.iastate.edu/farms/progress_report.php. Accessed: February 2, 2009.
Al-Kaisi, M. 2008b. Long-term tillage and crop rotation effects on yield and soil carbon. Annual Progress Reports-2008, Northwest Research and Demonstration Farm and Allee Demonstration Farm. Iowa State University, Ames, IA. Available online: http://www.ag.iastate.edu/farms/progress_report.php. Accessed: February 2, 2009.
Al-Kaisi, M., and M. Licht. 2007a. Long-term tillage and crop rotation effects on yield and soil carbon. Annual Progress Reports-2007, Northeast Research and Demonstration Farm. Iowa State University, Ames, IA. Available online: http://www.ag.iastate.edu/farms/progress_report.php. Accessed: February 2, 2009.
Al-Kaisi, M., and M. Licht. 2007b. Long-term tillage and crop rotation effects on yield and soil carbon. Annual Progress Reports-2007, Armstrong and Neely-Kinyon Research and Demonstration Farm. Iowa State University, Ames, IA. Available online: http://www.ag.iastate.edu/farms/progress_report.php. Accessed: February 2, 2009.
Al-Kaisi, M., M. Licht, and B. Larabee. 2006a. Long-term tillage and crop rotation effects on yield and soil carbon. Annual Progress Reports-2007, Northern Research and Demonstration Farm. Iowa State University, Ames, IA. Available online: http://www.ag.iastate.edu/farms/progress_report.php. Accessed: February 2, 2009.
225
Al-Kaisi, M., M. Licht, and B. Larabee. 2006b. Long-term tillage and crop rotation effects on yield and soil carbon. Annual Progress Reports-2007, Armstrong Research and Demonstration Farm. Iowa State University, Ames, IA. Available online: http://www.ag.iastate.edu/farms/progress_report.php. Accessed: February 2, 2009.
ASABE. 2008. Density, specific gravity, and mass-moisture relationships of grain for storage. ANSI/ASAE D241.4. American Society of Agricultural and Biological Engineers, St. Joseph, MI.
Bern, C. J. 1998. Preserving the Iowa corn crop: Energy use and CO2 release. Applied Engineering in Agriculture 14: 293-299.
Bhat, M. G., B. C. English, A. F. Turhollow, and H. O. Nyangito. 1994. Energy in synthetic fertilizers and pesticides: Revisited. ORN/Sub/90-99732/2. Oak Ridge National Laboratory, Oak Ridge, TN. U. S. Department of Energy, Washington D. C.
Börjesson, P. I. I. 1996. Energy analysis of biomass production and transportation. Biomass and Bioenergy 11: 305-318.
Downs, H. W., and R. W. Hansen. 1998. Estimating farm fuel requirements. No. 5.006. Colorado State University Extension, Fort Collins, CO. Available online: http://www.cde.state.co.us/artemis/ucsu20/ucsu2062250061998internet.pdf. Accessed: February 2, 2009.
Edwards, W., and M. Clarahan. 2008. Grain harvesting equipment and labor in Iowa. Ag Decision Maker. Iowa State University Extension Ames, IA. Available online: http://www.extension.iastate.edu/agdm/. Accessed: February 2, 2009.
EPA. 2008. eGRID subregion GHG output emission rates for year 2005. Washington, D. C. Available online: http://www.epa.gov/cleanenergy/energy-resources/egrid/index.html. Accessed: January 23, 2009.
Ewan, R. 2001. Chapter 5: Energy utilization in swine nutrition. In: A. J. Lewis and L. L. Southern (eds.) Swine nutrition. p 85-94. CRC Press, Boca Raton, FL.
Hammond, G., and C. Jones. 2008. Inventory of carbon and energy. Version 1.6a. Department of Mechanical Engineering, University of Bath, Bath, UK. Available online: www.bath.ac.uk/mech-eng/sert/embodied/. Accessed: February 2, 2009.
Hanna, M. 2001. Fuel required for field operations. PM 709. Iowa State University Extension, Ames, IA.
Hill, J., E. Nelson, D. Tilman, S. Polasky, and D. Tiffany. 2006. Environmental, economic, and energetic costs and benefits of biodiesel and ethanol biofuels. Proccedings of the National Academy of Sciences 103: 11206-11210.
226
ICPB/ICGA. 2009. Iowa corn production and use. Johnston, IA. Available online: http://www.iowacorn.org/cms/en/CornEducation/Corneducation.aspx. Accessed: March 22, 2009.
IDOT. 2007. Iowa truck informaton guide. Office of Motor Vehicle Enforcement, Des Moines, IA. Available online: http://www.iamvd.com/omcs/index.htm. Accessed: February 2, 2009.
IPCC. 2006. 2006 IPCC guidelines for national greenhouse gas inventories. Kamiyamaguchi, Japan. Available online: http://www.ipcc-nggip.iges.or.jp/public/2006gl/index.html. Accessed: January 14, 2009.
IPCC. 2007. Climate change 2007: The physical science basis. Intergovernmental Panel on Climate Change, Geneva, Switzerland.
ISU. 2003. Managing manure nutrients for crop production. PM 1811. Iowa State University Extension, Ames, IA.
Liebman, M., L. R. Gibson, D. N. Sundberg, A. H. Heggenstaller, P. R. Westerman, C. A. Chase, R. G. Hartzler, F. D. Manalled, A. S. Davis, and P. M. Dixon. 2008. Agronomic and economic performance characteristics of conventional and low-external-input cropping systems in the central corn belt. Agronomy Journal 100: 600-610.
Mallarino, A. P., and M. Licht. 2007. Effects of crop rotation and nitrogen fertilization of corn on yields of corn, soybean, and oats. Annual Progress Reports-2007, Northeast Research and Demonstration Farm Iowa State University, Ames, IA. Available online: http://www.ag.iastate.edu/farms/progress_report.php. Accessed: February 2, 2009.
Mallarino, A. P., E. Ortiz-Torres, and D. Rueber. 2006. Grain yield of corn, soybean, and oat as affected by crop rotation and nitrogen fertilization for corn. Annual Progress Reports-2005, Northern Research and Demonstration Farm. Iowa State University, Ames, IA. Available online: http://www.ag.iastate.edu/farms/progress_report.php. Accessed: February 2, 2009.
MWPS. 1987. Structures and environment handbook. 11th Revised ed. MidWest Plan Service, Ames, IA.
Nagy, C. N. 1999. Energy coefficients for agricultural inputs in Western Canada. Canadian Agricultural Energy End-Use Data Analysis Centre. Centre for Studies in Agriculture, Law, and the Environment, University of Saskatchewan, Saskatoon, SK.
NASS. 2007. Agricultural chemical use database. USDA-National Agricultural Statistics Service, Washington, D. C. Available online: http://www.pestmanagement.info/nass/. Accessed: February 2, 2009.
227
Peterolia, D. R. 2007. The economics of harvesting and transporting corn stover for conversion of fuel ethanol: A case study for Minnesota. Biomass and Bioenergy 32: 603-612.
Pordesimo, L. O., B. R. Hames, S. Sokhansanj, and W. C. Edens. 2005. Variation in corn stover composition and energy content with crop maturity. Biomass and Bioenergy 28: 366-374.
Quezada-Cavillo, R., C. C. Robayo, and B. L. Nichols. 2006. Chapter 8: Carbohydrate digestion and absorption. In: M. H. Stipanuk (ed.) Biochemical, physiological, and molecular aspects of human nutrition. p 168-199. Saunders, St. Louis, MO.
Sauber, T. E., and F. N. Owens. 2001. Chapter 35: Cereals and by-products for swine. In: A. J. Lewis and L. L. Southern (eds.) Swine nutrition. p 785-802. CRC Press, Boca Raton, FL.
Sauvant, D., J. M. Perez, and G. Tran (eds). 2004. Tables of composition and nutrition value of feed materials: Pigs, poultry, cattle, sheep, goats, rabbits, horses, fish. 2nd edition. Wageningen Academic Publishers Wageningen, NL.
Sawyer, J. E., A. P. Mallarino, R. Killorn, and S. K. Barnhart. 2002. A general guide for crop nutrient and limestone recommendations in Iowa. PM 1688. Iowa State University Extension, Ames, IA.
Whittemore, C. T. 2006. Chapter 8: Energy value of feedstuffs for pigs. In: I. Kyriazakis and C. T. Whittemore (eds.) Whittemore’s science and practice of pig production, 3rd edition. p 317-342. Blackwell Publishing, Oxford, UK.
Whittemore, C. T., M. J. Hazledine, and W. H. Close. 2003. Nutrient requirement standards for pigs. British Society of Animal Science, Penicuik, Scotland, UK.
Wilcke, B. 2004. Energy costs for corn drying and cooling. P102-2004-09. University of Minnesota Extension, St. Paul MN.
Wilcke, W. F., and R. V. Morey. 2002. Selecting fans and determining airflow for crop drying, cooling, and storage. FO-05716-GO. University of Minnesota Extension, St. Paul MN.
1 Values represent average production and total inputs for one calendar year of continuous corn, continuous soybeans, oats under seeded with alfalfa and alfalfa following establishment.
2 Based on Sawyer et al. (2002) unless otherwise stated. 3 Grain and harvestable biomass (corn stover, oat straw, alfalfa hay) equivalent to 180, 54,
120 bushel/acre and 4.0 ton/acre at 84.5, 87.0, 86.0, and 85.0% dry matter for corn, soybean, oat, and alfalfa respectively.
4 Corn grain will be dried to 84.5% dry matter for storage, all other crops are harvested at storage moisture content.
5 Assumes 15.24 cm of soil depth to be neutralized. 6 Nitrogen from PM 1811 ISU 2003. 7 Corn and soybeans are given as seed/m2; oats and alfalfa presented as g seed/m2. 8 Based on NASS (2007). 9 Active ingredient
229
Table 2. Fuel use distribution assumptions and 100-year global warming potential for crop production inputs.
1 C-C= continuous corn, C-S = corn-soybean; C-C-S = corn-corn-soybean; C-S-C-O = corn, soybean, corn, oat under seeded with alfalfa; C-S-C-O-A = corn, soybean, corn, oat under seeded with alfalfa, alfalfa hay
233
Table 6. Summary of production, non-solar energy inputs, and 100-year global warming potential for 5 crop sequences1. Sequence C-C C-S C-C-S C-S-C-O C-S-C-O-A Gross energy, MJ/m2 31.25 21.25 25.81 22.06 20.62 Net energy, MJ/m2 12.27 8.89 10.52 8.79 7.76 Starch, g/m2 708.40 394.95 526.60 432.94 346.35 Non-solar energy, MJ/m2 2.44 1.57 1.94 1.66 1.43 100-yr GWP2, g CO2 equivalents/m2
175.70 113.10 139.3 119.8 105.1
Output Ratios Gross energy : non-solar energy 12.81 13.54 10.95 13.29 14.42 Net energy : non-solar energy 5.03 5.66 5.42 5.29 5.43 Starch : non-solar energy 290.33 251.56 271.44 260.81 242.20 Gross energy : 100-yr GWP 0.18 0.19 0.19 0.18 0.20 Net energy : 100-yr GWP 0.07 0.08 0.07 0.07 0.07 Starch : 100-yr GWP 4.03 3.49 3.78 3.61 3.30
1 CC= continuous corn, C-S = corn-soybean; C-C-S = corn-corn-soybean; C-S-C-O = corn, soybean, corn, oat under seeded with alfalfa; C-S-C-O-A = corn, soybean, corn, oat under seeded with alfalfa, alfalfa hay
2 100-yr GWP = 100-year global warming potential
234
APPENDIX 3: PIG FEED INGREDIENT MANUFACTURING AND DELIVERY: PROCESS INVENTORY AND ASSUMPTIONS
This section examines the energy required to prepare a complete and balanced pig
diet at a commercial feed mill typical of Iowa including transportation distance and fuel
efficiency assumptions. The energy required to process corn, oats, and soybeans into primary
feed ingredients—ground corn, ground oats, roasted soybeans, soy oil, and soybean meal is
reported. The energetics of corn-grain ethanol and soy oil-based biodiesel in the context of
pig feedstuff creation is also reviewed. The energy and subsequent emissions of greenhouse
gases required to process, manufacture, or synthesize ground limestone, moncalcium
phosphate, phytase, L-lysine, and DL-Methionine are estimated based on reviewed literature.
Non-solar energy use and 100-yr global warming potential (GWP) are reported per kg of feed
ingredient or complete and balanced diet.
TRANSPORTATION AND DIET MIXING
Many pig diet ingredients are produced near the site of diet formulation and pig
production, some are not. The model assumes that transportation of distances 200 km
occurs via freight train. The energy intensity of moving freight via U.S. railroads is reported
as 0.2 kJ kg•km-1 (Davis et al., 2008). For transportation of distances < 200 km a semi-
tractor truck with fuel efficiency of 2.2 km/L is assumed (Davis et al., 2008). A reported 33.3
m3 trailer volume (Edwards and Clarahan, 2008) and 24,000 kg towing capacity are also
assumed. It is estimated that the energy intensity of moving freight via the described semi-
tractor and trailer is 0.7 kJ kg•km-1. Assumed transportation distances for each feed
ingredient are detailed in table 1. It is assumed that 100% of transportation fuel is diesel fuel.
235
Energy associated with weighing ingredients, moving ingredients and mixed diets
inside of the feed mill, and mixing of the final diet is assumed to originate as electricity.
Based on discussions with commercial feed mill operators and equipment manufacturers it is
estimated that all activities associated with mixing and moving material inside the feed mill
requires 2.1 kJ/kg.
PRIMARY FEED INGREDIENTS
Cereal grains such as corn and oats are almost always ground and mixed with other
ingredients before being fed to pigs. Reducing particle size of cereal grains to 600 m
results in improvements in nutrient digestion, absorption, and metabolism in pigs (Hancock
and Behnke, 2001). Reducing feed particle size to 400 m improves some measures of
productivity in growing pigs (Healy et al., 1994; Wondra et al., 1995a) and energy utilization
in lactating sows (Wondra et al., 1995c). However diets with particle size 400 m have also
been shown to increase the severity of stomach ulceration in finishing pigs (Wondra et al.,
1995a) and lactating sows (Wondra et al., 1995c). Flowability of finely ground diets can be
problematic, requiring more attention to adjustment of feeders. For this analysis it is assumed
that the target feed particle size is 600 m.
Although both hammermills and roller mills are common in the US feed industry,
roller mills offer several advantages in pig diet manufacture. Greater apparent nutrient
digestibility has been reported in finishing pigs fed corn ground using a roller mill compared
to hammermilled corn (Wondra et al., 1995b). It is also generally accepted that operation of
roller mills requires less energy/kg of feed processed compared to hammermills (Hancock
and Behnke, 2001). Wondra et al. (1995b) report energy use of 38.9 kJ/kg for a roller mill
compared to 51.2 kJ/kg for a hammermill when milling corn to a mean particle size of 400
236
m. Energy consumption by a commercial feed mill is expected to be considerably less per
kg of material ground. Based on discussions with commercial feed mill operators and
equipment manufacturers it is estimated that processing 1,000 kg of material to 600 m in a
commercial roller mill typical of what is used in Iowa for processing pig feed will require
15.6 MJ and 104 seconds.
Raw soybeans have been effectively fed to gestating sows (Crenshaw and Danielson,
1985). Other researchers have reported that finishing pigs fed diets containing amino acid-
supplemented raw soybeans perform similarly to pigs fed corn-soybean meal control diets
(Southern et al., 1990). Raw soybeans contain several anti-nutritional factors, particularly
trypsin inhibitors which disrupt protease activity and reduce protein digestion and utilization
(De Schutter and Morris, 1990; van Heugten, 2001). Simple heat treatment or roasting of raw
soybeans destroys the trypsin inhibitors and other anti-nutritional factors in soybeans (De
Schutter and Morris, 1990). Roasted, full-fat soybeans contain all the soy oil and amino acids
present in raw soybeans without the anti-nutritional factors. Feeding roasted, full-fat
soybeans—a high energy, amino acid rich feedstuff—to pigs results in equal or superior
performance to pigs fed soybean meal as a protein supplement (De Schutter and Morris,
1990). Based on conversations with commercial grain roasters it is estimated that processing
1,000 kg raw soybeans into roasted, full-fat soybeans requires 536.9 MJ energy from
liquefied petroleum gas (LP gas) and 37.0 MJ energy from electricity. Following roasting,
full-fat soybeans are ground before being mixed with other diet ingredients. As with corn and
oats, our model assumes that processing roasted, full-fat soybeans to 600 µm in a commercial
roller mill requires 15.6 kJ/kg of material.
237
Roasted, full-fat soybeans are not a common feedstuff for pigs in Iowa because of the
historic profit potential in separating soybean oil and meal. Soybean meal is often directed to
animal feed, but most soybean oil is marketed to higher value end-users. Processing soybeans
into soybean meal and soy oil is a multi-step process that requires significant amounts of
energy input (Erickson, 1995; Li et al., 2006; Dalgaard et al., 2008; Huo et al., 2008).
Efficiency of soybean processing plants is not 100% with literature values ranging from
78.6–82.0% for the conversion of soybeans into soybean meal (Woerfel, 1995; Li et al.,
2006; Dalgaard et al., 2008). Similarly 15.8–17.8% of a given mass of soybeans will be
manufactured into soy oil (Woerfel, 1995; Li et al., 2006; Dalgaard et al., 2008). For our
analysis we assume that 100 kg of soybeans will be processed into 80 kg soybean meal and
17 kg soy oil, with the remaining 3 kg being lost.
When a process has two or more usable products, the energy required for processing
is allocated between the products. Because this analysis is focused on pig feed production,
we will allocate processing energy based on net energy (NE) and mass of feedstuffs
produced. For example, processing 100 kg of soybeans results in 80 kg soybean meal with a
NE for growing pigs of 8.4 MJ/kg (Sauvant et al., 2004). In addition to soybean meal, 17 kg
soybean oil with a NE for growing pigs of 29.8 MJ/kg (Sauvant et al., 2004) is also
generated. Processing of 100 kg of soybeans into soybean meal and soy oil thus results in the
production of 1,178.6 MJ NE for growing pig. We attribute 57% of soybean production and
processing energy to soybean meal and 43% to soy oil based on the NE of the final product
mass. Literature values of energy use for processing of soybeans into soybean meal and
soybean oil range between 0.47 MJ/kg (Dalgaard et al., 2008) and 2.66 MJ/kg (Huo et al.,
2008). For this analysis we assume soybean processing requires 0.60 MJ/kg. This equates to
238
0.34 MJ/kg of soybean meal and 0.26 MJ/kg of soy oil. Following previous reviews (Li et al.,
2006; Dalgaard et al., 2008; Huo et al., 2008), we estimate that 91% of the energy associated
with soybean processing is LP gas and 9% is electricity.
BIOFUEL CO-PRODUCTS
The energy balance of biofuels is affected by the inputs required to produce raw
materials and how those raw materials are refined into biofuels. Clearly defining system
boundaries is essential for a meaningful discussion of biofuels. Our analysis of biofuel
production is focused on implications for pig diets. We assume that the raw materials used
for biofuel production are corn grain and soy oil for ethanol and biodiesel production
respectively. The co-product of ethanol fermentation is dried distiller’s grains with solubles
(DDGS). The co-product of biodiesel refining is crude glycerol. We assume that the corn and
soybeans are grown in a corn-soybean sequence. The cultivation and processing energy of
soybeans is divided between soy oil and soybean meal based on NE of the total mass of
products. Only the energy attributed to soy oil is included in the biofuel analysis. The
distribution of energy and 100-yr global warming potential for the production of biofuels
and their co-products is presented in tables 2 and 3.
Generating ethanol from corn grain and biodiesel from soy oil necessarily forgoes the
opportunity of feeding those feedstuffs to pigs. Thus when examining biofuels in the context
of pig feed production the cultivation energy of the feedstock, the processing energy of
converting the feedstock into biofuel and co-product, the energetic value of the biofuel and
co-product, and the NE of the feedstock not fed to pigs are considered. The NE of corn grain
and soy oil are 11.1 MJ/kg and 29.8 MJ/kg respectively (Sauvant et al., 2004) and our
analysis incorporates the NE opportunity cost of converting these materials into biofuels and
239
co-products as opposed to directly feeding corn or soy oil to pigs. We attribute 100% of the
NE of the feedstock not fed to pigs to ethanol and biodiesel. Dried distillers grains with
solubles and crude glycerol are co-product feedstuffs that would never be created except for
the production of ethanol and biodiesel. All other energy inputs are divided between the
biofuel and co-product based on proportion of useful energy in the final products.
The allocation of processing energy between biofuel and co-products influences the
energy balance of biofuel production (Shapouri et al., 2002; Hill et al., 2006; Huo et al.,
2008). For every 1,000 kg of corn entering ethanol processing facilities, 417.3 L ethanol is
generated and 303.6 kg DDGS is co-produced (ISU, 2008). The gross energy (GE) of corn-
grain ethanol is assumed to be 21.3 MJ/L (Hill et al., 2006) while the density is 0.80 kg/L
(Blei and Odian, 2000). The NE of DDGS when fed to pigs is 7.0 MJ/kg (Sauvant et al.,
2004). Thus processing 1,000 kg corn grain into ethanol and DDGS results in 11.0 GJ useful
energy (biofuel + coproduct). Of the total useful energy, 81% is attributed to ethanol with the
remaining 19% attributed to DDGS. Therefore 81% of the energy used during the production
process is allocated to ethanol and the remaining 19% is allocated to DDGS in our analysis.
Another important co-product of ethanol production is CO2 released during
fermentation. It has been reported that 23% of the total CO2 emissions from production of
ethanol is from the actual fermentation of feedstock and that 100% of emissions from
fermentation processes are captured (Möllersten et al., 2003). It has also been reported that
54% of the total CO2 emissions released during consumption of processing energy related to
corn grain ethanol production and fermentation of corn is captured (Möllersten et al., 2003).
Some biorefineries capture and sell CO2 from ethanol plants to the beverage industry or
manufacturers of dry ice (ISU, 2008; Vogel, 2008). This CO2 eventually makes its way to the
240
atmosphere and so is not sequestered, but rather delayed. Sequestration of CO2 by biofuel
producers is a prospect (Möllersten et al., 2003; Lindfeldt and Westermark, 2008) but no dry-
mill ethanol plant in Iowa reports capturing CO2 for long-term sequestration (IADNR, 2008).
Our analysis assumes zero net emissions of CO2 and other greenhouse gases from the actual
fermentation of corn grain. Our analysis does include emissions of greenhouse gases
associated with non-solar energy use in the processing of grain into ethanol and DDGS.
Estimated energy use for conversion of corn into ethanol and DDGS through the dry-
milling process range from 12.7–13.6 MJ/L ethanol (Shapouri et al., 2002; Hill et al., 2006).
Our analysis assumes 13.2 MJ/L of ethanol production. Energy used for production of
ethanol and its co-product is divided between thermal energy and electricity (Shapouri et al.,
2002). It is estimated 74% of the energy used for processing corn into ethanol and DDGS is
from LP gas and 26% is from electricity (Shapouri et al., 2002).
Processing soybean oil into biodiesel requires energy, reagents, and solvents and
results in co-production of crude glycerol (Hill et al., 2006; Huo et al., 2008). For every 1.0
kg of soybean oil processed, 1.0 kg of biodiesel and 0.1 kg co-products (glycerol, salts, and
other impurities) are generated (Huo et al., 2008). The mass of end-products is greater than
the mass of soybean oil entering the refinement process because of the addition of solvents
and reagents. Hill et al. (2006) included the production energy of solvents and reagents used
in biodiesel production and estimated that every 1.0 kg of soybean oil processed requires 1.0
MJ of steam energy and 0.1 MJ of electricity. This compares with the estimated 1.0 MJ of
natural gas and 0.05 MJ of electricity presented by Huo et al. (2008). For this analysis we
assume that each kg of soybean oil processed requires 1.0 MJ of natural gas and 0.1 MJ of
electricity. For every 1.0 L of biodiesel produced, it is estimated that 79 g of crude glycerol is
241
generated (Thompson and He, 2006). The GE of biodiesel used in previous analyses range
from 32.9 to 36.1 MJ/L (Hill et al., 2006; Huo et al., 2008). Our analysis assumes the GE of
biodiesel is 34.5 MJ/L. A reported density of 0.89 kg/Lwas also assumed for biodiesel (Huo
et al., 2008).
Crude glycerol is a substance that until recently received little attention as a feedstuff
for pigs in the United States. Lammers et al. (2008) reported a digestible energy (DE) value
of 14.0 MJ/kg. Net energy of crude glycerol fed to pigs has not been determined. The ratio of
NE to DE is variable for feedstuffs with a typical range of 0.68–0.72 (Whittemore et al.,
2003). A ratio of NE to DE of 0.71 is commonly used for conversion of DE to NE
(Whittemore et al., 2003). Multiplying the reported DE of crude glycerol (Lammers et al.,
2008) by 0.71 results in a predicted NE value that is similar to the theoretical NE value
calculated using prediction equations for swine feedstuffs (Sauvant et al., 2004). The NE of
crude glycerol fed to growing pigs is estimated as 9.9 MJ/kg in this analysis.
For every 1,000 kg of soybean oil entering biodiesel processing facilities, 890 L of
biodiesel and 70.3 kg of crude glycerol are produced. This results in the generation of 31.4
GJ useful energy (biofuel + co-product). Producing this useful energy requires 1.0 GJ of LP
gas and 0.1 GJ electricity. Based on useful energy generated, 98% of processing energy is
allocated to the biodiesel with 2% allocated to crude glycerol.
MICRO-INGRDIENTS
The mirco-ingredients—minerals, vitamins, sythetic amino acids, and enzymes—
typical account for 5% of the total mass of pig diets fed. Our analysis focuses on salt, ground
limestone, and monocalcium phosphate because those 3 ingredients account for most of the
mass among the micro-ingredients. The enzyme phytase and synthetic amino acids L-Lysine
242
and DL-Methionine are also included because they have an impact on nitrogen and
phosphorus utilization and cycling within pig production systems that is disproportionate to
their relative mass.
Ground limestone is added to pig diets as a source of Ca. The energy to produce 1.0
kg of ground limestone is reported as 2.5 MJ with 97% of the energy coming as LP gas and
the remaining 3% as electricity (LaHore and Croke, 1978). It is calculated that production of
ground limestone results in emission of 173.4 g CO2 equivalents (IPCC, 2006; EPA, 2008).
Salt is added to pig diets as a source of Na and as a stimulant of feed intake. The energy to
produce 1.0 kg of salt is reported as 1.6 MJ with 65% of the energy coming as electricity and
the remaining as LP gas (LaHore and Croke, 1978). Producing 1.0 kg of salt is calculated to
result in emission of 279.8 g CO2 equivalents (IPCC, 2006; EPA, 2008). The processing
energy values reported by LaHore and Croke (1978) are for feed production in Australia and
are more than 30 years old. It is assumed that techniques and efficiencies for limestone and
salt production in Australia are similar to Iowa. It is reasonable that incremental
improvements in processing efficiency have occurred over time. Because limestone and salt
require relatively little processing energy and comprise 5% of the diet, the error introduced
by using processing energy values from 1978 is assumed to be negligible.
Monocalcium phosphate, Ca(H2PO4)2, is a highly available inorganic source of
phosphorus (P) that is commonly used in pig diets. Environmental impact potential
associated with production of monocalcium phosphate (MCP) has been reported (Nielsen and
Wenzel, 2006). It is estimated that producing 1.0 kg of MCP requires 13.8 MJ of energy and
results in emission of 1,103.4 g of CO2 equivalents (Nielsen and Wenzel, 2006).
243
Plants incorporate P into their structures that are generally inaccessible to the
digestive tract of pigs. Feeding pigs the enzyme phytase enables utilization of plant source P.
This in turn allows reduction of inorganic P sources required to meet the needs of pigs and
reduces the excretion of P to the environment (Crenshaw, 2001; Wathes and Whittemore,
2006; Whittemore, 2006). Environmental impacts associated with production of a
commercial form of phytase—Ronozyme® P5000 CT—through fungal fermentation has
been examined (Nielsen et al., 2006; Nielsen and Wenzel, 2006). Impact values presented by
Nielsen and Wenzel (2006) take into consideration benefits derived from reduced use of
MCP. Use of the cradle-to-gate values presented by Nielsen et al. (2006) is more appropriate
for our analysis because it enables balanced comparison of more specific dietary formulation
strategies. Our analysis assumes that production of 1.0 kg phytase requires 40 MJ and results
in emission of 2,000 g CO2 equivalents (Nielsen et al., 2006).
Synthetic amino acids enable more precise matching of diet formulation with the
nutritional requirements of the pig. This in turn optimizes amino acid utilization and
minimizes excretion of nitrogen (N) by the pig. Lysine and methionine are generally the first
and second limiting amino acids in pig diets. This is because of the relatively low amounts of
these amino acids found in typical feed ingredients relative to the pig’s needs.
Commercial synthesis of L-lysine through bacterial fermentation is well established
with an estimated 800,000 metric tons produced annually (Anastassiadis, 2007). The process
of bacterial fermentation is widely understood and discussed (Hilliger et al., 1984; Gerhartz
et al., 1985; Anastassiadis, 2007). However information necessary to determine the energy
use and 100-yr global warming potential associated with L-lysine synthesis is generally
regarded as proprietary information. Thus a simplified model of L-lysine synthesis is
244
presented and used to estimate energy use and 100-yr global warming potential of this feed
ingredient.
Synthesis of L-lysine occurs through aerobic biosynthesis by selected strains of
bacteria (Gerhartz et al., 1985; Anastassiadis, 2007). There are four basic components of
bioreactors used for biosynthesis of L-lysine—a carbon rich substrate, a source of nitrogen,
selected strains of bacteria, and aeration (Hilliger et al., 1984; Anastassiadis, 2007). Molasses
and ethanol are the most common substrates for bacterial fermentation of L-lysine although
other carbon sources can be used (Hilliger et al., 1984). Our simplified model assumes that
ethanol (C2H6O) is the primary source of carbon and that anhydrous ammonia (NH3) is the
source of nitrogen (Anastassiadis, 2007). Identifying a specific microorganism for use in this
simplified model is not necessary, rather the authors assume a strain capable of yielding 45 g
L-lysine for every 100 g of ethanol is used. This yield falls within the range of reported
productivity for developed strains of microorganisms (Anastassiadis, 2007). Microbial
synthesis of L-lysine is an aerobic process (Hilliger et al., 1984; Anastassiadis, 2007). A
model for predicting energy use for aeration in L-lysine fermentation has been proposed by
Hilliger et al. (1984). If a 25 m3 commercial fermentation vat is used, the power input
necessary for maintaining aerobic conditions is estimated as 129.6 MJ/hr (Hilliger et al.,
1984). Continuous flow of the fermentation process has several advantages under
commercial production conditions (Anastassiadis, 2007) and our model assumes a
continuous flow process. Microbial fermentation is a biological process and thus necessarily
requires time. Based on literature reports it is assumed that 48 hours pass between the time a
particular molecule of ethanol enters the fermenter and its carbon atoms exit as L-lysine or
co-products of fermentation (Hilliger et al., 1984; Gerhartz et al., 1985; Anastassiadis, 2007).
245
Post-fermentation drying of the L-lysine fermentation broth is necessary to produce the solid
feed additive most commonly used in pig diets (Anastassiadis, 2007). Removal of water is
estimated to require 6.5 MJ/kg of water with 97% of the energy consumed as LP gas and the
remaining 3% as electricity (Bern, 1998; Wilcke, 2004). The 100-yr GWP of drying activity
is calculated as 0.44 kg CO2 equivalents per kg of water removed (IPCC, 2006; EPA, 2008).
The simplified model of L-lysine synthesis through bacterial fermentation is presented as
equation 1.
Equation 1: Simplified model of L lysine synthesis through bacterial fermentation
2,222 g C2H6O 232 g NH30.63 MJ aeration 1,000 g Lysine 6.5 g H2O
1,000 g Lysine 6.5 g H2O 0.04 MJ drying 1,000 g Lysine
The fermentation broth is generally maintained at a temperature of 31–33°C during
the entire process (Anastassiadis, 2007). This likely requires the input of some energy as
heat. It is also expected that energy from steam generated during the drying process is
recycled through the production cycle. Our simplified model assumes no inputs of energy for
heating fermentation broth and no recovery of steam generated energy. We estimate that
production of 1.0 kg of L-lysine requires 2,222 g (2.8 L) ethanol, 232 g anhydrous ammonia,
0.64 J of processing energy. The energy and 100-yr global warming potential associated with
production of anhydrous ammonia and ethanol were also included in the analysis. Production
of 2.8 L of ethanol from corn grain produced in a corn-soybean crop sequence was estimated
using previously described crop and biofuel production models. It is estimated that
cultivating and processing adequate amounts of corn to produce 2.8 L ethanol requires 40.20
MJ and results in emissions of 736.8 g CO2 equivalents. This estimate does not include the
246
portion of cultivation and processing energy that is allocated to the ethanol co-product,
DDGS or the NE of 6.6 kg corn not fed to pigs if processed into 2.8 L ethanol. Producing 232
g anhydrous ammonia is calculated to require 11.3 MJ (Bhat et al., 1994) and result in
emission of 762.4 g CO2 equivalents (Bhat et al., 1994; IPCC, 2006; EPA, 2008).
DL-methionine production through fermentation is possible, however no commercial
process utilizing fermentation has been developed due to problems associated with isolation
of appropriate strains of microbes (Gomes and Kumar, 2005; Kumar and Gomes, 2005). A
chemical process for production of DL-methionine has been recognized for more than 60
years (Goldsmith and Tishler, 1946) and is the exclusive method for production of DL-
methionine on a commercial scale (Binder, 2003). The chemical synthesis of 1.0 kg DL-
methionine is reported to require 88.0 MJ of energy, the vast majority being delivered as
petrochemical raw materials (Binder, 2003). Based on the assumption that 100% of the
petrochemical is delivered as LP gas, it is calculated that each 1.0 kg of DL-methionine
results in emmisison of 5,557.2 g CO2 equivalents (IPCC, 2006).
RESULTS
Table 4 presents energy use and resulting 100-yr global warming potential associated
with preparation and delivery of feed ingredients. Very little processing is required to prepare
corn and oats for inclusion in pig diets. Also because feed mills are typically located near the
site of grain and pig production, transportation energy for these feedstuffs is less than other
feed ingredients. The energy required to produce 1.0 kg of monocalcium phosphate, phytase,
L-Lysine, and DL-Methionine are several orders of magnitude larger than energy required to
produce primary feed ingredients like corn and soybean meal. Very small quantities of these
247
feed ingredients are used in typical pig diets and their inclusion usually results in nutrient
cycling impacts that exceed their relative contribution to the mass of the mixed diet.
CONCLUSIONS
The current inventory of manufacturing and processing energy of pig feed ingredients
is an initial step in improved analysis of the implications of pig diet choice in Iowa. This
inventory is by no means complete, but it can be linked with the previously described crop
production model (Lammers, 2009) to estimate the non-solar energy and 100-yr GWP
associated with pig feed production in Iowa. Refinement of this inventory and inclusion of
additional feed ingredients is desirable and should continue.
REFERENCES
Anastassiadis, S. 2007. L-Lysine fermentation. Recent Patents on Biotechnology 1: 11–24.
Bern, C. J. 1998. Preserving the Iowa corn crop: Energy use and CO2 release. Applied Engineering in Agriculture 14: 293-299.
Bhat, M. G., B. C. English, A. F. Turhollow, and H. O. Nyangito. 1994. Energy in synthetic fertilizers and pesticides: Revisited. ORN/Sub/90-99732/2. Oak Ridge National Laboratory, Oak Ridge, TN. U. S. Department of Energy, Washington D. C.
Binder. 2003. Life cycle analysis of DL-Methionine in broiler meat production. Amino News. Evonik Degussa GmbH, Available online: http://www.aminoacidsandmore.com. Accessed: March 7, 2009.
Blei, I., and G. Odian. 2000. General, organic, and biochemistry. W. H. Freeman and Compnay, New York, NY.
Crenshaw, M. A., and D. M. Danielson. 1985. Raw soybeans for gestating swine. Journal of Animal Science 60: 163–170.
Crenshaw, T. D. 2001. Chapter 10: Calcium, phosphorus, vitamin D, and vitamin K in swine nutrition. In: A. J. Lewis and L. L. Southern (eds.) Swine nutrition. p 187–212. CRC Press, Boca Raton, FL.
Dalgaard, R., J. Schmidt, N. Halsberg, P. Christensen, M. Thrane, and W. A. Pengue. 2008. LCA of soybean meal. International Journal of Life Cycle Assessment 13: 240–254.
248
Davis, S. C., S. W. Diegel, and R. G. Boundy. 2008. Transportation energy data book: Edition 27. ORNL-6981. Office of Energy Efficiency and Renewable Energy USDOE, Oak Ridge, TN.
De Schutter, A. C., and J. R. Morris. 1990. Chapter 43: Soybeans: Full-fat. In: P. A. Thacker and R. N. Kirkwood (eds.) Nontraditional feed sources for use in swine production. p 439–451. Butterworth Publishers, Stoneham, MA.
Edwards, W., and M. Clarahan. 2008. Grain harvesting equipment and labor in Iowa. Ag Decision Maker. Iowa State University Extension Ames, IA. Available online: http://www.extension.iastate.edu/agdm/. Accessed: February 2, 2009.
EPA. 2008. eGRID subregion GHG output emission rates for year 2005. Washington, D. C. Available online: http://www.epa.gov/cleanenergy/energy-resources/egrid/index.html. Accessed: January 23, 2009.
Erickson, D. R. 1995. Chapter 5: Overview of modern soybean processing and links between processes. In: D. R. Erickson (ed.) Practical handbook of soybean processing and utilization. p 56–64. AOCS Press and United Soybean Board, Champaign, IL.
Gerhartz, W., Y. S. Yamamoto, F. T. Campbell, R. Pfefferkorn, and J. F. Rounsaville (eds). 1985. Ulmann’s encyclopedia of industrial chemistry. 5th edition. VCH Publishers, Deerfield Beach, FL.
Goldsmith, D., and M. Tishler. 1946. The synthesis of DL-Methionine. Journal of American Chemistry Society 68: 144.
Gomes, J., and D. Kumar. 2005. Production of L-Methionine by submerged fermentation: A review. Enzyme and Microbial Technology 37: 3–18.
Hancock, J., D, and K. C. Behnke. 2001. Chapter 21: Use of ingredient and diet processing technologies (grinding, mixing, pelleting, and extruding) to produce quality feeds for pigs. In: A. J. Lewis and L. L. Southern (eds.) Swine nutrition. p 469–497. CRC Press, Boca Raton, FL.
Healy, B. J., J. D. Hancock, G. A. Kennedy, P. J. Bramel-Cox, K. C. Behnke, and R. H. Hines. 1994. Optimum particle size of corn and hard and soft sorghum for nursery pigs. Journal of Animal Science 72: 2227–2236.
Hill, J., E. Nelson, D. Tilman, S. Polasky, and D. Tiffany. 2006. Environmental, economic, and energetic costs and benefits of biodiesel and ethanol biofuels. Proccedings of the National Academy of Sciences 103: 11206-11210.
Hilliger, H., H. O. Möckel, and W. Forberg. 1984. The optimization of L-Lysine fermentation and a mass transfer model. Acta Biotechnology 4: 355–360.
249
Huo, H., M. Wang, C. Bloyd, and V. Putsche. 2008. Life-cycle assessment of energy and greenhouse gas effects of soybean-derived biodiesel and renewable fuel. Argonne National Laboratory, Argonne, IL. Available online: http://www.transportation.anl.gov/pdfs/AF/467.pdf. Accessed: February 6, 2009.
IADNR. 2008. 2007 greenhouse gas emissions from selected Iowa source categories. Iowa Department of Natural Resources, Des Moines, IA.
IPCC. 2006. 2006 IPCC guidelines for national greenhouse gas inventories. Kamiyamaguchi, Japan. Available online: http://www.ipcc-nggip.iges.or.jp/public/2006gl/index.html. Accessed: January 14, 2009.
ISU. 2008. Corn ethanol production. Iowa State University Extension, Ames, IA. Available online: http://www.extension.org/pages/Corn_Ethanol_Production. Accessed: March 2, 2009.
Kumar, D., and J. Gomes. 2005. Methionine production by fermentation. Biotechnology Advances 23: 41–61.
LaHore, R., and B. Croke. 1978. Energetics of stockfeed production. Animal Feed Science and Technology 3: 1–14.
Lammers, P. J. 2009. Energy and nutrient cycling in swine production systems. Appendix 2: Crop production model, Iowa State University, Ames, IA.
Lammers, P. J., B. J. Kerr, T. E. Weber, W. A. Dozier III, M. T. Kidd, K. Bregendahl, and M. S. Honeyman. 2008. Digestible and metabolizable energy of crude glycerol fed to pigs. Journal of Animal Science 86: 602-608.
Li, Y., E. Griffing, M. Higgins, and M. Overcash. 2006. Life cycle assessment of soybean oil production. Journal of Food Process Engineering 29: 429–445.
Lindfeldt, E. G., and M. O. Westermark. 2008. System study of carbon dioxide (CO2) capture in bio-based motor fuel production. Energy 33: 352–361.
Möllersten, K., J. Yan, and J. R. Moreira. 2003. Potential market niches for biomass energy with CO2 capture and storage—opportunities for energy supply with negative CO2 emissions. Biomass and Bioenergy 25: 273–285.
Nielsen, P. H., K. M. Oxenbøll, and H. Wenzel. 2006. Cradle-to-gate environmental assessment of enzyme products produced industrially in Denmark by Novozymes A/S. International Journal of Life Cycle Assessment OnlineFirst (DOI:http//dx.doi.org/10.1065/lca2006.265.2).
Nielsen, P. H., and H. Wenzel. 2006. Environmental assessment of Ronozyme® P5000 CT Phytase as an alternative to inorganic phosphate supplementation to pig feed used in
250
intensive pig production. International Journal of Life Cycle Assessment OnlineFirst (DOI:http//dx.doi.org/10.1065/lca2006.08.265.1).
Sauvant, D., J. M. Perez, and G. Tran (eds). 2004. Tables of composition and nutrition value of feed materials: Pigs, poultry, cattle, sheep, goats, rabbits, horses, fish. 2nd edition. Wageningen Academic Publishers Wageningen, NL.
Shapouri, H., J. A. Duffield, and M. Wang. 2002. The energy balance of corn ethanol: An update. Agricultural Economic Report No. 813. USDA, Office of Chief Economist, Office of Energy Policy and New Uses, Washington D. C.
Southern, L. L., J. E. Pontif, K. L. Watkins, and D. F. Coombs. 1990. Amino acid-supplemented raw soybean diets for finishing swine. Journal of Animal Science 68: 2387–2393.
Thompson, J. C., and B. B. He. 2006. Characterization of crude glycerol from biodiesel production from multiple feedstocks. Applied Engineering in Agriculture 22: 261–265.
van Heugten, E. 2001. Chapter 25: Mycotoxins and other anitnutritional factors in swine feeds. In: A. J. Lewis and L. L. Southern (eds.) Swine nutrition. p 563–583. CRC Press, Boca Raton, FL.
Vogel, S. 2008. Milton gas could end up in your soda: Ethanol plant will capture, sell CO2. Janesville Gazete, Janesville, WI. Available online: http://gazettextra.com/news/2008/feb/08/milton-gas-could-end-your-soda-ethanol-plant-will-/. Accessed: March 24, 2009.
Wathes, C., and C. T. Whittemore. 2006. Chapter 17: Environmental management of pigs. In: I. Kyriazakis and C. T. Whittemore (eds.) Whittemore’s science and practice of pig production, 3rd edition. p 533-592. Blackwell Publishing, Oxford, UK.
Whittemore, C. T. 2006. Chapter 12: Requirements for water, minerals, and vitamins. In: I. Kyriazakis and C. T. Whittemore (eds.) Whittemore’s science and practice of pig production, 3rd edition. p 404–416. Blackwell Publishing, Oxford, UK.
Whittemore, C. T., M. J. Hazledine, and W. H. Close. 2003. Nutrient requirement standards for pigs. British Society of Animal Science, Penicuik, Scotland, UK.
Wilcke, B. 2004. Energy costs for corn drying and cooling. P102-2004-09. University of Minnesota Extension, St. Paul MN.
Woerfel, J. B. 1995. Chapter 4: Harvest, storage, handling, and trading of soybeans. In: D. R. Erickson (ed.) Practical handbook of soybean processing and utilization. p 39–55. AOCS Press and United Soybean Board, Champaign, IL.
251
Wondra, K. J., J. D. Hancock, K. C. Behnke, R. H. Hines, and C. R. Stark. 1995a. Effects of particle size and pelleting on growth performance, nutrient digestibility, and stomach morphology in finishing pigs. Journal of Animal Science 73: 757–763.
Wondra, K. J., J. D. Hancock, K. C. Behnke, and C. R. Stark. 1995b. Effects of mill type and particle size uniformity on growth performance, nutrient digestibility, and stomach morphology in finishing pigs. Journal of Animal Science 73: 2564–2573.
Wondra, K. J., J. D. Hancock, G. A. Kennedy, K. C. Behnke, and K. R. Wondra. 1995c. Effects of reducing particle size of corn in lactation diets on energy and nitrogen metabolism in second-parity sows. Journal of Animal Science 73: 427–432.
252
Table 1. Estimated travel distance1 and mode of transportation for pig feed ingredients and finished diet in Iowa. Mode of Transportation Activity
Semi-tractor, Km
Railroad, km
Energy, kJ/kg
Grain delivery to feed mill 12 0 8.4 Roasted soybean delivery to feed mill 12 0 8.4 Soybean delivery to soybean processor 130 0 91.0 Soybean meal delivery to feed mill 100 0 70.0 Soy oil delivery to feed mill 100 0 70.0 Soybean oil delivery to biodiesel bio-refinery 0 0 0 Crude glycerol delivery to feed mill 100 0 70.0 Grain delivery to ethanol bio-refinery 48 0 33.6 DDGS delivery to feed mill 36 0 25.2 Ethanol delivery to amino acid processor 0 500 100.0 Synthetic amino acid delivery to feed mill 48 500 133.6 Ground limestone delivery to feed mill 75 0 52.5 Salt delivery to feed mill 75 0 52.5 Monocalcium phosphate delivery to feed mill 48 600 153.6 Phytase delivery to feed mill 48 700 173.6 Delivery of mixed diet to pig production site 12 0 8.4
1 Values are for round trip distance.
253
Table 2. Inventory of non-solar energy and 100-yr global warming potential associated with ethanol fermentation and dried distiller’s grains co-generation. Entire Process Ethanol DDGS Corn input, kg/kg DDGS 3.3 Biofuel output, L 1.4 Co-product output, kg 1.0 Useful energy output, MJ 36.8 29.8 7.0 Allocation of impacts, % 81 19 NE of corn not fed1, MJ 36.6 36.6 0 Production and delivery of corn2, MJ 6.3 5.1 1.2 Fermentation and drying3, MJ 18.5 15.0 3.5 Total non-solar energy input energy, MJ 61.4 56.7 4.7 Emissions from cultivation2, g CO2 equivalents 440.6 356.9 83.7 Emissions from delivery3, g CO2 equivalents 14.2 11.5 2.7 Total emissions, g CO2 equivalents 454.8 368.4 86.4
1 Attributed entirely to ethanol because DDGS is a co-product feed that would not be produced except for production of ethanol.
2 Non-solar energy and associated emissions used to grow, harvest, store, transport, and grind 3.3 kg corn planted in Corn-Soybean sequence with no harvesting of corn stalks.
3 Non-solar energy and associated emissions used to process 3.3 kg of ground corn into 1.0 kg DDGS and 1.4 L fuel ethanol.
254
Table 3. Inventory of non-solar energy and 100-yr global warming potential associated with biodiesel refining and crude glycerol co-generation. Entire Process Ethanol DDGS Soybean oil kg/kg crude glycerol 14.2 Biofuel output, L 12.7 Co-product output, kg 1.0 Useful energy output, MJ 448.1 438.2 9.9 Allocation of impacts, % 98 2 NE of soy oil not fed1, MJ 426.2 426.2 0 Production and delivery of soy oil2, MJ 96.2 94.3 1.9 Refining3, MJ 15.6 15.3 0.3 Total non-solar energy input energy, MJ 538.0 535.8 2.2 Emissions from cultivation2, g CO2 equivalents 7,186.0 7,042.3 143.7 Emissions from delivery3, g CO2 equivalents 1,228.5 1,203.9 24.6 Total emissions, g CO2 equivalents 8,414.5 8,246.2 168.3
1 Attributed entirely to biodiesel because crude glycerol is a co-product feed that would not be produced except for production of biodiesel.
2 57% of non-solar energy and associated emissions used to grow, harvest, store, transport, and process 83.6 kg soybeans planted in Corn-Soybean sequence into 14.2 kg soy oil and 66.9 kg soybean meal. Reported value excludes non-solar energy and associated emissions allotted to soybean mean (43% of total).
3 Non-solar energy and associated emissions used to process 14.2 kg of soy oil into 1.0 kg crude glycerol and 1.4 L biodiesel.
255
Table 4. Energy use and resulting 100-yr global warming potential associated with producing and delivering swine feed ingredients to feed mill and mixing formulated swine diets in Iowa. Ingredient
1 Does not include energy use or 100-yr global warming potential (GWP) associated with cultivation and storage of grains and oilseeds.
2 Values include energy and 100-yr GWP required to produce 3.3 kg corn grain in C-S sequence. Values exclude NE of 3.3 kg corn grain not fed to pigs, the gross energy of 1.4 L ethanol that is co-produced, and the potential displacement of other transportation fuels by ethanol. Values assume 0% capture of CO2 produced by fermentation.
3 Values include energy and 100-yr GWP required to production 14.2 kg soy oil from C-S sequence. Values exclude NE of 14.2 kg soy oil not fed to pigs, the gross energy of 12.7 L of biodiesel that is co-produced, and the potential displacement of other transportation fuels by biodiesel.
4 (LaHore and Croke, 1978). 5 (Nielsen and Wenzel, 2006). 6 (Nielsen et al., 2006). 7 (Binder, 2003).
256
ACKNOWLEDGEMENTS
While writing this dissertation and completing my formal degree I have been helped
and supported by many people along the way. First and foremost I want to thank Mark
Honeyman for being my major professor, mentor, and friend. I have learned and grown so
much over the last six years and your patience, compassion, guidance, and encouragement
have always been there for me and have enabled me to succeed. Without your support I never
would have never been able to complete this adventure, thank you for helping me discover
my calling.
Thank you to Jim Kliebenstein, my co-major professor and another excellent model
of a professional I want to emulate. Thank you to my committee Jay Harmon, Matt Helmers,
and Doug Kenealy. Your assistance and counsel have added greatly to this project and I have
learned a great deal from each of you. Appreciation is extended to Kent Berns, Tim Goode,
Dennis Shannon, Arlier Penner, Randy Breach, Lyle Rossiter, and Dave Stender for all the
assistance and reality checks they have brought to various projects over the years.
The Hatch Act, state of Iowa Funds, USDA Special Grants, USDA SARE, and the
Leopold Center for Sustainable Agriculture are gratefully acknowledged for their financial
support. Thank you to my collaborators particularly Brian Kerr, Tom Webber, Steven
Lonergan, and Kristjan Bregendahl. Thank you to Pat Horton for helping me keep all the
budgetary items in line and my stipend checks flowing. Thank you to Sally Medford for all
the assistance, support, and friendship over the years. Special thanks to Gretchen Zdorkowski
for her never-ending patience, consideration, and encouragement and for always being
willing to help me process and analyze life decisions and choices. Thank you to Kelly Cain
257
for the recognizing my potential and encouraging me to pursue graduate school as well as the
continued encouragement throughout the adventure.
Thank you to all my friends particularly Andy Heggenstaller, Mary Nyasimi,
Valentin Picasso, and Sarah Carlson for being the first peers to really help me begin to
understand sustainability and agricultural research and to Dave Correll, Devan McGranahan,
Stefans Gailans, Jessica Veenstra, Jen Burton, and Travis Cox for their friendship,
perspectives, challenges, and acceptance. Without this strong community of voices and
viewpoints the last six years would have not been nearly as productive or enjoyable. I have
been truly blessed to be a part of a very unique program for six years and have reaped
countless benefits and rewards for this association, thank you for being part of it. Thank you
to Jen Filipiak for helping me through the dissertation process, particularly these last few
very intense months.
Finally and most importantly, thank you to my family—Mom and Dad for their
unwavering belief in me and for always supporting my choices and encouraging me to
explore new opportunities even when they take me far from home. Thank you to my siblings
Beth, Steve, Katie, and her husband Brandon for their constant reminders that I am loved and
that a wonderful and very real world exists beyond the walls of my office. Thank you to
Grandpa Lammers for always telling me that I am much smarter than I really am and for
being a constant and steady reminder of the man I want to become. Thank you to Daryl and
Rae Ann Peterson, my appreciation for your friendship and love cannot be adequately
expressed in words. Finally thanks to Mariah, Douglas, Sally, Clint, and Amy for being a
constant reminder of what truly matters. You are all growing so fast and have so many
opportunities and promise, always remember your uncle Pete loves you!