31
Energy Considerations At Navy Restoration Sites FRTR Meeting – May 13, 2010 Kim Parker Brown, M.S., P.E.

Energy Considerations At Navy Restoration Sites
FRTR Meeting – May 13, 2010Kim Parker Brown, M.S., P.E.

2
Presentation Overview
• Green Sustainable Remediation (GSR) Drivers
• Navy GSR Drivers• Navy GSR Guidance
–Renewable Energy• Navy GSR Survey
Results
• Case Study 1: SiteWiseTM Analysis, NAS Alameda
•
Case Study 2: Former Live Impact Area (LIA) Vieques, Puerto Rico
•
Case Study 3: Bioventing System, Naval Air Station Whidbey Island, Washington
•
Case Study 4: Mobile Wind Turbine, Former Adak Naval Complex, AK
•
Case Study 5: Phytoremediation, NTC Orlando
• Lessons Learned• Navy TechVal Program• Conclusion & Summary

3
GSR Drivers
EO 13514 –
October 5, 2009 Federal Leadership in Environmental, Energy, and Economic Performance•
GSR related major elements: Improve energy efficiency; reduce GHG emissions, water consumption, waste generation; promote renewable energy, recycling, community enhancements
DoD Memorandum August 10, 2009 “Consideration of GSR practices in the Defense Environmental Restoration Program”•
Evaluate opportunities for GSR during all phases of remediation
•
Implement these opportunities when and where these makes sense
•
Track and report progress
4
Key Energy and GSR Driver
Executive Order 13423Signed on January 24, 2007, includes the following goals:
–
Energy efficiency to be improved and greenhouse gas emissions reduced by way of reduction in energy intensity by
(i) 3 percent annually through FY 2015 or (ii) 30 percent by FY 2015, relative to FY03 baseline.
–
50% of statutorily required renewable energy consumed has to come from new (new = renewables
placed in service
after Jan 1) renewable sources
5
Key Energy Driver - DOD Renewable Goal
Defense Authorization Act FY 2007SEC. 2852. DOD GOAL REGARDING USE OF RENEWABLE ENERGY TO MEET ELECTRICITY NEEDS:
•“…not less than 25 percent of total quantity of electric•energy within DOD facilities and activities during FY 2025 and thereafter from renewable energy sources (as defined in section 203(b) of the Energy Policy Act of 2005)…”
6
Navy GSR Guidance for Optimization Goals
Optimize the Remedy. An optimized remedy is a green and sustainable remedy. The Navy has been promoting remedy optimization for over a decade. Navy Optimization policy guidance documents are listed below:
•DON Policy for Optimizing Remedial and Removal Actions under the Environmental Restoration Program (DON, 2004),
•Guide for Optimizing Remedial Action Operations (Naval Facilities Engineering Command [NAVFAC], 2001),
•DON Guidance for Planning and Optimizing Monitoring Strategies (NAVFAC, 2008), and
•Guidance for Optimizing Remedy Evaluation, Selection and Design (NAVFAC, 2010).

7
Navy GSR Guidance: Documents
Updates to Navy Optimization guidance documents to include GSR principles are:
•
Guidance for Optimizing Remedy Evaluation, Selection, and Design (March 2010) Extensive updates and revisions have been made to the original 2004 version of this guidance and some of the more significant changes include incorporation of the following information: –
sustainability concepts to account for the overall environmental footprint of a remedial action
–
expanded view of the conceptual site model (CSM).
•
Guidance for Optimizing Remedial Action Operations - 2001 (currently being updated)
•
New Guidance for GSR, currently in development

8
Navy GSR Guidance: Renewable Energy
Commonly available on-site methods of supplying renewable energy to generate electricity to power remediation equipment:
•Photovoltaics: well suited for remediation systems because they can be used for small-scale applications as well as large scale application
–Ability to installed with battery systems to store energy during
sunny periods and use this stored energy during dark or cloudy periods.
–Ability to be tied into the power grid such that during periods where site demand exceeds what the PV system can provide, power is delivered from the grid to the site.
–When the PV system output exceeds the site demand, energy is transmitted from the PV system to the grid and the utility company gives credit to the PV system owner for this energy.

9
Navy GSR Guidance: GSR Web Portal
Web Portal Contains information regarding:•
GSR Fact sheet •
Resources
•
Tools (e.g., SiteWise™) •
Case studies• Educational Web Tool •
Contacts
10
Navy GSR Survey Responses: Low Energy Technologies
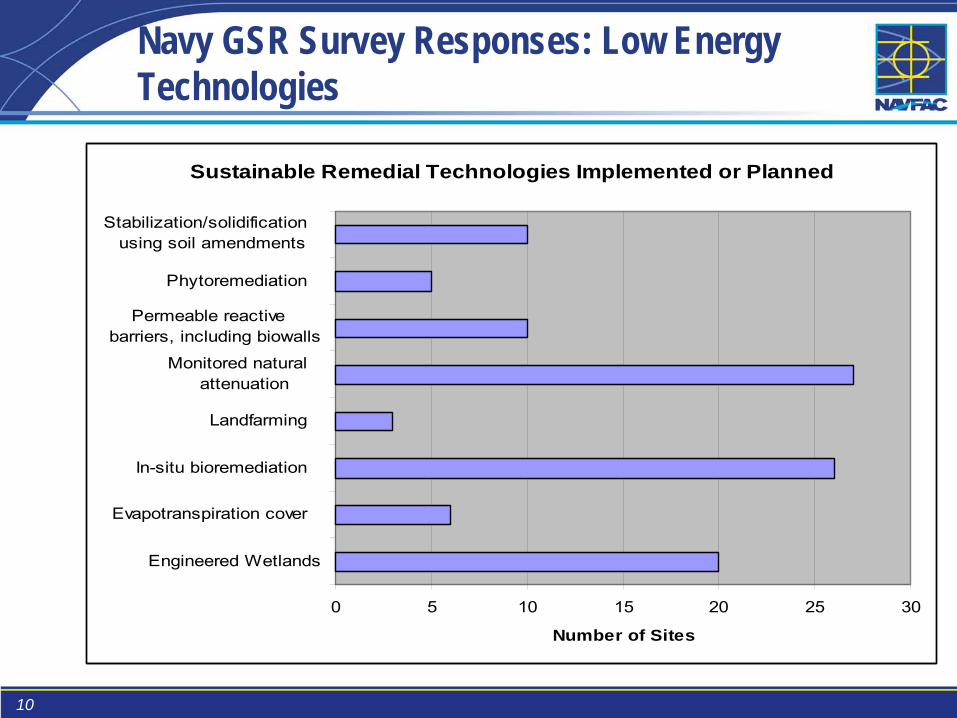
Sustainable Remedial Technologies Implemented or Planned
0 5 10 15 20 25 30
Engineered Wetlands
�Evapotranspiration cover
�In-situ bioremediation
�Landfarming
�Monitored naturalattenuation
�Permeable reactivebarriers, including biowalls
�Phytoremediation
�Stabilization/solidificationusing soil amendments
Number of Sites

11
Navy GSR Survey Responses, continued
Sustainable Actions Actual or Planned
0 5 10 15 20 25 30 35
�Preserved natural resources
�Minimized energy use and increased energy efficiency
�Minimized emissions, including greenhouse gases
�Minimized fresh water consumption or maximized waterreuse in treatment systems
�Maximized recycling, reuse, and reduction of materialsincluding waste
�Minimized negative ecological impacts
Number of Sites
12
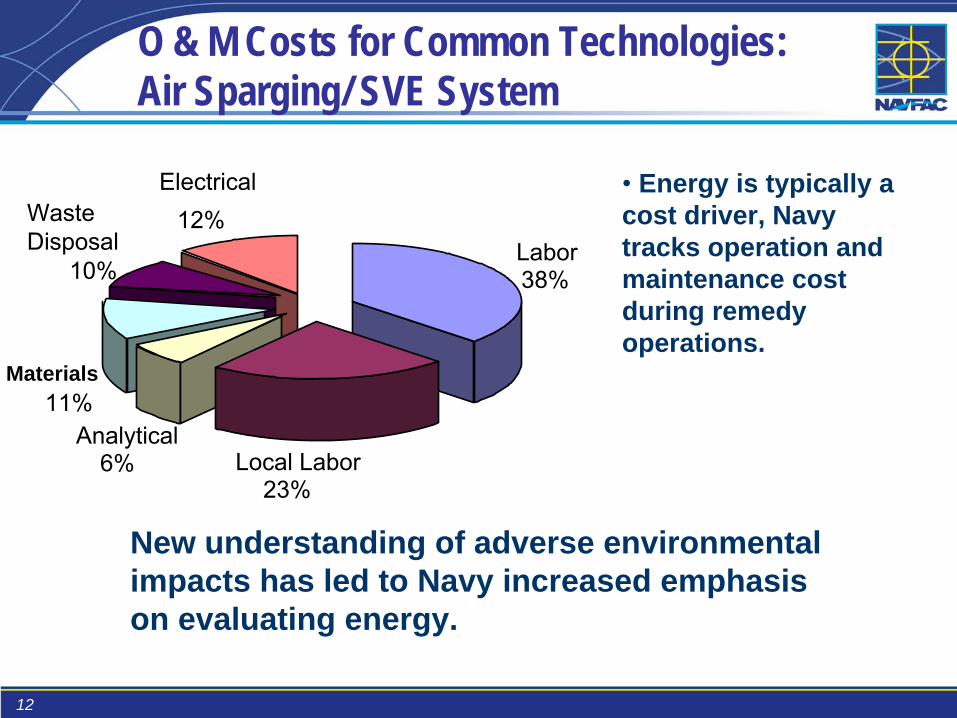
O & M Costs for Common Technologies: Air Sparging/ SVE System
Labor38%
Local Labor23%
Analytical6%
Materials11%
Waste Disposal
10%
Electrical12%
•
Energy is typically a cost driver, Navy tracks operation and maintenance cost during remedy operations.
New understanding of adverse environmental impacts has led to Navy increased emphasis on evaluating energy.
13
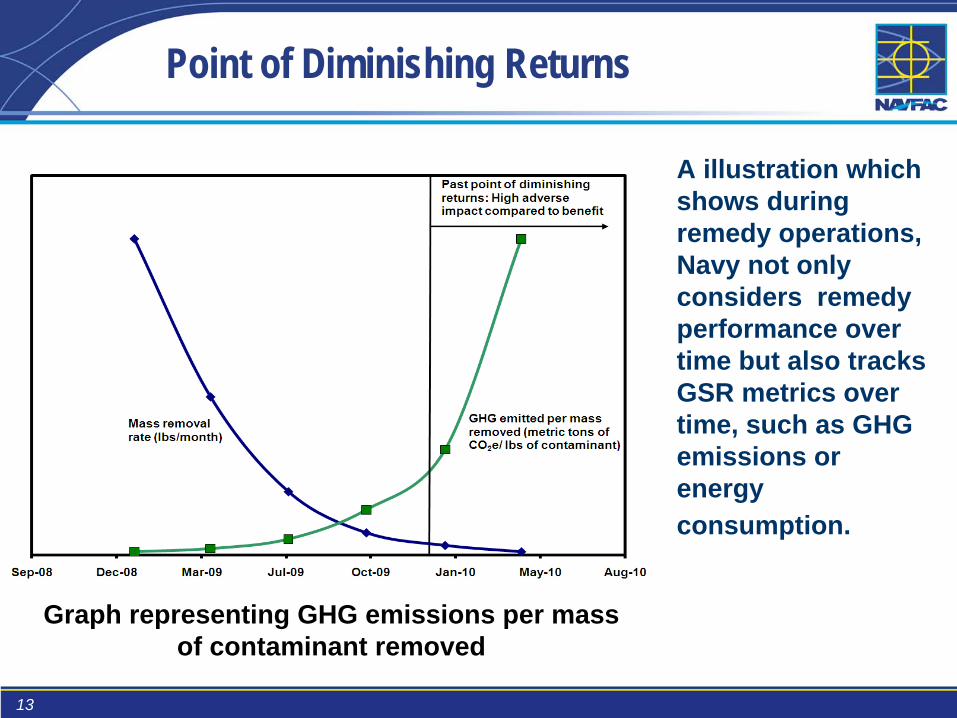
Point of Diminishing Returns
Graph representing GHG emissions per mass of contaminant removed
A illustration which shows during remedy operations, Navy not only considers remedy performance over time but also tracks GSR metrics over time, such as GHG emissions or energy consumption.

14
Case Study 1: NAS Alameda
•
Naval Air Station closed in 1997, now called Alameda Point
•
Navy’s BRAC PMO San Diego is responsible for remediation of all the sites / OUs.
•
Sustainability evaluation case study -
remediation alternatives for soil and groundwater at OU 2-C
•
Battelle conducted the case study using “SITEWISE TM”
tool.

15
Case Study 1: NAS Alameda Sustainability Evaluation of Remediation Alternatives for OU 2-C
•
Evaluation included remediation alternatives for soil and groundwater. Only alternatives for soil included in this presentation
•
Soil remediation alternatives–
S2: 4700 cu yd soil excavation & off site disposal, engineered cap, ICs, & monitoring
–
S3: 23,000 cu yd soil excavation & off site disposal, ICs, & monitoring–
S4: 11,000 cu yd soil excavation & off site disposal, SVE, ICs, & monitoring

16
Case Study 1: Evaluation Results for Soil Alternatives GHG Emissions
•
Calculate life cycle impacts from operation of remedy components and consumable materials
•
Impacts during equipment manufacturing / fabrication not included
•
For soil remedies, largest contribution to GHG emissions is CO2 from fuel consumption - equipment use, and transportation of materials
•
Alternative S3 has the highest soil excavation volume and GHG emissions ~ 1700 tons
S2 S3 S4

17
Case Study 1: NAS Alameda Energy Usage
•
Energy usage has same trend as GHG emissions
•
Energy usage is mostly from transportation fuels; reported in MWh
•
S3 has the highest energy usage due to transport of large quantity of soil S2 S3 S4

18
Case Study 1: NAS Alameda Relative Impacts for Soil Remedies
Alternative GHG Emissions
Energy Usage
Air Emissions Collateral Risk
S2 Low Low Low Low S3 High High High HighS4 Medium Medium Medium Medium
Relative ranking is compatible with evaluation of CERCLA nine criteria
19
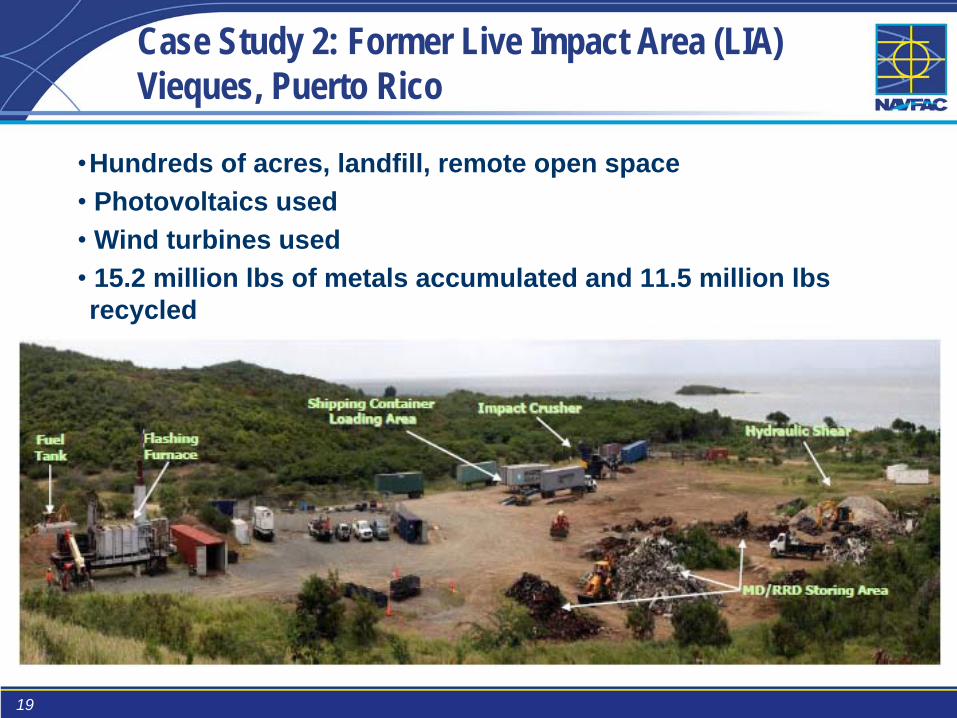
Case Study 2: Former Live Impact Area (LIA) Vieques, Puerto Rico
•Hundreds of acres, landfill, remote open space•
Photovoltaics used•
Wind turbines used•
15.2 million lbs of metals accumulated and 11.5 million lbs recycled

20
Case Study 3: Bio Venting System Installation Naval Air Station Whidbey Island, Washington
Contaminants: Total Petroleum Hydrocarbons
Technology: Passive BioventingDescription & GSR Actions: Navy is in the process of upgrading the fuel distribution center at NAS Whidbey Island. Upgrade compromises the demolition of 4 large existing fuel farms and construction of a single new fuel farm. The bioventing
system allows onsite management and treatment of the PCS, instead of hauling the soil off-site for treatment.
Once treated the soil can be reused as fill material.250 ,000 gallon UST was recycled to be used as containment structure for the bioventing
project. This was done by removing the top of the UST.
Cost Avoidance Measures Use of wind energy to provide forced air through the soil , for successful bioventing.

21
Case Study 4: Mobile Wind Turbine Former Adak Naval Complex, AK
•Remote area, multiple sites, free product
•
Mobile wind turbines used to generate power for remediation systems
•Some units were damaged when gale force winds unexpectedly hit site
•Whether temporary or permanent, plan equipment sizing for ‘worst case’
scenario
22
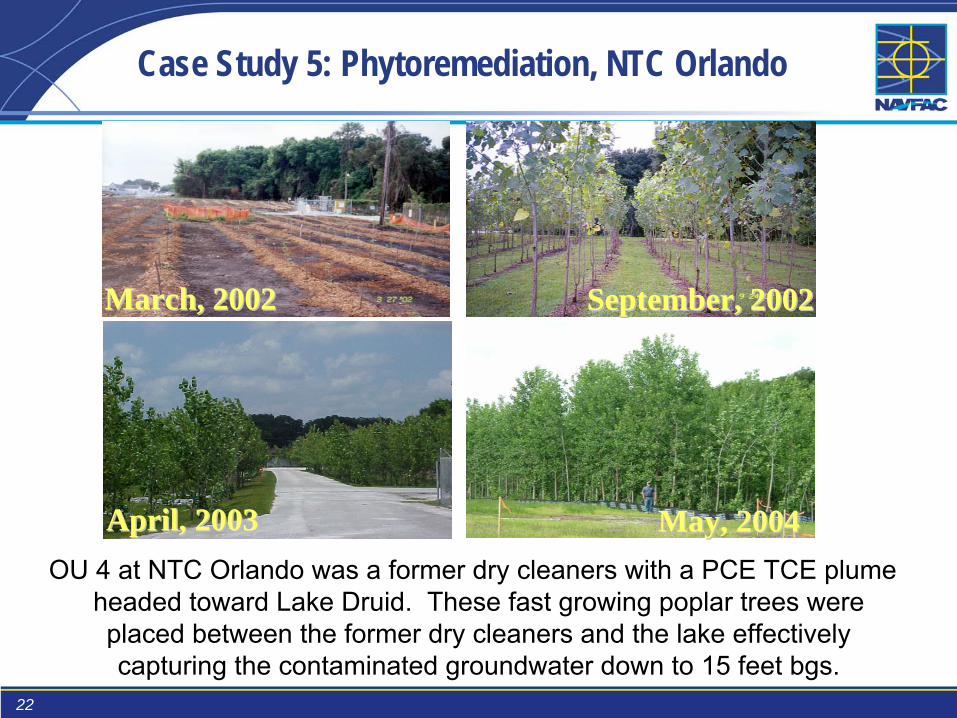
Case Study 5: Phytoremediation, NTC Orlando
OU 4 at NTC Orlando was a former dry cleaners with a PCE TCE plume headed toward Lake Druid. These fast growing poplar trees were placed between the former dry cleaners and the lake effectively capturing the contaminated groundwater down to 15 feet bgs.
March, 2002March, 2002 September, 2002September, 2002
April, 2003April, 2003 MayMay, 20042004

23
“Enhanced Bioremediation was selected as the groundwater remedy partially because it reduced energy requirements compared to more active remedial alternatives.” - Point Mugu Site 6/24
“Shut down energy intensive remedial systems that were not moving towards achieving RAOs and are re-evaluating site risks to develop a more appropriate remedy” - NAS North Island
“Considered power requirements and length of usage, and evaluated possible options” - Treasure Island Site 24
“Evaluated recycling the heat from the thermal unit to heat the Department of Fish and Game sheds. Was not employed because it was not economical.” - CAA C
Lessons Learned: Navy Survey November 2009
24
“Recycled recovered 40,000 lb petroleum product, which was ultimately used for make-up fuel (e.g., it was burned in a boiler).” - CAA 13, Bldg 530
“Considering energy requirements and transportation costs has been a component of NAVFAC Southwest's remedy selection and optimization processes for several years.”
“Considered using solar energy to run a SVE system. The alternative wasn't feasible due to required number of solar panels and cost.”- Former NSWC White Oak Site 4
Lessons Learned, continued

25
Exert pull on emerging technologies to achieve the energy reduction goals required EPAct 05 and by EO 13423.
Accelerate the adoption of new energy saving technologies by the Navy.
Reduce the risk and cost to the Navy of incorporating emerging energy technologies.
Field evaluate newer technologies to meet Navy performance requirements.
Demonstrate their reliability and supportability to the risk averse private sector (ESCOs and Utilities).
Demonstrate their reliability and supportability to risk averse DON users who have no resources to correct failures or respond to high utility bills.
Navy Techval
TECHVAL PROGRAM DESCRIPTION/PURPOSE

26
Navy TechVal -Green Light Technologies
•Airfield LED lighting
•Super T8 lighting
•Day Lighting
•Spectrally Enhanced Lighting
•Turbocor Chiller Compressor•Vending Miser•Cool Roof•Thermal Destratifiers•Heat Pipes•Duct Sealants
Cost Effectiveness less than 10 years, therefore the money saved from installation costs and energy savings, due to the use of these technologies, will pay for themselves in this timeframe.
Green Light Technologies Examples:

27
Navy Tech Val - Yellow Light Technologies
•Photo Luminescent Exit Signs
•Desuperheaters
•Sand Filters
•Dolphin Water Treatment
•LED folio Lighting•Boiler Combustion Controls•HVAC Occupancy Sensors•CO2 HVAC Control•Watt Warrior
Types of Technologies
Cost Effectiveness greater than 10 years, therefore the money saved from installation costs and energy savings, due to the use of these technologies, will pay for themselves between 10 to 15 years.

28
Conclusion
–
GSR is intended to be used as a set of optimization practices to augment remedial options so they are protective with respect to soil or ground water impacts
–
Navy will not use GSR to support “No Action” alternatives to avoid responsibilities
–
Navy seeks to apply GSR during all phases of remediation
–
Navy considering sustainability when developing performance objectives and exit strategies

29
Summary
•Alternative & Low Energy Technologies–Opportunities–Challenges–Cost considered–Sustainability improvement is focus

30
Key Points of Contact
•Kim Parker Brown, M.S., P.E.Naval Facilities Engineering Command Headquarters(NAVFAC HQ)(202) 685-0096 [email protected]
•Karla HarreNAVFAC Engineering Service Center (ESC)(805) [email protected]
•
Thomas SpriggsNAVFAC Atlantic(757) [email protected]

31
Thank You Any Questions?
The 'Green Hornet,' an F/A-18 Super Hornet powered by a 50/50 biofuel blend, Took off on Earth Day, April 22, at Naval
Air Station Patuxent River, Md.


