43
Energy Consumption Issues in Sensor Networks Cintia B. Margi CMPE259 – March 09th, 2005
| Date post: | 20-Dec-2015 |
| Category: |
Documents |
| View: | 212 times |
| Download: | 0 times |

Energy Consumption Issues in Sensor Networks
Cintia B. MargiCMPE259 – March 09th, 2005

2
SoE - UCSC
Outline• Energy Model for Communications
[MASCOTS04 paper]• Energy consumption for Processing
Tasks• Power TOSSIM [SenSys04]• Prediction-based energy map [Ad-hoc
Journal 05]• Energy Harvesting [ISLPED'03]

3
SoE - UCSC
Energy model for communication
• MASCOTS 04 paper by Cintia & Katia

4
SoE - UCSC
Energy model for communication
• Power-awareness in sensor networks:– MAC protocols: S-MAC [Ye02], TRAMA
[Rajendran03], T-MAC [vanDam03]– Directed Diffusion [Intanagonwiwat00],
aggregation [Solis04]
• QualNet, GloMoSim and ns-2:– Either do not model all the radio states– Or do not take proper accounting– Accounting done on different layers

5
SoE - UCSC
Energy model for communication
Related Work
• Measurements of energy consumed by NICs:– NICs in hand-helds [Stemm97]– WaveLAN laptops [Feeney01]
• Models– LEACH [Heinzelman00]– Sensor network lifetime [Bharwaj02]– Measure battery discharge to model
communications [Lochin03]

6
SoE - UCSC
Energy model for communication
Features
• Explicitly accounts for low-power radio modes.
• Considers the different energy costs associated with each one of the possible radio states.
• For example:State TR1000 WaveLAN
Transmitting 24.75 mW 1400 mWRx/overhearing/sensing 13.5 mW 900 mWIdle 13.5 mW 900 mWSleeping 15 uW

7
SoE - UCSC
Energy model for communication
Model
• Energy spent while in a given radio state y is:– Ey = Py * Ty
• Py = V * iy
• tx: Ty = PacketSize/TransmissionRate
• Otherwise, use a timer
• Implemented in GloMoSim and QualNet.

8
SoE - UCSC
Energy model for communication
Validation
• Sanity check: compare with original GloMoSim
• Testbed in S-MAC paper• More on MASCOTS04 paper

9
SoE - UCSC
Energy model for communication
Validation IEEE 802.11• Original vs. Instrumented GloMoSim• Simulation parameters:
– No mobility– CBR traffic node 0 to 2, data size is 200
bytes.– Duration is 250 seconds.– Energy parameters for radio: original
GloMoSim. Original (mJ) Instrumented (mJ)Node 0 224999.46 224999.46Node 1 224998.74 224998.74Node 2 224999.28 224999.28

10
SoE - UCSC
Energy model for communication
Validation S-MAC• Qualitative comparison:
– Simulation vs. testbed
• S-MAC protocol [Ye02]• 5-node 2-hop topology• App.: 10 x 380 bytes• Low power radio (TR1000)• Simulation/measurements
lasts enough time for all packets to be transmitted.

11
SoE - UCSC
Energy model for communication
Validation S-MAC
• Same behavior as results in [Ye02].
• Source: average nodes 0 & 1.

12
SoE - UCSC
Case Studies
• Protocol comparison:– 802.11 vs. S-MAC [MASCOTS 2004]
• Analytical Model Validation– Single-hop saturated IEEE 802.11 wireless
network [ICCCN 2004]

13
SoE - UCSC
Energy model for communication
802.11 vs. S-MAC• Parameters:
– 50 nodes– low power
radio (TR1000)– CBR with 10
sources, 380 bytes
– routing: AODV– Duration: 150s

14
SoE - UCSC
Energy model for communication
802.11 vs. S-MAC
TX RX Overhear Sensing Idle Sleep1
10
100
1000
Average Time per state (IAT = 1s)
802.11
S-MAC

15
SoE - UCSC
Energy model for communication
Summary
• Simple energy model for communication.
• Implemented at GloMoSim & QualNet.• Instrumentation provides complete
energy and time accounting per radio state.
• Useful tool to evaluate and understand power-aware protocols.

16
SoE - UCSC
Processing/sensing energy model
• ongoing work

17
SoE - UCSC
Processing/sensing energy model
• For simple sensors (e.g., temperature), energy consumed by communication subsystem dominates.
• However, for more sophisticated sensors, (e.g., accelerometers & magnetometers) this is not true [Doherty01].
• How about camera as sensors?

18
SoE - UCSC
Processing/sensing energy model
Related Work
• Energy savings due data compression [Barr03].
• Power management architecture for laptops [Balakrishnan01].
• Power Management in Wireless Networks [Zheng03].
• Energy budget (Great Duck Island deployment) [Mainwaring02].

19
SoE - UCSC
Processing/sensing energy model
Approach
• Energy cost based on tasks.• Energy measurements
– Current– Discharge rate

20
SoE - UCSC
Processing/sensing energy model
Testbeds• Dell laptops• Stargates• Motes

21
SoE - UCSC
Processing/sensing energy model
Methodology• Macroscopic view• Set of experiments:
– baseline system– processing (FFT)– disk access (dbench for laptops)– network transmission (Iperf for laptops)– Network reception (Iperf for laptops)
• Well-known benchmarks whenever possible.

22
SoE - UCSC
Processing/sensing energy model
Methodology - Laptops• Power Management: off• Use ACPI to obtain voltage & discharge rate.– Standard for power management– Define methods to read the parameters– Under Linux: /proc/acpi/– Everytime a “file” in /proc/acpi/ is read,
corresponding ACPI method is executed.

23
SoE - UCSC
Processing/sensing energy model
Methodology – Stargates & Motes• Stargates:
– measure current using power suply– use battery monitor chip– Vladi's project
• Motes:– measure current using power suply– Samit's project with motes

24
SoE - UCSC
Processing/sensing energy model
Results
Laptops:Task Av. Discharge RateBaseline 10.200 WFFT 25.047 WDisk 13.430 WTX 22.389 WRX 16.101 W
Stargates:Task CurrentIdle 475 mAFFT 735mATX 740mARX 700mAsleep 67mA
25
SoE - UCSC
Then what?
• From a complete energy consumption characterization, we can:– derive energy consumption prediction
model• application dependent• hardware dependent
– resource manager
26
SoE - UCSC
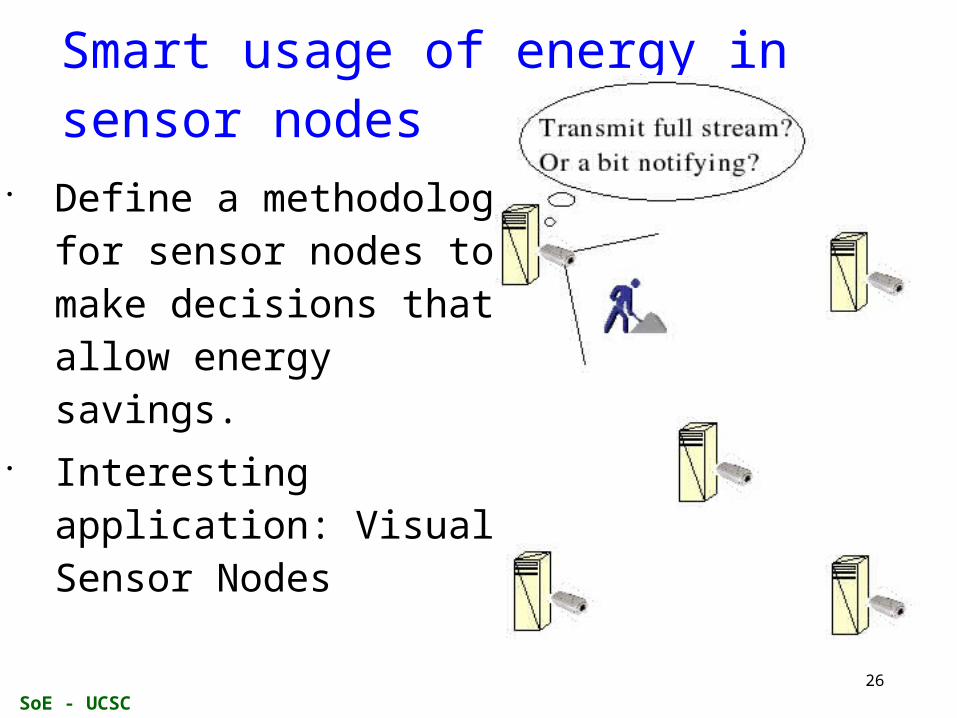
Smart usage of energy in sensor nodes
• Define a methodology for sensor nodes to make decisions that allow energy savings.
• Interesting application: Visual Sensor Nodes
27
SoE - UCSC
Power TOSSIM [SenSys04]

28
SoE - UCSC
Power TOSSIM [SenSys04]• extension to TOSSIM (TinyOS Simulator)
to include energy consumption;• add a module that keeps track of power
state;• modifications to other modules to report
transitions;• CPU energy usage -> estimate number
of cycles in AVR;• generate traces that will processed later.
29
SoE - UCSC
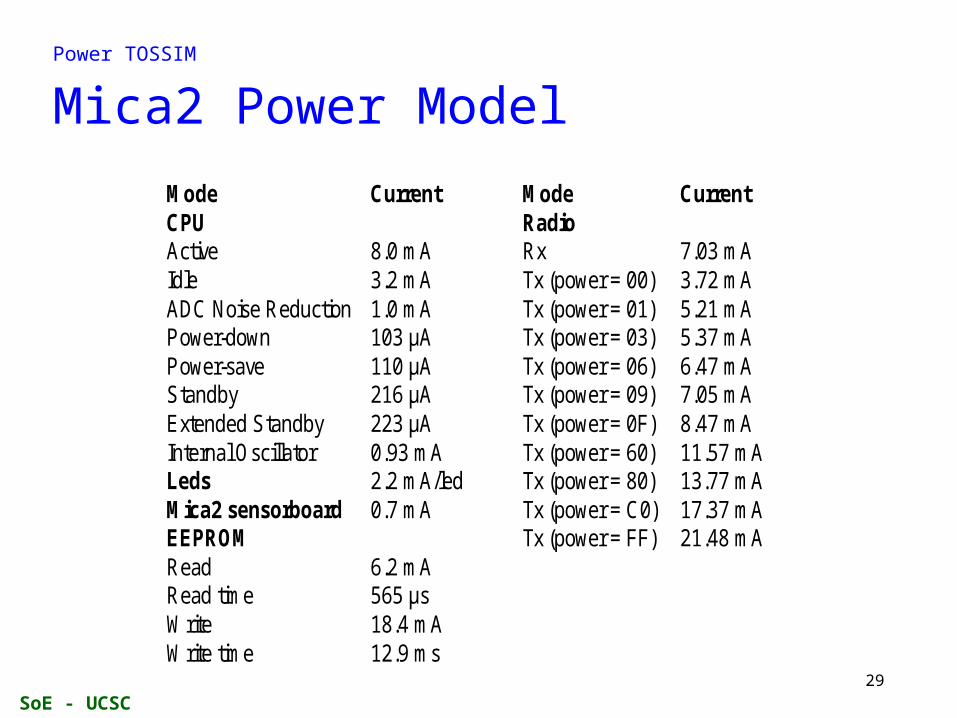
Power TOSSIM
Mica2 Power Model
Mode Current Mode CurrentCPU Radio Active 8.0 mA Rx 7.03 mAIdle 3.2 mA Tx (power = 00) 3.72 mAADC Noise Reduction 1.0 mA Tx (power = 01) 5.21 mAPower-down 103 µA Tx (power = 03) 5.37 mAPower-save 110 µA Tx (power = 06) 6.47 mAStandby 216 µA Tx (power = 09) 7.05 mAExtended Standby 223 µA Tx (power = 0F) 8.47 mAInternal Oscillator 0.93 mA Tx (power = 60) 11.57 mALeds 2.2 mA/led Tx (power = 80) 13.77 mAMica2 sensorboard 0.7 mA Tx (power = C0) 17.37 mAEEPROM Tx (power = FF) 21.48 mARead 6.2 mARead time 565 µsWrite 18.4 mAWrite time 12.9 ms

30
SoE - UCSC
Power TOSSIM
Benchmarks
Graph from slides used at SenSys04 by authors.
31
SoE - UCSC
Prediction-based energy map [Ad-hoc Journal 05]

32
SoE - UCSC
Prediction-based energy map [Ad-hoc Journal 05]
• Goal: – construct an energy map of a wireless
sensor network using prediction-based approach.
• Naive approach: nodes send periodically updates with its available energy to monitoring node.– Problem?

33
SoE - UCSC
Prediction-based energy map
Approach• Nodes send a message with current
energy available and parameters of energy dissipation model.
• Nodes send updates if prediction is off by a pre-determine threshold (e.g. 3%).

34
SoE - UCSC
Prediction-based energy map
Energy dissipation model• Probabilistic model based on Markov
chains;• node operation modes are the states;• transition probability matrix is
constructed based on the node past history;
• then can calculate energy dissipated based on time spent on each state.

35
SoE - UCSC
Prediction-based energy map
Diagram

36
SoE - UCSC
Energy Harvesting [ISLPED'03]

37
SoE - UCSC
Energy Harvesting [ISLPED'03]• Harvesting problem: problem of
extracting the maximum work out of a given energy environment.
• Goal: – learn about energy environment (energy
available and recharging capabilities);– use this info for task sharing among
nodes.

38
SoE - UCSC
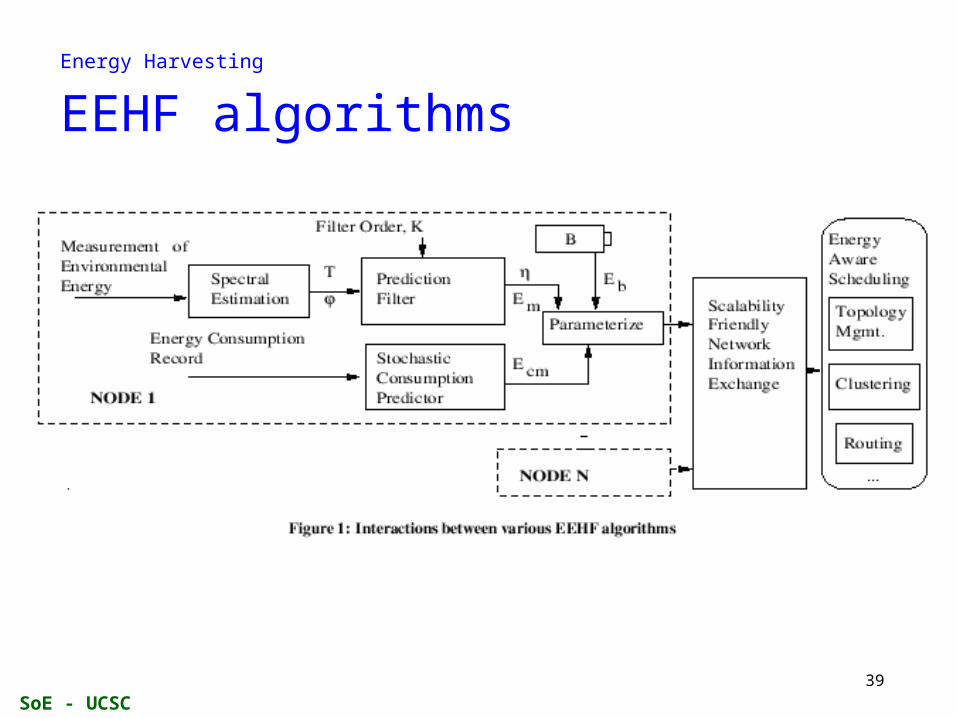
Energy Harvesting
Challenges• workload X recharging cycles;• residual energy is not enough info, so
need to know how recharging occurs:– needs to predict recharging opportunities,
otherwise consider only residual energy.
39
SoE - UCSC
Energy Harvesting
EEHF algorithms

40
SoE - UCSC
Energy sources
Paper: PicoRadio Supports Ad Hoc Ultra-Low Power Wireless Networking

41
SoE - UCSC
Energy sources
Microbial Fuel Cells • EcoBot II (http://www.ias.uwe.ac.uk/)
• Anode: bacteria found in sludge, act as catalysts to generate energy from the given substrate (flies or rotten apple);
• Cathode: O2 from free air acts as the oxidising agent to take up the electrons and protons to produce H2O.
• EcoBot I:• Anode: a freshly grown culture of E. coli fed
with refined sugar;• Catholyte: ferricyanide.

42
SoE - UCSC
Energy sources
Microbial Fuel Cells• MFC X Alkaline battery:
– single MFC: output voltage is 0.8V, capacity is 163mAh and energy is 37mWh. It weighs 100g and costs ~ £3.00.
– AA alkaline cell: output voltage of 1.5V, capacity of 2.8Ah and an energy is 4.2Wh. It weighs 25g and costs ~ £0.30.

43
SoE - UCSC
• Questions?


