Product quality optimization in an integrated biorefinery: Conversion of pistachio nutshell biomass to biofuels and activated biochars via pyrolysis Seçil Is ßıtan a , Selim Ceylan a,⇑ , Yıldıray Topcu a , Chloe Hintz b , Juliann Tefft c , Thiago Chellappa d,e , Jicheng Guo f , Jillian L. Goldfarb e,f,⇑ a Chemical Engineering Department, Faculty of Engineering, Ondokuz Mayıs University, 55139, Kurupelit, Samsun, Turkey b Department of Chemical Engineering, University of New Hampshire, 33 Academic Way, Durham, NH 03824, USA c Department of Biomedical Engineering, Boston University, 44 Cumminton Mall, Boston, MA 02215, USA d Department of Mechanical Engineering, Boston University, 110 Cummington Mall, Boston, MA 02215, USA e Department of Mechanical Engineering, Federal University of Rio Grande do Norte, 59078-970 Natal, RN, Brazil f Division of Materials Science & Engineering, Boston University, 15 St. Mary’s Street, Brookline, MA 02446, USA article info Article history: Received 14 June 2016 Received in revised form 6 September 2016 Accepted 8 September 2016 Keywords: Pyrolysis Bio-oil Biorefinery Activated carbon Biochar Optimization abstract An economically viable transition to a renewable, sustainable energy future hinges on the ability to simultaneously produce multiple high value products from biomass precursors. Though there is consid- erable literature on the thermochemical conversion of biomass to biofuels and biochars, there are few holistic examinations that seek to understand trade-offs between biofuel quality and the associated pyrolysis conditions on activated carbons made from the resulting biochars. Using an Ordinary Least Squares regression analysis, this study probes the impact of pyrolysis and activation temperature on surface areas and pore volumes for 28 carbon dioxide-activated carbons. Activation temperature has the largest single impact of any other variable; increasing the temperature from 800 to 900 °C leads to an increase in surface area of more than 300 m 2 /g. Contrary to some prior results, pyrolysis temperature has minimal effect on the resulting surface area and pore volume, suggesting that optimizing the temper- ature at which biofuels are extracted will have little impact on carbon dioxide-activated carbons. Increasing pyrolysis temperature increases methane formation but decreases gaseous hydrocarbons. Bio-oil obtained at lower pyrolysis temperatures shows fewer oxygenated compounds, indicating a greater stability, but higher pyrolysis temperatures maximize production of key biorefinery intermedi- aries such as furans. By analyzing data in such a holistic manner, it may be possible to optimize the production of biofuels and activated carbons from biomass by minimizing the amount of raw materials and energy necessary to maximize fuel quality, surface areas and pore volumes, thereby increasing the economic incentives for thermochemical conversion of biomass. Ó 2016 Elsevier Ltd. All rights reserved. 1. Introduction There is a global reliance on fossil fuels for the majority of worldwide energy generation, resulting in uncertainty about future energy supplies due to economic, political, and environmen- tal volatilities [1]. As the world shifts towards a renewable energy future, one of the most crucial areas to address is in energy for transportation. The United States Energy Independence and Security Act of 2007 Renewable Fuel Standard mandates that 16 billion gallons of cellulosic biofuel be blended into transportation fuels by 2022, a part of which must be biodiesel produced from biomass [2]. Moving beyond cellulosic ethanol, researchers are investigating various integrated pathways to produce renewable fuels, chemicals, and materials [3]. Thermal decomposition methods, including pyrolysis, are promising methods to deliver this biofuel from a variety of biomasses, including marine macroalgeto mitigate green tide issues [4]. Terrestrial sources such as olive pits have been shown to biofu- els and activated carbons while mitigating land disposal of car- bonaceous biomasses [5]. Unlike biological conversion processes, http://dx.doi.org/10.1016/j.enconman.2016.09.031 0196-8904/Ó 2016 Elsevier Ltd. All rights reserved. ⇑ Corresponding authors at: Division of Materials Science & Engineering, Boston University, 15 St. Mary’s Street, Brookline, MA 02446, USA (J.L. Goldfarb). E-mail addresses: [email protected](S. Ceylan), [email protected], [email protected](J.L. Goldfarb). Energy Conversion and Management 127 (2016) 576–588 Contents lists available at ScienceDirect Energy Conversion and Management journal homepage: www.elsevier.com/locate/enconman
Transcript
Energy Conversion and Management 127 (2016) 576–588
Seçil Is�ıtan a, Selim Ceylan a,⇑, Yıldıray Topcu a, Chloe Hintz b, Juliann Tefft c, Thiago Chellappa d,e,Jicheng Guo f, Jillian L. Goldfarb e,f,⇑aChemical Engineering Department, Faculty of Engineering, Ondokuz Mayıs University, 55139, Kurupelit, Samsun, TurkeybDepartment of Chemical Engineering, University of New Hampshire, 33 Academic Way, Durham, NH 03824, USAcDepartment of Biomedical Engineering, Boston University, 44 Cumminton Mall, Boston, MA 02215, USAdDepartment of Mechanical Engineering, Boston University, 110 Cummington Mall, Boston, MA 02215, USAeDepartment of Mechanical Engineering, Federal University of Rio Grande do Norte, 59078-970 Natal, RN, BrazilfDivision of Materials Science & Engineering, Boston University, 15 St. Mary’s Street, Brookline, MA 02446, USA
a r t i c l e i n f o
Article history:Received 14 June 2016Received in revised form 6 September 2016Accepted 8 September 2016
An economically viable transition to a renewable, sustainable energy future hinges on the ability tosimultaneously produce multiple high value products from biomass precursors. Though there is consid-erable literature on the thermochemical conversion of biomass to biofuels and biochars, there are fewholistic examinations that seek to understand trade-offs between biofuel quality and the associatedpyrolysis conditions on activated carbons made from the resulting biochars. Using an Ordinary LeastSquares regression analysis, this study probes the impact of pyrolysis and activation temperature onsurface areas and pore volumes for 28 carbon dioxide-activated carbons. Activation temperature hasthe largest single impact of any other variable; increasing the temperature from 800 to 900 �C leads toan increase in surface area of more than 300 m2/g. Contrary to some prior results, pyrolysis temperaturehas minimal effect on the resulting surface area and pore volume, suggesting that optimizing the temper-ature at which biofuels are extracted will have little impact on carbon dioxide-activated carbons.Increasing pyrolysis temperature increases methane formation but decreases gaseous hydrocarbons.Bio-oil obtained at lower pyrolysis temperatures shows fewer oxygenated compounds, indicating agreater stability, but higher pyrolysis temperatures maximize production of key biorefinery intermedi-aries such as furans. By analyzing data in such a holistic manner, it may be possible to optimize theproduction of biofuels and activated carbons from biomass by minimizing the amount of raw materialsand energy necessary to maximize fuel quality, surface areas and pore volumes, thereby increasing theeconomic incentives for thermochemical conversion of biomass.
� 2016 Elsevier Ltd. All rights reserved.
1. Introduction
There is a global reliance on fossil fuels for the majority ofworldwide energy generation, resulting in uncertainty aboutfuture energy supplies due to economic, political, and environmen-tal volatilities [1]. As the world shifts towards a renewable energyfuture, one of the most crucial areas to address is in energy fortransportation. The United States Energy Independence and
Security Act of 2007 Renewable Fuel Standard mandates that 16billion gallons of cellulosic biofuel be blended into transportationfuels by 2022, a part of which must be biodiesel produced frombiomass [2]. Moving beyond cellulosic ethanol, researchers areinvestigating various integrated pathways to produce renewablefuels, chemicals, and materials [3].
Thermal decomposition methods, including pyrolysis, arepromising methods to deliver this biofuel from a variety ofbiomasses, including marine macroalgeto mitigate green tideissues [4].
Terrestrial sources such as olive pits have been shown to biofu-els and activated carbons while mitigating land disposal of car-bonaceous biomasses [5]. Unlike biological conversion processes,
S. Is�ıtan et al. / Energy Conversion and Management 127 (2016) 576–588 577
pyrolysis enables conversion of the entire plant material as a feed-stock [6]. However, though pyrolysis is able to produce biofuelsand biochars from a variety of biomasses, there is little researchthat tackles a holistic optimization of the pyrolysis process interms of the quality of products produced. Rather, most studieson biomass pyrolysis optimization seek to maximize the quantityof each product produced, such as from laboratory-based studieson pertinent reaction conditions [7]. Other studies approach theintegrated biorefinery from an economic cost-benefit analysisusing ‘‘standardized” reaction conditions [8]. Some studiesapproach pyrolysis biorefinery optimization from the context ofthe supply chain [9]. Others probe the greenhouse gas emissionsfrom various pyrolysis options to find an optimized pathway thatreduces atmospheric impacts of fuel production [10]. Still otherspresent new systems technologies that can embrace many of theselatter aspects simultaneously [11]. While some studies go so far asto probe the optimal pyrolysis conditions for oil quality [12], none(that the authors could locate) probe the optimal conditions for allthree pyrolysis products – bio-oil, pyrolysis gas, and biochar –which likely hampers work that seeks to understand how to max-imize the pyrolysis process of an integrated biorefinery in terms ofall three products. Society is at a critical juncture in the globalquest for a renewable, sustainable future; with oil prices starting2016 under $30 per barrel, the economics of pyrolysis as a platformto bio-oils – even if the production of bio-oil can be lowered tobelow $26 per barrel [13] – is a hard sell. Additional revenuestreams, beyond biochars, must be created to make this environ-mentally attractive energy product more fiscally appealing.Improving techno-economic analyses for the design of efficientbio-refineries requires knowledge of the technical trade-offsbetween energy inputs, product yield, and product quality [14],the latter of which – after a comprehensive review of the literature– appears to be the most lacking.
Pyrolysis, or thermal decomposition in an oxygen-limited envi-ronment, yields three products in different ratios depending on theprocessing conditions: bio-oil, pyrolysis gas, and biochar [15].Pyrolysis removes volatiles, many of which contain heteroatoms,from a raw solid sample, increasing the relative carbon contentand creating voids, thereby developing the material’s porosity,and simultaneously evolving condensable and non-condensablefuels. Starting material, particle size, heating rate, pyrolysis tem-perature, hold time, and activation method are all factors thatinfluence the yields and properties of bio-oil, pyrolysis gas, andchars [16]. Different types of biomass contain different percentagesof hemicellulose, cellulose, lignin, and ash. Since these componentsvolatilize at different temperature ranges, the impact of increasingpeak pyrolysis temperature varies among feedstocks and products[17]. In general, the maximum liquid product yield from pyrolysisoccurs between 450 and 600 �C [18]. This depends on the specificprocess parameters employed, i.e. heating rate and energy input[19]. Liquid product compositions also depend on the biomasscharacteristics, i.e. particle size and biomass precursor [20].Though there is a significant amount of work done on what condi-tions optimize product yields from pyrolysis, there is less workdone on optimizing product quality. Therefore, this paper presentsa laboratory-based study on product quality optimization of a sam-ple biomass to encourage researchers to holistically consider biore-finery product quality in their process feasibility analyses.
Compounding the need to develop renewable fuels is to do so ina sustainable manner; an integrated approach to food, water andenergy security is necessary to address increasing global popula-tion, climate change, urbanization and overall increases in foodconsumption and standards of living [21]. Integrated systems –from small-scale bio-refineries to large-scale resource manage-ment integration – must be implemented to insure that our land,energy and water resources can sustain our global population
[22]. Such integrated solutions are said to be key to addressing glo-bal climate management strategies [23]. The World Health Organi-zation estimates that one-third of the world’s population, across allcontinents, currently suffers from varying degrees of water scar-city. With the accumulation of pollutants such as pharmaceuticals,organics, metals and other potentially hazardous compounds inwater, it is imperative to simultaneously develop a method toremove these contaminants that is inexpensive, effective, andeasily implementable. Adsorption using activated carbon is onepossible solution, the cost and environmental impact of whichcan be significantly reduced by using biomass waste as a precursor[24]. This integrated biorefinery proposed here produces high sur-face area activated carbons from the biochars resulting from pyro-lytic fuel extraction. The goal of this work is to determine if there isa trade-off between optimal pyrolysis temperatures for fuel extrac-tion versus activated carbon production.
The general method for the production of high surface area bio-chars via physical activation is well established [25]. Briefly, a mildoxidant, such as steam, air or carbon dioxide, can be used followingpyrolysis to increase porosity and surface area. The preliminarypyrolysis step removes a majority of the hydrogen and carbonatoms incorporated into the biomass structure [25]. Given theabundance of carbon dioxide as a product of fuel combustion, itsuse as an activating agent represents a reasonably sustainablematerial choice [26]. In this process, CO2 diffuses to the surface ofthe biochar’s walls, where an oxygen atom dissociates from CO2
and reacts with the carbon surface to form carbon monoxide [27].The CO is subsequently desorbed from the surface, further develop-ing the pore structure [28]. The rate of the carbon-carbon dioxidereaction is temperature-dependent [29]; the reaction is slow attemperatures below 800 �C, and temperatures exceeding 800 �Care generally required to achieve a sufficient rate of reaction [30].
Many groups have demonstrated the ability to activate bio-chars, including pistachio nutshells, using carbon dioxide. Forexample, Yang and Lua generated physically activated carbonsfrom pistachio shells using carbon dioxide as the oxidizing gas[31]. They suggested that pyrolysis conditions, prior to activation,impacted the properties of the resulting chars. However, in anotherpublication, this group found that the effect of pyrolysis tempera-ture was minimal beyond 400 �C; at pyrolysis temperatures of 250and 300 �C, the surface areas hovered around 350 m2/g; all the sur-face areas at pyrolysis temperatures of 400–1000 �C ranged from600 to 778 m2/g, with the highest surface area achieved at500 �C, and second highest (748.8 m2/g) at 900 �C [32]. To upgradecarbonaceous biochar to an activated carbon, Acikalin et al. studiedthe pyrolysis of pistachio shells at various nitrogen flow rates, peakpyrolysis temperatures, hold times, and heating rates [33]. Theyfound that conventional pyrolysis without activation yielded charswith relatively low surface areas (under 10 m2/g), but postulatedthat physical or chemical activation could provide the additionalsurface area and porosity needed to make pistachio shells a suit-able candidate for activated carbon applications. However, thereis no systematic work that probes the true impact of pyrolysisand CO2 activation conditions to determine the primary variablesresponsible for enhancing adsorptive surface areas of biochars.Furthermore, there is scant work that seeks to understand the bal-ance between pyrolysis temperature on biofuel manufacture andits impact on biochar production.
Studies such as this are important to the economical productionof biomass-based liquid and gaseous fuels, and activated carbons,in order to minimize energy, time, and materials requirements toproduce such sustainable fuels and materials. The current workpresents laboratory results from the pyrolysis and activation of pis-tachio shell biochars to develop an overall understanding of whichprocessing conditions present the optimal route to biofuel andactivated carbon production in terms of product quality. While other
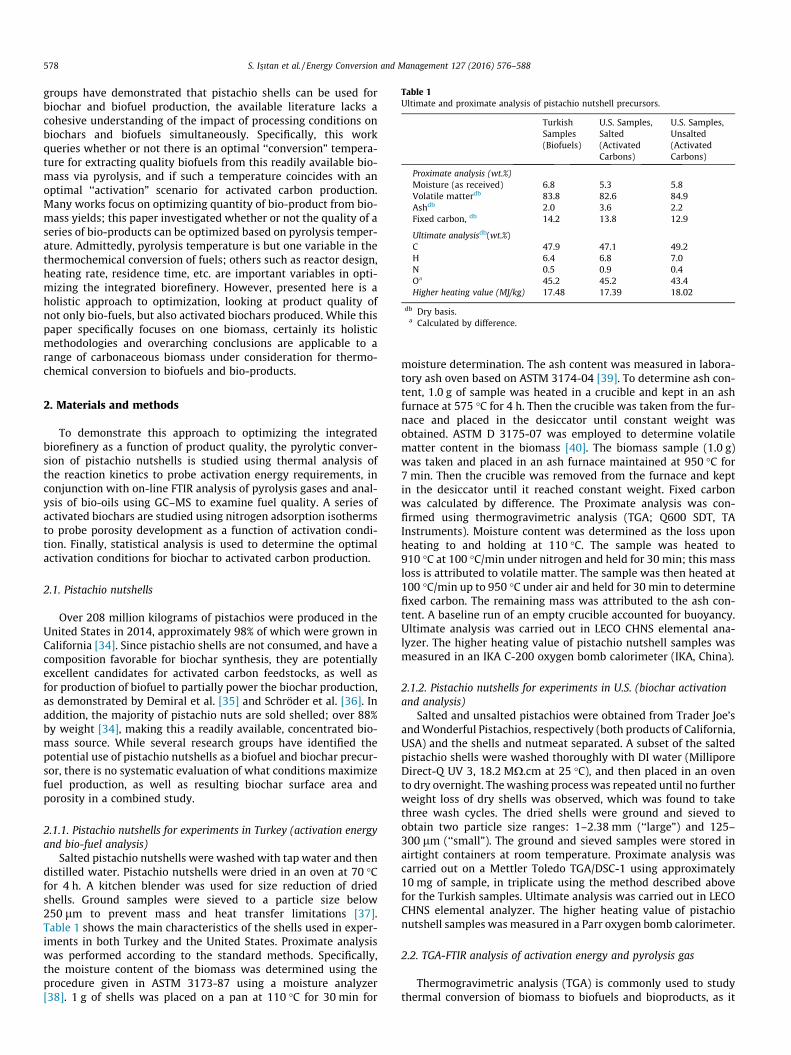
Table 1Ultimate and proximate analysis of pistachio nutshell precursors.
578 S. Is�ıtan et al. / Energy Conversion and Management 127 (2016) 576–588
groups have demonstrated that pistachio shells can be used forbiochar and biofuel production, the available literature lacks acohesive understanding of the impact of processing conditions onbiochars and biofuels simultaneously. Specifically, this workqueries whether or not there is an optimal ‘‘conversion” tempera-ture for extracting quality biofuels from this readily available bio-mass via pyrolysis, and if such a temperature coincides with anoptimal ‘‘activation” scenario for activated carbon production.Many works focus on optimizing quantity of bio-product from bio-mass yields; this paper investigated whether or not the quality of aseries of bio-products can be optimized based on pyrolysis temper-ature. Admittedly, pyrolysis temperature is but one variable in thethermochemical conversion of fuels; others such as reactor design,heating rate, residence time, etc. are important variables in opti-mizing the integrated biorefinery. However, presented here is aholistic approach to optimization, looking at product quality ofnot only bio-fuels, but also activated biochars produced. While thispaper specifically focuses on one biomass, certainly its holisticmethodologies and overarching conclusions are applicable to arange of carbonaceous biomass under consideration for thermo-chemical conversion to biofuels and bio-products.
2. Materials and methods
To demonstrate this approach to optimizing the integratedbiorefinery as a function of product quality, the pyrolytic conver-sion of pistachio nutshells is studied using thermal analysis ofthe reaction kinetics to probe activation energy requirements, inconjunction with on-line FTIR analysis of pyrolysis gases and anal-ysis of bio-oils using GC–MS to examine fuel quality. A series ofactivated biochars are studied using nitrogen adsorption isothermsto probe porosity development as a function of activation condi-tion. Finally, statistical analysis is used to determine the optimalactivation conditions for biochar to activated carbon production.
2.1. Pistachio nutshells
Over 208 million kilograms of pistachios were produced in theUnited States in 2014, approximately 98% of which were grown inCalifornia [34]. Since pistachio shells are not consumed, and have acomposition favorable for biochar synthesis, they are potentiallyexcellent candidates for activated carbon feedstocks, as well asfor production of biofuel to partially power the biochar production,as demonstrated by Demiral et al. [35] and Schröder et al. [36]. Inaddition, the majority of pistachio nuts are sold shelled; over 88%by weight [34], making this a readily available, concentrated bio-mass source. While several research groups have identified thepotential use of pistachio nutshells as a biofuel and biochar precur-sor, there is no systematic evaluation of what conditions maximizefuel production, as well as resulting biochar surface area andporosity in a combined study.
2.1.1. Pistachio nutshells for experiments in Turkey (activation energyand bio-fuel analysis)
Salted pistachio nutshells were washed with tap water and thendistilled water. Pistachio nutshells were dried in an oven at 70 �Cfor 4 h. A kitchen blender was used for size reduction of driedshells. Ground samples were sieved to a particle size below250 lm to prevent mass and heat transfer limitations [37].Table 1 shows the main characteristics of the shells used in exper-iments in both Turkey and the United States. Proximate analysiswas performed according to the standard methods. Specifically,the moisture content of the biomass was determined using theprocedure given in ASTM 3173-87 using a moisture analyzer[38]. 1 g of shells was placed on a pan at 110 �C for 30 min for
moisture determination. The ash content was measured in labora-tory ash oven based on ASTM 3174-04 [39]. To determine ash con-tent, 1.0 g of sample was heated in a crucible and kept in an ashfurnace at 575 �C for 4 h. Then the crucible was taken from the fur-nace and placed in the desiccator until constant weight wasobtained. ASTM D 3175-07 was employed to determine volatilematter content in the biomass [40]. The biomass sample (1.0 g)was taken and placed in an ash furnace maintained at 950 �C for7 min. Then the crucible was removed from the furnace and keptin the desiccator until it reached constant weight. Fixed carbonwas calculated by difference. The Proximate analysis was con-firmed using thermogravimetric analysis (TGA; Q600 SDT, TAInstruments). Moisture content was determined as the loss uponheating to and holding at 110 �C. The sample was heated to910 �C at 100 �C/min under nitrogen and held for 30 min; this massloss is attributed to volatile matter. The sample was then heated at100 �C/min up to 950 �C under air and held for 30 min to determinefixed carbon. The remaining mass was attributed to the ash con-tent. A baseline run of an empty crucible accounted for buoyancy.Ultimate analysis was carried out in LECO CHNS elemental ana-lyzer. The higher heating value of pistachio nutshell samples wasmeasured in an IKA C-200 oxygen bomb calorimeter (IKA, China).
2.1.2. Pistachio nutshells for experiments in U.S. (biochar activationand analysis)
Salted and unsalted pistachios were obtained from Trader Joe’sandWonderful Pistachios, respectively (both products of California,USA) and the shells and nutmeat separated. A subset of the saltedpistachio shells were washed thoroughly with DI water (MilliporeDirect-Q UV 3, 18.2 MX.cm at 25 �C), and then placed in an ovento dry overnight. Thewashing process was repeated until no furtherweight loss of dry shells was observed, which was found to takethree wash cycles. The dried shells were ground and sieved toobtain two particle size ranges: 1–2.38 mm (‘‘large”) and 125–300 lm (‘‘small”). The ground and sieved samples were stored inairtight containers at room temperature. Proximate analysis wascarried out on a Mettler Toledo TGA/DSC-1 using approximately10 mg of sample, in triplicate using the method described abovefor the Turkish samples. Ultimate analysis was carried out in LECOCHNS elemental analyzer. The higher heating value of pistachionutshell samples was measured in a Parr oxygen bomb calorimeter.
2.2. TGA-FTIR analysis of activation energy and pyrolysis gas
Thermogravimetric analysis (TGA) is commonly used to studythermal conversion of biomass to biofuels and bioproducts, as it
S. Is�ıtan et al. / Energy Conversion and Management 127 (2016) 576–588 579
combines information on the amount and rate of decomposition asa function of time and temperature. This, in turn, enables assess-ment of activation energies of pyrolysis, which can be used todesign thermochemical conversion systems to maximize productyield and minimize energy input [41]. While there are many mod-els available to calculate the activation energy, recent recommen-dations by the ICTAC Kinetics Committee suggest thatisoconversional methods that use at least three temperatures arepreferred as they overcome heating rate as an experimental vari-able [42]. Such methods are often based off of the Arrheniusequation:
k ¼ Ae�E=RT ð1ÞA is the frequency (or pre-exponential) factor, E the activationenergy, T the absolute temperature, R the universal gas constant,and k is the reaction rate constant. Nonisothermal TGA data aretransformed by defining the extent of conversion, x(t), as a functionof initial mass, mi, final mass, mf, and mass at any time t, mt:
XðtÞ ¼ mi �mt
mi �mfð2Þ
Common to many isoconversional methods is the assumption thatcountless reactions occur simultaneously during pyrolysis, and areall irreversible first order parallel reactions with different activationenergies. These combined reactions can be represented by a distri-bution function, f(E), often fit to a Distributed Activation EnergyModel (DAEM) [19]. The DAEM is widely used to determine thermaldecomposition kinetics of a range of carbonaceous samples, includ-ing oil shale and plastic mixtures [43], biomasses [44], coal and bio-mass mixtures [45], pure coals [46], as well as to study the stabilityof materials such as polymers [47]. The distribution function rou-tinely assumes the form [48]:
XðtÞ ¼ 1�Z 1
0exp �A
Z t
0exp � E
RT
� �dt
� �f ðEÞdE ð3Þ
When TGA experiments are conducted at several constant temper-ature ramp rates, b ¼ dT=dt, Eq. (3) can be written as:
XðtÞ ¼ 1�Z 1
0exp �A
b
Z t
0exp � E
RT
� �dT
� �f ðEÞdE ð4Þ
While it is commonly assumed that the function, f(E), is normallydistributed with average activation energy [49], Ea and a standarddeviation, r:
f ðEÞ ¼ 1r
ffiffiffiffiffiffiffi2p
p exp �ðE� EaÞ22r2
" #ð5Þ
Non-Gaussian distributions are sometimes used to represent f(E),including Weibull [50], Gamma [51], and Maxwell-Boltzmann dis-tributions [52]. While many variations of the DAEM consider thefrequency factor to be constant for all reactions; Miura and Maki[53] allow for a compensation effect between A and E through theirIntegral method. This frequency factor encompasses the collisionfrequency of molecules during a chemical reaction and the successof the collisions between those molecules to result in a reaction. Ittherefore depends on the number of molecules present in a controlvolume. As the number of molecules participating in pyrolytic reac-tions increases with temperature and yet decreases as volatiles arelost from the solid, it is intuitive that the frequency factor is adynamic variable across the range of conversion.
In addition to activation energy, the energy requirements ofpyrolysis as a function of temperature can be explored using differ-ential scanning calorimetry (DSC). This analysis was performed inthe U.S. on the Mettler-Toledo TGA-DSC1 at a heating rate of20 �C/min. The DSC was calibrated using both NIST-traceable goldand indium at rates of 5 and 20 �C/min. The analysis of gaseous
products released during pyrolysis was carried out using a TG–FTIRinstrument that consists of a thermogravimetric analyzer (TGAQ600 SDT, TA Instruments) and a Fourier-transform infrared spec-trometer (BRUKER TENSOR 27 FTIR). The sample was heated fromroom temperature to 800 �C under high purity nitrogen flowingrate at 80 mL/min and a heating rate of 20 �C/min. The stainlesssteel transfer pipe and the gas cell in the FTIR were both heatedat a constant temperature of 200 �C to prevent gas condensationand minimize secondary reactions. The volatiles evolved duringpyrolysis were detected simultaneously by FTIR. The IR spectrawere recorded at 4000–400 cm�1 with a resolution of 1 cm�1.
2.3. Bio-oil analysis
Bio-oil was collected by condensing pyrolysis vapors exiting thefixed bed reactor into dichloromethane (DCM) at 0 �C. The DCM-bio-oil was separated using a rotary evaporator, and then thebio-oil was re-diluted in a known amount of DCM for analysis.Analysis was performed on an Agilent 5975C gas chromatograph-mass spectrometer using a 30 m HP-5MS column with a 0.25 lminner diameter. A 1 lL injection volume with a 10:1 split ratiowas used. The initial oven temperature was 80 �C with 0 min holdtime; the temperature was ramped at 10 �C/min to 200 �C and therate of temperature increased was slowed to 5 �C/min up to 300 �C,with a hold time of 10 min and helium pressure of 188.7 kPa psi(total flow of 25 mL/min) for a total run time of 42 min. The instru-ment employed an FID detector with H2 flow of 35 mL/min, Air at350 mL/min and heater set at 260 �C. The ion source of the massspectrometer was set at 230 �C. Spectra were taken in the 50–550 m/z mass range over a 42 min total run time.
2.4. Preparation of activation carbons from pistachio nutshells
Two porcelain boats were filled with approximately 2 g of raw,ground pistachio nutshells. The boats were placed in a 100 quartztube, which was inserted into a Lindberg/Blue Mini-Mite Tube Fur-nace. The samples were heated to 110 �C at 10 �C/min and held atthat temperature for 60 min to remove moisture. Next, the samplewas heated from 110 �C to a peak pyrolysis temperature of either450 �C, 550 �C or 650 �C at a heating rate of 10 �C/min, and heldat peak temperature for 45 min. Throughout this process, nitrogengas (99.999%) flowed through the tube at approximately 150 mL/min. After pyrolysis, the sample was cooled under nitrogen to roomtemperature, and then reheated at a rate of 10 �C/min to a peakactivation temperature of either 800 �C or 900 �C under continuousnitrogen flow. Once the peak activation temperature was reached,the gas flow was switched to carbon dioxide (99.99%) at a flow rateof 100 mL/min. The samples were held at the peak activation tem-perature and exposed to CO2 gas for 30 min, then allowed to cool toroom temperature under nitrogen at 150 mL/min.
2.5. Characterization of pistachio biochars
Carbon contents of the resulting biochars and activated carbonswere determined using theMettler Toledo TGA/DSC-1 as previouslydescribed. An ASAP 2020 Surface Area and Porosity Analyzer(Micromeritics, Norcross, GA), as well as a QuantachromeAutosorb-1 were used to measure the biochars’ surface areas andporosity distribution via nitrogen (99.9999%) adsorption isothermsat 77 K. Between 0.3 and 0.5 g of samplewas used for eachmeasure-ment, measured on a semi-microbalance accurate to 10�4 g. Sam-ples were degassed at 120 �C for 5 h under vacuum. Adsorption-desorption isotherm data were collected using nitrogen gas adsorp-tion at 77 K with an overall partial pressure range of 0.05–0.99. Thespecific surface areas of samples were estimated using the BET the-ory. Total pore volume was calculated by converting the volume of
Table 2Activation energies of pyrolysis of pistachio nutshells calculated by the distributedactivation energy model at each mass fraction converted (X); error indicates onestandard deviation.
X Equation R2 Ea (kJ/mol)
0.1 y = �17822x + 23.113 0.9947 148.2 ± 7.7
580 S. Is�ıtan et al. / Energy Conversion and Management 127 (2016) 576–588
gas adsorbed at a relative pressure of 0.985 to a liquid volume.Micropore volume, or the volume of pores with widths less than2 nm, was calculated using the Dubinin-Radushkevich (D-R) equa-tion. Materials were analyzed by scanning electron microscopy(SEM, Zeiss Supra55 with field emission gun) operated at 3 kV toqualitatively characterize surface morphology.
0.2 y = �18759x + 23.500 0.9972 156.0 ± 5.80.3 y = �17793x + 20.838 0.9909 147.9 ± 10.00.4 y = �18919x + 21.914 0.9914 157.3 ± 10.40.5 y = �19327x + 21.861 0.9841 160.7 ± 14.40.6 y = �18452x + 20.006 0.9805 153.4 ± 15.30.7 y = �17983x + 18.841 0.9765 149.5 ± 16.40.8 y = �15147x + 13.729 0.9751 125.9 ± 14.2
Average 149.9 ± 10.7
3. Results and discussion
This work investigates the pyrolysis of a common biomass fromseveral angles – decomposition kinetics, bio-oil and pyrolysis gasproduced, and ability to create activated biochars – to determineif pyrolysis temperature can be used as a basis to optimize thisintegrated biorefinery concept. Such a concept could be appliedacross many different biomasses; presented here is a representa-tive case using pistachio nutshells.
3.1. TG-FTIR analysis
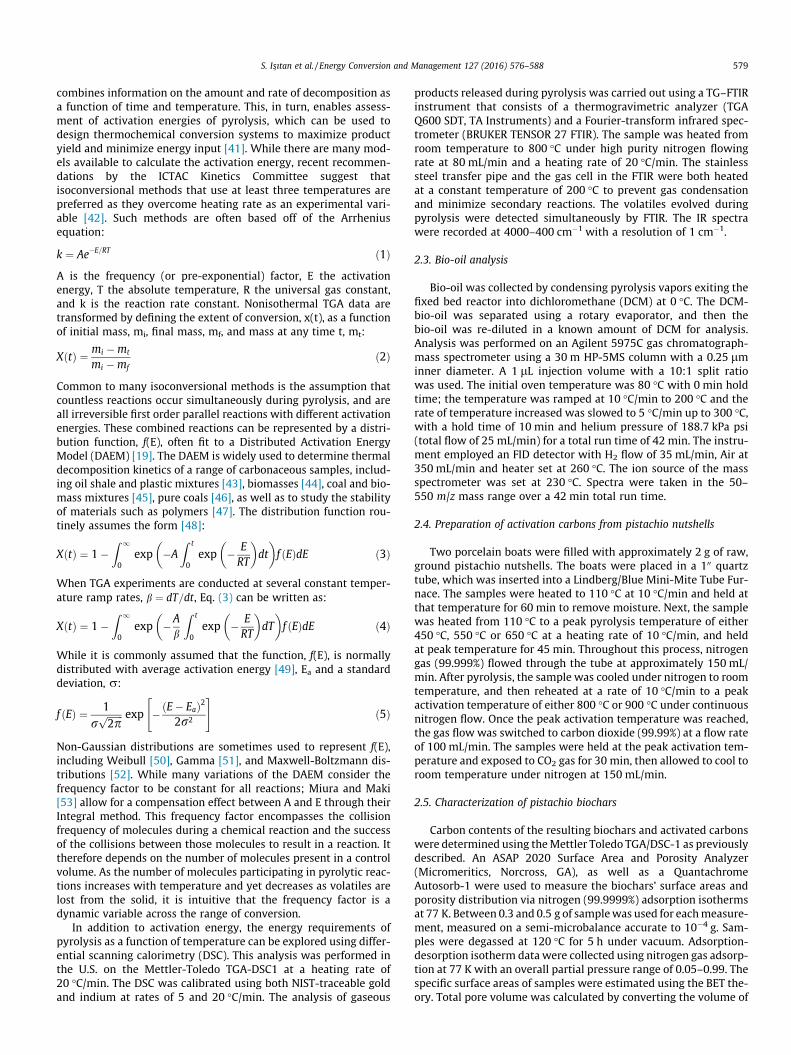
Thermogravimetric curves of fractional mass loss and derivativethermogravimetric curves (Fig. 1) mirror those throughout the bio-mass pyrolysis literature for a variety of biomasses, including algae[4], olive mill waste [5], corn stalk [20], and pistachio shells [54]. Athigher heating rates the peak reaction temperature and reactivityare higher than at lower heating rates. The Distributed ActivationEnergy Model was used to determine the activation energy ofpyrolysis over a mass fraction conversion range of 0.1–0.8, asshown in Fig. S1 (Supplemental Information, available online).Values at each fractional conversion are given in Table 2. The acti-vation energy at each conversion level ranged from 125.9 ± 14.2 to160.7 ± 14.4 kJ/mol, as shown in Fig. 1. The average activationenergy was found to be 149.9 ± 10.7 kJ/mol. Our data are in goodagreement with literature values for the pyrolysis of nutshells,which range from 124 kJ/mol for pistachio shells [54] to 181 kJ/molfor the pyrolysis of walnut shells [55].
A coupled TG-FTIR system was employed to determine typicalvolatiles and gas products. The FTIR spectrum is used to identifyvarious organic and inorganic compounds found in gaseous prod-ucts. The 3D FTIR spectra of gas products are shown in Fig. S2 ofthe online Supplemental Information. The spectrum gives informa-tion about IR absorbance, wavenumber and time (and hence tem-perature profile, as heating rate is constant) during the pyrolysis
(a) TG and DTG curves for pyrolysis at 5, 10, 20, 40°C/min
Fig. 1. Thermogravimetric analysis of pyrolysi
process. Due to complex behavior of pyrolysis reactions, distin-guishing products is a difficult task. However, using characteristicabsorbance bands, specification of representative product groupsis possible. Based on literature the assigned peaks correspond tothe functional groups observed in 3D FTIR spectra are givenin Table 3; peak assignments were made compiling commonlyused spectral ranges as described by Meng et al. [56], Li et al.[57], and Chen et al. [58].
As seen in Fig. 2, the change in spectral intensity during pyrol-ysis of PSs can be divided into three stages. At the first stage, whenthe temperature was below 250 �C, weak H2O and volatile organ-ics, and a strong CO2 peak were observed. Li et al. studied ligninpyrolysis and reported that between 120 and 200 �C, H2O forma-tion occurs due to breakage of hydroxyl groups of aliphatic groups;CO2 released in this temperature range may be related to crackingof lateral CAC bonds [51].
At the second stage, where primary decomposition occurs, var-ious gaseous products are devolatilized, and in greater amounts. Atthis stage, where the temperature is greater than 350 �C, demethy-loxylation, demethylation and decarboxylation reactions occur;such reactions may explain the increase in activation energy asconversion increases as such reactions require more energy toovercome the barrier to reaction [4]. The formation of CH4, corre-sponding to the stretching vibration of CAH bonds at (3200–2900 cm�1) can be caused by the cracking of the methoxyl(AOACH3), methyl (ACH3), and methylene (ACH2A) groups below500 �C. The net characteristic absorbance at 2400–2240 cm�1 indi-
(b) Ea at 10wt% conversions from 0.1 to 0.8 (error bars indicate one standard deviation; horizontal lines indicates average Ea ± 1 standard deviation)
0
50
100
150
200
0.1 0.2 0.3 0.4 0.5 0.6 0.7 0.8
Act
ivat
ion
Ene
rgy
(kJ/
mol
)
Mass Fraction Sample Converted
Avg Ea
s of pistachio nutshells (Turkish samples).
Table 3Primary products of pistachio nutshell pyrolysis determined from 3D TG-FTIR plot.
S. Is�ıtan et al. / Energy Conversion and Management 127 (2016) 576–588 581
cates presence of CO2, which is mainly due to cracking and reform-ing of the functional groups of carboxyl (C@O) and carbonyl(CAOAC). The characteristic band of CO (2230–2000 cm�1) is nearto that of CO2. The release of CO can be attributed to the breakageof ether bonds and C@O bonds and the secondary decompositionreactions of the volatiles. The specific C@O stretching absorbanceband (1880–1620 cm�1) indicates the presence of aldehydes,ketones, and organic acids. The bands at 1600–400 cm�1 are com-plex, and identifying each component is not feasible for such aheterogeneous set of reactions with only FTIR. However, basedon the literature, these bands indicate the existence of multipleorganics, including alcohols, aldehydes, acids, and phenols. As thetemperature increases to 450 �C, there is an increase in C@O absor-bance, and as the temperature increases further to 550 �C, there ishigher CH4 evolution.
At a third stage (>600 �C), the absorbance intensity of productswas weak, as seen in Fig. 2. The main compound produced wasCO2, and decreased amount of H2O and CH4 were also observed[59]. As seen in Fig. 2, the amount of gaseous products peaked ata temperature of 342 �C. The absorbance intensities of H2O and
(a) Low temperature region
(c) High temperature region
0
0.01
0.02
0.03
0.04
0.05
0.06
0.07
0.08
500 1000 1500 2000 2500 3000 3500 4000
Abs
orba
nce
Wavelength (cm-1)
271°C 342°C
CO2"
C=O"Alcohols,(aldehydes,(acids(and(phenols
CH4
H2O
0
0.01
0.02
0.03
0.04
0.05
0.06
0.07
0.08
500 1500 2500 3500
Abs
orba
nce
Wavelength (cm-1)
646°C 736°C
H2O"
CO2
CH4
Alcohols,(aldehydes,(acids(and(phenols
C=O
CO
CO
Fig. 2. Gaseous products determined from FTIR spectra fo
CO2 were slightly changed between lower and higher temperatureregions. At higher temperature region the decrease in amount ofgases can be observed from absorbance intensities. However, anincrease was observed in CH4 quantity at 736 �C.
3.2. Bio-oil analysis
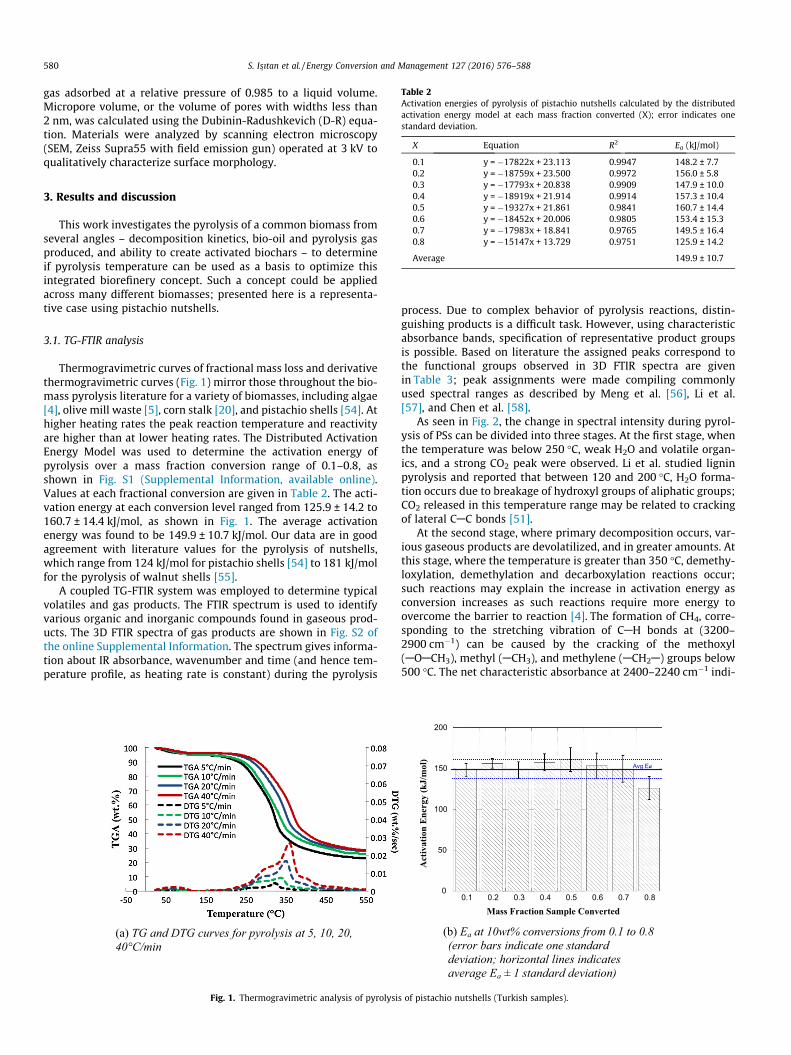
Bio-oil was collected from pistachio nutshells pyrolyzed at 450,550 and 650 �C. Table 4 presents the top identifiable compoundpeaks by percent area for each bio-oil (oil phase only). As bio-oilis a complex heterogeneous liquid comprised of organic acids,aldehydes, esters, ketones, sugars, alcohols, phenols, guaicols, syr-ingols, furans and other functionalized organics, it is nearly impos-sible to completely separate on one instrument in a single solvent.Only compounds with greater than 90% NIST library match areincluded in this table. Thus, this analysis is a semi-quantitativeapproach to compare relative yields of key components at eachpeak pyrolysis temperature to discuss general trends in ability tooptimize or minimize formation of representative components.
Total detected (including substituted) phenols were highest forthe 450 �C pyrolyzed sample, comprising approximately 25% of thetotal relative detected concentrations. This fraction drops toapproximately 15% of total area for the 550 �C sample and 19%for the 650 �C area. Relative contents of methylated phenols recov-ered at all three pyrolysis temperatures compare well with otherbio-oils found in the literature, such as that from even the fastpyrolysis of safflower seed (at up to 300 �C/min) [60]. The relativecomposition of phenol ranged from 2.3 to 3% for all three samples,lower than that of pyrolyzed sugarcane bagasse and empty palmfruit bunch at 6.2 and 5%, respectively [61].
The bio-oil collected at 650 �C had a high percentage of furans(up to 17% of relative chromatogram area), as compared to only3.5% at 550 �C and none detected at 450 �C. As a basis of compar-ison, switchgrass pyrolyzed at 6 �C/min up to 600 �C shows furans
(b) Mid temperature region
r pyrolysis of pistachio nutshells (Turkish samples).
Table 4GC–MS analysis of bio-oil from pistachio nutshell pyrolysis at 450, 500, and 650 �C.
Retention time (min) Compound identified Peak chromatogram area
582 S. Is�ıtan et al. / Energy Conversion and Management 127 (2016) 576–588
content of around 4.2% [62]. Furan derivatives are thought to bekey intermediates in sustainable renewable energy [63] and chem-ical production [64] and thus improving their yield in pyrolysisbio-oils is a key to process optimization. The relative yields ofdetected alkanes, alkenes and branched hydrocarbons rangedfromless than 1% at 450 �C to�1.5% at 550 �C to over 15% at 650 �C, withthe majority being comprised of 8 or fewer carbons, similar to priorpyrolysis bio-oil literature [65].
However, optimism must be tempered concerning yields of fur-ans and hydrocarbons at elevated pyrolysis temperatures slightlyby noting – as often found in for pyrolysis bio-oils – elevated levelsof oxygenated compounds, especially organic acids, at higher tem-peratures. For example, compounds with –COOH function groupswere not detected (again, at a 90% NIST-library match threshold)for 450 �C pyrolyzed sample, but represented �3% of the total areafor both 550 and 650 �C pyrolyzed samples. It is such oxygenatedcompounds, resulting in unstable oils that are predominantlyresponsible for the lack of widespread implementation of pyrolysisas a route to biomass-based liquid biofuels [66].
3.3. Characterization of fabricated pistachio shell biochars
By varying the pyrolysis and activation temperatures, and sizeand type (salted/unsalted/washed) of pistachio shell precursors,BET surface areas upwards of 1400 m2/g were achieved, with totalpore volumes ranging from 0.21 to 0.64 cm3/g and micropore vol-umes ranging from 0.20 to 0.58 cm3/g.
Washing biomass with water is known to remove up to 90% ofalkali metals [67], carbonates and chlorides, and of course in thiscase sodium chloride applied during roasting, all of which repre-sent fixed-carbon and ash components (i.e. material not availablefor adsorption) [68]. Therefore, one might expect the washed bio-chars to have the highest carbon content. However, the washedshells had lower overall surface areas than their salted/unsaltedcounterparts on a per-gram of biochar (specific) basis. The largeparticle size precursors exhibited adsorption-desorption behaviorresembling Type I isotherms, indicating a microporous samples,however, as discussed below, the micropore volume is negativelycorrelated with larger particle sizes. As depicted in Fig. S3 (in
S. Is�ıtan et al. / Energy Conversion and Management 127 (2016) 576–588 583
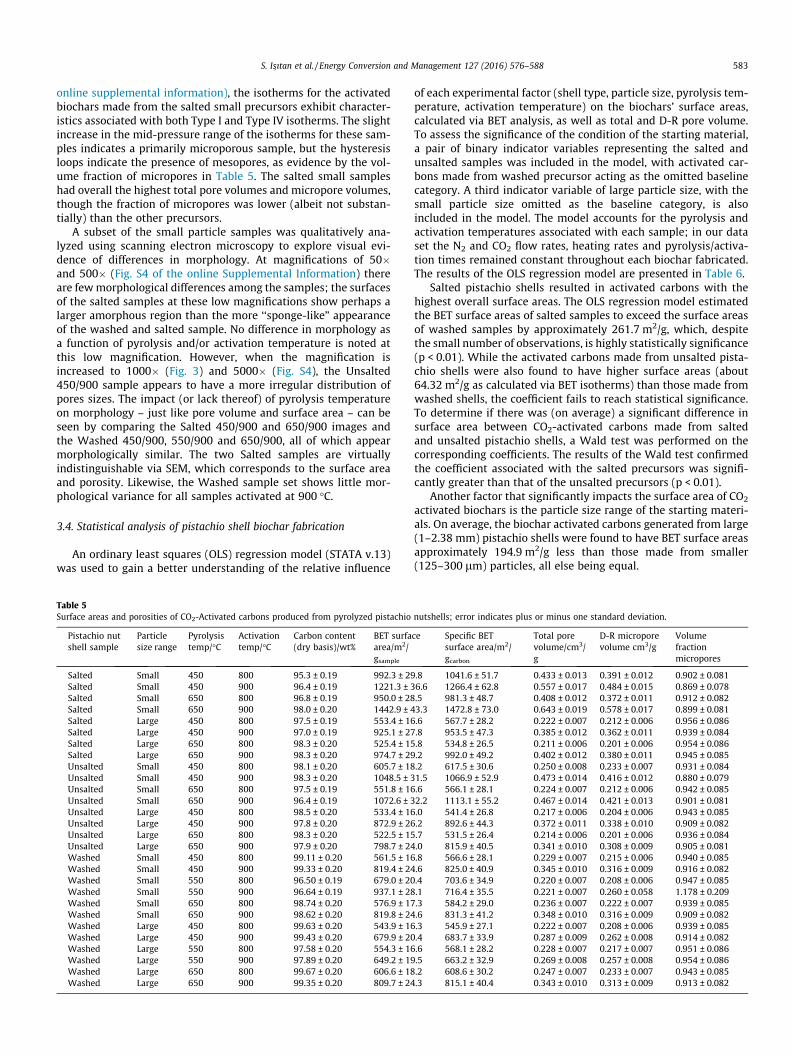
online supplemental information), the isotherms for the activatedbiochars made from the salted small precursors exhibit character-istics associated with both Type I and Type IV isotherms. The slightincrease in the mid-pressure range of the isotherms for these sam-ples indicates a primarily microporous sample, but the hysteresisloops indicate the presence of mesopores, as evidence by the vol-ume fraction of micropores in Table 5. The salted small sampleshad overall the highest total pore volumes and micropore volumes,though the fraction of micropores was lower (albeit not substan-tially) than the other precursors.
A subset of the small particle samples was qualitatively ana-lyzed using scanning electron microscopy to explore visual evi-dence of differences in morphology. At magnifications of 50�and 500� (Fig. S4 of the online Supplemental Information) thereare fewmorphological differences among the samples; the surfacesof the salted samples at these low magnifications show perhaps alarger amorphous region than the more ‘‘sponge-like” appearanceof the washed and salted sample. No difference in morphology asa function of pyrolysis and/or activation temperature is noted atthis low magnification. However, when the magnification isincreased to 1000� (Fig. 3) and 5000� (Fig. S4), the Unsalted450/900 sample appears to have a more irregular distribution ofpores sizes. The impact (or lack thereof) of pyrolysis temperatureon morphology – just like pore volume and surface area – can beseen by comparing the Salted 450/900 and 650/900 images andthe Washed 450/900, 550/900 and 650/900, all of which appearmorphologically similar. The two Salted samples are virtuallyindistinguishable via SEM, which corresponds to the surface areaand porosity. Likewise, the Washed sample set shows little mor-phological variance for all samples activated at 900 �C.
3.4. Statistical analysis of pistachio shell biochar fabrication
An ordinary least squares (OLS) regression model (STATA v.13)was used to gain a better understanding of the relative influence
Table 5Surface areas and porosities of CO2-Activated carbons produced from pyrolyzed pistachio
Pistachio nutshell sample
Particlesize range
Pyrolysistemp/�C
Activationtemp/�C
Carbon content(dry basis)/wt%
BET surfaarea/m2/gsample
Salted Small 450 800 95.3 ± 0.19 992.3 ± 29Salted Small 450 900 96.4 ± 0.19 1221.3 ± 3Salted Small 650 800 96.8 ± 0.19 950.0 ± 28Salted Small 650 900 98.0 ± 0.20 1442.9 ± 4Salted Large 450 800 97.5 ± 0.19 553.4 ± 16Salted Large 450 900 97.0 ± 0.19 925.1 ± 27Salted Large 650 800 98.3 ± 0.20 525.4 ± 15Salted Large 650 900 98.3 ± 0.20 974.7 ± 29Unsalted Small 450 800 98.1 ± 0.20 605.7 ± 18Unsalted Small 450 900 98.3 ± 0.20 1048.5 ± 3Unsalted Small 650 800 97.5 ± 0.19 551.8 ± 16Unsalted Small 650 900 96.4 ± 0.19 1072.6 ± 3Unsalted Large 450 800 98.5 ± 0.20 533.4 ± 16Unsalted Large 450 900 97.8 ± 0.20 872.9 ± 26Unsalted Large 650 800 98.3 ± 0.20 522.5 ± 15Unsalted Large 650 900 97.9 ± 0.20 798.7 ± 24Washed Small 450 800 99.11 ± 0.20 561.5 ± 16Washed Small 450 900 99.33 ± 0.20 819.4 ± 24Washed Small 550 800 96.50 ± 0.19 679.0 ± 20Washed Small 550 900 96.64 ± 0.19 937.1 ± 28Washed Small 650 800 98.74 ± 0.20 576.9 ± 17Washed Small 650 900 98.62 ± 0.20 819.8 ± 24Washed Large 450 800 99.63 ± 0.20 543.9 ± 16Washed Large 450 900 99.43 ± 0.20 679.9 ± 20Washed Large 550 800 97.58 ± 0.20 554.3 ± 16Washed Large 550 900 97.89 ± 0.20 649.2 ± 19Washed Large 650 800 99.67 ± 0.20 606.6 ± 18Washed Large 650 900 99.35 ± 0.20 809.7 ± 24
of each experimental factor (shell type, particle size, pyrolysis tem-perature, activation temperature) on the biochars’ surface areas,calculated via BET analysis, as well as total and D-R pore volume.To assess the significance of the condition of the starting material,a pair of binary indicator variables representing the salted andunsalted samples was included in the model, with activated car-bons made from washed precursor acting as the omitted baselinecategory. A third indicator variable of large particle size, with thesmall particle size omitted as the baseline category, is alsoincluded in the model. The model accounts for the pyrolysis andactivation temperatures associated with each sample; in our dataset the N2 and CO2 flow rates, heating rates and pyrolysis/activa-tion times remained constant throughout each biochar fabricated.The results of the OLS regression model are presented in Table 6.
Salted pistachio shells resulted in activated carbons with thehighest overall surface areas. The OLS regression model estimatedthe BET surface areas of salted samples to exceed the surface areasof washed samples by approximately 261.7 m2/g, which, despitethe small number of observations, is highly statistically significance(p < 0.01). While the activated carbons made from unsalted pista-chio shells were also found to have higher surface areas (about64.32 m2/g as calculated via BET isotherms) than those made fromwashed shells, the coefficient fails to reach statistical significance.To determine if there was (on average) a significant difference insurface area between CO2-activated carbons made from saltedand unsalted pistachio shells, a Wald test was performed on thecorresponding coefficients. The results of the Wald test confirmedthe coefficient associated with the salted precursors was signifi-cantly greater than that of the unsalted precursors (p < 0.01).
Another factor that significantly impacts the surface area of CO2
activated biochars is the particle size range of the starting materi-als. On average, the biochar activated carbons generated from large(1–2.38 mm) pistachio shells were found to have BET surface areasapproximately 194.9 m2/g less than those made from smaller(125–300 lm) particles, all else being equal.
nutshells; error indicates plus or minus one standard deviation.
Fig. 3. SEM images of selected pistachio biochars with small particle precursors, 1000� magnification (scale bars represent 10 lm).
584 S. Is�ıtan et al. / Energy Conversion and Management 127 (2016) 576–588
The regression analysis indicates that pyrolysis temperatures(450 �C, 550 �C or 650 �C) had no significant impact on the surfacearea of the resulting activated carbons. The magnitude of the corre-sponding regression coefficient is low relative to the standard error(coefficient of 0.123 m2/g per �C increase with a standard error of0.230). Unlike temperature of pyrolysis, the activation temperaturewas found to greatly impact surface area. According to the model,increasing the activation temperature from 800 �C to 900 �Cresulted in an increase in BET surface area of approximately
308.2 m2/g, or a 3.082 m2/g increase per �C increase. These resultssupport the idea that increasing CO2 activation temperaturesbeyond 800 �C allows for increased rates of surface reactionsbetween the oxidizing carbon dioxide and char surface.
Using these coefficients, a model generated to predict the BETsurface area based on experimental parameters fits the data fairlywell with an R2 value of 0.78 and an adjusted R2 value, whichaccounts for the number of observations and number of parame-ters, of 0.75. Similar models were obtained for total pore volume
Table 6Factors influencing pistachio biochar BET surface areas, DR-Micropore Volume, viaOLS regression (washed, small = omitted baseline categories).
Standard errors in parentheses. All significance tests are two-tailed.** p < 0.01.
S. Is�ıtan et al. / Energy Conversion and Management 127 (2016) 576–588 585
and (R2 = 0.83) and D-R micropore volume (R2 = 0.82). The coeffi-cients and levels of statistical significance for these are given inTable 6. A scatter plot demonstrating the fit of the experimentaldata to the estimated models is depicted in Fig. 4. The modelsare more accurate at surface areas exceeding 600 m2/g for bothBET and Langmuir areas.
The same variables that yielded higher surface areas – salted,smaller particle size and higher activation temperatures – werealso positively correlated and statistically significant with theDubinin-Radushkevich Micropore Volumes. Indeed, the BET sur-face area and D-R volume are highly correlated (at >0.999). Thisis of course expected given that their values are derived, originally,from Langmuir’s theories on gas adsorption and calculated usingthe same set of isotherms for each sample. To summarize Table 6,in order to maximize the micropore volume, the most significantexperimental variable was using a salted shell precursor, followedby smaller particle sizes and finally higher activation temperatures,all of which are statistically significant at p < 0.01.
(a) Surface area
Fig. 4. Actual versus predicted (OLS regression) BET ( ) surface areas, total pore voluSamples).
3.5. Comparison to prior literature results for activated pistachiobiochar precursors
Few studies present such a large experimental matrix enablingthe optimization of activated biochar parameters. One notableexception is that done by Azargohar and Dalai [69]. They probethe impact of biochar to steam ratio, activation temperature andtime on the BET surface areas of spruce wood biochar, activatedusing steam and KOH. They posit an overwhelming importanceof activation temperature over many other variables on increasingsurface area for both steam and KOH activation, and the positiveeffect of increasing ratio of oxidizing agent to biochar on surfacearea. Azargohar and Dalai find that for steam activation of sprucewood biochar, as the temperature increases the BET surface areaincreases and reaction yield decreases. A study by Heschel andKlose [70] looks at the impact of a variety of precursor materials(biomass residues including coconut, walnut and hazelnut, peach,cherry and plum stones) and processing conditions onagricultural-based biochars. They find that the porous structuresof the chars are highly dependent on both pyrolysis temperatureand heating rate. They conclude that the critical parameters deter-mining the quality of the activated biochar are activation temper-ature and burnoff. The data presented here agrees with theassertion that activation temperature is a key determinant of sur-face area, though burnoff was not studied herein.
The quality of biochars vary considerably; in their thoroughreview of biomass pyrolysis, Ioannidou and Zabaniotou [71] sug-gest that pyrolysis temperature has the largest impact on charquality; as temperature increases, the char yield decreases due tohigher loss of volatiles. Pyrolysis heating rate, nitrogen flow rateand pyrolysis hold time, were also found to be mitigating factorson biochar quality. Conversely, the current work demonstrates thatthe surface areas of pistachio biochars resulting from pyrolysistemperatures of 450, 550 and 650 �C, all other things equal, werenot statistically different. Insofar as the impact of pyrolysis tem-perature, Lua et al. show that, as long as it beyond a minimumvalue (which in their Table 5 appears to be around 400 �C), theimpact of increasing pyrolysis temperature on resulting surfacearea is minimal [32]. Yang and Lua [31] do a head-to-head compar-
(b) Pore volume
me (d), and D-R Micropore volume ( ) for CO2 activated pistachio biochars (U.S.
586 S. Is�ıtan et al. / Energy Conversion and Management 127 (2016) 576–588
ison of their CO2-activated pistachio nutshell biochar samples’ sur-face area to determine the effect of heating rate. They discuss thatgoing from 5 to 10 �C/min increases surface area ‘‘because thehigher rate results in a higher thermal gradient across the charsample. . . [which] favors the diffusion of the CO2 molecules intothe activated carbon structure.” They then note that if the sampleis heated at rates higher than 10 �C/min, the BET surface area pro-gressively decreases because of ‘‘shorter contact time between thechar and the CO2 gas. . .[leading to] a shorter dwell time for thecarbon-CO2 reaction and therefore reduced pore development.”However, because of the small sample size, none of the resultsshow a statistical significance at even p < 0.05 (even when apply-ing a curvilinear fit, as n = 5 observations.)
3.6. Impact of pyrolysis temperature on biofuel and activated biocharproduction
This investigation set out to determine if one could approachthe conversion of biomass to biofuels and activated biochars usingpyrolysis temperature as a key variable for optimization of productquality, using pistachio nutshells as an example biomass. Ofcourse, the quality of products produced in an integrated biorefin-ery is only part of the story; the energy required to produce these
Table 7Summary of impact of pyrolysis temperature on quality of bioproducts produced from pis
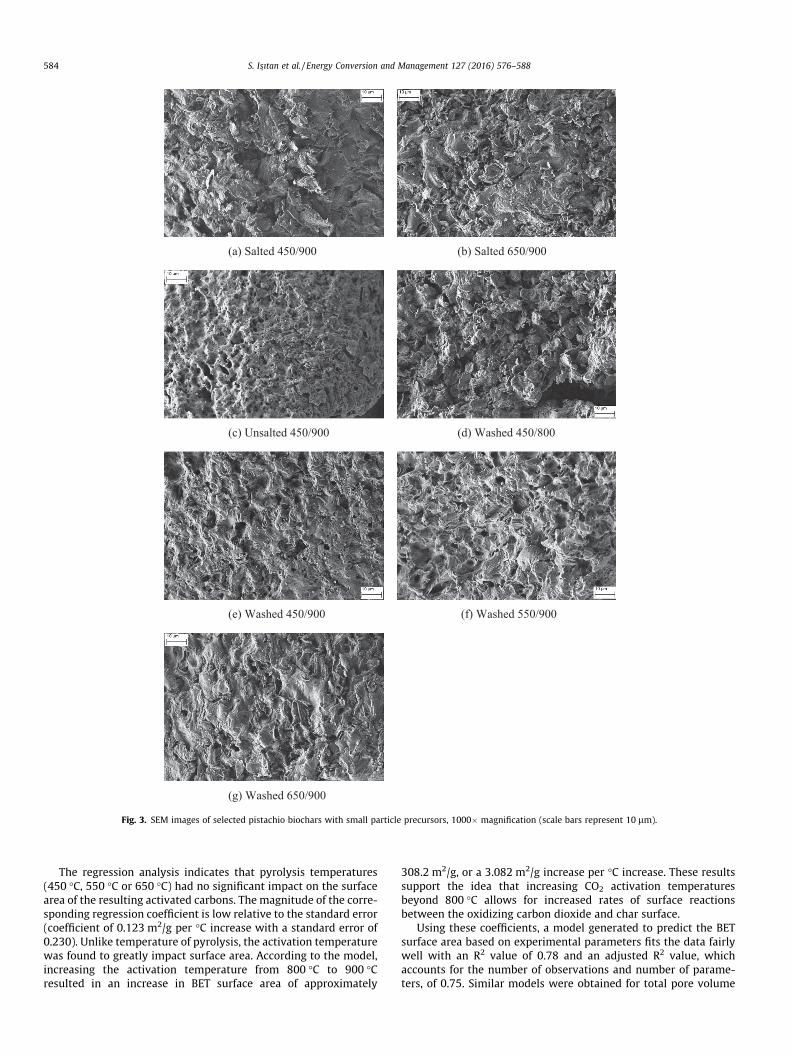
Fig. 5. DSC curve showing endothermic nature of pyrolysis of pistachio nutshell asa function of temperature.
fuels and materials – and therefore net energy balance – are keydeterminants of the ‘‘sustainability” of the system. While an over-all energy audit is beyond the scope of the current work, an exam-ination of the heat flow required to pyrolyze the pistachionutshells offers a different perspective on the trade-off betweenpyrolysis temperature and resulting product. As shown in Fig. 5,the pyrolysis of biomass is endothermic; the peak heat flowrequired to volatilize materials occurred between 390 and 430 �Cat a maximum of 4.4 mW/mg. After peaking, the heat required topyrolyze the samples actually begins to decrease as more and morevolatiles are driven off; by integrating the area under the heatcurve from 110 �C to 450, 550 and then 650 �C, the heat requiredto devolatilize the sample (per unit mass) increases by 33% to gofrom 450 to 550 �C, and then another 16.7% to increase from550 �C to 650 �C. Of course, while the total heat requirements forpyrolysis are biomass-specific (see van de Velden et al. 2010 fora comprehensive review on the endothermicity of biomass pyroly-sis), as temperature increases by extension the heat (and energyinput) required to pyrolyze the sample at higher temperatures alsoincreases.
Results from each analysis set, along with over-arching impacton process, are summarized in Table 7. Using a holistic approachto explore the product quality (liquid bio-fuel, pyrolysis gas, andactivated biochars) as a function of pyrolysis temperatures, it isfound that increasing pyrolysis temperature has a negative impactin terms of overall reaction energies (activation energies at eachconversion level are approximately equal, but peak decompositionrate occurs below 450 �C). Temperature and evolved gaseoushydrocarbons are inversely correlated, though increasing pyrolysistemperature does increase methane yield. Likewise, by increasingpyrolysis temperature the oxygenated compounds present in bio-oil increased (lowering overall stability) while simultaneouslyincreasing hydrocarbon and furan/furfural yields, the latter ofwhich are thought to be important biorefinery intermediary com-ponents. Finally, pyrolysis temperature has a negligible impact onthe CO2-activated biochars produced. Overall, this product quality-driven approach suggests that current methods that only look atproduct yield as a function of energy requirements may well missan opportunity to improve process efficiency by considering pro-duct quality. Though pyrolysis at lower temperatures may sacrificeproduct yield, it requires considerably less heat/energy, does notimpact decomposition rates, and improves stability of bio-oil,increasing light hydrocarbon content of pyrolysis gas, and hasnot impact on subsequently produced activation biochars. Thus,further research on the incorporation of product quality as a medi-ating variable in techo-economic and life cycle analyses of the inte-grated biorefineries may prove beneficial to the production ofrenewable energy and products via pyrolysis of biomass.
tachio nutshells.
650 �C pyrolysis Overarching impact
Slowest decomposition Increasing temperature beyond 450 �C doesnot increase rate of pyrolysis
Peak CH4 Increasing temperature increases natural gasyield, diminishes other products
Highest furans+ Hydrocarbons;lowest phenols
Increasing temperature reduces stability,improves yield of key intermediaries
1148 J/g Increasing temperature requires 33% moreheat for 450–550 �C and 16.7% from 550 to650 �CActivation temperature key variable for CO2
activated biochar production
S. Is�ıtan et al. / Energy Conversion and Management 127 (2016) 576–588 587
4. Conclusions
The ability to design materials and fuels is constantly expand-ing; understanding the experimental factors that lead to desiredcharacteristics, such as high surface areas and micropore volumesin activated sorbents, and increased bio-oil stability, will lead tomore efficient processes. This study probes the impact of pyrolysistemperature on the resulting bio-oil from pistachio nutshells, andthe impact of pyrolysis and activation temperature on the proper-ties of biomass-based activated carbons made from CO2-activatedpistachio nutshells, a readily available biomass. The ability tosimultaneously produce more stable bio-oil and high surface areamicroporous carbons with a lower temperature pyrolysis stepcould increase the economic and environmental benefits of usingbiomass as a source of renewable fuel and as a precursor to pro-ducing activated carbons. Current methods that strive to maximizeproduct yield as a function of energy requirements may miss anopportunity to improve process efficiency by considering productquality. Future research on different biomass precursors is neces-sary to determine if this holds only for pistachio nutshells or forother biomasses. Such a product-quality driven approach to theintegrated biorefinery could increase the economic and environ-mental benefits of biomass as a renewable fuel source.
Acknowledgements
The authors appreciate the assistance of D. Kriner with the sta-tistical analysis for this work. J. Goldfarb acknowledges that a por-tion of this material is based upon work supported by the NationalScience Foundation under Grant No. NSF CBET-1127774. T. Chel-lappa acknowledges the support of the CAPES Brazilian Post-Doctoral Fellowship Program. S. Ceylan acknowledges fundingfrom Ondokuz Mayıs University with a project number of PYO.MUH.1901.12.010 and TUB_ITAK with a project number of214M153.
Appendix A. Supplementary material
Supplementary data associated with this article can be found, inthe online version, at http://dx.doi.org/10.1016/j.enconman.2016.09.031.
References
[1] García-Martos C, Rodríguez J, Sánchez MJ. Modelling and forecasting fossilfuels, CO2 and electricity prices and their volatilities. Appl Energy2013;101:363–75.
[2] Kauffman N, Hayes D, Brown R. A life cycle assessment of advanced biofuelproduction from a hectare of corn. Fuel 2011;90(11):3306–14.
[3] Tokimatsu K, Konishi S, Ishihara K, Tezuka T, Yasuoka R, Nishio M. Role ofinnovative technologies under the global zero emissions scenarios. ApplEnergy 2016;162:1483–93.
[4] Ceylan S, Goldfarb JL. Green tide to green fuels: TG–FTIR analysis and kineticstudy of Ulva prolifera pyrolysis. Energy Convers Manage 2015;101:263–70.
[5] Schievano A, Adani F, Buessing L, Botto A, Casoliba EN, Rossoni M, et al. Anintegrated biorefinery concept for olive mill waste management: supercriticalCO2 extraction and energy recovery. Green Chem 2015;17(5):2874–87.
[6] Mettler MS, Vlachos DG, Dauenhauer PJ. Top ten fundamental challenges ofbiomass pyrolysis for biofuels. Energy Environ Sci 2012;5(7):7797–809.
[7] Neves D, Thunman H, Matos A, Tarelho L, Gómez-Barea A. Characterization andprediction of biomass pyrolysis products. Prog Energy Combust Sci 2011;37(5):611–30.
[8] Yoder J, Galinato S, Granatstein D, Garcia-Pérez M. Economic tradeoff betweenbiochar and bio-oil production via pyrolysis. Biomass Bioenergy 2011;35(5):1851–62.
[9] Yue D, You F, Snyder SW. Biomass-to-bioenergy and biofuel supply chainoptimization: overview, key issues and challenges. Comput Chem Eng2014;66:36–56.
[10] Peters JF, Iribarren D, Dufour J. Biomass pyrolysis for biochar or energyapplications? A life cycle assessment. Environ Sci Technol 2015;49(8):5195–202.
[11] Kokossis AC, Yang A. On the use of systems technologies and a systematicapproach for the synthesis and the design of future biorefineries. ComputChem Eng 2010;34(9):1397–405.
[12] Lehto J, Oasmaa A, Solantausta Y, Kytö M, Chiaramonti D. Review of fuel oilquality and combustion of fast pyrolysis bio-oils from lignocellulosic biomass.Appl Energy 2014;116:178–90.
[13] Laird DA, Brown RC, Amonette JE, Lehmann J. Review of the pyrolysis platformfor coproducing bio-oil and biochar. Biofuels, Bioprod Biorefin 2009;3(5):547–62.
[14] Wright MM, Daugaard DE, Satrio JA, Brown RC. Techno-economic analysis ofbiomass fast pyrolysis to transportation fuels. Fuel 2010;89:S2–S10.
[15] Roberts KG, Gloy BA, Joseph S, Scott NR, Lehmann J. Life cycle assessment ofbiochar systems: estimating the energetic, economic, and climate changepotential. Environ Sci Technol 2009;44(2):827–33.
[16] Isa KM, Daud S, Hamidin N, Ismail K, Saad SA, Kasim FH. Thermogravimetricanalysis and the optimisation of bio-oil yield from fixed-bed pyrolysis of ricehusk using response surface methodology (RSM). Ind Crops Prod 2011;33(2):481–7.
17] Trubetskaya A, Jensen PA, Jensen AD, Llamas ADG, Umeki K, Gardini D, et al.Effects of several types of biomass fuels on the yield, nanostructure andreactivity of soot from fast pyrolysis at high temperatures. Appl Energy2016;171:468–82.
[18] Ingram L, Mohan D, Bricka M, Steele P, Strobel D, Crocker D, et al. Pyrolysis ofwood and bark in an auger reactor: physical properties and chemical analysisof the produced bio-oils. Energy Fuels 2007;22(1):614–25.
[19] Mani T, Murugan P, Mahinpey N. Determination of distributed activationenergy model kinetic parameters using simulated annealing optimizationmethod for nonisothermal pyrolysis of lignin. Ind Eng Chem Res 2008;48(3):1464–7.
[20] Pütün AE, Özbay N, Önal EP, Pütün E. Fixed-bed pyrolysis of cotton stalk forliquid and solid products. Fuel Process Technol 2005;86(11):1207–19.
[21] Olsson G. Water, energy and food interactions—challenges and opportunities.Front Environ Sci Eng 2013;7(5):787–93.
[22] Fang D, Chen B. Linkage analysis for the water–energy nexus of city. ApplEnergy 2016. http://dx.doi.org/10.1016/j.apenergy.2016.04.020 [In press].
[23] Howells M, Hermann S, Welsch M, Bazilian M, Segerström R, Alfstad T, et al.Integrated analysis of climate change, land-use, energy and water strategies.Nat. Clim. Change 2013;3(7):621–6.
[24] Mohan D, Sarswat A, Ok YS, Pittman CU. Organic and inorganic contaminantsremoval from water with biochar, a renewable, low cost and sustainableadsorbent–a critical review. Bioresour Technol 2014;160:191–202.
[25] Prauchner MJ, Rodríguez-Reinoso F. Chemical versus physical activation ofcoconut shell: A comparative study. Microporous Mesoporous Mater2012;152:163–71.
[26] Arami-Niya A, Daud WMAW, Mjalli FS. Using granular activated carbonprepared from oil palm shell by ZnCl 2 and physical activation for methaneadsorption. J Anal Appl Pyrol 2010;89(2):197–203.
[27] Reif AE. The mechanism of the carbon dioxide–carbon reaction. J Phys Chem1952;56(6):785–8.
[28] Moreno-Castilla C, Carrasco-Marin F, Maldonado-Hodar FJ, Rivera-Utrilla J.Effects of non-oxidant and oxidant acid treatments on the surface properties ofan activated carbon with very low ash content. Carbon 1998;36(1):145–51.
[29] Zhang T, Walawender WP, Fan LT, Fan M, Daugaard D, Brown RC. Preparationof activated carbon from forest and agricultural residues through CO2
activation. Chem Eng J 2004;105(1):53–9.[30] Zhu Y, Gao J, Li Y, Sun F, Gao J, Wu S, et al. Preparation of activated carbons for
SO2 adsorption by CO2 and steam activation. J Taiwan Inst Chem Eng 2012;43(1):112–9.
[31] Yang T, Lua AC. Characteristics of activated carbons prepared from pistachio-nut shells by physical activation. J Colloid Interf Sci 2003;267(2):408–17.
[32] Lua AC, Yang T, Guo J. Effects of pyrolysis conditions on the properties ofactivated carbons prepared from pistachio-nut shells. J Anal Appl Pyrol2004;72(2):279–87.
[33] Açıkalın K, Karaca F, Bolat E. Pyrolysis of pistachio shell: effects of pyrolysisconditions and analysis of products. Fuel 2012;95:169–77.
[34] Boriss H, Romero C. Pistachios. AgMRC Agricultural Marketing ResourceCenter; 2015. Available from: http://www.agmrc.org/commodities-products/nuts/pistachios/ [Accessed 26 April 2016].
[35] Demiral I, Atilgan NG, S�ensöz S. Production of biofuel from soft shell ofpistachio (Pistacia vera L.). Chem Eng Commun 2008;196(1–2):104–15.
[36] Schröder E, Thomauske K, Weber C, Hornung A, Tumiatti V. Experiments onthe generation of activated carbon from biomass. J Anal Appl Pyrol 2007;79(1):106–11.
[38] ASTM D 3173-87. Standard method for determination of moisture content inbiomass. Philadelphia, PA: Am. Society for Testing Materials, International;2003.
[39] ASTM D 3174-04. Standard method for ash in the analysis sample of coal andcoke. Philadelphia, PA: Am. Society for Testing Materials, International; 2004.
[40] ASTM D 3175-07. Standard method for volatile matter in the analysis sampleof coal and coke. Philadelphia, PA: Am. Society for Testing Materials,International; 2007.
[41] Shuping Z, Yulong W, Mingde Y, Chun L, Junmao T. Pyrolysis characteristicsand kinetics of the marine microalgae Dunaliella tertiolecta usingthermogravimetric analyzer. Bioresour Technol 2010;101(1):359–65.
588 S. Is�ıtan et al. / Energy Conversion and Management 127 (2016) 576–588
[42] Vyazovkin S, Chrissafis K, Di Lorenzo ML, Koga N, Pijolat M, Roduit B, et al.ICTAC Kinetics Committee recommendations for collecting experimentalthermal analysis data for kinetic computations. Thermochim Acta2014;590:1–23.
[43] Aboulkas A. Kinetic and mechanism of Tarfaya (Morocco) oil shale and LDPEmixture pyrolysis. J Mater Process Technol 2008;206(1):16–24.
[44] Cai J, Liu R. New distributed activation energy model: numerical solution andapplication to pyrolysis kinetics of some types of biomass. Bioresour Technol2008;99(8):2795–9.
[45] Li Z, Liu C, Chen Z, Qian J, Zhao W, Zhu Q. Analysis of coals and biomasspyrolysis using the distributed activation energy model. Bioresour Technol2009;100(2):948–52.
[46] Please CP, McGuinness MJ, McElwain DLS. Approximations to the distributedactivation energy model for the pyrolysis of coal. Combust Flame 2003;133(1):107–17.
[47] Dawood A, Miura K. Pyrolysis kinetics of c-irradiated polypropylene. PolymDegrad Stabil 2001;73(2):347–54.
[48] Sonobe T, Worasuwannarak N. Kinetic analyses of biomass pyrolysis using thedistributed activation energy model. Fuel 2008;87(3):414–21.
[49] Cai J, Li T, Liu R. A critical study of the Miura-Maki integral method for theestimation of the kinetic parameters of the distributed activation energymodel. Bioresour Technol 2011;102(4):3894–9.
[50] Lakshmanan CC, White N. A new distributed activation energy model usingWeibull distribution for the representation of complex kinetics. Energy Fuels1994;8(6):1158–67.
[51] Burnham AK, Braun RL. Global kinetic analysis of complex materials. EnergyFuels 1999;13(1):1–22.
[52] Skrdla PJ. Crystallizations, solid-state phase transformations and dissolutionbehavior explained by dispersive kinetic models based on a Maxwell�Boltzmann distribution of activation energies: theory, applications, andpractical limitations. J Phys Chem A 2009;113(33):9329–36.
[53] Miura K, Maki T. A simple method for estimating f (E) and k 0 (E) in thedistributed activation energy model. Energy Fuels 1998;12(5):864–9.
[54] Tonbul Y. Pyrolysis of pistachio shell as a biomass. J Therm Anal Calorim2007;91(2):641–7.
[55] Yuan HR, Liu RH. Study on pyrolysis kinetics of walnut shell. J Therm AnalCalorim 2007;89(3):983–6.
[56] Meng A, Zhou H, Qin L, Zhang Y, Li Q. Quantitative and kinetic TG-FTIRinvestigation on three kinds of biomass pyrolysis. J Anal Appl Pyrol2013;104:28–37.
[57] Li B, Lv W, Zhang Q, Wang T, Ma L. Pyrolysis and catalytic pyrolysis ofindustrial lignins by TG-FTIR: kinetics and products. J Anal Appl Pyrol2014;108:295–300.
[58] Chen D, Liu D, Zhang H, Chen Y, Li Q. Bamboo pyrolysis using TG–FTIR and alab-scale reactor: analysis of pyrolysis behavior, product properties, andcarbon and energy yields. Fuel 2015;148:79–86.
[59] Zhang Q, Chang J, Wang T, Xu Y. Review of biomass pyrolysis oil properties andupgrading research. Energy Convers Manage 2007;48(1):87–92.
[60] Onay O. Influence of pyrolysis temperature and heating rate on the productionof bio-oil and char from safflower seed by pyrolysis, using a well-swept fixed-bed reactor. Fuel Process Technol 2007;88(5):523–31.
[61] Mantilla SV, Gauthier-Maradei P, Gil PÁ, Cárdenas ST. Comparative study ofbio-oil production from sugarcane bagasse and palm empty fruit bunch: yieldoptimization and bio-oil characterization. J Anal Appl Pyrol 2014;108:284–94.
[62] Imam T, Capareda S. Characterization of bio-oil, syn-gas and bio-char fromswitchgrass pyrolysis at various temperatures. J Anal Appl Pyrol2012;93:170–7.
[63] Kamm B. Production of platform chemicals and synthesis gas from biomass.Angew Chem Int Ed 2007;46(27):5056–8.
[64] Tong X, Ma Y, Li Y. Biomass into chemicals: conversion of sugars to furanderivatives by catalytic processes. Appl Catal A 2010;385(1):1–13.
[65] Ates� F, Pütün E, Pütün AE. Fast pyrolysis of sesame stalk: yields and structuralanalysis of bio-oil. J Anal Appl Pyrol 2004;71(2):779–90.
[66] Xiu S, Shahbazi A. Bio-oil production and upgrading research: a review. RenewSustain Energy Rev 2012;16(7):4406–14.
[67] Davidsson KO, Korsgren JG, Pettersson JBC, Jäglid U. The effects of fuel washingtechniques on alkali release from biomass. Fuel 2002;81(2):137–42.
[68] Tumuluru JS, Wright CT, Boardman RD, Yancey NA, Sokhansanj S. A review onbiomass classification and composition, co-firing issues and pretreatmentmethods. In: 2011 Louisville, Kentucky, August 7–10, 2011. American Societyof Agricultural and Biological Engineers; 2011. p. 1.
[69] Azargohar R, Dalai AK. Steam and KOH activation of biochar: experimental andmodeling studies. Microporous Mesoporous Mater 2008;110(2):413–21.
[70] Heschel W, Klose E. On the suitability of agricultural by-products for themanufacture of granular activated carbon. Fuel 1995;74(12):1786–91.
[71] Ioannidou O, Zabaniotou A. Agricultural residues as precursors for activatedcarbon production—a review. Renew Sustain Energy Rev 2007;11(9):1966–2005.