Energy Crises: Their Imminence, Size, and Impact Sanjay. V. Khare Department of Physics and Astronomy, The University of Toledo, Toledo, OH-43606 http://astro1.panet.utoledo.edu/~khare/ Acknowledgements Funding: NSF, DARPA, DOE, WPAFB, PVIC from Sate of Ohio, Data and Slides: Gratitude and thanks to many fellow peakists Presentation: My student Shandeep Voggu
Transcript
Energy Crises: Their Imminence, Size, and Impact
Sanjay. V. Khare
Department of Physics and Astronomy, The University of Toledo, Toledo, OH-43606
http://astro1.panet.utoledo.edu/~khare/
Acknowledgements
Funding: NSF, DARPA, DOE, WPAFB, PVIC from Sate of Ohio,Data and Slides: Gratitude and thanks to many fellow peakists Presentation: My student Shandeep Voggu
-- 3 Ohio Universities: – University of Toledo– Ohio State University– Bowling Green State
University
– 4 Ohio Not-for-Profit Organizations:– Battelle Memorial Institute– Green Energy Ohio– Edison Materials Technology
Center– Honda OSU Partnership
– 12 Ohio Companies: – Owens Corning– Pilkington– SSOE– Solar Fields– Midwest Optoelectronics– Innovative Thin Films– LakeShore Cryotronics– Decker Homes– Advanced Distributed Generation– Metamateria Partners– NewCyte– Cornerstone Research Group
The PVIC Proposal Team: Co-PI's, Rob Collins (UT) & Bob Davis (OSU)
SolarSolarFieldsFields
Honda-Honda-OSUOSU
PartnershPartnershipip
ProgramProgram
PVIC: Center for Photovoltaics PVIC: Center for Photovoltaics Innovation and CommercializationInnovation and Commercialization
Center for Photovoltaics Innovation andCommercialization
Sustainability Goal: continue innovation growth with operating fund revenue growing from $2.5 M/yr
Center for Photovoltaics Innovation andCommercialization
PVIC: Center for Photovoltaics PVIC: Center for Photovoltaics Innovation and CommercializationInnovation and Commercialization
Four Distinct Crises
Problem Imminence Impact Awareness
I Global WarmingApproaching
(5 to 10 years)GRADUAL over 10 – 100+ years
HIGH
II Peak Production
Liquid Fuels
Now
(-3 to 5 years)CATASTROPIC
Undertanding is POOR
III Peak Production
Total Energy
Approaching
(10 to 15 years)CATASTROPIC
Understanding is POOR
IV Peak Other Materials (food, top
soil, fertile land, H2O, P, U, Au)
Now
(0 to 5 years)
CATASTROPIC
Can be exacerbated by
I - III
INCREASING
PEAK OILPEAK OIL(and the unfolding energy crisis)(and the unfolding energy crisis)
-What is Peak Oil?What is Peak Oil?
-What are the consequences?What are the consequences?
-What can we do about it?What can we do about it?
Fuel Prices
1955
2005
Yesterday
Today … Tomorrow?
Oil originates from the decomposition of microorganisms that got buried under
geologic formations in the sea millions of years ago.
In some cases the sea retreated, which explains why oil is also found on land.
-Oil was a gift from nature.
-It took millions of years to produce
-When it’s gone, it’s gone forever
Before the first oil well was dug
in Pennsylvania in 1859, Nature had made about two
trillion barrels of oil and scattered it unevenly around
the world.
By 2006 we’ve used up about 0.96 trillion. In other words
we’re near the half-way point.
“Hubbert's Peak: The Impending World Oil Shortage”, Kenneth S. Deffeyes
An oil well isn’t like a car’s fuel tank
• With a car you can drive at full speed until the moment you run out of fuel.
• That’s because your tank is a hollow cavity. The fuel fills the bottom of the tank and there’s nothing preventing it from being pumped out.
0 time
Gas
olin
e us
e
But an oil well isn’t a hollow cavity
• It’s a large deposit of stones or sandstone sandwiched between two layers of impervious rock. The hollow spaces between the stones or sand are filled with thick and viscous oil.
• A pipe is lowered into the mixture of oil and stones or sand and the oil is slowly pumped up.
It takes time for oil to ooze from zones of high concentration to the zone of low concentration near the pipe.
Click
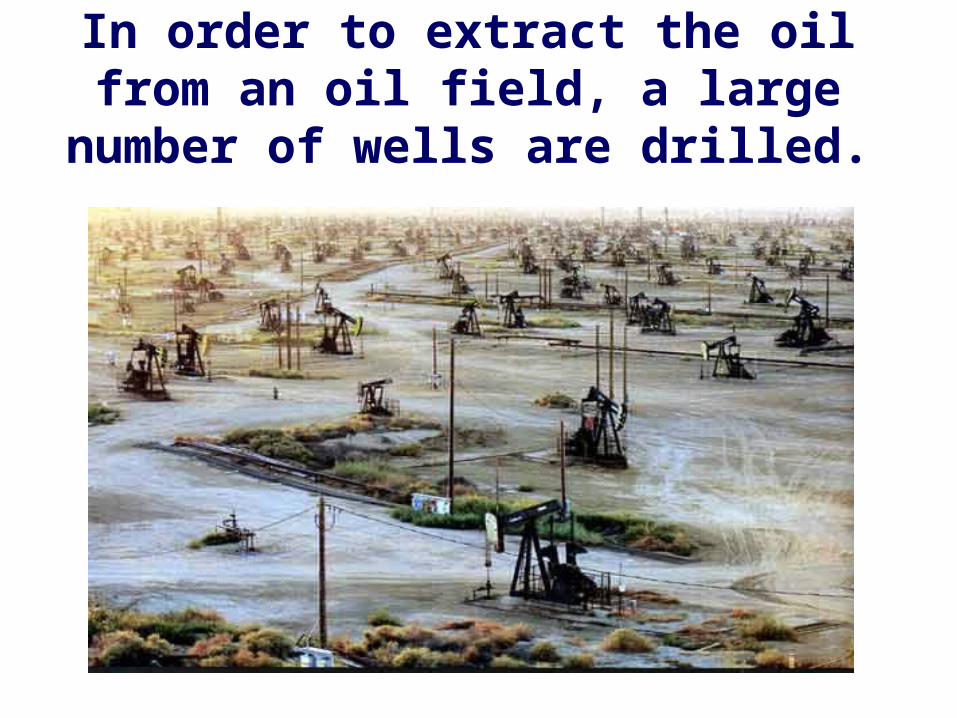
In order to extract the oil from an oil field, a large number of wells are
drilled.
An oil field empties rapidly at the start
and yields lots of oil.
Then the flow slows down gradually.
Towards the end the flow eases to a
trickle.
An oil field yields its contents over the years, something like this.
Mid point
2nd half
When you plot the production of an aggregate of oil fields, it approximates a bell curve
Top of the curve
1st half
0 time
Gas
olin
e us
e
Contrast with car fuel tank
…and from then on, oil production
will decline year after year…
The top of the bell curve is whatpetroleum experts refer to as the oil peak or peak oil.
http://www.oilcrisis.com/
Remember that we’ve used up almost half of the world’s oil. When we reach the half-way point on a bell
Total Energy Use, 1965 to 2050, (Courtesy: Paul Chefurka)
Summary about Supply
• We will soon reach peak oil in (-1 to 5 years)
• After that we will have less energy for transportation every year than the previous year. This will go on indefinitely!
• Net total surplus energy for all uses will peak in 10 to 20 years
• After that we will have less energy every year than the previous year. This will go on indefinitely!
PEAK OILPEAK OIL
Part 2Part 2
-What are the consequences?What are the consequences?
-Extremely Serious!Extremely Serious!
We will soon reach the point where we can’t pump out enough to keep up with demand [Even if demand is constant!]. Then we go
into PERMANENT, IRREVERSIBLE decline!
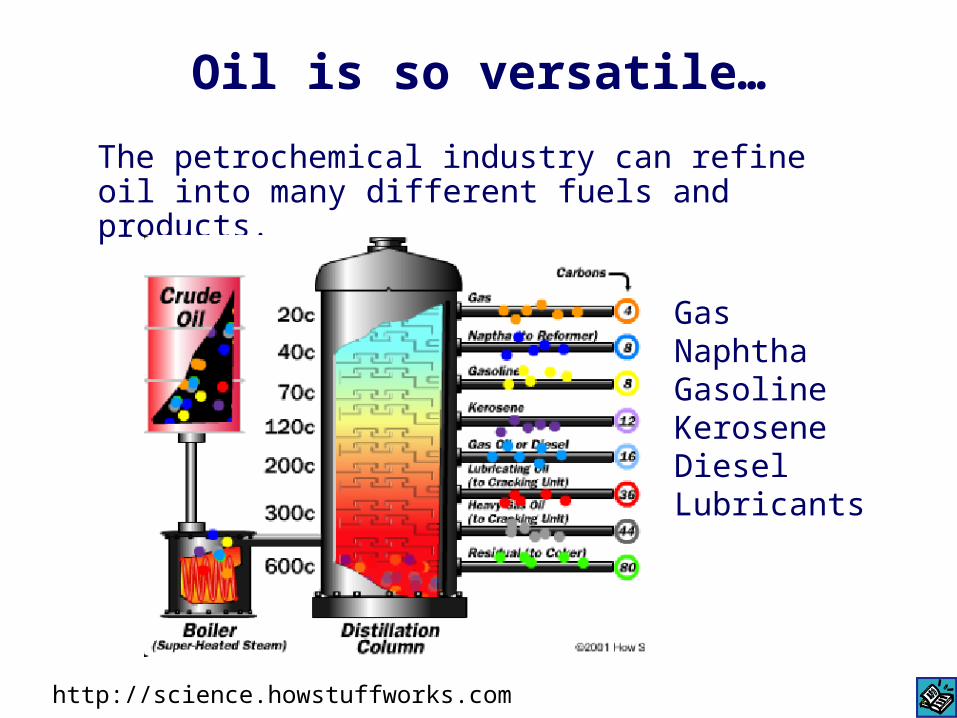
Oil is so versatile…
The petrochemical industry can refine oil into many different fuels and products.
GasNaphthaGasolineKeroseneDieselLubricants
http://science.howstuffworks.com
Including plastics, textiles, pharmaceuticals, paints, dies, asphalt
No easy scalable substitute for oil
Tourism only exists because cheap oil is available
Impact: Economic, Social and Cultural
• Growth Economics• Industries
– Tourism– Entertainment (movies in theaters, sports, theme parks, shopping) – Restaurants– Transportation (cars, trucks, oil-ships vs. electric (trains and cars), sail-
ships)– Banking – Finance – Housing (Suburban long commute vs. urban walking) – Farming, Solar, Wind, Geothermal, Lumbering, Energy equipment
• Family Structure– Grandparent-Parent-Child relationship– Husband-Wife relationship– Neighbor-Neigbor relationship (less house mobility)
==> Steady or Shrinking Economy
Resource Wars for Oil
• Farming “is an annual artificial catastrophe, and it requires the equivalent of three or four tons of TNT per acre for a modern American farm. Iowa's fields require the energy of 4,000 Nagasaki bombs every year.” 1
Fossil Fuel and Agriculture
1 Richard Manning; “The Oil We Eat”, Harpers, 2005. Mr. Manning was referring to the growing of the world’s major grain crops - corn, rice and wheat.
Fossil Fuel and Agriculture
• On average, the food industry uses 10 calories of fossil fuel energy to produce 1 calorie of food.
• For pork, it’s 68 calories for 1 calorie on your plate.
• For beef, it’s 35 calories for 1 calorie on your plate. 1
1 Richard Manning; “The Oil We Eat”, Harpers, 2005.
Population
First Oil Well ?
0
1
2
3
4
5
6
0 500 1000 1500 2000 2500
Anno Domini
Bill
ion
s o
f P
eop
le
OIL (1857)
PEAK OILPEAK OIL
Part 3Part 3
-What can we do about it?What can we do about it?
Is there an easy solution?
• No, not in reality.
• Conservation is a partial solution.
• Alternative fuels (solar, wind, geothermal) are likely to provide help but not for transport.
• New technology like battery-operated cars are likely to help a little only in the long run (> 20 years).
• Demand Reduction: We may need to unwind good portion of globalization; go back to simpler life styles, technologies that worked before.
Energy and basic human needs. The international relationship between energy use (kilograms of oil equivalent per capita) and the Human
Development Index (2000). (Source: UNDP, 2002, WRI, 2002)
Correct definition of a good lifeLess material consumption
More meaningful relationships with humans, plants, animals and location.
Mitigation
Type of Effort Importance
Conservation and efficiency, personal and societal High
Rapid deployment of existing technology, public transport, electric-transport, wind, solar-heat and
photovoltaic, geothermalHigh
Raising awareness by scientists and engineers of locals, media and policy makers
High
Applied engineering researchMedium term
(5 – 10 years)
Fundamental research done today will have scaled impact after 20 years
Long Term
(10 – 20 years)
Most important step
• A Depletion Protocol to cut imports to match depletion rate
• Will avoid wars
Priorities (USA)
-Tackle population growth
-Massive public education for reduction in demand (targets of 50 to 80% per capita in 10 years)
- Stop corn ethanol immediately
-World War II type effort for energy conservation in homes and buildings, new solid state lighting, CAFE standards
-World War II type effort for car and truck batteries, solar, wind, geothermal, and wave energy
-Greater use of arable land for growing crops such as oilseeds, willow for wood pellets, forest generation
-Buying locally produced goods where possible
Battery Materials for Transport
MaterialPower
DensityTotal Energy /
(unit mass)Material Peak
Production
Li ion (Li2CO3) High High Unknown
Zebra (NaMCl) Low High Unknown
Lead Acid High Low Unknown
Ultracapacitor
(BaTiO3) HighHigh Unknown
Others (NaS) High High Unknown
What can I do now?
• Work on:– Getting educated yourself first– Reducing your liquid fuels consumption by 50% to 80%– Educating family, friends, co-workers, policy-makers– Contacting your local, state, and federal representatives– Trying to reduce consumption in your line of work– Changing careers from energy consuming to energy producing
industries– Participating and influencing the media
• Teach children about these issues to continue dialogue into future generations
Your actions will make the future
If we do nothing
Techno-fantasy led techno-fixeswith no basis in reality
If we work very hard for 25 years!
Thank You
References:
• www.theoildrum.com
• www.energybulletin.net
• www.aspo-usa.org
• Beyond Oil: The View from Hubbert's Peak; By Kenneth S. Deffeyes
• Out of Gas: The End of the Age of Oil; By David Goodstein