Page 1
1
Energy Data Logger Using Internet Of Things (IoT)
By:
Tahir Ali 1424100
Qadir Khan 152488
Abdul Haleem 152482
Iyad Alawawda 142499
THIS THESIS SUBMITTED IN PARTIAL FULFILLMENT OF THE REQUIREMENTS FOR
TE DEGREE BACHELORS OF SCIENCE (B.S.C)
SUPERVISED BY
ASSOCIATE PROF. KHONDOKAR HABIBUL KABIR
DEPARTMENT OF ELECTRICAL AND ELECTRONIC ENGINEERING
ISLAMIC UNIVERSITY OF TECHNOLOGY (IUT), GAZIPUR, BANGLADESH
NOVEMBER, 2019
Page 2
2
DECLARATION OF CANDIDATE
I hereby declare that this project report is based on our original work except for citations and
Quotations, which have been duly acknowledge. We also declare that it has not been previously,
concurrently submitted for any other degree or award at IUT or other institutions.
Signature of Supervisor: Signature of Authors
Tahir Ali
(1424100)
Dr. Kandhokar Habibul Kabir
Associate. Professor
Department of Electrical &Electronics
Engineering
Islamic University of Technology (IUT) Qadir Khan
(152488)
Abdul Haleem
(152482)
Iyad Alawawda
(142499)
Page 3
3
DEDICATION
I would like to dedicate this thesis to my family who supported me through both good and tough
times. They always give me the motivation to move forward in my life.
Page 4
4
ACKNOWLEDEMENTS
All the praises are due to the merciful almighty ALLAH (SWT), the most exalted the most
Beneficent, the most Merciful who blessed me to be here at Islamic University of Technology
(IUT) for pursing the Bachelor’s degree.
Our Journey towards the Bachelor’s degree would not have been possible without the help of
many people. It is our great pleasure to take this opportunity to thank them for their support and
advice that we received.
We are highly grateful to our respected supervisor, AssociateProf. Dr. Khondokar Habibul
Kabir, for his guidance and support for this thesis. Without his bolstering influence as well as
buttress to move on, we would not be intrigued, let alone to work in this area of science. He truly
inspires us to be a genuine scientist and conduct research in a proper constructive way.
We would like to thank all the faculty members of EEE Dept., IUT for their continuous support
and encouragement. They provided a friendly environment for us to learn and grow.
Finally, our deepest of gratitude goes to our family who always listened to our sufferings and
enchanted us with their delightful words. Last but not the least we would like to thank our friends
who always supported us through this journey.
Page 5
5
ABSTRACT
IoT (Internet of things) has become an interesting topic in the field of technological research. It
is basically, interconnecting of devices with each other over the internet. We typically think of
the Internet of things (IoT) in terms of autonomous cars and smart homes, but some of the best
applications of IoT technology are in fields that are intensely practical. One such example is
Digital data logging which is a standalone device that can read electrical signals from
measurement devices and store the data to server. A Voltage sensor, Current sensor and
multichannel temperature logger is connected to developed Wi-Fi module Esp8266 (NodeMcu)
to measure and record voltage, current, energy and the temperature of different devices, home
appliances etc. capable of sensing voltage up to 440V, Current 350A and temperature with a
range of 0 °C up to 50 °C, depending on the type of sensor connected. The Esp8266 Wi-Fi
module receives the analogue voltage, current, temperature data from particular sensors and
conversion to digital data is performed. The voltage, current and temperature reading is then
uploaded to server via internet. So that it can be retrieved later on a computer. The measured data
will be stored at the intervals of 1second, 5 seconds, 10 seconds, or 1 minute, at user’s
preference. The logger will be disconnected automatically if exceeds preset values by user and
protected by single channel relay. Voltage, Current and Temperature sensors are tested to prove
they have the same properties for the output voltage, current, temperature and humidity
sensitivity before applied to the system.
This project is focused on the consumption of energy of a particular area and particular device. If
we calculate energy consumption for one-week of any particular site or electrical equipment,
then we can predict the consumption of energy for coming weeks, month and years of that site or
electrical equipment. Thus, we can save energy and save money. It has potential to become a
low-cost energy logger for laboratory, factory, home and offices use if the hardware is further
developed.
Page 6
6
Table of Contents
CHAPTER 01
Introduction
1.1 Introduction . . . . . . . . . . . . . . . . . . . . . . . . . . . . . . . . . . . . . . . . . . . . . . . . . . . . . . . . . . . . .. 14
1.2 Project Background . . . . . . . . . . . . . . . . . . . . . . . . . . . . . . . . . . . . . .. . . . . . . . . . . . . . . . . . 14
1.3 Problem Statement . . . . . . . . . . . . . . . . . . . . . . . . . . . . . . . . . . . . . . . . . . . . . . .. . . . . . . . . 14
1.4 Research Motivation . . . . . . . . . . . . . . . . . . . . . . . . . . . . . . . . . . . . . . . . . . . . . . . . . . . . . . 15
1.5 Project objective . . . . . . . . . . . . . . . . . . . . . . . . . . . . . . . . . . . . . . . . . . . . . . . . . . . . . . . . . . 15
1.6 Project Scope . . . . . . . . . . . . . . . . . . . . . . . . . . . . . . . . . . . . . . . . . . . . . . . . . . . . . . . . . . . 15
CHAPTER02
2 Internet of Thing (IoT)
2.1 Introduction . . . . . . . . . . . . . . . . . . . . . . . . . . . . . . . . . . . . . . . . . . . . . . . . . . . . . . . . . . . . . . 18
2.2 Internet of Things (IoT) . . . . . . . . . . . . . . . . . . . . . . . . . . . . . . . . . . . . . . . . . . . . . . . . . . . 19
2.3 IoT definition . . . . . . . . . . . . . . . . . . . . . . . . . . . . . . . . . . . . . . . . . . . . . . . . . . . . . . . . . . . . . 20
2.4 IoT elements . . . . . . . . . . . . . . . . . . . . . . . . . . . .… . . . . . . . . . . . . . . . . . . . . . . . . . . . . . . . . 22
2.5 IoT applications . . .. . . . . . . . . . . . . . . . . . . . . . . . . . . . . . . . . . . .23
2.6 Signal sensing method . . . . . . . . . . . .. . . . . . . . .. . . . . . . . . . . . . . . . . . . . . . . . . . . . . . . . . . 24
2.7 Summary . . . . . . . . . . . . . . . . . . . . . . . . . . . . . . . . . . . . ... . . . . . . . . . . . . . . . . . . . . . . . . ., . 24
Page 7
7
CHAPTER 03
3 Hardware and Software
3.1 Introduction . . . . . . . . . . . . . . . . . . . . . . . . . . . . . . . . . . . . . . . . . . . . . . . . . . . . . . . . . . . . 26
3.2 Data Logger Description. . . . . . . . . . . . . . . . . . . . . . . . . . . . . . . . . . . . . . .. . . . . . . . . . . . . . .26
3.3 Choice of Components. . . . . . . . . . . . .. . . . . . . . . . . . . . . . . . . . . . . . . . . . . . . . . . . . . . 27
3.3.1 Bread Board . . . . . . . . . . . . . . . . . . . . . . . . . . . . . . . . . . . . . . . . . . . . . . . . . . . . . . . . . . .28
3.3.2 Connecting wires . . . . . . . . . . . . . . . . . . . . . . . . . . . . . . . . . . . . . . . . . . . . . . . . . . . . . 29
3.3.3 Esp8266 . . . . . . . . . . . . . . . . . . . . . . . . . . . . . . . . . . . . . . . . . . . . . . . . . . . . . . . . . . . . . . .29
3.3.4 Current sensor . . . . . . . . . . . . . . . . . . . . . . . . . . . . . . . . . . . .. . . . . . . . . . . . . . . . . . . . . .31
3.3.5 DHT11 Sensor. . . . . . . . . . . . . . . . . . . . . . . . . . . . . . . . . . . . . . . . . . . . . . . . . . . . . . . . . . 32
3.3.6 Single Channel Relay . . . . . . . . . . . . . . . . . . . . . . . . . . . . . . . . . . . . . . . . . . . . . . . . . . . . . .34
3.4 Hardware Mechanism . . . . . . . . . . . . . . . . . . . . . . . . .. . . . . . . . . . . . . . . . . . . . . . . . . . . . . ..36
3.4.1 Site allocation . . . . . . . . . . . . . . . . . . . . . . . . . . . . . . . . . . . . . . . . . . . . . . . . . . . . . . . . . . . .36
3.4.2 Data Logging. . . . . . . . . . . . . . . . . . . . . . . . . . . . . . . . . . . . . . . . . . . . . . . . . . . . . . . . . . . . 36
3.5 Software . . . . . . . . . . . . . . . . . . . . . . . . . . . . . . . . . . . . . . . . . . . . . . . . . . . . . . . . . . . . . . . . .36
3.5.1 Arduino IDE. . . . . . . . . . . . . . . . . . . . . . . . . . . . . . . . . . . . . . . . . . . . . . . . . . . . . . . . . . . . . 36
3.5.2 Programming of Esp8266 . . . . . . . . . . . . . . . . . . . . . . . . . . . . . . . . . . . . . . . . . . . . . . . . . . 37
3.5.3 Web Interfacing. . . . . . . . . . . . . . . . . . . . . . . . . . . . . . . . . . . . . . . . . . . . . . . . . . . . . . . . . . 44
3.5.4 Screen-shot of Web page. . . . . . . . . . . . . . . . . . . . . . . . . . . . . . . . . . . . . . . . . . . . . . . . . . . 44
3.5.5 Screen-shot of Data Acquisition . . . . . . . . . . . . . . . . . . . . . . . . . . . . . . . . . . . . . . . . . . . . . 46
3.6 Summary. . . . . . . . . . . . . . . . . . . . . . . . . . . . . . . . . . . . . . . . . . . . . . . . . . . . . . . . . . . . . . . . . 46
Page 8
8
CHAPTER 04
4 Working Process
Working Process . . . . . . . . . . . .. . . . . . . . . . . . . . . . . . . . . . . . . . . . . . . . . . . . . . . . . . . . . . . . . . 48
4.1 Block Diagram . . .. . . . . . . . . . . . . . . . . . . . . . . . . . . . . . . . . . . . . . . . . . . . . . . . . . . . . . . . . 48
4.2 Flow Chart . . . . . . . . . . . . . . . . . . . . . . . . . . . . . . . . . . . . . . . . . . . . . . . . . . . . . . . .. . . . . . 49
4.3 Project View . . . . . . . . . . . . . . . . . . . . . . . . . . . . . . . . . . . . . . . . . . . . . . . . . . . . . . . . . . . . . . 50
CHAPTER 05
5 Experimental Studies
5.1 Hardware Implementation . . . . . . . . . .. . . . . . . . . . . . . . . . . . . . . . . . . . . . . . . . . . . . . . . . . .53
5.2 Data analysis, Result and Decision . . . . . . . . . . . . . . . . . . . . . . . . . . . .. . .. . . . . . . . . . . . . . .53
CHAPTER 06
6 Device Impact
6.1 Health and Safety . . . . . . . . . . . . . . . . . . . . . . . . . . . . . . . . . . . . . . . . . . . . . . . . . . . . . . . . . . 61
6.2 Lower Energy Consumption . . . . . . . . . . . . . . . . . . . . . . . . . . . . . . . . . . . . . . . . . . . . . . . . . 61
CHAPTER 07
7 Conclusion and Future Work
7.1 Future Work . . . . . . . . . . . . . . . . . . . . . . . . . . . . . . . . . . . . . . . . . . . . . . . . . . . . . . . . . . . . . 63
7.2 Conclusion. . . . . . . . . . . . . . . . . . . . . . . . . . . . . . . . . . . . . . . . . . . . . . . . . . . . . . . . . . . . . . . .64
REFERNCES. . . . . . . . . . . . . . . . . . . . . . . . . . . . . . . . . . . . . . . . . . . . . . . . . . . . . . . 65
Page 9
9
LIST OF FIGURES
Figure 2.1. Smart home full of smart and sensing IoT devices.
Figure 2.2. The Internet of Things emergence between 2008 and 2009
Figure 2.3. The IoT evolution
Figure 2.4. The elements of the IoT
Figure 3.1. Bread Board
Figure. 3.2. Connecting Wires
Figure 3.3. ESP8266 (Wi-Fi Module)
Figure 3.4. ACS712 Current Sensor
Figure 3.5. Voltage vs. Current graph
Figure 3.6. DHT11 (Temperature and Humidity) sensor
Figure3.7. Single channel relay
Figure 3.8. Arduino IDE
Figure 3.9. Webpage to Display Parameters
Figure 3.10.Data acquisition
Figure 5.1. Humidity Graph
Figure 4.1. Block Diagram
Figure 4.2. Flow chart
Figure 5.2. Temperature graph
Figure 5.3. Energy graph
Page 10
10
Figure 5.4. Voltage graph
Figure 5.5. Current graph
Figure 5.6. Voltage, Temperature and humidity values
Figure. 5.7. Temperature, Humidity and Current values on mobile
Figure. 5.8. Voltage and current values on mobile
Page 11
11
LIST OF TABLES
Table 3.1Components of Project
Page 12
12
LIST OF ABBREVIATIONS
IoT Internet of Things
V Voltage
C Current
OppS Opportunistic sensing
PC Personal Computers
IBSG Internet Business Solutions Group
RFID Radio-frequency identification
IERC European Research Cluster on the Internet of Things
WSNs Wireless Sensor Networks
BLE Bluetooth Low Energy
RH Relative humidity
NO Normally-open
NC Normally-closed
Page 13
13
CHAPTER
1
INTRODUCTION
Page 14
14
1 Introduction
This chapter introduces the main areas in this thesis, which are linked to the Internet of Things
and opportunistic sensing paradigms. The chapter presents the motivation and defines the aims
of this research work. Further, the thesis contributions are highlighted. Also, this chapter
includes a section that introduces the sustainability aspects of this thesis.
1.1 Project Background
Energy data logger is energy monitoring devices that easy to use for analyzing the energy
consumption on electrical appliance. This device records data overtime and store it in to cloud
for monitoring process. Furthermore, it also displays the energy consumption in real time via
ThingSpeak. It is very useful for monitoring efficiency of the electrical usage so people do not
waste the energy. The element of data logging system for this project is shows in Figure 1.0.The
Energy Data Logger can detect the unseen fault in appliance such overloading. It will display
increasing in energy consumption directly to the cloud. A faulty appliance can cause by several
effect mainly in motor powered appliance like washing machine. The communication between
hardware and computer are establishing using computer Hyper-Terminal link that read the
data from hardware. This energy meter can act as precaution device that tells user the state
of their appliance. User can repair their appliance before it’s too late because they have
been warned by the spiking in energy usage by the faulty appliance.
1.2 Problem Statement
The conventional Energy Meter only displays numbers that must be calculated later to get the
actual energy usage. Because of this the consumer do not aware of their energy usage and will
use it unintentionally although the energy usage is exceeded their monthly expectation.
As the consumers do not know their energy usage, they only know the usage at the end of the
month and nothing they can do to overcome this problem. This problem can affect more to the
consumer that has big family with so many appliances running at once. The energy meter also
cannot record the energy usage that can be monitored by consumer in order to prevent over
Page 15
15
consuming the energy. They also cannot analyze the energy consumption if some faulty
appliance making energy usage higher than it should.
1.3 Research Motivation
Nowadays, big buildings are being equipped with an increasing number of electrical devices.
Some building has bulk number of electrical and electronics devices. The monthly bill is due for
let’s say a whole apartment; it will not describe that which device has consumed more energy.
For that reason, we are suggesting installation of energy data loggers to monitor the consumption
of energy particularly. Thus, we can save energy by monitoring the consumption of electrical
energy for particular device using over use and save the energy and money at a time.
1.4 Project Objective
1. The first objective of this project is to design a device and system that can display energy
usage in real-time in kWh unit. The data from the energy meter can also be display in computer
using serial communication.
2. Then, to record energy usages in user residence so the energy consumption in that residence
can be monitored in order to use energy efficiently. The recording or logging process is
controlled by the PIC and the data taken is stored in EEPROM. The data can be access using
computer interface generated by Microsoft Visual Basic.
3. The appropriate graph can be also generated to give user clearer view of their energy
consumption. This graph will analyze and evaluate of the total energy consumption a lot easier.
The accomplishing in building this system can surely make user more aware and effective in
using electrical energy.
1.5 Project Scope
The scope of this project will cover both software and hardware development. The hardware part
is about designing suitable circuit, Printed Circuit Board (PCB) layout and also includes the
correct component to make the hardware work as desired. After completing assembles the
component, hardware test is needed to confirm it functionality. While for software development,
Page 16
16
it will include developing the system coding using C++ for the Esp8266. The system coding
must correctly integrate with the project input/output component such sensors and cloud display.
Proteus 7.8 were used as simulation software for both hardware and software development.
Then, the interface for the computer to displaying the data from project is created using
ThingSpeak. The interface must properly in sync with the hardware so it can read the data. The
software such ThingSpeak and its driver also needed in order to make the interface working.
Page 17
17
CHAPTER
2
INTERNET OF THINGS (IoT)
Page 18
18
2.1 Introduction
The modern world of technologies develops rapidly and brings considerable changes to human
life. Gradually, everything that surrounds people in their everyday life becomes smart and makes
it easier and more comfortable. Such smart things that already exist are smart devices (e.g. smart
phones, tablets, watches, TV), smart transportation (e.g. cars, buses, trains), smart buildings (e.g.
houses, business centers, shopping malls). They serve a human user in automatic and
collaborative manner while the user does not need to make big efforts to exploit them. They
communicate with each other, thereby, creating a network that can also interact with the world.
This is enabled via the Internet of Things (IoT) that interconnects different objects like smart
phones, watches, cars, sensors, etc. According to Gartner, by the end of this year (2019) the
number of connected things which will be used all around the world will reach 8.4 billion (see
Figure 1). This number has increased from 2019 to more than 21% and will grow up to 20.4
billion by 2020. This can cause to concern about the amount of energy consumed by these
devices. However, the IoT can also become one of the crucial drivers of green Information and
Communication Technologies (ICT), if there is an increased focus on energy efficiency.
According to GeSI’s report SMARTer 2030, ICT can facilitate to reduce the amount of global
CO2 emissions by 20 till 2030. Therefore, academia, industry, and government are interested in
developing the IoT technologies and systems that introduce sustainable development to the
world. The authors of Green internet of things for smart world highlighted green ICT principles
leading to energy efficiency improvement of the IoT area. One of the principles is a length
minimization of the wireless data path. It is important especially for IoT systems gathering and
transferring an enormous amount of data via wireless connections. The principle can be achieved
using opportunistic sensing (OppS) which utilizes the opportunity of collecting data about an
environment from IoT devices (sensors) using mobile smart gadgets (e.g. smart phones, tablets,
PCs etc.) carried by people, without their direct involvement. Thus, there is no need in
predefined infrastructure and additional hardware. Moreover, as the devices and sensors
communicate directly without mediator hops, it reduces the usage of bandwidth and,
consequently, energy consumption.
Page 19
19
Figure 2.1. Smart Home full of smart and sensing IoT devices
The world’s rapid development has also brought negative consequences. One of them is over use
of electrical energy. Therefore, the knowledge of over use of electrical energy becomes vital,
because it affects our rural areas through load shedding. There are many people who just turn on
lights, different devices and don’t turn them off causing wastage of electricity and huge amount
of electricity bills. Moreover, the recent search states that the demand of electricity will be 79%
more in 2050 as compared to 2019.
Notably, modern people spend, on average, about 90% of their time indoors where they use
different electric and electronic appliances causing the wastage of electrical energy. It is
important to monitor the consumption of electricity and the wastage of electricity.
2.2 Internet of Things (IoT)
Internet of Things (IoT) plays a huge role in the modern world. It is a major enabling technology
for future smart cities. In this section, we review this paradigm and its components.
Page 20
20
2.3 IoT definition
The Internet of Things (IoT), or Internet of Objects, was proposed as a concept by Kevin Ashton
in 1999. He referred it to interconnected objects with radio-frequency identification (RFID)
technology. However, there is still no exact definition of the IoT paradigm today. Many visions
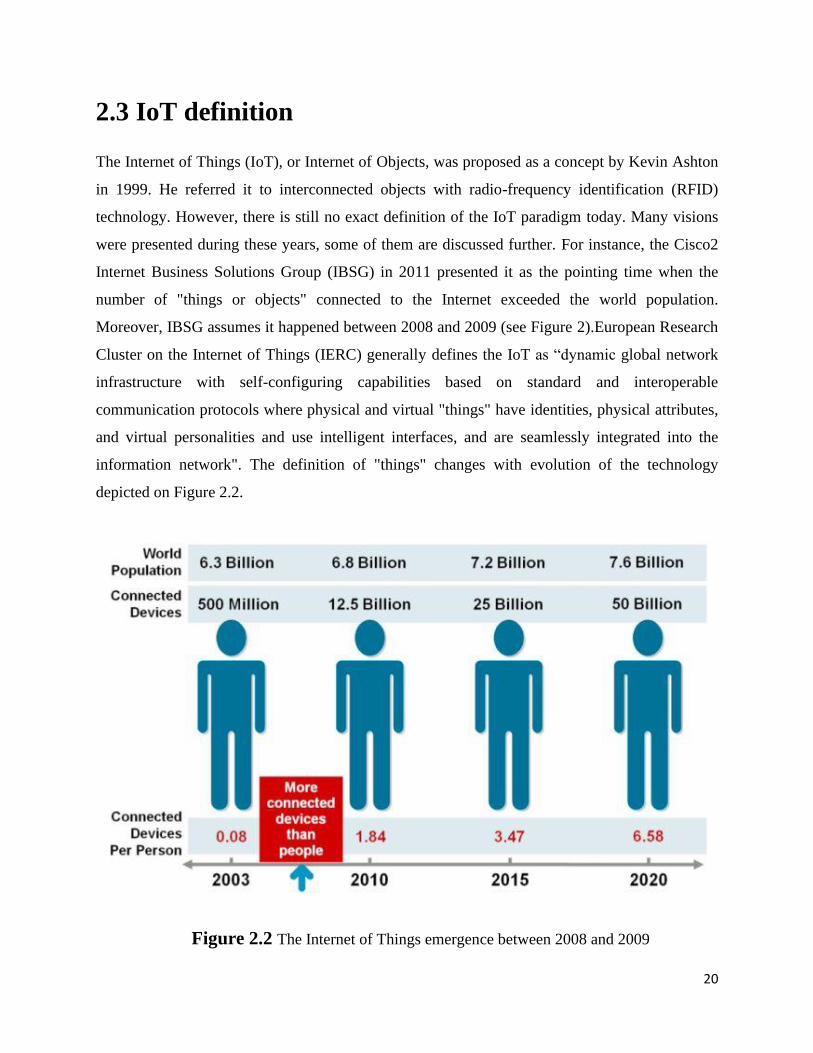
were presented during these years, some of them are discussed further. For instance, the Cisco2
Internet Business Solutions Group (IBSG) in 2011 presented it as the pointing time when the
number of "things or objects" connected to the Internet exceeded the world population.
Moreover, IBSG assumes it happened between 2008 and 2009 (see Figure 2).European Research
Cluster on the Internet of Things (IERC) generally defines the IoT as “dynamic global network
infrastructure with self-configuring capabilities based on standard and interoperable
communication protocols where physical and virtual "things" have identities, physical attributes,
and virtual personalities and use intelligent interfaces, and are seamlessly integrated into the
information network". The definition of "things" changes with evolution of the technology
depicted on Figure 2.2.
Figure 2.2 The Internet of Things emergence between 2008 and 2009
Page 21
21
. Figure 2.3. The IoT evolution
• Things-oriented - focused on the "objects" and on approaches for their identification and
integration;
• Internet-oriented - adapting IP to make anything addressable and reachable from
anywhere;
• Semantics-oriented - utilizing semantic technologies for data managing, storing and
representing in the continuously growing network of things.
• They state that the IoT is a combination of these visions. To summarize, the IoT implies
an infrastructure of smart devices (e.g. smart phones, tablets, laptops etc.) connected to
the world-wide network where they communicate and exchange data with other
“objects". Moreover, it allows sensing and remotely controlling such “objects” as
sensors, and also processing any received information without human intervention.
Page 22
22
2.4 IoT elements
The IoT systems do not have standardized list of the components they can contain. However,
defines six elements which deliver the IoT functionality (see Figure 4):
Figure 2.4. The elements of the IoT
• Identification within the IoT paradigm implies naming (setting an ID and address) and
matching services with their demand;
• Sensing means data collection from the network objects (smart sensors, actuators,
wearable devices) and send it to some central sink like database or cloud;
• Communication includes technologies linking all objects together while consuming low
power like Wi-Fi, Bluetooth, Z-wave, LTE-Advanced and etc.;
• Computation represents processing units (e.g. microprocessors and micro-controllers like
Arduino, Esp8266, Intel, Galileo) and software applications (e.g. Blynk and ThingSpeak
IoT)which execute computational ability of "things";
• Services perform some work for different applications;
• Semantics refer to the ability of knowledge extraction (recognition and analysis of data)
using different machines in a smart way.
The first three elements are also highlighted in as a class of the enabling technologies. also
emphasized other five IoT components from the more high-level perspective:
• Radio Frequency Identification (RFID),
Page 23
23
• Wireless Sensor Networks (WSNs),
• addressing schemes,
• data storage and analytics,
• Visualization.
Indeed, the first four technologies perform features of the communication, sensing,
identification and semantics elements described above. Noteworthy, WSNs play one of the
crucial roles in the IoT paradigm as they bring a wide range of applications, through
capability of sensing different environmental phenomenon. However, WSNs within the IoT
paradigm differs from the conventional ones in terms of using smarter devices instead of
simple sensors constrained with only sensing abilities. These devices have computational
ability and consist of several different sensors. Therefore, they can make certain decisions
autonomously and provide different services. Further, in this thesis, they are called sensing
IoT devices. Thus, the elements defined by can be considered as basic components of the IoT
systems. Further, this thesis takes into account these components during development of the
proposed system.
2.5 IoT applications
The wide capabilities of the IoT bring an opportunity to apply it in all spheres of human life
in order to enhance its quality. The major areas where the IoT is currently being integrated
are smart homes/buildings, smart cities, environmental monitoring, healthcare, smart
business/inventory and product management, security and surveillance. The general
application scenario implies a system containing smart devices, sensors for different
measurements communicating with each other and some central station via RF technologies
like Wi-Fi, Bluetooth Low Energy (BLE), ZigBee and etc. The station collects and analyses
data from them. According to the analysis, it can make some decisions and notify the system
to perform some action. Thereby, the system needs a minimal human involvement to the data
processing. There are still many fields where the IoT can be introduced to contribute towards
their improvement and automation. We have chosen to apply our system to energy data
logging.
Page 24
24
2.6 Signal sensing method
The NodeMcu Esp8266 with the help of sensors connected to it senses the different
parameters like Voltage, Current, Temperature, Humidity and energy. After sensing all
parameters, it sends the data to the web server where we can see our real time data uploading
and update with 10 seconds interval of time
2.7 Summary
This chapter has discussed the IoT and OppS paradigms in details. It has reviewed several
works developed in this domain. Due to this, we identified a gap of these systems. They do
not utilize any specific approach to collect the raw data from sensing actuators to enhance the
efficiency of their system. In the implementations, they used to collect data with mobile
smart devices from nearby sensors thereby applying OppS paradigm. They do not consider
that these sensors might produce low accuracy data or even are not connectible because their
signal strength is too low. However, the introduction of an approach that identifies efficient
sensors can improve the effectiveness of this stage in the IoT systems. This idea came to us
while reviewing the technique widely used in WSNs called kNN query that selects the k
sensors from which the data is collected. Mostly, we have inspired by 3DkNN that uses a
mobile smart device to collect the data. Moreover, we have chosen a method that helps to
enable our idea of ranking the sensors that are available in radio range and then pick k top
sensors to collect data from.
Page 25
25
CHAPTER
3
HARDWARE AND SOFTWARE
Page 26
26
3.1 Introduction:
Monitoring and data logging are an essential part for the proper and efficient operation of any
electrical energy system. The monitoring system is used to protect the overall system especially
over use of energy. Usually, almost all monitoring system for electrical system displays voltage,
current, energy, temperature and humidity on the system cloud. Recently wireless connection of
Bluetooth and Wi-Fi is used for both local or remote control and monitoring system design. Data
logging of an energy system can be done by storing all monitoring parameters using different
type of analog or digital sensors. Data is stored in the data logger device or on the cloud. This
memory can be increased or update depending on the user requirement. The complexity of the
data logger depends on the required numbers of the sensor, data collecting device and the
technology or method using for the acquisition of data.
Energy monitoring and data logging systems require a huge number of input parameters and
these types of system is very expensive [32]. There are some commercial monitoring systems for
electrical energy system with the option of on-grid or off the grid. However, this complex and
expensive monitoring and data logging system is not suitable for small energy system. To
overcome the technological and cost limitation, a NodeMcu, ESP8266, and Wi-Fi based data
logger have been designed to provide a low cost, reliable and user-friendly monitoring system
for energy data logging system, mainly for the rural electrification programs in developing
countries in Asia and Africa.
3.2 Data logger Description:
To provide a low-cost low power energy data logger for a small monitoring for the rural
electrification in the developing countries like Bangladesh, India, Nepal etc. an ESP8266
microcontroller-based system is designed using Arduino IDE software. It has a simple local web
server which is configured using C language, and the monitored parameters are stored on the
cloud. All the monitoring parameters are shown in a real time data and can be download from the
web page through an internet browser like Firefox Mozilla, Google Chrome or even Microsoft
Edge by the end user. To measure the current, IC aACS712 Current Sensor issued. Which can
Page 27
27
measure up to 250A? Voltage sensor is built in proteus to measure the voltage. Temperature and
Humidity sensor is used to measure the temperature up to 50C and humidity up to 80. The
detailed hardware is design discussed throughout this chapter. A web page for displaying those
monitoring parameters is also developed which is discussed in the next chapter. It is the heart of
our model. We have used several components to fulfill the prototype model.
In this section we are going to discuss about all those components as well as software we
used to build the system.
3.3 Choice of component
The main portion of a prototype model is its components which are going to be used to operate
the whole system. In this case it is very necessary to choose those components very carefully. In
addition, if we do not choose components carefully, there might be some problems. For instance,
when we will integrate the whole circuit together, some of the components might not perform
well, there can have certain voltage drop or elements might not get proper power
supply. In this case the whole system can be failed whereas the whole circuit integration is
correct. So, perfect choice of components is really a big issue while making prototype models.
Besides, costing is a big issue here as in the market, everyone generally prefers a good output
with a very less budget. That is why for making a good product we all should
bear in mind the cost minimization. We have selected different components to make the
device physically. We tried to use cheap and effective as well as market available components.
To build this project we have used different components. Table-4.1 shows the component list of
our prototype model. We have tried to show almost all the characteristics and behavior of
different component that are used as a hardware part in our model.
Page 28
28
TABLE 3.1Components of Project
Serial Components Quantity
1 Vero board 1
2 breadboard 1
3 NodeMcu Esp8266 1
4 DTH11 Temperature and Humidity Sensor 1
5 Single Channel Relay 1
6 Resistors 8
7 ACS712-5A Current sensor 1
8 Voltage Sensor 1
9 IC 4051 1
10 Connecting Wires 25
11 Male connector 1
12 Female Header 4
13 +3v supply Charger 1
3.3.1 Breadboard
A breadboard is a solder less device for temporary prototype with electronics and test circuit
designs. Most electronic components in electronic circuits can be interconnected by inserting
their leads or terminals into the holes and then making connections through wires where
appropriate. The breadboard has strips of metal underneath the board and connects the holes on
the top of the board. The metal strips are laid out as shown below. The top and bottom rows of
holes are connected horizontally and split in the middle while the remaining holes are connected
vertically.
Figure3.1.Bread Board
Page 29
29
3.3.2 Connecting Wires
Connecting wires allows an electrical current to travel from one point on a circuit to another
because electricity needs a medium through which it can move. Most of the connecting wires are
made up of copper or aluminum. Copper is cheap and good conductivity. Instead of the copper,
silver can also be used which has high conductivity but it is too costly to use.
Fig. 3.2Connecting Wires
3.3.3 Esp8266
The ESP8266 Wi-Fi Module is a self-contained SOC with integrated TCP/IP protocol stack that
can give any microcontroller access to your Wi-Fi network. The ESP8266 is capable of either
hosting an application or offloading all Wi-Fi networking functions from another application
processor. Each ESP8266 module comes pre-programmed with an AT command set firmware,
meaning, you can simply hook this up to your Arduino device and get about as much Wi-Fi-
ability as a Wi-Fi Shield offers (and that's just out of the box)! The ESP8266 module is an
extremely cost-effective board with a huge, and ever growing, community. Figure 6 depicts
esp8266
Page 30
30
Figure 3.3ESP8266 (Wi-Fi Module)
This module has a powerful enough on-board processing and storage capability that allows it to
be integrated with the sensors and other application specific devices through its GPIOs with
minimal development up-front and minimal loading during runtime. Its high degree of on-chip
integration allows for minimal external circuitry, including the front-end module, is designed to
occupy minimal PCB area. The ESP8266 supports APSD for VoIP applications and Bluetooth
co-existence interfaces; it contains a self-calibrated RF allowing it to work under all operating
conditions, and requires no external RF parts.
Specification:
• Open-source
• Interactive
• Programmable
Page 31
31
• Low cost
• Simple
• Smart
• WI-FI enabled
• USB-TTL included
• Plug and Play
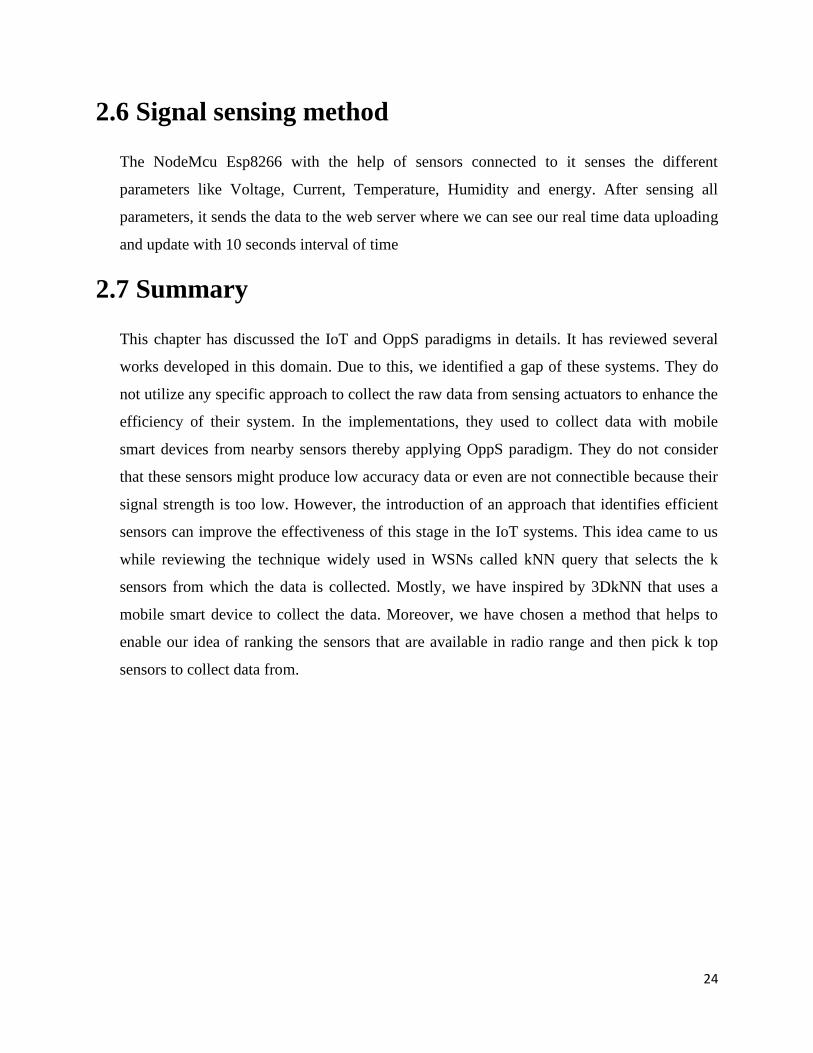
3.3.4 Current Sensor
ACS712 Current Sensor IC is used to measure the current of different electrical devices. The
cool thing about an ACS712 is that current is measured is measured in two directions. What that
means that if we sample fast enough and long enough, we sure to find the peak in one direction
and the peak in another direction as the ACS712 have 5 μs output rise time in response to step
input current. We are measuring AC current of 50Hz i.e. 20mSec per cycle and we get around
4000 Samples in one cycle.
Figure 3.4.ACS712 Current Sensor
Page 32
32
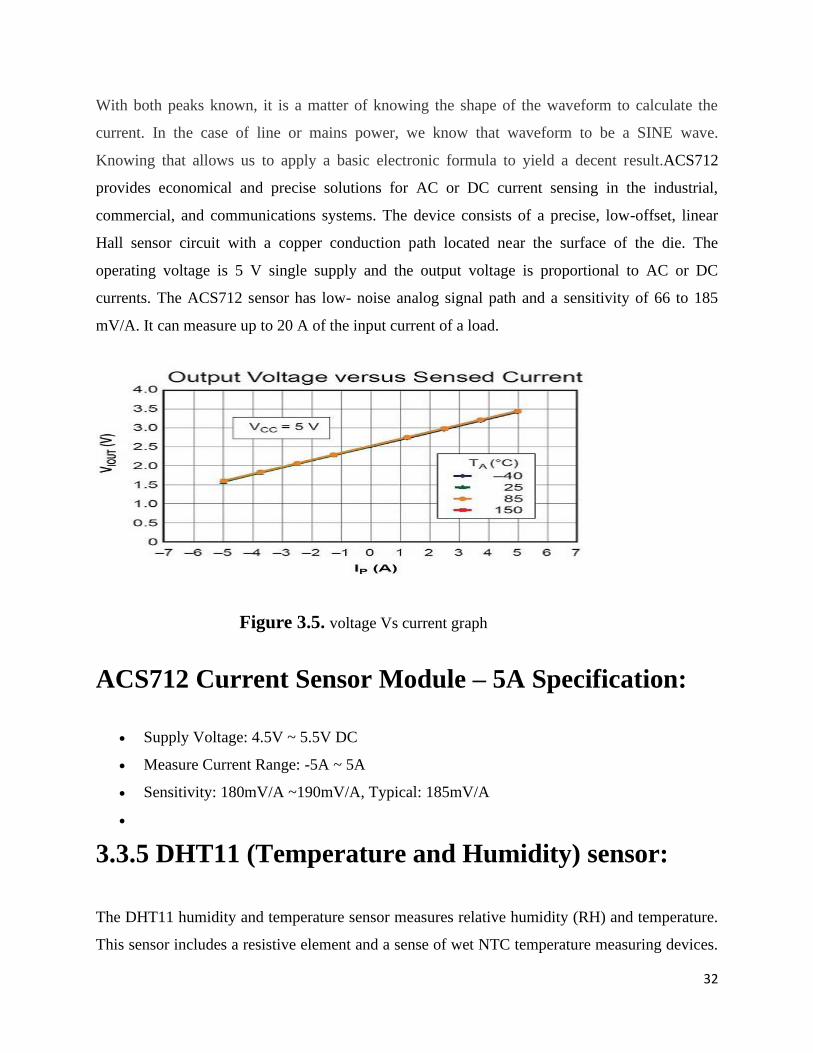
With both peaks known, it is a matter of knowing the shape of the waveform to calculate the
current. In the case of line or mains power, we know that waveform to be a SINE wave.
Knowing that allows us to apply a basic electronic formula to yield a decent result.ACS712
provides economical and precise solutions for AC or DC current sensing in the industrial,
commercial, and communications systems. The device consists of a precise, low-offset, linear
Hall sensor circuit with a copper conduction path located near the surface of the die. The
operating voltage is 5 V single supply and the output voltage is proportional to AC or DC
currents. The ACS712 sensor has low- noise analog signal path and a sensitivity of 66 to 185
mV/A. It can measure up to 20 A of the input current of a load.
Figure 3.5. voltage Vs current graph
ACS712 Current Sensor Module – 5A Specification:
• Supply Voltage: 4.5V ~ 5.5V DC
• Measure Current Range: -5A ~ 5A
• Sensitivity: 180mV/A ~190mV/A, Typical: 185mV/A
•
3.3.5 DHT11 (Temperature and Humidity) sensor:
The DHT11 humidity and temperature sensor measures relative humidity (RH) and temperature.
This sensor includes a resistive element and a sense of wet NTC temperature measuring devices.
Page 33
33
It has excellent quality, fast response, anti-interference ability and high cost performance
advantages. Relative humidity is the ratio of water vapor in air vs. the saturation point of water
vapor in air. Relative Humidity = (density of water vapor / density of water vapor at saturation) x
100% The DHT11 calculates relative humidity by measuring the electrical resistance between
two electrodes. The humidity sensing component of the DHT11 is a moisture holding substrate
(usually a salt or conductive plastic polymer) with the electrodes applied to the surface. When
water vapor is absorbed by the substrate, ions are released by the substrate which increases the
conductivity between the electrodes. The change in resistance between the two electrodes is
proportional to the relative humidity. Higher relative humidity decreases the resistance between
the electrodes while lower relative humidity increases the resistance between the electrodes.
Inside the DHT11 you can see electrodes applied to a substrate on the front of the chip: The
temperature readings from the DHT11 come from a surface mounted NTC temperature sensor
(thermistor) built into the unit.
Specification:
• Operating Voltage: 3.5V to 5.5V
• Operating current: 0.3mA (measuring) 60uA (standby)
Figure 3.6DHT11 (Temperature and Humidity) sensor
Page 34
34
• Output: Serial data
• Temperature Range: 0°C to 50°C
• Humidity Range: 20
• Resolution: Temperature and Humidity both are 16-bit
• Accuracy: ±1°C and ±1
3.3.6 Single Channel 5v Relay
A relay is an electrically operated device. It has a control system and (also called input circuit or
input contactor) and controlled system (also called output circuit or output contactor). It is
frequently used in automatic control circuit. To put it simply, it is an automatic switch to
controlling a high-current circuit with a low-current signal.
The advantages of a relay lie in its lower inertia of the moving, stability, long-term reliability and
small volume. It is widely adopted in devices of power protection, automation technology, sport,
remote control, reconnaissance and communication, as well as in devices of electro mechanics
and power electronics. Generally speaking, a relay contains an induction part which can reflect
input variable like current, voltage, power, resistance, frequency, temperature, pressure, speed
and light etc. It also contains an actuator module (output) which can energize or de-energize the
connection of controlled circuit. There is an intermediary part between input part and output part
that is used to coupling and isolate input current, as well as actuate the output. When the rated
value of input (voltage, current and temperature etc.) is above the critical value, the controlled
output circuit of relay will be energized or de energized.
NB: input into a relay can be divided into two categories: electrical quantities (including current,
voltage, frequency, power etc.) and non- electrical quantities (including temperature, pressure,
speed, etc.)
Page 35
35
Features
The features of 1-Channel Relay module are as follow:
1) Good in safety. In power system and high voltage system, the lower current can control the
higher one.
2) 1-channel high voltage system output, meeting the needs of single channel control.
3) Wide range of controllable voltage.
4) Being able to control high load current, which can reach 240V, 10A.
5) With a normally-open (NO) contact and a normally-closed (NC) contacts.
Interface Connecting and Setting
Fig3.7single channel relay & interface
Page 36
36
3.4 Hardware Mechanism
Hardware mechanism is the most important part of this project. In this section we have
discussed how hardware part will work.
3.4.1 Site allocation
We have to select the site for collect the data logging.
3.4.2 Data logging:
We will connect the energy data logger to our desired site to collect the data of energy
consumption. The data logger after connecting to load collects the data and transfers the real time
data to the Server. We can access our data easily on server.
3.5 Software
In our prototype model we are using the Arduino IDE software to program the NodeMCU
ESP8266 micro controllers and ThingSpeak app to configure the android
control system.
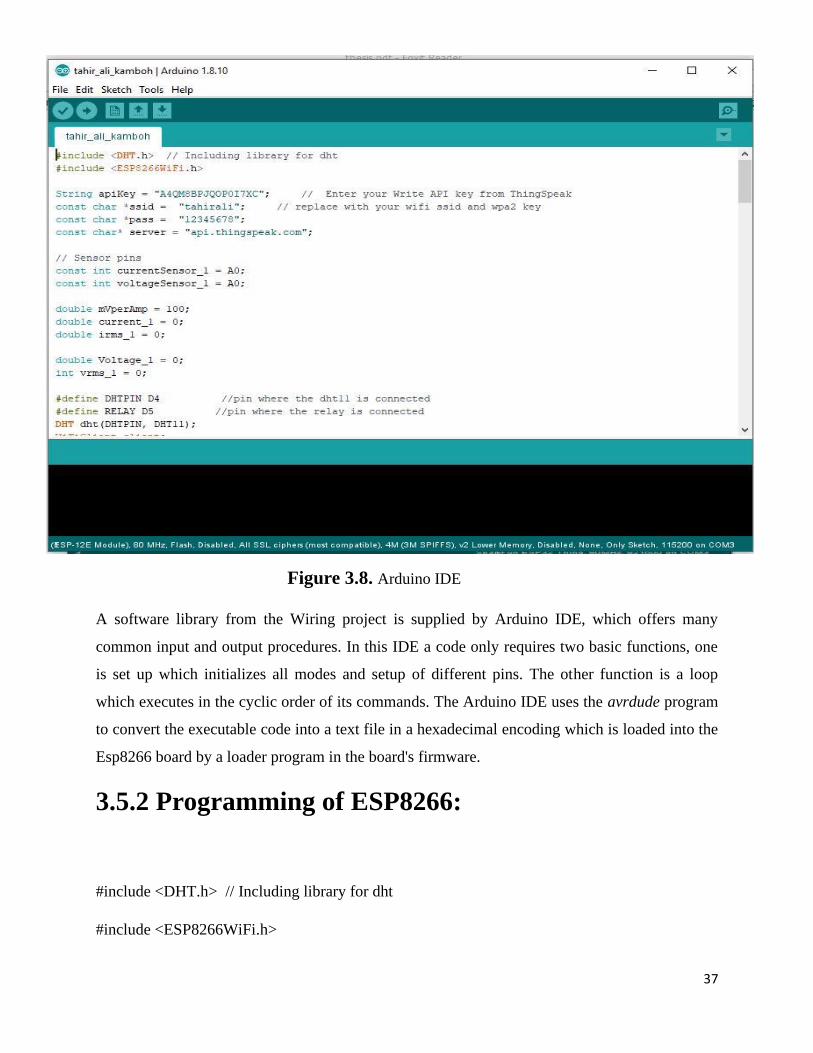
3.5.1 Arduino IDE:
Arduino integrated development environment (IDE) is a cross-platform application which
is written for both Windows and Linux operating systems using Java programming
language. Arduino IDE is developed by Arduino and it originated from the IDE for the
languages Processing and Wiring. The IDE consists of a text editor for writing code, a
compiler, and debugger to compile the code and checking errors in the code. It supports
the languages C and C++ using special rules of code structuring. Figure 3.8 shows an
Arduino IDE sketch.
Page 37
37
Figure 3.8. Arduino IDE
A software library from the Wiring project is supplied by Arduino IDE, which offers many
common input and output procedures. In this IDE a code only requires two basic functions, one
is set up which initializes all modes and setup of different pins. The other function is a loop
which executes in the cyclic order of its commands. The Arduino IDE uses the avrdude program
to convert the executable code into a text file in a hexadecimal encoding which is loaded into the
Esp8266 board by a loader program in the board's firmware.
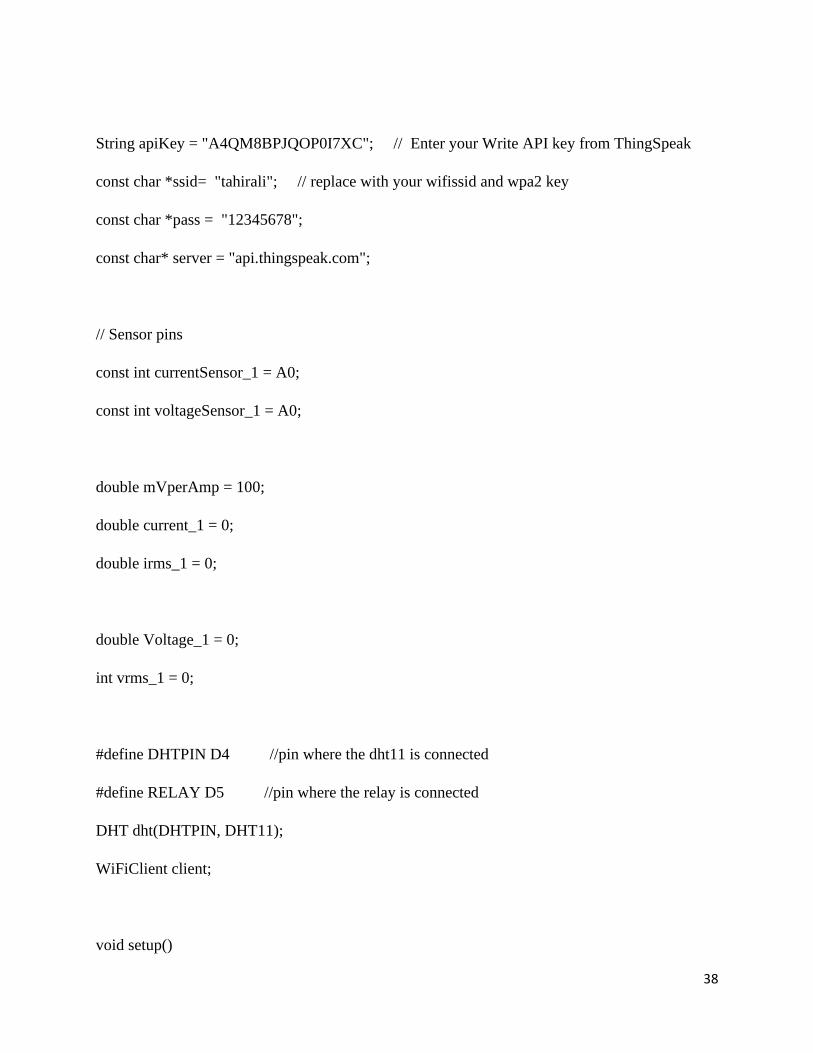
3.5.2 Programming of ESP8266:
#include <DHT.h> // Including library for dht
#include <ESP8266WiFi.h>
Page 38
38
String apiKey = "A4QM8BPJQOP0I7XC"; // Enter your Write API key from ThingSpeak
const char *ssid= "tahirali"; // replace with your wifissid and wpa2 key
const char *pass = "12345678";
const char* server = "api.thingspeak.com";
// Sensor pins
const int currentSensor_1 = A0;
const int voltageSensor_1 = A0;
double mVperAmp = 100;
double current_1 = 0;
double irms_1 = 0;
double Voltage_1 = 0;
int vrms_1 = 0;
#define DHTPIN D4 //pin where the dht11 is connected
#define RELAY D5 //pin where the relay is connected
DHT dht(DHTPIN, DHT11);
WiFiClient client;
void setup()
Page 39
39
{
Serial.begin(115200);
pinMode(RELAY, OUTPUT);
digitalWrite(RELAY, HIGH);
delay(10);
dht.begin();
Serial.println("Connecting to ");
Serial.println(ssid);
WiFi.begin(ssid, pass);
while (WiFi.status() != WL_CONNECTED)
{
delay(500);
Serial.print(".");
}
Serial.println("");
Serial.println("WiFi connected");
}
void loop()
{
float H = dht.readHumidity();
float T = dht.readTemperature();
Page 40
40
Voltage_1 = getVPP(0, voltageSensor_1);
vrms_1 = (Voltage_1 / 2.0) * 0.707 * 575;
vrms_1 = vrms_1;
if (H > 80 || T > 50) {
digitalWrite(RELAY, LOW);
}
else {
digitalWrite(RELAY, HIGH);
}
float V = vrms_1 / 2.83;
float I = 0;
float E = V * I * 0.8;
if (isnan(H) || isnan(T))
{
Serial.println("Failed to read from DHT sensor!");
return;
}
if (client.connect(server, 80)) // "184.106.153.149" or api.thingspeak.com
Page 41
41
{
String postStr = apiKey;
postStr += "&field1=";
postStr += String(V);
postStr += "&field2=";
postStr += String(I);
postStr += "&field3=";
postStr += String(T);
postStr += "&field4=";
postStr += String(H);
postStr += "&field5=";
postStr += String(E);
postStr += "\r\n\r\n";
client.print("POST /update HTTP/1.1\n");
client.print("Host: api.thingspeak.com\n");
client.print("Connection: close\n");
client.print("X-THINGSPEAKAPIKEY: " + apiKey + "\n");
client.print("Content-Type: application/x-www-form-urlencoded\n");
client.print("Content-Length: ");
client.print(postStr.length());
client.print("\n\n");
client.print(postStr);
Page 42
42
Serial.print("Temperature: ");
Serial.print(T);
Serial.print(" degrees Celcius, Humidity: ");
Serial.print(H);
Serial.print(" %, Voltage: ");
Serial.print(V);
Serial.println("V. Send to Thingspeak.");
}
client.stop();
Serial.println("Waiting...");
// thingspeak needs minimum 15 sec delay between updates
delay(1000);
}
float getVPP(int pinValue, char property)
{
float result;
int readValue;
int maxValue = 0;
int minValue = 1024;
uint32_t start_time = millis();
while ((millis() - start_time) < 1000)
Page 43
43
{
if (pinValue == 0)
{
readValue = analogRead(property);
}
else if (pinValue == 1)
{
readValue = analogRead(property);
}
if (readValue>maxValue)
{
maxValue = readValue;
}
if (readValue<minValue)
{
minValue = readValue;
}
}
result = ((maxValue - minValue) * 5.0) / 1024.0;
return result;
}
Page 44
44
3.5.3 Web Interfacing:
A local free web server is signed up to display all monitoring parameters of the electrical
equipment system. This server is built within the ESP8266 microcontroller. The Esp8266
development board is a Wi-Fi compatible system which can act as an Access Point (AP) and a
client, for example, a personal computer (PC), laptop or cell phone, can be connected to its Wi-
Fi. Whenever a client gets connected to its AP, then it can browse that local server data through a
webpage.
3.5.4 Screen-shot of the Web page:
The Local Web server page https://thingspeak.com/channels/895937/private_show is shown in
the figure.
Page 45
45
Figure3.9Webpage to Display Parameters
Page 46
46
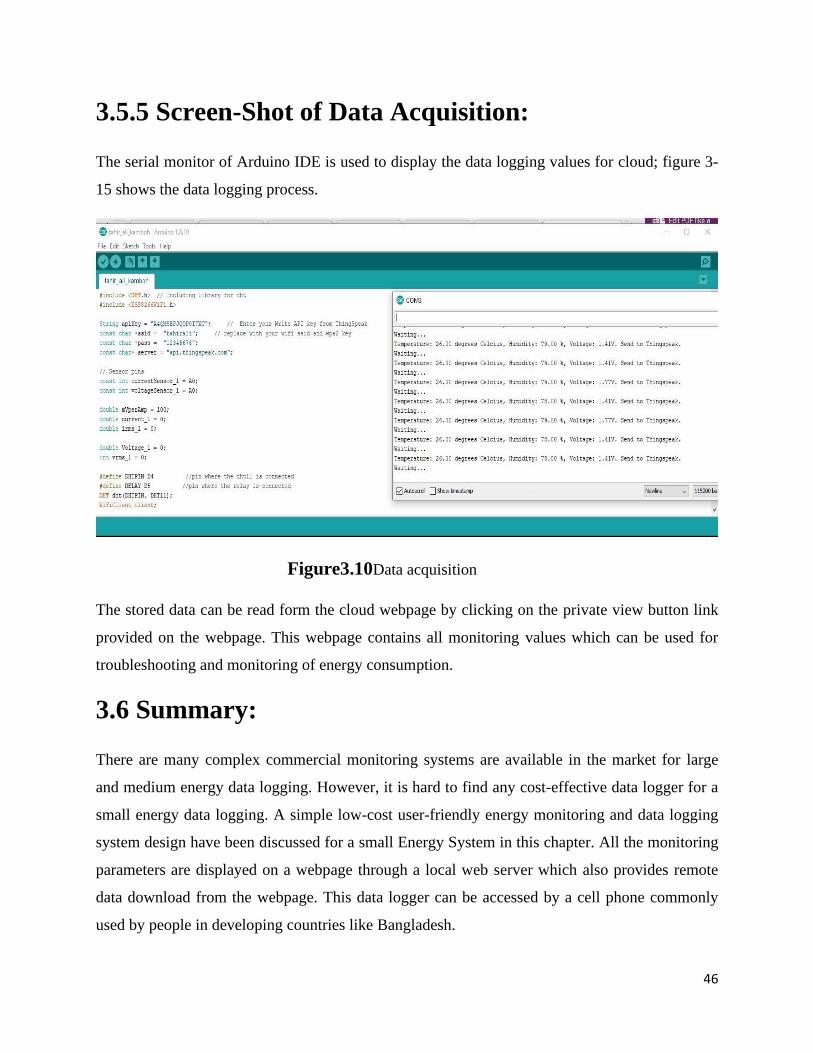
3.5.5 Screen-Shot of Data Acquisition:
The serial monitor of Arduino IDE is used to display the data logging values for cloud; figure 3-
15 shows the data logging process.
Figure3.10Data acquisition
The stored data can be read form the cloud webpage by clicking on the private view button link
provided on the webpage. This webpage contains all monitoring values which can be used for
troubleshooting and monitoring of energy consumption.
3.6 Summary:
There are many complex commercial monitoring systems are available in the market for large
and medium energy data logging. However, it is hard to find any cost-effective data logger for a
small energy data logging. A simple low-cost user-friendly energy monitoring and data logging
system design have been discussed for a small Energy System in this chapter. All the monitoring
parameters are displayed on a webpage through a local web server which also provides remote
data download from the webpage. This data logger can be accessed by a cell phone commonly
used by people in developing countries like Bangladesh.
Page 47
47
CHAPTER
4
WORKING PROCESS
Page 48
48
Working Process
In this chapter we have discussed the whole working process of our device. Here we have
not only showed the project’s physical view but also, we have discussed all the working
principles, a block diagram of the system and two flowcharts of the whole process. The
working principles of the total system are shown on the flow chart and overview of the system is
shown on the block diagram below.
4.1 Block Diagram
Block Diagram is a visual portrayal of a framework that utilizes straight forward, marked
hinders that speak to single or different things, substances or ideas, associated by lines to
demonstrate connections between them. A substance relationship chart (ERD), one case
of a square outline, speaks to a data framework by demonstrating the connections between
individuals, objects, spots, ideas or occasions inside that frame work. Block Diagrams are a
summed-up portrayal of an idea and are not proposed to show finish data concerning plan or
produce. In contrast to schematics, outlines and design charts, square graphs don’t depict the
essential detail for physical development. In this section we draw a diagram of our whole system
using blocks. Where NodeMcu Esp8266 is connected with 3 sensors, a Single Channel Relay is
connected for the protection of Circuit from any type of fault. On the other hand, micro
controller NodeMcu is also connected with ThingSpeak website Server where we can see desired
sensing results.
Figure 4.1. Block diagram
Page 49
49
4.2 Flow Chart
A flowchart is a formalized realistic portrayal of a rationale succession, work or assembling
process, association outline, or comparable formalized structure. The motivation behind
a stream outline is to furnish individuals with a typical dialect or reference moment that
managing a venture or process. Flowcharts utilize straightforward geometric images and bolts to
characterize connections. In programming, for example, the start or end of a program is spoken
to by an oval. A procedure is spoken to by a square shape, a choice is spoken to by a precious
stone and an I/O process is spoken to by a parallelogram. The Internet is spoken to by a cloud.
Flowcharts are utilized in planning and archiving straightforward procedures or projects. Like
different sorts of graphs, they help picture what is happening and, in this way, help comprehend
a procedure, and maybe likewise find more subtle highlights inside the procedure, similar to
defects and bottlenecks. There are diverse kinds of flowcharts: each sort has Working Process
very own arrangement of boxes and documentations. The Flow Charts of our system is given
below.
Figure 4.2. flow diagram
Page 50
50
4.3 Project View
Here, we can see the physical view of our prototype model in Fig. 4.3.
Figure 4.3 Project View
Page 51
51
Figure 4.4. Project View with load
Page 52
52
CHAPTER
5
EXPERIMENTAL STUDIES
Page 53
53
Experimental Studies
We have done some measurements and analysis with the components of the device. These
topics are mentioned below
5.1 Hardware Implementation
First of all our three sensors are connected with the Esp8266. Here NodeMcu provides the power
supply to the sensors to start sensing their particular parameters from the environment and
hardware. Here Current sensor, voltage sensor, Relay and DHT11 3V pins and ground pins are
connected to NodeMcu.
Based on the results of current, voltage and DHT11 sensors; they will start transferring data to
the website automatically. The VCC pin of Current sensor is connected with the digital pin 3v3
and Out pin with digital pin of IC 4051 accordingly. The VCC pin of Relay is connected with the
digital pin 3v3 and the IN pin with D5 of ESP8266. DHT11 temperature and humidity sensor is
connected with NodeMCU ESP8266. GND and VCC pin of DHT11 is connected with GND pin
and 3v3 of NodeMCU. Remaining digital pin OUT of DHT11 is connected with the digital pin
D4 of NodeMCU. DHT11 is sending sensor data to NodeMCU through this digital pin.
The100Wbulb is connected as load with the circuit.
5.2 Data analysis, Result and Decision
Three sensors are connected with the circuit start sensing the data and with the help of
NodeMCU transfers the data to the website. We can monitor these sensor values in real time on
the website.
Page 54
54
Figure 5.1 Humidity Graph
Figure 5.2Temperature graph
Page 55
55
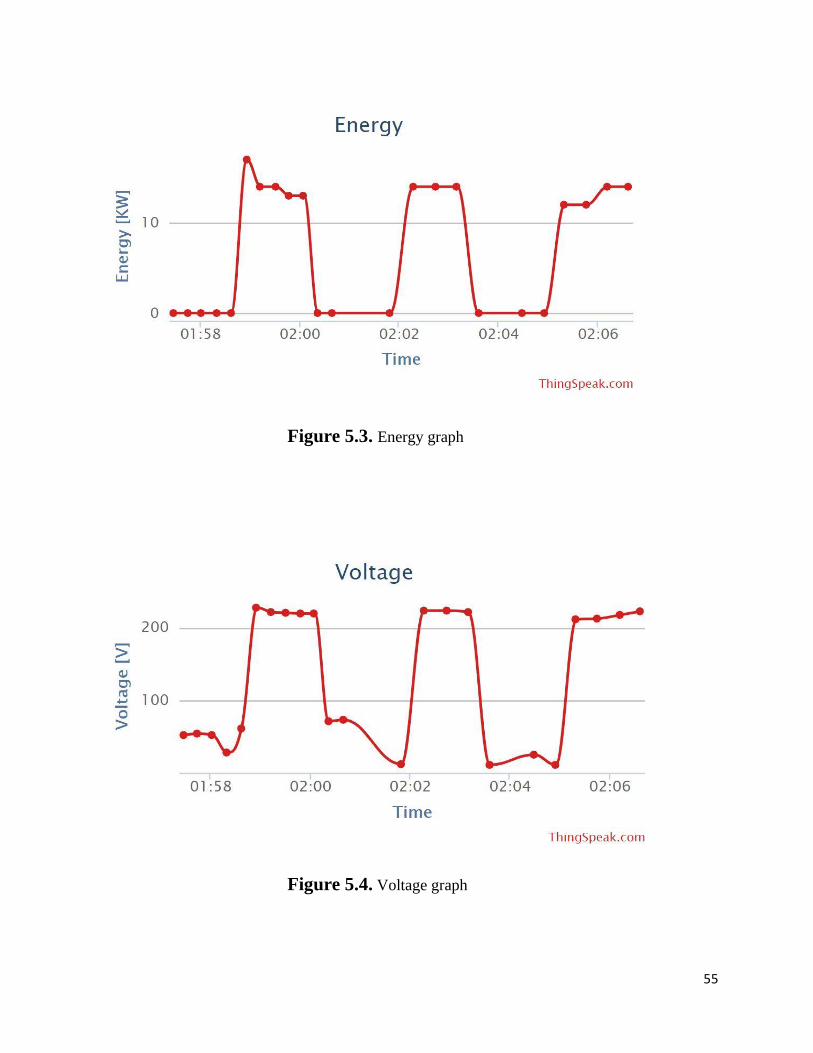
Figure 5.3. Energy graph
Figure 5.4. Voltage graph
Page 56
56
Figure 5.5. Current graph
Our target is not only to measure the sensor values but also to use those sensor values
for taking the decision. In a simple way we can say that, our system will show us that how much
energy the system has consumed in particular time frame.
Temperature sensors are designed to use in almost any application as well as the prototype
models and industry. The temperature is estimated with the assistance of an NTC thermistor or
negative temperature coefficient thermistor. This sensor features a calibrated digital signal output
with the temperature and humidity sensor capability. It is integrated with a high-performance 8-
bit micro controller. This DHT11 temperature and humidity sensor is connected with the
NodeMCU ESP8266. When our system is on, the temperature and humidity sensor (DHT11) will
start measuring the temperature and humidity values automatically from the surrounding
Page 57
57
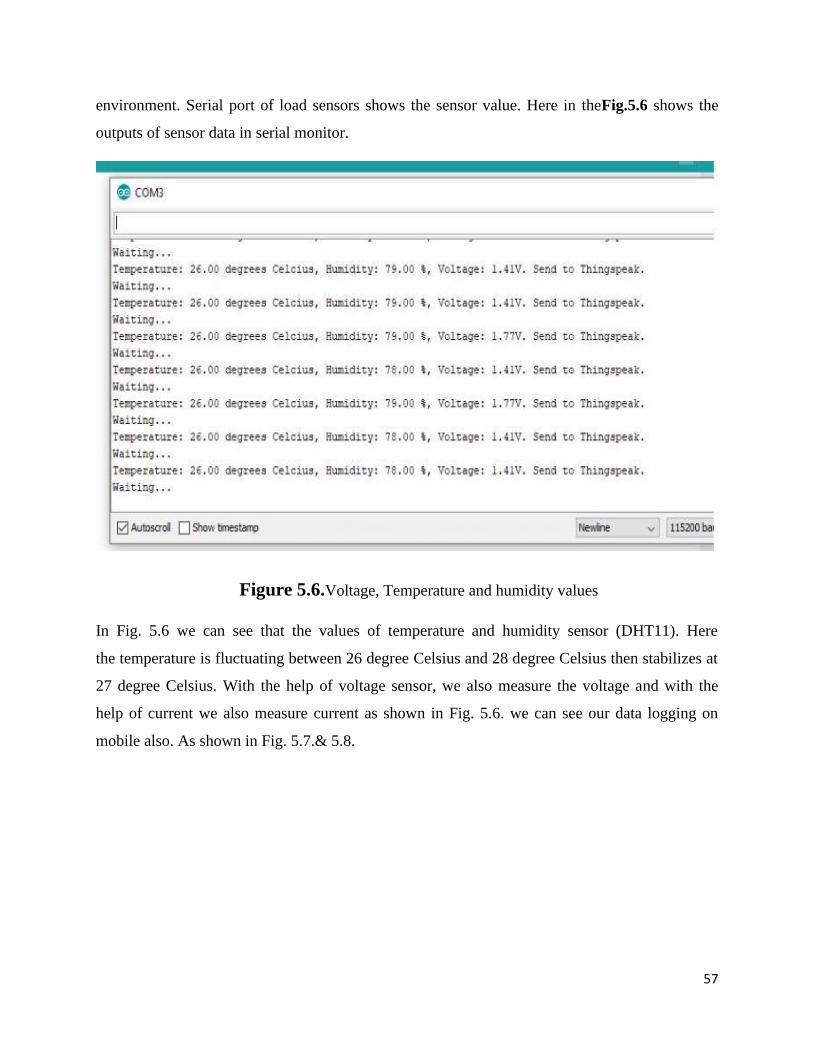
environment. Serial port of load sensors shows the sensor value. Here in theFig.5.6 shows the
outputs of sensor data in serial monitor.
Figure 5.6.Voltage, Temperature and humidity values
In Fig. 5.6 we can see that the values of temperature and humidity sensor (DHT11). Here
the temperature is fluctuating between 26 degree Celsius and 28 degree Celsius then stabilizes at
27 degree Celsius. With the help of voltage sensor, we also measure the voltage and with the
help of current we also measure current as shown in Fig. 5.6. we can see our data logging on
mobile also. As shown in Fig. 5.7.& 5.8.
Page 58
58
Fig. 5.7Temperature, Humidity and Current values on mobile
Page 59
59
Fig. 5.8. Voltage and current values on mobile
Page 60
60
CHAPTER
6
DEVICE IMPACT
Page 61
61
Device Impact
In this chapter we have discussed different impact of the device in different aspect like. Besides
this we have also discussed cost analysis and economic impact of this device.
6.1 Health and Safety Impact
Our prototype model is designed in a way, so that it can be helpful to people in safety issues. In
recent days, in our society over use of electrical energy is common now days. Many people leave
their electric appliances ON. For this reason, we have designed a prototype model of energy data
logger where our system will automatically detect over use of energy in our homes. After
detecting, our system will share this energy consumption from the Home with the help of an
Esp8266 to the website. Where we can monitor our daily energy consumption So, we can see
our over usage of energy and keep us safe from big amount bills.
6.2 Lower energy consumption
Another major problem of our society is wastage of energy and in recent days this problem
is becoming more acute. As a fastest developing country many factories and mega
malls are being established, in a result we are facing the energy problem. To reduce this
kind of problem, many agendas and project works are developing but still this problem has not
been solved properly. So, we all should come forward in order to solve excess energy
consumption, otherwise in near future we will face more energy issues. Here, in our prototype
model we are proposing temperature-controlled energy data logger using (IoT) which is able to
collect data and send it to the web server. As it is designed for rooms, so it can be installed in
home, office, schools, colleges and many more places easily. As a result, huge amount of energy
and electricity can be saved.
Page 62
62
CHAPTER
7
CONCLUSION AND FUTURE WORK
Page 63
63
7.1 Future work
We live during a time where inventive innovation could easily compare to ever previously.
Numerous individuals feel like they can’t work except if they have a type of innovative
contraption set up, and this stretches out to the home, which is the reason we are contemplating
here what’s on the horizon for home robotization. In any case, you need to trust hat the savvy
innovation utilized inside home computerization programming will keep on expanding its
pervasiveness among individuals around the nation. Ten years prior, the idea of a cell phone with
a touch-screen, a music player, a completely working web program and more alternatives
appeared as though a curiosity held just for the most favored individuals. Five years prior, the
possibility of such items as Amazon’s Alexa menial helper appeared to be really unusual.
However, in 2018, these are only a portion of the numerous innovative instruments that a
substantial level of the populace depends upon every day. As innovation keeps on being created
and new strategies for administration preparing are trialed, this will undoubtedly proceed such a
movement.
With respect to energy data logging specifically, energy consumption data logging will turn into
a significantly bigger need than it as of now is. As we hear increasingly about any semblance of
digital assaults and over usage of energy, this will have individual’s data logging consistently,
and it reaches out to the home, where a house that brags all these magnificently valuable things
will turn into a more prominent focus for energy data logging, particularly amid occasion times.
Right now, old-school mortgage holders are adhering to the more customary, less propelled
methods for protecting their homes from over usage of electrical energy. Finally, home
mechanization Future Work & Conclusions as of now to a great degree progressed, with the
capacity to control l temperature, power consumption and the sky is the limit from there,
alongside littler yet similarly significant procedures, for example, exchanging over TV stations
and noting your telephone. That is the condition of play in 2019, and we have just overcome
much, however would you be able to envision the advancements that could be made in the years
to come? We at times joke about the assignments that youngsters decline to do physically on the
grounds that they have shrewd innovation to do it for them, yet this is just going to increment.
Anyway, we have a few gets ready for our exploration too. So, after a period we can
investigation that information to improve our framework. We previously thought of utilizing that
Page 64
64
information to anticipate the most agreeable temperature, voltage, current and energy. So that in
the wake of running for a couple of days our framework can consequently log the energy data.
To do this work we require internet 24/7as the data can be sent to the website.
7.2 Conclusion:
For a smooth, efficient and robust operation of any electrical energy system, a data logger, and
monitoring system is very foremost. Data logger and monitoring system enables the proper
operation and contributes to identifying system malfunctioning before any major failure.
By having a data logger, it becomes very easy to trace any particular data on a specific time
period which leads to an easily traceable scenario to find any anomalies in operation. Moreover,
deploying the monitoring system in the electrical energy system increases system reliability and
ensure smooth operation. An efficient monitoring system can assist the user of this energy
system to run the system trouble-free for many years.
To design a Smart Home System (SHS) using energy data logger, a load is connected to the data
logger and real-life data has been collected. After designing the overall system, it has been
clouded to ThingSpeak website for an energy analysis.
In this thesis, a low-cost, user-friendly, reliable data logger and monitoring system has been
developed for Smart Home energy system, mainly for the small home system in a rural
area or remote area of a developing country. This data logger stores all monitoring parameter on
a cloud and displays that on a ThingSpeak website. Data can be seen directly from the webpage
to analyze and verify the system operation. For an efficient monitoring, an Android App is also
available for a cell phone to display all parameters in real time basis. Cell phones are commonly
used in developing countries and people are familiar with their use and application. This data
logger is developed using ESP8266 microcontroller with the help of open sourced software
called Arduino. The developed data logger hardware prototype is very simple and uses only three
sensors for temperature, voltage, and current sensing. Moreover, the easily accessible android
app is also available for monitoring energy parameters with open source software to make it cost
effective.
Page 65
65
References
[1] Cui, Y., Kim, M., Gu, Y., jin Jung, J., and Lee, H. (2014). Home appliance management
system for monitoring digitized devices using cloud computing technology in ubiquitous
sensor network environment. International Journal of Distributed Sensor Networks,
10(2):174097.
[2] Fernandes, R., Matos, J. N., Varum, T., and Pinho, P. (2014). Wi-fi intruder detection. In
2014 IEEE Conference on Wireless Sensors (ICWiSE), pages 96–99.
[3] Gu, H., Diao, Y., Liu, W., and Zhang, X. (2011). The design of smart home platform
based on cloud computing. In Proceedings of 2011 International Conference on Electronic
Mechanical Engineering and Information Technology, volume 8, pages 3919–3922
[4] Huaiyu, X., Ruidan, S., Xiaoyu, H., and Qing, N. (2009). Remote control system design
based on web server for digital home. In 2009 Ninth International Conference on Hybrid
Intelligent Systems, volume 2, pages 457–461.
[5] Huang, L.-C., Chang, H.-C., Chen, C.-C., and Kuo, C.-C. (2011). A zigbee-based
monitoring and protection system for building electrical safety. Energy and Buildings,
43(6):1418 – 1426.
[6] Longe, O. M., Ouahada, K., Rimer, S., Zhu, H., and Ferreira, H. C. (2015). Effective
energy consumption scheduling in smart homes. In AFRICON 2015, pages 1–5.
Mao, X., Li, K., Zhang, Z., and Liang, J. (2017). Design and implementation of a new
smart home control system based on internet of things. In 2017 International Smart Cities
Conference (ISC2), pages 1–5.
[7] Nag, D., Majumder, D., Raquib, C. M., Pramanik, S., Basu, A., Rana, T. K., and Rana,
B. (2017). Green energy powered smart healthy home. In 2017 8th Annual Industrial
Automation and Electromechanical Engineering Conference (IEMECON), pages 47–51.
[8] Nguyen, T. V., Lee, D. G., Seol, Y. H., Yu, M. H., and Choi, D. (2007). Ubiquitous
Page 66
66
access to home appliance control system using infrared ray and power line communication.
In 2007 3rd IEEE/IFIP International Conference in Central Asia on Internet, pages 1–4.
[9] Panwar, A., Singh, A., Kumawat, R., Jaidka, S., and Garg, K. (2017). Eyrie smart home
automation using internet of things. In 2017 Computing Conference, pages 1368–1370.
[10] Quwaider, M. (2017). Real-time intruder surveillance using low-cost remote wireless
sensors. In 2017 8th International Conference on Information and Communication
Systems (ICICS), pages 194–199.
[11] Sowmiya, M. and Sabeenian, R. S. (2017). Security and monitoring system by using
rfid tags and multiple sensors. In 2017 IEEE International Conference on Electrical,
Instrumentation and Communication Engineering (ICEICE), pages 1–5.
[12] Tejani, D., Al-Kuwari, A. M. A. H., and Potdar, V. (2011). Energy conservation
in a smart home. In 5th IEEE International Conference on Digital Ecosystems and
Technologies (IEEE DEST 2011), pages 241–246
[13] Wang, P., Jiang, H., Shi, W., and Cheng, M. (2009). Design and realization of remote
control in smart home system. In 2009 International Conference on Communication
Software and Networks, pages 13–15.
[14] Wang, P., Yan, L., Wang, J., and Zhu, Y. (2010). The remote intelligent controlling and
monitoring system of home appliances based on gprs/gsm. In 2010 IEEE International
Conference on Information Theory and Information Security, pages 958–961.
[15] Wang, X., Liu, S., and Li, Q. (2017). Research on control strategy of pwm rectifier
technology based on dsp. In 2017 IEEE International Conference on Information and
Automation (ICIA), pages 1050–1053.
[16] Zhang, Y., Xu, D., Yan, C., and Zou, S. (2015). Hybrid pwm scheme for the grid inverter.
IEEE Journal of Emerging and Selected Topics in Power Electronics, 3(4):1151–1159.
Page 67
67
[17] International Energy Outlook 2017, Energy Information Administration (EIA),
available: https://www.eia.gov/outlooks/ieo/pdf/0484(2017).pdf. \
[18] "Electrification: So how many people are we actually talking about?" Energy
Access - Africa. July 19, 2017. Accessed November 25, 2017.
https://energyaccessafrica.com/2016/07/05/so-how-many-people-are-we-actually-talking-about/.
[19] B. Shrihariprasath and V. Rathinasabapathy, “A smart IoT system for monitoring
solar PV power conditioning unit,” 2016 World Conference on Futuristic Trends in
Research and Innovation for Social Welfare (Startup Conclave), 2016.
[20]. V. Maulik, K. Chudasama, M., Bhatt and B., Gohil. "Real Time Data
Monitoring of PV Solar cell using LabVIEW", 2016.
[21] S. AG, "DATA MANAGER M", Sma.de, 2017. [Online]. Available:
https://www.sma.de/en/products/monitoring-control/data-manager-m.html.
[Accessed: 26- Nov- 2017].
[22]. A. J. Swart, H. C. Pienaar, and R. M. Schoeman. "Cost-effective energy
monitoring of domestic off-grid PV systems." JEPE, Journal of Energy and Power
Engineering, vol. 5, pp.182-188, 2013.
[23]Nashwa El-Bendary, Mohamed Mostafa M. Fouad, Rabie A.
Ramadan, Soumya Banerjee and Aboul Ella Hassanien, “Smart
Environmental Monitoring Using Wireless Sensor
Networks”,K15146_C025.indd, 2013
[24] Grzegorz Lehmann, Andreas Rieger, Marco Blumendorf,
SahinAlbayrakDAI, “A 3-Layer Architecture for Smart
Environment Models”/A model-based approach/Labor Technische
University Berlin, Germany 978-1-4244-5328-3/10 © IEEE,2010.
Page 68
68
[25] Moghavvemi M. and Tan. S. “A reliable and economically feasible
remote sensing system for temperature and relative humidity
measurement”. Sensors and Actuators. 2005. 181-185.
[26] DESCO Official Website: https://www.desco.org.bd/?page=pre-paid-meter
[27] Khan, A.H. (2015). A Nobel Design of DC Micro Grid For Rural Area In Bangladesh.
INTERNATIONAL JOURNAL OF TECHNOLOGY ENHANCEMENT AND
EMERING ENGINEERING RESEARCH, 3(01), 19-56
[28] Endesa S.A. 2017.https://www.endesaclientes.com/smart-meter.html
[29] Datasheet. Arduino
MEGA2560.http://www.mantech.co.za/datasheets/products/A000047.pdf
[30] Datasheet. Arduino UNO.http://digital.csic.es/bitstream/10261/127788/7/D-c-
%20Arduino%20uno.pdf
[31] Shanghai SIM Com Wireless Solutions Ltd. (2009). Hardware Design SIM
900A_HD_V1.01.http://www.image.micros.com.pl/_dane_techniczne_auto/sim900a
.pdf
[32]Wikipedia. Wikimedia Foundation. Web. 31 October, 2014.
<https://www.itead.cc/wiki/Stackable_SD_Card_shield_V3.0