California Energy Commission Clean Transportation Program FINAL PROJECT REPORT Energy-Efficient and Cost- Effective Microalgae Disruption for Extraction of Lipids for Biodiesel Production Prepared for: California Energy Commission Prepared by: San Diego State University Research Foundation Gavin Newsom, Governor April 2019 | CEC-600-2019-015
Transcript
California Energy Commission Clean Transportation Program FINAL PROJECT REPORT
Energy-Efficient and Cost-Effective Microalgae Disruption for Extraction of Lipids for Biodiesel Production
Prepared for: California Energy Commission Prepared by: San Diego State University Research Foundation
Gavin Newsom, Governor April 2019 | CEC-600-2019-015
California Energy Commission
Temesgen Garoma Primary Author
San Diego State University 5250 Campanile Drive San Diego, CA 92182 Phone: (619) 594-1900 SDSU (https://sdsu.edu/)
Contract Number: ARV-15-011
Larry Rillera Commission Agreement Manager
Elizabeth John Office Manager Advanced Fuel Production Office
Kevin Barker Deputy Director FUELS AND TRANSPORTATION
Drew Bohan Executive Director
DISCLAIMER This report was prepared as the result of work sponsored by the California Energy Commission (CEC). It does not necessarily represent the views of the CEC, its employees, or the State of California. The CEC, the State of California, its employees, contractors, and subcontractors make no warrant, express or implied, and assume no legal liability for the information in this report; nor does any party represent that the use of this information will not infringe upon privately owned rights. This report has not been approved or disapproved by the CEC nor has the CEC passed upon the accuracy or adequacy of the information in this report.
Assembly Bill 118 (Núñez, Chapter 750, Statutes of 2007) created the Clean Transportation Program, formerly known as the Alternative and Renewable Fuel and Vehicle Technology Program. The statute authorizes the California Energy Commission (CEC) to develop and deploy alternative and renewable fuels and advanced transportation technologies to help attain the state’s climate change policies. Assembly Bill 8 (Perea, Chapter 401, Statutes of 2013) reauthorizes the Clean Transportation Program through January 1, 2024, and specifies that the CEC allocate up to $20 million per year (or up to 20 percent of each fiscal year’s funds) in funding for hydrogen station development until at least 100 stations are operational. The Clean Transportation Program has an annual budget of about $100 million and provides financial support for projects that:
• Reduce California’s use and dependence on petroleum transportation fuels and increase the use of alternative and renewable fuels and advanced vehicle technologies.
• Produce sustainable alternative and renewable low-carbon fuels in California. • Expand alternative fueling infrastructure and fueling stations. • Improve the efficiency, performance and market viability of alternative light-, medium-,
and heavy-duty vehicle technologies. • Retrofit medium- and heavy-duty on-road and nonroad vehicle fleets to alternative
technologies or fuel use. • Expand the alternative fueling infrastructure available to existing fleets, public transit,
and transportation corridors. • Establish workforce-training programs and conduct public outreach on the benefits of
alternative transportation fuels and vehicle technologies.
To be eligible for funding under the Clean Transportation Program, a project must be consistent with the Energy Commission’s Clean Transportation Program Investment Plan, updated annually. The Energy Commission issued PON-14-602 to fund projects that put emphasis on transformative technology solutions to significant biofuels industry problems that increase yields, productivity, or cost effectiveness of biofuel production; and/or that target a significant unmet need in California’s biofuels industry. In response to PON-14-602, the recipient submitted an application which was proposed for funding in the Energy Commission’s Notice of Proposed Awards June 24, 2015 and the agreement was executed as ARV-15-011 on December 28, 2015.
ii
ABSTRACT This project investigated the use of Cutrine plus and copper sulfate for the disruption of algal biomass. The chemicals effectively disrupted algae cells, enhancing lipid extraction. The quantity of lipid extracted increased by about 30 percent for disrupted samples. Moreover, the estimated energy input, greenhouse gas (GHG) emission, and operating cost for the proposed cell disruption method were lower than those for the existing methods. The estimated energy inputs were 5 to 300 times lower than those for the existing methods, while the GHG emissions were 8 to 600 times lower. On the basis of operating cost, copper sulfate ranked at 30 percentile and Cutrine plus at 60 percentile compared to the existing methods. Despite these advantages, the adaption of the method may be limited by the extended (about 24-hour) contact time required to achieve significant increase in lipid extraction. Moreover, algal biofuel is not currently competitive with petroleum-based fuels, mainly due to cost and energy intensity. The integration of algal biofuel production with waste treatment systems was recommended to address this challenge. The integration could allow for the recovery and unitization of resources contained in various waste streams. If these challenges are addressed with future research efforts, then algal biofuel can provide several potential benefits: a) it has an estimated GHG emissions of 55.25 gCO2-e/MJ of biodiesel produced, which is below the California Health & Safety requirement of 83.25 gCO2-eq/MJ for diesel substitute. b) it has lower water consumption intensity than the majority of feedstocks used or considered for biofuel production. c) the industry could create about 72,000 jobs in California. d) it could enhance natural resources preservation by recovering and utilizing resources contained in various waste streams.
Keywords: C. vulgaris, cell disruption, lipid extraction yield, Cu, copper sulfate, GHG emission, water usage, and resource recovery and utilization.
Please use the following citation for this report:
Garoma, Temesgen. San Diego State University. 2019. Energy-Efficient and Cost-Effective Microalgae Disruption for Extraction of Lipids for Biodiesel Production. California Energy Commission. Publication Number: CEC-600-2019-015.
iii
TABLE OF CONTENTS Page
Preface ................................................................................................................................ i Abstract ............................................................................................................................. ii Table of Contents............................................................................................................... iii List of Figures .................................................................................................................... iv
List of Tables ...................................................................................................................... v
CHAPTER 1: Introduction .................................................................................................... 3 Background ..................................................................................................................... 3 The Current State of Algal Biomass Disruption Technologies ............................................... 4 Project Objectives ............................................................................................................ 8
CHAPTER 2: Materials and Methods ..................................................................................... 9 Technical Approach .......................................................................................................... 9 Experimental Set-up for Disruption of C. vulgaris Cells in Suspension .................................. 9 Experimental Set-up for Disruption of C. vulgaris Cells in Paste ........................................... 9 Procedure for Lipid Extraction ......................................................................................... 10 Materials ........................................................................................................................ 12
C. vulgaris Culture Maintenance, Cultivation and Harvesting ..................................................................................... 12 Analytical Methods ......................................................................................................... 13
CHAPTER 3: Disruption of C. vulgaris Cells with Cu ............................................................. 16 Introduction ................................................................................................................... 16 Disruption of C. vulgaris cells in Suspension ..................................................................... 16 Summary ....................................................................................................................... 18
CHAPTER 4: Disruption of C. vulgaris Cells with Copper Sulfate ........................................... 19 Introduction ................................................................................................................... 19 Disruption of C. vulgaris cells in Suspension ..................................................................... 19 Summary ....................................................................................................................... 21
CHAPTER 5: Lipid Extraction Yields .................................................................................... 22 Introduction ................................................................................................................... 22 Lipid Extraction from Algal Biomass Disrupted with Cu ...................................................... 22 Lipid Extraction from Algal Biomass Disrupted with Copper Sulfate .................................... 23 Comparison of Lipid Extraction Yields .............................................................................. 24 Effect of Pretreatment on Lipid Profile ............................................................................. 24 Summary ....................................................................................................................... 25
Energy Input and GHG Emissions during Copper Sulfate Production .................................. 32 Energy Input and GHG Emissions during Cu Production .................................................... 33
The Production of Copper ...................................................................................................................................... 33 The Production of Ammonia ................................................................................................................................... 33 The Production of Ethylene Oxide .......................................................................................................................... 33 The Production of Ethanolamine ............................................................................................................................. 34 The Production of Cu ............................................................................................................................................ 34
Comparison of the Proposed and Existing Technologies .................................................... 34 Cu and Copper Sulfate Dose .................................................................................................................................. 34 Energy-efficiency .................................................................................................................................................. 34 Cost-effectiveness on the Basis of Operating Costs .................................................................................................. 35 Global Warming Potential ...................................................................................................................................... 37
Benefits to California ...................................................................................................... 38 Estimate of the Project’s GHG Emissions and Carbon Intensity Benefits ..................................................................... 38 Potential to Help California Meet its 2020 Climate Goal ............................................................................................. 40 Techno-economic Analysis ..................................................................................................................................... 40 Estimate of Water Usage if this Technology is Deployed in a Pilot or Scaled-Up Facility ............................................... 45 The Project’s Benefits to the California Biofuel Industry ............................................................................................ 46 Potential Job Creation, Economic Development, and Increased State Revenue ........................................................... 47 Potential Increase in Water Reuse, Resource Recovery from Waste, and Natural Resources Preservation...................... 48
Figure 3: Experimental set-up for disruption of algae cells in dilute suspensions ..................... 9
Figure 4: Algal lipid extraction at different stages in the extraction process from left to right . 11
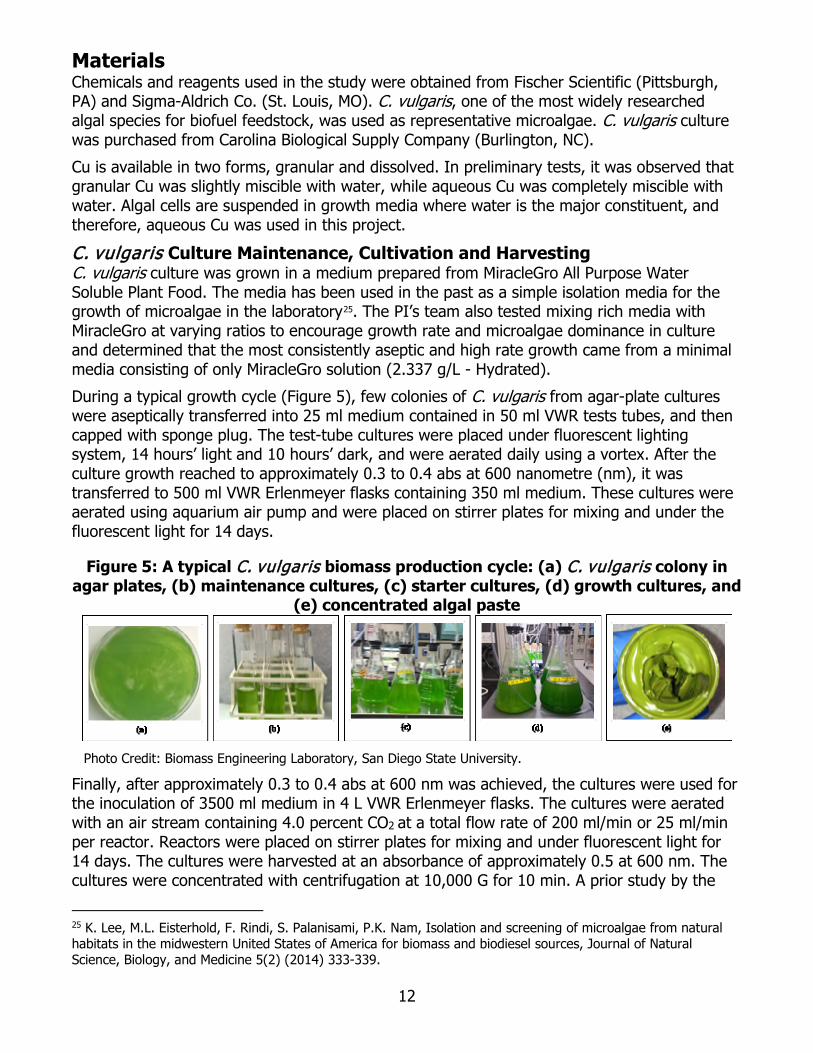
Figure 5: A typical C. vulgaris biomass production cycle: (a) C. vulgaris colony in agar plates, (b) maintenance cultures, (c) starter cultures, (d) growth cultures, and (e) concentrated algal paste ................................................................................................................................ 12
Figure 6: Typical growth curve for C. vulgaris cultures in 4 L reactors .................................. 13
Figure 7: Algae cell viability as a function of contact time and varying Cu dose ..................... 16
Figure 8: Estimation of the intrinsic rate constant of the disruption of C. vulgaris with Cu ...... 17
Figure 9: Scanning electron micrographs of the C. vulgaris cell surfaces: (a) cell without treatment (control) and (b) cells treated with Cu; scale bars denote 1 μm ............................ 18
Figure 10: Algae cell viability as a function of contact time and varying Cu dose ................... 19
v
Figure 11: Estimation of the intrinsic rate constant of the disruption of C. vulgaris with copper sulfate .............................................................................................................................. 20
Figure 12: Scanning electron micrographs of the C. vulgaris cell surfaces: (a) cell without treatment (control) and (b) cells treated with copper sulfate; scale bars denote 1 μm ........... 21
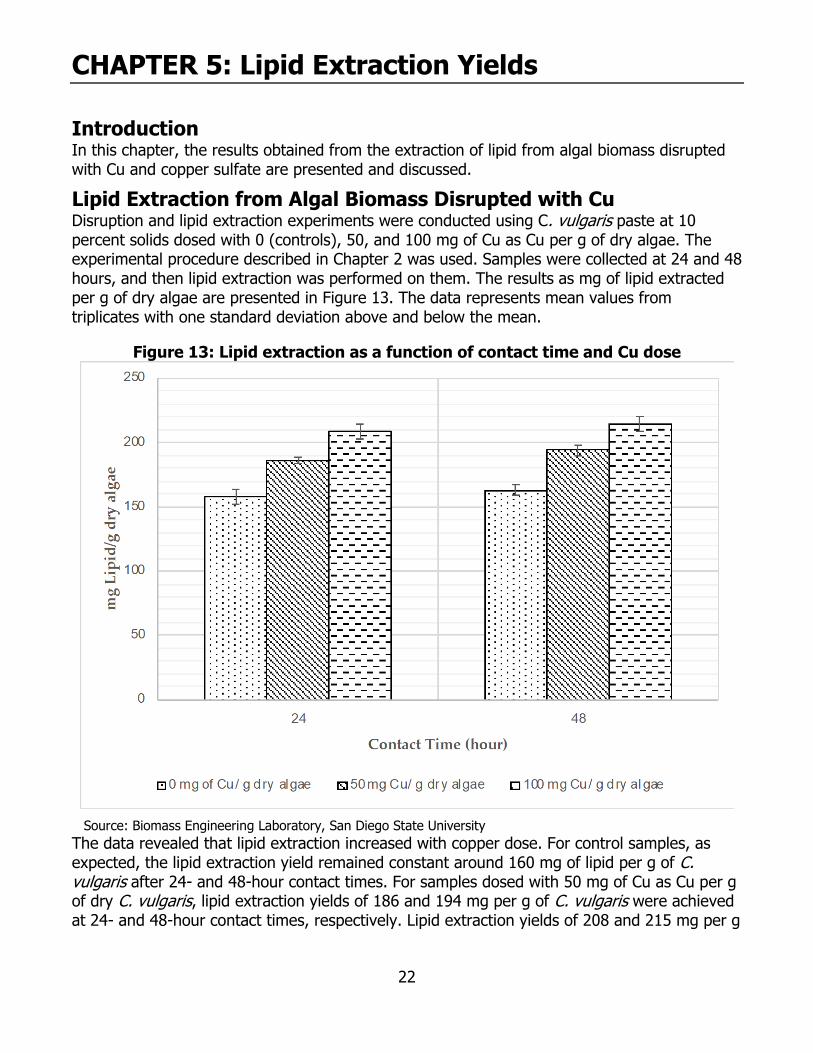
Figure 13: Lipid extraction as a function of contact time and Cu dose................................... 22
Figure 14: Lipid extraction as a function of contact time and copper sulfate dose .................. 23
Figure 15: A simplified high-level overview of the key resources required in the algal biofuel supply chain ..................................................................................................................... 28
Figure 16: Key resources input into and associated environmental issues resulting from algal biomass disruption methods .............................................................................................. 29
Figure 17: Pyro metallurgical process in copper production .................................................. 32
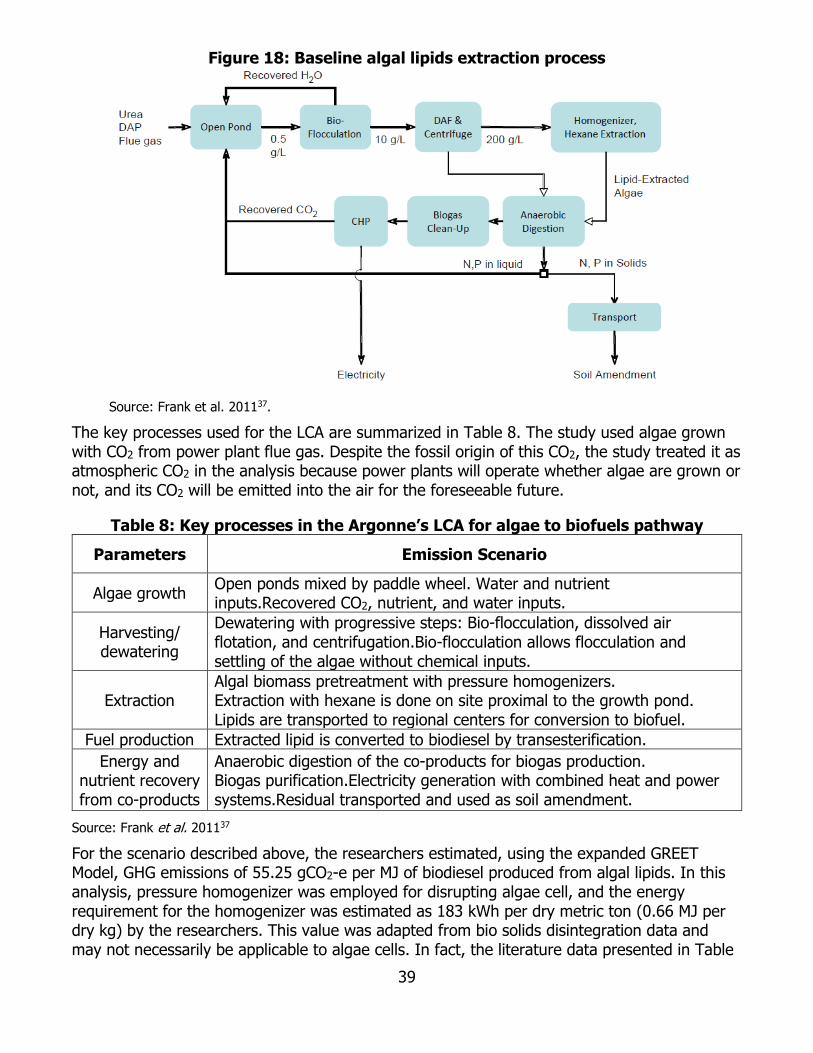
Figure 18: Baseline algal lipids extraction process ............................................................... 39
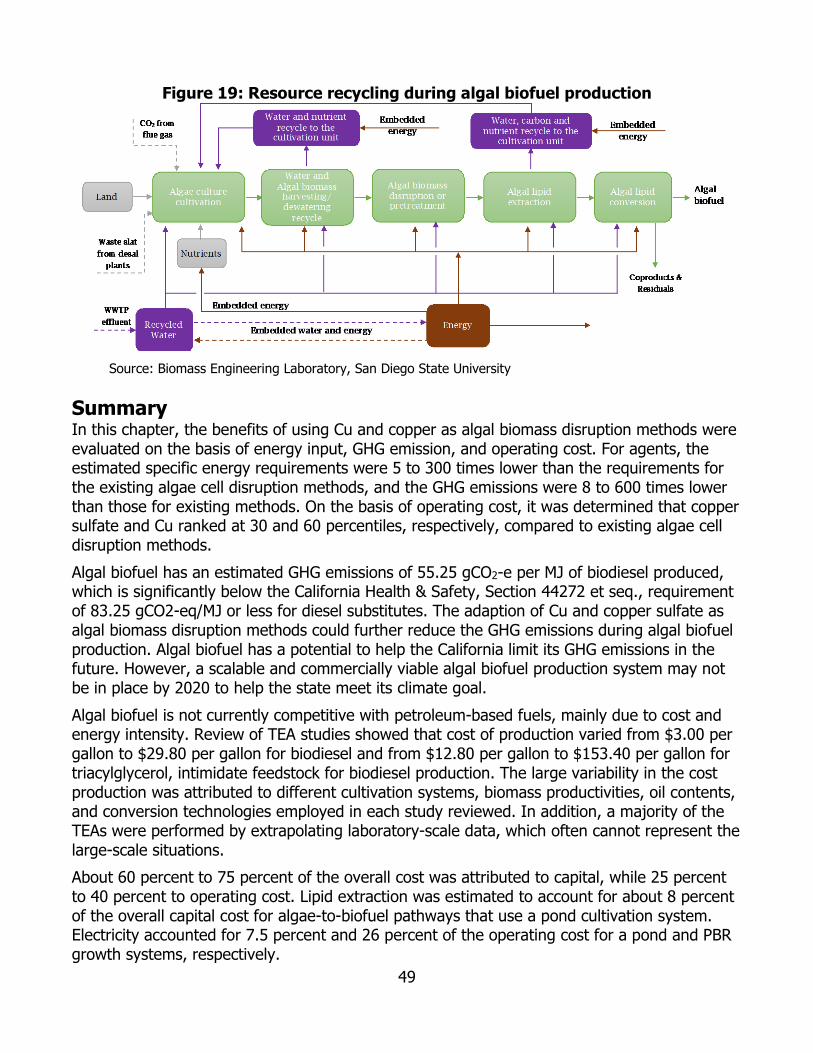
Figure 19: Resource recycling during algal biofuel production .............................................. 49
LIST OF TABLES Page
Table 1: Summary of experimental cell disruption methods and their energy consumptions ..... 7
Table 2: FAME library based on Sigma Aldrich FAME Mix 18919-1AMP standard .................... 14
Table 7: Global warming potential for selected algal cell disruption methods ........................ 37
Table 8: Key processes in the Argonne’s LCA for algae to biofuels pathway .......................... 39
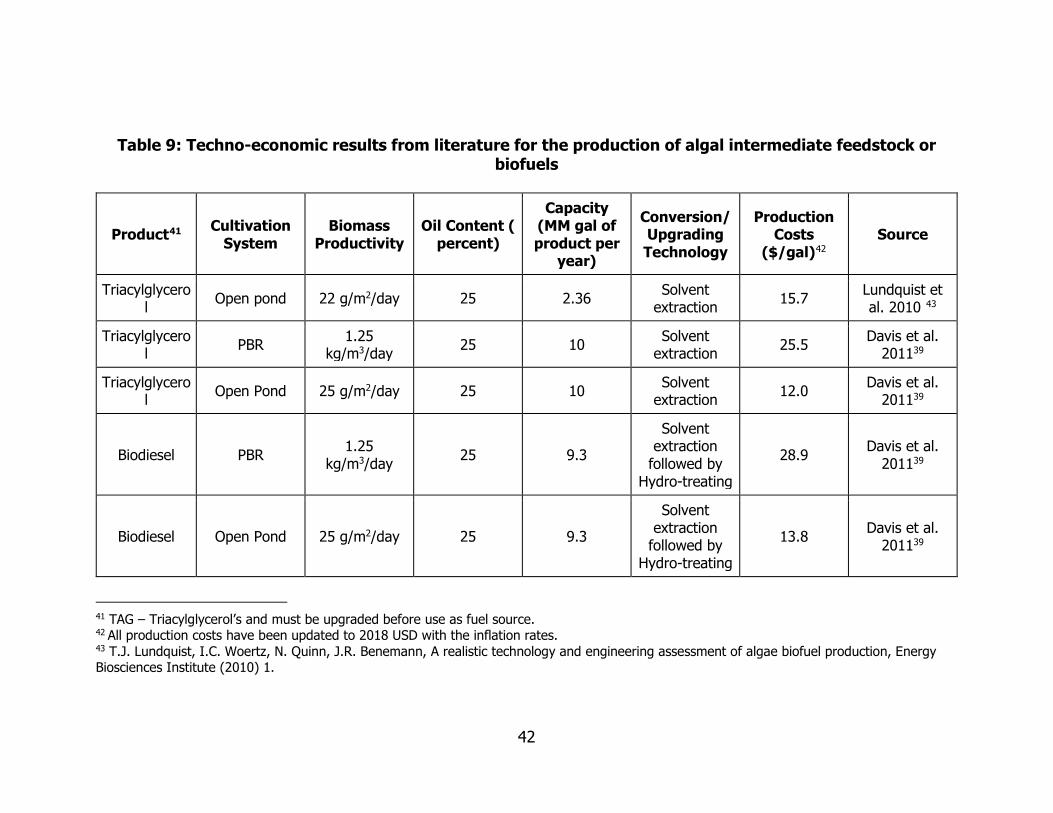
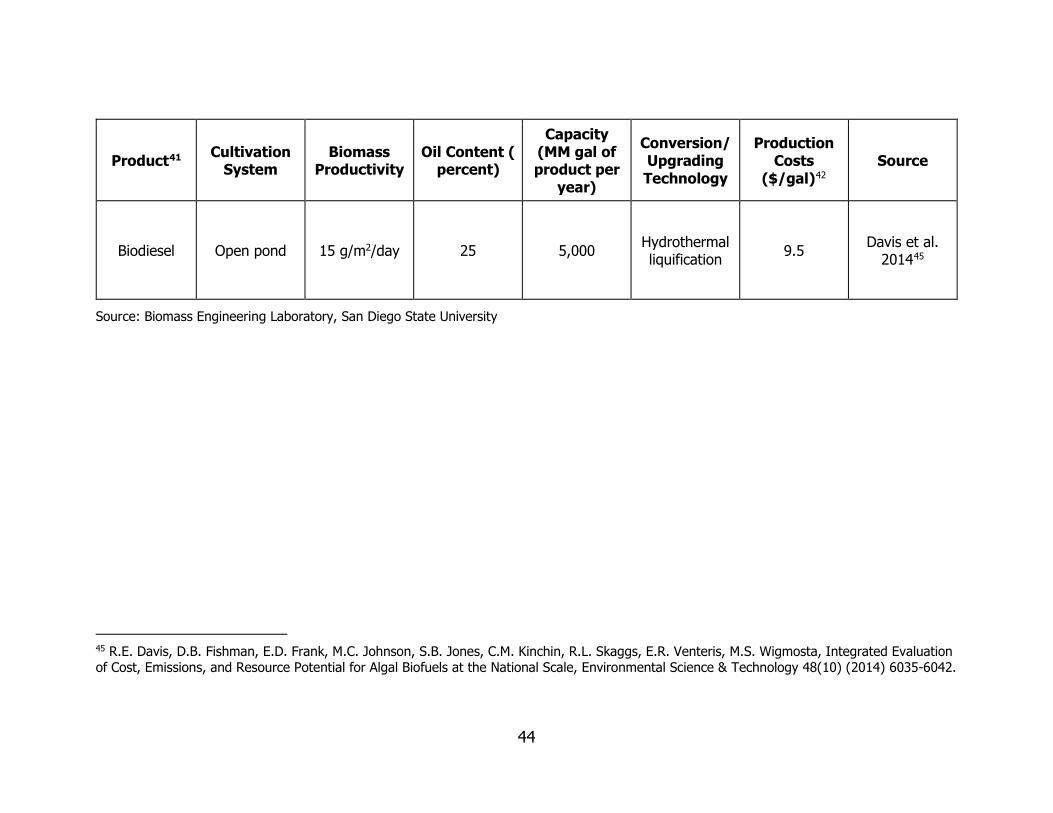
Table 9: Techno-economic results from literature for the production of algal intermediate feedstock or biofuels ......................................................................................................... 42
Table 10: Water usage during algal biodiesel production ..................................................... 45
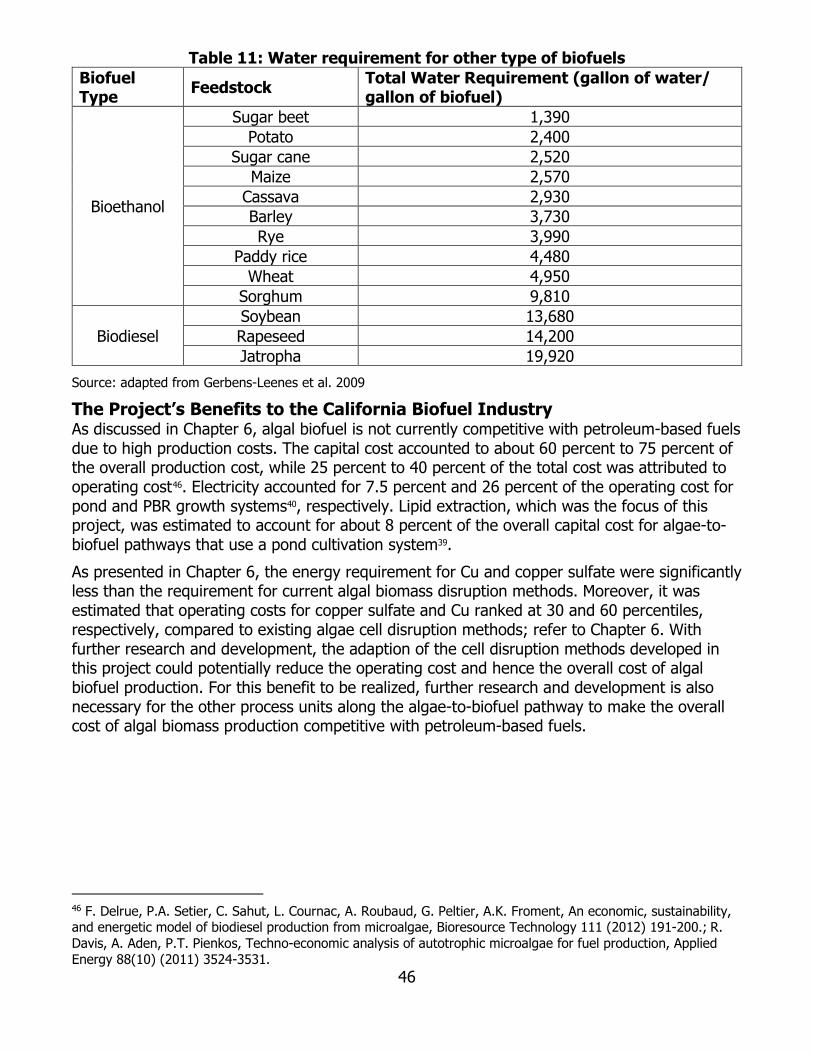
Table 11: Water requirement for other type of biofuels ....................................................... 46
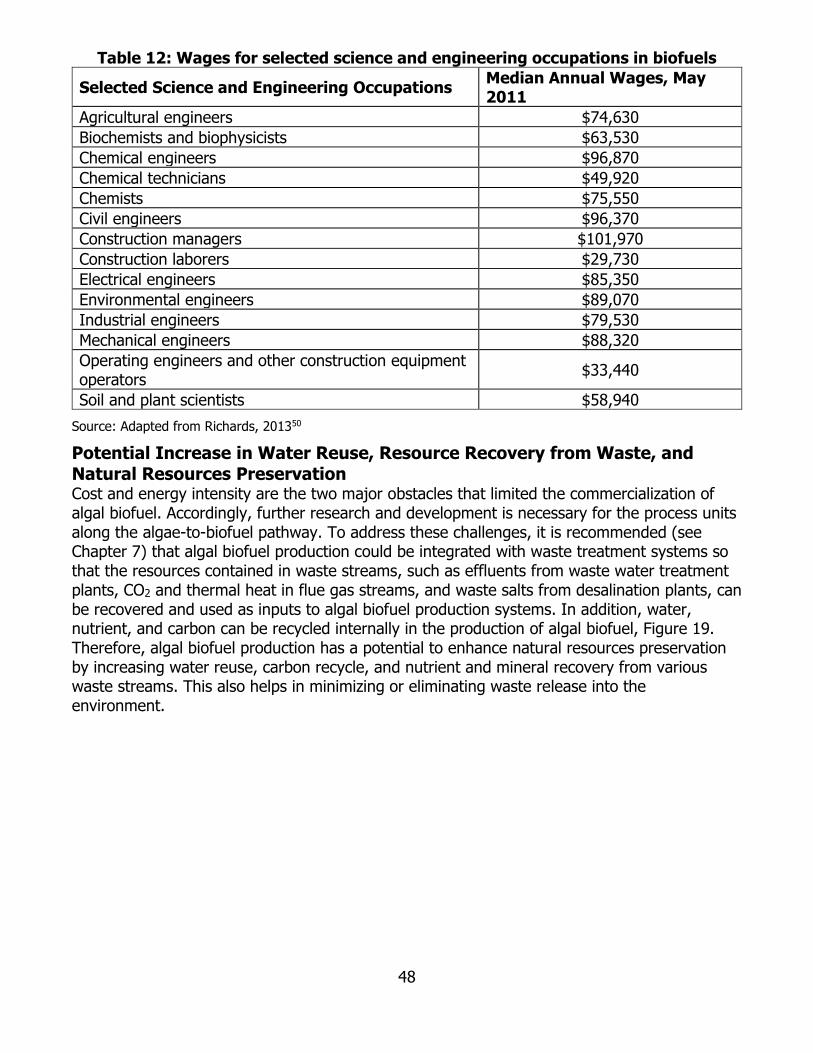
Table 12: Wages for selected science and engineering occupations in biofuels ...................... 48
vi
1
EXECUTIVE SUMMARY Microalgae have emerged as a promising long-term and sustainable feedstock for biofuel production due to their high productivity rate, ability to tolerate a wide range of growth conditions, and lack of competition for land and water with food crops. A considerable amount of public and private funding has been spent on algal biofuel research, development, and demonstration. The basic concept of using algal biomass as feedstock for biofuel production has been proven and demonstrated. However, a scalable and commercially viable system has yet to be developed. The key barriers relate to the cost and energy intensity of the algae-to-biofuel pathway process. The main steps in the pathway include 1) algae culture cultivation, 2) algal biomass harvesting/dewatering, 3) algal biomass disruption or pre-treatment, 4) algal lipid extraction, 5) algal lipid conversion, and 6) algal biofuel. Copper and copper sulfate were used in this project and were shown to be effective in disrupting algae cells. Sample results confirmed that the algae cells were ruptured after treatment with these agents. The benefits of using copper and copper sulfate as algal biomass disruption methods were evaluated on the basis of energy input, GHG emission, and operating cost. With respect to copper and copper sulfate, the estimated specific energy requirements were 5 to 300 times lower than the requirements for existing algae cell disruption methods, and the GHG emissions were 8 to 600 times lower than those for existing methods. With respect to operating costs, it was determined that copper and copper sulfate ranked lower when compared to existing algae cell disruption methods. Despite these results, algal biofuel is not currently competitive with petroleum-based fuels, mainly related cost and energy intensity. The cost of algal-biofuel production varied from $3.00 to $29.8 per gallon for biodiesel and from $12.80 to $153.40 per gallon for a precursor feedstock for biodiesel production. About 60 percent to 75 percent of the overall cost was attributed to capital costs, while 25 percent to 40 percent to operating costs. While the project results point out that algal biofuel production is not competitive with fossil technology, it also appears that algal solutions for the transportation sector requires significant investments, technological development, and time. It is not clear that the private sector is willing to make the requisite investments needed or that the public sector has the capacity to invest in this technology for the long term in reducing technological costs. Equally evident is the absence of when the public may see commercial algal products in the transportation sector. It is recommended that the technology must be pilot-tested to identify and address challenges that may arise during upscaling. The data that will be gathered from pilot-scale tests would be used to establish the process and operational parameters for the technology, paving the way for eventual commercialization.
2
3
CHAPTER 1: Introduction
Background Senate Bill 32 was approved by Governor Brown in 2016. Senate Bill 32 requires the California Air Resources Board to ensure that statewide GHG emissions are reduced 40 percent below 1990 levels by 2030. The 2016 California Air Resources Board statewide GHG emission inventory indicates that the transportation sector is the largest source of GHG in California, responsible for 50 percent of emissions when fuel refining is included, as well as 80 percent of smog-forming pollutants. Executive Order B-55-18 indicates that while California has taken specific steps to reduce GHG emissions, Governor has taken further steps to reduce climate change impacts. His executive order established a new statewide goal “to achieve carbon neutrality as soon as possible, no later than 2045, and achieve and maintain net negative emissions thereafter.” Microalgae have emerged as a promising long-term and sustainable feedstock for biofuel production due to their high productivity rate1, ability to tolerate a wide range of growth conditions2, and lack of competition for land and water with food crops3. Moreover, carbon dioxide (CO2) sequestration via algae was estimated to be one to two orders of magnitude greater than terrestrial plants4. A considerable amount of funding, from both government and private investments, has been spent on research, development, and demonstration projects focused on algal biofuel. As a result, the basic concept of using algal biomass as feedstock for biofuel production has been proven and demonstrated5. However, a scalable, sustainable, and commercially viable system has yet to be developed. The key barriers relate to the cost and energy intensity of the processes involved in the algae-to-biofuel pathway. Currently, two approaches are pursued in the algae-to-fuel pathway: (1) algal lipid extraction and upgrading, and (2) whole algae hydrothermal liquefaction and upgrading. In the former pathway, microalgae cultivation, harvesting/dewatering, extraction, and conversion are the main steps involved (Figure 1). Of these steps, the processes used for algae cultivation and the conversion of extracted cell contents to biofuel are relatively well-established. Algal biomass harvesting and extraction of lipids still attract intense interest from researchers around the world6.
1 T.M. Mata, A.A. Martins, N.S. Caetano, Microalgae for biodiesel production and other applications: A review, Renewable and Sustainable Energy Reviews 14(1) (2010) 217-232. 2 M.A. Borowitzka, Species and Strain Selection, in: M.A. Borowitzka, N.R. Moheimani (Eds.), Algae for Biofuels and Energy, Springer Netherlands, Dordrecht, Netherlands, 2012, pp. 77-89. 3 A. Singh, P.S. Nigam, J.D. Murphy, Renewable fuels from algae: An answer to debatable land based fuels, Bioresource Technology 102(1) (2011) 10-16. 4 B. Wang, Y. Li, N. Wu, C. Lan, CO2 bio-mitigation using microalgae, Applied Microbiology and Biotechnology 79(5) (2008) 707-718. 5 U.S. DOE, National Algal Biofuels Technology Roadmap, U.S. Department of Energy, Office of Energy Efficiency and Renewable Energy, Biomass Program, College Park, Maryland, 2010. 6 T. Garoma, D. Janda, Investigation of the effects of microalgal cell concentration and electroporation, microwave and ultrasonication on lipid extraction efficiency, Renewable Energy 86 (2016) 117-123.
4
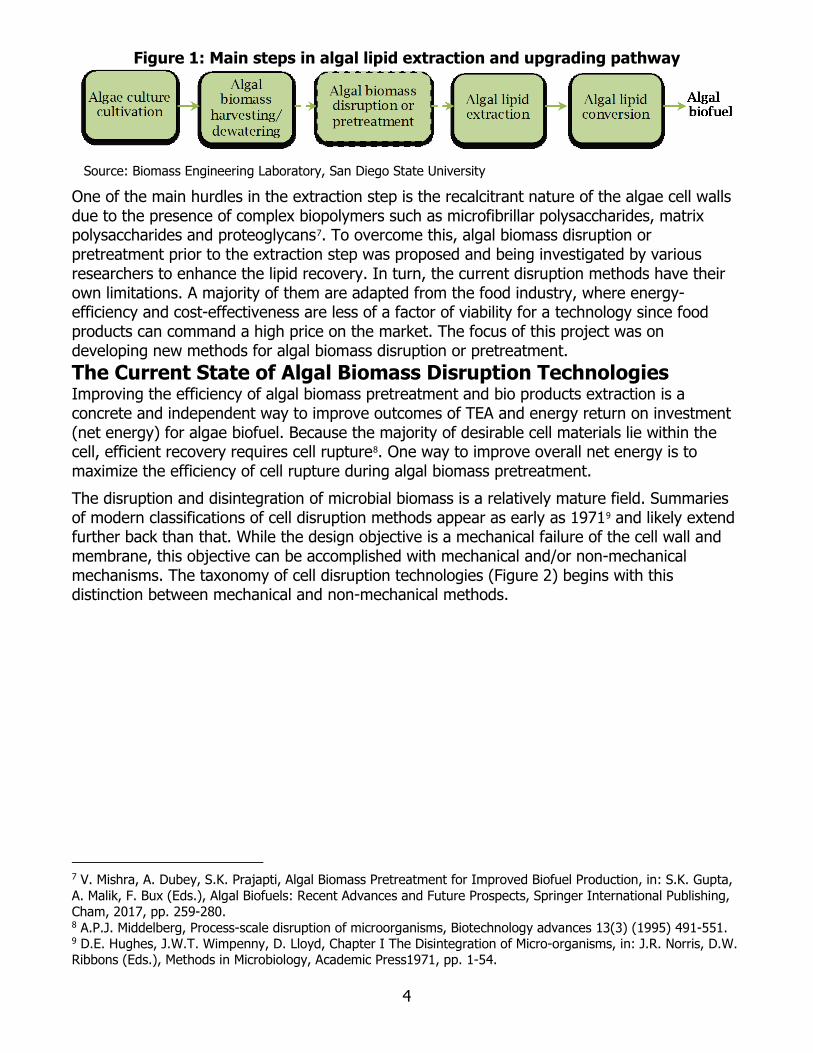
Figure 1: Main steps in algal lipid extraction and upgrading pathway
Source: Biomass Engineering Laboratory, San Diego State University
One of the main hurdles in the extraction step is the recalcitrant nature of the algae cell walls due to the presence of complex biopolymers such as microfibrillar polysaccharides, matrix polysaccharides and proteoglycans7. To overcome this, algal biomass disruption or pretreatment prior to the extraction step was proposed and being investigated by various researchers to enhance the lipid recovery. In turn, the current disruption methods have their own limitations. A majority of them are adapted from the food industry, where energy-efficiency and cost-effectiveness are less of a factor of viability for a technology since food products can command a high price on the market. The focus of this project was on developing new methods for algal biomass disruption or pretreatment. The Current State of Algal Biomass Disruption Technologies Improving the efficiency of algal biomass pretreatment and bio products extraction is a concrete and independent way to improve outcomes of TEA and energy return on investment (net energy) for algae biofuel. Because the majority of desirable cell materials lie within the cell, efficient recovery requires cell rupture8. One way to improve overall net energy is to maximize the efficiency of cell rupture during algal biomass pretreatment. The disruption and disintegration of microbial biomass is a relatively mature field. Summaries of modern classifications of cell disruption methods appear as early as 19719 and likely extend further back than that. While the design objective is a mechanical failure of the cell wall and membrane, this objective can be accomplished with mechanical and/or non-mechanical mechanisms. The taxonomy of cell disruption technologies (Figure 2) begins with this distinction between mechanical and non-mechanical methods.
7 V. Mishra, A. Dubey, S.K. Prajapti, Algal Biomass Pretreatment for Improved Biofuel Production, in: S.K. Gupta, A. Malik, F. Bux (Eds.), Algal Biofuels: Recent Advances and Future Prospects, Springer International Publishing, Cham, 2017, pp. 259-280. 8 A.P.J. Middelberg, Process-scale disruption of microorganisms, Biotechnology advances 13(3) (1995) 491-551. 9 D.E. Hughes, J.W.T. Wimpenny, D. Lloyd, Chapter I The Disintegration of Micro-organisms, in: J.R. Norris, D.W. Ribbons (Eds.), Methods in Microbiology, Academic Press1971, pp. 1-54.
5
Figure 2: Existing algal cell disruption methods
Source: adapted and modified from multiple sources10.
Mechanical methods of cell disruption are characterized by the direct application of force as a surface force. These surface forces are applied in the forms of solid and liquid shear. Three methods that fall into the solid shear category are bead milling, expeller pressing, and grinding with a mortar and pestle. In bead milling, a solution containing microbial biomass is fed into a chamber partially filled with inert beads. The beads in the chamber are then agitated either by shaking or by rotors inside the chamber. These moving beads directly impact and crush the cells in solution. An expeller press is a combination of the principles of an Archimedes screw, a centrifuge, and a screen. Solution containing biomass is fed into a tubular chamber tightly fitted with a screw conveyor and wrapped with a fine screen. The screw is rotated at high speed, creating a high-pressure environment with large centrifugal force. The heavier solid materials accumulate against the screen, and liquids are harvested either through the center of the screw (usually in dewatering applications) or as they pass through the screen (usually in oil recovery applications). The solid shear in this case is imparted by the screw, the screen, and the impingement of the cells on one another. Grinding with a mortar and pestle involves the manual grinding of solids between two solid surfaces by pressing the surfaces together longitudinally and then moving them transversely.
10 A.P.J. Middelberg, Process-scale disruption of microorganisms, Biotechnology advances 13(3) (1995) 491-551.; D.E. Hughes, J.W.T. Wimpenny, D. Lloyd, Chapter I The Disintegration of Micro-organisms, in: J.R. Norris, D.W. Ribbons (Eds.), Methods in Microbiology, Academic Press1971, pp. 1-54.; Y. Chisti, M. Moo-Young, Disruption of microbial cells for intracellular products, Enzyme and Microbial Technology 8(4) (1986) 194-204.; J. Geciova, Methods for disruption of microbial cells for potential use in the dairy industry-a review, International Dairy Journal 12 (2002) 13.; A.K. Lee, D.M. Lewis, P.J. Ashman, Disruption of microalgal cells for the extraction of lipids for biofuels: Processes and specific energy requirements, Biomass and Bioenergy 46 (2012) 89-101.; A. Gonçalves, J.M. Pires, M. Simões, Green fuel production: processes applied to microalgae, Environ Chem Lett 11(4) (2013) 315-324.; S.T.L. Harrison, 2.44 - Cell Disruption, in: M. Moo-Young (Ed.), Comprehensive Biotechnology (Second Edition), Academic Press, Burlington, 2011, pp. 619-640
6
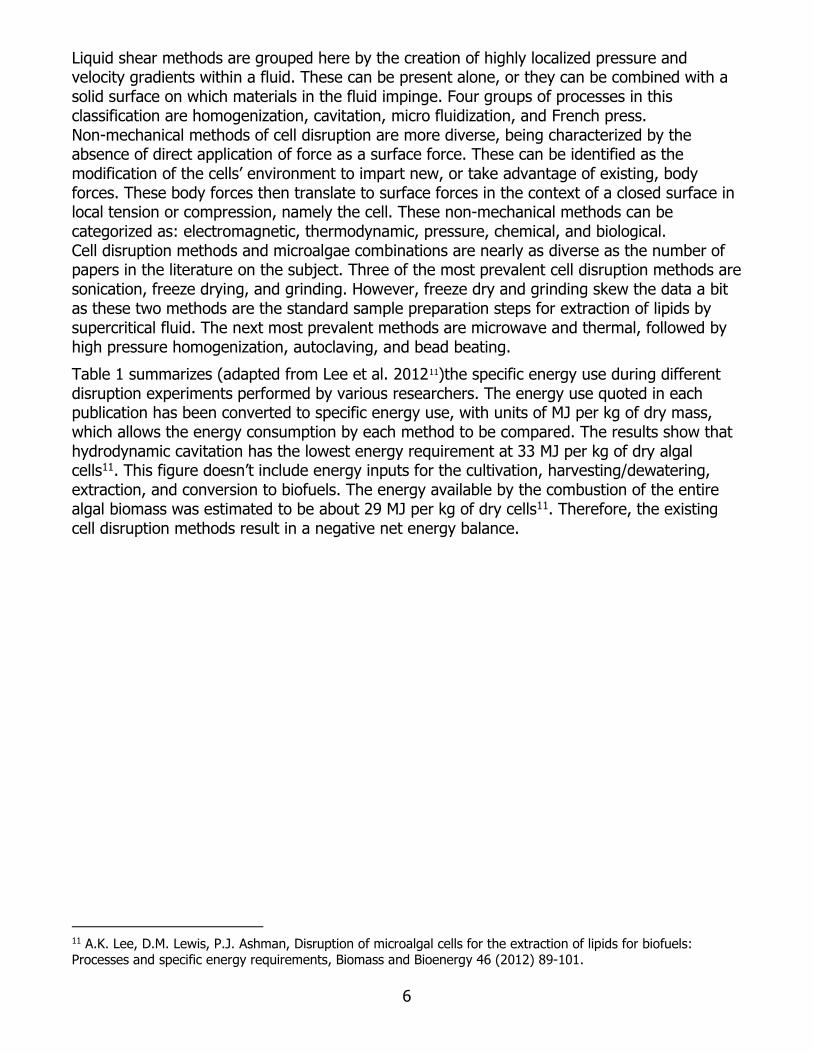
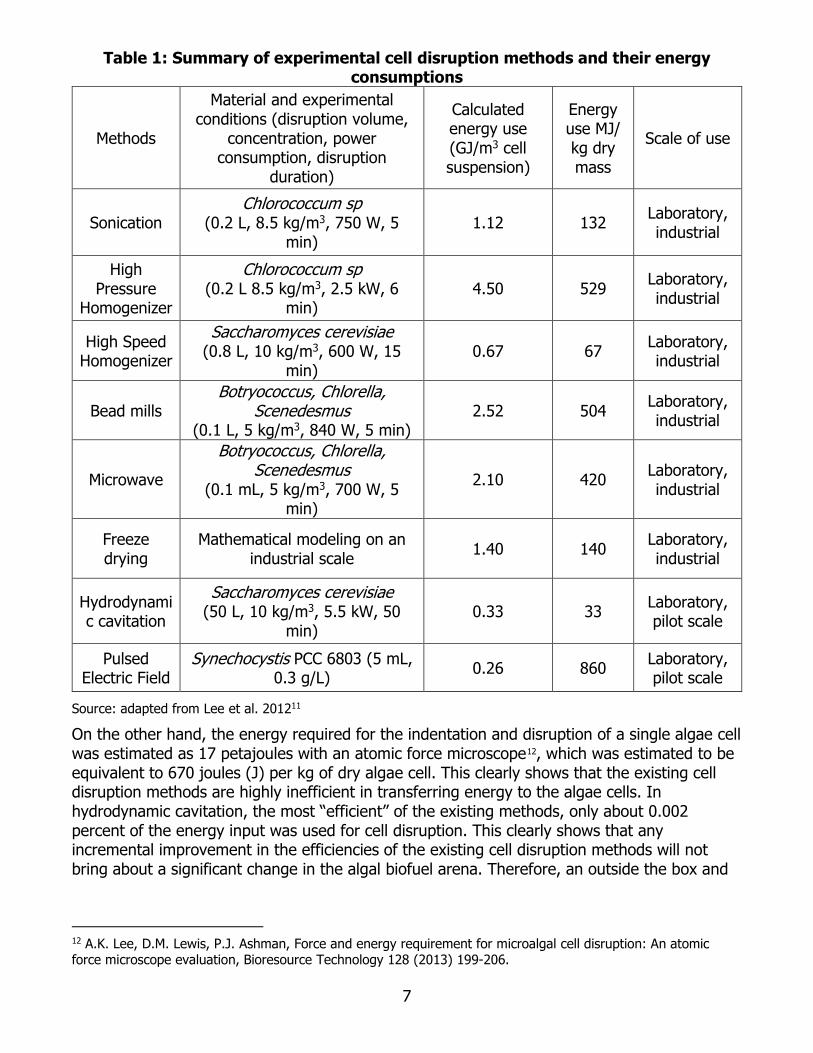
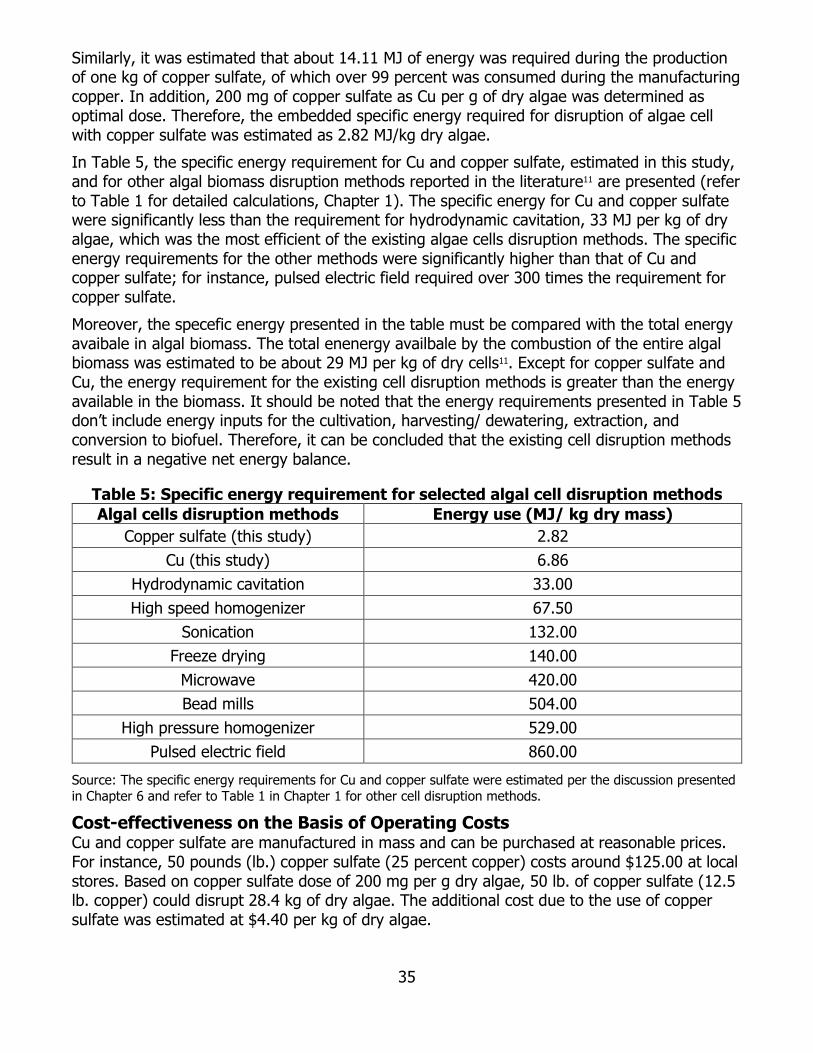
Liquid shear methods are grouped here by the creation of highly localized pressure and velocity gradients within a fluid. These can be present alone, or they can be combined with a solid surface on which materials in the fluid impinge. Four groups of processes in this classification are homogenization, cavitation, micro fluidization, and French press. Non-mechanical methods of cell disruption are more diverse, being characterized by the absence of direct application of force as a surface force. These can be identified as the modification of the cells’ environment to impart new, or take advantage of existing, body forces. These body forces then translate to surface forces in the context of a closed surface in local tension or compression, namely the cell. These non-mechanical methods can be categorized as: electromagnetic, thermodynamic, pressure, chemical, and biological. Cell disruption methods and microalgae combinations are nearly as diverse as the number of papers in the literature on the subject. Three of the most prevalent cell disruption methods are sonication, freeze drying, and grinding. However, freeze dry and grinding skew the data a bit as these two methods are the standard sample preparation steps for extraction of lipids by supercritical fluid. The next most prevalent methods are microwave and thermal, followed by high pressure homogenization, autoclaving, and bead beating. Table 1 summarizes (adapted from Lee et al. 201211)the specific energy use during different disruption experiments performed by various researchers. The energy use quoted in each publication has been converted to specific energy use, with units of MJ per kg of dry mass, which allows the energy consumption by each method to be compared. The results show that hydrodynamic cavitation has the lowest energy requirement at 33 MJ per kg of dry algal cells11. This figure doesn’t include energy inputs for the cultivation, harvesting/dewatering, extraction, and conversion to biofuels. The energy available by the combustion of the entire algal biomass was estimated to be about 29 MJ per kg of dry cells11. Therefore, the existing cell disruption methods result in a negative net energy balance.
11 A.K. Lee, D.M. Lewis, P.J. Ashman, Disruption of microalgal cells for the extraction of lipids for biofuels: Processes and specific energy requirements, Biomass and Bioenergy 46 (2012) 89-101.
7
Table 1: Summary of experimental cell disruption methods and their energy consumptions
Methods
Material and experimental conditions (disruption volume,
On the other hand, the energy required for the indentation and disruption of a single algae cell was estimated as 17 petajoules with an atomic force microscope12, which was estimated to be equivalent to 670 joules (J) per kg of dry algae cell. This clearly shows that the existing cell disruption methods are highly inefficient in transferring energy to the algae cells. In hydrodynamic cavitation, the most “efficient” of the existing methods, only about 0.002 percent of the energy input was used for cell disruption. This clearly shows that any incremental improvement in the efficiencies of the existing cell disruption methods will not bring about a significant change in the algal biofuel arena. Therefore, an outside the box and
12 A.K. Lee, D.M. Lewis, P.J. Ashman, Force and energy requirement for microalgal cell disruption: An atomic force microscope evaluation, Bioresource Technology 128 (2013) 199-206.
8
transformative solution is necessary for the development of a sustainable algal biofuel industry. Project Objectives The purpose of this project was to develop an energy-efficient, cost-effective, and sustainable microalgae cell disruption method, enhancing lipid extraction. To accomplish this, the following objectives were identified and completed: • Investigation of the disruption of algae cell with copper (Cu), • Investigation of the disruption of algae cell with copper sulfate, • Determination of the increases in lipid extraction yields, and • Evaluation of the benefits of the project.
9
CHAPTER 2: Materials and Methods
Technical Approach The disruption experiments with Cu and copper sulfate were investigated using: (1) dilute C. vulgaris suspension at approximately 0.02 percent solids, and (2) C. vulgaris paste at 10 percent solids.
Experimental Set-up for Disruption of C. vulgaris Cells in Suspension The set-up for disruption experiment involving C. vulgaris in suspension consisted of 500 mL Erlenmeyer flasks (Kimble Chase) with a taper Polytetrafluoroethylene stopper (Figure 3). The working volume of the reactors was set to 400 ml to maintain semi-batch reactors after periodic withdrawal of samples for various analyses conducted. Amber flasks were used to prevent transmission of light to the algae cells.
Figure 3: Experimental set-up for disruption of algae cells in dilute suspensions
Photo Credit: Biomass Engineering Laboratory, San Diego State University.
In a typical disruption experiment involving C. vulgaris in suspension, first the algae culture was centrifuged at 10,000 standard gravity for 10 minutes and the supernatant was discarded. The remaining paste was re-suspended in a phosphate buffered deionized water at pH of 7.0. This was done to reduce the influence of the residual growth media on Cu or copper sulfate. Then the re-suspended algal biomass was transferred to clean and autoclaved glass bottles. Next, a solution of Cu or copper sulfate was added to the bottles to result in desired doses. The pH of the reactors was adjusted to 7.0 using dilute solutions of 0.1 N of sodium hydroxide (NaOH) or hydrochloric acid (HCl). Then, the reactors were capped, and the contents were mixed continuously using stirrer plates. Samples were periodically collected from the reactors during the course of treatment process. Finally, the cell samples were characterized using cellometer and scanning electron microscope (SEM) analyses.
Experimental Set-up for Disruption of C. vulgaris Cells in Paste The disruption experiment involving C. vulgaris paste at 10 percent was performed in a clean Van Waters & Rogers (VWR) 50-ml centrifuge tubes. To the clean VWR tubes, known mass of the algae paste and a solution of Cu or copper sulfate were added to achieve desired doses of
10
copper and 10 percent algae cell concentration. The contents of the tubes were mixed using Heidolph Unimax 1010 shaker. Samples were withdrawn periodically and processed for lipid extraction, following the procedure described in Chapter 2.
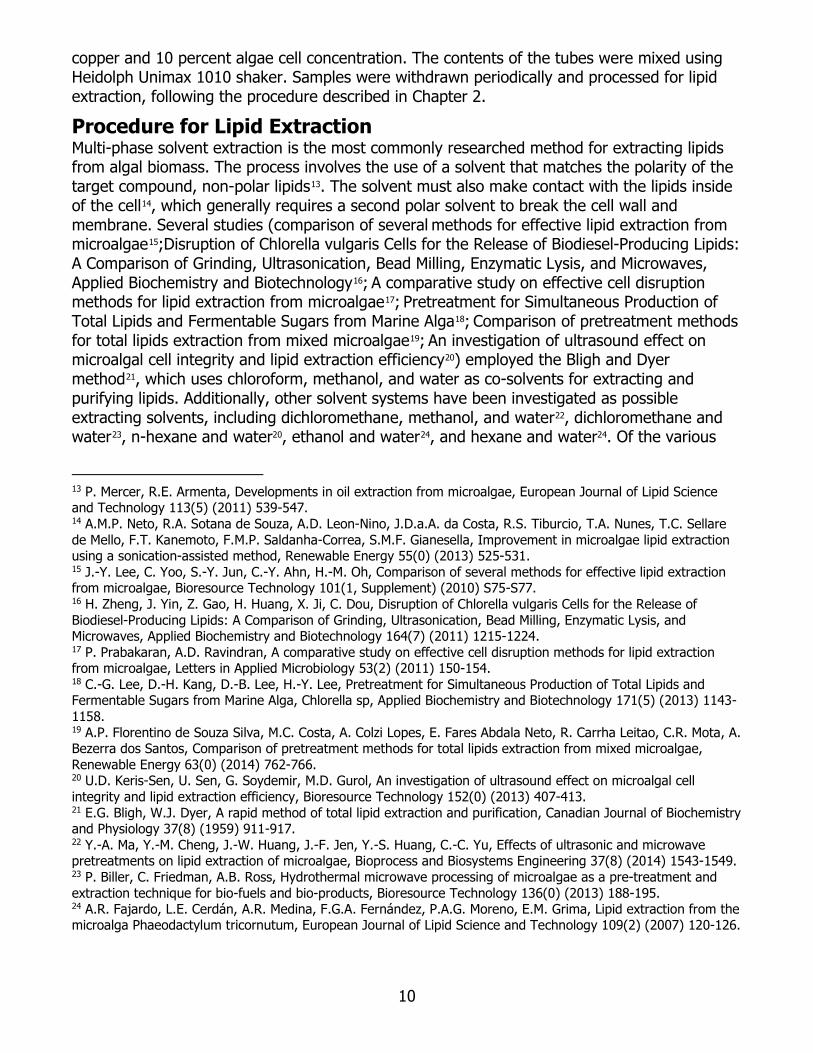
Procedure for Lipid Extraction Multi-phase solvent extraction is the most commonly researched method for extracting lipids from algal biomass. The process involves the use of a solvent that matches the polarity of the target compound, non-polar lipids13. The solvent must also make contact with the lipids inside of the cell14, which generally requires a second polar solvent to break the cell wall and membrane. Several studies (comparison of several methods for effective lipid extraction from microalgae15;Disruption of Chlorella vulgaris Cells for the Release of Biodiesel-Producing Lipids: A Comparison of Grinding, Ultrasonication, Bead Milling, Enzymatic Lysis, and Microwaves, Applied Biochemistry and Biotechnology16; A comparative study on effective cell disruption methods for lipid extraction from microalgae17; Pretreatment for Simultaneous Production of Total Lipids and Fermentable Sugars from Marine Alga18; Comparison of pretreatment methods for total lipids extraction from mixed microalgae19; An investigation of ultrasound effect on microalgal cell integrity and lipid extraction efficiency20) employed the Bligh and Dyer method21, which uses chloroform, methanol, and water as co-solvents for extracting and purifying lipids. Additionally, other solvent systems have been investigated as possible extracting solvents, including dichloromethane, methanol, and water22, dichloromethane and water23, n-hexane and water20, ethanol and water24, and hexane and water24. Of the various
13 P. Mercer, R.E. Armenta, Developments in oil extraction from microalgae, European Journal of Lipid Science and Technology 113(5) (2011) 539-547. 14 A.M.P. Neto, R.A. Sotana de Souza, A.D. Leon-Nino, J.D.a.A. da Costa, R.S. Tiburcio, T.A. Nunes, T.C. Sellare de Mello, F.T. Kanemoto, F.M.P. Saldanha-Correa, S.M.F. Gianesella, Improvement in microalgae lipid extraction using a sonication-assisted method, Renewable Energy 55(0) (2013) 525-531. 15 J.-Y. Lee, C. Yoo, S.-Y. Jun, C.-Y. Ahn, H.-M. Oh, Comparison of several methods for effective lipid extraction from microalgae, Bioresource Technology 101(1, Supplement) (2010) S75-S77. 16 H. Zheng, J. Yin, Z. Gao, H. Huang, X. Ji, C. Dou, Disruption of Chlorella vulgaris Cells for the Release of Biodiesel-Producing Lipids: A Comparison of Grinding, Ultrasonication, Bead Milling, Enzymatic Lysis, and Microwaves, Applied Biochemistry and Biotechnology 164(7) (2011) 1215-1224. 17 P. Prabakaran, A.D. Ravindran, A comparative study on effective cell disruption methods for lipid extraction from microalgae, Letters in Applied Microbiology 53(2) (2011) 150-154. 18 C.-G. Lee, D.-H. Kang, D.-B. Lee, H.-Y. Lee, Pretreatment for Simultaneous Production of Total Lipids and Fermentable Sugars from Marine Alga, Chlorella sp, Applied Biochemistry and Biotechnology 171(5) (2013) 1143-1158. 19 A.P. Florentino de Souza Silva, M.C. Costa, A. Colzi Lopes, E. Fares Abdala Neto, R. Carrha Leitao, C.R. Mota, A. Bezerra dos Santos, Comparison of pretreatment methods for total lipids extraction from mixed microalgae, Renewable Energy 63(0) (2014) 762-766. 20 U.D. Keris-Sen, U. Sen, G. Soydemir, M.D. Gurol, An investigation of ultrasound effect on microalgal cell integrity and lipid extraction efficiency, Bioresource Technology 152(0) (2013) 407-413. 21 E.G. Bligh, W.J. Dyer, A rapid method of total lipid extraction and purification, Canadian Journal of Biochemistry and Physiology 37(8) (1959) 911-917. 22 Y.-A. Ma, Y.-M. Cheng, J.-W. Huang, J.-F. Jen, Y.-S. Huang, C.-C. Yu, Effects of ultrasonic and microwave pretreatments on lipid extraction of microalgae, Bioprocess and Biosystems Engineering 37(8) (2014) 1543-1549. 23 P. Biller, C. Friedman, A.B. Ross, Hydrothermal microwave processing of microalgae as a pre-treatment and extraction technique for bio-fuels and bio-products, Bioresource Technology 136(0) (2013) 188-195. 24 A.R. Fajardo, L.E. Cerdán, A.R. Medina, F.G.A. Fernández, P.A.G. Moreno, E.M. Grima, Lipid extraction from the microalga Phaeodactylum tricornutum, European Journal of Lipid Science and Technology 109(2) (2007) 120-126.
11
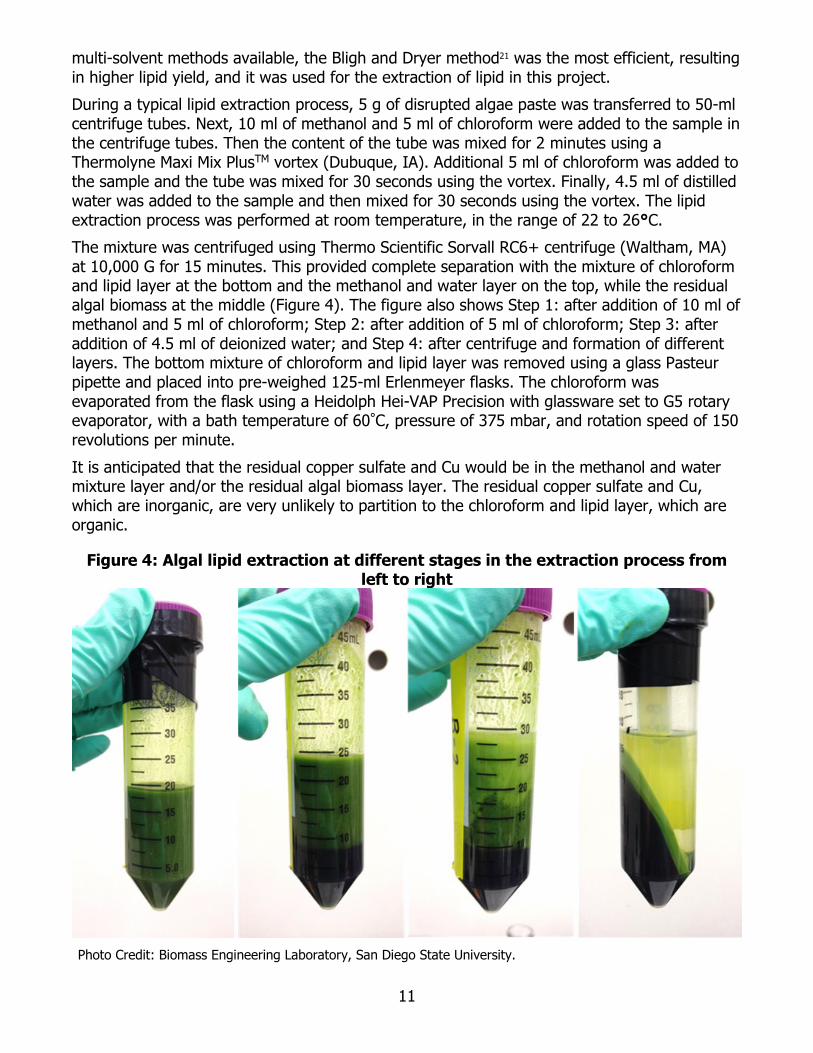
multi-solvent methods available, the Bligh and Dryer method21 was the most efficient, resulting in higher lipid yield, and it was used for the extraction of lipid in this project. During a typical lipid extraction process, 5 g of disrupted algae paste was transferred to 50-ml centrifuge tubes. Next, 10 ml of methanol and 5 ml of chloroform were added to the sample in the centrifuge tubes. Then the content of the tube was mixed for 2 minutes using a Thermolyne Maxi Mix PlusTM vortex (Dubuque, IA). Additional 5 ml of chloroform was added to the sample and the tube was mixed for 30 seconds using the vortex. Finally, 4.5 ml of distilled water was added to the sample and then mixed for 30 seconds using the vortex. The lipid extraction process was performed at room temperature, in the range of 22 to 26°C. The mixture was centrifuged using Thermo Scientific Sorvall RC6+ centrifuge (Waltham, MA) at 10,000 G for 15 minutes. This provided complete separation with the mixture of chloroform and lipid layer at the bottom and the methanol and water layer on the top, while the residual algal biomass at the middle (Figure 4). The figure also shows Step 1: after addition of 10 ml of methanol and 5 ml of chloroform; Step 2: after addition of 5 ml of chloroform; Step 3: after addition of 4.5 ml of deionized water; and Step 4: after centrifuge and formation of different layers. The bottom mixture of chloroform and lipid layer was removed using a glass Pasteur pipette and placed into pre-weighed 125-ml Erlenmeyer flasks. The chloroform was evaporated from the flask using a Heidolph Hei-VAP Precision with glassware set to G5 rotary evaporator, with a bath temperature of 60°C, pressure of 375 mbar, and rotation speed of 150 revolutions per minute. It is anticipated that the residual copper sulfate and Cu would be in the methanol and water mixture layer and/or the residual algal biomass layer. The residual copper sulfate and Cu, which are inorganic, are very unlikely to partition to the chloroform and lipid layer, which are organic.
Figure 4: Algal lipid extraction at different stages in the extraction process from left to right
Photo Credit: Biomass Engineering Laboratory, San Diego State University.
12
Materials Chemicals and reagents used in the study were obtained from Fischer Scientific (Pittsburgh, PA) and Sigma-Aldrich Co. (St. Louis, MO). C. vulgaris, one of the most widely researched algal species for biofuel feedstock, was used as representative microalgae. C. vulgaris culture was purchased from Carolina Biological Supply Company (Burlington, NC). Cu is available in two forms, granular and dissolved. In preliminary tests, it was observed that granular Cu was slightly miscible with water, while aqueous Cu was completely miscible with water. Algal cells are suspended in growth media where water is the major constituent, and therefore, aqueous Cu was used in this project. C. vulgaris Culture Maintenance, Cultivation and Harvesting C. vulgaris culture was grown in a medium prepared from MiracleGro All Purpose Water Soluble Plant Food. The media has been used in the past as a simple isolation media for the growth of microalgae in the laboratory25. The PI’s team also tested mixing rich media with MiracleGro at varying ratios to encourage growth rate and microalgae dominance in culture and determined that the most consistently aseptic and high rate growth came from a minimal media consisting of only MiracleGro solution (2.337 g/L - Hydrated). During a typical growth cycle (Figure 5), few colonies of C. vulgaris from agar-plate cultures were aseptically transferred into 25 ml medium contained in 50 ml VWR tests tubes, and then capped with sponge plug. The test-tube cultures were placed under fluorescent lighting system, 14 hours’ light and 10 hours’ dark, and were aerated daily using a vortex. After the culture growth reached to approximately 0.3 to 0.4 abs at 600 nanometre (nm), it was transferred to 500 ml VWR Erlenmeyer flasks containing 350 ml medium. These cultures were aerated using aquarium air pump and were placed on stirrer plates for mixing and under the fluorescent light for 14 days.
Figure 5: A typical C. vulgaris biomass production cycle: (a) C. vulgaris colony in agar plates, (b) maintenance cultures, (c) starter cultures, (d) growth cultures, and
(e) concentrated algal paste
Photo Credit: Biomass Engineering Laboratory, San Diego State University.
Finally, after approximately 0.3 to 0.4 abs at 600 nm was achieved, the cultures were used for the inoculation of 3500 ml medium in 4 L VWR Erlenmeyer flasks. The cultures were aerated with an air stream containing 4.0 percent CO2 at a total flow rate of 200 ml/min or 25 ml/min per reactor. Reactors were placed on stirrer plates for mixing and under fluorescent light for 14 days. The cultures were harvested at an absorbance of approximately 0.5 at 600 nm. The cultures were concentrated with centrifugation at 10,000 G for 10 min. A prior study by the
25 K. Lee, M.L. Eisterhold, F. Rindi, S. Palanisami, P.K. Nam, Isolation and screening of microalgae from natural habitats in the midwestern United States of America for biomass and biodiesel sources, Journal of Natural Science, Biology, and Medicine 5(2) (2014) 333-339.
13
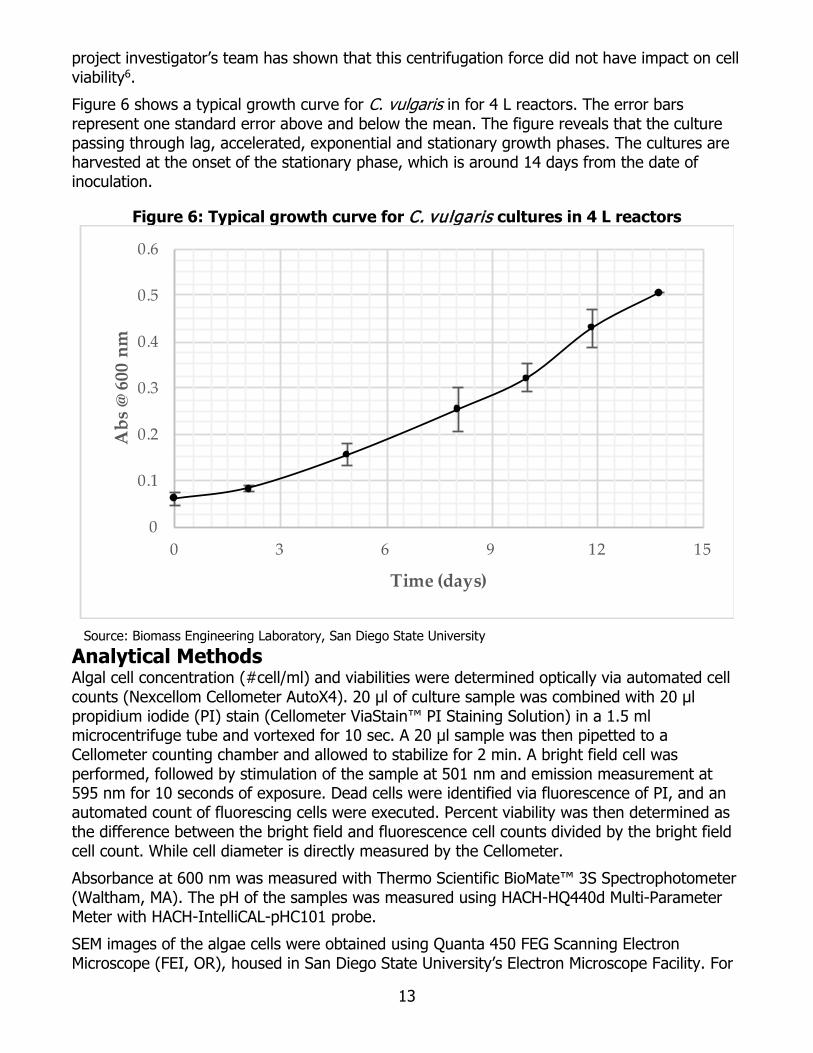
project investigator’s team has shown that this centrifugation force did not have impact on cell viability6. Figure 6 shows a typical growth curve for C. vulgaris in for 4 L reactors. The error bars represent one standard error above and below the mean. The figure reveals that the culture passing through lag, accelerated, exponential and stationary growth phases. The cultures are harvested at the onset of the stationary phase, which is around 14 days from the date of inoculation.
Figure 6: Typical growth curve for C. vulgaris cultures in 4 L reactors
Source: Biomass Engineering Laboratory, San Diego State University
Analytical Methods Algal cell concentration (#cell/ml) and viabilities were determined optically via automated cell counts (Nexcellom Cellometer AutoX4). 20 μl of culture sample was combined with 20 μl propidium iodide (PI) stain (Cellometer ViaStain™ PI Staining Solution) in a 1.5 ml microcentrifuge tube and vortexed for 10 sec. A 20 μl sample was then pipetted to a Cellometer counting chamber and allowed to stabilize for 2 min. A bright field cell was performed, followed by stimulation of the sample at 501 nm and emission measurement at 595 nm for 10 seconds of exposure. Dead cells were identified via fluorescence of PI, and an automated count of fluorescing cells were executed. Percent viability was then determined as the difference between the bright field and fluorescence cell counts divided by the bright field cell count. While cell diameter is directly measured by the Cellometer. Absorbance at 600 nm was measured with Thermo Scientific BioMate™ 3S Spectrophotometer (Waltham, MA). The pH of the samples was measured using HACH-HQ440d Multi-Parameter Meter with HACH-IntelliCAL-pHC101 probe. SEM images of the algae cells were obtained using Quanta 450 FEG Scanning Electron Microscope (FEI, OR), housed in San Diego State University’s Electron Microscope Facility. For
14
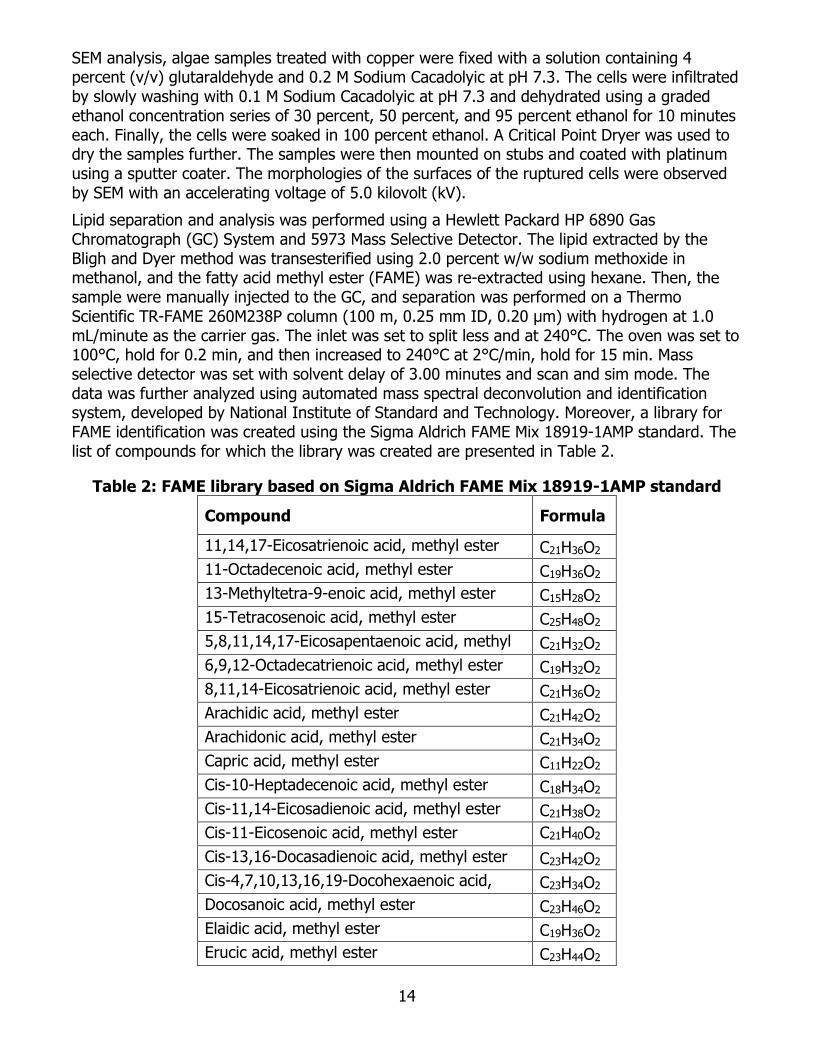
SEM analysis, algae samples treated with copper were fixed with a solution containing 4 percent (v/v) glutaraldehyde and 0.2 M Sodium Cacadolyic at pH 7.3. The cells were infiltrated by slowly washing with 0.1 M Sodium Cacadolyic at pH 7.3 and dehydrated using a graded ethanol concentration series of 30 percent, 50 percent, and 95 percent ethanol for 10 minutes each. Finally, the cells were soaked in 100 percent ethanol. A Critical Point Dryer was used to dry the samples further. The samples were then mounted on stubs and coated with platinum using a sputter coater. The morphologies of the surfaces of the ruptured cells were observed by SEM with an accelerating voltage of 5.0 kilovolt (kV). Lipid separation and analysis was performed using a Hewlett Packard HP 6890 Gas Chromatograph (GC) System and 5973 Mass Selective Detector. The lipid extracted by the Bligh and Dyer method was transesterified using 2.0 percent w/w sodium methoxide in methanol, and the fatty acid methyl ester (FAME) was re-extracted using hexane. Then, the sample were manually injected to the GC, and separation was performed on a Thermo Scientific TR-FAME 260M238P column (100 m, 0.25 mm ID, 0.20 µm) with hydrogen at 1.0 mL/minute as the carrier gas. The inlet was set to split less and at 240°C. The oven was set to 100°C, hold for 0.2 min, and then increased to 240°C at 2°C/min, hold for 15 min. Mass selective detector was set with solvent delay of 3.00 minutes and scan and sim mode. The data was further analyzed using automated mass spectral deconvolution and identification system, developed by National Institute of Standard and Technology. Moreover, a library for FAME identification was created using the Sigma Aldrich FAME Mix 18919-1AMP standard. The list of compounds for which the library was created are presented in Table 2.
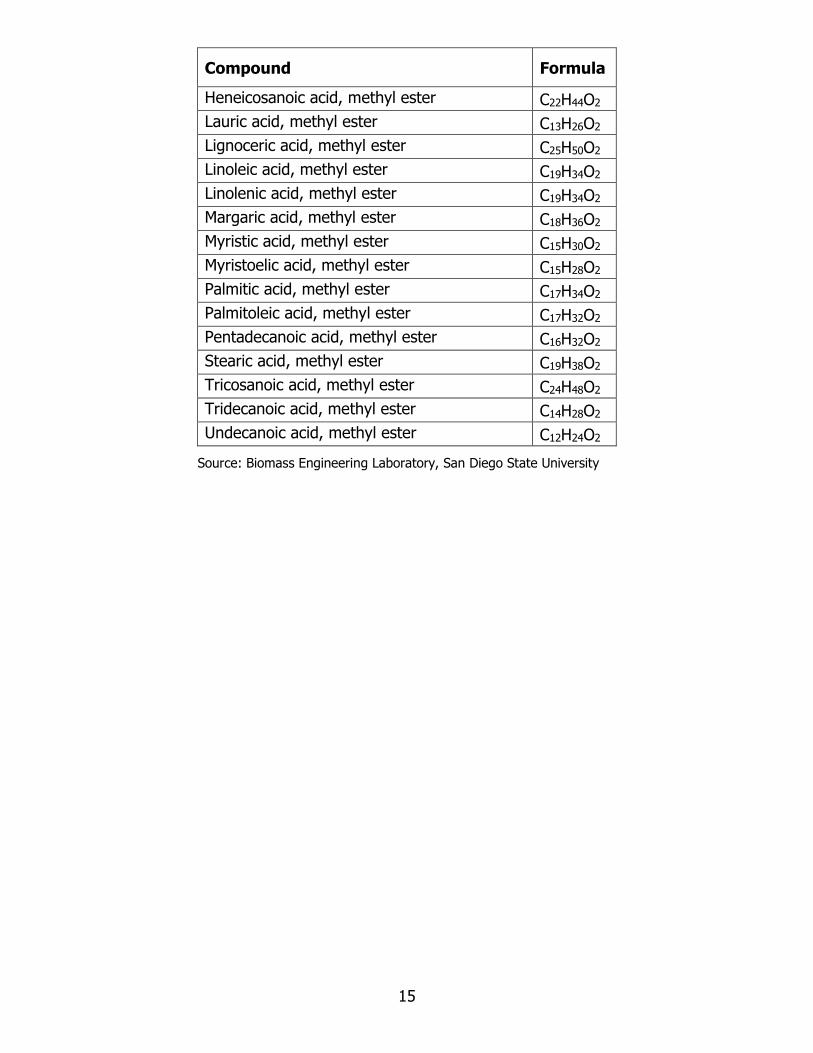
Table 2: FAME library based on Sigma Aldrich FAME Mix 18919-1AMP standard
Source: Biomass Engineering Laboratory, San Diego State University
16
CHAPTER 3: Disruption of C. vulgaris Cells with Cu
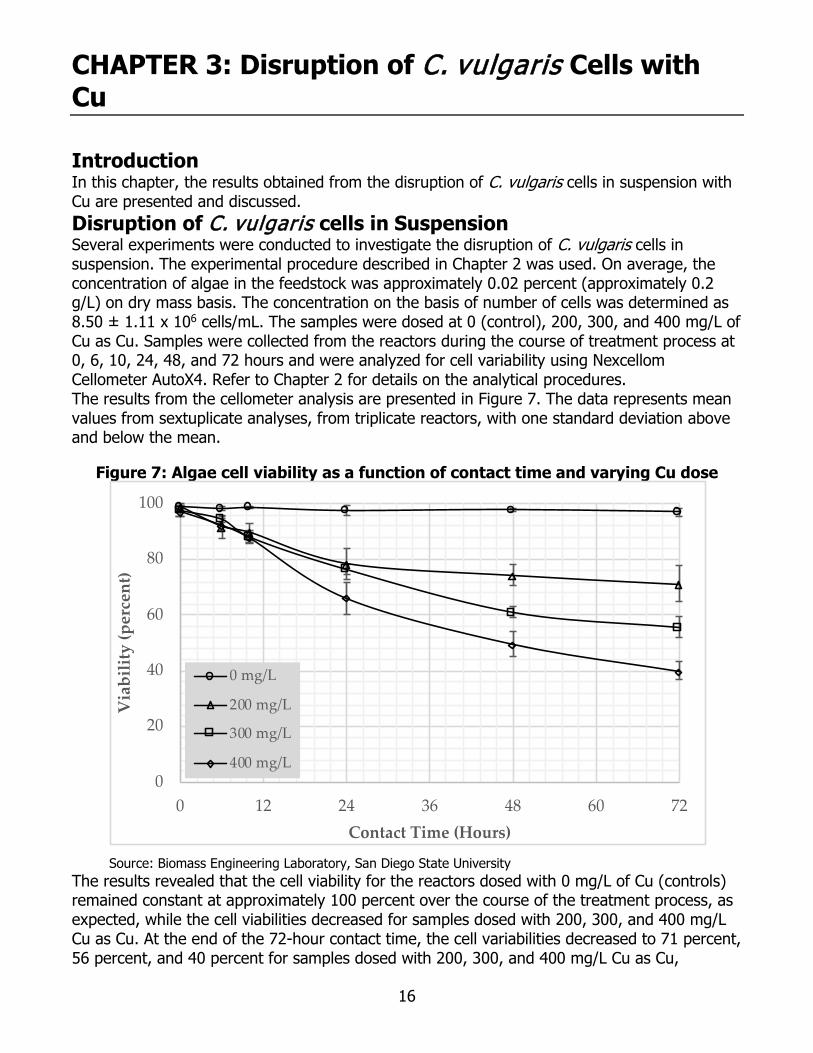
Introduction In this chapter, the results obtained from the disruption of C. vulgaris cells in suspension with Cu are presented and discussed. Disruption of C. vulgaris cells in Suspension Several experiments were conducted to investigate the disruption of C. vulgaris cells in suspension. The experimental procedure described in Chapter 2 was used. On average, the concentration of algae in the feedstock was approximately 0.02 percent (approximately 0.2 g/L) on dry mass basis. The concentration on the basis of number of cells was determined as 8.50 ± 1.11 x 10⁶ cells/mL. The samples were dosed at 0 (control), 200, 300, and 400 mg/L of Cu as Cu. Samples were collected from the reactors during the course of treatment process at 0, 6, 10, 24, 48, and 72 hours and were analyzed for cell variability using Nexcellom Cellometer AutoX4. Refer to Chapter 2 for details on the analytical procedures. The results from the cellometer analysis are presented in Figure 7. The data represents mean values from sextuplicate analyses, from triplicate reactors, with one standard deviation above and below the mean.
Figure 7: Algae cell viability as a function of contact time and varying Cu dose
Source: Biomass Engineering Laboratory, San Diego State University
The results revealed that the cell viability for the reactors dosed with 0 mg/L of Cu (controls) remained constant at approximately 100 percent over the course of the treatment process, as expected, while the cell viabilities decreased for samples dosed with 200, 300, and 400 mg/L Cu as Cu. At the end of the 72-hour contact time, the cell variabilities decreased to 71 percent, 56 percent, and 40 percent for samples dosed with 200, 300, and 400 mg/L Cu as Cu,
17
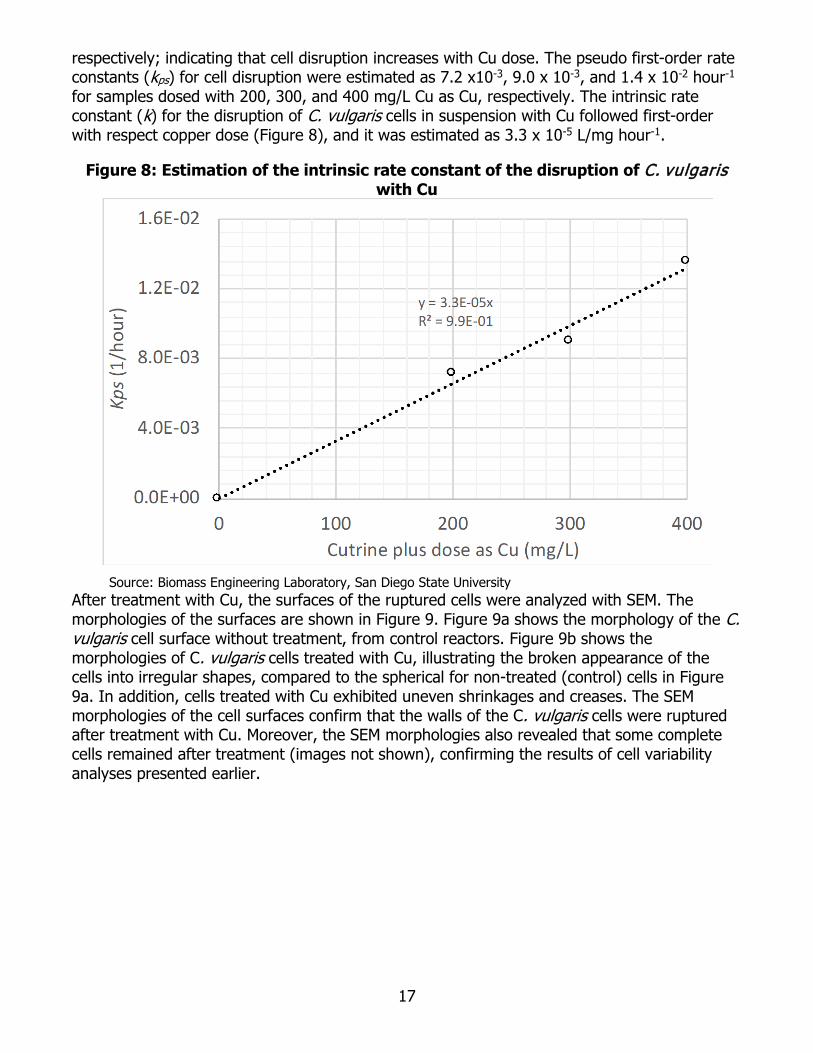
respectively; indicating that cell disruption increases with Cu dose. The pseudo first-order rate constants (kps) for cell disruption were estimated as 7.2 x10⁻³, 9.0 x 10⁻³, and 1.4 x 10⁻² hour-1 for samples dosed with 200, 300, and 400 mg/L Cu as Cu, respectively. The intrinsic rate constant (k) for the disruption of C. vulgaris cells in suspension with Cu followed first-order with respect copper dose (Figure 8), and it was estimated as 3.3 x 10⁻⁵ L/mg hour-1.
Figure 8: Estimation of the intrinsic rate constant of the disruption of C. vulgaris with Cu
Source: Biomass Engineering Laboratory, San Diego State University
After treatment with Cu, the surfaces of the ruptured cells were analyzed with SEM. The morphologies of the surfaces are shown in Figure 9. Figure 9a shows the morphology of the C. vulgaris cell surface without treatment, from control reactors. Figure 9b shows the morphologies of C. vulgaris cells treated with Cu, illustrating the broken appearance of the cells into irregular shapes, compared to the spherical for non-treated (control) cells in Figure 9a. In addition, cells treated with Cu exhibited uneven shrinkages and creases. The SEM morphologies of the cell surfaces confirm that the walls of the C. vulgaris cells were ruptured after treatment with Cu. Moreover, the SEM morphologies also revealed that some complete cells remained after treatment (images not shown), confirming the results of cell variability analyses presented earlier.
18
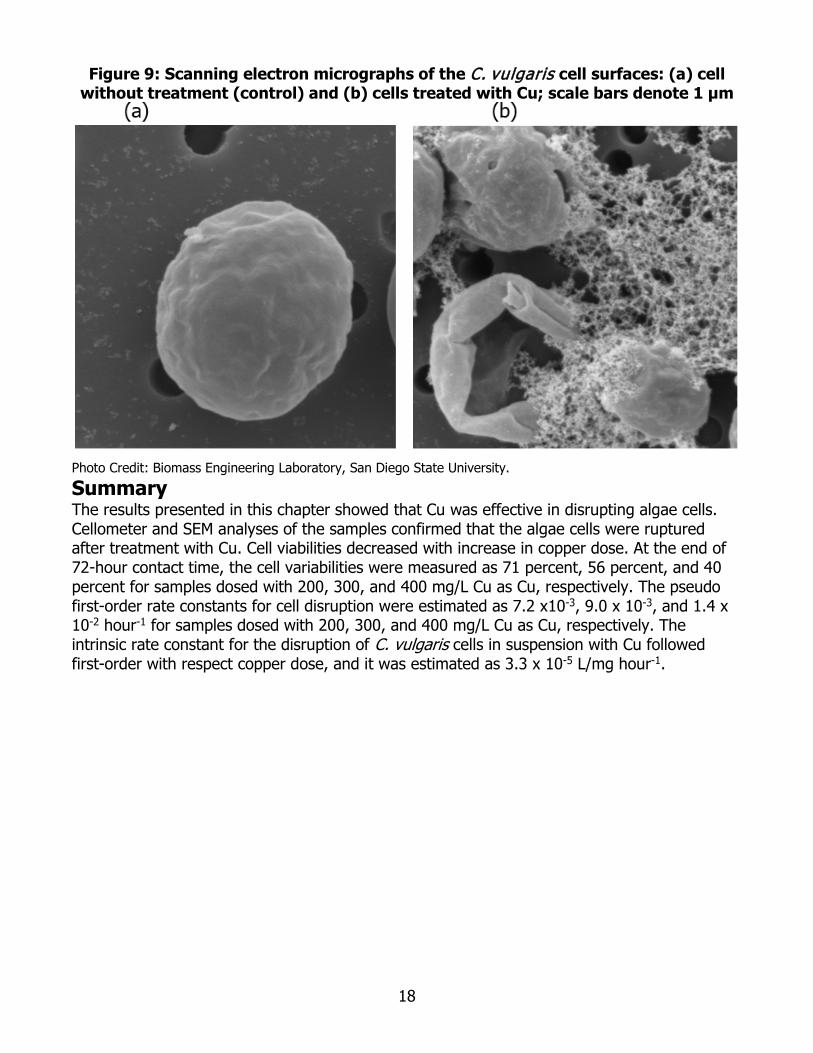
Figure 9: Scanning electron micrographs of the C. vulgaris cell surfaces: (a) cell without treatment (control) and (b) cells treated with Cu; scale bars denote 1 μm
Photo Credit: Biomass Engineering Laboratory, San Diego State University. Summary The results presented in this chapter showed that Cu was effective in disrupting algae cells. Cellometer and SEM analyses of the samples confirmed that the algae cells were ruptured after treatment with Cu. Cell viabilities decreased with increase in copper dose. At the end of 72-hour contact time, the cell variabilities were measured as 71 percent, 56 percent, and 40 percent for samples dosed with 200, 300, and 400 mg/L Cu as Cu, respectively. The pseudo first-order rate constants for cell disruption were estimated as 7.2 x10⁻³, 9.0 x 10⁻³, and 1.4 x 10⁻² hour-1 for samples dosed with 200, 300, and 400 mg/L Cu as Cu, respectively. The intrinsic rate constant for the disruption of C. vulgaris cells in suspension with Cu followed first-order with respect copper dose, and it was estimated as 3.3 x 10⁻⁵ L/mg hour-1.
19
CHAPTER 4: Disruption of C. vulgaris Cells with Copper Sulfate
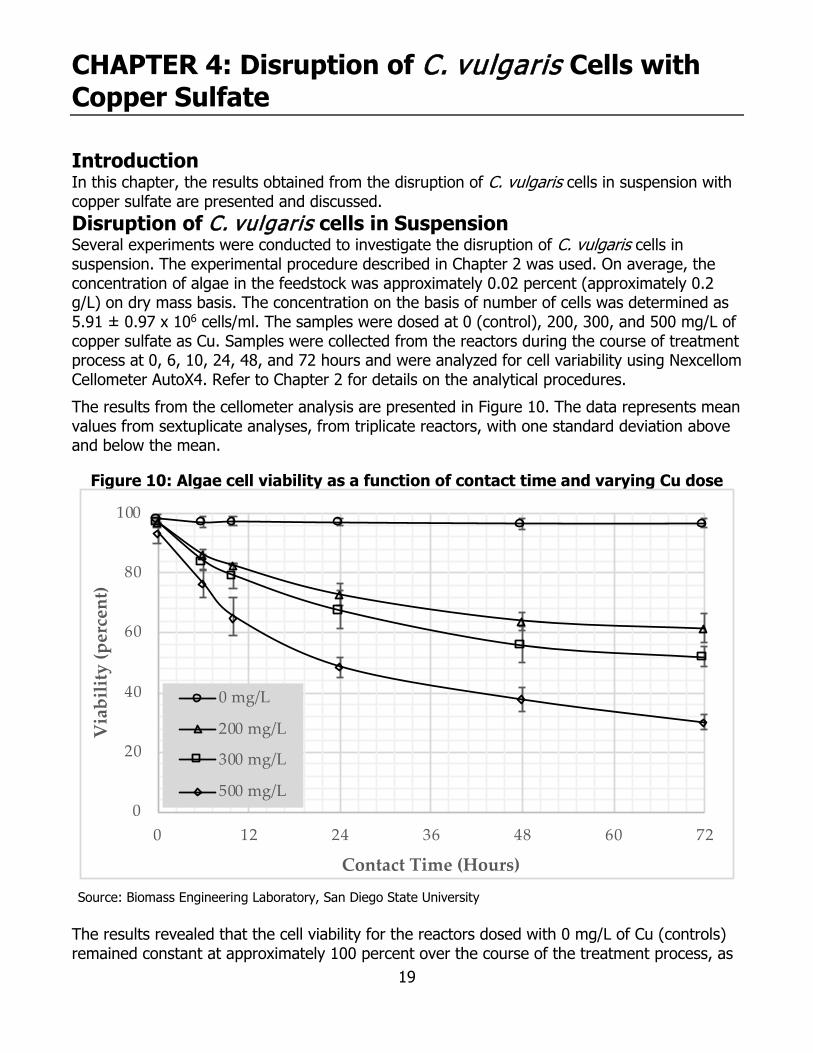
Introduction In this chapter, the results obtained from the disruption of C. vulgaris cells in suspension with copper sulfate are presented and discussed. Disruption of C. vulgaris cells in Suspension Several experiments were conducted to investigate the disruption of C. vulgaris cells in suspension. The experimental procedure described in Chapter 2 was used. On average, the concentration of algae in the feedstock was approximately 0.02 percent (approximately 0.2 g/L) on dry mass basis. The concentration on the basis of number of cells was determined as 5.91 ± 0.97 x 10⁶ cells/ml. The samples were dosed at 0 (control), 200, 300, and 500 mg/L of copper sulfate as Cu. Samples were collected from the reactors during the course of treatment process at 0, 6, 10, 24, 48, and 72 hours and were analyzed for cell variability using Nexcellom Cellometer AutoX4. Refer to Chapter 2 for details on the analytical procedures. The results from the cellometer analysis are presented in Figure 10. The data represents mean values from sextuplicate analyses, from triplicate reactors, with one standard deviation above and below the mean.
Figure 10: Algae cell viability as a function of contact time and varying Cu dose
Source: Biomass Engineering Laboratory, San Diego State University
The results revealed that the cell viability for the reactors dosed with 0 mg/L of Cu (controls) remained constant at approximately 100 percent over the course of the treatment process, as
20
expected, while the cell viabilities decreased for samples dosed with 200, 300, and 500 mg/L copper sulfate as Cu. At the end of the 72-hour contact time, the cell variabilities decreased to 62 percent, 52 percent, and 30 percent for samples dosed with 200, 300, and 500 mg/L copper sulfate as Cu, respectively; indicating that cell disruption increases with copper sulfate dose. The pseudo first-order rate constants for cell disruption were estimated as 1.1 x10⁻², 1.3 x 10⁻², and 3.3 x 10⁻² hour-1 for samples dosed with 200, 300, and 500 mg/L copper sulfate as Cu, respectively. The intrinsic k for the disruption of C. vulgaris cells in suspension with copper sulfate followed first-order with respect copper dose (Figure 11), and it was estimated as 6.0 x 10⁻⁵ L/mg hour-1.
Figure 11: Estimation of the intrinsic rate constant of the disruption of C. vulgaris with copper sulfate
Source: Biomass Engineering Laboratory, San Diego State University
After treatment with copper sulfate, the surfaces of the ruptured cells were analyzed with SEM. The morphologies of the surfaces are shown in Figure 12. Figure 12a shows the morphology of the C. vulgaris cell surface without treatment, from control reactors. Figure 12b shows the morphologies of C. vulgaris cells treated with copper sulfate, illustrating the broken appearance of the cells into irregular shapes, compared to the spherical for non-treated (control) cells in Figure 12a. In addition, cells treated with copper sulfate exhibited uneven shrinkages and creases. The SEM morphologies of the cell surfaces confirm that the walls of the C. vulgaris cells were ruptured after treatment with copper sulfate. Moreover, the SEM morphologies also revealed that some complete cells remained after treatment (images not shown), confirming the results of cell variability analyses presented earlier.
21
Figure 12: Scanning electron micrographs of the C. vulgaris cell surfaces: (a) cell without treatment (control) and (b) cells treated with copper sulfate; scale bars
denote 1 μm
Photo Credit: Biomass Engineering Laboratory, San Diego State University. Summary The results presented in this chapter showed that copper sulfate was effective in disrupting algae cells. Cellometer and SEM analyses of the samples confirmed that the algae cells were ruptured after treatment with copper sulfate. Cell viabilities decreased with increase in copper dose. At the end of 72-hour contact time, the cell variabilities were measured as 62 percent, 52 percent, and 30 percent for samples dosed with 200, 300, and 500 mg/L copper sulfate as Cu, respectively. The pseudo first-order rate constants for cell disruption were estimated as 1.1 x10⁻², 1.3 x 10⁻², and 3.3 x 10⁻² hour-1 for samples dosed with 200, 300, and 500 mg/L copper sulfate as Cu, respectively. The intrinsic rate constant for the disruption of C. vulgaris cells in suspension with copper sulfate followed first-order with respect copper dose, and it was estimated as 6.0 x 10⁻⁵ L/mg hour-1.
22
CHAPTER 5: Lipid Extraction Yields
Introduction In this chapter, the results obtained from the extraction of lipid from algal biomass disrupted with Cu and copper sulfate are presented and discussed.
Lipid Extraction from Algal Biomass Disrupted with Cu Disruption and lipid extraction experiments were conducted using C. vulgaris paste at 10 percent solids dosed with 0 (controls), 50, and 100 mg of Cu as Cu per g of dry algae. The experimental procedure described in Chapter 2 was used. Samples were collected at 24 and 48 hours, and then lipid extraction was performed on them. The results as mg of lipid extracted per g of dry algae are presented in Figure 13. The data represents mean values from triplicates with one standard deviation above and below the mean.
Figure 13: Lipid extraction as a function of contact time and Cu dose
Source: Biomass Engineering Laboratory, San Diego State University
The data revealed that lipid extraction increased with copper dose. For control samples, as expected, the lipid extraction yield remained constant around 160 mg of lipid per g of C. vulgaris after 24- and 48-hour contact times. For samples dosed with 50 mg of Cu as Cu per g of dry C. vulgaris, lipid extraction yields of 186 and 194 mg per g of C. vulgaris were achieved at 24- and 48-hour contact times, respectively. Lipid extraction yields of 208 and 215 mg per g
23
of C. vulgaris were achieved at 24- and 48-hour contact times, respectively, for samples dosed with 100 mg of Cu as Cu per g of dry C. vulgaris. The p-values, at an α of 0.05, for various paired t-tests for lipid extraction yield achieved at different copper doses (0 vs. 50 mg/g, 0 vs. 100 mg/g, and 50 vs. 100 mg/g) were < 0.01, indicating that there were significant differences for the yields. On the other hand, there was no significant difference in lipid yields for samples dosed with 0, 50, and 100 mg of Cu as Cu per g of dry algae for paired t-tests at contact times of 24 and 48 hours; the p-values for the paired t-test were > 0.05.
Lipid Extraction from Algal Biomass Disrupted with Copper Sulfate Similarly, disruption experiments were conducted using C. vulgaris paste at 10 percent solids dosed with 0 (controls), 100, and 200 mg of copper sulfate as Cu per g of dry algae. The experimental procedure described in Chapter 2 was used. Samples were collected at 24 and 48 hours, and then lipid extraction was performed on them. The results as mg of lipid extracted per g of dry algae are presented in Figure 14. The data represents mean values from triplicates with one standard deviation above and below the mean.
Figure 14: Lipid extraction as a function of contact time and copper sulfate dose
Source: Biomass Engineering Laboratory, San Diego State University
The data revealed that lipid extraction increased with copper dose. For control samples, as expected, the lipid extraction yield remained constant around 155 mg of lipid per g of C. vulgaris after 24- and 48-hour contact times. For samples dosed with 100 mg of copper sulfate as Cu per g of dry C. vulgaris, lipid extraction yields of 185 and 193 mg per g of C. vulgaris
24
were achieved at 24- and 48-hour contact times, respectively. Lipid extraction yields of 200 and 205 mg per g of C. vulgaris were achieved at 24- and 48-hour contact times, respectively, for samples dosed with 200 mg of copper sulfate as Cu per g of dry C. vulgaris. The p-values, at an α of 0.05, for paired t-tests for lipid extraction yield achieved at 0 and 100 and 0 and 200 mg of Cu per g of dry algae were < 0.01, indicating that there were significant differences for the yields. On the other hand, the p-value for paired t-test for lipid extraction yield achieved at 100 and 200 mg of Cu per g of dry algae was > 0.3, indicating that there was no significant difference. Moreover, there was no significant difference in lipid yields for samples dosed with 0, 100, and 200 mg of copper sulfate as Cu per g of dry algae for paired t-tests at contact times of 24 and 48 hours; the p-values for the paired t-test were > 0.4.
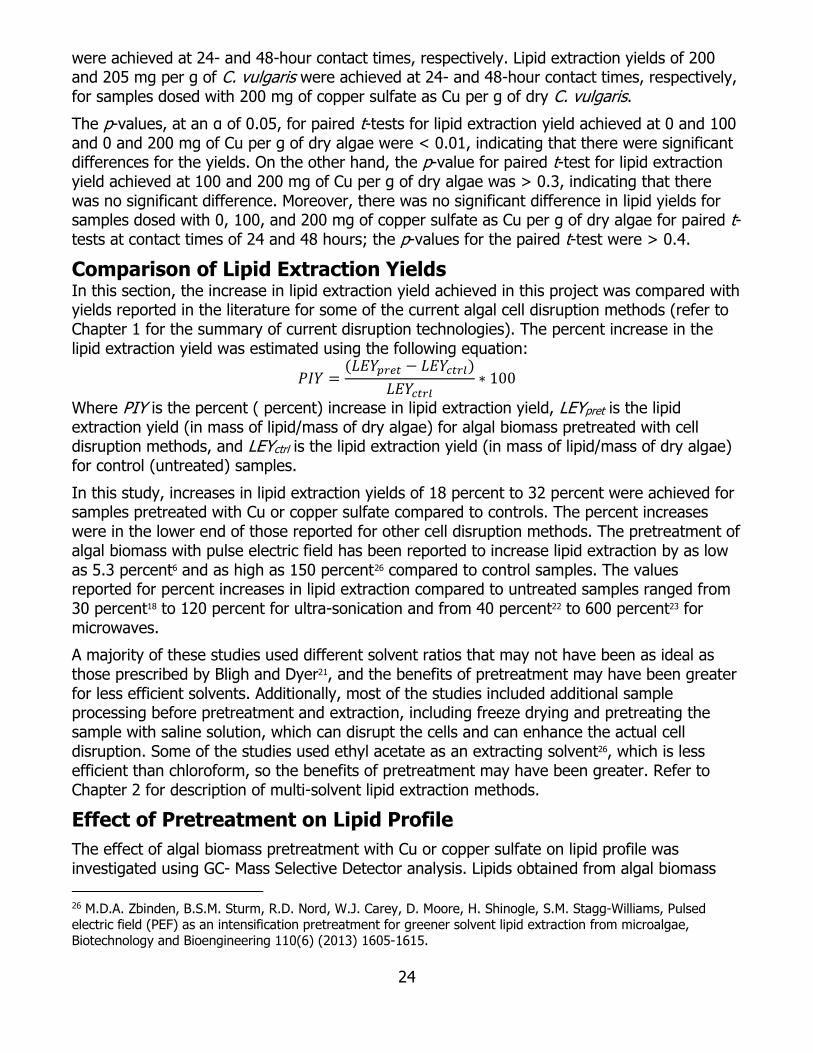
Comparison of Lipid Extraction Yields In this section, the increase in lipid extraction yield achieved in this project was compared with yields reported in the literature for some of the current algal cell disruption methods (refer to Chapter 1 for the summary of current disruption technologies). The percent increase in the lipid extraction yield was estimated using the following equation:
𝑃𝑃𝑃𝑃𝑃𝑃 =(𝐿𝐿𝐿𝐿𝑃𝑃𝑝𝑝𝑝𝑝𝑝𝑝𝑝𝑝 − 𝐿𝐿𝐿𝐿𝑃𝑃𝑐𝑐𝑝𝑝𝑝𝑝𝑐𝑐)
𝐿𝐿𝐿𝐿𝑃𝑃𝑐𝑐𝑝𝑝𝑝𝑝𝑐𝑐∗ 100
Where PIY is the percent ( percent) increase in lipid extraction yield, LEYpret is the lipid extraction yield (in mass of lipid/mass of dry algae) for algal biomass pretreated with cell disruption methods, and LEYctrl is the lipid extraction yield (in mass of lipid/mass of dry algae) for control (untreated) samples. In this study, increases in lipid extraction yields of 18 percent to 32 percent were achieved for samples pretreated with Cu or copper sulfate compared to controls. The percent increases were in the lower end of those reported for other cell disruption methods. The pretreatment of algal biomass with pulse electric field has been reported to increase lipid extraction by as low as 5.3 percent6 and as high as 150 percent26 compared to control samples. The values reported for percent increases in lipid extraction compared to untreated samples ranged from 30 percent18 to 120 percent for ultra-sonication and from 40 percent22 to 600 percent23 for microwaves. A majority of these studies used different solvent ratios that may not have been as ideal as those prescribed by Bligh and Dyer21, and the benefits of pretreatment may have been greater for less efficient solvents. Additionally, most of the studies included additional sample processing before pretreatment and extraction, including freeze drying and pretreating the sample with saline solution, which can disrupt the cells and can enhance the actual cell disruption. Some of the studies used ethyl acetate as an extracting solvent26, which is less efficient than chloroform, so the benefits of pretreatment may have been greater. Refer to Chapter 2 for description of multi-solvent lipid extraction methods.
Effect of Pretreatment on Lipid Profile The effect of algal biomass pretreatment with Cu or copper sulfate on lipid profile was investigated using GC- Mass Selective Detector analysis. Lipids obtained from algal biomass 26 M.D.A. Zbinden, B.S.M. Sturm, R.D. Nord, W.J. Carey, D. Moore, H. Shinogle, S.M. Stagg-Williams, Pulsed electric field (PEF) as an intensification pretreatment for greener solvent lipid extraction from microalgae, Biotechnology and Bioengineering 110(6) (2013) 1605-1615.
25
treated with Cu or copper sulfate and control samples (untreated) were transesterified, and then analyzed and compared. The same lipid extraction and lipid transesterification processes were used for the control and samples pretreated with Cu and copper sulfate. The transesterified lipid compounds identified using the National Institute of Standard and Technology and FAME libraries are presented in Table 3. Refer to Chapter 2 for details on the analytical procedures. The result showed that there were no major differences in the lipid profiles between controls and samples pretreated with copper sulfate after 24 or 48 hours of contact time. For Cu, few compounds were not detected at 24 hours contact time, but at 48-hours contact time, the lipid profiles of the control and Cu pretreated samples were similar. Therefore, it can be inferred that, pretreatment of algal biomass with Cu or copper sulfate has no influence on the lipid profiles, hence the biodiesel that would be produced from the resulting lipids.
Source: Biomass Engineering Laboratory, San Diego State University
Summary The results presented in this chapter showed the disruption of C. vulgaris cells with Cu and copper sulfate increased lipid extraction yields. For Cu, the lipid extraction yield was improved by as high as 32 percent with respect to control samples for 10 percent algae paste dosed
26
with 100 mg of Cu as Cu per g of dry algae and 24-hours of contact time. About 30 percent increase in lipid yield was achieved for copper sulfate at 200 mg of Cu per g of dry algae. The percent increases achieved in this project were in the lower end of those reported for other cell disruption methods. A majority of the studies reported in the literature used different solvent ratios that may not have been as ideal as those prescribed by Bligh and Dyer, and the benefits of pretreatment may have been greater for less efficient solvents. Additionally, most of the studies included additional sample processing before pretreatment and extraction, including freeze drying and pretreating the sample with saline solution, which can disrupt the cells and can enhance the actual cell disruption. Some of the studies used ethyl acetate as an extracting solvent, which is less efficient than chloroform, so the benefits of pretreatment may have been greater. The results from GC- Mass Selective Detector analysis of the transesterified lipid showed that there were no major differences in lipid profiles between controls and samples pretreated with Cu or copper sulfate. Therefore, it was inferred that pretreatment of algal biomass with Cu or copper sulfate has no influence on the lipid profiles, hence the biodiesel that would be produced from the resulting lipids.
27
CHAPTER 6: Project Benefits
Introduction In the previous chapters, the feasibility of using Cu and copper sulfate as algal cell disruption agents was investigated. The results revealed that Cu and copper sulfate were effective in disrupting C. vulgaris, the representative microalgae used in this project. In this chapter, the benefits of using Cu and copper sulfate as algal biomass disruption methods were evaluated. In evaluating the benefits, parameters, such as energy-efficiency, cost-effectiveness, and sustainability of the proposed methods compared with existing methods, were employed. First, the energy input and GHG emissions during the production of Cu and copper sulfate were estimated. Next, the specific energy requirement and GHG emission per mass of algal biomass disrupted by using Cu and copper sulfate were estimated, and the values were compared with values reported in the literature for existing algal biomass disruption methods. The cost-effectiveness of the proposed methods compared with existing algal cell disruption methods was evaluated on the basis of operating cost since the capital cost for the existing methods were not readily available. Finally, the benefits of adapting the technology in California were assessed. Algal Biofuel Supply Chain As stated in Chapter 2, currently two approaches are pursued in the algae-to-biofuel pathway: (1) algal lipid extraction and upgrading, and (2) whole algae hydrothermal liquefaction and upgrading. In the former pathway, microalgae cultivation, harvesting/ dewatering, disruption/ pretreatment, extraction, and conversion are the main steps involved. In this section, a high-level of algal biofuel production and supply chain for the lipid extraction and upgrading pathway is briefly discussed. Algal biofuel production system requires a number of inputs – land, water, carbon source, and energy, to mention a few of them. Figure 15 provides a simplified high-level overview of the key resources required in the algal biofuel supply chain. The cultivation step requires most of the inputs – land, water, CO2 as carbon source, nutrients, and energy. On the other hand, energy and water are the major input to the other process units – harvesting/ dewatering, disruption/ pretreatment, extraction, and conversion. Land is required as inputs to these units, but insignificant compared to the requirements for the cultivation steps. Moreover, the water usage rate for the cultivation step depends whether open pond or photo bioreactor (PBR) growth systems are employed, and this will be discussed in Chapter 6 in detail. It should also be noted that the resources presented in the Figure 15 are not exhaustive. Additional resource such as materials, capital, labor, and other inputs associated with the construction, operations, and maintenance of the facilities are needed.
28
Figure 15: A simplified high-level overview of the key resources required in the algal biofuel supply chain
Source: Biomass Engineering Laboratory, San Diego State University
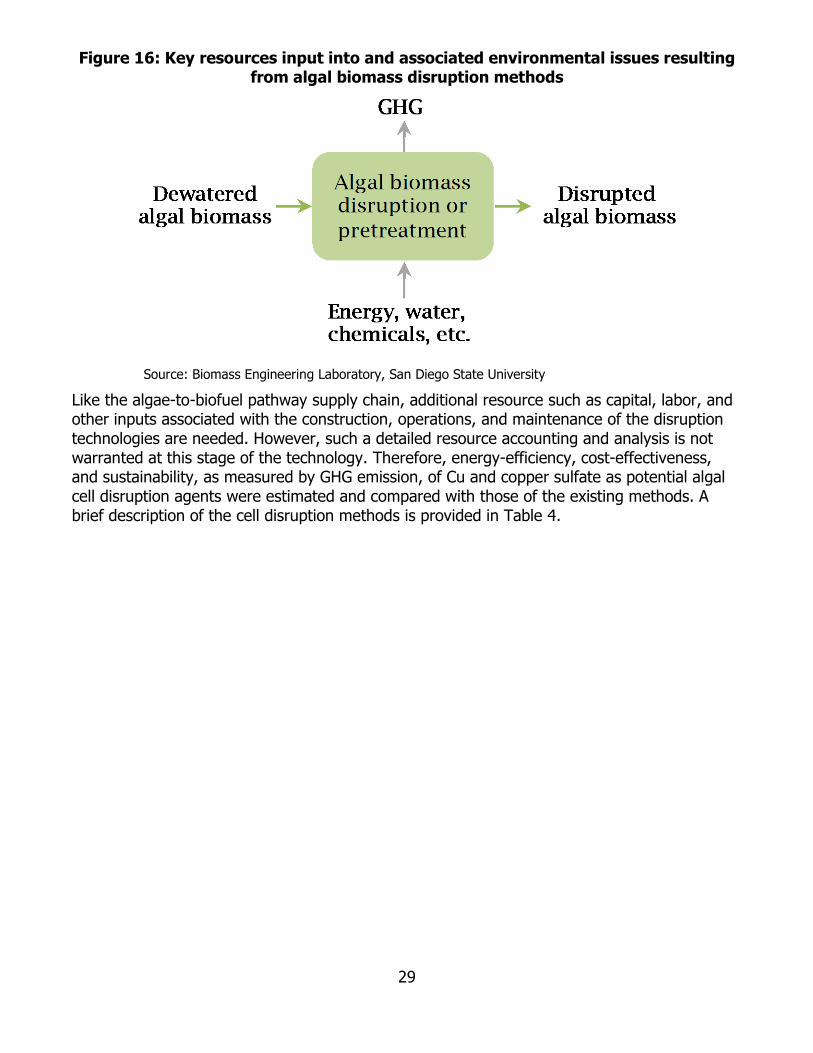
Baseline for Algal Biomass Disruption Technologies The focus of this project was to develop new methods for algal biomass disruption or pretreatment methods. As presented in Chapter 1, a variety of disruption methods are currently available for algal biomass disruption, including bead milling, high-pressure homogenization, high-speed homogenization, hydrodynamic cavitation, microwave, ultra-sonication, pulsed electric field, among other fields27. To compare the methods developed in this project with current methods, resources input into the unit and associated environmental issues are identified in Figure 16. Energy is the key resource required for all the disruption methods. In addition, the methods developed in this project require the addition of chemicals. The major output from all the methods associated with environmental issues is the emission of GHG.
27 Y. Chisti, M. Moo-Young, Disruption of microbial cells for intracellular products, Enzyme and Microbial Technology 8(4) (1986) 194-204; A.K. Lee, D.M. Lewis, P.J. Ashman, Disruption of microalgal cells for the extraction of lipids for biofuels: Processes and specific energy requirements, Biomass and Bioenergy 46 (2012) 89-101.; I. Agerkvist, S.-O. Enfors, Characterization of E. coli cell disintegrates from a bead mill and high pressure homogenizers, Biotechnology and Bioengineering 36(11) (1990) 1083-1089.; I. Agerkvist, S.-O. Enfors, Characterization of E. coli cell disintegrates from a bead mill and high pressure homogenizers, Biotechnology and Bioengineering 36(11) (1990) 1083-1089.; E. Günerken, E. D'Hondt, M.H.M. Eppink, L. Garcia-Gonzalez, K. Elst, R.H. Wijffels, Cell disruption for microalgae biorefineries, Biotechnology Advances 33(2) (2015) 243-260.; K.-Y. Show, D.-J. Lee, J.-H. Tay, T.-M. Lee, J.-S. Chang, Microalgal drying and cell disruption – Recent advances, Bioresource Technology 184 (2015) 258-266.; T. Garoma, T. Shackelford, Electroporation of Chlorella vulgaris to enhance biomethane production, Bioresource Technology 169 (2014) 778-783.
29
Figure 16: Key resources input into and associated environmental issues resulting from algal biomass disruption methods
Source: Biomass Engineering Laboratory, San Diego State University
Like the algae-to-biofuel pathway supply chain, additional resource such as capital, labor, and other inputs associated with the construction, operations, and maintenance of the disruption technologies are needed. However, such a detailed resource accounting and analysis is not warranted at this stage of the technology. Therefore, energy-efficiency, cost-effectiveness, and sustainability, as measured by GHG emission, of Cu and copper sulfate as potential algal cell disruption agents were estimated and compared with those of the existing methods. A brief description of the cell disruption methods is provided in Table 4.
30
Table 4: A brief description of the current cell disruption methods Cell
Disruption Methods
Process Description Mechanism
of Cell Disruption
Hydrodynamic cavitation
Works by subjecting cell suspensions to rapid changes of pressure that cause the formation of cavities in the liquid when the pressure is relatively low and then the voids implode at higher
pressure, generating intense shock wave which disrupts the cells. Cavitation and shear stress
High-speed homogenizer
Consists of a stator–rotor assembly when stirred at high speed, creating cavitation due to a local pressure drop nearly down to the vapor pressure of the liquid. Subsequently, as the liquid
moves away from the impeller, the liquid pressure restores proportional to the decrease in velocity and the distance from impeller tip and causes the collapse of the cavities. As the
cavities collapse, they generate intense shock wave which disrupts the cells.
Cavitation and shear stress
Sonication The process of applying high frequency acoustic waves that initiate a cavitation process and a propagating shock wave forms jet streams in the surrounding medium causing cell disruption
by high shear forces and free radicals. Cavitation and free radicals
Freeze drying Freeze drying is the process of removing water from materials through a low temperature
dehydration process which involves freezing the product, lowering pressure, then removing the ice by sublimation.
Thermal and osmotic shock
Microwave
A suspension is exposed to microwaves, the microwaves interact selectively with the dielectric or polar molecules (e.g., water) and cause local heating as a result of frictional forces from
inter- and intramolecular movements. Water exposed to microwaves reaches the boiling point fast resulting in expansion within the cell and an increase in the internal pressure. The local
heat and pressure combined with the microwave induced damage to the cell membrane/wall, facilitates the release of cell contents.
Temperature increase, molecular energy increase
Bead mills Employ very small glass, ceramic or steel beads placed in a vessel along with the sample
media. Disruption of the sample occurs as the beads collide rapidly with the cells, induced by vigorous agitation of the vessel. After the processing cycle is complete, the beads settle by
gravity and separated from homogeneous cell materials.
Mechanical compaction and shear
stress
31
Cell Disruption Methods
Process Description Mechanism
of Cell Disruption
High-pressure homogenizer
Work by forcing cell suspensions through a very narrow channel or orifice under pressure. Cell disruption is achieved through high-pressure impact of the accelerated fluid jet on the
stationary surface as well as hydrodynamic cavitation from the pressure drop induced shear stress.
Cavitation and shear stress
Pulsed electric field
Uses an external electric field to induce an electrical potential across the cell wall. Cell disruption is caused by electromechanical compression and electric field-induced tension
inducing pore formation in the wall.
Proliferation due to
electricity
Cu, copper sulfate (this
study)
The cell disruption agents are brought in contact with cells in suspension in a reactor or vessel by mixing. The agents disrupt the cells by interaction with the cell membrane components or
cell contents.
Chemical substrate interaction
Source: Biomass Engineering Laboratory, San Diego State University
32
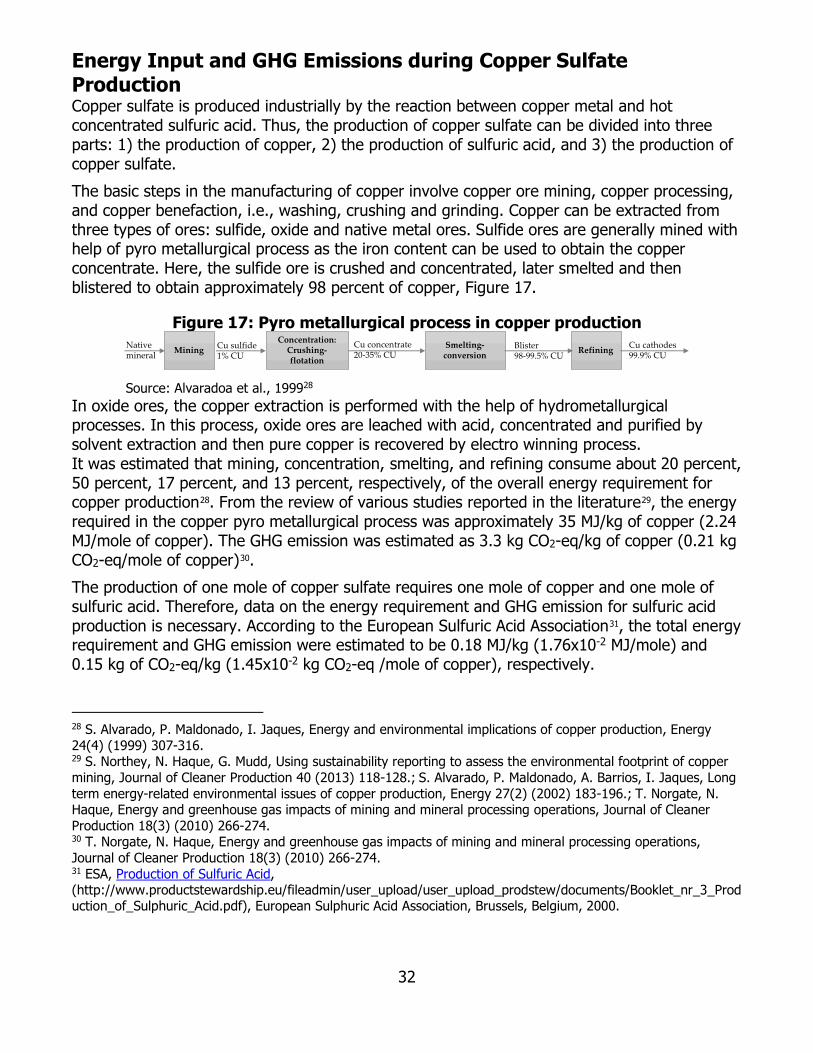
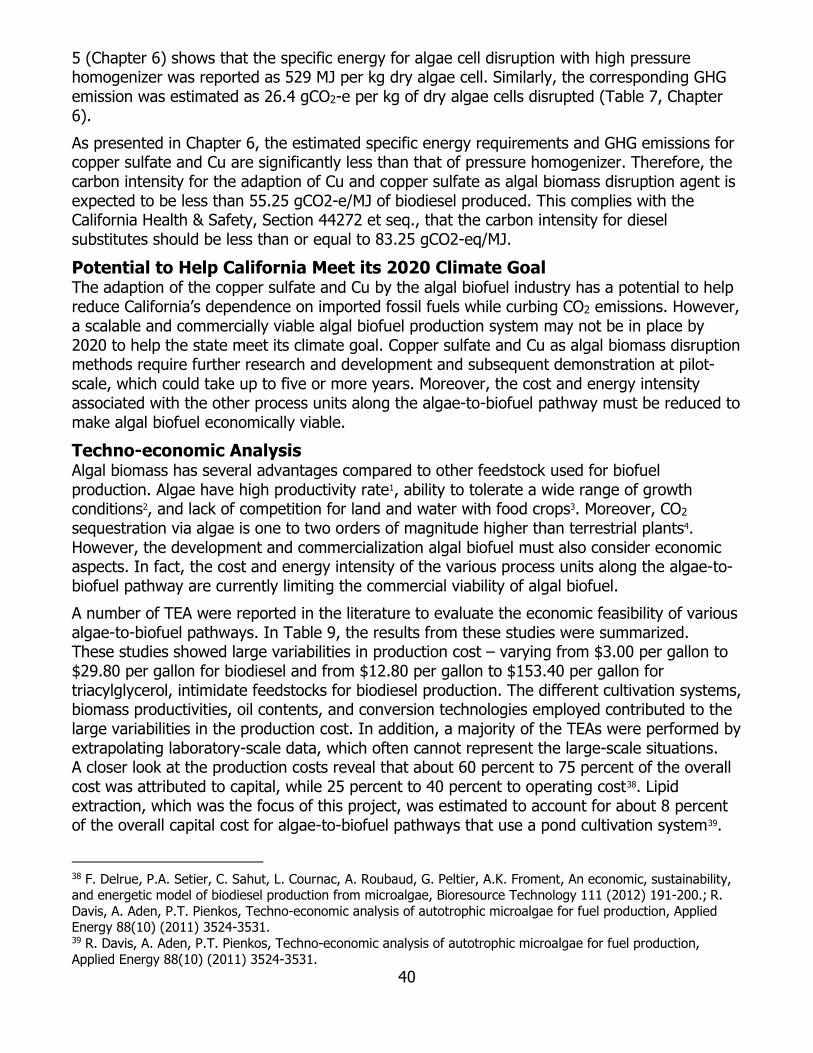
Energy Input and GHG Emissions during Copper Sulfate Production Copper sulfate is produced industrially by the reaction between copper metal and hot concentrated sulfuric acid. Thus, the production of copper sulfate can be divided into three parts: 1) the production of copper, 2) the production of sulfuric acid, and 3) the production of copper sulfate. The basic steps in the manufacturing of copper involve copper ore mining, copper processing, and copper benefaction, i.e., washing, crushing and grinding. Copper can be extracted from three types of ores: sulfide, oxide and native metal ores. Sulfide ores are generally mined with help of pyro metallurgical process as the iron content can be used to obtain the copper concentrate. Here, the sulfide ore is crushed and concentrated, later smelted and then blistered to obtain approximately 98 percent of copper, Figure 17.
Figure 17: Pyro metallurgical process in copper production
Source: Alvaradoa et al., 199928
In oxide ores, the copper extraction is performed with the help of hydrometallurgical processes. In this process, oxide ores are leached with acid, concentrated and purified by solvent extraction and then pure copper is recovered by electro winning process. It was estimated that mining, concentration, smelting, and refining consume about 20 percent, 50 percent, 17 percent, and 13 percent, respectively, of the overall energy requirement for copper production28. From the review of various studies reported in the literature29, the energy required in the copper pyro metallurgical process was approximately 35 MJ/kg of copper (2.24 MJ/mole of copper). The GHG emission was estimated as 3.3 kg CO2-eq/kg of copper (0.21 kg CO2-eq/mole of copper)30. The production of one mole of copper sulfate requires one mole of copper and one mole of sulfuric acid. Therefore, data on the energy requirement and GHG emission for sulfuric acid production is necessary. According to the European Sulfuric Acid Association31, the total energy requirement and GHG emission were estimated to be 0.18 MJ/kg (1.76x10⁻² MJ/mole) and 0.15 kg of CO2-eq/kg (1.45x10⁻² kg CO2-eq /mole of copper), respectively.
28 S. Alvarado, P. Maldonado, I. Jaques, Energy and environmental implications of copper production, Energy 24(4) (1999) 307-316. 29 S. Northey, N. Haque, G. Mudd, Using sustainability reporting to assess the environmental footprint of copper mining, Journal of Cleaner Production 40 (2013) 118-128.; S. Alvarado, P. Maldonado, A. Barrios, I. Jaques, Long term energy-related environmental issues of copper production, Energy 27(2) (2002) 183-196.; T. Norgate, N. Haque, Energy and greenhouse gas impacts of mining and mineral processing operations, Journal of Cleaner Production 18(3) (2010) 266-274. 30 T. Norgate, N. Haque, Energy and greenhouse gas impacts of mining and mineral processing operations, Journal of Cleaner Production 18(3) (2010) 266-274. 31 ESA, Production of Sulfuric Acid, (http://www.productstewardship.eu/fileadmin/user_upload/user_upload_prodstew/documents/Booklet_nr_3_Production_of_Sulphuric_Acid.pdf), European Sulphuric Acid Association, Brussels, Belgium, 2000.
Thus, the production of one mole of copper sulfate requires an input of 2.24 MJ/mole (for copper) plus 1.76x10⁻² MJ/mole (for sulfuric acid) = 2.2576 MJ/mole of copper sulfate. This is equivalent to 14.11 MJ/ kg of copper sulfate. This is value in agreement with the value reported as 15 MJ/kg of copper sulfate by Adom and Dunn, 201532. Similarly, the GHG emission per mole of copper sulfate was estimated as 0.21 kg CO2-eq/mole (for copper) plus 1.45x10⁻² CO2-eq /mole (for sulfuric acid) = 0.2259 kg CO2-eq/mole, which is equivalent to 1.41 kg CO2-eq/kg. Again, the value is in agreement with the value reported as 1.4 kg CO2-eq/kg of copper sulfate by Adom and Dunn, 201532.
Energy Input and GHG Emissions during Cu Production The production of Cu involves the complexation of copper ion (Cu2+) and ethanolamine (C2H7NO). On the other hand, the production of ethanolamine takes place by the reaction between ammonia (NH3) and ethylene oxide (C2H4O). Thus, the production of Cu can be divided into five parts: 1) the production of copper, 2) the production of ammonia, 3) the production of ethylene oxide, 4) the production of ethanolamine, and 5) the production of Cu. In the following subsections, the estimated energy input and CO2 emission during the production of these chemicals are presented. The Production of Copper In the previous subsection, the processes involved in the production of copper were described. Accordingly, the total energy requirement for copper production was estimated as 35 MJ/kg of copper (2.24 MJ/mole of copper) and the GHG emission was equivalent to 3.3 kg CO2-eq/kg of copper (0.21 kg CO2-eq/mole of copper). The Production of Ammonia Ammonia is synthesized from nitrogen (N2) and hydrogen (H2) by the following reaction: N2 + 3H2 → 2NH3 Nitrogen available in the atmospheric air is the best source of nitrogen while hydrogen can be produced from various feedstocks, although currently it is derived mostly from fossil fuels through either steam reforming or partial oxidation process, depending on the type of fossil fuel. However, about 80 percent of the ammonia production capacity worldwide is currently provided by the well-developed steam reforming process using natural gas as feedstock [45]. The total energy requirement for ammonia production was estimated as 15.38 MJ/kg of ammonia (0.26 MJ/mole of ammonia) and the GHG emission was equivalent to 2.52 kg CO2-eq/kg of ammonia (0.043 kg CO2-eq/mole of ammonia)33. The Production of Ethylene Oxide Ethylene oxide is industrially produced by oxidation of ethylene (C2H4) in the presence of silver catalyst. The total energy requirement for ethylene oxide production was estimated as 10
32 F. Adom, J.B. Dunn, Material and Energy Flows in the Production of Macro and Micronutrients, Buffers, and Chemicals used in Biochemical Processes for the Production of Fuels and Chemicals from Biomass, (https://greet.es.anl.gov/publication-fuel-chemicals-biomass), Argonne National Laboratory, Lemont, IL 2015. 33 DECHEMA/IEA/ICCA, Energy and GHG Reductions in the Chemical Industry via Catalytic Processes: ANNEXES. (https://www.iea.org/media/freepublications/technologyroadmaps/TechnologyRoadmapCatalyticProcessesAnnexes.pdf), Gesellschaft für Chemische Technik und Biotechnologie (DECHEMA), International Energy Agency (IEA), and International Council of Chemical Associations (ICCA), 2013.
MJ/kg (0.44 MJ/mole) and the GHG emission was equivalent to 1.16 kg CO2-eq/kg (0.051 kg CO2-eq/mole)33. The Production of Ethanolamine Ethanolamine is produced by reacting ethylene oxide with aqueous ammonia as follows: C2H4O + NH3 C2H7NO This reaction is exothermic, and thus requires no energy input. Therefore, the energy input and CO2 emission during the production of ethanolamine can be estimated using the energy consumed and CO2 emitted during the production of ethylene oxide and ammonia. Accordingly, the energy input was estimated as 0.7 MJ/mole of ethanolamine (11.48 MJ/kg of ethanolamine) and the CO2 emission was estimated as 0.094 kg CO2-eq/mole of ethanolamine (1.54 kg CO2-eq/kg of ethanolamine). The Production of Cu The energy consumption and CO2 emitted during the synthesis of Cu is not readily available. However, it can be estimated from the embodied energy of copper and ethanolamine since it is synthesized from the complexation these compounds. The synthesis of one more of Cu requires three moles of ethanolamine and one more of copper. Thus, the energy input during the production of Cu can be estimated as 4.34 MJ per mole Cu. The value was equivalent to 68.6 MJ per kg of Cu as Cu. Similarly, the CO2 emission during the production of Cu was estimated as 0.492 kg CO2-eq/mole Cu, which was equivalent to 7.74 kg CO2-eq/ kg of Cu as Cu.
Comparison of the Proposed and Existing Technologies
Cu and Copper Sulfate Dose In the previous chapters, the results from tasks that evaluated the feasibility of using Cu and copper sulfate as algal cell disruption agents were reported. The disruption of algae cells in suspension dosed with varying concentration of Cu and copper sulfate was investigated. In addition, the lipid extraction yield from algal paste dosed with varying concentration of Cu and copper sulfate was evaluated. For algal paste at 10 percent solids dosed with 50 and 100 mg of Cu as Cu per g of dray algae, lipid extraction yields of 190 and 210 mg/g of dry algae, respectively, were achieved at 24-hours contact time. These correspond to about 18 percent and 32 percent increases, respectively, with respect to control samples. For copper sulfate, lipid extraction yields of 190 and 200 mg/ g of dry algae were achieved for algal paste at 10 percent solids dosed with 100 and 200 mg of copper sulfate as Cu per g of dry algae, respectively, at 24-hours contact time. These correspond to about 21 percent and 30 percent increases, respectively, with respect to control samples. Cu dose of 100 mg as Cu per g of dry algae and copper sulfate dose of 200 mg as Cu per g of dry algae were used for the estimation of the energy-efficiency, cost-effectiveness, and sustainability of Cu and copper sulfate in the following subsections. Energy-efficiency In the previous subsection, it was estimated that about 68.6 MJ of energy was consumed during the production of one kg of Cu as Cu. In addition, 100 mg of Cu as Cu per g of dry algae was determined as optimal dose. Therefore, the embedded specific energy required for disruption of algae cell with Cu was estimated as 6.86 MJ/kg dry algae.
35
Similarly, it was estimated that about 14.11 MJ of energy was required during the production of one kg of copper sulfate, of which over 99 percent was consumed during the manufacturing copper. In addition, 200 mg of copper sulfate as Cu per g of dry algae was determined as optimal dose. Therefore, the embedded specific energy required for disruption of algae cell with copper sulfate was estimated as 2.82 MJ/kg dry algae. In Table 5, the specific energy requirement for Cu and copper sulfate, estimated in this study, and for other algal biomass disruption methods reported in the literature11 are presented (refer to Table 1 for detailed calculations, Chapter 1). The specific energy for Cu and copper sulfate were significantly less than the requirement for hydrodynamic cavitation, 33 MJ per kg of dry algae, which was the most efficient of the existing algae cells disruption methods. The specific energy requirements for the other methods were significantly higher than that of Cu and copper sulfate; for instance, pulsed electric field required over 300 times the requirement for copper sulfate. Moreover, the specefic energy presented in the table must be compared with the total energy avaibale in algal biomass. The total enenergy availbale by the combustion of the entire algal biomass was estimated to be about 29 MJ per kg of dry cells11. Except for copper sulfate and Cu, the energy requirement for the existing cell disruption methods is greater than the energy available in the biomass. It should be noted that the energy requirements presented in Table 5 don’t include energy inputs for the cultivation, harvesting/ dewatering, extraction, and conversion to biofuel. Therefore, it can be concluded that the existing cell disruption methods result in a negative net energy balance.
Table 5: Specific energy requirement for selected algal cell disruption methods Algal cells disruption methods Energy use (MJ/ kg dry mass)
Copper sulfate (this study) 2.82 Cu (this study) 6.86
Hydrodynamic cavitation 33.00 High speed homogenizer 67.50
Sonication 132.00 Freeze drying 140.00
Microwave 420.00 Bead mills 504.00
High pressure homogenizer 529.00 Pulsed electric field 860.00
Source: The specific energy requirements for Cu and copper sulfate were estimated per the discussion presented in Chapter 6 and refer to Table 1 in Chapter 1 for other cell disruption methods.
Cost-effectiveness on the Basis of Operating Costs Cu and copper sulfate are manufactured in mass and can be purchased at reasonable prices. For instance, 50 pounds (lb.) copper sulfate (25 percent copper) costs around $125.00 at local stores. Based on copper sulfate dose of 200 mg per g dry algae, 50 lb. of copper sulfate (12.5 lb. copper) could disrupt 28.4 kg of dry algae. The additional cost due to the use of copper sulfate was estimated at $4.40 per kg of dry algae.
36
Similarly, one gallon of Cu (0.909 lb. copper) costs around $36.00 at local stores. Based on Cu as Cu dose of 50 mg per g dry algae, one gallon of Cu (0.909 lb. copper) could disrupt 4.13 kg of dry algae. The additional cost due to the use of Cu was estimated at $8.73 per kg of dry algae. Comparing the cost-effectiveness of Cu and copper sulfate with other algal biomass disruption methods is not easy. The capital cost associated with the existing disruption methods is not readily available. Therefore, operating cost was used to compare the cost-effectiveness of the proposed algal cell disruption agents with the existing methods. For copper sulfate and Cu, the operating costs are comprised of energy use and the cost of the chemicals. The unit costs for copper sulfate and Cu were already estimated as $4.40 and $8.73 per kg of dry algae disrupted, respectively. The cost associated with energy was estimated using an average price of 12.64 cents per kilowatt-hour for electricity for industrial sector for California34 and the specific energy use per kg of dry algae disrupted. Accordingly, the cost associated with energy use for copper sulfate was $0.10 per kg of dry algae disrupted, while it was estimated as $0.24 per kg dry algae disrupted for Cu. The total operating cost for copper sulfate was estimated as $4.50 per kg of dry algae disrupted, while for Cu it was estimated as $9.00 per kg of dry algae disrupted. In Table 6, the operating costs for selected algal cell disruption methods are presented. For other disruption methods, only energy cost was considered as operating cost, and it was estimated using an average price of 12.64 cents per kilowatt-hour for electricity for industrial sector for California34 and the specific energy requirement presented in Table 5. It was determined that copper sulfate and Cu ranked at 30 and 60 percentiles, respectively, compared to existing algae cell disruption methods. On the basis of the operating cost presented in Table 6, hydrodynamic cavitation seemed to be cost-effective. However, the ranking may be changed when capital cost is taken into consideration.
Hydrodynamic cavitation 1.2 High speed homogenizer 2.4
Copper sulfate (this study) 4.5 Sonication 4.6
Freeze drying 4.9 Cu (this study) 9.0
Microwave 14.7 Bead mills 17.7
High pressure homogenizer 18.6 Pulsed electric field 30.2
34 IEA, Electric Power Monthly with Data for May 2018, (https://www.eia.gov/electricity/monthly/current_month/epm.pdf), International Energy Agency, 2018.
Source: The operating costs were estimated per the discussions presented in Chapter 6.
Global Warming Potential In this project, Global Warming Potential (GWP) will be used to assess the sustainability of the algal cell disruption methods. In the previous subsections, CO2 emission during the production of Cu was estimated as 7.74 kg CO2-eq/kg of Cu as Cu. Based on Cu as Cu dose of 100 mg per g dry algae, the GWP for Cu as algal cell disruption agent was estimated as 0.77 kg CO2-eq/kg of dry algae disrupted. Similarly, during copper sulfate production about 1.3 kg CO2-eq/kg of copper sulfate as Cu was released into the environment. Based on copper sulfate as Cu dose of 200 mg per g dry algae, the GWP for copper sulfate as algal cell disruption agent was estimated as 0.26 kg CO2-eq/kg of dry algae disrupted. In 2017, the California power mix included about 34 percent of natural gas, 29 percent renewables, 15 percent large hydropower, 9 percent nuclear, 4 percent coal, and 9 percent unspecified sources35. The lifecycle emissions for the mix was estimated as 50 g CO2-eq./MJ of electricity generated36. For hydrodynamic cavitation, the GWP was estimated as 1.6 kg CO2-eq./kg dry algae (Table 7); higher than that of copper sulfate and Cu. Similarly, the estimated GWPs for the other disruption methods were significantly higher than that of copper sulfate and Cu, Table 7.
Table 7: Global warming potential for selected algal cell disruption methods Algal cells disruption methods GW (kg CO2-eq./kg dry algae)
Copper sulfate (this study) 0.26 Cu (this study) 0.77
Hydrodynamic cavitation 1.6 High speed homogenizer 3.4
Sonication 6.6 Freeze drying 7.0
Microwave 21.0 Bead mills 25.2
High pressure homogenizer 26.4 Pulsed electric field 43.0
Source: The GWPs for the cell disruption methods were estimated per the discussions presented in Chapter 6.
35 IEA, Electric Power Monthly with Data for May 2018, (https://www.eia.gov/electricity/monthly/current_month/epm.pdf), International Energy Agency, 2018. 36 IPCC, Annex II: Metrics & Methodology. In: Climate Change: Mitigation of Climate Change. Contribution of Working Group III to the Fifth Assessment Report of the Intergovernmental Panel on Climate Change, (https://www.ipcc.ch/pdf/assessment-report/ar5/wg3/ipcc_wg3_ar5_annex-iii.pdf). , Intergovernmental Panel on Climate Change, Cambridge University Press, Cambridge, United Kingdom and New York, NY, USA: IPCC, 2014.
Benefits to California Benefits to California derived from this research and development project were assessed within the following context: • Provide a quantified estimate of the project’s GHG emissions and carbon intensity benefits.
o Potential to help California meet its 2020 climate goal. • Conduct TEA. • Provide an estimate of water usage, if any, if this technology is deployed in a pilot or scale-
up facility. • Provide a quantified estimate of the project’s benefits to the California biofuel industry.
o Potential reductions in capital costs. o Potential reductions in operation costs. o Potential reductions in costs of production of algal biofuels.
• Provide a quantified estimate of the project’s benefit to California. o Potential job creation, economic development, and increased state revenue. o Potential increase in water reuse, resource recovery from waste, and natural
resources preservation. Estimate of the Project’s GHG Emissions and Carbon Intensity Benefits As presented in Chapter 6, the GHG emissions resulting from the use of copper sulfate and Cu as algal biomass disruption agents is significantly less than the current methods. To quantify the benefit of adaption of these methods, a life-cycle analysis (LCA) for GHG emissions and energy use for algae-based biofuel performed by researchers at Argonne National Laboratory37 was employed. For the analysis, the researchers expanded the Greenhouse Gases, Regulated Emissions, and Energy Use in Transportation (GREET v1.6) model to include algae-based fuel production pathways. The study has included in the analysis energy recovery through biogas production from the residual biomass after lipid extraction, including fugitive methane (CH4) emissions during the production of biogas and nitrous oxide (N2O) emissions during the use of the solid residue from anaerobic digestion as agricultural fertilizer, Figure 18.
37 E.D. Frank, J. Han, P.-R. I, A. Elgowainy, M.Q. Wang, Life-Cycle Analysis of Algal Lipid Fuels with the GREET Model, (https://greet.es.anl.gov/publication-algal-lipid-fuels), Argonne National Laboratory, Chicago, Illinois, 2011.
Figure 18: Baseline algal lipids extraction process
Source: Frank et al. 201137.
The key processes used for the LCA are summarized in Table 8. The study used algae grown with CO2 from power plant flue gas. Despite the fossil origin of this CO2, the study treated it as atmospheric CO2 in the analysis because power plants will operate whether algae are grown or not, and its CO2 will be emitted into the air for the foreseeable future.
Table 8: Key processes in the Argonne’s LCA for algae to biofuels pathway Parameters Emission Scenario
Algae growth Open ponds mixed by paddle wheel. Water and nutrient inputs.Recovered CO2, nutrient, and water inputs.
Harvesting/ dewatering
Dewatering with progressive steps: Bio-flocculation, dissolved air flotation, and centrifugation.Bio-flocculation allows flocculation and settling of the algae without chemical inputs.
Extraction Algal biomass pretreatment with pressure homogenizers. Extraction with hexane is done on site proximal to the growth pond. Lipids are transported to regional centers for conversion to biofuel.
Fuel production Extracted lipid is converted to biodiesel by transesterification. Energy and
nutrient recovery from co-products
Anaerobic digestion of the co-products for biogas production. Biogas purification.Electricity generation with combined heat and power systems.Residual transported and used as soil amendment.
Source: Frank et al. 201137
For the scenario described above, the researchers estimated, using the expanded GREET Model, GHG emissions of 55.25 gCO2-e per MJ of biodiesel produced from algal lipids. In this analysis, pressure homogenizer was employed for disrupting algae cell, and the energy requirement for the homogenizer was estimated as 183 kWh per dry metric ton (0.66 MJ per dry kg) by the researchers. This value was adapted from bio solids disintegration data and may not necessarily be applicable to algae cells. In fact, the literature data presented in Table
40
5 (Chapter 6) shows that the specific energy for algae cell disruption with high pressure homogenizer was reported as 529 MJ per kg dry algae cell. Similarly, the corresponding GHG emission was estimated as 26.4 gCO2-e per kg of dry algae cells disrupted (Table 7, Chapter 6). As presented in Chapter 6, the estimated specific energy requirements and GHG emissions for copper sulfate and Cu are significantly less than that of pressure homogenizer. Therefore, the carbon intensity for the adaption of Cu and copper sulfate as algal biomass disruption agent is expected to be less than 55.25 gCO2-e/MJ of biodiesel produced. This complies with the California Health & Safety, Section 44272 et seq., that the carbon intensity for diesel substitutes should be less than or equal to 83.25 gCO2-eq/MJ. Potential to Help California Meet its 2020 Climate Goal The adaption of the copper sulfate and Cu by the algal biofuel industry has a potential to help reduce California’s dependence on imported fossil fuels while curbing CO2 emissions. However, a scalable and commercially viable algal biofuel production system may not be in place by 2020 to help the state meet its climate goal. Copper sulfate and Cu as algal biomass disruption methods require further research and development and subsequent demonstration at pilot-scale, which could take up to five or more years. Moreover, the cost and energy intensity associated with the other process units along the algae-to-biofuel pathway must be reduced to make algal biofuel economically viable. Techno-economic Analysis Algal biomass has several advantages compared to other feedstock used for biofuel production. Algae have high productivity rate1, ability to tolerate a wide range of growth conditions2, and lack of competition for land and water with food crops3. Moreover, CO2 sequestration via algae is one to two orders of magnitude higher than terrestrial plants4. However, the development and commercialization algal biofuel must also consider economic aspects. In fact, the cost and energy intensity of the various process units along the algae-to-biofuel pathway are currently limiting the commercial viability of algal biofuel. A number of TEA were reported in the literature to evaluate the economic feasibility of various algae-to-biofuel pathways. In Table 9, the results from these studies were summarized. These studies showed large variabilities in production cost – varying from $3.00 per gallon to $29.80 per gallon for biodiesel and from $12.80 per gallon to $153.40 per gallon for triacylglycerol, intimidate feedstocks for biodiesel production. The different cultivation systems, biomass productivities, oil contents, and conversion technologies employed contributed to the large variabilities in the production cost. In addition, a majority of the TEAs were performed by extrapolating laboratory-scale data, which often cannot represent the large-scale situations. A closer look at the production costs reveal that about 60 percent to 75 percent of the overall cost was attributed to capital, while 25 percent to 40 percent to operating cost38. Lipid extraction, which was the focus of this project, was estimated to account for about 8 percent of the overall capital cost for algae-to-biofuel pathways that use a pond cultivation system39.
38 F. Delrue, P.A. Setier, C. Sahut, L. Cournac, A. Roubaud, G. Peltier, A.K. Froment, An economic, sustainability, and energetic model of biodiesel production from microalgae, Bioresource Technology 111 (2012) 191-200.; R. Davis, A. Aden, P.T. Pienkos, Techno-economic analysis of autotrophic microalgae for fuel production, Applied Energy 88(10) (2011) 3524-3531. 39 R. Davis, A. Aden, P.T. Pienkos, Techno-economic analysis of autotrophic microalgae for fuel production, Applied Energy 88(10) (2011) 3524-3531.
41
Electricity accounted for 7.5 percent and 26 percent of the operating cost for a pond and PBR growth systems40, respectively. The high electricity consumption in PBR system was due to light-emitting diodes that serve as source light energy for the algae culture. In pond cultivation system, the algae culture uses solar energy. Based on the TEA reviewed, algal biofuel is not currently competitive with petroleum-based fuels due to high production costs.
40 L. Amer, B. Adhikari, J. Pellegrino, Technoeconomic analysis of five microalgae-to-biofuels processes of varying complexity, Bioresource Technology 102(20) (2011) 9350-9359.
42
Table 9: Techno-economic results from literature for the production of algal intermediate feedstock or biofuels
Product41 Cultivation System
Biomass Productivity
Oil Content ( percent)
Capacity (MM gal of product per
year)
Conversion/ Upgrading Technology
Production Costs
($/gal)42 Source
Triacylglycerol Open pond 22 g/m2/day 25 2.36 Solvent
extraction 15.7 Lundquist et al. 2010 43
Triacylglycerol PBR 1.25
kg/m3/day 25 10 Solvent extraction 25.5 Davis et al.
201139
Triacylglycerol Open Pond 25 g/m2/day 25 10 Solvent
extraction 12.0 Davis et al. 201139
Biodiesel PBR 1.25 kg/m3/day 25 9.3
Solvent extraction
followed by Hydro-treating
28.9 Davis et al. 201139
Biodiesel Open Pond 25 g/m2/day 25 9.3 Solvent
extraction followed by
Hydro-treating 13.8 Davis et al.
201139
41 TAG – Triacylglycerol’s and must be upgraded before use as fuel source. 42 All production costs have been updated to 2018 USD with the inflation rates. 43 T.J. Lundquist, I.C. Woertz, N. Quinn, J.R. Benemann, A realistic technology and engineering assessment of algae biofuel production, Energy Biosciences Institute (2010) 1.
43
Product41 Cultivation System
Biomass Productivity
Oil Content ( percent)
Capacity (MM gal of product per
year)
Conversion/ Upgrading Technology
Production Costs
($/gal)42 Source
Triacylglycerol Open pond 24 g/m2/day 50 1.9 Solvent
extraction 34.7 Amer et al. 201140
Biodiesel Open pond 24 g/m2/day 50 1.9 Direct
transesterification
19.0 Amer et al. 201140
Triacylglycerol PBR 0.9 kg/m2/day 50 92 Solvent
extraction 153.4 Amer et al. 201140
Biodiesel Open pond 25 g/m2/day 30 2.7 Solvent
extraction followed by
Hydro-treating 12.5 Delrue et al.
201238
Biodiesel PBR 1.3 kg/m3/d 30 140 Solvent
extraction followed by
Hydro-treating 20.8 Delrue et al.
201238
Biodiesel Open pond 30 g/m2/day 50 6.4
Solvent extraction
followed by transesterificati
on
3.0 Nagarajan et al. 201344
44 S. Nagarajan, S.K. Chou, S. Cao, C. Wu, Z. Zhou, An updated comprehensive techno-economic analysis of algae biodiesel, Bioresource Technology 145 (2013) 150-156.
44
Product41 Cultivation System
Biomass Productivity
Oil Content ( percent)
Capacity (MM gal of product per
year)
Conversion/ Upgrading Technology
Production Costs
($/gal)42 Source
Biodiesel Open pond 15 g/m2/day 25 5,000 Hydrothermal liquification 9.5 Davis et al.
201445
Source: Biomass Engineering Laboratory, San Diego State University
45 R.E. Davis, D.B. Fishman, E.D. Frank, M.C. Johnson, S.B. Jones, C.M. Kinchin, R.L. Skaggs, E.R. Venteris, M.S. Wigmosta, Integrated Evaluation of Cost, Emissions, and Resource Potential for Algal Biofuels at the National Scale, Environmental Science & Technology 48(10) (2014) 6035-6042.
45
Estimate of Water Usage if this Technology is Deployed in a Pilot or Scaled-Up Facility Water usage values reported in the literature for various algae-to-biofuel pathway are summarized in Table 10. There was a large variability in the water consumption intensity reported in the literature. The type of cultivation system employed, open pond vs. PBR, significantly affects water usage. Open pond systems are prone to water loss through evaporation, while PBR limit water evaporation loss. Some algae-to-biofuel pathways recycle water, reducing water consumption per unit volume of algal biofuel production. Finally, a majority of the water usage reported in the literature were extrapolated from laboratory-scale data, which often cannot represent the large-scale situations. Of the literature reviewed, only Delrue et al. 201238 provided the water consumption breakdown for the process units along the algae-to-biofuel pathways. Accordingly, for open pond system, about 61 percent of the water was consumed during the cultivation step and harvesting/dewatering, extraction, and conversion each accounted for 13 percent of the total water usage. For the algae-to-fuel pathway that used PBR system, harvesting/ dewatering, extraction, and conversion steps each communed for 27 percent of the total water usage, while the cultivation process accounted for 19 percent of the total water consumption.
Table 10: Water usage during algal biodiesel production
Cultivation System
Water Recycle Rate ( percent)
Water Usage (gal water / gal of biodiesel produced)
Source
PBR 80 1,700 Subhadra et al. 2010 [58] Open pond 0 3,400 Yang et al. 2011 [59] Open pond 100 540 Yang et al. 2011 [59] PBR 100 60 Harto et al. 2010 [60] Open pond 100 650 Harto et al. 2010 [60] Open pond 0 3,090 Delrue et al. 2012 [52] PBR 0 1,500 Delrue et al. 2012 [52]
Source: Biomass Engineering Laboratory, San Diego State University
These reviews showed that the water consumption intensity of algal biofuel was substantial. On average, the water intensities for pond and PBR systems without water recycle were 2,650 and 3,250 gal of water per gal of biofuel, respectively. However, the water usage could be significantly reduced by water recycling. For instance, Yang et al. 2011 reported about 84 percent reduction in water usage for a pond cultivation system with recycling. Moreover, the water consumption intensity for algal biofuel is considerably lower than the majority of feedstocks currently used or considered for biofuel production (Table 11). For examples, the water footprint for soybean biodiesel was estimated as 13,680 gallons per gallon of biodiesel produced.
46
Table 11: Water requirement for other type of biofuels Biofuel Type Feedstock Total Water Requirement (gallon of water/
The Project’s Benefits to the California Biofuel Industry As discussed in Chapter 6, algal biofuel is not currently competitive with petroleum-based fuels due to high production costs. The capital cost accounted to about 60 percent to 75 percent of the overall production cost, while 25 percent to 40 percent of the total cost was attributed to operating cost46. Electricity accounted for 7.5 percent and 26 percent of the operating cost for pond and PBR growth systems40, respectively. Lipid extraction, which was the focus of this project, was estimated to account for about 8 percent of the overall capital cost for algae-to-biofuel pathways that use a pond cultivation system39. As presented in Chapter 6, the energy requirement for Cu and copper sulfate were significantly less than the requirement for current algal biomass disruption methods. Moreover, it was estimated that operating costs for copper sulfate and Cu ranked at 30 and 60 percentiles, respectively, compared to existing algae cell disruption methods; refer to Chapter 6. With further research and development, the adaption of the cell disruption methods developed in this project could potentially reduce the operating cost and hence the overall cost of algal biofuel production. For this benefit to be realized, further research and development is also necessary for the other process units along the algae-to-biofuel pathway to make the overall cost of algal biomass production competitive with petroleum-based fuels.
46 F. Delrue, P.A. Setier, C. Sahut, L. Cournac, A. Roubaud, G. Peltier, A.K. Froment, An economic, sustainability, and energetic model of biodiesel production from microalgae, Bioresource Technology 111 (2012) 191-200.; R. Davis, A. Aden, P.T. Pienkos, Techno-economic analysis of autotrophic microalgae for fuel production, Applied Energy 88(10) (2011) 3524-3531.
47
Potential Job Creation, Economic Development, and Increased State Revenue Currently, there are 100 plus companies involved in the algal biofuel arena worldwide47, with 36 plus of them based in the US. Of the companies based in the US, 13 are located in California. Synthetic Genomics and Solazyme, based in California, are two of the top five leading algal biofuel companies globally48. With further research and development and subsequent pilot-scale testing, the technology developed in this project could be adapted by the algal biofuel companies based in California and elsewhere in the US. ABO49 estimated the potential for creation of 220,000 jobs in the algal biofuels sector by 2020 in the US. Considering the current state of the various technologies along the algae-to-biofuel pathway, the estimated job creation may not happen by 2020. However, with further research and development, the future job creation potential of the industry in California could be significant. As stated above, of the 36 algal biofuel companies based in the US, 13 (approximately 36 percent) are located in California. Using Algae Biomass Organization potential job creation data, it was estimated that about 72,000 jobs could be created in California in the future. The biofuel industry employs a wide range of workers in a variety of occupations. Scientists and engineers conduct research and development; construction workers build plants and update infrastructure; agricultural workers grow and harvest feedstocks; plant workers process feedstocks into fuel; and sales workers sell the biofuels. According the US Bureau of Labor Statistics50, the average annual wages for the most common occupations in the biofuel industry are presented in Table 12. Therefore, the proposed project could benefit the state by creating green jobs. Activities related to the construction and operation of the algal biofuel plants may enhance economic development, promote economic growth, and increase revenue for the state.
47 Z. Patton, States Test Algae as a Biofuel, (http://www.governing.com/topics/energy-env/states-test-algae-biofuel.html), GOVERNING 2010. 48 J. Jacquot, 5 Companies Making Fuel From Algae Now, (http://www.popularmechanics.com/science/energy/a4677/4333722/), 2009. 49 ABO, ABO Farm Bill Testimony, (http://www.algaebiomass.org/abo-farm-bill-testimony-may-18-2012/), 2012. (Accessed April 2, 2015 2015). 50 E. Richards, Careers in Biofuels, (http://www.bls.gov/green/biofuels/biofuels.pdf), U.S. Bureau of Labor Statistics, 2013.
Table 12: Wages for selected science and engineering occupations in biofuels
Selected Science and Engineering Occupations Median Annual Wages, May 2011
Agricultural engineers $74,630 Biochemists and biophysicists $63,530 Chemical engineers $96,870 Chemical technicians $49,920 Chemists $75,550 Civil engineers $96,370 Construction managers $101,970 Construction laborers $29,730 Electrical engineers $85,350 Environmental engineers $89,070 Industrial engineers $79,530 Mechanical engineers $88,320 Operating engineers and other construction equipment operators $33,440
Soil and plant scientists $58,940 Source: Adapted from Richards, 201350
Potential Increase in Water Reuse, Resource Recovery from Waste, and Natural Resources Preservation Cost and energy intensity are the two major obstacles that limited the commercialization of algal biofuel. Accordingly, further research and development is necessary for the process units along the algae-to-biofuel pathway. To address these challenges, it is recommended (see Chapter 7) that algal biofuel production could be integrated with waste treatment systems so that the resources contained in waste streams, such as effluents from waste water treatment plants, CO2 and thermal heat in flue gas streams, and waste salts from desalination plants, can be recovered and used as inputs to algal biofuel production systems. In addition, water, nutrient, and carbon can be recycled internally in the production of algal biofuel, Figure 19. Therefore, algal biofuel production has a potential to enhance natural resources preservation by increasing water reuse, carbon recycle, and nutrient and mineral recovery from various waste streams. This also helps in minimizing or eliminating waste release into the environment.
49
Figure 19: Resource recycling during algal biofuel production
Source: Biomass Engineering Laboratory, San Diego State University
Summary In this chapter, the benefits of using Cu and copper as algal biomass disruption methods were evaluated on the basis of energy input, GHG emission, and operating cost. For agents, the estimated specific energy requirements were 5 to 300 times lower than the requirements for the existing algae cell disruption methods, and the GHG emissions were 8 to 600 times lower than those for existing methods. On the basis of operating cost, it was determined that copper sulfate and Cu ranked at 30 and 60 percentiles, respectively, compared to existing algae cell disruption methods. Algal biofuel has an estimated GHG emissions of 55.25 gCO2-e per MJ of biodiesel produced, which is significantly below the California Health & Safety, Section 44272 et seq., requirement of 83.25 gCO2-eq/MJ or less for diesel substitutes. The adaption of Cu and copper sulfate as algal biomass disruption methods could further reduce the GHG emissions during algal biofuel production. Algal biofuel has a potential to help the California limit its GHG emissions in the future. However, a scalable and commercially viable algal biofuel production system may not be in place by 2020 to help the state meet its climate goal. Algal biofuel is not currently competitive with petroleum-based fuels, mainly due to cost and energy intensity. Review of TEA studies showed that cost of production varied from $3.00 per gallon to $29.80 per gallon for biodiesel and from $12.80 per gallon to $153.40 per gallon for triacylglycerol, intimidate feedstock for biodiesel production. The large variability in the cost production was attributed to different cultivation systems, biomass productivities, oil contents, and conversion technologies employed in each study reviewed. In addition, a majority of the TEAs were performed by extrapolating laboratory-scale data, which often cannot represent the large-scale situations. About 60 percent to 75 percent of the overall cost was attributed to capital, while 25 percent to 40 percent to operating cost. Lipid extraction was estimated to account for about 8 percent of the overall capital cost for algae-to-biofuel pathways that use a pond cultivation system. Electricity accounted for 7.5 percent and 26 percent of the operating cost for a pond and PBR growth systems, respectively.
50
The water consumption intensity of algal biofuel was substantial. On average, the water intensities for pond and PBR systems without water recycle were 2,650 and 3,250 gallons of water per gallon of biofuel, respectively. However, the water usage could be significantly reduced by water recycling. For instance, about 84 percent reduction in water usage for a pond cultivation system with recycling has been reported in the literature. Moreover, the water consumption intensity for algal biofuel is lower than the majority of feedstocks currently used or considered for biofuel production. Algal biofuel is not currently competitive with petroleum-based fuels, mainly due to cost and energy intensity. It was determined that the energy requirement for Cu and copper sulfate were significantly less than the requirement for current algal biomass disruption methods. Moreover, it was estimated that operating costs for copper sulfate and Cu ranked at 30 and 60 percentiles, respectively, compared to existing algae cell disruption methods. With further research and development, the adaption of the cell disruption methods developed in this project could potentially reduce the operating cost and, hence, the overall cost of algal biofuel production. For this benefit to be realized, further research and development is also necessary for the other process units along the algae-to-biofuel pathway to make the overall cost of algal biomass production competitive with petroleum-based fuels. Algae Biomass Organization estimated the potential for creation of 220,000 jobs in the algal biofuels sector by 2020 in the US. Considering the current state of the various technologies along the algae-to-biofuel pathway, the estimated job creation may not happen by 2020. However, with further research and development, the future job creation potential of the industry in California could be significant. Currently, there are 100 plus companies involved in the algal biofuel arena worldwide, with 36 plus of them based in the US. Of the companies based in the US, 13 (approximately 36 percent) are located in California. Using Algae Biomass Organization potential job creation data, it was estimated that about 72,000 jobs could be created in California in the future. Therefore, the proposed project could benefit the state by creating green jobs. Moreover, activities related to the construction and operation of the algal biofuel plants may enhance economic development, promote economic growth, and increase revenue for the state. Cost and energy intensity are the two major obstacles that limited the commercialization of algal biofuel. Accordingly, further research and development is necessary for the process units along the algae-to-biofuel pathway to make the overall cost of algal biomass production competitive compared to petroleum-based fuels. It is recommended (see Chapter 7) that algal biofuel production could be integrated with waste treatment systems so that the resources contained in waste streams, such as effluents from waste water treatment plants, CO2 and thermal heat in flue gas streams, and waste salts from desalination plants, can be recovered and used as inputs to algal biofuel production systems. Therefore, algal biofuel production has a potential to enhance natural resources preservation by increasing water reuse, carbon recycle, and nutrient and mineral recovery from various waste streams. This also helps in minimizing or eliminating waste release into the environment.
51
CHAPTER 7: Conclusions and Recommendations
Conclusions The project showed that Cu and copper sulfate were effective in disrupting algae cells. Cellometer and SEM analyses of the samples confirmed that the algae cells were ruptured after treatment with the agents. The rupturing effect has increased lipid extraction yield by 32 percent with respect to control samples for 10 percent paste dosed with 100 mg of Cu as Cu per g of dry C. vulgaris and 24-hours of contact time. About 30 percent increase in lipid yield was achieved for copper sulfate at 200 mg of Cu per g of dry algae. On the basis of the mass of copper dosed, it was also observed that copper sulfate was less effective compared to Cu. It was also observed that a contact time of 24-hour was needed to achieve significant increase in lipid yield, and this may limit the adaption of Cu and copper sulfate as algal cell disruption methods. This is because longer contact times require large reactor volumes, which may in turn increase the cost of the technology. A GHG emissions potential of 55.25 gCO2-e per MJ was estimated for biodiesel produced from algal lipids. With further research and development, the adaption of Cu and copper sulfate as algal biomass disruption method has a potential to reduce the GHG emissions further below the California Health & Safety, Section 44272 et seq., requirement of 83.25 gCO2-eq/MJ or less for diesel substitute. The water consumption intensity of algal biofuel was substantial. On average, the water intensities for pond and PBR systems without water recycle were 2,650 and 3,250 gallon of water per gallon of biofuel, respectively. The water usage could be significantly reduced by water recycling. About 84 percent reduction in water usage has been reported for a pond cultivation system with recycling. Moreover, the water consumption intensity for algal biofuel is considerably lower than the majority of feedstocks currently used or considered for biofuel production. Biofuel production from algal biomass has a potential to enhance natural resources preservation by increasing water reuse, carbon recycle, and nutrient and mineral recovery from various waste streams. This also helps in minimizing or eliminating waste release into the environment. Despite these advantages, algal biofuel is not currently competitive with petroleum-based fuels, mainly related cost and energy intensity. The cost of production varied from $3.00 per gallon to $29.80 per gallon for biodiesel and from $12.80 per gallon to $153.40 per gallon for triacylglycerol, intimidate feedstock for biodiesel production. About 60 percent to 75 percent of the overall cost was attributed to capital costs, while 25 percent to 40 percent to operating costs. Electricity accounted for 7.5 percent and 26 percent of the operating cost for a pond and PBR growth systems, respectively. While the project results point out that algal biofuel production is not competitive with fossil technology, it also appears that algal solutions for the transportation sector requires significant investments, technological development, and time. It is not clear that the private sector is willing to make the requisite investments needed or that the public sector has the capacity to invest in this technology for the long term in reducing technological costs. Equally evident is
52
the absence of when the public may see commercial algal products in the transportation sector. Recommendations Future research and development efforts must be focused on reducing the contact time between the disruption agents and algae cell. This may be achieved by using copper nanoparticles, where the surface area to volume ratio is very large. The larger surface area will increase the reactivity of copper with algae cell, thereby reducing the contact time. It is also recommended that the technology must be pilot-tested to identify and address challenges that may arise during upscaling. The data that will be gathered from pilot-scale test would be used to establish the process and operational parameters for the technology, paving the way for eventual commercialization. Moreover, further research and development is necessary for the other process units along the algae-to-biofuel pathway to make the overall cost of algal biomass production competitive compared to petroleum-based fuels. Cost and energy intensity are the two major obstacles that must be overcame. To address this, it is recommended that algal biofuel production could be integrated with waste treatment systems so that the resources contained in waste streams can be recovered and used as inputs to the algal biofuel system. Effluents from waste water treatment plants could serve as source of water, nutrient supplement, and carbon source. Flue gas streams from power plants and other industries provide CO2 and thermal energy, in the form of low-grade heat. Finally, waste salts from desalination plants can be used as mineral sources for algae culture cultivation. Besides the availability and characteristics of these resources, their geo-location with respect to the siting of the integrated system is critical. Therefore, performing comprehensive analyses of the resources, the siting of the integrated system, and the logistics in the transportation of some of the resources is warranted. Finally, TEA of the integrated system is vital to determine the economic feasibility of algal biofuel production with the integrated system.
53
GLOSSARY CARBON DIOXIDE (CO2)—A colorless, odorless, nonpoisonous gas that is a normal part of the air. Carbon dioxide is exhaled by humans and animals and is absorbed by green growing things and by the sea. CO2 is the greenhouse gas whose concentration is being most affected directly by human activities. CO2 also serves as the reference to compare all other greenhouse gases (see carbon dioxide equivalent). COPPER (Cu) —a metallic chemical element that is easily formed into sheets and wires and is one of the best known conductors of heat and electricity51 FATTY ACID METHYL ESTER (FAME)—a type of fatty acid ester that are derived by transesterification of fats with methanol. The molecules in biodiesel are primarily FAMEs, usually obtained from vegetable oils by transesterification52 GAS CHROMATOGRAPH (GC)—A chemical analysis instrument for separating chemicals in a complex sample. It uses a flow-through narrow tube known as the column, through which different chemical constituents of a sample pass in a gas stream at different rates depending on their various chemical and physical properties.53 GIGAJOULE —The gigajoule (GJ) is equal to one billion (109) joules. 6 GJ is about the chemical energy of combusting 1 barrel (159 l) of crude oil. 2 GJ is about the Planck energy unit. GLOBAL WARMING POTENTIAL (GWP)—a measure of how much heat a greenhouse gas traps in the atmosphere up to a specific time horizon, relative to carbon dioxide. It compares the amount of heat trapped by a certain mass of the gas in question to the amount of heat trapped by a similar mass of carbon dioxide and is expressed as a factor of carbon dioxide (whose GWP is standardized to 1).54 GREENHOUSE GAS (GHG)—Any gas that absorbs infrared radiation in the atmosphere. Greenhouse gases include water vapor, carbon dioxide (CO2), methane (CH4), nitrous oxide (NOx), halogenated fluorocarbons (HCFCs), ozone (O3), perfluorinated carbons (PFCs), and hydrofluorocarbons (HFCs). JOULE (J) — unit of work or energy in the International System of Units (SI); it is equal to the work done by a force of one newton acting through one metre.55 KILOVOLT (KV)— one thousand volts LIFECYCLE ANALYSIS (LCA)—a way of figuring out the overall impact that a particular human product has on the environment in its entire existence.56 MEGAJOULE (MJ)—A joule is a unit of work or energy equal to the amount of work done when the point of application of force of one newton is displaced one meter in the direction of the force. It takes 1,055 joules to equal a British thermal unit. It takes about one million joules to make a pot of coffee. A megajoule itself totals one million joules. NANOMETRE (NM)—one billionth of a meter PHOTOBIOREACTOR (PBR)—a bioreactor that utilizes a light source to cultivate phototrophic microorganisms. These organisms use photosynthesis to generate biomass from light and carbon dioxide and include plants, mosses, macroalgae, microalgae, cyanobacteria and purple bacteria 51 Merriam-Webster (https://www.merriam-webster.com/dictionary/copper) 52 Wikipedia (https://en.wikipedia.org/wiki/Fatty_acid_methyl_ester) 53 Wikipedia (https://en.wikipedia.org/wiki/Gas_chromatography) 54 Wikipedia (https://en.wikipedia.org/wiki/Global_warming_potential) 55 Wikipedia (https://www.britannica.com/science/joule) 56 Study website (https://study.com/academy/lesson/life-cycle-analysis-definition-example.html)
PROPIDIUM IODIDE (PI)— an organic iodide salt containing a propidium.57 SCANNING ELECTRON MICROSCOPE (SEM)—Type of electron microscope designed for directly studying the surfaces of solid objects that utilizes a beam of focused electrons of relatively low energy as an electron probe that is scanned in a regular manner over the specimen. The action of the electron beam stimulates emission of high-energy backscattered electrons and low-energy secondary electrons from the surface of the specimen.58 TECHNO-ECONOMIC ANALYSES (TEA)—provides us with a quantitative and qualitative understanding of the impact that technology and research breakthroughs have on the financial viability of the biomass conversion strategy.59 VAN WATERS & ROGERS (VWR)— a global chemical and ingredients distributor and provider of value-added services who works with leading suppliers worldwide60
57 National Library of Medicine (https://pubchem.ncbi.nlm.nih.gov/compound/Propidium-iodide) 58 Encyclopedia Britannica (https://www.britannica.com/technology/scanning-electron-microscope) 59 Advanced Biofuels and Bioproducts process development unit (http://abpdu.lbl.gov/capabilities/techno-economic-analysis/) 60 Wikipedia (https://en.wikipedia.org/wiki/Univar_Solutions)
[1] ARB, Assembly Bill 32 Overview, 2014. (http://www.arb.ca.gov/cc/ab32/ab32.htm). (Accessed May 26 2018). [2] CA, Executive Order S-3-05, (http://gov.ca.gov/news.php?id=1861), 2005. [3] EIA, Annual Energy Review 2011, (http://www.eia.gov/totalenergy/data/annual/pdf/aer.pdf), U.S. Energy Information Administration, Washington, DC, 2012. [4] CA, Assembly Bill No. 118, Chapter 750, (http://www.leginfo.ca.gov/pub/11-12/bill/asm/ab_0101-0150/ab_118_bill_20110630_chaptered.pdf), State of California, 2007. [5] T.M. Mata, A.A. Martins, N.S. Caetano, Microalgae for biodiesel production and other applications: A review, Renewable and Sustainable Energy Reviews 14(1) (2010) 217-232. [6] M.A. Borowitzka, Species and Strain Selection, in: M.A. Borowitzka, N.R. Moheimani (Eds.), Algae for Biofuels and Energy, Springer Netherlands, Dordrecht, Netherlands, 2012, pp. 77-89. [7] A. Singh, P.S. Nigam, J.D. Murphy, Renewable fuels from algae: An answer to debatable land based fuels, Bioresource Technology 102(1) (2011) 10-16. [8] B. Wang, Y. Li, N. Wu, C. Lan, CO2 bio-mitigation using microalgae, Applied Microbiology and Biotechnology 79(5) (2008) 707-718. [9] U.S. DOE, National Algal Biofuels Technology Roadmap, U.S. Department of Energy, Office of Energy Efficiency and Renewable Energy, Biomass Program, College Park, Maryland, 2010. [10] T. Garoma, D. Janda, Investigation of the effects of microalgal cell concentration and electroporation, microwave and ultrasonication on lipid extraction efficiency, Renewable Energy 86 (2016) 117-123. [11] V. Mishra, A. Dubey, S.K. Prajapti, Algal Biomass Pretreatment for Improved Biofuel Production, in: S.K. Gupta, A. Malik, F. Bux (Eds.), Algal Biofuels: Recent Advances and Future Prospects, Springer International Publishing, Cham, 2017, pp. 259-280. [12] A.P.J. Middelberg, Process-scale disruption of microorganisms, Biotechnology advances 13(3) (1995) 491-551. [13] D.E. Hughes, J.W.T. Wimpenny, D. Lloyd, Chapter I The Disintegration of Micro-organisms, in: J.R. Norris, D.W. Ribbons (Eds.), Methods in Microbiology, Academic Press1971, pp. 1-54. [14] Y. Chisti, M. Moo-Young, Disruption of microbial cells for intracellular products, Enzyme and Microbial Technology 8(4) (1986) 194-204. [15] J. Geciova, Methods for disruption of microbial cells for potential use in the dairy industry-a review, International Dairy Journal 12 (2002) 13. [16] A.K. Lee, D.M. Lewis, P.J. Ashman, Disruption of microalgal cells for the extraction of lipids for biofuels: Processes and specific energy requirements, Biomass and Bioenergy 46 (2012) 89-101. [17] A. Gonçalves, J.M. Pires, M. Simões, Green fuel production: processes applied to microalgae, Environ Chem Lett 11(4) (2013) 315-324. [18] S.T.L. Harrison, 2.44 - Cell Disruption, in: M. Moo-Young (Ed.), Comprehensive Biotechnology (Second Edition), Academic Press, Burlington, 2011, pp. 619-640.
[19] A.K. Lee, D.M. Lewis, P.J. Ashman, Force and energy requirement for microalgal cell disruption: An atomic force microscope evaluation, Bioresource Technology 128 (2013) 199-206. [20] P. Mercer, R.E. Armenta, Developments in oil extraction from microalgae, European Journal of Lipid Science and Technology 113(5) (2011) 539-547. [21] A.M.P. Neto, R.A. Sotana de Souza, A.D. Leon-Nino, J.D.a.A. da Costa, R.S. Tiburcio, T.A. Nunes, T.C. Sellare de Mello, F.T. Kanemoto, F.M.P. Saldanha-Correa, S.M.F. Gianesella, Improvement in microalgae lipid extraction using a sonication-assisted method, Renewable Energy 55(0) (2013) 525-531. [22] J.-Y. Lee, C. Yoo, S.-Y. Jun, C.-Y. Ahn, H.-M. Oh, Comparison of several methods for effective lipid extraction from microalgae, Bioresource Technology 101(1, Supplement) (2010) S75-S77. [23] H. Zheng, J. Yin, Z. Gao, H. Huang, X. Ji, C. Dou, Disruption of Chlorella vulgaris Cells for the Release of Biodiesel-Producing Lipids: A Comparison of Grinding, Ultrasonication, Bead Milling, Enzymatic Lysis, and Microwaves, Applied Biochemistry and Biotechnology 164(7) (2011) 1215-1224. [24] P. Prabakaran, A.D. Ravindran, A comparative study on effective cell disruption methods for lipid extraction from microalgae, Letters in Applied Microbiology 53(2) (2011) 150-154. [25] C.-G. Lee, D.-H. Kang, D.-B. Lee, H.-Y. Lee, Pretreatment for Simultaneous Production of Total Lipids and Fermentable Sugars from Marine Alga, Chlorella sp, Applied Biochemistry and Biotechnology 171(5) (2013) 1143-1158. [26] A.P. Florentino de Souza Silva, M.C. Costa, A. Colzi Lopes, E. Fares Abdala Neto, R. Carrha Leitao, C.R. Mota, A. Bezerra dos Santos, Comparison of pretreatment methods for total lipids extraction from mixed microalgae, Renewable Energy 63(0) (2014) 762-766. [27] U.D. Keris-Sen, U. Sen, G. Soydemir, M.D. Gurol, An investigation of ultrasound effect on microalgal cell integrity and lipid extraction efficiency, Bioresource Technology 152(0) (2013) 407-413. [28] E.G. Bligh, W.J. Dyer, A rapid method of total lipid extraction and purification, Canadian Journal of Biochemistry and Physiology 37(8) (1959) 911-917. [29] Y.-A. Ma, Y.-M. Cheng, J.-W. Huang, J.-F. Jen, Y.-S. Huang, C.-C. Yu, Effects of ultrasonic and microwave pretreatments on lipid extraction of microalgae, Bioprocess and Biosystems Engineering 37(8) (2014) 1543-1549. [30] P. Biller, C. Friedman, A.B. Ross, Hydrothermal microwave processing of microalgae as a pre-treatment and extraction technique for bio-fuels and bio-products, Bioresource Technology 136(0) (2013) 188-195. [31] A.R. Fajardo, L.E. Cerdán, A.R. Medina, F.G.A. Fernández, P.A.G. Moreno, E.M. Grima, Lipid extraction from the microalga Phaeodactylum tricornutum, European Journal of Lipid Science and Technology 109(2) (2007) 120-126. [32] K. Lee, M.L. Eisterhold, F. Rindi, S. Palanisami, P.K. Nam, Isolation and screening of microalgae from natural habitats in the midwestern United States of America for biomass and biodiesel sources, Journal of Natural Science, Biology, and Medicine 5(2) (2014) 333-339. [33] M.D.A. Zbinden, B.S.M. Sturm, R.D. Nord, W.J. Carey, D. Moore, H. Shinogle, S.M. Stagg-Williams, Pulsed electric field (PEF) as an intensification pretreatment for greener solvent lipid extraction from microalgae, Biotechnology and Bioengineering 110(6) (2013) 1605-1615.
A-3
[34] I. Agerkvist, S.-O. Enfors, Characterization of E. coli cell disintegrates from a bead mill and high pressure homogenizers, Biotechnology and Bioengineering 36(11) (1990) 1083-1089. [35] A.P.J. Middelberg, Process-scale disruption of microorganisms, Biotechnology Advances 13(3) (1995) 491-551. [36] E. Günerken, E. D'Hondt, M.H.M. Eppink, L. Garcia-Gonzalez, K. Elst, R.H. Wijffels, Cell disruption for microalgae biorefineries, Biotechnology Advances 33(2) (2015) 243-260. [37] K.-Y. Show, D.-J. Lee, J.-H. Tay, T.-M. Lee, J.-S. Chang, Microalgal drying and cell disruption – Recent advances, Bioresource Technology 184 (2015) 258-266. [38] T. Garoma, T. Shackelford, Electroporation of Chlorella vulgaris to enhance biomethane production, Bioresource Technology 169 (2014) 778-783. [39] S. Alvarado, P. Maldonado, I. Jaques, Energy and environmental implications of copper production, Energy 24(4) (1999) 307-316. [40] S. Northey, N. Haque, G. Mudd, Using sustainability reporting to assess the environmental footprint of copper mining, Journal of Cleaner Production 40 (2013) 118-128. [41] S. Alvarado, P. Maldonado, A. Barrios, I. Jaques, Long term energy-related environmental issues of copper production, Energy 27(2) (2002) 183-196. [42] T. Norgate, N. Haque, Energy and greenhouse gas impacts of mining and mineral processing operations, Journal of Cleaner Production 18(3) (2010) 266-274. [43] ESA, Production of Sulfuric Acid, (http://www.productstewardship.eu/fileadmin/user_upload/user_upload_prodstew/documents/Booklet_nr_3_Production_of_Sulphuric_Acid.pdf), European Sulphuric Acid Association, Brussels, Belgium, 2000. [44] F. Adom, J.B. Dunn, Material and Energy Flows in the Production of Macro and Micronutrients, Buffers, and Chemicals used in Biochemical Processes for the Production of Fuels and Chemicals from Biomass, (https://greet.es.anl.gov/publication-fuel-chemicals-biomass), Argonne National Laboratory, Lemont, IL 2015. [45] EU, Integrated Pollution Prevention and Control, Reference Document on Best Available Techniques for the Manufacture of Large Volume Inorganic Chemicals - Ammonia, Acids and Fertilisers. (http://eippcb.jrc.ec.europa.eu/reference/BREF/lvic_aaf.pdf), European Commission, 2007. [46] DECHEMA/IEA/ICCA, Energy and GHG Reductions in the Chemical Industry via Catalytic Processes: ANNEXES. (https://www.iea.org/media/freepublications/technologyroadmaps/TechnologyRoadmapCatalyticProcessesAnnexes.pdf), Gesellschaft für Chemische Technik und Biotechnologie (DECHEMA), International Energy Agency (IEA), and International Council of Chemical Associations (ICCA), 2013. [47] IEA, Electric Power Monthly with Data for May 2018, (https://www.eia.gov/electricity/monthly/current_month/epm.pdf), International Energy Agency, 2018. [48] CEC, Total System Electric Generation, (http://www.energy.ca.gov/almanac/electricity_data/total_system_power.html), California Energy Commission, 2018. [49] IPCC, Annex II: Metrics & Methodology. In: Climate Change: Mitigation of Climate Change. Contribution of Working Group III to the Fifth Assessment Report of the Intergovernmental Panel on Climate Change, (https://www.ipcc.ch/pdf/assessment-report/ar5/wg3/ipcc_wg3_ar5_annex-iii.pdf). , Intergovernmental Panel on Climate Change, Cambridge University Press, Cambridge, United Kingdom and New York, NY, USA: IPCC, 2014.
[50] L. Lardon, A. Hélias, B. Sialve, J.-P. Steyer, O. Bernard, Life-Cycle Assessment of Biodiesel Production from Microalgae, Environmental Science & Technology 43(17) (2009) 6475-6481. [51] E.D. Frank, J. Han, P.-R. I, A. Elgowainy, M.Q. Wang, Life-Cycle Analysis of Algal Lipid Fuels with the GREET Model, (https://greet.es.anl.gov/publication-algal-lipid-fuels), Argonne National Laboratory, Chicago, Illinois, 2011. [52] F. Delrue, P.A. Setier, C. Sahut, L. Cournac, A. Roubaud, G. Peltier, A.K. Froment, An economic, sustainability, and energetic model of biodiesel production from microalgae, Bioresource Technology 111 (2012) 191-200. [53] R. Davis, A. Aden, P.T. Pienkos, Techno-economic analysis of autotrophic microalgae for fuel production, Applied Energy 88(10) (2011) 3524-3531. [54] L. Amer, B. Adhikari, J. Pellegrino, Technoeconomic analysis of five microalgae-to-biofuels processes of varying complexity, Bioresource Technology 102(20) (2011) 9350-9359. [55] T.J. Lundquist, I.C. Woertz, N. Quinn, J.R. Benemann, A realistic technology and engineering assessment of algae biofuel production, Energy Biosciences Institute (2010) 1. [56] S. Nagarajan, S.K. Chou, S. Cao, C. Wu, Z. Zhou, An updated comprehensive techno-economic analysis of algae biodiesel, Bioresource Technology 145 (2013) 150-156. [57] R.E. Davis, D.B. Fishman, E.D. Frank, M.C. Johnson, S.B. Jones, C.M. Kinchin, R.L. Skaggs, E.R. Venteris, M.S. Wigmosta, Integrated Evaluation of Cost, Emissions, and Resource Potential for Algal Biofuels at the National Scale, Environmental Science & Technology 48(10) (2014) 6035-6042. [58] B.G. Subhadra, M. Edwards, Coproduct market analysis and water footprint of simulated commercial algal biorefineries, Applied Energy 88(10) (2011) 3515-3523. [59] J. Yang, M. Xu, X. Zhang, Q. Hu, M. Sommerfeld, Y. Chen, Life-cycle analysis on biodiesel production from microalgae: Water footprint and nutrients balance, Bioresource Technology 102(1) (2011) 159-165. [60] C. Harto, R. Meyers, E. Williams, Life cycle water use of low-carbon transport fuels, Energy Policy 38(9) (2010) 4933-4944. [61] W. Gerbens-Leenes, A.Y. Hoekstra, T.H. van der Meer, The water footprint of bioenergy, Proceedings of the National Academy of Sciences 106(25) (2009) 10219-10223. [62] Z. Patton, States Test Algae as a Biofuel, (http://www.governing.com/topics/energy-env/states-test-algae-biofuel.html), GOVERNING 2010. [63] J. Jacquot, 5 Companies Making Fuel From Algae Now, (http://www.popularmechanics.com/science/energy/a4677/4333722/, http://www.popularmechanics.com/), 2009. [64] ABO, ABO Farm Bill Testimony, (http://www.algaebiomass.org/abo-farm-bill-testimony-may-18-2012/), 2012. (Accessed April 2, 2015 2015). [65] E. Richards, Careers in Biofuels, (http://www.bls.gov/green/biofuels/biofuels.pdf), U.S. Bureau of Labor Statistics, 2013.