41
Energy Extraction from Horse Manure Biogas plant vs. Heating Plant A Case Study in Wången By: Amitis Moazedian May 28, 2013 Department of Engineering and Sustainable Development
Energy Extraction from Horse Manure
Biogas plant vs. Heating Plant
A Case Study in Wången
By: Amitis Moazedian
May 28, 2013
Department of Engineering and Sustainable Development
i
Acknowledgment
This thesis work would not have been possible without the guidance and the help of several
individuals who in one way or another contributed and extended their valuable assistance in
the preparation and completion of this study.
First and foremost, my utmost gratitude to Lena van den Brink for her unfailing support as my
thesis adviser.
Morgan Fröling, Department of Engineering and Sustainable Development for his patience
and steadfast encouragement to complete this study.
The staff of the Wången trotting school, especially Conny Erlandsson for being
accommodating to our queries; Mikael Jansson, SWEBO research & Development
Manager and Adam Ricketts Swab Energy Sales Executive, who despite the distance
painstakingly e-mailed the information I needed; James Bonet at Jordbruksverket because of
his guidance regarding biogas production, Zarrin Badr for her moral support and allocating
quite some time proofreading the final version of this thesis, and last but not least my beloved
parents for all their love and support.

ii
Table of Contents
Acknowledgment ........................................................................................................................ i
List of Tables ............................................................................................................................. iv
List of Figures ........................................................................................................................... iv
Abstract ...................................................................................................................................... v
List of words and Abbreviations ............................................................................................... vi
1 Introduction ......................................................................................................................... 1
Scope and boundaries ............................................................................................................. 1
Purpose ................................................................................................................................... 2
Goal ........................................................................................................................................ 2
2 Methods ............................................................................................................................... 3
3 About Wången .................................................................................................................... 3
Wången and environment ....................................................................................................... 4
Wången’s map ........................................................................................................................ 4
Energy consumption and costs ............................................................................................... 5
4 Horse manure ...................................................................................................................... 6
Wången’s horse manure problem ........................................................................................... 6
5 Possible solutions for producing usable energy from horse manure .................................. 7
6 Results ................................................................................................................................. 7
Incineration ............................................................................................................................. 7
6.1.1 Legislation ............................................................................................................ 7
6.1.2 Problems regarding the choice of an incineration plant ....................................... 8
6.1.3 Selection of an incineration plant for Wången ..................................................... 8
6.1.4 System description ............................................................................................... 9
6.1.5 Fuel options for SWEBO Biotherm ................................................................... 10
6.1.6 Heating plant and the environment .................................................................... 11
6.1.7 Energy usage ...................................................................................................... 11
6.1.8 Calculated heat production ................................................................................. 12
6.1.9 Economy ............................................................................................................. 12
Anaerobic digestion .............................................................................................................. 13
6.1.10 Anaerobic digestion-Microbiology .................................................................... 16
6.1.11 Legislation .......................................................................................................... 17
6.1.12 Problems regarding the choice of an anaerobic digester .................................... 17

iii
6.1.13 Selection of anaerobic digestion plant for Wången ........................................... 17
6.1.14 System description ............................................................................................. 18
6.1.15 Horse manure as raw material in AD ................................................................. 18
6.1.16 Calculated gas production .................................................................................. 19
6.1.17 Calculated heat and power production ............................................................... 20
6.1.18 Anaerobic digestion and the environment .......................................................... 20
6.1.19 Digestate usage ................................................................................................... 22
6.1.20 Economy ............................................................................................................. 22
7 Discussion ......................................................................................................................... 23
Heat and electricity generation comparison ......................................................................... 23
Environment ......................................................................................................................... 25
Byproducts ............................................................................................................................ 26
Manure load as substrate ...................................................................................................... 26
Economy ............................................................................................................................... 26
8 Conclusion ........................................................................................................................ 27
9 Suggestion to Wången School .......................................................................................... 27
10 Reference .......................................................................................................................... 29
11 Appendices ........................................................................................................................... I
Appendix 0: Heating value of some common fuels ................................................................ I
Appendix 1: Wången energy consumption from 2006 ............................................................ I
Appendix 2: Energy consumption in Wången in 2009 ............................................................ I
Appendix 3: Share of electricity usage for heat and other purposes than heating................. II
Appendix 4: Emission during operation of a heating plant ................................................... II
Appendix 5: Emission during operation of a CHP plant ....................................................... II
Appendix 6: Acidification potential ...................................................................................... II
Appendix 7: Energy gain ...................................................................................................... III
Appendix 8: Energy consumption from June until August .................................................. III

iv
List of Tables
Table (1).Calculated heat gain and need in Wången ................................................................ 12 Table (2). A summary of investment and operational costs for heating plant ......................... 13 Table (3). Mesophilic, Thermophilic and Psycrophilic AD ..................................................... 15
Table (4). Gas yield .................................................................................................................. 19 Table (5). Calculated CHP gain heat and electricity of burning biogas in each month ........... 20 Table(6). Capital and operating cost for biogas plant .............................................................. 23 Table (7). A Comparison between heat and electricity generated in two systems in 9 months23 Table (8). Energy meeting of two compared plants in % ......................................................... 25
Table (9). Economic comparison heating plant vs. anaerobic digester ................................... 27 Table (10). Calculated saved manure and pellet need ............................................................. 28
List of Figures
Figure (1). Wången on the map ................................................................................................. 3 Figure (2). Wången's map .......................................................................................................... 4
Figure (4). Wången energy consumption from 2006 ................................................................. 5 Figure (3). Wången photovoltaic cells installed on student housing ......................................... 5 Figure(5). Energy consumption in Wången in 2009 ................................................................. 6
Figure (6). Swebo Biotherm Gen 3 equipped with EKS system ................................................ 9
Figure(7). A schematic view of the heating plant .................................................................... 10 Figure( 9). Acidification Potential ........................................................................................... 11 Figure( 8). A view of a SWEBO Biotherm ............................................................................. 10
Figure (10). Classification of different substrates by TS content ............................................ 14
Figure (11). The Anaerobic digestion process ........................................................................ 15 Figure (12). Anaerobic digester technical details .................................................................... 18 Figure (13). Biogas CHP plant acidification potential in gSO2 eqv / year ............................... 21 Figure( 14). Summary of energy production in a CHP plant and Wången energy demand .... 24 Figure (15). Summary of energy production in a heating plant and Wången energy demand 24
Figure (16). Acidification potential in g SO2 eqv/ year ........................................................... 25

v
Abstract
Wången is a trotting school located in Alsen region in Mid Sweden. Currently they keep
almost 105 horses in their premises, which produce 2 400 m3 of stall waste per year. Stall
waste has always been a concern for those who keep animals, and though composting has
been a viable solution to this problem for quite some time, it is no longer the only solution.
Stall waste can be converted to energy and there are different techniques and approaches to do
so.
In this study the writer compares the viability of two possible techniques (Biogas and heating
plant) by collecting data from two existing biogas and heating plant providers for Wången
trotting school. The results show that with almost same amount of investment on the reactors,
a heating plant can meet 85% of Wången heating demand while Biogas plant could only meet
10 % of Wången’s heating consumption.
On the other hand, as a result of nitrogen bound compound existence in horse manure,
burning stall waste in the heating plant showed a more acidifying potential compared to the
biogas plant.
vi
List of words and Abbreviations
Manure: animal feces and urine
Bedding material: material which absorb the liquid portion of manure
Wood shaving: a fibrous material used as bedding
Stall waste: a mixture of manure and bedding material
AD: Anaerobic Digestion (in the absence of oxygen)
Digestate: the solid residues of AD
Biogas: gas composed of CO2 –CH4 resulted from AD
CHP: Combined Heat and Power plant
Ash: combustion byproduct
SRT: The Solids Retention Time is the average time the activated-sludge solids are in the
system. The SRT is an important design and operating parameter for the activated-sludge
process and is usually expressed in days (Asano, 2007, p 591).
TS: Total Solid
VS: Volatile Solid
Energy density: the amount of energy stored in a unit of volume
Nm3: normal cubic meter used in the industry for gas emission and exchange
WID: Waste Incineration Directive
1
1 Introduction
Today’s increasing need for energy has resulted in using non-renewable fossil fuel in a high
pace. Burning fossil fuels has brought about many environmental problems such as global
warming. During the burning process, Carbon, stored in the fossil fuels for millions of years,
finds its way out to the atmosphere in the form of carbon dioxide. Carbon dioxide is a
powerful greenhouse gas, which causes a warming effect by capturing the converted heat
from the reflected UV-radiation from the earth surface.
Energy crisis in 1979 along with an increasing desire to have a better environment caused
industrial countries like European states to try to find other alternatives for fossil fuels.
During these years with heavy invention in the search for alternative energy sources, Sweden
has been in the front line between all those countries (Swedish Institute, 2011). According to
Swedish institute, 45 percent of Sweden’s energy supply, such as electricity, district heating
and fuel, comes from renewable energy, and Sweden has aimed to increase its share of
renewable energy to 50 percent by 2020 (2011).
This determination to find renewable sources of energy is even noticeable between companies
and small entities in Sweden. Conducting environmental activities is now a natural part of
many companies and organizations in Sweden, so is for Wången trotting school.
This quotation in Wången environmental handbook is noteworthy:
“Wången will work for a reduced impact on global warming by working towards reducing
energy consumption and greenhouse gas emissions. “(van den Brink, 2012a)
In accordance with their environmental policy, Wången trotting school is moving toward
reduction in waste, emissions and energy consumption (van den Brink, 2012b).
To achieve an economically and environmentally sustainable energy system, Wången is
looking for alternative ways to provide their energy needs. In this study, the writer will
investigate the potential of having a heating plant vs. a biogas plant as an alternative energy
source for Wången trotting school.
Scope and boundaries
The scope of this work comprises an investigation on Wången’s current energy situation and
conditions, which are necessary to establish a heating and an anaerobic digestion plant plus a
partial study of requirements to implement and manage such establishments.
Calculations in this thesis study for evaluating the best possible option1 for biogas and heating
plant installation relies heavily on the facts and figures gathered by Lena van den Brink for
Wången AB, also on the ones collected from contact and interviews with responsible bodies
in Wången AB, and from people, who have relative knowledge about alternative energy
sources.
Only a mixture of horse manure and wood shaving as bedding material have been studied as
substrate.
1 From environmental, economic perspective and energy provision perspective (described in section bellow)
2
In this thesis work, the writer will investigate the feasibility of constructing a biogas plant vs.
a heating plant for Wången ´s manure problem from environmental and economic points of
view.
Environmental point of view
Environmental issues investigated in this study:
Global warming potential resulting from greenhouse gas emission during reactors
operation time2
Acidification potential caused by emissions to the air during the boilers’ operation
time2
Economic point of view
Microeconomic is the subject of the analysis in this study for economic issues, and related
subjects to be discussed are:
Initial investment
Operating costs
Pay-back period
In this section, it is assumed that the company provides itself with the total initial capital. No
possibility for getting incentives or loan has been studied here
Energy provisioning
In this section, the amount of energy, which both reactors can create for Wången, will be
discussed and compared.
At the end a quick comparison will be made based on:
The reactors byproduct from quantity, applicability and characteristics
Horse manure as a substrate for both systems
Purpose
The aim of this study is to discover alternative sources of energy for Wången trotting school
to pursue the best total solution from a sustainability and economic perspective.
Goal
The goal of this study is investigating Wångens conditions for establishing a heating furnace
for heating purposes vs. a biogas plant for biogas production from horse manure.
2 Both boilers need to work 24 hours 7 days per week, and stall waste is available for nine months of the year;
therefore, all calculations are made accordingly.
Emissions from the heating plant are collected from Swebo Bioenergy pilot boiler, located at Swebo
Bioenergy’s premises in Boden with a nominal load of 250 kW(”Emissions do not change drastically as the
power of the heating plant increases” stated M. Jansson from SWEBO on an email on 1st May 2013).

3
Assessing these conditions, result in finding corresponding factors that are crucial for the
implementation and a successful establishment of either a heating or a biogas plant.
Contribution of those two boilers (during operation time) to global warming, acidification and
the amount of produced energy will be compared and in the end the amount of capital needed
to establish for each one of the boilers, operation costs and the possibility of being energy
self-sufficient will be discussed.
The work done through this thesis together with gathering and providing more information
would help Wången AB to make a decision to solve their manure problem in a more efficient
way.
2 Methods
Based on the study of literature reports, the requirements for implementing a successful
establishment of both a biogas and a heating plant using horse dung have been investigated.
To provide data for essential calculations, two existing reactor generators have been contacted
BioEnergy, a heating plant generator, and SWaB Energy, anaerobic digester producer. These
selections have been based on the size of the stall waste in Wången trotting school, and the
companies’ experience to deal with horse manure as a substrate alone.
After adopting the collected emission data for Wången’s case study (based on the manure
quantity), the data have been processed with GWP 100 years (kg CO2 e/kg) and acidification
(g SO2 e/g) characterization indicators (Baumann and Tillman, 2004). Then the result is
compared to reach a conclusion.
Economic data, such as initial capital; operation costs; etc. has been provided by reactor
generators for the right reactor size in case of Wången stall waste. These values are then
compared and discussed during the following chapters.
3 About Wången
Wången is a national educational trotting
center in Sweden. It is one of the three
national equestrian sports centers, whose
main task is to educate professional
equestrians in the field of modern horse
industry, specializing in horses for sport
and leisure.
Wången is located in the picturesque
Alsen3 region between Åre and Östersund
(50 kilometers from Östersund). Horses
have been important to this region for over
100 years.
Wången offers education and research
3 Alsen is located in Mid Sweden, where average lowest temperature reportedly is “-9.6
oC”, in January
(Weather statistics for Åre, Jämtland (Sweden), n.d)..
Figure (1). Wången on the map (Wången, n.d)

4
opportunities along with conference facilities and an inn with varied accommodations. .
Formerly a stud-farm, Wången is now the national center for Swedish harness racing, and it
offers a wide variety of educational courses in harness racing and Icelandic horse riding.
These activities are held in close co-operation with the sports’ respective organizations
(Wången, n.d).
Wången and environment
Wången trotting school is concerned about environmental problems. Their environmental
work is characterized by continuous improvement of environmental performance which is
achieved by:
Environmental and cyclical thinking
Providing employees and students training and information; creating conditions so that
everyone can perform applying a better management concerning the environment
Reducing waste, emissions and energy consumption by educating all the people
involved, such as employees, students, trainees, guests, suppliers and other
stakeholders, in order to minimize wasting natural resources. (van den Brink, 2012b)
Wången’s map
Figure bellow shows different areas of the Wången trotting school.
Figure (2). Wången's map (van den Brink)
1. School building /
practice hall
2. Assembly hall
3. Stable A, B, C
4. Smithy
5. Stable D
6. Stable E
7. Wangr(Hotel)
8. Förvaltaren(Hotel)
9. Wärdshus
10. Annex
11. Cottages
12. Student housing
13. Workshop
14. Slop track for training
horses
15. Oval shaped track for
training horses
16. Trotting track
17. Track for training
islandic horses
18. Plan for horse riding
19. Stable F
20. Stable G
21. Automatic horse walk
trainer

5
Energy consumption and costs
Today, Wången is equipped with geothermal heat pumps and photovoltaic panels, which
provide the school with warm water
and heat. Almost 60% 4of warm
water and space heating comes from
geothermal during winter. The solar
panels only supply one stable and the
pupils’ homes with warm water for
60% during summer time. The rest
of the warm water during summer
for the entire Wången comes from
geothermal heating (L. Van den
Brink, personal communication, 20
May 2013)).
Figure (4) illustrates Wången energy consumption since 2006. Except for 20105, the rate of
energy usage remains the same. Therefore, energy consumption of the year 2009 is used as a
sample for the calculations. See Appendix 1.
Figure (4). Wången energy consumption from 2006 (van den Brink, 2013a)
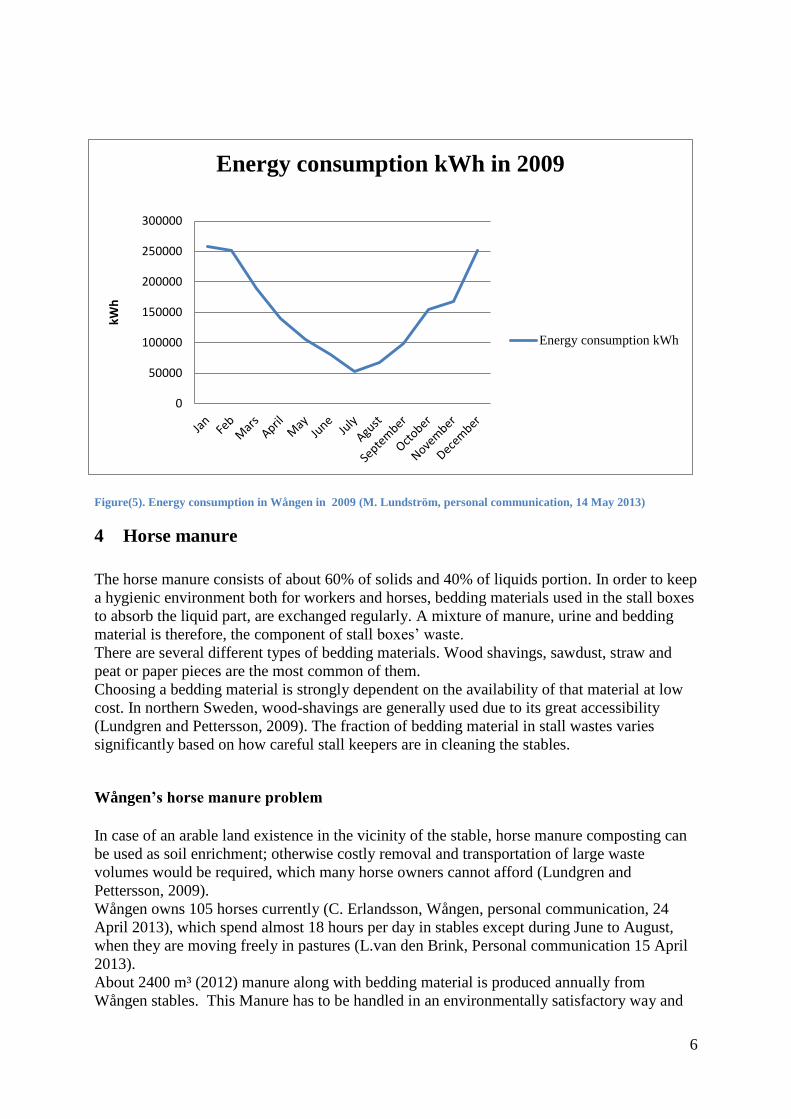
Figure (5) shows Wången energy consumption in 2009. Based on the chart, the lowest energy
consumption happens in July and the highest in January, and the big share of energy
consumption for heating in winter is noticeable. See Appendix2.
Wången spent about 1 752 000 SEK in 2009 to purchase electricity. This high figure
pinpoints the importance of finding other alternative energy sources for Wången School to
help decreasing its energy costs.
4 The exact amount of the energy, which is provided through geothermal is not available.
5 Wången experienced a cold winter in 2010.
0
500000
1000000
1500000
2000000
2500000
200
6
200
7
200
8
200
9
201
0
201
1
201
2
Year
Energy consumption kWh
Energy consumption kWh
Figure (3). Wången photovoltaic cells installed on student housing
(number 12 on Figure (2))
6
0
50000
100000
150000
200000
250000
300000
kWh
Energy consumption kWh in 2009
Energy consumption kWh
Figure(5). Energy consumption in Wången in 2009 (M. Lundström, personal communication, 14 May 2013)
4 Horse manure
The horse manure consists of about 60% of solids and 40% of liquids portion. In order to keep
a hygienic environment both for workers and horses, bedding materials used in the stall boxes
to absorb the liquid part, are exchanged regularly. A mixture of manure, urine and bedding
material is therefore, the component of stall boxes’ waste.
There are several different types of bedding materials. Wood shavings, sawdust, straw and
peat or paper pieces are the most common of them.
Choosing a bedding material is strongly dependent on the availability of that material at low
cost. In northern Sweden, wood-shavings are generally used due to its great accessibility
(Lundgren and Pettersson, 2009). The fraction of bedding material in stall wastes varies
significantly based on how careful stall keepers are in cleaning the stables.
Wången’s horse manure problem
In case of an arable land existence in the vicinity of the stable, horse manure composting can
be used as soil enrichment; otherwise costly removal and transportation of large waste
volumes would be required, which many horse owners cannot afford (Lundgren and
Pettersson, 2009).
Wången owns 105 horses currently (C. Erlandsson, Wången, personal communication, 24
April 2013), which spend almost 18 hours per day in stables except during June to August,
when they are moving freely in pastures (L.van den Brink, Personal communication 15 April
2013).
About 2400 m³ (2012) manure along with bedding material is produced annually from
Wången stables. This Manure has to be handled in an environmentally satisfactory way and
7
at an affordable/reasonable cost. So far, the manure has been used as fertilizer for crops in a
nearby field. But the manure is mixed with bedding material resulting in the farmers’ gradual
refusal of the mixture (L.van den Brink, personal communication 15 April 2013). Therefore,
Wången has to find another solution in a most efficient way to deal with their horse manure.
5 Possible solutions for producing usable energy from horse manure
Dealing with stall wastes has always been a concern for horse owners. Composting manure
in order to produce organic rich soil is an applicable way to deal with the stall wastes. No
longer, however, is it the only solution.
Converting horse manure into energy is now another alternative for horse owners of all sizes,
and different technologies are available for this conversion, including:
Incineration
Anaerobic digestion
Heat extraction
Gasification
Traditionally, the cost-effectiveness of these technologies has largely been dependent on the
size of the horse farm operation. In general, the larger the operation, the more cost-effective
these options are. However, technology development has made several of these options
feasible for small horse farms, as well (Sustainable Stables, 2012).
In the following part, the first two alternatives will be discussed for Wången’s manure
problem.
6 Results
Incineration
Burning manure to produce heat is not a new trend. For ages, man has burned animal waste
to obtain heat (Combs, n.d)., and is still a common practice around the world especially in
traditional and developing countries, such as India. In those regions, dried cow dung is
being burned for heating and cooking purposes (Chopp, 2013).
According to Lundgren and Pettersson (2009), the largest part of the horse manure is
recycled for agricultural purposes. Combustion and other usages such as soil production for
lawns were of small importance.
6.1.1 Legislation
According to the Waste Combustion Directive (WID 2000/76/EC), all the European Union
members, should determine if manure is considered as a waste or a renewable fuel for heat
production. If it follows the Waste Combustion Directive, the plant owner has to fulfill
regulations concerning:
permission for a new plant
operation conditions
emissions to air
8
water discharges from the cleaning of exhaust gases
ash handling
controlling and monitoring system
measurement requirements
access to information and public participation
Some countries do not have any actual requirements for small scale biofuel plants, while
some countries require exhaust gas emissions, thermal efficiency and supervision programs.
If heat production from manure is considered to be a biofuel plant, there is no EU directive
for the plant to fulfill.
Combustion of manure in Sweden is included in WID. In spite of the fact that horse manure
is a waste, it can be burned without fulfilling WID requirement due to the fact that the horse
manure contains a lot of grass and bedding material as opposed to usual poultry, cow and pig
manure (Edström et al., 2011, P.8).
However, the remained ash can only be used as fertilizer if it passes the regulations
regarding cadmium content.
6.1.2 Problems regarding the choice of an incineration plant
Inconsistency in horse manure compound is perhaps the biggest challenge in manure
combustion. Changes in the size of the fuel particles (such as in bedding material), difference
in ash composition or amount, as well as content moisture difference could cause mechanical
problems or may require changes in operation, which may not be possible with the actual
plant design.
To solve these issues, there are two possibilities:
Designing a facility with the ability to modify itself according to the fuel quality
variation.
Providing a standardized input fuel (requires a much higher technical and economical
effort on fuel preparation) (Edström et al., 2011).
6.1.3 Selection of an incineration plant for Wången
A 300-500 kW (M. Jansson, SWEBO, personal communication 25 April 2013) Swebo
Biotherm Gen 3 with Power and emission control system (EKS) and adjustable to the fuel
quality is chosen as heating plant6 to study the Wången’s case. Swebo Biotherm Gen 3 can
handle manure with moisture content up to 50% and an energy content of about 1700kWh /
ton. In cases of higher moisture content or long maintained manure, the EKS program (or
pallet booster) in a matter of 30-60 seconds activates to avoid decreasing power and
increasing emissions. This system causes the wooden pellets which are stored in a cylinder
near the heating plant, to be injected directly into the fireplace and in this way the
combustion process is regulated. This system is also activated when the requirements for
combustion are not maintained due to the poor quality of fuel, or if a higher power than the
original fuel is needed (BIOTHERM, 2012, P.8). It is also equipped a cyclone to reduce dust
emission. Swebo Biotherm Gen 3 is illustrated in figure (6).
6 All the mentioned problems, which can occur while dealing with horse manure, can be avoided with this
selection.
9
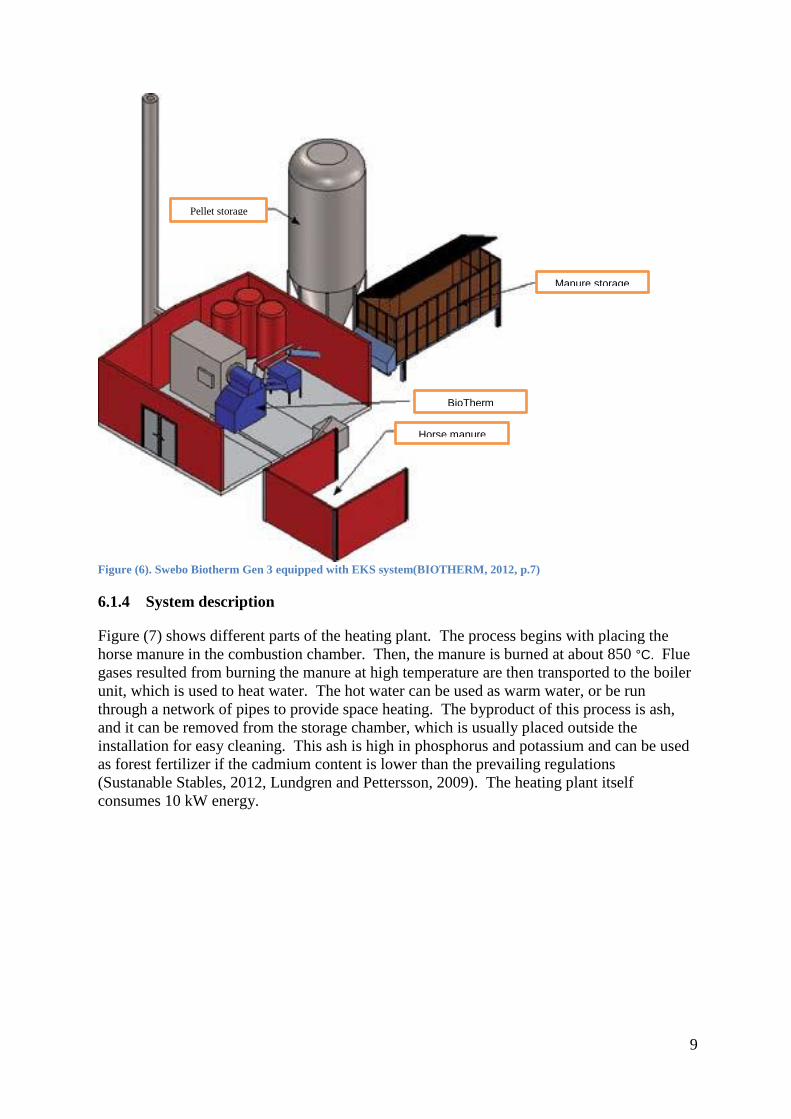
Figure (6). Swebo Biotherm Gen 3 equipped with EKS system(BIOTHERM, 2012, p.7)
6.1.4 System description
Figure (7) shows different parts of the heating plant. The process begins with placing the
horse manure in the combustion chamber. Then, the manure is burned at about 850 °C. Flue
gases resulted from burning the manure at high temperature are then transported to the boiler
unit, which is used to heat water. The hot water can be used as warm water, or be run
through a network of pipes to provide space heating. The byproduct of this process is ash,
and it can be removed from the storage chamber, which is usually placed outside the
installation for easy cleaning. This ash is high in phosphorus and potassium and can be used
as forest fertilizer if the cadmium content is lower than the prevailing regulations
(Sustanable Stables, 2012, Lundgren and Pettersson, 2009). The heating plant itself
consumes 10 kW energy.
Manure storage
BioTherm
Horse manure
Horse manure
Pellet storage

10
Figure(7). A schematic view of the heating plant(BIOTHERM, 2012, p.5)
6.1.5 Fuel options for SWEBO Biotherm
SWEBO BioTherm is not designed solely for horse owners. It is also ideal to be used by
slaughterhouse owners, animal breeders, chicken manures and in the forestry industry
(BIOTHERM, 2012).
Around one mile from Wången, locates Pelle & Lisa, an egg producer. It has around 18,000
chickens that provide around 60 liters of manure per hen per year. This manure can be also
burned with stall wastes. During contact with a responsible representative of Pelle & Lisa,
(U.Hallberg, Pelle & Lisa, personal communication, April 29 2013), Pelle & Lisa expressed
their interest to cooperate with Wången regarding the project. There is possibility for further
studies to investigate the effects of mixing chicken manure with stall waste. This study only
focuses on using horse manure and bedding material for biogas production.
Organic residues can also be burned with stall waste to produce energy. Currently, Wärdhus
(number 9 in Figure (2)) produces about 100 liters of organic waste every week, which can
be added to stall waste in furnace. This amount of organic waste is now composted at the
facility (C. Erlandsson, Wången, personal communication, 24 April 2013). Examining the
effect of mixing these residues with biogas production is out of the scope of this study.
Figure( 8). A view of a SWEBO Biotherm
11
6.1.6 Heating plant and the environment
Same as with other organic compounds, burning horse manure results in formation of CO2
and water. Horse manure contains considerably more fuel-bound nitrogen compared to other
organic materials such as wood-chips. This results in formation of NOX (Lundgren and
Pettersson, 2009). Nitric oxide and Nitrogen dioxide (NOX) will be produced during
combustion of nitrogen and oxygen at high temperatures. NOx contributes to
smog and acidic rain formation.
6.1.6.1 Global warming potential
No greenhouse gas emission has been reported during the furnace operating time (See
Appendix 4).
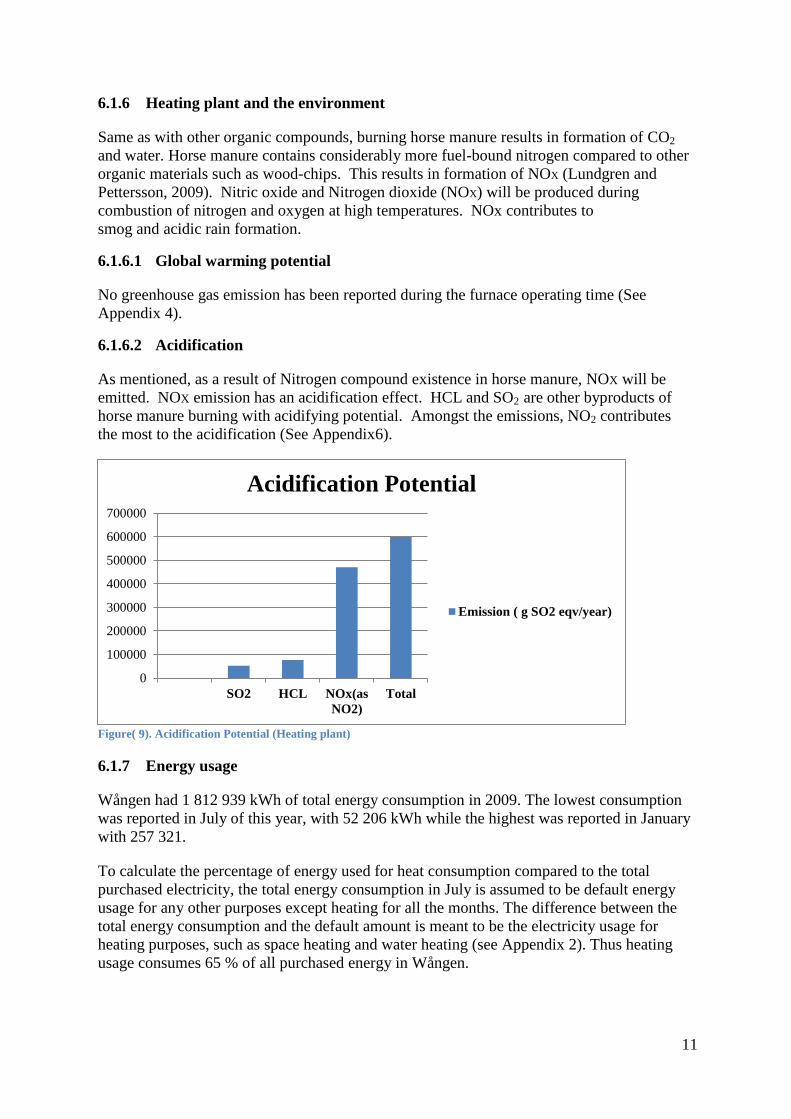
6.1.6.2 Acidification
As mentioned, as a result of Nitrogen compound existence in horse manure, NOX will be
emitted. NOX emission has an acidification effect. HCL and SO2 are other byproducts of
horse manure burning with acidifying potential. Amongst the emissions, NO2 contributes
the most to the acidification (See Appendix6).
Figure( 9). Acidification Potential (Heating plant)
6.1.7 Energy usage
Wången had 1 812 939 kWh of total energy consumption in 2009. The lowest consumption
was reported in July of this year, with 52 206 kWh while the highest was reported in January
with 257 321.
To calculate the percentage of energy used for heat consumption compared to the total
purchased electricity, the total energy consumption in July is assumed to be default energy
usage for any other purposes except heating for all the months. The difference between the
total energy consumption and the default amount is meant to be the electricity usage for
heating purposes, such as space heating and water heating (see Appendix 2). Thus heating
usage consumes 65 % of all purchased energy in Wången.
0
100000
200000
300000
400000
500000
600000
700000
SO2 HCL NOx(as
NO2)
Total
Acidification Potential
Emission ( g SO2 eqv/year)

12
6.1.8 Calculated heat production
Mikael Jansson (Swab Energy, personal communication, 25 April 2013) states that the horse
manure varies in quality, but based on his experience working with already delivered
systems, he evaluates that one ton of manure with moisture content of 45-50% occupies
between 3-5 cubic meters of space. He also mentions that depending on the quality of the
manure, the heating value can vary between 900 kWh / ton to up to 2000 kWh / ton.
In this study, horse manure’s moisture content, density and heating average values are
assumed to be 45-50%, 350 kg/m3 and 1.45 kWh/kg respectively(To see the heating value of
some common fuels see Appendix 0). The system is modulating down to around 20% of the
energy capacity.
Since stall waste is only available for nine months (September till May), energy consumption
in June, July and August has been deducted from total energy consumption. With 20 %
modulating down in the furnace, total amount of 108 267 kWh energy, in the form of heat, is
expected to be obtained from the furnace each month.
The total heat surplus in April, May, September and October is calculated to be 145 152
kWh7. As table (1) shows the gained heat from the stall waste combustion cannot meet the
Wången’s heating demand during the other months. Minus signs in the table below shows
the amount of extra heat which is needed to be met during those months.
Month Energy
consumption
kWh
Energy for
heating and
warm water
Energy for
other purposes
than heating
Gained energy
from horses
with modulation
Heat
need
Jan 257 321 205 115 52 206 108 267 -96 848
Feb 251 000 198 794 52 206 108 267 -90 527
Mars 189 472 137 266 52 206 108 267 -28 999
April 139 135 86 929 52 206 108 267 21 338
May 104 652 52 446 52 206 108 267 55 821
September 98 515 46 309 52 206 108 267 61 958
October 154 437 102 231 52 206 108 267 6 036
November 167 239 115 033 52 206 108 267 -6 766
December 251 038 198 832 52 206 108 267 -90 565
Total 1 612 809 1 142 955 469 854 974 400 -168 555 Table (1).Calculated heat gain and need in Wången
With a good management of stall wastes during the months with surplus heat, Wången only
needs to provide around 200 000 kWh for their heating demand during nine months (more
description is provided under the chapter ‘Suggestion to Wången school’).
6.1.9 Economy
As Table (2) shows, the total capital costs are evaluated to be around 4 million SEK. This
includes the inspection8 fee, which varies between 10-20000SEK (depending on the size of
7 Equivalent of 100 105kg or 286 m3 stall waste
8 The cost for issuing a guarantee from Inspecta or other similar companies, after installation
13
the boiler) (M. Jansson, SWEBO, personal communication 13 May 2013). The average
electricity price assumed to be one SEK. The operational costs consist of the total electricity
consumption costs for the furnace.
To make the calculations easy, the costs of building a boiler room and labor costs are
excluded here.
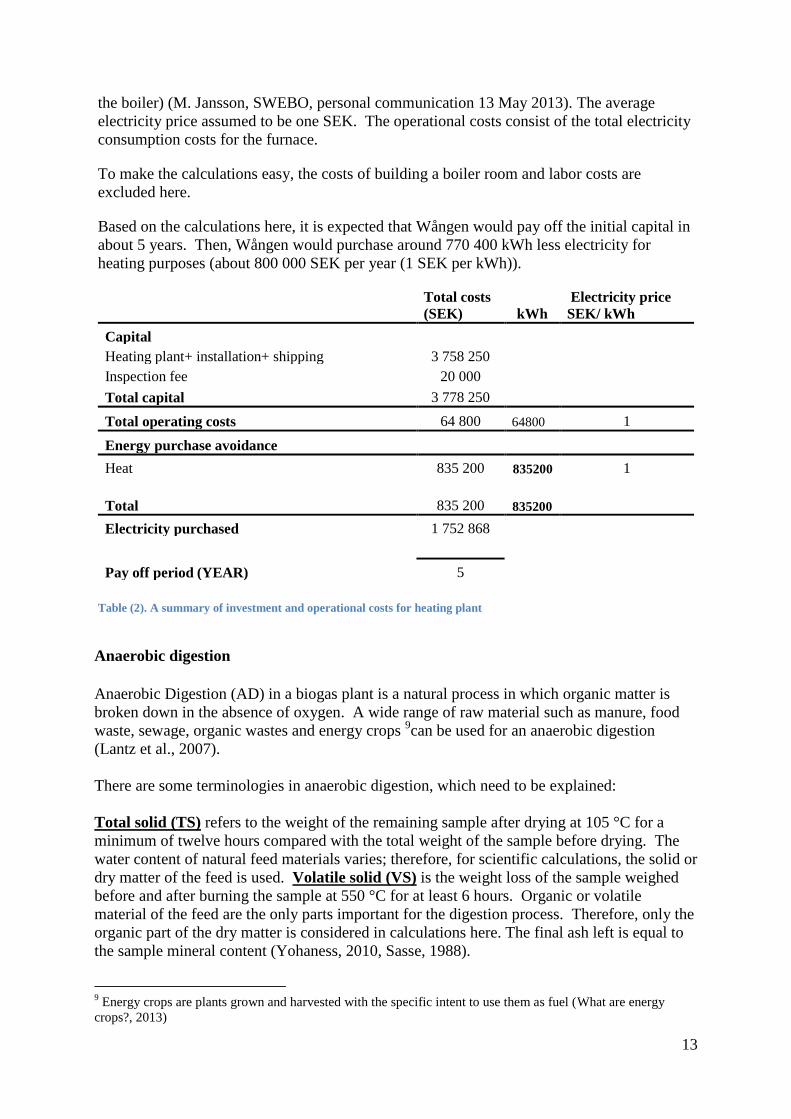
Based on the calculations here, it is expected that Wången would pay off the initial capital in
about 5 years. Then, Wången would purchase around 770 400 kWh less electricity for
heating purposes (about 800 000 SEK per year (1 SEK per kWh)).
Total costs
(SEK) kWh Electricity price
SEK/ kWh
Capital Heating plant+ installation+ shipping 3 758 250
Inspection fee 20 000 Total capital 3 778 250 Total operating costs 64 800 64800 1
Energy purchase avoidance
Heat 835 200 835200 1
Total 835 200 835200
Electricity purchased 1 752 868
Pay off period (YEAR) 5
Table (2). A summary of investment and operational costs for heating plant
Anaerobic digestion
Anaerobic Digestion (AD) in a biogas plant is a natural process in which organic matter is
broken down in the absence of oxygen. A wide range of raw material such as manure, food
waste, sewage, organic wastes and energy crops 9can be used for an anaerobic digestion
(Lantz et al., 2007).
There are some terminologies in anaerobic digestion, which need to be explained:
Total solid (TS) refers to the weight of the remaining sample after drying at 105 °C for a
minimum of twelve hours compared with the total weight of the sample before drying. The
water content of natural feed materials varies; therefore, for scientific calculations, the solid or
dry matter of the feed is used. Volatile solid (VS) is the weight loss of the sample weighed
before and after burning the sample at 550 °C for at least 6 hours. Organic or volatile
material of the feed are the only parts important for the digestion process. Therefore, only the
organic part of the dry matter is considered in calculations here. The final ash left is equal to
the sample mineral content (Yohaness, 2010, Sasse, 1988).
9 Energy crops are plants grown and harvested with the specific intent to use them as fuel (What are energy
crops?, 2013)
14
Digestion Techniques are divided into Wet and Dry Digestion Process (Liss, 2008). When
the dry matter content of the feedstock is below 15%, the AD process is called ‘Wet
Digestion’, or ‘Wet Fermentation’; when it is above 15%; the process is referred to as ‘Dry
Digestion’ (Lukehurst et al., 2010, p. 5).
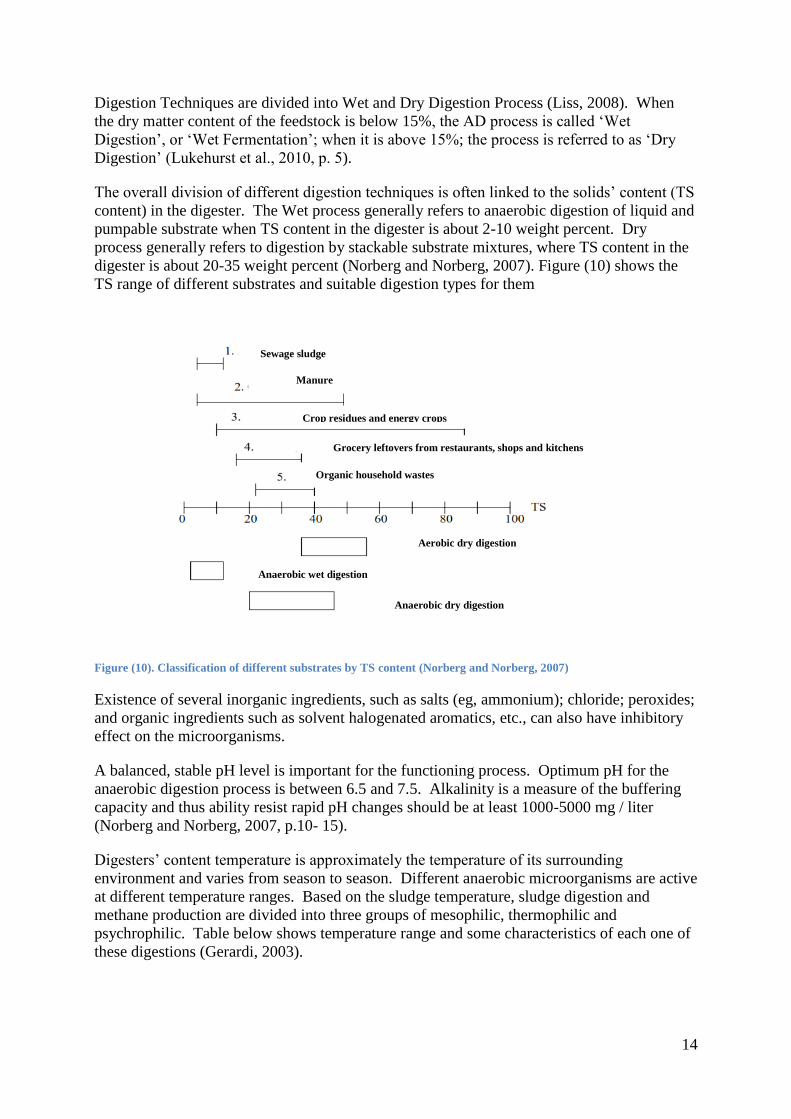
The overall division of different digestion techniques is often linked to the solids’ content (TS
content) in the digester. The Wet process generally refers to anaerobic digestion of liquid and
pumpable substrate when TS content in the digester is about 2-10 weight percent. Dry
process generally refers to digestion by stackable substrate mixtures, where TS content in the
digester is about 20-35 weight percent (Norberg and Norberg, 2007). Figure (10) shows the
TS range of different substrates and suitable digestion types for them
Figure (10). Classification of different substrates by TS content (Norberg and Norberg, 2007)
Existence of several inorganic ingredients, such as salts (eg, ammonium); chloride; peroxides;
and organic ingredients such as solvent halogenated aromatics, etc., can also have inhibitory
effect on the microorganisms.
A balanced, stable pH level is important for the functioning process. Optimum pH for the
anaerobic digestion process is between 6.5 and 7.5. Alkalinity is a measure of the buffering
capacity and thus ability resist rapid pH changes should be at least 1000-5000 mg / liter
(Norberg and Norberg, 2007, p.10- 15).
Digesters’ content temperature is approximately the temperature of its surrounding
environment and varies from season to season. Different anaerobic microorganisms are active
at different temperature ranges. Based on the sludge temperature, sludge digestion and
methane production are divided into three groups of mesophilic, thermophilic and
psychrophilic. Table below shows temperature range and some characteristics of each one of
these digestions (Gerardi, 2003).
Sewage sludge
Manure
Crop residues and energy crops
Grocery leftovers from restaurants, shops and kitchens
Organic household wastes
Aerobic dry digestion
Anaerobic wet digestion
Anaerobic dry digestion
15
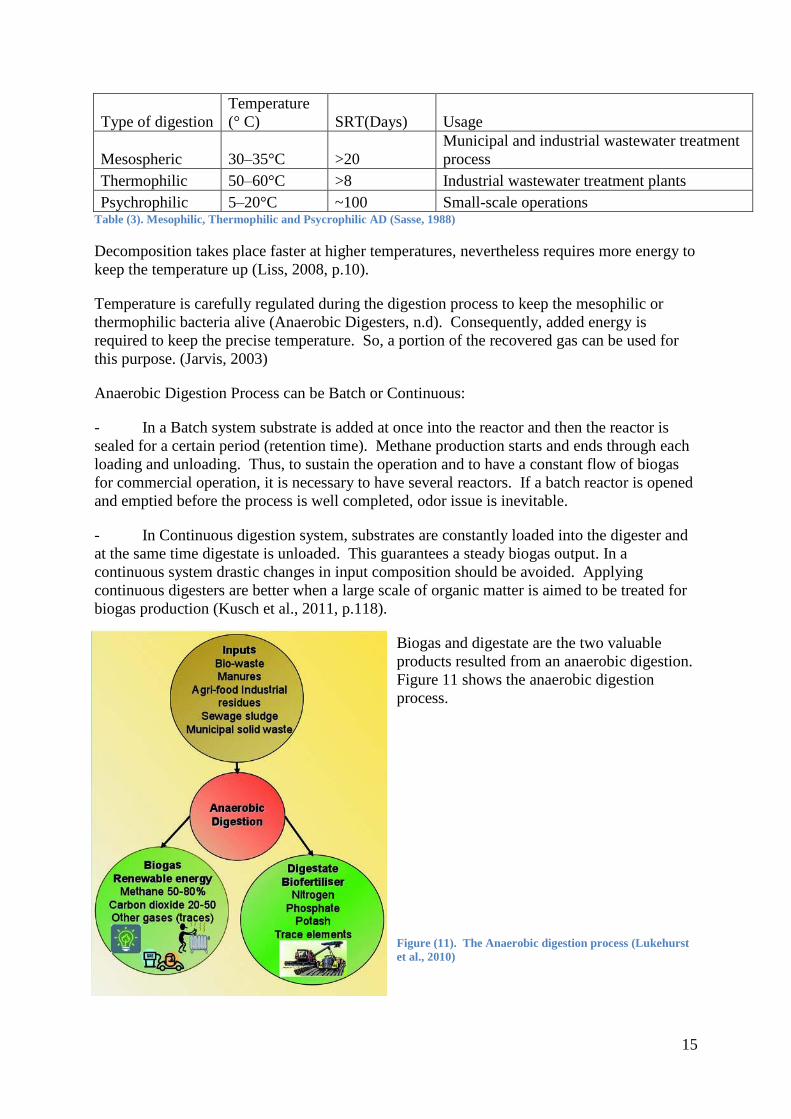
Type of digestion
Temperature
(° C) SRT(Days) Usage
Mesospheric 30–35°C >20
Municipal and industrial wastewater treatment
process
Thermophilic 50–60°C >8 Industrial wastewater treatment plants
Psychrophilic 5–20°C ~100 Small-scale operations Table (3). Mesophilic, Thermophilic and Psycrophilic AD (Sasse, 1988)
Decomposition takes place faster at higher temperatures, nevertheless requires more energy to
keep the temperature up (Liss, 2008, p.10).
Temperature is carefully regulated during the digestion process to keep the mesophilic or
thermophilic bacteria alive (Anaerobic Digesters, n.d). Consequently, added energy is
required to keep the precise temperature. So, a portion of the recovered gas can be used for
this purpose. (Jarvis, 2003)
Anaerobic Digestion Process can be Batch or Continuous:
- In a Batch system substrate is added at once into the reactor and then the reactor is
sealed for a certain period (retention time). Methane production starts and ends through each
loading and unloading. Thus, to sustain the operation and to have a constant flow of biogas
for commercial operation, it is necessary to have several reactors. If a batch reactor is opened
and emptied before the process is well completed, odor issue is inevitable.
- In Continuous digestion system, substrates are constantly loaded into the digester and
at the same time digestate is unloaded. This guarantees a steady biogas output. In a
continuous system drastic changes in input composition should be avoided. Applying
continuous digesters are better when a large scale of organic matter is aimed to be treated for
biogas production (Kusch et al., 2011, p.118).
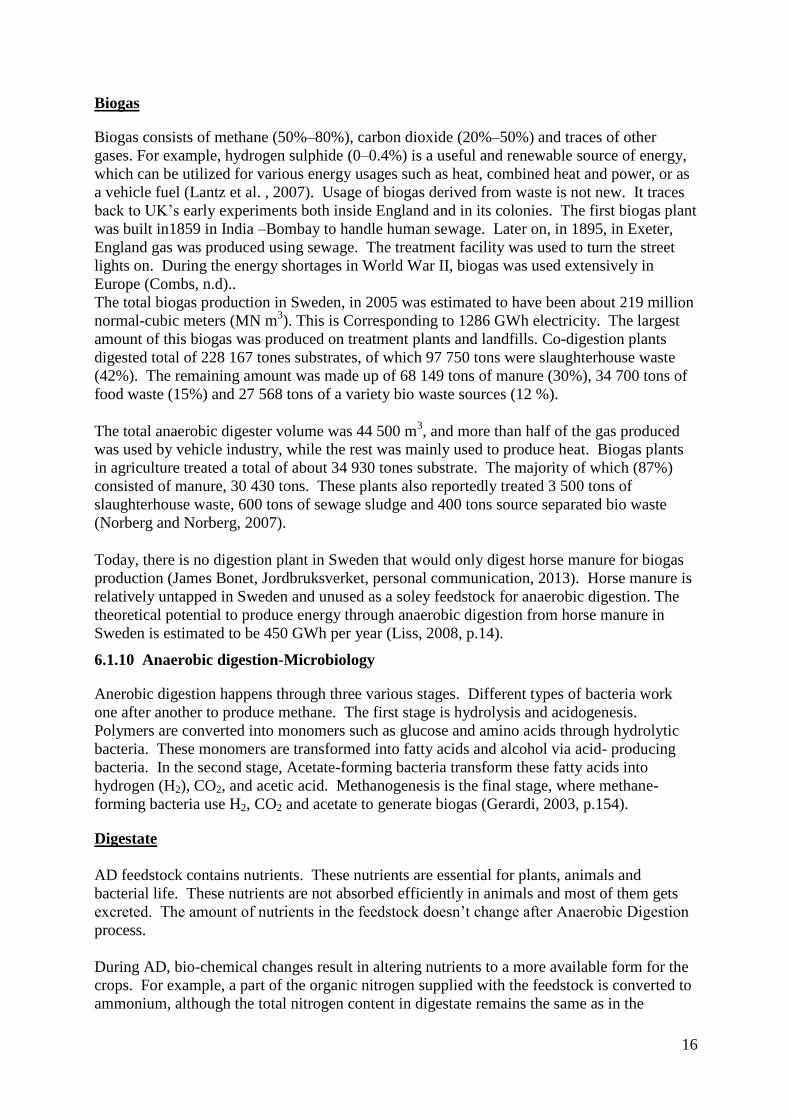
Biogas and digestate are the two valuable
products resulted from an anaerobic digestion.
Figure 11 shows the anaerobic digestion
process.
Figure (11). The Anaerobic digestion process (Lukehurst
et al., 2010)
16
Biogas
Biogas consists of methane (50%–80%), carbon dioxide (20%–50%) and traces of other
gases. For example, hydrogen sulphide (0–0.4%) is a useful and renewable source of energy,
which can be utilized for various energy usages such as heat, combined heat and power, or as
a vehicle fuel (Lantz et al. , 2007). Usage of biogas derived from waste is not new. It traces
back to UK’s early experiments both inside England and in its colonies. The first biogas plant
was built in1859 in India –Bombay to handle human sewage. Later on, in 1895, in Exeter,
England gas was produced using sewage. The treatment facility was used to turn the street
lights on. During the energy shortages in World War II, biogas was used extensively in
Europe (Combs, n.d)..
The total biogas production in Sweden, in 2005 was estimated to have been about 219 million
normal-cubic meters (MN m3). This is Corresponding to 1286 GWh electricity. The largest
amount of this biogas was produced on treatment plants and landfills. Co-digestion plants
digested total of 228 167 tones substrates, of which 97 750 tons were slaughterhouse waste
(42%). The remaining amount was made up of 68 149 tons of manure (30%), 34 700 tons of
food waste (15%) and 27 568 tons of a variety bio waste sources (12 %).
The total anaerobic digester volume was 44 500 m3, and more than half of the gas produced
was used by vehicle industry, while the rest was mainly used to produce heat. Biogas plants
in agriculture treated a total of about 34 930 tones substrate. The majority of which (87%)
consisted of manure, 30 430 tons. These plants also reportedly treated 3 500 tons of
slaughterhouse waste, 600 tons of sewage sludge and 400 tons source separated bio waste
(Norberg and Norberg, 2007).
Today, there is no digestion plant in Sweden that would only digest horse manure for biogas
production (James Bonet, Jordbruksverket, personal communication, 2013). Horse manure is
relatively untapped in Sweden and unused as a soley feedstock for anaerobic digestion. The
theoretical potential to produce energy through anaerobic digestion from horse manure in
Sweden is estimated to be 450 GWh per year (Liss, 2008, p.14).
6.1.10 Anaerobic digestion-Microbiology
Anerobic digestion happens through three various stages. Different types of bacteria work
one after another to produce methane. The first stage is hydrolysis and acidogenesis.
Polymers are converted into monomers such as glucose and amino acids through hydrolytic
bacteria. These monomers are transformed into fatty acids and alcohol via acid- producing
bacteria. In the second stage, Acetate-forming bacteria transform these fatty acids into
hydrogen (H2), CO2, and acetic acid. Methanogenesis is the final stage, where methane-
forming bacteria use H2, CO2 and acetate to generate biogas (Gerardi, 2003, p.154).
Digestate
AD feedstock contains nutrients. These nutrients are essential for plants, animals and
bacterial life. These nutrients are not absorbed efficiently in animals and most of them gets
excreted. The amount of nutrients in the feedstock doesn’t change after Anaerobic Digestion
process.
During AD, bio-chemical changes result in altering nutrients to a more available form for the
crops. For example, a part of the organic nitrogen supplied with the feedstock is converted to
ammonium, although the total nitrogen content in digestate remains the same as in the

17
feedstock. As a result, digestate has a great potential to be used as a bio-fertilizer (Lukehurst
et al., 2010, p.8). Due to organic substance degradation in the digester, the remaining
digestate does not create odor.
6.1.11 Legislation
In Sweden, substrates for biogas generation are divided into three categories in Sweden. There
are some special laws regarding the ways to deal with each category. Animal manure and
digestate are classified under category 2. To reduce the risk of spreading seriously transmitted
diseases, the basic requirement for category 2 materials is a heat treatment at 70 ° C for 60
minutes10
. Other methods that provide an equivalent level of hygienic end product can be
approved by the Board of Agriculture. If the digest undergoes this treatment it can be used as
fertilizer in Sweden (Jordbruksverket, 2013).
6.1.12 Problems regarding the choice of an anaerobic digester
Operational conditions (gas composition, hydraulic retention time (HRT), oxidation-reduction
potential (ORP), and volatile acid concentration) in the digester should be controlled and
maintained carefully within optimum ranges, as Methane- forming bacteria are very sensitive
to changes in alkalinity, pH, and temperature (Gerardi, 2003).
Having a liable substrate is of a great importance when it comes to anaerobic digestion. In
case of having no substrate to feed the digesters, anaerobic bacteria will die (A.Ricketts, Swab
Energy, personal communication, 30 April 2013).
6.1.13 Selection of anaerobic digestion plant for Wången
As it is shown in figure 10, dry anaerobic digestion is suitable for almost all residues from
farms, such as manure, crop residues and household organic wastes. So a dry anaerobic
digester can be used for horse manure. Regarding the large volume of waste, a continuous
dry fermentation is preferable.
SEaB Energy supplies compact and easy to install turnkey continuous anaerobic digesters
(AD), which can process between 200 and 1000 tons of food and bio waste per year. The
system is known as MUCKBUSTER and SEaB MB400 in the food processing and on-site
catering and accommodation sectors.
In the agricultural and rural sectors, the system generates energy and can create new income.
It is designed to produce between 8kWe - 55kWe electricity via a combined heat and power
unit (CHPs). The system also provides PAS110 pasteurization, so that residual organic
digestates can be sold as fertilizer or mulch (SWabEnergy).
The system is designed to be fully automated; it feeds itself as long as the hopper is filled. If
pH dosing is required, the system will add the mix to fix it. In case of using horse manure no
pH dosing is required because horse manure is neither pH acidic nor. Digester has remote
dial in equipment that provides controllers with pressures, temperatures and levels
(A.Ricketts,Swab energy, personal communication, 4 May 2013). Therefore, in case any
problem arises, the system can adjust itself.
10
This legislation only applies if the substrate originates from more than three different farms.
18
Two anaerobic digesters with 240 m3 reactor capacity are needed to handle the manure in
Wången case. These two digesters are then need to be conected to a 40 kW CHP plant which
can provide the school with both heat and electricity.
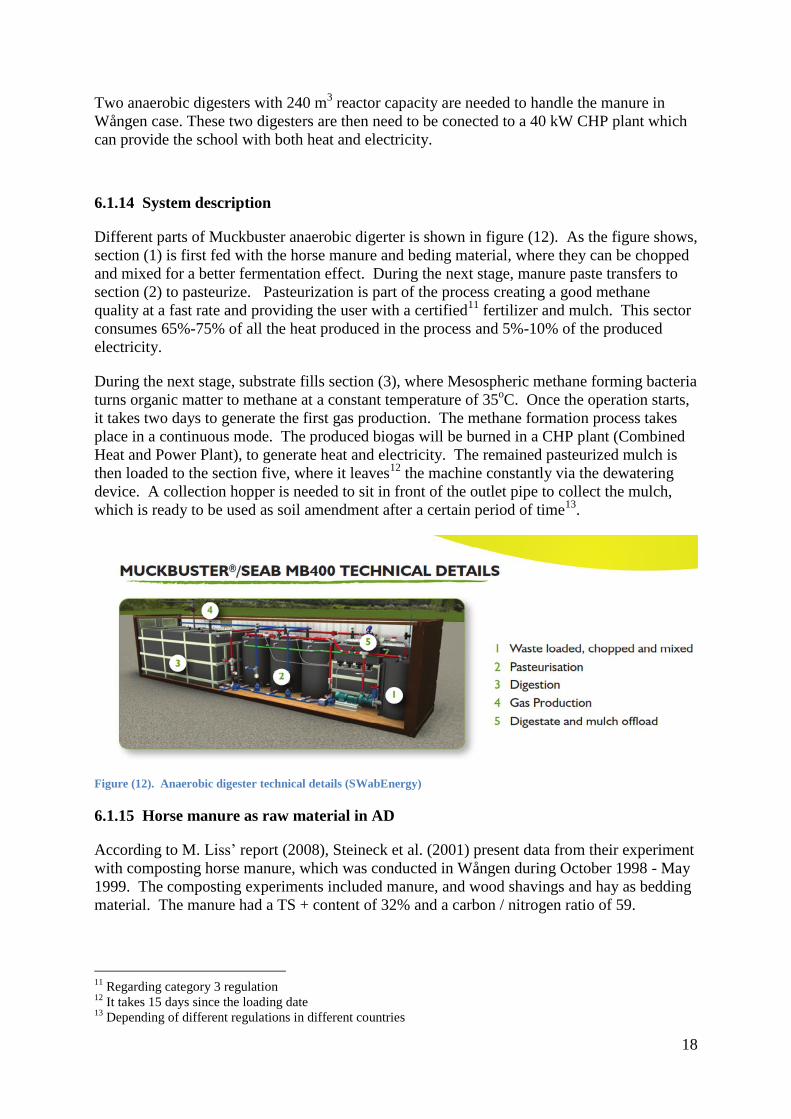
6.1.14 System description
Different parts of Muckbuster anaerobic digerter is shown in figure (12). As the figure shows,
section (1) is first fed with the horse manure and beding material, where they can be chopped
and mixed for a better fermentation effect. During the next stage, manure paste transfers to
section (2) to pasteurize. Pasteurization is part of the process creating a good methane
quality at a fast rate and providing the user with a certified11
fertilizer and mulch. This sector
consumes 65%-75% of all the heat produced in the process and 5%-10% of the produced
electricity.
During the next stage, substrate fills section (3), where Mesospheric methane forming bacteria
turns organic matter to methane at a constant temperature of 35oC. Once the operation starts,
it takes two days to generate the first gas production. The methane formation process takes
place in a continuous mode. The produced biogas will be burned in a CHP plant (Combined
Heat and Power Plant), to generate heat and electricity. The remained pasteurized mulch is
then loaded to the section five, where it leaves12
the machine constantly via the dewatering
device. A collection hopper is needed to sit in front of the outlet pipe to collect the mulch,
which is ready to be used as soil amendment after a certain period of time13
.
Figure (12). Anaerobic digester technical details (SWabEnergy)
6.1.15 Horse manure as raw material in AD
According to M. Liss’ report (2008), Steineck et al. (2001) present data from their experiment
with composting horse manure, which was conducted in Wången during October 1998 - May
1999. The composting experiments included manure, and wood shavings and hay as bedding
material. The manure had a TS + content of 32% and a carbon / nitrogen ratio of 59.
11
Regarding category 3 regulation 12
It takes 15 days since the loading date 13
Depending of different regulations in different countries
19
Today, Wången uses wood shavings as bedding material (L. van den Brink, personal
communication, 15 April 2013). Moreover, each manure heap can vary in characteristics
based on the amount of bedding material in the pile. The figures from this experiment cannot
be applied completely but give a general idea about the characteristics of the product.
6.1.16 Calculated gas production
The methane gain depends on several factors such as the digestion time and degradation
kinetics (influenced by substrate characteristics and process conditions). The total methane
potential Gpot can be determined by optimized batch testing, which should include
extrapolation of the experimental findings (Kusch et al., 2011). In order to reach this, the
amount of TS and VS of horse manure should be determined in laboratory. Since there was
no possibility to do an experiment on stall waste composition in Wången to obtain the TS and
VS value, these values are adopted from other studies (30 % TS and 75% VS of TS %).
Horse manure often consists of very long straw that is difficult to manage, resulting in a rather
low biogas output. Kreuger et al. (2006) presents such attempt where the biogas yield for
horse manure was 120 Nm3 CH4/ton VS laboratory scale, but only 50 Nm
3 CH4 in hydrolysis
reactor in pilot scale. The low biogas yield in pilot scale is thought to be due to the manure
possibly stored for long time without coverage and existence of long straw.
Experiments in hydrolysis reactor laboratory scale, which gave 146 Nm3 per tons dry mater in
42 days of anaerobic digestion (Kusch, 2008), is consistent with the approximately 150 Nm3
CH4 / ton TS at 40 days reported by Nilsson (2000), while indicates Kusch (2008) the yield
after 100 days on a laboratory scale was as high as 247 Nm3 CH4 / ton TS.
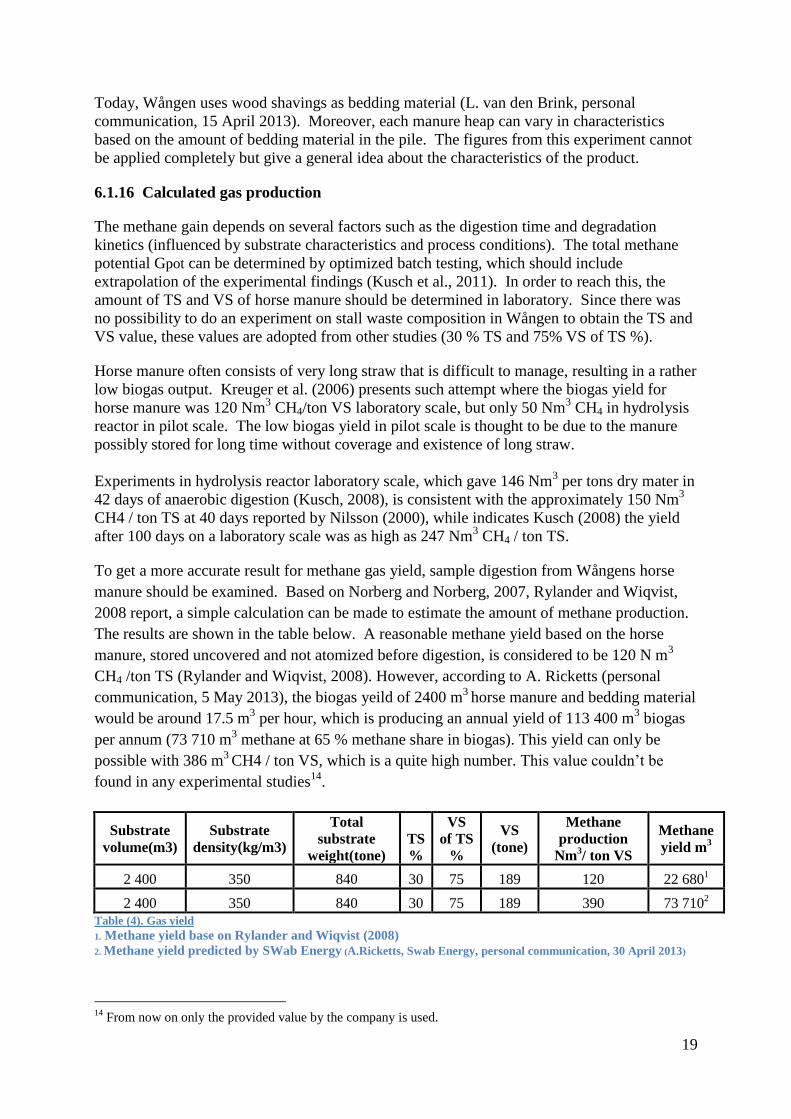
To get a more accurate result for methane gas yield, sample digestion from Wångens horse
manure should be examined. Based on Norberg and Norberg, 2007, Rylander and Wiqvist,
2008 report, a simple calculation can be made to estimate the amount of methane production.
The results are shown in the table below. A reasonable methane yield based on the horse
manure, stored uncovered and not atomized before digestion, is considered to be 120 N m3
CH4 /ton TS (Rylander and Wiqvist, 2008). However, according to A. Ricketts (personal
communication, 5 May 2013), the biogas yeild of 2400 m3
horse manure and bedding material
would be around 17.5 m3 per hour, which is producing an annual yield of 113 400 m
3 biogas
per annum (73 710 m3 methane at 65 % methane share in biogas). This yield can only be
possible with 386 m3 CH4 / ton VS, which is a quite high number. This value couldn’t be
found in any experimental studies14
.
Substrate
volume(m3) Substrate
density(kg/m3)
Total
substrate
weight(tone) TS
%
VS
of TS
%
VS
(tone)
Methane
production
Nm3/ ton VS
Methane
yield m3
2 400 350 840 30 75 189 120 22 6801
2 400 350 840 30 75 189 390 73 7102
Table (4). Gas yield
1. Methane yield base on Rylander and Wiqvist (2008)
2. Methane yield predicted by SWab Energy (A.Ricketts, Swab Energy, personal communication, 30 April 2013)
14
From now on only the provided value by the company is used.
20
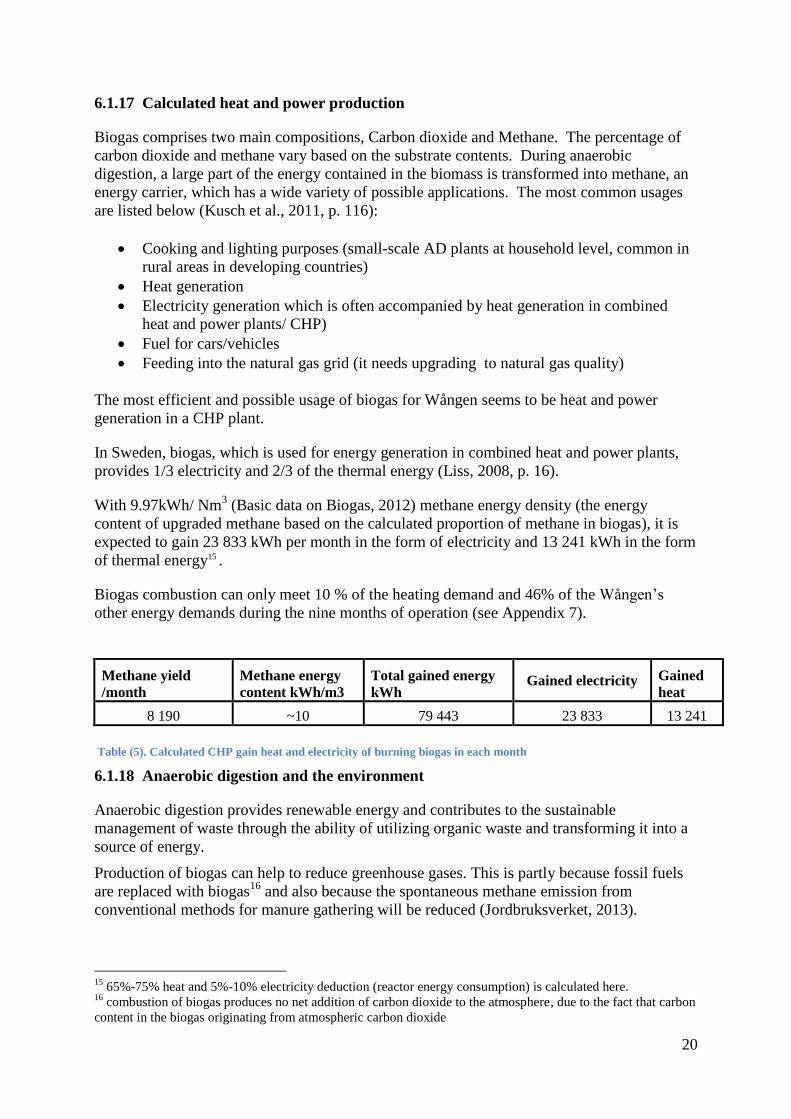
6.1.17 Calculated heat and power production
Biogas comprises two main compositions, Carbon dioxide and Methane. The percentage of
carbon dioxide and methane vary based on the substrate contents. During anaerobic
digestion, a large part of the energy contained in the biomass is transformed into methane, an
energy carrier, which has a wide variety of possible applications. The most common usages
are listed below (Kusch et al., 2011, p. 116):
Cooking and lighting purposes (small-scale AD plants at household level, common in
rural areas in developing countries)
Heat generation
Electricity generation which is often accompanied by heat generation in combined
heat and power plants/ CHP)
Fuel for cars/vehicles
Feeding into the natural gas grid (it needs upgrading to natural gas quality)
The most efficient and possible usage of biogas for Wången seems to be heat and power
generation in a CHP plant.
In Sweden, biogas, which is used for energy generation in combined heat and power plants,
provides 1/3 electricity and 2/3 of the thermal energy (Liss, 2008, p. 16).
With 9.97kWh/ Nm3 (Basic data on Biogas, 2012) methane energy density (the energy
content of upgraded methane based on the calculated proportion of methane in biogas), it is
expected to gain 23 833 kWh per month in the form of electricity and 13 241 kWh in the form
of thermal energy15 .
Biogas combustion can only meet 10 % of the heating demand and 46% of the Wången’s
other energy demands during the nine months of operation (see Appendix 7).
Methane yield
/month Methane energy
content kWh/m3 Total gained energy
kWh Gained electricity Gained
heat
8 190 ~10 79 443 23 833 13 241
Table (5). Calculated CHP gain heat and electricity of burning biogas in each month
6.1.18 Anaerobic digestion and the environment
Anaerobic digestion provides renewable energy and contributes to the sustainable
management of waste through the ability of utilizing organic waste and transforming it into a
source of energy.
Production of biogas can help to reduce greenhouse gases. This is partly because fossil fuels
are replaced with biogas16
and also because the spontaneous methane emission from
conventional methods for manure gathering will be reduced (Jordbruksverket, 2013).
15
65%-75% heat and 5%-10% electricity deduction (reactor energy consumption) is calculated here. 16
combustion of biogas produces no net addition of carbon dioxide to the atmosphere, due to the fact that carbon
content in the biogas originating from atmospheric carbon dioxide

21
Untreated manure produces Methane gas. Methane gas is a more powerful greenhouse gas
rather than carbon dioxide (Baumann and Tillman, 2004, p.510). Biogas production and
combustion by capturing and burning Methane gas minimizes Methane emissions to the
atmosphere.
If remained sludge, which is enriched with nutrients, is in conformation with the regulations
regarding sanitation of the digests in Sweden, it can be used as soil amendments in farms.
According to Schäfer et al. (2006), storage of solid manure heaps can result in nitrous oxide
and methane emissions. Anaerobic digestion of daily produced solid manure would reduce
these emissions.
6.1.18.1 Global warming potential
NOX and CO are the two main emissions resulted from biogas burning in a CHP plant (see
Appendix 5). None of these gases have a global warming potential. CO2 is filtered during the
process. And in case of release, it would not contribute to the global warming due to the
carbon content in the biogas originating from atmospheric carbon dioxide.
However, we can say that biogas production in some way, with capturing the methane can
mitigate global warming. This methane could be emitted to atmosphere if the manure left
untreated.
6.1.18.2 Acidification
At 5% oxygen, only 500mg/Nm3 of NOx (acidifying gas) is emitted from biogas combustion
in a CHP plant. This amount compared to the acidifying gas emissions from a bio burner is
trivial
Figure (13). Biogas CHP plant acidification potential in gSO2 eqv / year
0
5000
10000
15000
20000
25000
30000
Biogas CHP plant
Acidification potential
Emission ( g SO2
eqv/year)

22
6.1.19 Digestate usage
Depending on the volume of wood bedding used, the manure will be reduced to 20%-30% of
its original volume. The bedding volume will not be reduced (A. Ricketts, Swab Energy,
personal communication, 2013).
As mentioned in previous sections, digestate is reach in nutrient and can be used as fertilizer.
Nevertheless, like other crop fertilizers, if it is applied during autumn and winter when there is
little plant uptake, nutrient leaching and runoff into the ground and surfacewaters is
inevitable. Digestate must therefore be stored until the right time for application.
Each country has set some regulating limits to adjust nitrogen loading on farmlands. In
Sweden, required storage time for digestate is 6–10 months (Lukehurst et al., 2010, p.9-11).
Storing digestates, such as manure, in open tanks, can result in ammonia and methane
emission. Therefor by covering the surface of digestate in a storage tank using protective
layers such as plastic pieces, clay pebbles or chopped straw, etc., these emissions can be
reduced (Lukehurst et al., 2010, p.9-11).
In an email on 29 April 2013 A. Ricketts stated that the digestate also can be used as bedding
material if it is left to dry up. However, the feasibility of using digastate as bedding material
according to Swedish regulations has not been studied here.
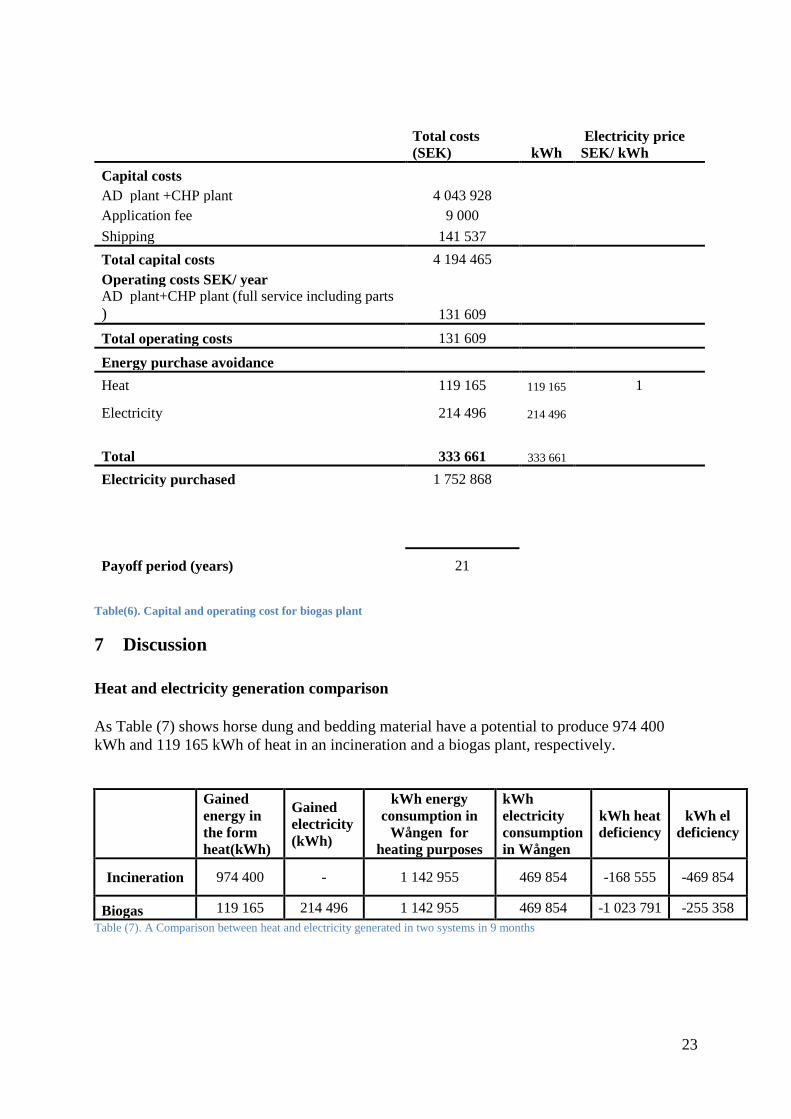
6.1.20 Economy
Total capital cost for starting a biogas plant, including shipping and application fee, is
evaluated to be about 4 million SEK, which can be paid off in almost 24 years.
Full operating cost, including parts and labor for anaerobic digesters for one year, is estimated
to be 263 219 SEK by the company17
. Since labor cost for the heating plant has been
excluded in this study, to have a more reliable comparison between two systems, half of the
estimated operating cost is used for calculation. Since reactor energy demand is provided by
its own energy generation (5%- 10 % electricity and 65%-75 % heat), the energy consumption
has already been deducted from the generated energy. The provided figures are the expected
captured heat and electricity.
After the pay-off period, Wången purchased a total of 306 180 kWh less energy annually
(about 300 000 SEK less per year).
17
This value is equivalent to 26 000 GBP.
23
Total costs
(SEK) kWh Electricity price
SEK/ kWh
Capital costs AD plant +CHP plant 4 043 928
Application fee 9 000 Shipping 141 537
Total capital costs 4 194 465 Operating costs SEK/ year
AD plant+CHP plant (full service including parts
) 131 609 Total operating costs 131 609
Energy purchase avoidance
Heat 119 165 119 165 1
Electricity 214 496
214 496
Total 333 661 333 661
Electricity purchased 1 752 868
Payoff period (years) 21
Table(6). Capital and operating cost for biogas plant
7 Discussion
Heat and electricity generation comparison
As Table (7) shows horse dung and bedding material have a potential to produce 974 400
kWh and 119 165 kWh of heat in an incineration and a biogas plant, respectively.
Gained
energy in
the form
heat(kWh)
Gained
electricity
(kWh)
kWh energy
consumption in
Wången for
heating purposes
kWh
electricity
consumption
in Wången
kWh heat
deficiency kWh el
deficiency
Incineration 974 400 - 1 142 955 469 854 -168 555 -469 854
Biogas 119 165 214 496 1 142 955 469 854 -1 023 791 -255 358
Table (7). A Comparison between heat and electricity generated in two systems in 9 months

24
Biogas can only meet 10 % 18
of heat and 46% of electricity consumption in nine months
operation, while a heating plant in case of a good management of surplus stall wastes during
April-October can cover up to 85 % of heating demand (Table 8). This high percentage of
heat coverage is of great importance for Wången’s case where 65 % of total energy
consumption is to fulfill their heating demand. Figures 14 and 15 illustrate the gained energy
from both plants and Wången’s energy demand.
Figure( 14). Summary of energy production in a CHP plant and Wången energy demand
Figure (15). Summary of energy production in a heating plant and Wången energy demand
18
It is mostly due to reactor’s high heat consumption in pasteurization process for a better Methane quality at a
fast rate
0
50000
100000
150000
200000
250000
kW
h
Biogas
Gained electricity kWh
Gained heat kWh
Electricity need kWh
Heat need kWh
0
50000
100000
150000
200000
250000
kW
h
Heating plant
Gained heat from
horses with modulation
Heat need
Electricity need

25
%Heat provision (9 months) %Electricity provision (9 months)
Heating plant 85 0
Biogas 10 46 Table (8). Energy meeting of two compared plants in %
The percentage of energy usage for heating purposes from June- August is calculated to be
22 % of total energy consumption in that period. See Appendix 8.
Environment
None of these systems showed any greenhouse gas emissions during their operations,
although acidifying emissions (mostly NOX) have been seen in both systems. Combusting
horse manure in the furnace however, showed more NOX emissions compared to that of
biogas burning in a CHP plant. This created a more acidification potential compared with that
of a heating plant (see Appendix 6).
Figure (16). Acidification potential in g SO2 eqv/ year
The NOX emissions from the heating plant can be justified if transporting manure to a heating
plant center (as the only remained solution to deal with the manure problem) come into
consideration.
Two such facilities can be chosen for this purpose (Jonas Hasselstam, Jämtkraft, personal
communication, 3 June 2013).
Lungvik heating plant in Östersund
Biomass (mostly fleece) is the main burning substrate in this facility. As a result of the
high moisture content and different energy capacity (compared to fleece) of horse manure,
burning stall waste in this facility has never been practiced. Further study is needed to
investigate the feasibility of burning manure in this plant.
0
100000
200000
300000
400000
500000
600000
700000
NOx(as NO2) Total
g S
O2 e
qv
/yea
r
Acidification potential comparision
Heating plant
Biogas CHP plant

26
Korsta Verken plant in Sundsvall
The possibility of burning manure in this plant is more probable. All the burnable waste in
Östersund is transported to Korsta Verken plant to be burned. However burning manure in
this facility has never been practiced.
Investigating the contribution of transporting stall waste to these two facilities to global
warming and acidification potential is out of the scope of this study.
Byproducts
Digestate
Digestion process causes the manure volume to be reduced to 20%-30% of its original
volume. However, the bedding material volume will not be reduced. Assuming that the
substrate has manure and bedding material portion with 2:1 ratio, there is still 4.8 m3
effluents
per day or 1296 m3 per annum. Moreover, according to Swedish regulations, digestate needs
to rest for a period of 6–10 months to be allowed to be used as fertilizer.
Ash
About 2%-4% of the stall waste’s volume turns into ash (M. Jansson, SWEBO, personal
communication, 13 May 2013). This provides about 0.36 m3 ash residues per day or 97 m
3
per year, which is almost 5% of the waste’s volume. If ash passes the heavy metal prevailing
limit in Sweden, it can be used as both forest and farm fertilizer without storage time
limitation.
Manure load as substrate
Accessible manure for nine month per year (during winter), makes stall wastes a reliable
substrate for heating plant. Almost 85 % of energy needed for heating purposes can be
acquired by burning horse manure and bedding material during winter.
On the other hand, anaerobic digesters need to have a reliable load the whole year; otherwise,
microbial activity stops (A.Ricketts,Swab Energy, personal communication, 25 April 2013).
A reliable substrate can be obtained by the help of sewage and slurry form toilets in Wången,
however, this substrate shift’ compatability with the Swedish regulations must be studied19
.
Economy
Table (9) shows a comparative summary of economic aspects of the two reactors. The initial
capital for system establishment is almost the same. However, the huge difference between
the energy outputs of the digesters has resulted in a longer payback period for the biogas
reactor and huge difference between the avoided purchased energy.
19
Toilete sewage is now stored in tanks with the capacity of 30 m3 outside the Wången, and a company is hired
to empty the storage tanks four times per year.
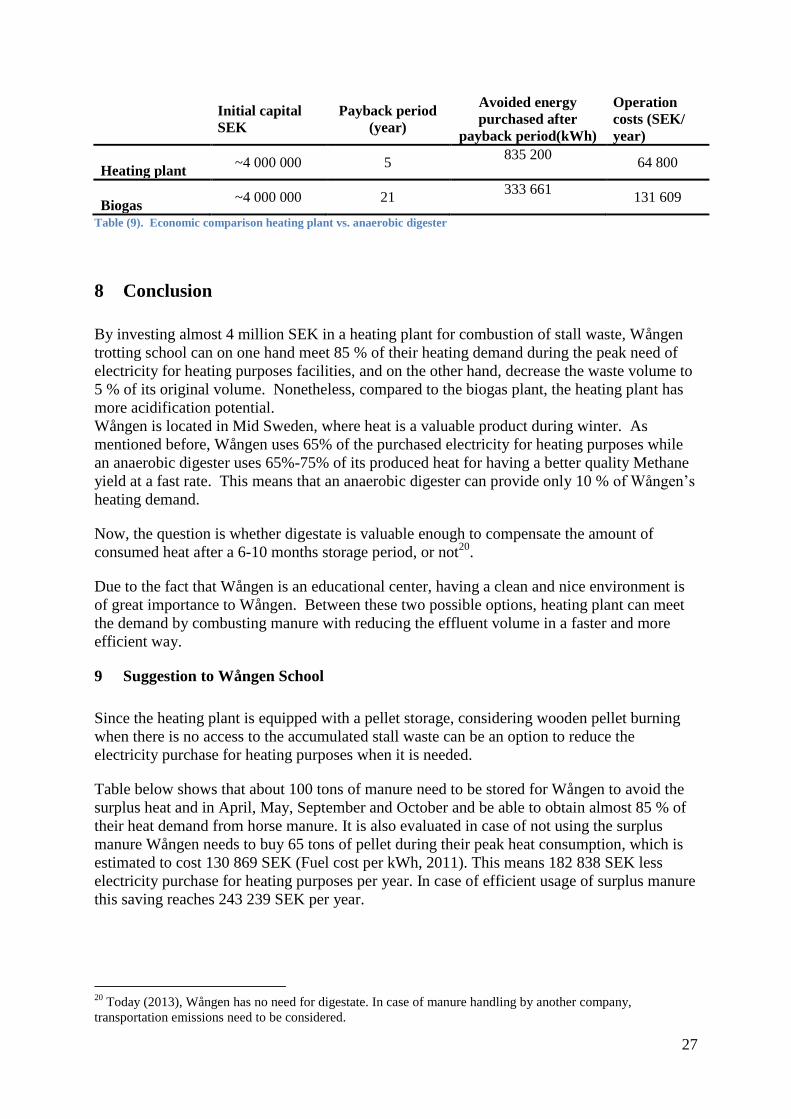
27
Initial capital
SEK Payback period
(year)
Avoided energy
purchased after
payback period(kWh)
Operation
costs (SEK/
year)
Heating plant ~4 000 000 5
835 200 64 800
Biogas ~4 000 000 21
333 661 131 609
Table (9). Economic comparison heating plant vs. anaerobic digester
8 Conclusion
By investing almost 4 million SEK in a heating plant for combustion of stall waste, Wången
trotting school can on one hand meet 85 % of their heating demand during the peak need of
electricity for heating purposes facilities, and on the other hand, decrease the waste volume to
5 % of its original volume. Nonetheless, compared to the biogas plant, the heating plant has
more acidification potential.
Wången is located in Mid Sweden, where heat is a valuable product during winter. As
mentioned before, Wången uses 65% of the purchased electricity for heating purposes while
an anaerobic digester uses 65%-75% of its produced heat for having a better quality Methane
yield at a fast rate. This means that an anaerobic digester can provide only 10 % of Wången’s
heating demand.
Now, the question is whether digestate is valuable enough to compensate the amount of
consumed heat after a 6-10 months storage period, or not20
.
Due to the fact that Wången is an educational center, having a clean and nice environment is
of great importance to Wången. Between these two possible options, heating plant can meet
the demand by combusting manure with reducing the effluent volume in a faster and more
efficient way.
9 Suggestion to Wången School
Since the heating plant is equipped with a pellet storage, considering wooden pellet burning
when there is no access to the accumulated stall waste can be an option to reduce the
electricity purchase for heating purposes when it is needed.
Table below shows that about 100 tons of manure need to be stored for Wången to avoid the
surplus heat and in April, May, September and October and be able to obtain almost 85 % of
their heat demand from horse manure. It is also evaluated in case of not using the surplus
manure Wången needs to buy 65 tons of pellet during their peak heat consumption, which is
estimated to cost 130 869 SEK (Fuel cost per kWh, 2011). This means 182 838 SEK less
electricity purchase for heating purposes per year. In case of efficient usage of surplus manure
this saving reaches 243 239 SEK per year.
20
Today (2013), Wången has no need for digestate. In case of manure handling by another company,
transportation emissions need to be considered.
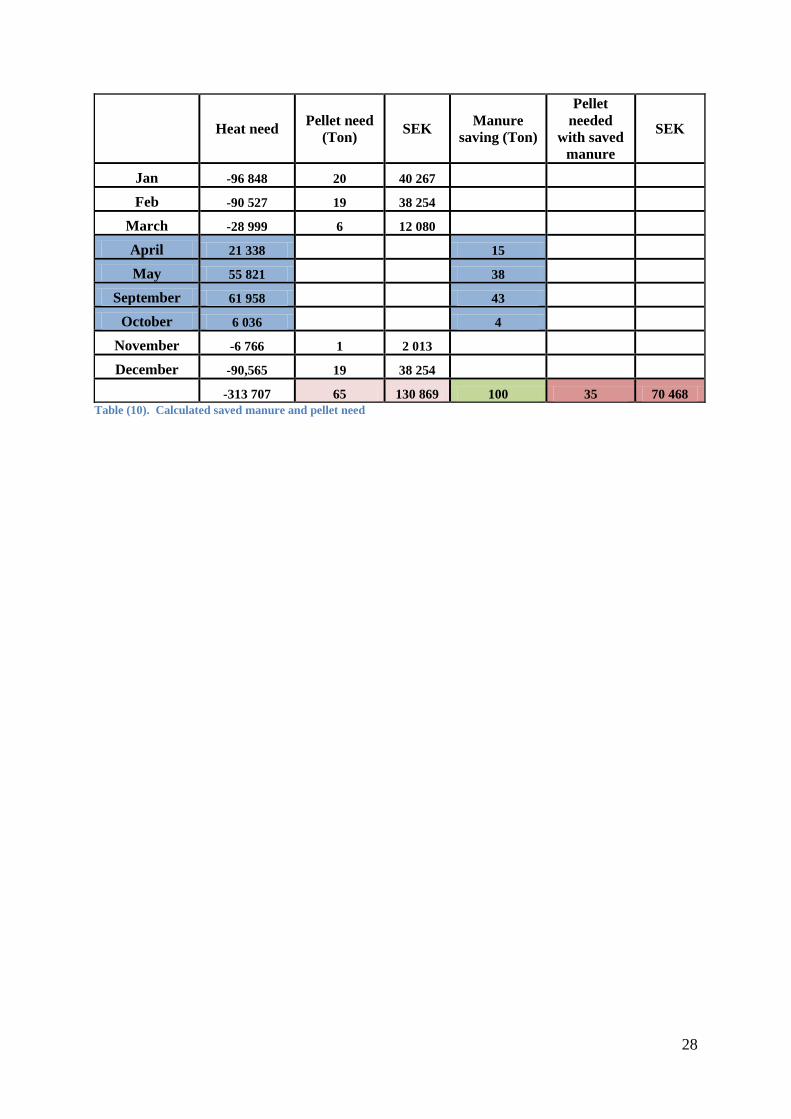
28
Heat need Pellet need
(Ton) SEK
Manure
saving (Ton)
Pellet
needed
with saved
manure
SEK
Jan -96 848 20 40 267
Feb -90 527 19 38 254
March -28 999 6 12 080
April 21 338 15
May 55 821 38
September 61 958 43
October 6 036 4
November -6 766 1 2 013
December -90,565 19 38 254
-313 707 65 130 869 100 35 70 468
Table (10). Calculated saved manure and pellet need
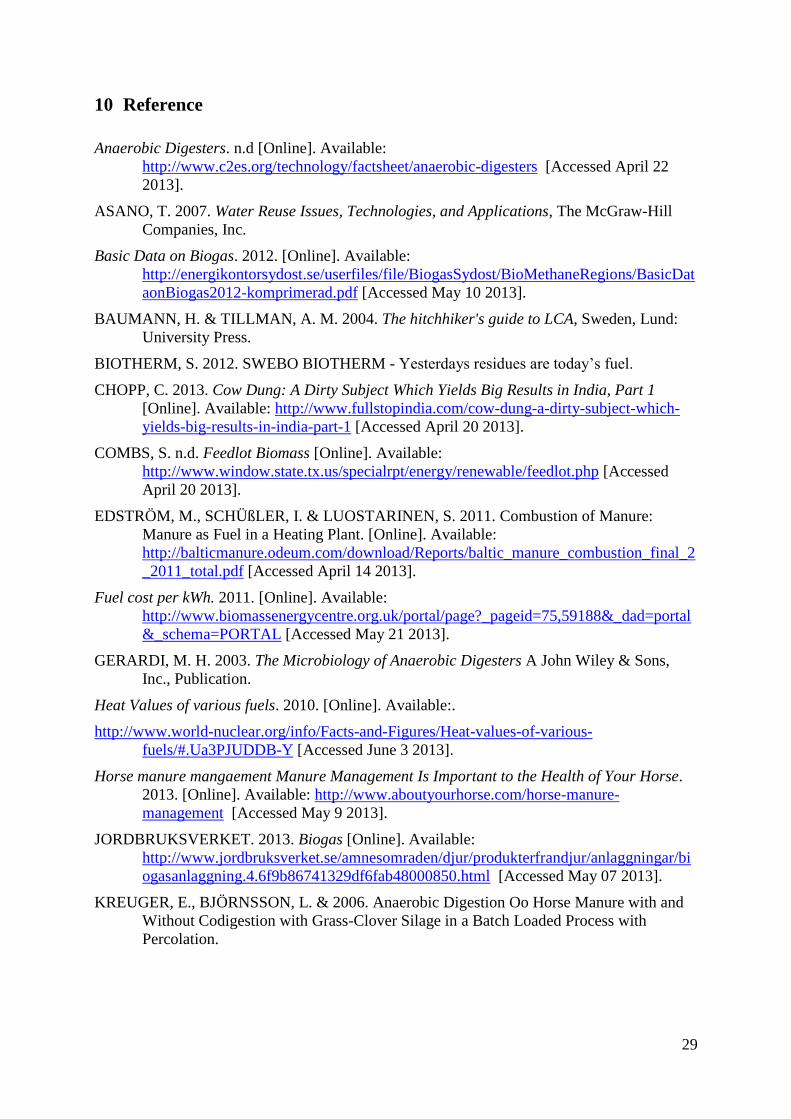
29
10 Reference
Anaerobic Digesters. n.d [Online]. Available:
http://www.c2es.org/technology/factsheet/anaerobic-digesters [Accessed April 22
2013].
ASANO, T. 2007. Water Reuse Issues, Technologies, and Applications, The McGraw-Hill
Companies, Inc.
Basic Data on Biogas. 2012. [Online]. Available:
http://energikontorsydost.se/userfiles/file/BiogasSydost/BioMethaneRegions/BasicDat
aonBiogas2012-komprimerad.pdf [Accessed May 10 2013].
BAUMANN, H. & TILLMAN, A. M. 2004. The hitchhiker's guide to LCA, Sweden, Lund:
University Press.
BIOTHERM, S. 2012. SWEBO BIOTHERM - Yesterdays residues are today’s fuel.
CHOPP, C. 2013. Cow Dung: A Dirty Subject Which Yields Big Results in India, Part 1
[Online]. Available: http://www.fullstopindia.com/cow-dung-a-dirty-subject-which-
yields-big-results-in-india-part-1 [Accessed April 20 2013].
COMBS, S. n.d. Feedlot Biomass [Online]. Available:
http://www.window.state.tx.us/specialrpt/energy/renewable/feedlot.php [Accessed
April 20 2013].
EDSTRÖM, M., SCHÜßLER, I. & LUOSTARINEN, S. 2011. Combustion of Manure:
Manure as Fuel in a Heating Plant. [Online]. Available:
http://balticmanure.odeum.com/download/Reports/baltic_manure_combustion_final_2
_2011_total.pdf [Accessed April 14 2013].
Fuel cost per kWh. 2011. [Online]. Available:
http://www.biomassenergycentre.org.uk/portal/page?_pageid=75,59188&_dad=portal
&_schema=PORTAL [Accessed May 21 2013].
GERARDI, M. H. 2003. The Microbiology of Anaerobic Digesters A John Wiley & Sons,
Inc., Publication.
Heat Values of various fuels. 2010. [Online]. Available:.
http://www.world-nuclear.org/info/Facts-and-Figures/Heat-values-of-various-
fuels/#.Ua3PJUDDB-Y [Accessed June 3 2013].
Horse manure mangaement Manure Management Is Important to the Health of Your Horse.
2013. [Online]. Available: http://www.aboutyourhorse.com/horse-manure-
management [Accessed May 9 2013].
JORDBRUKSVERKET. 2013. Biogas [Online]. Available:
http://www.jordbruksverket.se/amnesomraden/djur/produkterfrandjur/anlaggningar/bi
ogasanlaggning.4.6f9b86741329df6fab48000850.html [Accessed May 07 2013].
KREUGER, E., BJÖRNSSON, L. & 2006. Anaerobic Digestion Oo Horse Manure with and
Without Codigestion with Grass-Clover Silage in a Batch Loaded Process with
Percolation.
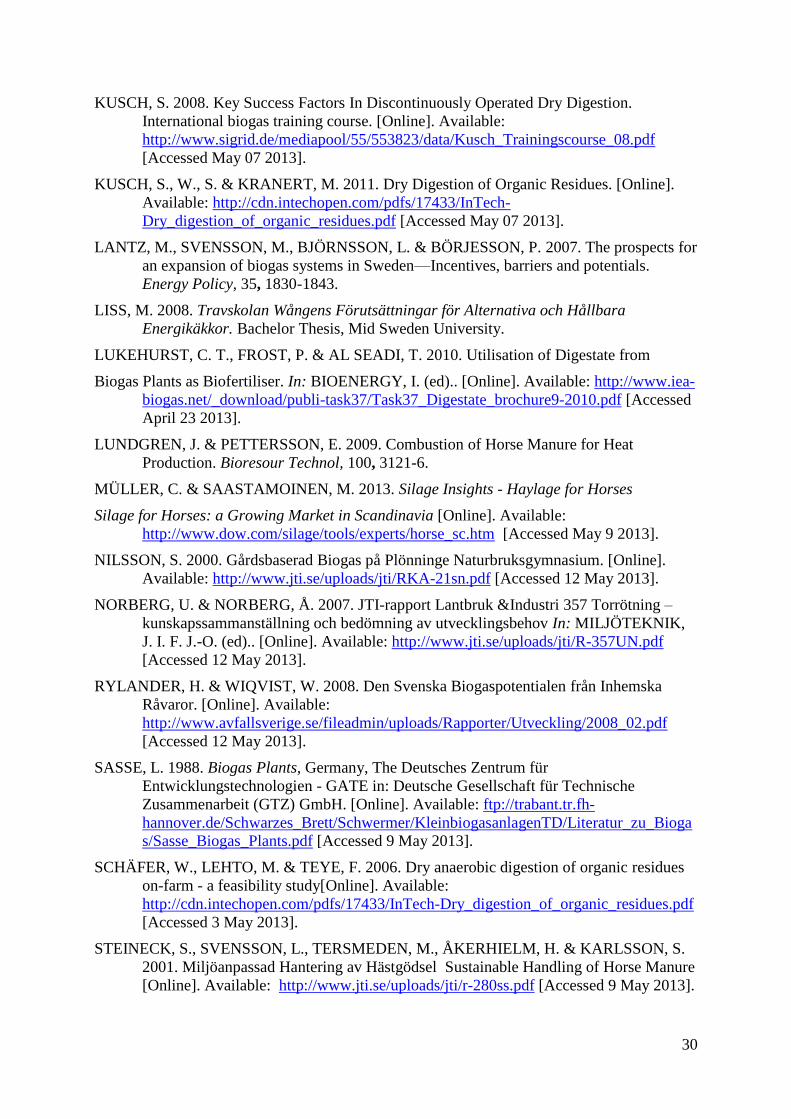
30
KUSCH, S. 2008. Key Success Factors In Discontinuously Operated Dry Digestion.
International biogas training course. [Online]. Available:
http://www.sigrid.de/mediapool/55/553823/data/Kusch_Trainingscourse_08.pdf
[Accessed May 07 2013].
KUSCH, S., W., S. & KRANERT, M. 2011. Dry Digestion of Organic Residues. [Online].
Available: http://cdn.intechopen.com/pdfs/17433/InTech-
Dry_digestion_of_organic_residues.pdf [Accessed May 07 2013].
LANTZ, M., SVENSSON, M., BJÖRNSSON, L. & BÖRJESSON, P. 2007. The prospects for
an expansion of biogas systems in Sweden—Incentives, barriers and potentials.
Energy Policy, 35, 1830-1843.
LISS, M. 2008. Travskolan Wångens Förutsättningar för Alternativa och Hållbara
Energikäkkor. Bachelor Thesis, Mid Sweden University.
LUKEHURST, C. T., FROST, P. & AL SEADI, T. 2010. Utilisation of Digestate from
Biogas Plants as Biofertiliser. In: BIOENERGY, I. (ed).. [Online]. Available: http://www.iea-
biogas.net/_download/publi-task37/Task37_Digestate_brochure9-2010.pdf [Accessed
April 23 2013].
LUNDGREN, J. & PETTERSSON, E. 2009. Combustion of Horse Manure for Heat
Production. Bioresour Technol, 100, 3121-6.
MÜLLER, C. & SAASTAMOINEN, M. 2013. Silage Insights - Haylage for Horses
Silage for Horses: a Growing Market in Scandinavia [Online]. Available:
http://www.dow.com/silage/tools/experts/horse_sc.htm [Accessed May 9 2013].
NILSSON, S. 2000. Gårdsbaserad Biogas på Plönninge Naturbruksgymnasium. [Online].
Available: http://www.jti.se/uploads/jti/RKA-21sn.pdf [Accessed 12 May 2013].
NORBERG, U. & NORBERG, Å. 2007. JTI-rapport Lantbruk &Industri 357 Torrötning –
kunskapssammanställning och bedömning av utvecklingsbehov In: MILJÖTEKNIK,
J. I. F. J.-O. (ed).. [Online]. Available: http://www.jti.se/uploads/jti/R-357UN.pdf
[Accessed 12 May 2013].
RYLANDER, H. & WIQVIST, W. 2008. Den Svenska Biogaspotentialen från Inhemska
Råvaror. [Online]. Available:
http://www.avfallsverige.se/fileadmin/uploads/Rapporter/Utveckling/2008_02.pdf
[Accessed 12 May 2013].
SASSE, L. 1988. Biogas Plants, Germany, The Deutsches Zentrum für
Entwicklungstechnologien - GATE in: Deutsche Gesellschaft für Technische
Zusammenarbeit (GTZ) GmbH. [Online]. Available: ftp://trabant.tr.fh-
hannover.de/Schwarzes_Brett/Schwermer/KleinbiogasanlagenTD/Literatur_zu_Bioga
s/Sasse_Biogas_Plants.pdf [Accessed 9 May 2013].
SCHÄFER, W., LEHTO, M. & TEYE, F. 2006. Dry anaerobic digestion of organic residues
on-farm - a feasibility study[Online]. Available:
http://cdn.intechopen.com/pdfs/17433/InTech-Dry_digestion_of_organic_residues.pdf
[Accessed 3 May 2013].
STEINECK, S., SVENSSON, L., TERSMEDEN, M., ÅKERHIELM, H. & KARLSSON, S.
2001. Miljöanpassad Hantering av Hästgödsel Sustainable Handling of Horse Manure
[Online]. Available: http://www.jti.se/uploads/jti/r-280ss.pdf [Accessed 9 May 2013].
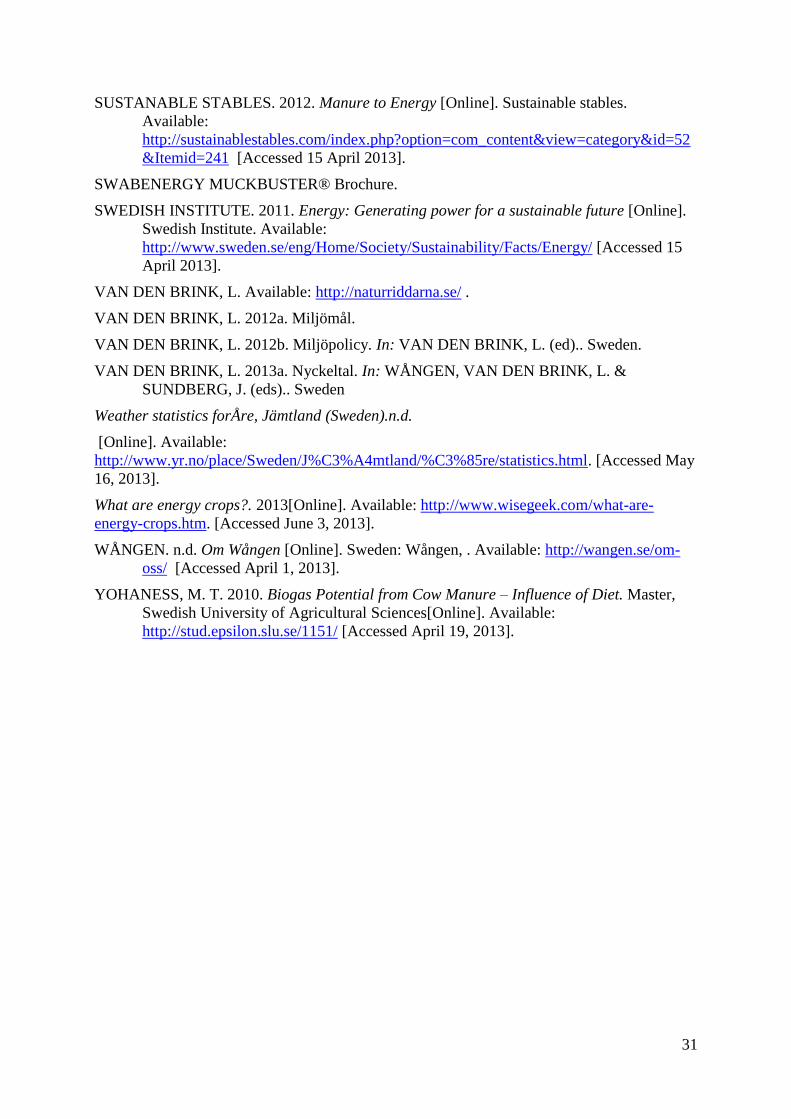
31
SUSTANABLE STABLES. 2012. Manure to Energy [Online]. Sustainable stables.
Available:
http://sustainablestables.com/index.php?option=com_content&view=category&id=52
&Itemid=241 [Accessed 15 April 2013].
SWABENERGY MUCKBUSTER® Brochure.
SWEDISH INSTITUTE. 2011. Energy: Generating power for a sustainable future [Online].
Swedish Institute. Available:
http://www.sweden.se/eng/Home/Society/Sustainability/Facts/Energy/ [Accessed 15
April 2013].
VAN DEN BRINK, L. Available: http://naturriddarna.se/ .
VAN DEN BRINK, L. 2012a. Miljömål.
VAN DEN BRINK, L. 2012b. Miljöpolicy. In: VAN DEN BRINK, L. (ed).. Sweden.
VAN DEN BRINK, L. 2013a. Nyckeltal. In: WÅNGEN, VAN DEN BRINK, L. &
SUNDBERG, J. (eds).. Sweden
Weather statistics forÅre, Jämtland (Sweden).n.d.
[Online]. Available:
http://www.yr.no/place/Sweden/J%C3%A4mtland/%C3%85re/statistics.html. [Accessed May
16, 2013].
What are energy crops?. 2013[Online]. Available: http://www.wisegeek.com/what-are-
energy-crops.htm. [Accessed June 3, 2013].
WÅNGEN. n.d. Om Wången [Online]. Sweden: Wången, . Available: http://wangen.se/om-
oss/ [Accessed April 1, 2013].
YOHANESS, M. T. 2010. Biogas Potential from Cow Manure – Influence of Diet. Master,
Swedish University of Agricultural Sciences[Online]. Available:
http://stud.epsilon.slu.se/1151/ [Accessed April 19, 2013].
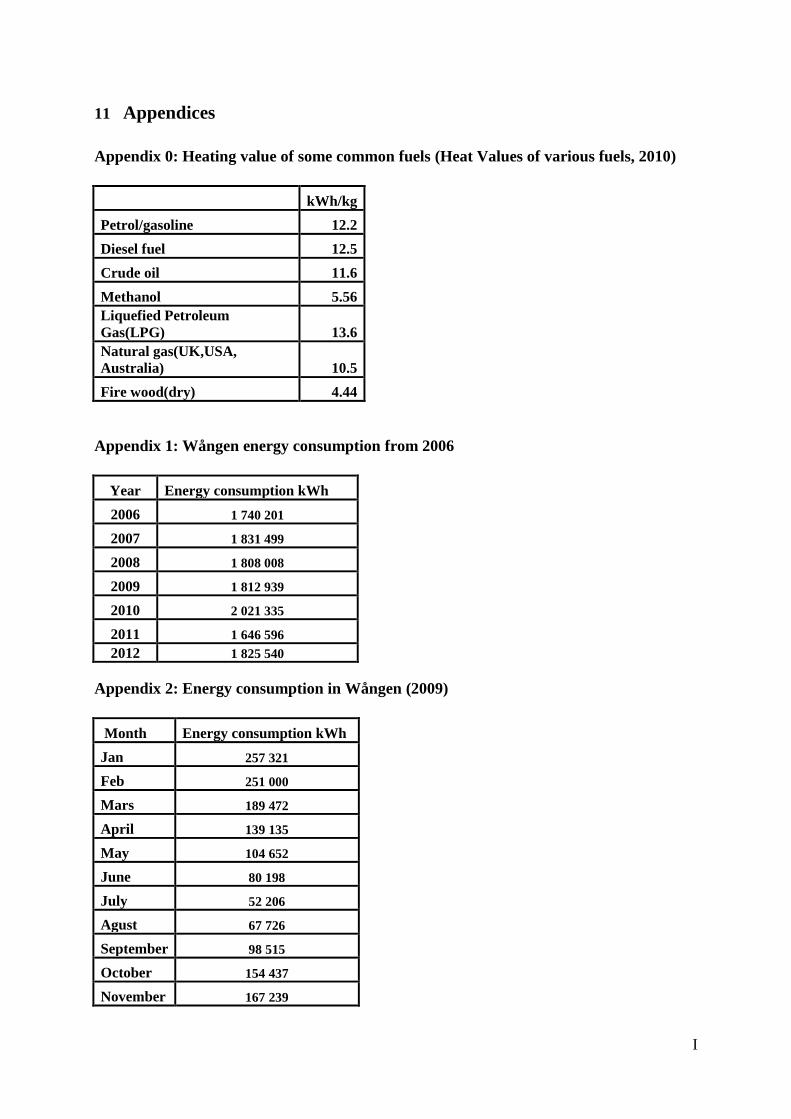
I
11 Appendices
Appendix 0: Heating value of some common fuels (Heat Values of various fuels, 2010)
kWh/kg
Petrol/gasoline 12.2
Diesel fuel 12.5
Crude oil 11.6
Methanol 5.56
Liquefied Petroleum
Gas(LPG) 13.6
Natural gas(UK,USA,
Australia) 10.5
Fire wood(dry) 4.44
Appendix 1: Wången energy consumption from 2006
Year Energy consumption kWh
2006 1 740 201
2007 1 831 499
2008 1 808 008
2009 1 812 939
2010 2 021 335
2011 1 646 596
2012 1 825 540
Appendix 2: Energy consumption in Wången (2009)
Month Energy consumption kWh
Jan 257 321
Feb 251 000
Mars 189 472
April 139 135
May 104 652
June 80 198
July 52 206
Agust 67 726
September 98 515
October 154 437
November 167 239
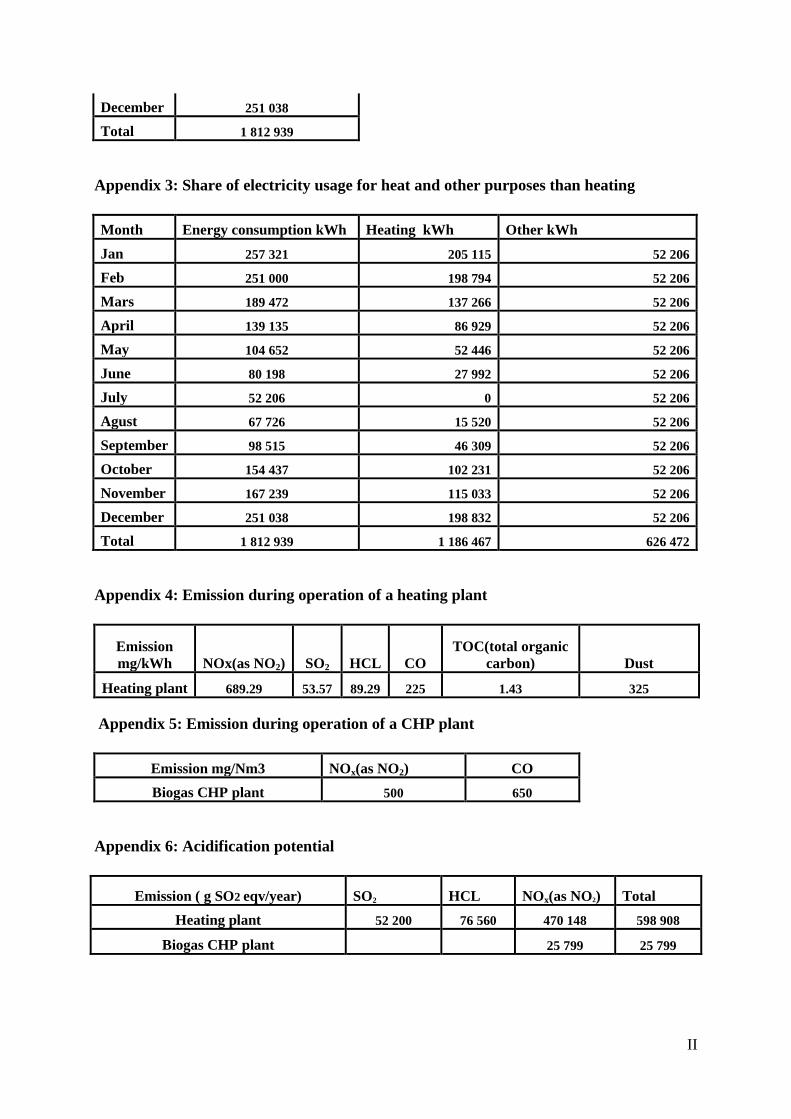
II
December 251 038
Total 1 812 939
Appendix 3: Share of electricity usage for heat and other purposes than heating
Month Energy consumption kWh Heating kWh Other kWh
Jan 257 321 205 115 52 206
Feb 251 000 198 794 52 206
Mars 189 472 137 266 52 206
April 139 135 86 929 52 206
May 104 652 52 446 52 206
June 80 198 27 992 52 206
July 52 206 0 52 206
Agust 67 726 15 520 52 206
September 98 515 46 309 52 206
October 154 437 102 231 52 206
November 167 239 115 033 52 206
December 251 038 198 832 52 206
Total 1 812 939 1 186 467 626 472
Appendix 4: Emission during operation of a heating plant
Emission
mg/kWh NOx(as NO2) SO2 HCL CO TOC(total organic
carbon) Dust
Heating plant 689.29 53.57 89.29 225 1.43 325
Appendix 5: Emission during operation of a CHP plant
Emission mg/Nm3 NOx(as NO2) CO
Biogas CHP plant 500 650
Appendix 6: Acidification potential
Emission ( g SO2 eqv/year) SO2 HCL NOx(as NO2) Total
Heating plant 52 200 76 560 470 148 598 908
Biogas CHP plant
25 799 25 799
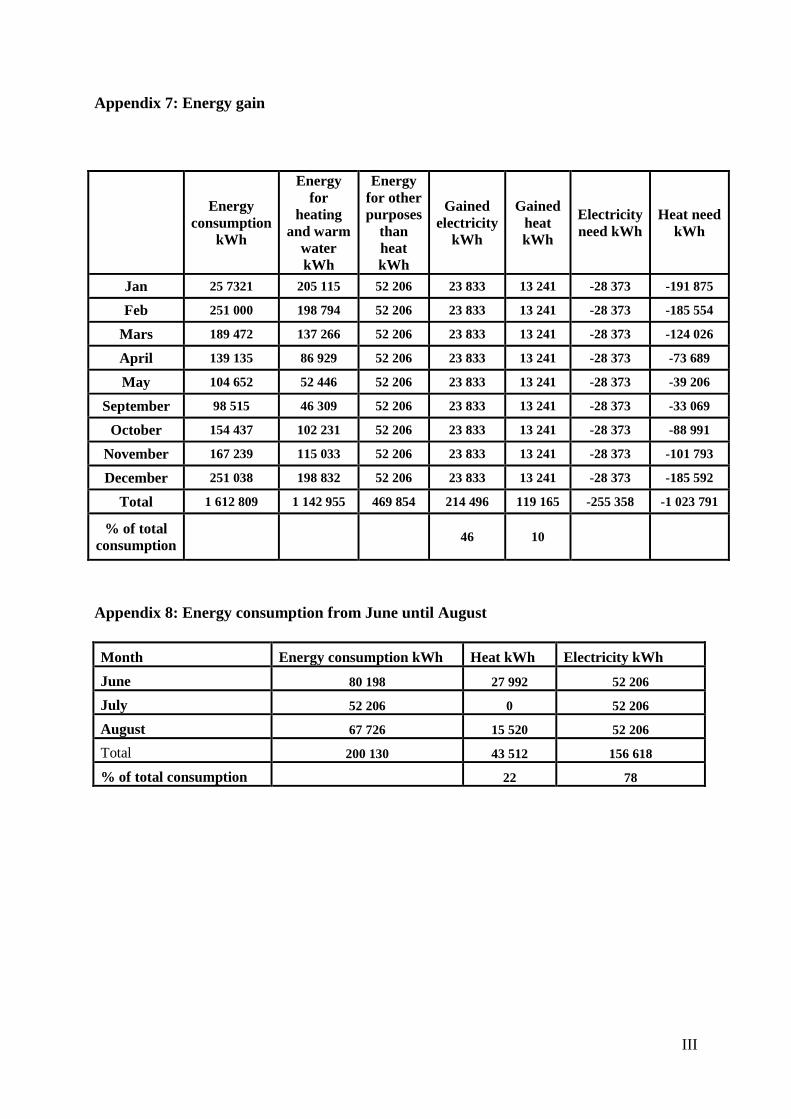
III
Appendix 7: Energy gain
Energy
consumption
kWh
Energy
for
heating
and warm
water
kWh
Energy
for other
purposes
than
heat
kWh
Gained
electricity
kWh
Gained
heat
kWh
Electricity
need kWh Heat need
kWh
Jan 25 7321 205 115 52 206 23 833 13 241 -28 373 -191 875
Feb 251 000 198 794 52 206 23 833 13 241 -28 373 -185 554
Mars 189 472 137 266 52 206 23 833 13 241 -28 373 -124 026
April 139 135 86 929 52 206 23 833 13 241 -28 373 -73 689
May 104 652 52 446 52 206 23 833 13 241 -28 373 -39 206
September 98 515 46 309 52 206 23 833 13 241 -28 373 -33 069
October 154 437 102 231 52 206 23 833 13 241 -28 373 -88 991
November 167 239 115 033 52 206 23 833 13 241 -28 373 -101 793
December 251 038 198 832 52 206 23 833 13 241 -28 373 -185 592
Total 1 612 809 1 142 955 469 854 214 496 119 165 -255 358 -1 023 791
% of total
consumption 46 10
Appendix 8: Energy consumption from June until August
Month Energy consumption kWh Heat kWh Electricity kWh
June 80 198 27 992 52 206
July 52 206 0 52 206
August 67 726 15 520 52 206
Total 200 130 43 512 156 618
% of total consumption
22 78


