Table of Contents Acknowledgments ......................................................................................................................................... 7
Note to the Reader ....................................................................................................................................... 8
Health and Safety .................................................................................................................................... 18
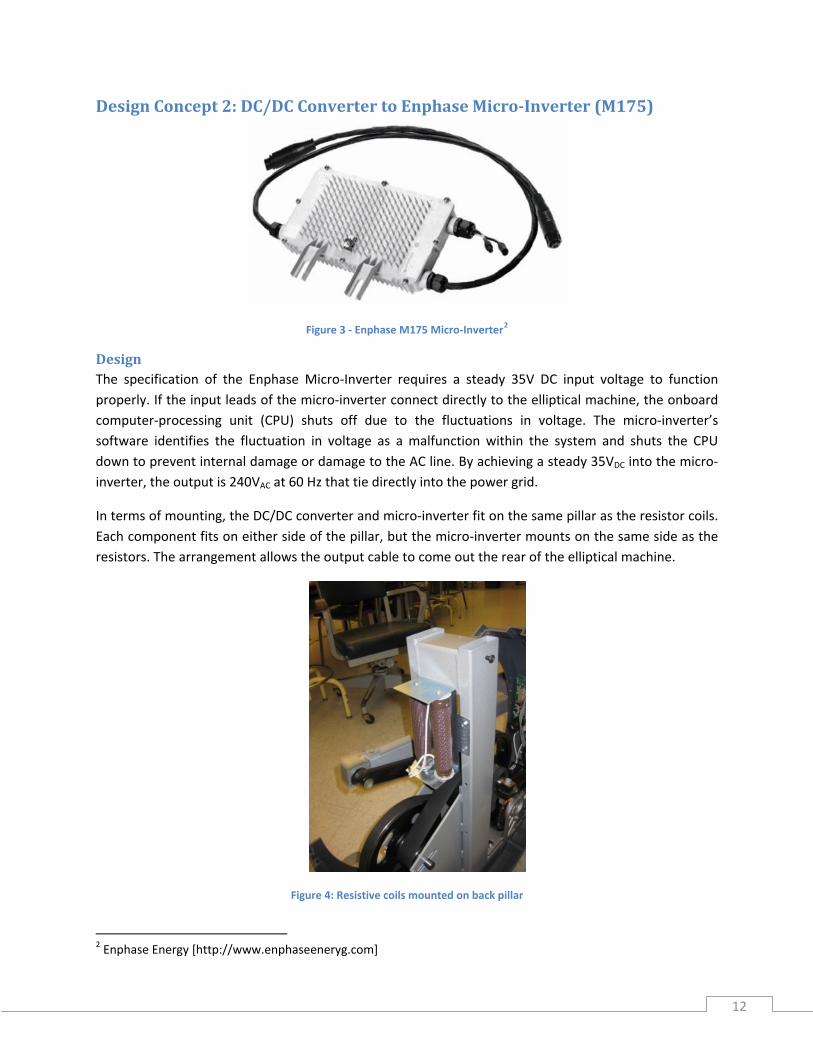
Social and Political .................................................................................................................................. 18
Design Choice and Implementation ........................................................................................................ 18
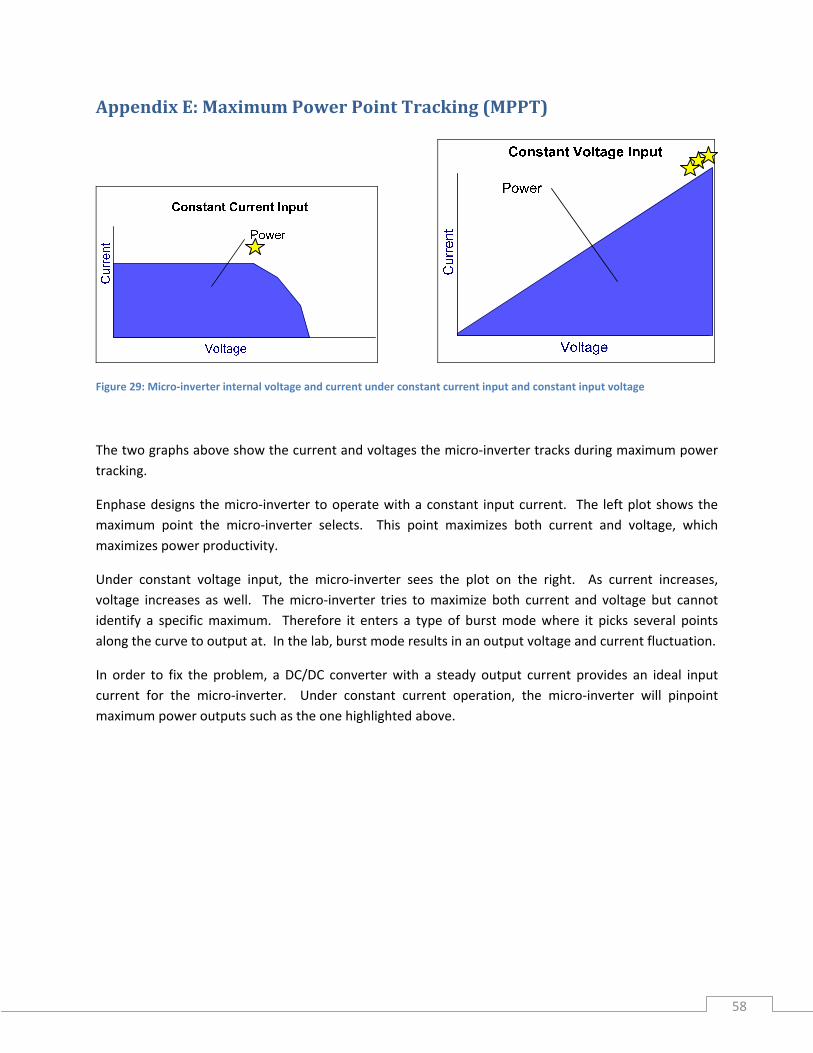
Overall System Description ................................................................................................................. 18
Choosing a DC/DC Converter .............................................................................................................. 20
Full System Test with Vicor DC Converter and Enphase micro‐inverter #2 ............................................ 41
Vicor Maxi DC converter troubleshooting .............................................................................................. 43
DC converters comparison test with resistive loading ........................................................................... 44
Vicor Customer Service Suggestions ....................................................................................................... 55
Vicor Maxi Specification Verification after Return of DC Converter module from Vicor Corporation (Electronic Loading) ................................................................................................................................ 55
Comparison of Vicor to Wilmore when sourced by elliptical and loaded by Clarostat Power Resistor . 58
Vicor Specification Verification when loaded with Clarostat Power Resistor ........................................ 61
Final Test ................................................................................................................................................. 62
Chapter 4 Design Realization and Verification ........................................................................................... 64
Appendix F: Energy Harvesting from Exercise Machines Self‐generating Elliptical Machines (Summer 2009) ........................................................................................................................................................... 88
3
List of Figures
Figure 1: EHFEM system block diagram ...................................................................................................... 11 Figure 2: Project planning Gantt chart ........................................................................................................ 12 Figure 3: Timeline of project ....................................................................................................................... 13 Figure 4: Machine's existing wiring ............................................................................................................. 23 Figure 5: Former resistive coils mounting shelf measurements ................................................................. 24 Figure 6: Full system test configuration ...................................................................................................... 25 Figure 7: One‐line diagram of DC converter troubleshooting test configuration ...................................... 26 Figure 8: Test #3 one‐line diagram ............................................................................................................. 26 Figure 9: Isolated micro‐inverter one‐line diagram .................................................................................... 27 Figure 10: Test #5 configuration ................................................................................................................. 29 Figure 11: EMU System Overview ............................................................................................................... 30 Figure 12: Enphase "My System" portal view ............................................................................................. 30 Figure 13: "My System" power harvest graph through Enphase portal ..................................................... 31 Figure 14: Full system configuration ........................................................................................................... 31 Figure 15: "My system" Enphase portal view for full system setup ........................................................... 32 Figure 16: Wilmore DC converter input characteristics .............................................................................. 34 Figure 17: Wilmore DC converter power capability ................................................................................... 35 Figure 18: Full system test efficiencies at various resistance settings........................................................ 36 Figure 19: Vicor DC converter voltage test setup ....................................................................................... 36 Figure 20: Vicor Maxi DC converter voltage characteristics ....................................................................... 38 Figure 21: Elliptical to Maxi DC converter test setup ................................................................................. 39 Figure 22: Full system setup with Vicor Maxi DC converter ....................................................................... 41 Figure 23: Trouble shooting setup with Vicor DC Converter ...................................................................... 43 Figure 24: Vicor Maxi DC converter test setup ........................................................................................... 44 Figure 25: Clarostat 240C Power Resistor Decade Box ............................................................................... 44 Figure 26: Wilmore DC Converter test setup with resistive load ............................................................... 45 Figure 27: Efficiency versus Output Current of Vicor Maxi and Wilmore DC converter when driving the Clarostat load .............................................................................................................................................. 46 Figure 28: Test configuration ...................................................................................................................... 47 Figure 29: Output voltage over range of load resistances .......................................................................... 48 Figure 30: DC converter load current versus load resistance ..................................................................... 49 Figure 31: Comparison of DC converter output voltages over range of load resistances .......................... 52 Figure 32: Comparison of DC converter output currents over a range of load resistances ....................... 53 Figure 33: Comparison of DC converter efficiencies over range of load resistances ................................. 54 Figure 34: DC converter testing with BK Precision electronic load and HP 6574A DC power supply ........ 55 Figure 35: Vicor Maxi DC converter output power vs. BK Precision Electronic Load resistance ................ 57 Figure 36: Vicor Maxi DC converter output current vs. BK Precision Electronic Load resistance .............. 57 Figure 37: Vicor Maxi DC converter efficiency vs. Vicor Maxi DC converter output current ..................... 58 Figure 38: Elliptical output to Vicor Maxi DC‐DC converter to Clarostat Decade Resistor Box .................. 59 Figure 39: Elliptical output to Wilmore DC‐DC converter to Clarostat decade resistor box ...................... 59
4
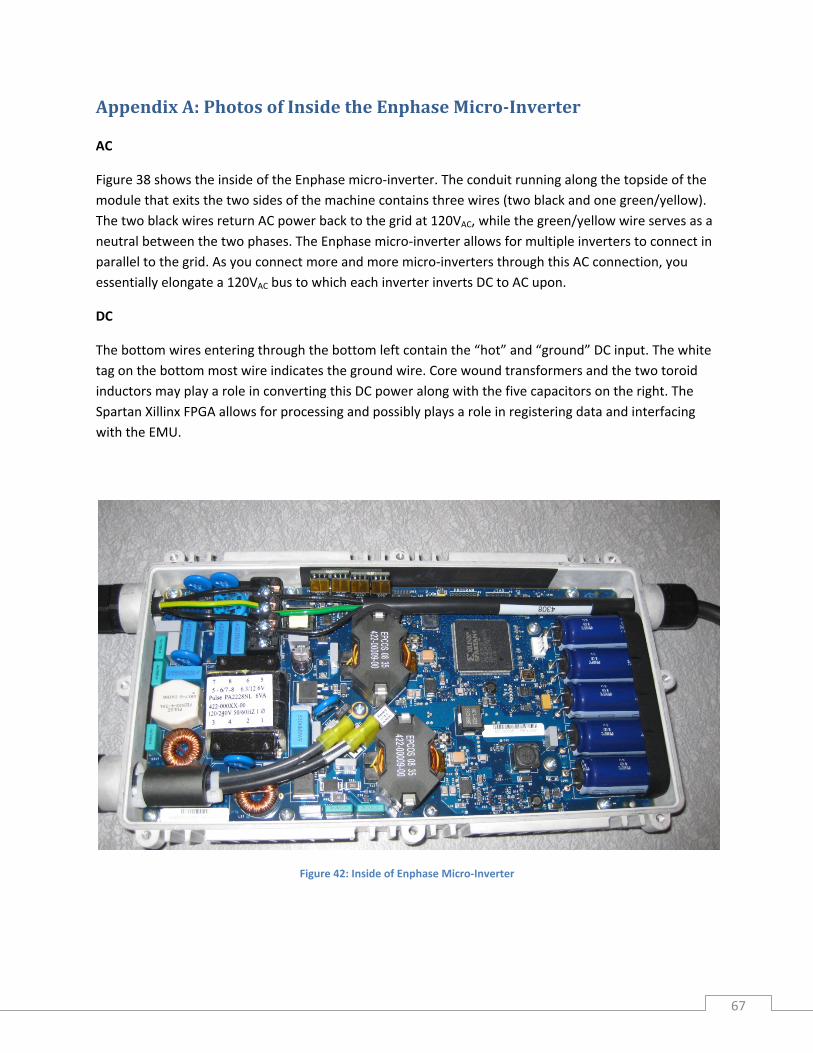
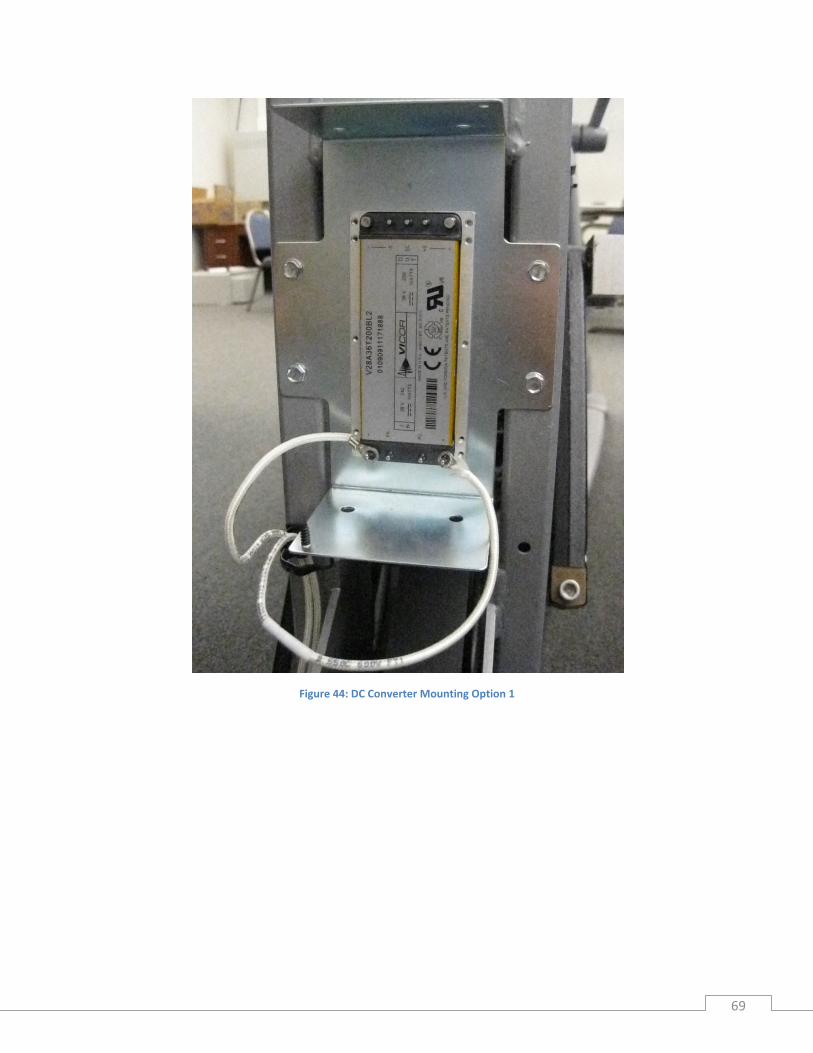
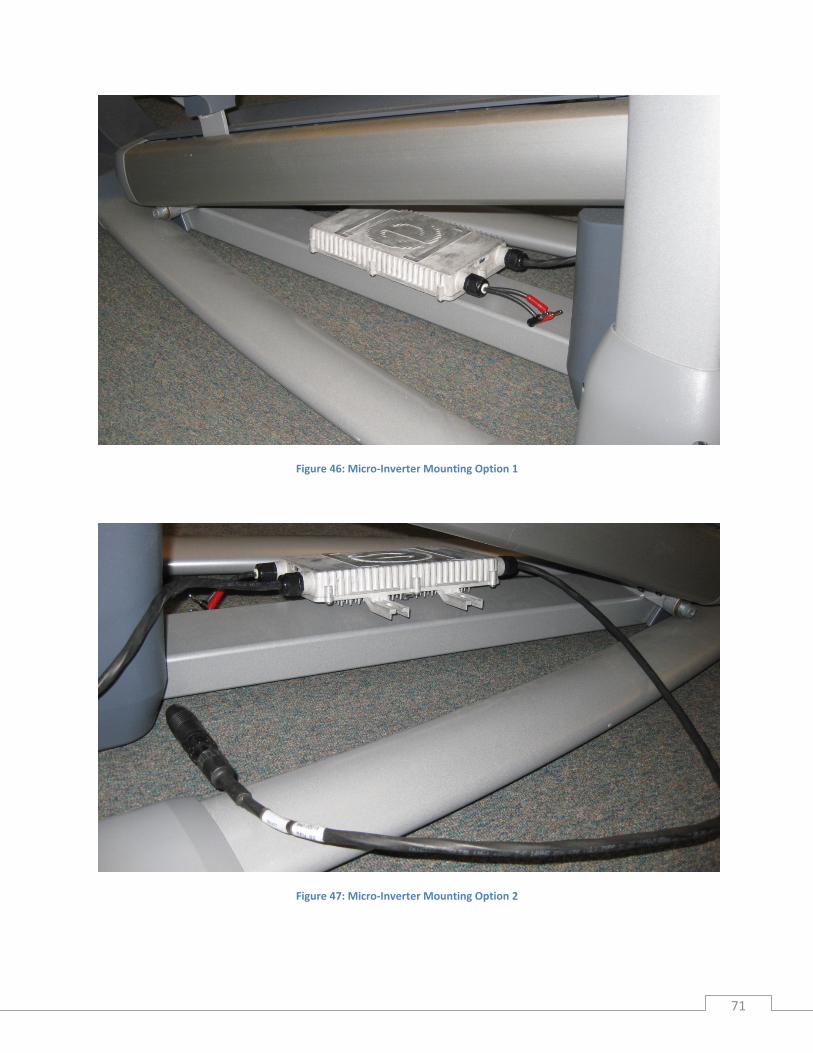
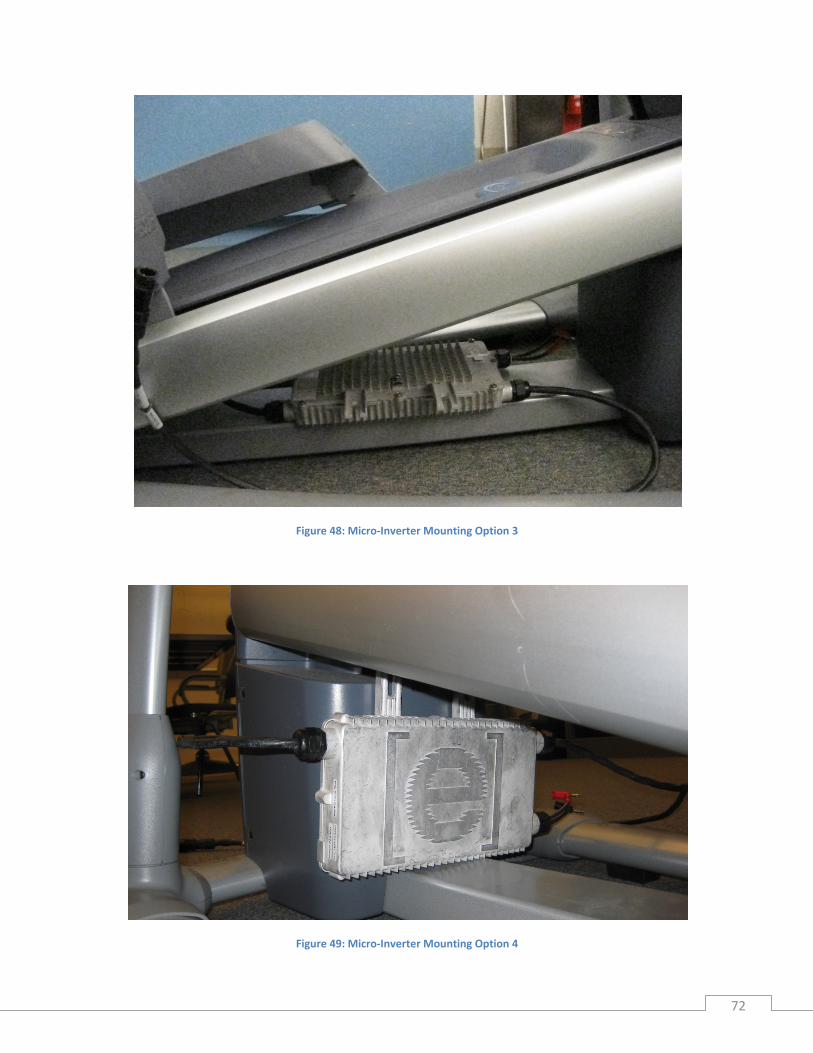
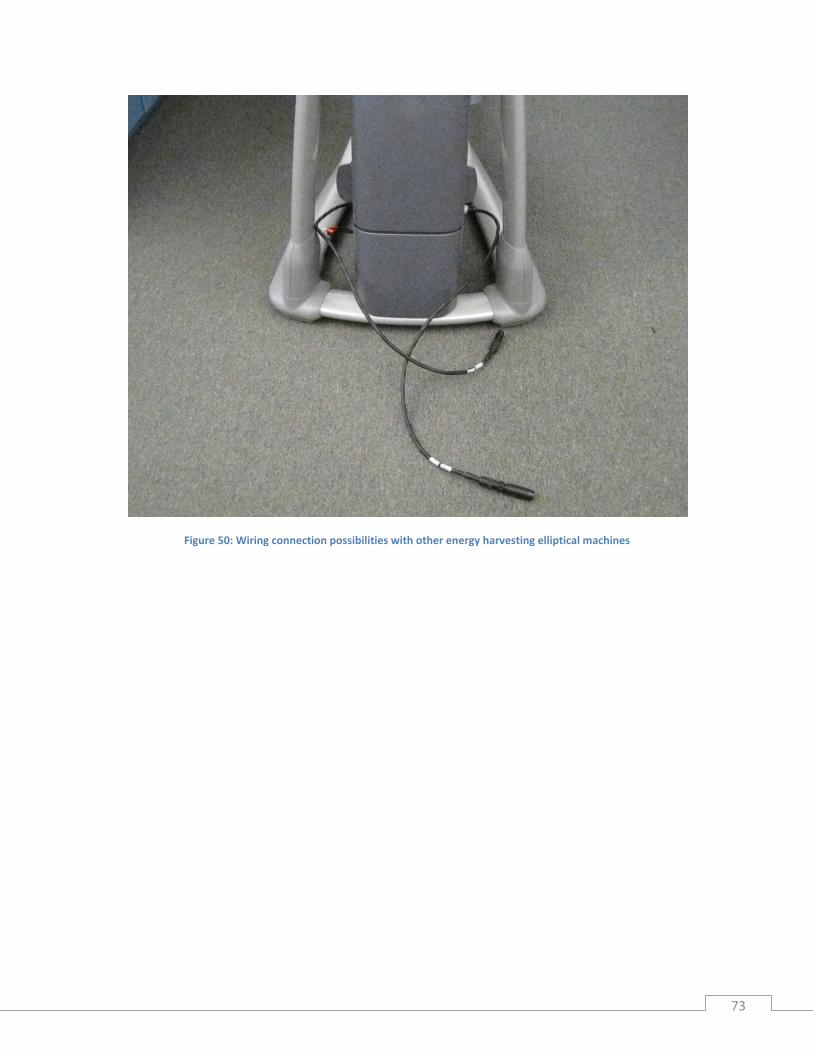
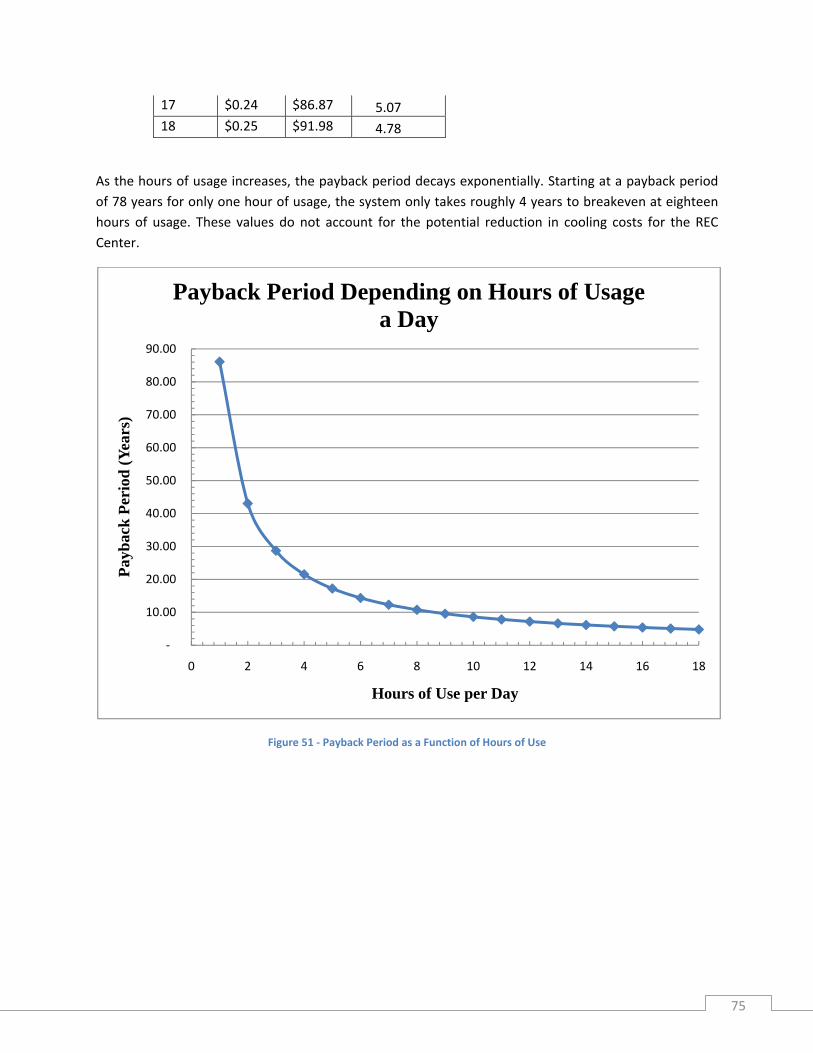
Figure 40: Vicor Maxi load test setup utilizing HP 6574A DC source and the Clarostat Resistor Box ........ 61 Figure 41: Vicor Maxi DC converter sourced by HP DC power source and loaded with the grid tied Enphase micro‐inverter .............................................................................................................................. 62 Figure 42: Inside of Enphase Micro‐Inverter .............................................................................................. 67 Figure 43: Physical dimensions of clearance under elliptical trainer track ................................................ 68 Figure 44: DC Converter Mounting Option 1 .............................................................................................. 69 Figure 45: DC Converter Mounting Option 2 .............................................................................................. 70 Figure 46: Micro‐Inverter Mounting Option 1 ............................................................................................ 71 Figure 47: Micro‐Inverter Mounting Option 2 ............................................................................................ 71 Figure 48: Micro‐Inverter Mounting Option 3 ............................................................................................ 72 Figure 49: Micro‐Inverter Mounting Option 4 ............................................................................................ 72 Figure 50: Wiring connection possibilities with other energy harvesting elliptical machines ................... 73 Figure 51 ‐ Payback Period as a Function of Hours of Use ......................................................................... 75
5
List of Tables
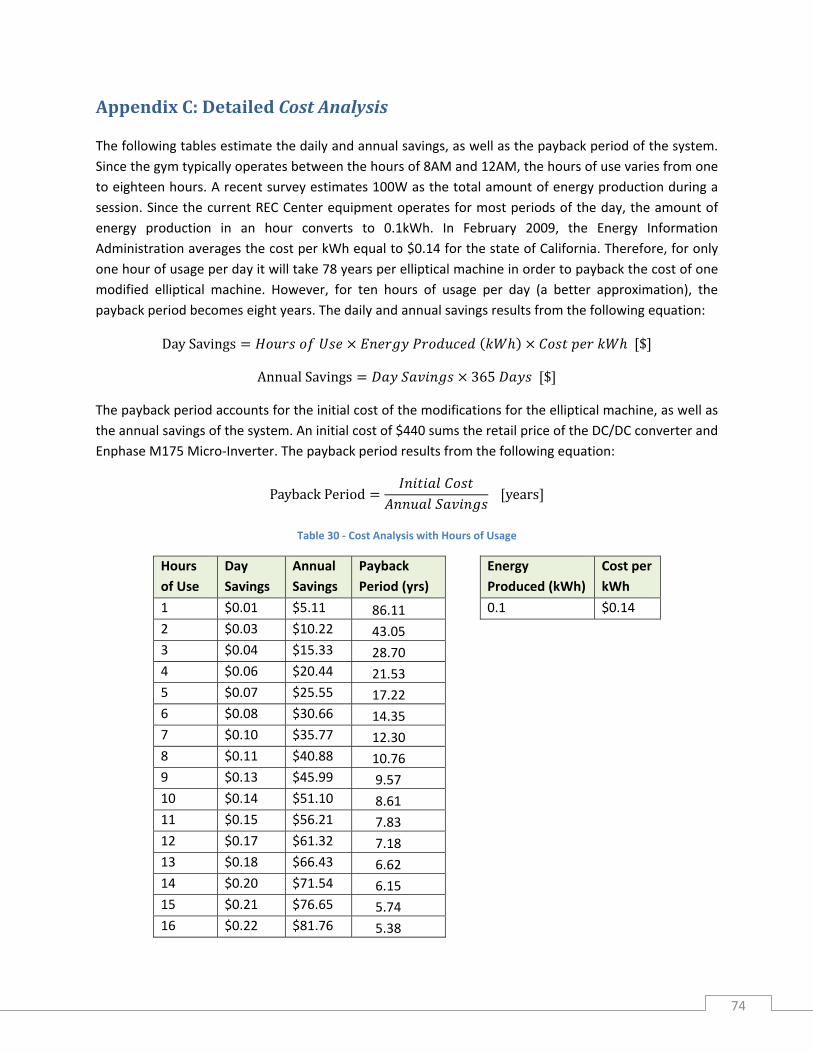
Table 1: Project expenses ........................................................................................................................... 14 Table 2: Cost estimate of elliptical machine with design modifications ..................................................... 17 Table 3: Focused Criteria of DC‐DC Converters .......................................................................................... 21 Table 4: DC Converter System Requirements ............................................................................................. 22 Table 5: Wilmore converter specifications ................................................................................................. 28 Table 6: Enphase micro‐inverter specifications .......................................................................................... 28 Table 7: Enphase device serial numbers ..................................................................................................... 28 Table 8: DC Converter Measurements ........................................................................................................ 29 Table 9: Micro‐inverter #2 Measurements ................................................................................................. 29 Table 10: Full system test results ................................................................................................................ 33 Table 11: Vicor Maxi DC converter pin assignments and specifications..................................................... 37 Table 12: DC Converter voltage characteristics .......................................................................................... 37 Table 13: Vicor Maxi V28A36T200BL2 current ratings ............................................................................... 39 Table 14: Elliptical to Vicor DC converter voltage characteristics .............................................................. 40 Table 15: Full System Test with Vicor DC converter results ....................................................................... 42 Table 16: Component measurements for test #10 ..................................................................................... 43 Table 17: Clarostat 240C Power Resistor Decade Box Specifications ......................................................... 45 Table 18: Vicor Maxi DC converter measurements under resistive load variation .................................... 45 Table 19: Wilmore DC converter measurements under resistive load variation ....................................... 45 Table 20: Vicor Maxi DC converter characteristics under resistive load .................................................... 47 Table 21: Vicor DC converter characteristics over wide range of load resistances .................................... 50 Table 22: Wilmore DC converter characteristics over wide range of load resistances .............................. 51 Table 23: Estimate of resistance at DC input of Enphase micro‐inverter ................................................... 54 Table 24: Electrical measurements of the input and output of the Vicor Maxi DC Converter when loaded with electronic load .................................................................................................................................... 56 Table 25: Electrical measurements of input and output of Vicor DC converter when sourced by elliptical and loaded with Clarostat ........................................................................................................................... 60 Table 26: Vicor Maxi over‐voltage specifications ....................................................................................... 60 Table 27: Electrical measurements of input and output of Wilmore DC converter when sourced by elliptical and loaded with Clarostat ............................................................................................................ 61 Table 28: VIcor maxi resistive loading test results using the HP DC source and the Clarostat decade box62 Table 29: Vicor Maxi test results when sourced by the HP DC power source and loaded with the Enphase micro‐inverter ............................................................................................................................................. 63 Table 30 ‐ Cost Analysis with Hours of Usage ............................................................................................. 74
6
Acknowledgments
We would like to thank everyone who contributed to this project.
• Paul Grierson for providing the Precor elliptical machine to Cal Poly’s EE department.
• Sharon Kirk and Curtis Kahnberg (Cal Poly Alumni) from Enphase for donating two Enphase micro‐inverters. Sharon helped troubleshoot the first micro‐inverter via the EMU when we experienced technical difficulties and identified the need for replacement. She consulted with anonymous departments within Enphase and provided a second micro‐inverter donation for us to continue testing
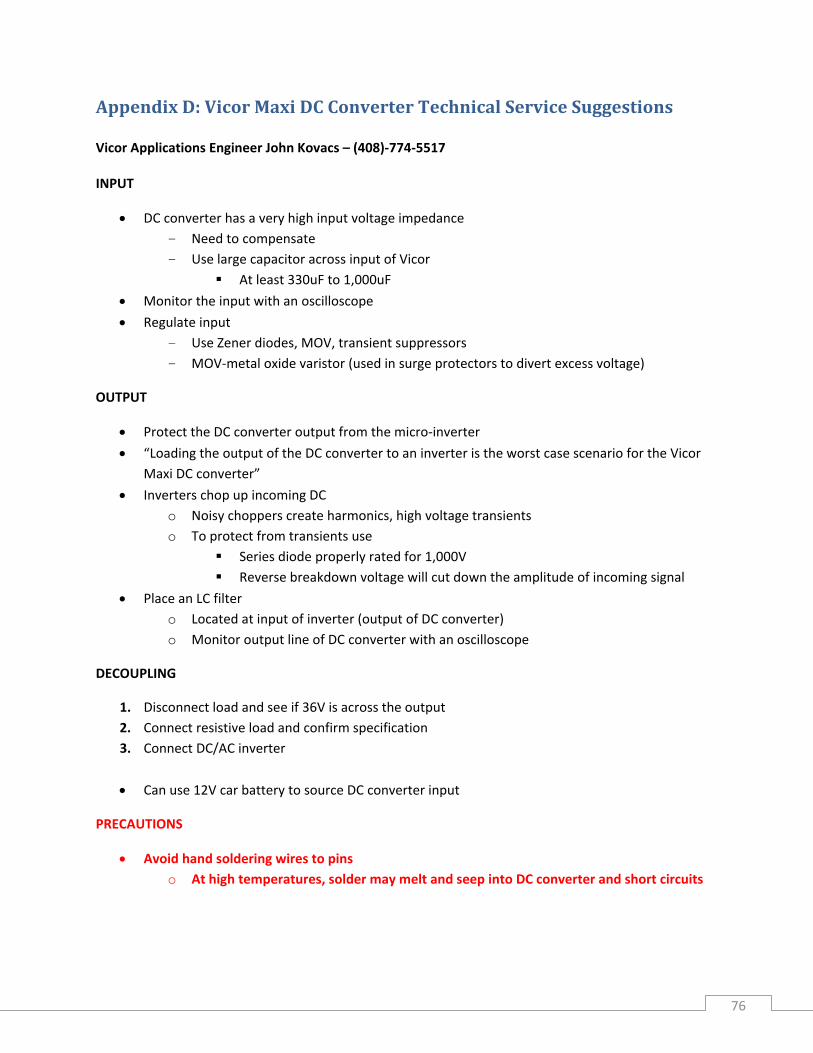
• John Kovacs, a technical engineer at Vicor, offered his assistance by answering questions, regarding the Vicor Maxi DC converter and provided suggestions in Appendix D.
• Thank you to Professors Braun, Dolan, Taufik, and Shaban for their assistance and instruction regarding this project.
7
8
Note to the Reader
Thank you for your interest in the Energy Harvesting from Elliptical Machines project. When reading this report, please note that the project continues the research and work completed in the first phase of the project, Energy Harvesting from Exercise Machines Self‐generating Elliptical Machines 1. For ease of access, the report appends the first phase of the project in Appendix F. Please read the two reports hand in hand; this report contains information concentrating on the alternative DC converter research and development while the previous report specifically documents the remaining system components as well as the overall project background. Also note that since Appendix F contains the previous report, the page numbers start over. Page number references to Appendix F will point to Appendix F’s page number system.
1 (Jonathan Chan)
9
Abstract In continuing the global effort to integrate innovative technology and renewable energy in the world’s power system, Cal Poly endeavors to harvest energy from elliptical machines and feed that power back into the electrical grid. This continuation of the previous project, Energy Harvesting from Exercise Machines Self‐generating Elliptical Machines2, seeks an alternative DC to DC converter to function within the existing elliptical self‐generating system. By attempting to implement this new DC to DC converter, the project strives to reduce the size of the converter in order to mount it on the elliptical machine. The project also tries to explain how the chosen company‐manufactured DC converter works completely isolated. It also studies the DC converter behavior within the system when connected between the Precor elliptical machine and Enphase micro‐inverter. In developing this self‐harvesting elliptical machine, Cal Poly hopes to incorporate an array of energy‐harvesting elliptical machines in its REC center expansion slated for completion in 2012.
2 (Jonathan Chan)
10
Chapter 1 Introduction Functional Requirements This project seeks to provide the ASI REC Center expansion project with a viable, experimental system design. In replacing the working Wilmore DC converter in the former system, the project intends to improve and optimize power generation to the grid as well as reduce physical size and bulkiness.
The following requirements mandate this system:
• Conform to all safety requirements outlined in UL 1741
• Conform to IEEE code 1547
• Conform to relevant safety requirements enforced by PG&E (state specific requirements)
• Conform to the National Electrical Code (NEC)
• No cost to ASI or Cal Poly
• No changes in original Precor elliptical experience
Please see the former project report, Energy Harvesting from Exercise Machines Self‐generating Elliptical Machines3, for details of the above safety codes.
Primary Constraints The following limiting factors govern and influence the approach of this project.
• Choosing an appropriate DC to DC converter that matches the wide input voltage range and outputs an appropriate amount of harvested power
• Interfacing the new DC to DC converter with other components of the system, i.e. the elliptical and micro‐inverter
• Ensuring that voltage and current levels never exceed component ratings
• Implementing a safe and code‐abiding method to connect the harvested energy back into the electrical grid.
The elliptical machine outputs a wide‐range of DC voltages and currents, which influence our search for an appropriate DC to DC converter. The input to the DC converter must withstand the current, voltage, and power the elliptical outputs. How the new DC to DC converter interacts with the additional components influences the range of operation. Individual component ratings determine this range of operation. We must closely monitor and determine the limits of our system, ensuring that the system never exceeds these boundaries. For the specific electrical limits, please see the desired DC converter specification in Table 4 on page 22 and the Enphase micro‐inverter specification in Table 6 on page 28.
Expected Problems We May Encounter The resistive coils located at the rear of the machine control the amount of opposing physical resistance for the user. At high resistance settings, the amount of heat dissipation increases. AC power supplying
3 (Jonathan Chan)
the magnetic generator provides power to the entire machine. An onboard converter changes the generated AC power into DC, which feeds into the onboard electronics (display board, heart monitor) as well as the resistive coils.
Tapping into the machine at the resistive coils poses questions about how it alters the user’s experience. Removing the resistors and connecting the tap in point to the input of the DC to DC converter changes the elliptical’s load. This change in load alters the electrical characteristics and mechanical resistance the user experiences. The project calls for identifying the deviation from standard elliptical operation and mitigation in reducing this change in user experience.
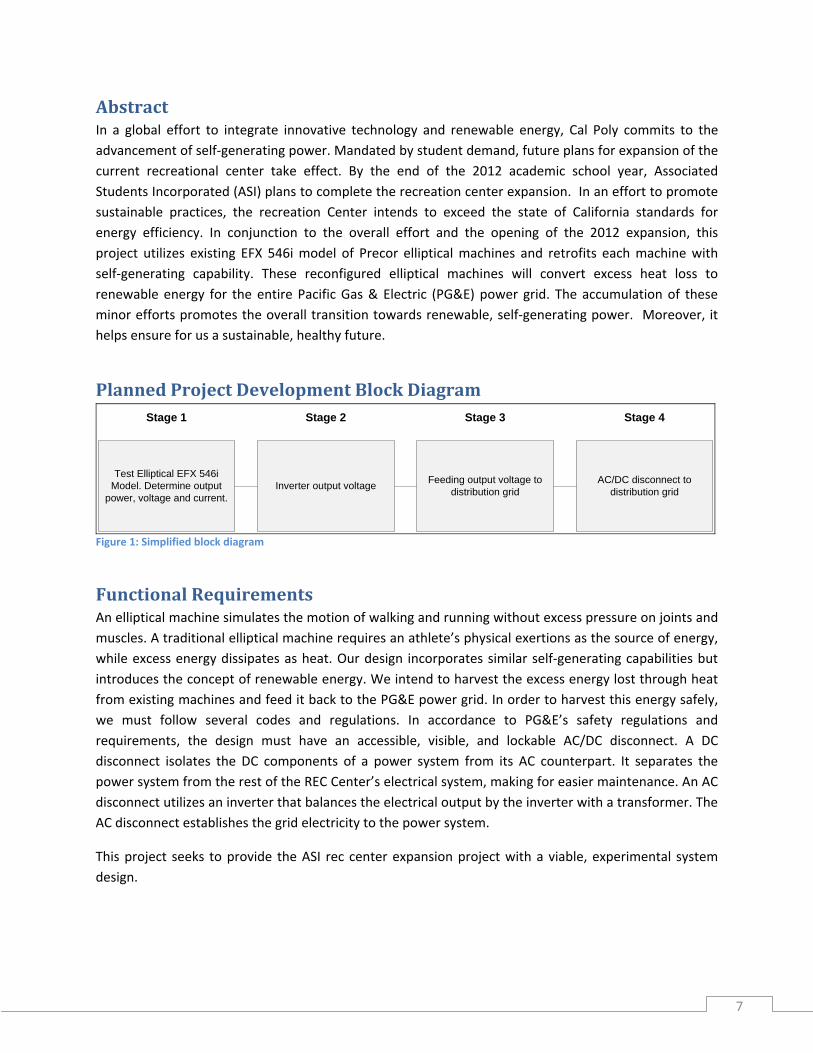
Overall System Design Concept Block Diagram
Figure 1: EHFEM system block diagram
With stages one, three, and four in place, this project concentrates on stage 2 and seeks to replace the existing Wilmore DC converter with a smaller and more efficient DC‐DC converter. Ideally, this reduction in size will allow for the mounting of the new converter in the existing resistor coil rack as shown in the section Vicor Maxi DC‐converter Mounting Options on page 23.
11
Chapter 2 Design & Project Planning
Figure 2: Project planning Gantt chart
12
13
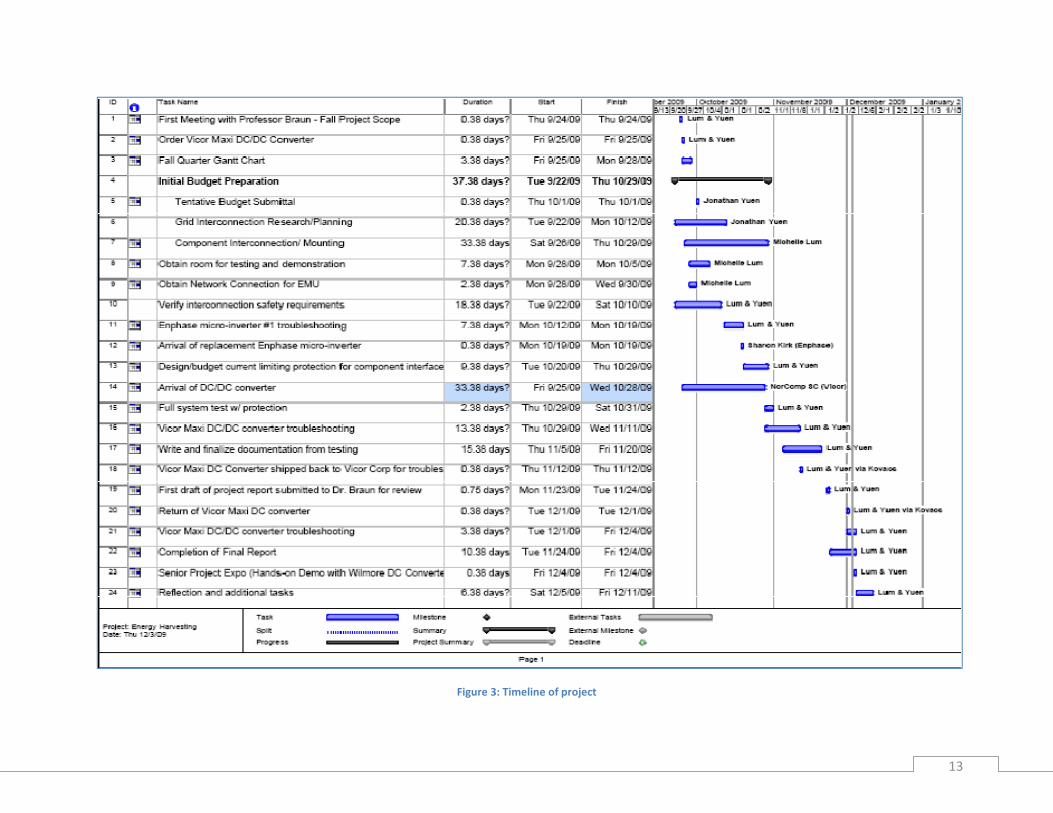
Figure 3: Timeline of project
Figure 2 shows the initially prepared Gantt chart for the second phase of Self‐generating Elliptical Machines project. Figure 3 shows the timeline of the milestones accomplished during the span of the project.
Economic
Project Expenses The replacement DC converter served as the main expense of this project. Minor costs include test leads, electrical tape, and protective fuses as listed below.
Table 1: Project expenses
Qty Item Description Retailer Manufacturer Part Number Unit Cost
Total Cost (tax included)
2 In Line Fuse Holder Radio Shack
2700015 $2.69 $5.85
1 Pk6 INS 10‐12MFQD(Male to Female Connectors)
Radio Shack
6403135 $1.99 $2.16
2 Electrical Tape for Coding Electrical Outlet
Fry's Freezer Flex 2804924 $1.29 $2.83
2 Solderless Stackup Banana Plug with Safety Shield
Fry's Pomona 2371429 $2.99 $6.56
1 Blade Fuses, 5 count Auto Zone
Bussman 32365 $3.99 $4.34
1 Vicor Maxi 28V Wide Input DC converter
Vicor Corp.
Vicor Corp. V28A36T200BL2 $208.00 $231.62
1 2nd Day 3PM Return Shipping of DC Converter to Vicor Corp.
USPS EH756706669US $17.50 $17.50
Total $270.87
Sources of Project Funding
HuSel – Cal Poly Humanitarian Service Learning Competition – Main Contributor The HuSel competition awards students involved in humanity research through clubs, class, or senior projects. All research needs to focus on humanitarian efforts, conducted as a team effort, and a structured timeline for completion. Competition advisors judge each proposed research on innovation, potential impact, and feasibility. All nominees receive an initial $500 contribution towards their research. The top three winners receive an additional $500 reimbursement for project expenses.
On April 29, 2009, the Energy Harvesting from Elliptical Machines (E.H.F.E.M) became a nominee by the HuSel honors program. The initial $500 contributed to the purchase of the Enphase energy management unit (EMU). With the funding only supporting about a fraction of the total cost, extra motivation compelled us to be one of the top three nominees. The concept of energy harvesting competed against humanity research associated with filtering clean drinking water and efforts against human trafficking. At the presentation ceremony on June 3rd, 2009, E.H.F.E.M and the concept of reharvesting energy for
14
15
Cal Poly received the honor and winning title of third place. An additional $500 contribution supports funding for a suitable DC/DC converter for the final design.
Administrative Problems with Obtaining Project Funding The project anticipated on purchasing the replacement DC converter early during the Summer of 2009 by using the HuSel award contribution of $500 to purchase a DC converter; however, anonymous Cal Poly administrators seized the award money from state accounts to pay off department deficits. This delayed the purchasing of the new DC converter until after the start of the Fall 2009 quarter due to the absence of this funding and unresolved indication of ever receiving reimbursement. Expenses came out‐of‐pocket and after four months efforts to obtain reimbursement are still ongoing.
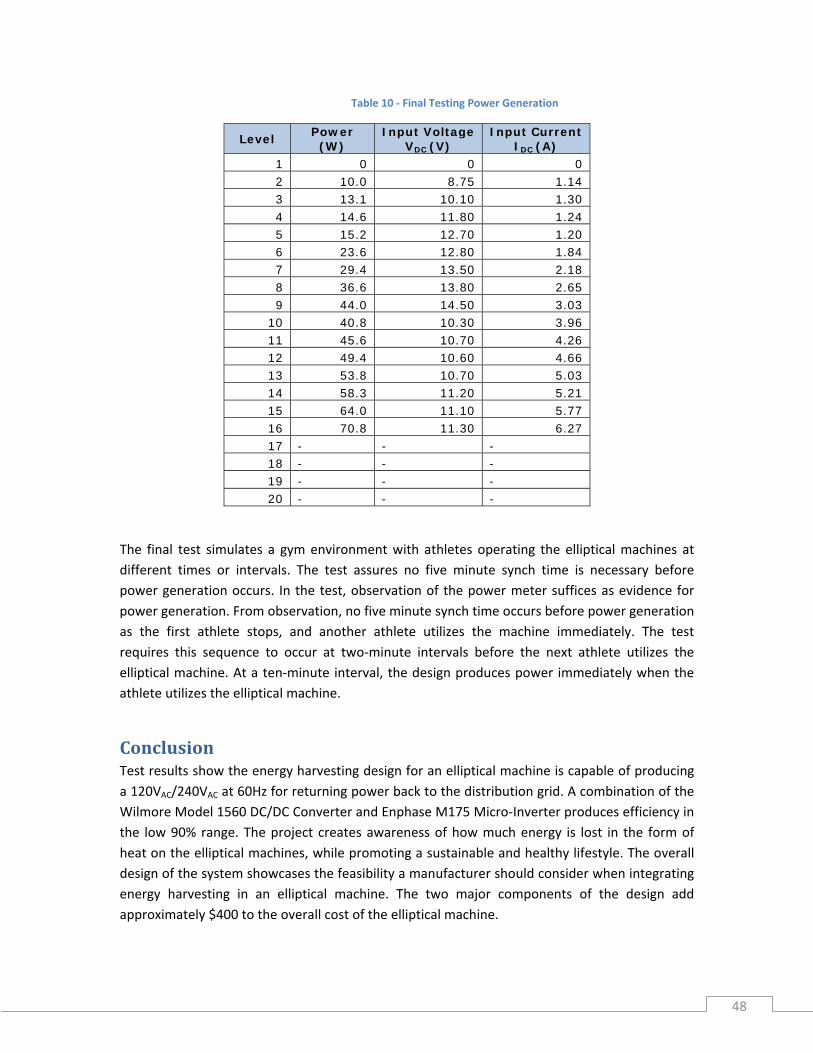
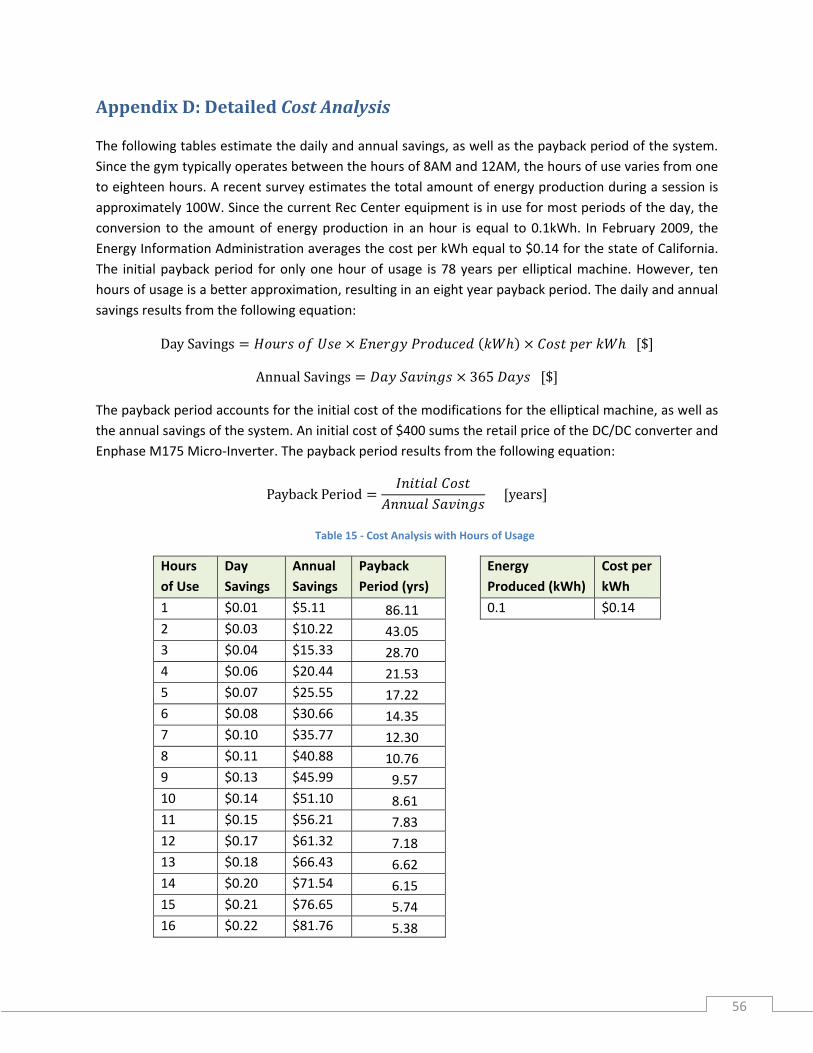
Energy and Cost Analysis The Enphase M175 Micro‐Inverter and DC/DC converter contribute to the major costs of the system. Each elliptical machine requires the two components in order to harvest energy. The Envoy EMU allows for administration control and monitoring and is not vital to the overall system. Modified elliptical machines require a total cost of approximately $440. See Table 2 for the list of modified system expenses.
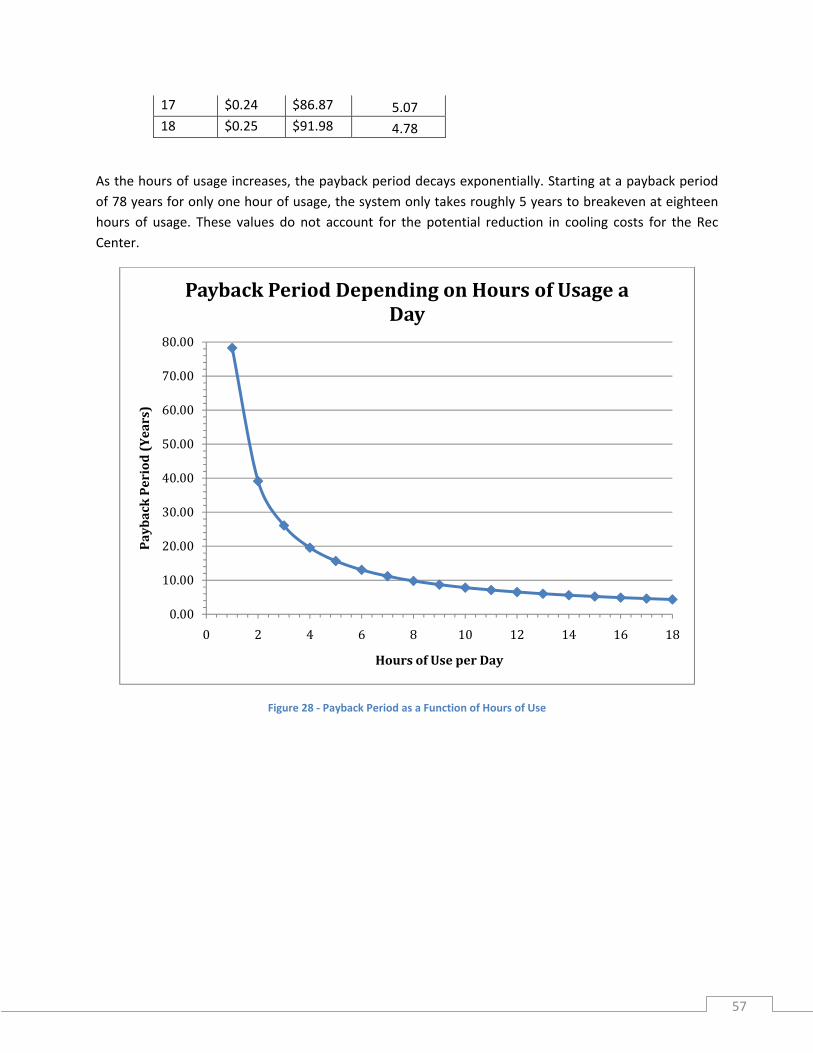
Estimating the cost savings relies on three quantitative assumptions. These assumptions include ten hours of usage during the day, a production of about 0.100kWh, and $0.14 per kWh as the price of electricity. Under these assumptions, each modified elliptical machine saves approximately $0.14 a day. At a day savings of $0.14, and seven days a week of operation, the payback period is about eight years. However, the savings do not reflect the additional savings in cooling costs for the REC Center with the removal of the resistor coils that dissipate heat.
Refer to Appendix C for a detailed cost analysis.
If Manufactured on a Commercial Basis Under the current financial crisis, several news sources report the decline in fitness equipment sales. The Sporting Goods Manufacturers Association reports in their press release in October 2009 that “for the first time in 20 years overall sales in the fitness equipment industry took a ‘hit’.” However the release states “participation rates were stronger in some activities” and the “two top attractions” that “generate the most sales are treadmills ($870 million) and elliptical machines ($687 million).”4 Also worth noting, “the home fitness market is roughly three times as big as the institutional market.”5 From this report, general sales trends of elliptical machines due to its popularity seem to generate revenue despite the touch economic crisis. Moreover, as more and more consumers purchase machines for personal use over gyms and recreational clubs, the idea of lowering their household electric bill may deem attractive.
4 (SGMA) 5 (SGMA)
16
An article, Fitness Equipment Sales Decline, by Club Industry reaffirms the decrease in sales “for institutions such as health clubs, universities, and military facilities due to a struggling economy.” “Sales fell 9.4 percent to $1.04 billion in 2008, down from $1.14 billion in 2007.” Club Industry also reports “big‐ticket cardio items experienced a greater decline than strength equipment.” With the migration towards personal purchased equipment rather than public facilities, the article quotes, marketing director Liz Binchi, “I think it’s very clear that the majority of club owners are opening fewer clubs, and, therefore, the level of equipment purchasing is down.”6 Based on the overall global trends, the following shows relevant estimates in manufacturing and selling an energy harvesting elliptical machine system.
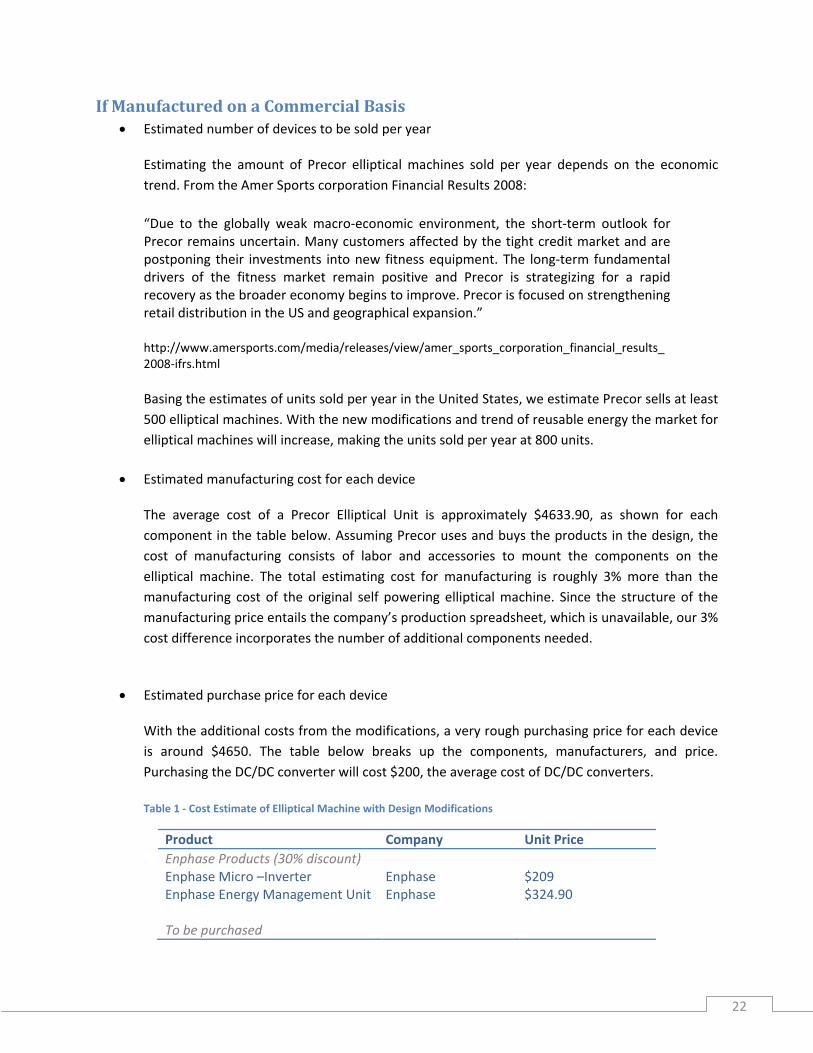
• Estimated number of devices to be sold per year Although we contacted Precor for an estimate of their yearly sales, we received no response to our inquiry. As in the previous report, we estimate that Precor sells at least 500 units of the EFX 546i model elliptical machine. Despite the tough economic hardships and decreases in sales as referenced from the articles above, we estimate that consumers will find the modified renewable energy feature of the machine attractive, increasing sales to between 650‐800 units annually.
• Estimated manufacturing cost for each device
Method 1
With the additional components to the Precor elliptical design, the manufacturing cost for each harvesting capable elliptical machine increases by an estimated 3% of Precor’s original manufacturing t (unkno ). cos wn
1 0.03
Method 2
Alternatively, in order to make a 35% profit margin the manufacturing of a single modified elliptical machine should cost 65% of the purchasing price ($4066) to manufacture as seen in able 2. The equation below calculates this amount. T
$4,666 1 0.35 $3032.90
6 (Bloyd)
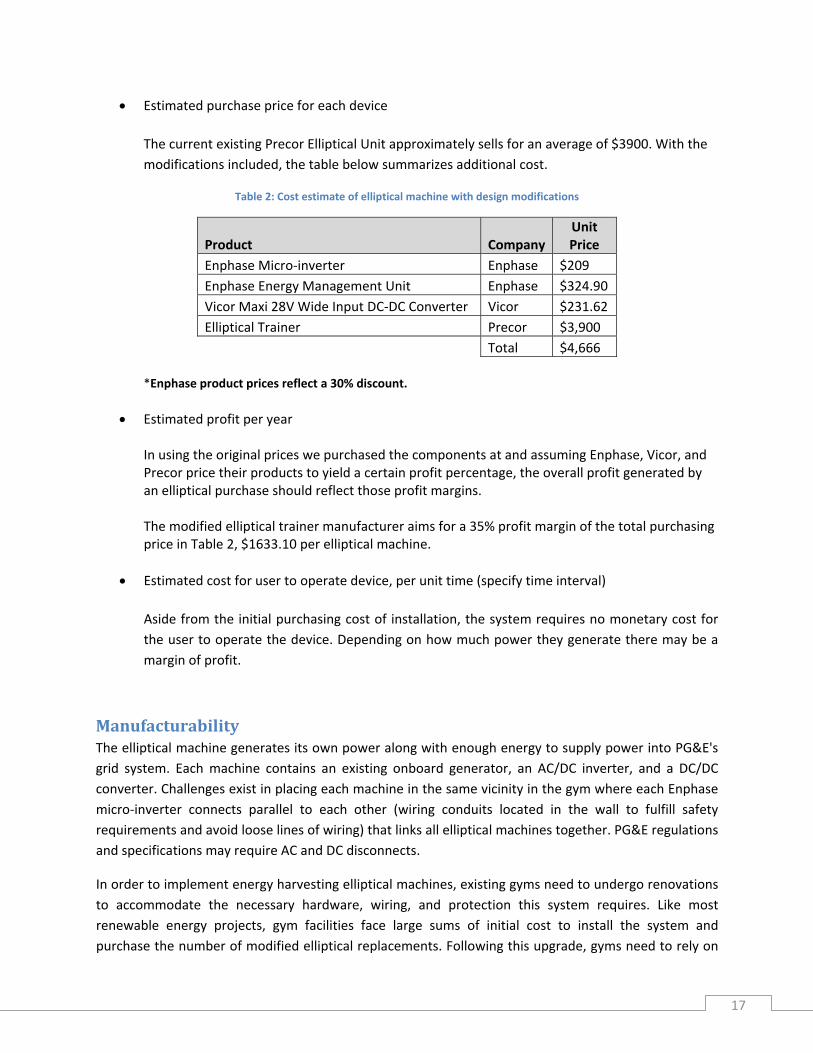
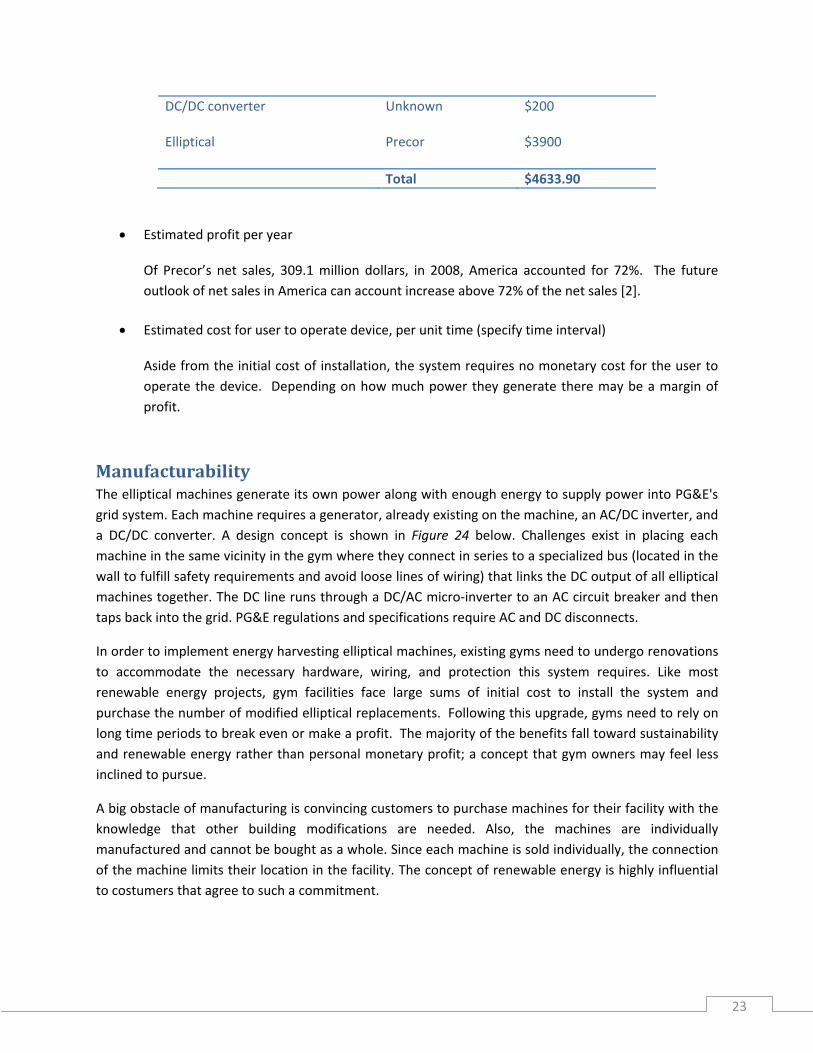
• Estimated purchase price for each device The current existing Precor Elliptical Unit approximately sells for an average of $3900. With the modifications included, the table below summarizes additional cost.
Table 2: Cost estimate of elliptical machine with design modifications
Total $4,666 *Enphase product prices reflect a 30% discount.
• Estimated profit per year
In using the original prices we purchased the components at and assuming Enphase, Vicor, and Precor price their products to yield a certain profit percentage, the overall profit generated by an elliptical purchase should reflect those profit margins. The modified elliptical trainer manufacturer aims for a 35% profit margin of the total purchasing price in Table 2, $1633.10 per elliptical machine.
• Estimated cost for user to operate device, per unit time (specify time interval)
Aside from the initial purchasing cost of installation, the system requires no monetary cost for the user to operate the device. Depending on how much power they generate there may be a margin of profit.
Manufacturability The elliptical machine generates its own power along with enough energy to supply power into PG&E's grid system. Each machine contains an existing onboard generator, an AC/DC inverter, and a DC/DC converter. Challenges exist in placing each machine in the same vicinity in the gym where each Enphase micro‐inverter connects parallel to each other (wiring conduits located in the wall to fulfill safety requirements and avoid loose lines of wiring) that links all elliptical machines together. PG&E regulations and specifications may require AC and DC disconnects.
In order to implement energy harvesting elliptical machines, existing gyms need to undergo renovations to accommodate the necessary hardware, wiring, and protection this system requires. Like most renewable energy projects, gym facilities face large sums of initial cost to install the system and purchase the number of modified elliptical replacements. Following this upgrade, gyms need to rely on
17
long time periods to break even or make a profit. The majority of the benefits fall toward sustainability and renewable energy rather than personal monetary profit, a concept that gym owners may feel less inclined to pursue.
Convincing customers to purchase machines for their facility with the knowledge that other building modifications are needed remains a big obstacle. Also, the system components are individually manufactured and cannot be bought as a whole. Therefore, the interconnection of the machines limits their location in the facility. The concept of renewable energy is highly influential to costumers that agree to such a commitment.
In order to accommodate energy harvesting capabilities on the current design of Precor elliptical machines, manufacturers will remove the resistive coils located at the back of the machine and use that space to mount a wide input DC converter approximately measuring 4.6 x 2.2 x 0.5 in.
Environmental Please see page 23 of Appendix F Energy Harvesting from Exercise Machines report for details regarding how the project as a whole impacts environmental issues.
Sustainability Please see page 24 of Appendix F Energy Harvesting from Exercise Machines report for details regarding how the project as a whole impacts sustainability issues.
Ethical Please see page 25 of Appendix F Energy Harvesting from Exercise Machines report for details regarding how the project as a whole impacts ethical issues.
Health and Safety Please see page 25 of Appendix F Energy Harvesting from Exercise Machines report for details regarding how the project as a whole impacts health and safety issues.
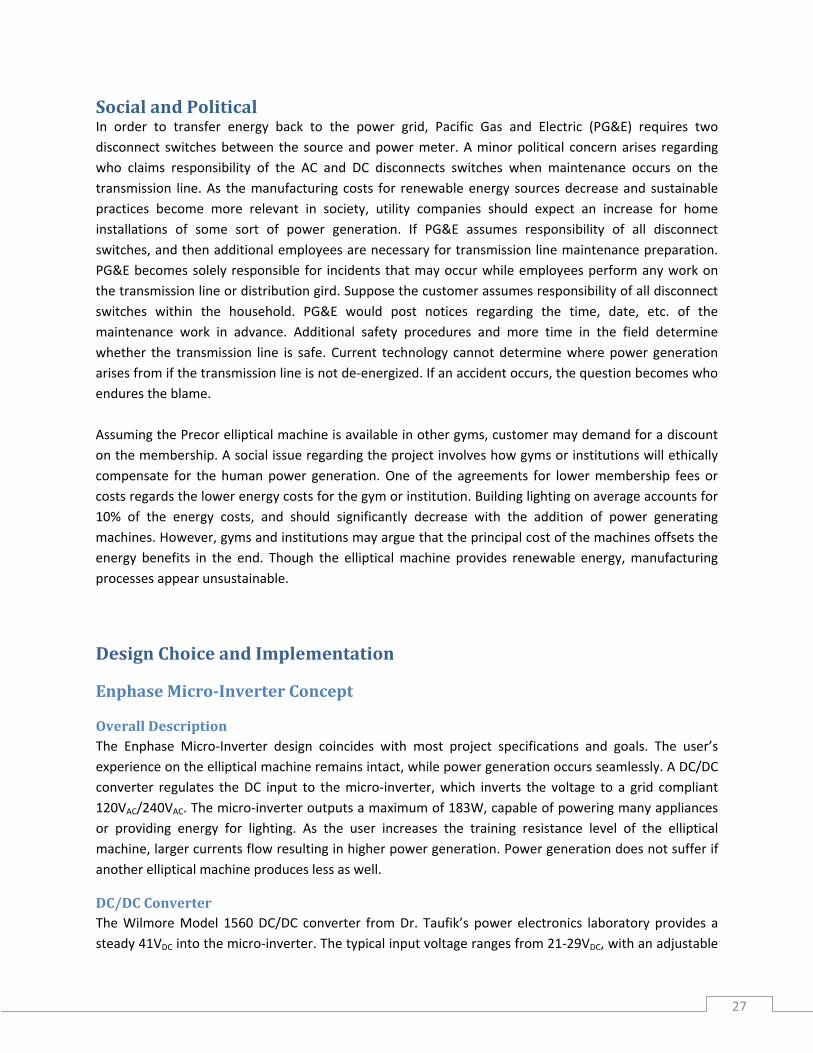
Social and Political Please see page 26 of Appendix F Energy Harvesting from Exercise Machines report for details regarding how the project as a whole impacts social and political issues.
Design Choice and Implementation
Overall System Description The Enphase Micro‐Inverter and the Precor elliptical machine dictate the DC converter specifications and requirements. Under this DC converter, the user’s experience on the elliptical machine should remain intact, while power generation occurs seamlessly. This DC/DC converter regulates the DC input to the micro‐inverter, which inverts the voltage to a grid compliant 120VAC/240VAC. The micro‐inverter outputs a maximum of 183W, capable of powering many appliances or providing energy for lighting. As
18
19
the user increases the training resistance level of the elliptical machine, larger currents at higher voltage levels flow resulting in higher power generation. Power generation does not suffer if another elliptical machine produces less as well. The following sections explain the decision‐making process in finding and choosing an appropriate DC converter that fits within this system.
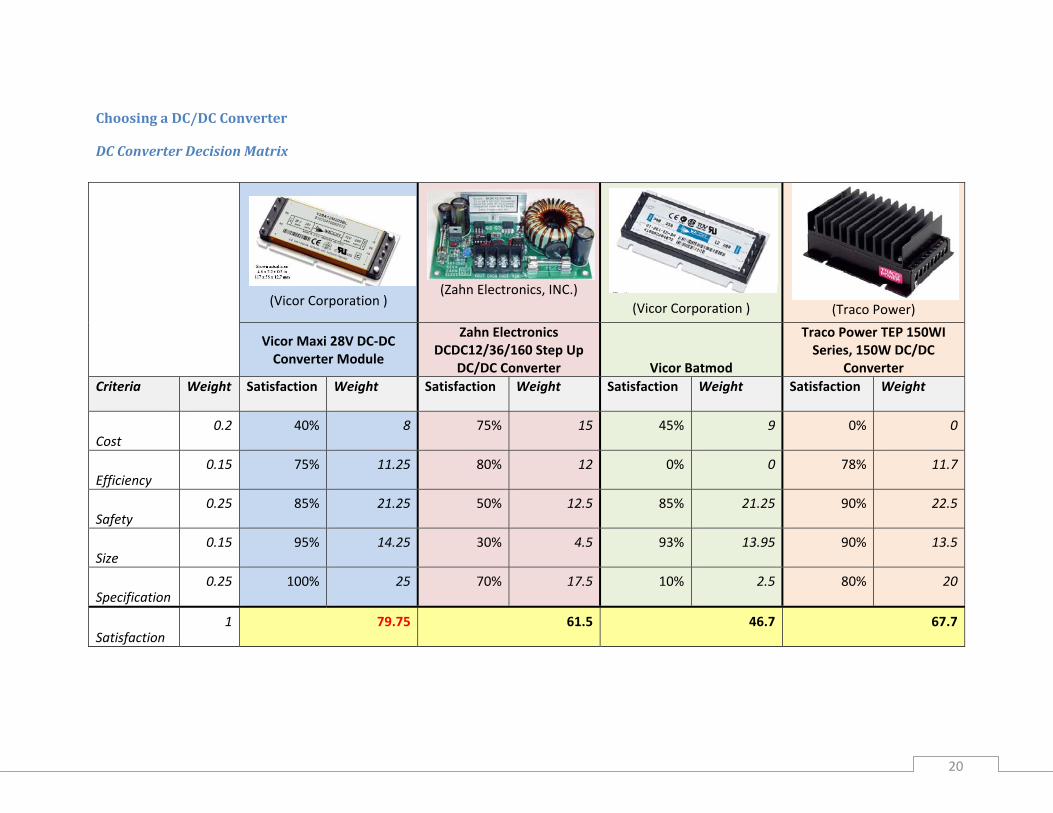
DC Converter Options Searching and research yielded four different off‐the‐shelf DC‐DC converters to implement into our system.
• Vicor Maxi 28V DC‐DC Converter Module • Zahn Electronics DCDC12/36/160 Step Up DC/DC Converter • Vicor Batmod • Traco Power TEP 150WI Series, 150W DC/DC Converter
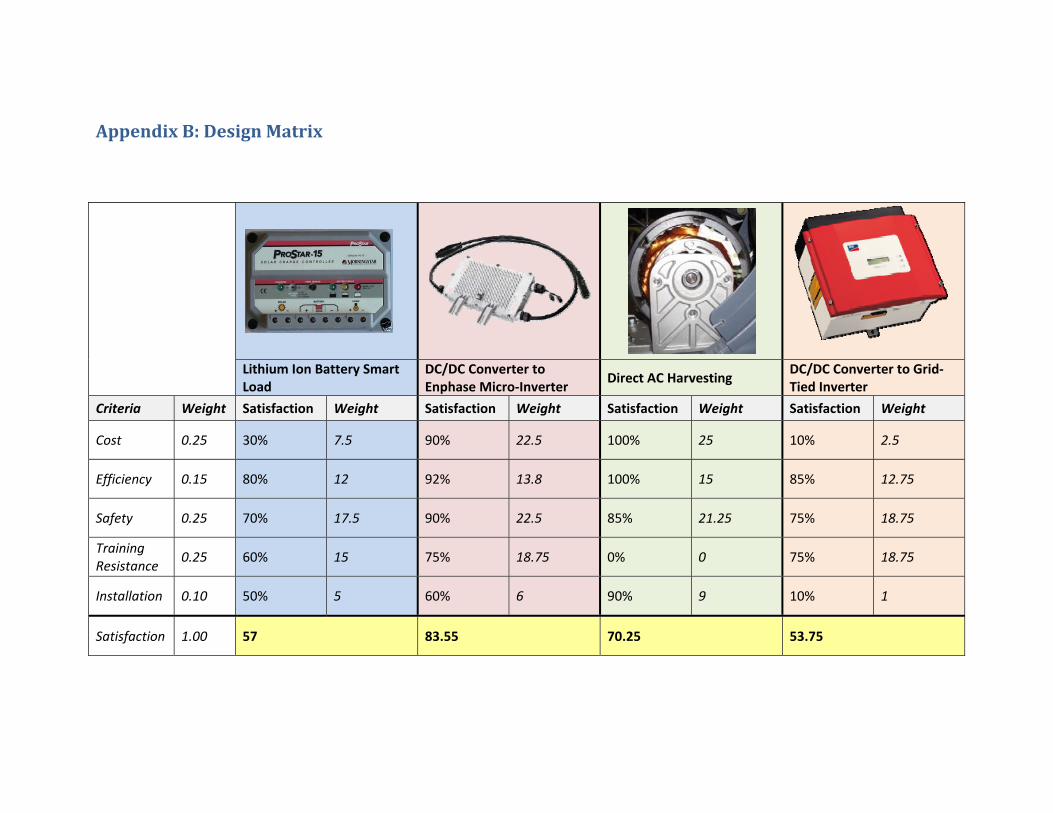
The screening process of the converter utilized the DC‐DC converter decision matrix. This matrix consists of the following criteria, which are weighted according to significance.
*Traco Power representatives refused to share the price of a single TEP 150WI Series, 150W DC/DC Converter
Cost Good engineering practices promote minimizing the cost of components. Ideally, we select the one component that achieves the desired functions at the least cost. However, in reviewing the other criteria, three of the four DC converters did not entirely match the desired specifications. The Vicor Maxi matched specification; however, it was the most expensive making cost not the ultimate deciding factor in choosing our DC converter. In choosing our DC converter, the Vicor Maxi’s functionality superseded its cost.
21
Efficiency The efficiency of the DC converter shows how much of the initial power input into the converter flows out of the output. Similar to cost, the selected Vicor Maxi did not hold the highest efficiency rating. The Zahn Electronics DCDC12/36/160 Step Up DC/DC Converter held the highest efficiency at 89%.
Safety With hazardous current levels entering and leaving the DC converter module, we studied the safety features and identified potential risk factors on each of the converter options. We looked at the pin layouts of each module for adequate insulation around hazardous energized conductors. The Vicor products require connection to vertical onboard pins that require additional insulation if used. The Zahn Electronics DC converter requires onboard connection using solder; the Traco Power converter utilizes screw terminal connections that are not fully insulated. We rated the Traco Power converter the highest safety satisfaction in our decision matrix since it contains the least amount of exposed wire.
Size A small volume DC converter will allow for the mounting of the device onto the back pillar of the elliptical machine. Therefore, we sought for a reasonable volume that would enable mounting. Outlined in our decision matrix, the Vicor Maxi sizes the smallest. The other converters expand roughly the same area; however they are slightly thicker and would stick out more from the pillar.
Specification (Deciding Factor) The DC‐DC converter interfaces between with the DC elliptical output and the micro‐inverter. This dictates the need to match the following specifications.
Table 4: DC Converter System Requirements
Input Voltage 8‐36V Max Input Current 5A Output Voltage 36V Output Power 200W
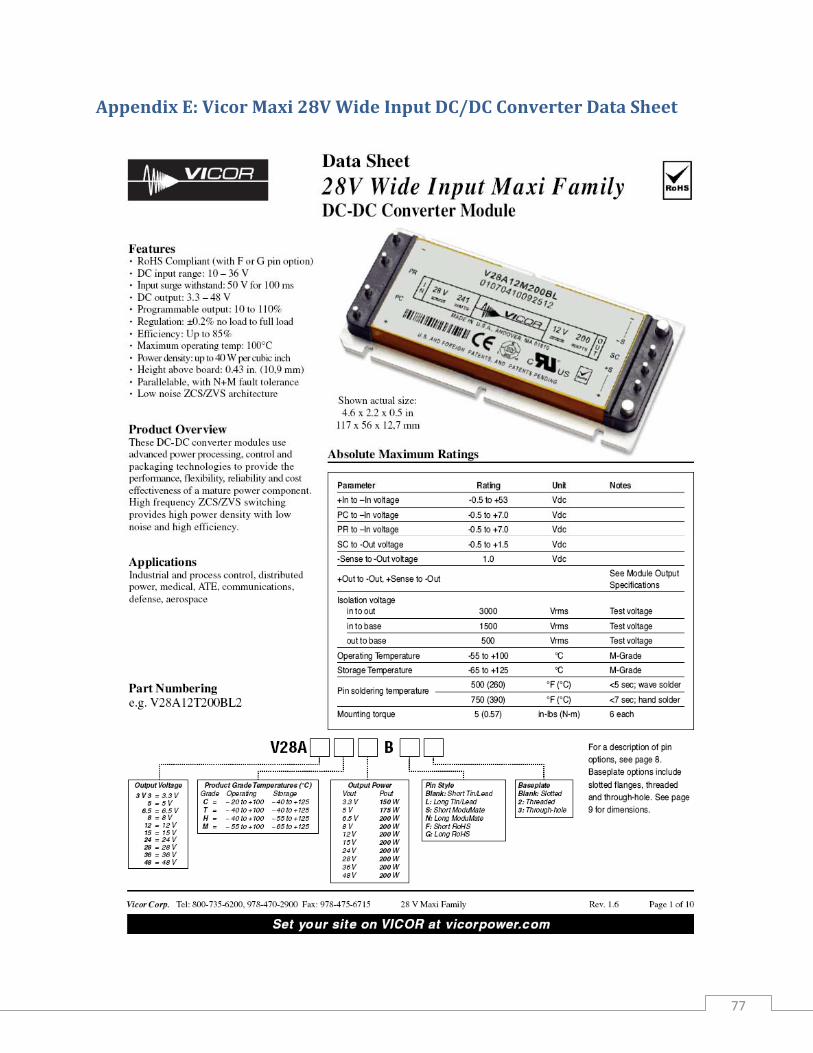
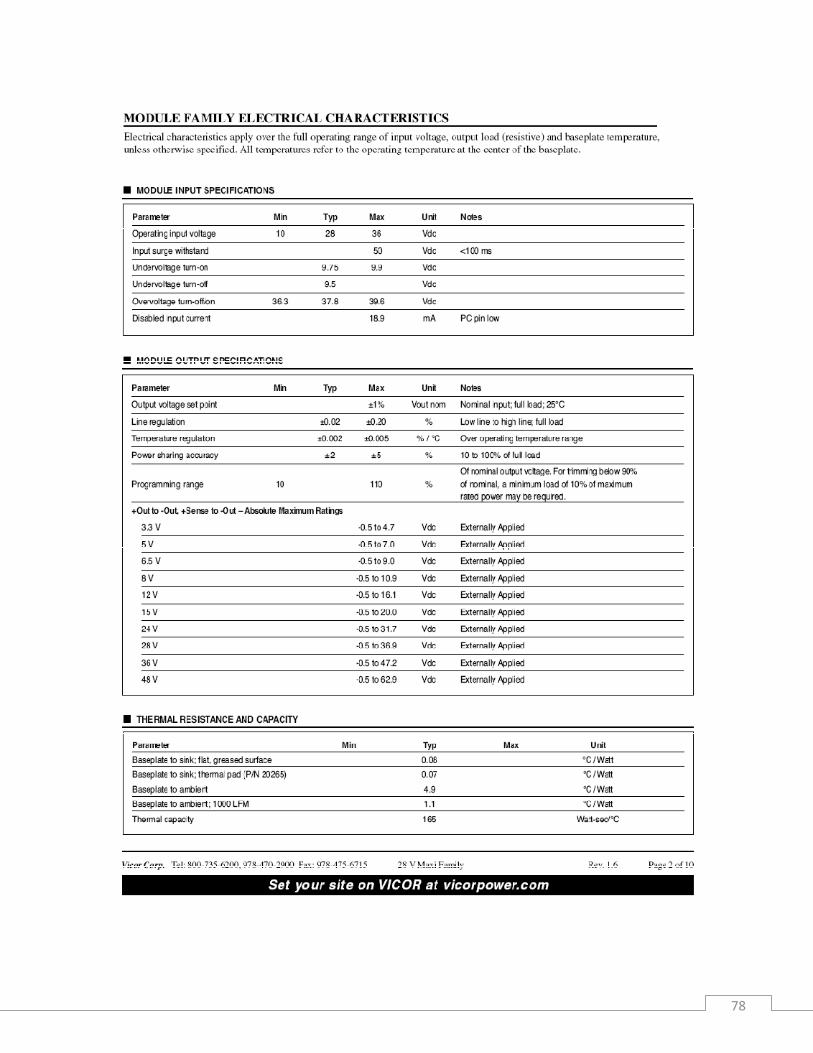
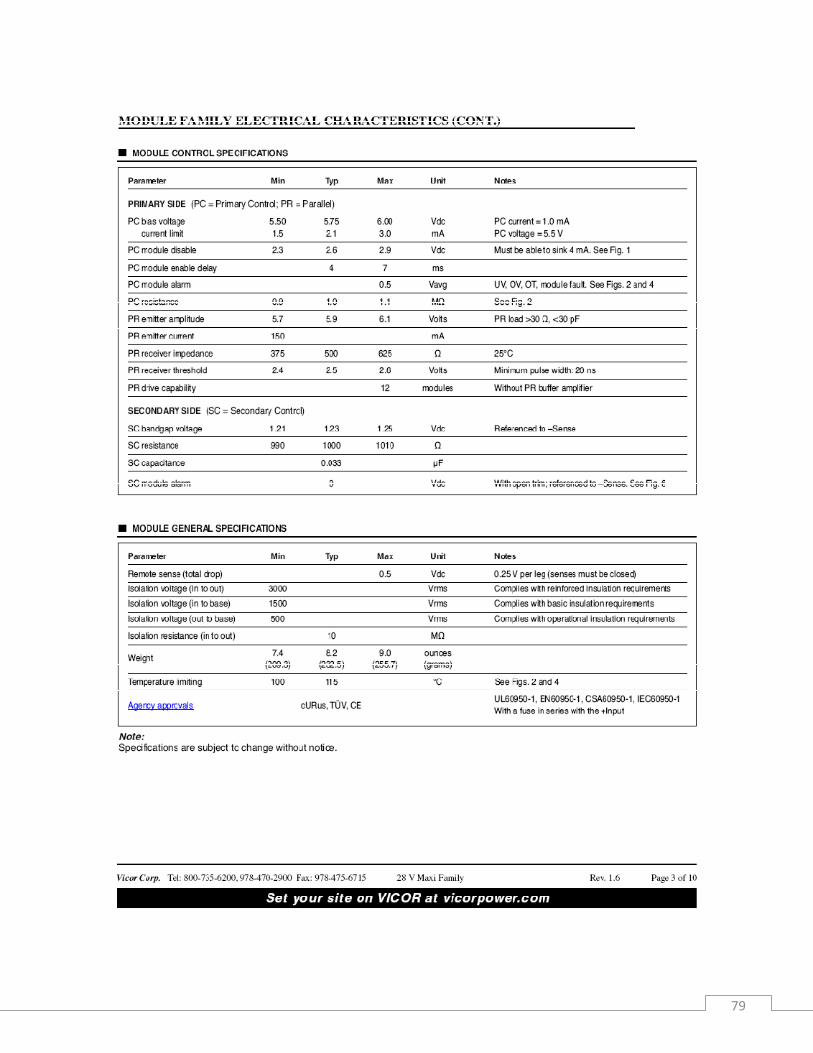
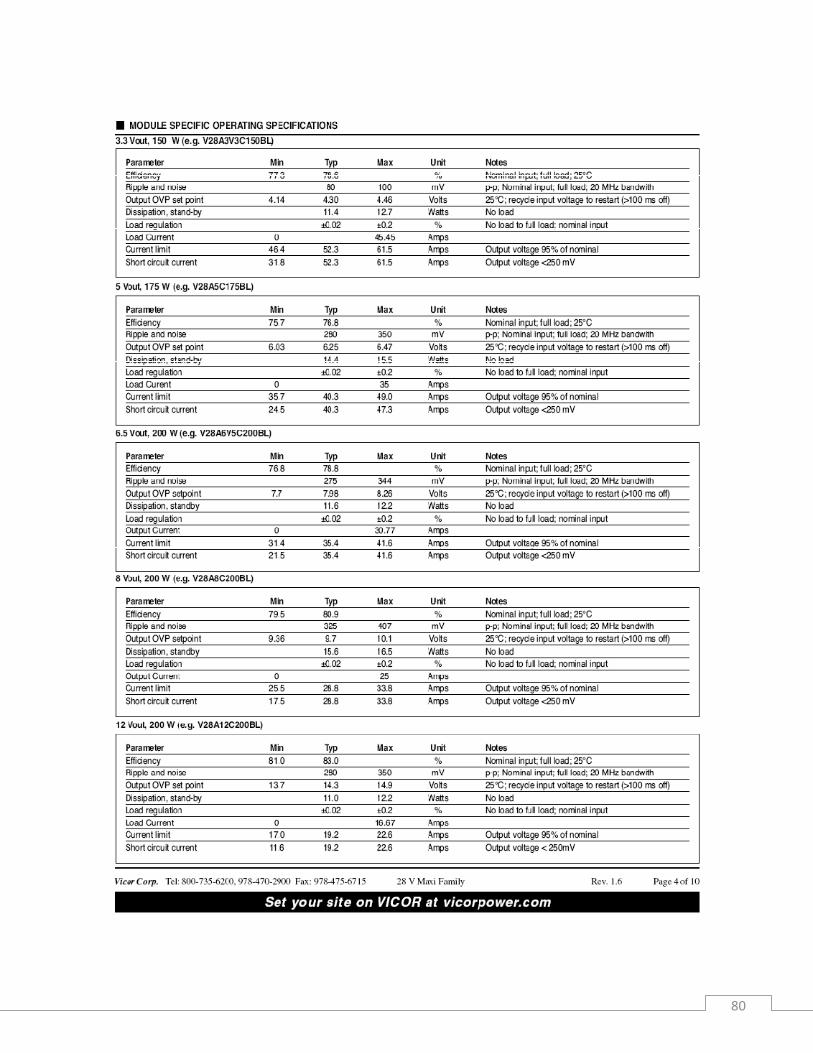
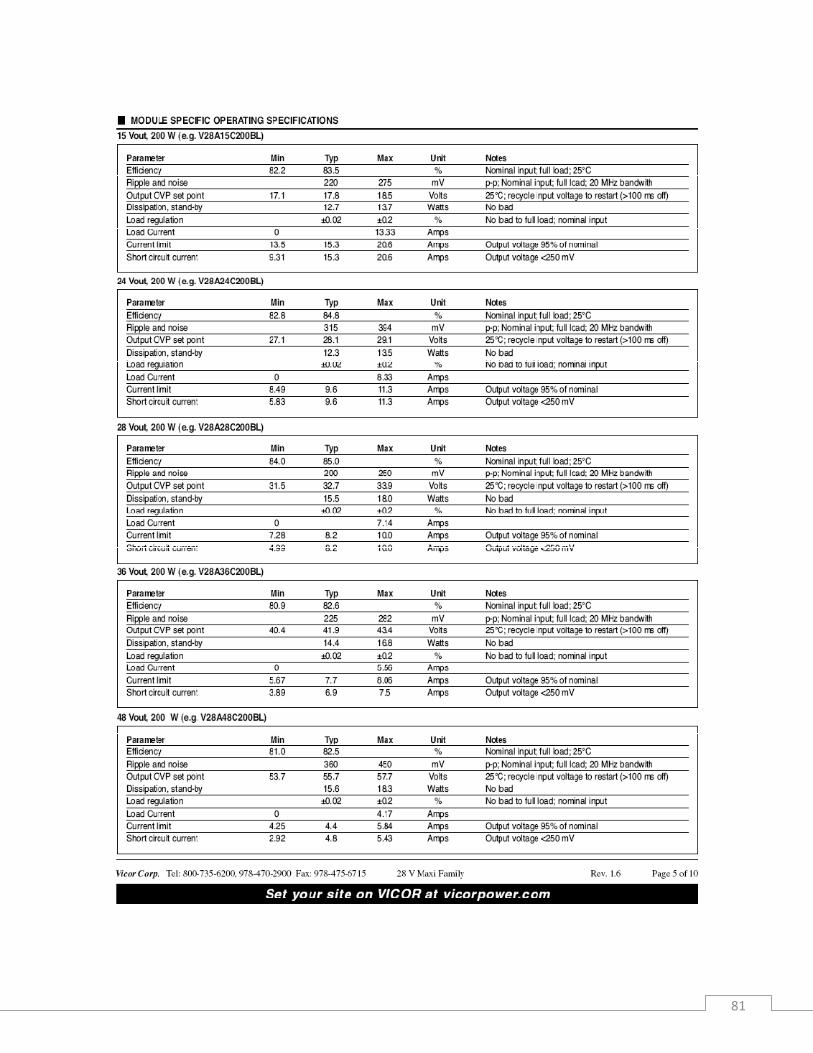
The Vicor Maxi 28V DC‐DC Converter module closely matches these specifications. Some of the other modules considered may have higher efficiencies; however they hold limited input and output voltage ranges. The micro‐inverter operates best with a constant 36V input, highlighting the need for a constant 36V DC converter output. Since the project seeks to maximize power harvesting, it makes sense to maximize DC‐converter output power. Therefore the Vicor Maxi succeeds in its capability of outputting the largest amount of power among the four DC converters, 200W. Overall, matching the desired specifications proved as the deciding factor in deciding to employ the Vicor Maxi 28V DC‐DC converter module. Appendix E includes the data sheets for the Vicor Maxi 28V DC‐DC converter module.
22
Vicor Maxi DCConverter Mounting Options
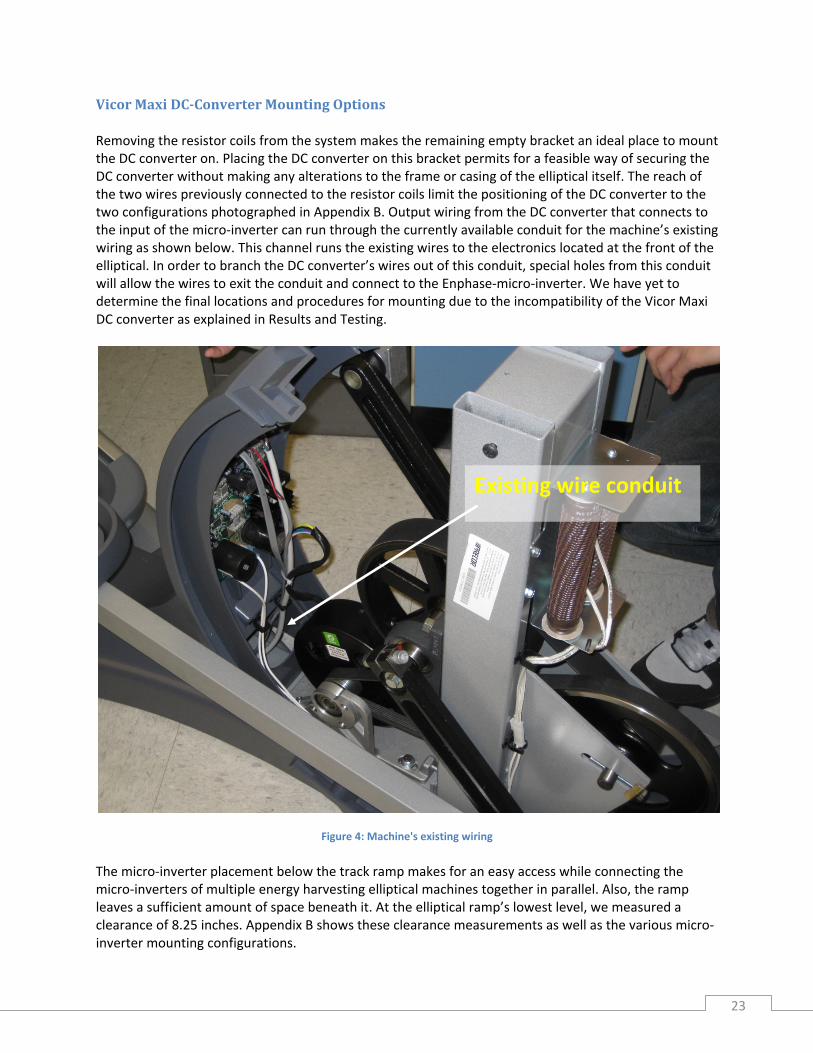
Removing the resistor coils from the system makes the remaining empty bracket an ideal place to mount the DC converter on. Placing the DC converter on this bracket permits for a feasible way of securing the DC converter without making any alterations to the frame or casing of the elliptical itself. The reach of the two wires previously connected to the resistor coils limit the positioning of the DC converter to the two configurations photographed in Appendix B. Output wiring from the DC converter that connects to the input of the micro‐inverter can run through the currently available conduit for the machine’s existing wiring as shown below. This channel runs the existing wires to the electronics located at the front of the elliptical. In order to branch the DC converter’s wires out of this conduit, special holes from this conduit will allow the wires to exit the conduit and connect to the Enphase‐micro‐inverter. We have yet to determine the final locations and procedures for mounting due to the incompatibility of the Vicor Maxi DC converter as explained in Results and Testing.
Existing wire conduit
Figure 4: Machine's existing wiring
The micro‐inverter placement below the track ramp makes for an easy access while connecting the micro‐inverters of multiple energy harvesting elliptical machines together in parallel. Also, the ramp leaves a sufficient amount of space beneath it. At the elliptical ramp’s lowest level, we measured a clearance of 8.25 inches. Appendix B shows these clearance measurements as well as the various micro‐inverter mounting configurations.
23
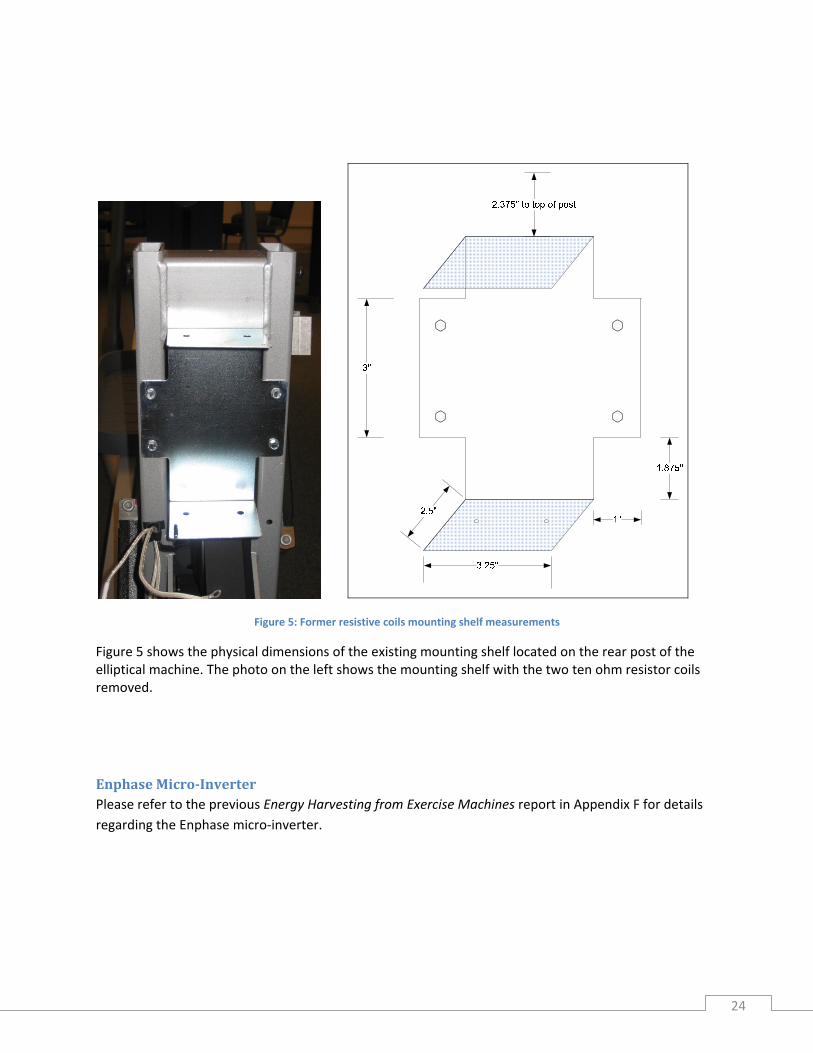
Figure 5: Former resistive coils mounting shelf measurements
Figure 5 shows the physical dimensions of the existing mounting shelf located on the rear post of the elliptical machine. The photo on the left shows the mounting shelf with the two ten ohm resistor coils removed.
Enphase MicroInverter Please refer to the previous Energy Harvesting from Exercise Machines report in Appendix F for details regarding the Enphase micro‐inverter.
24
Chapter 3 Results and Testing
Full System Test with Wilmore DC Converter Test #1: Complete Setup after Summer Break (October 12, 2009)
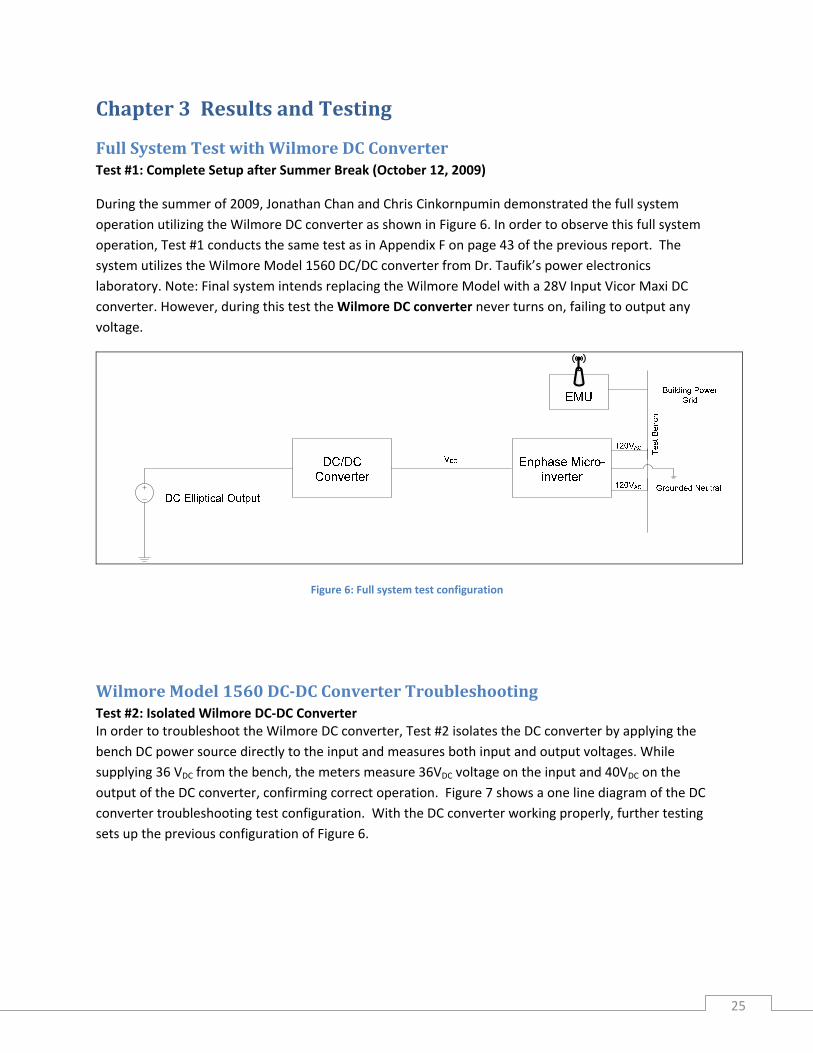
During the summer of 2009, Jonathan Chan and Chris Cinkornpumin demonstrated the full system operation utilizing the Wilmore DC converter as shown in Figure 6. In order to observe this full system operation, Test #1 conducts the same test as in Appendix F on page 43 of the previous report. The system utilizes the Wilmore Model 1560 DC/DC converter from Dr. Taufik’s power electronics laboratory. Note: Final system intends replacing the Wilmore Model with a 28V Input Vicor Maxi DC converter. However, during this test the Wilmore DC converter never turns on, failing to output any voltage.
Figure 6: Full system test configuration
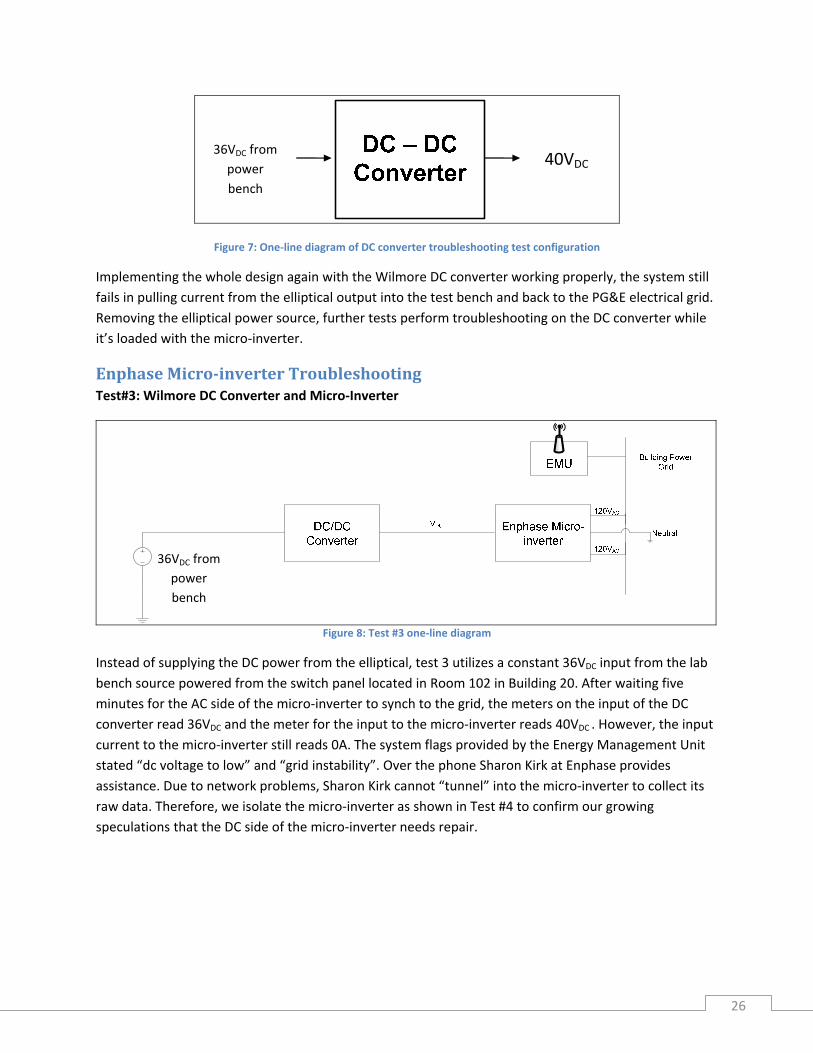
Wilmore Model 1560 DCDC Converter Troubleshooting Test #2: Isolated Wilmore DC‐DC Converter In order to troubleshoot the Wilmore DC converter, Test #2 isolates the DC converter by applying the bench DC power source directly to the input and measures both input and output voltages. While supplying 36 VDC from the bench, the meters measure 36VDC voltage on the input and 40VDC on the output of the DC converter, confirming correct operation. Figure 7 shows a one line diagram of the DC converter troubleshooting test configuration. With the DC converter working properly, further testing sets up the previous configuration of Figure 6.
25
36VDC from power bench
40VDC
Figure 7: One‐line diagram of DC converter troubleshooting test configuration
Implementing the whole design again with the Wilmore DC converter working properly, the system still fails in pulling current from the elliptical output into the test bench and back to the PG&E electrical grid. Removing the elliptical power source, further tests perform troubleshooting on the DC converter while it’s loaded with the micro‐inverter.
Enphase Microinverter Troubleshooting Test#3: Wilmore DC Converter and Micro‐Inverter
36VDC from power bench
Figure 8: Test #3 one‐line diagram
Instead of supplying the DC power from the elliptical, test 3 utilizes a constant 36VDC input from the lab bench source powered from the switch panel located in Room 102 in Building 20. After waiting five minutes for the AC side of the micro‐inverter to synch to the grid, the meters on the input of the DC converter read 36VDC and the meter for the input to the micro‐inverter reads 40VDC . However, the input current to the micro‐inverter still reads 0A. The system flags provided by the Energy Management Unit stated “dc voltage to low” and “grid instability”. Over the phone Sharon Kirk at Enphase provides assistance. Due to network problems, Sharon Kirk cannot “tunnel” into the micro‐inverter to collect its raw data. Therefore, we isolate the micro‐inverter as shown in Test #4 to confirm our growing speculations that the DC side of the micro‐inverter needs repair.
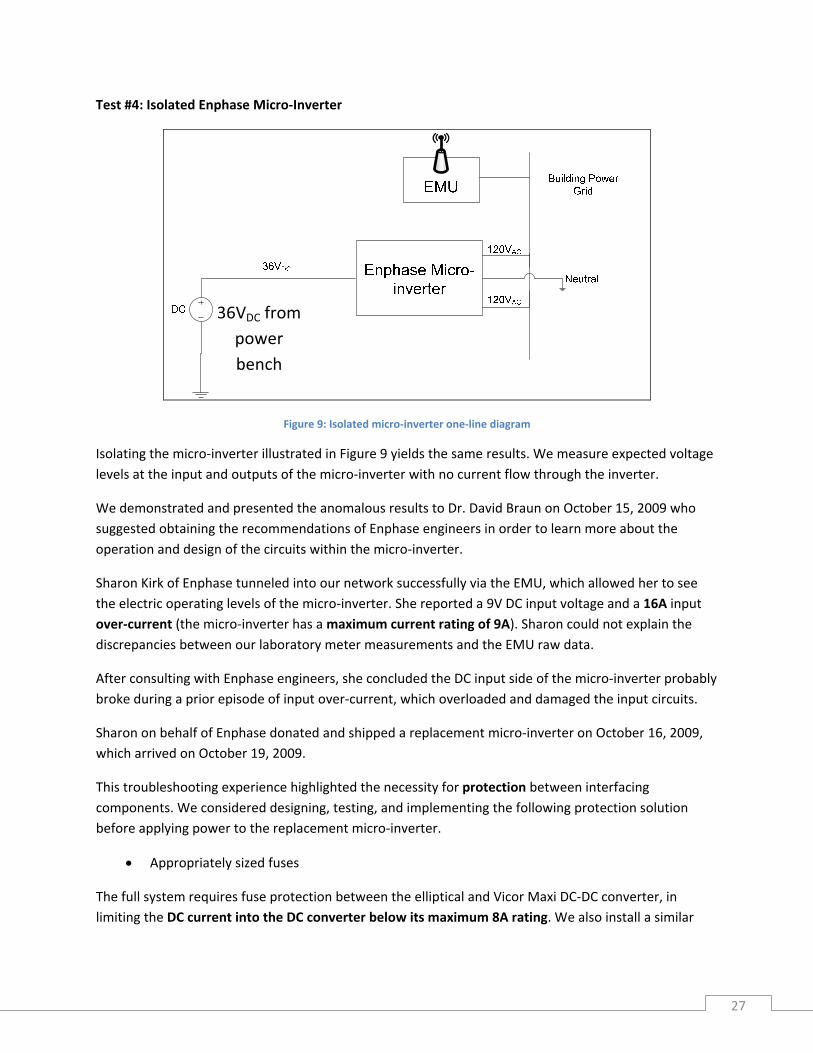
Isolating the micro‐inverter illustrated in Figure 9 yields the same results. We measure expected voltage levels at the input and outputs of the micro‐inverter with no current flow through the inverter.
We demonstrated and presented the anomalous results to Dr. David Braun on October 15, 2009 who suggested obtaining the recommendations of Enphase engineers in order to learn more about the operation and design of the circuits within the micro‐inverter.
Sharon Kirk of Enphase tunneled into our network successfully via the EMU, which allowed her to see the electric operating levels of the micro‐inverter. She reported a 9V DC input voltage and a 16A input over‐current (the micro‐inverter has a maximum current rating of 9A). Sharon could not explain the discrepancies between our laboratory meter measurements and the EMU raw data.
After consulting with Enphase engineers, she concluded the DC input side of the micro‐inverter probably broke during a prior episode of input over‐current, which overloaded and damaged the input circuits.
Sharon on behalf of Enphase donated and shipped a replacement micro‐inverter on October 16, 2009, which arrived on October 19, 2009.
This troubleshooting experience highlighted the necessity for protection between interfacing components. We considered designing, testing, and implementing the following protection solution before applying power to the replacement micro‐inverter.
• Appropriately sized fuses
The full system requires fuse protection between the elliptical and Vicor Maxi DC‐DC converter, in limiting the DC current into the DC converter below its maximum 8A rating. We also install a similar
27
fuse rated at 5A between the DC converter and micro‐inverter in limiting the DC current below the Vicor DC converter’s 5.56A load current maximum.
Enphase Microinverter #2 (Replacement) Testing with Fuse Protection Test #5: Wilmore DC Converter and Enphase Micro‐Inverter (October 29, 2009)
Table 5: Wilmore converter specifications
Wilmore DC Converter Specs Input 21‐29Vdc Output 48Vdc nominal Max Current 16A
Table 6: Enphase micro‐inverter specifications
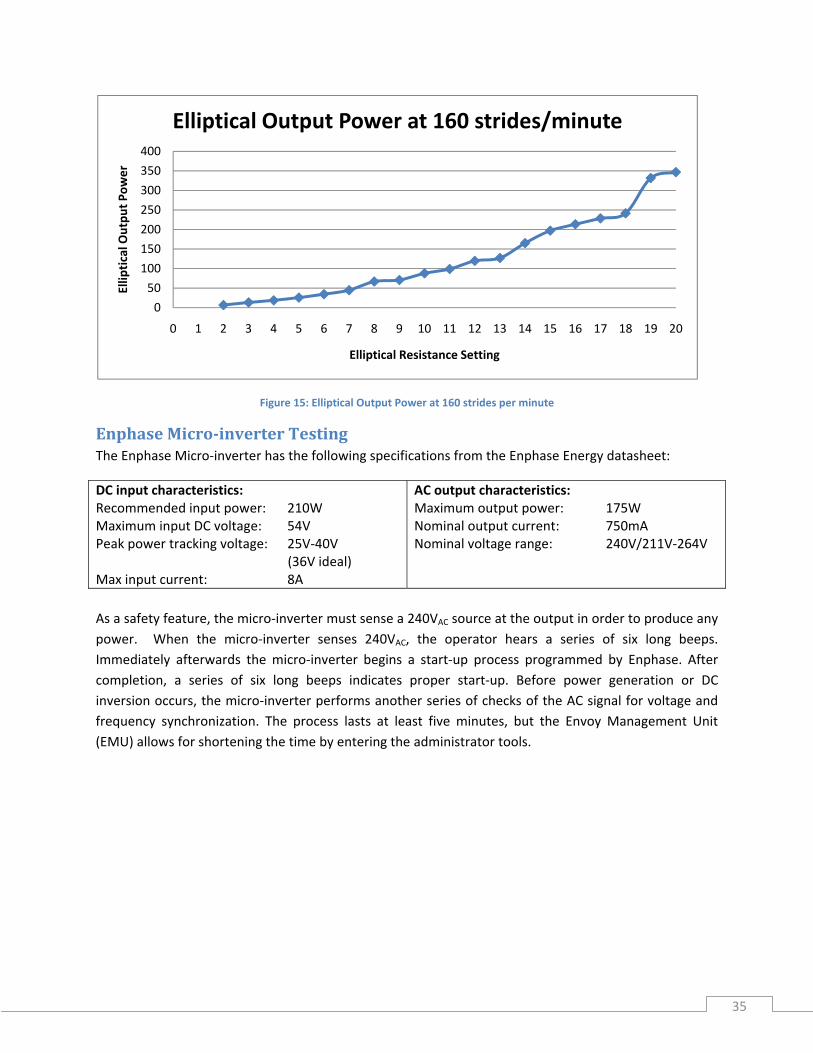
Micro‐inverter MPPT Range DC 25V‐40V Max DC current 8A AC max cont output current 0.75A AC max continuous output power 175W Max units per branch 16 Min Nom Max AC output 211V 240V 264V Operating Frequency (Hz) 59.3 60 60.5
Table 7: Enphase device serial numbers
Enphase Device Serial Number Micro‐inverter 1 030846014885
Table 5 and Table 6 show the two specifications for the Wilmore DC converter and the Enphase micro‐inverter. In order to keep track of the various Enphase devices, Table 7 lists the serial numbers of the two micro‐inverters and the EMU. Since the Wilmore DC converter potentially outputs a maximum current of 16A, in order to protect the micro‐inverter (8ADC max), we place a 7.5A fuse between the two components.
28
36VDC from power bench
Figure 10: Test #5 configuration
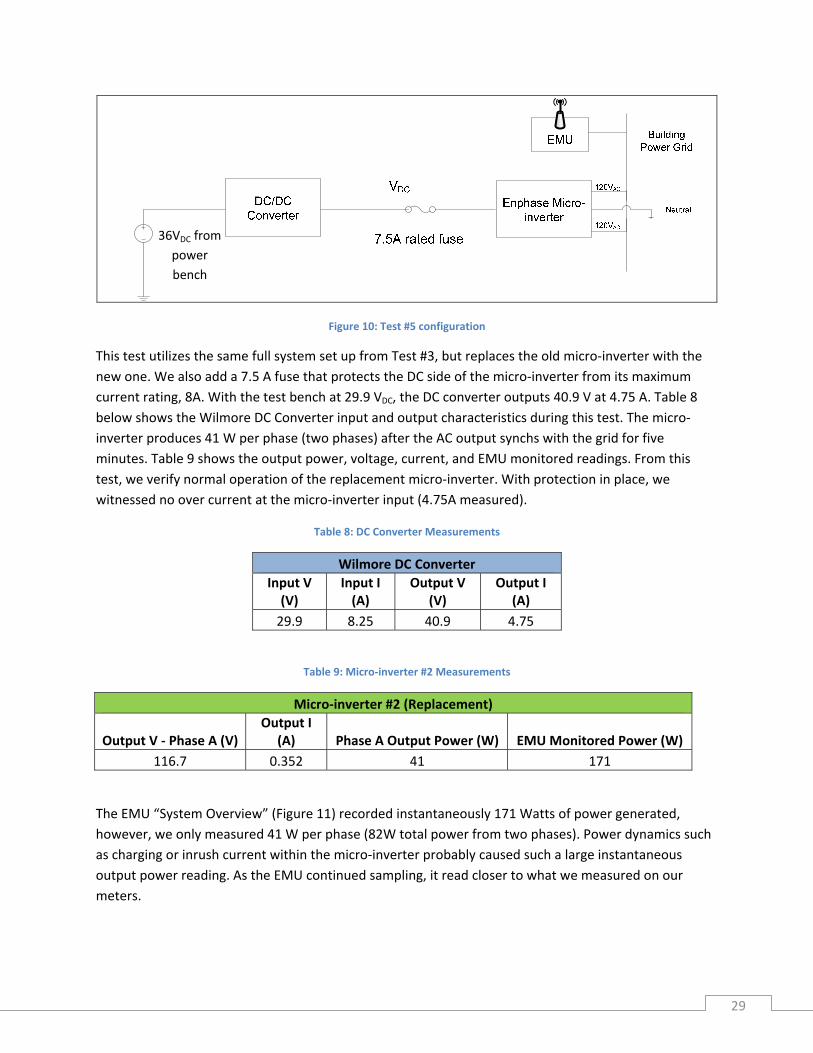
This test utilizes the same full system set up from Test #3, but replaces the old micro‐inverter with the new one. We also add a 7.5 A fuse that protects the DC side of the micro‐inverter from its maximum current rating, 8A. With the test bench at 29.9 VDC, the DC converter outputs 40.9 V at 4.75 A. Table 8 below shows the Wilmore DC Converter input and output characteristics during this test. The micro‐inverter produces 41 W per phase (two phases) after the AC output synchs with the grid for five minutes. Table 9 shows the output power, voltage, current, and EMU monitored readings. From this test, we verify normal operation of the replacement micro‐inverter. With protection in place, we witnessed no over current at the micro‐inverter input (4.75A measured).
Table 8: DC Converter Measurements
Wilmore DC Converter Input V (V)
Input I (A)
Output V (V)
Output I (A)
29.9 8.25 40.9 4.75
Table 9: Micro‐inverter #2 Measurements
Micro‐inverter #2 (Replacement)
Output V ‐ Phase A (V) Output I
(A) Phase A Output Power (W) EMU Monitored Power (W) 116.7 0.352 41 171
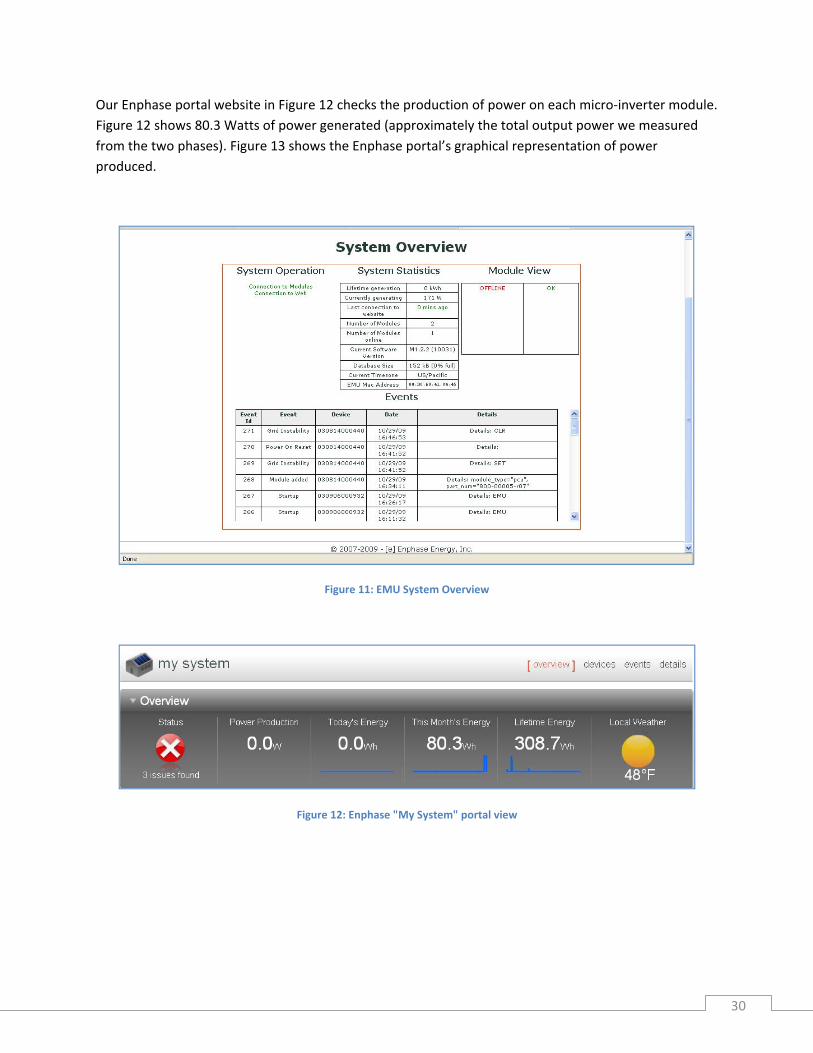
The EMU “System Overview” (Figure 11) recorded instantaneously 171 Watts of power generated, however, we only measured 41 W per phase (82W total power from two phases). Power dynamics such as charging or inrush current within the micro‐inverter probably caused such a large instantaneous output power reading. As the EMU continued sampling, it read closer to what we measured on our meters.
29
Our Enphase portal website in Figure 12 checks the production of power on each micro‐inverter module. Figure 12 shows 80.3 Watts of power generated (approximately the total output power we measured from the two phases). Figure 13 shows the Enphase portal’s graphical representation of power produced.
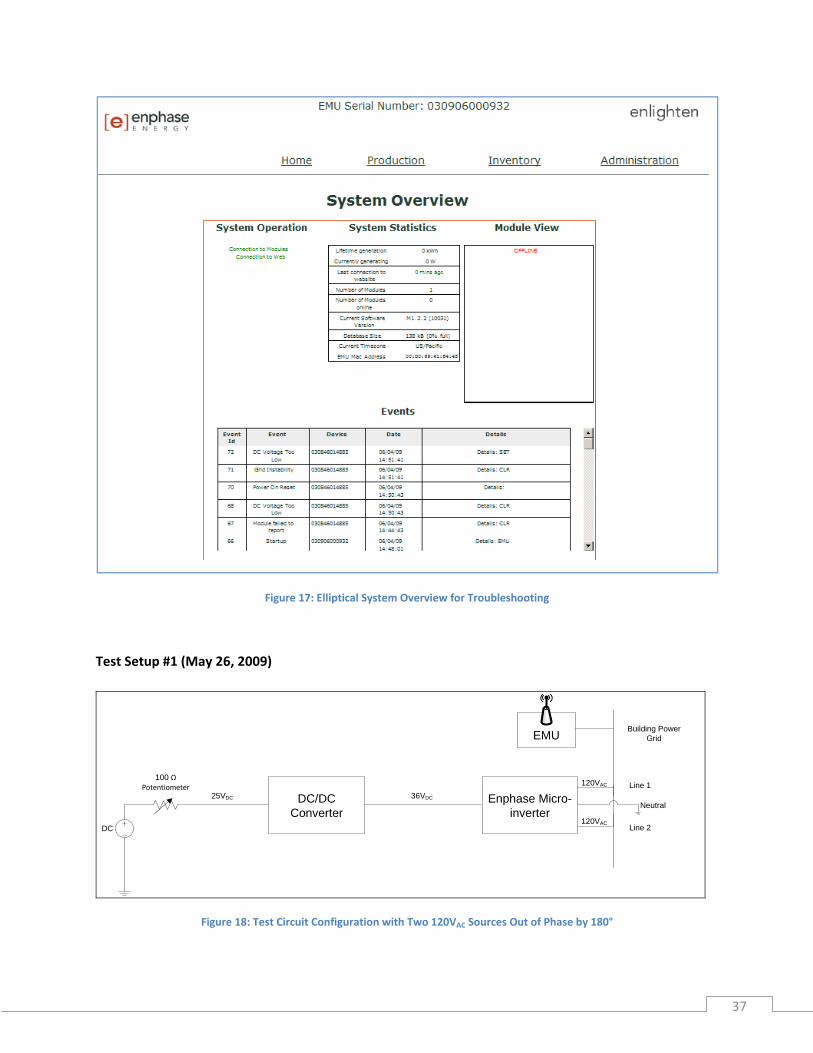
Figure 11: EMU System Overview
Figure 12: Enphase "My System" portal view
30
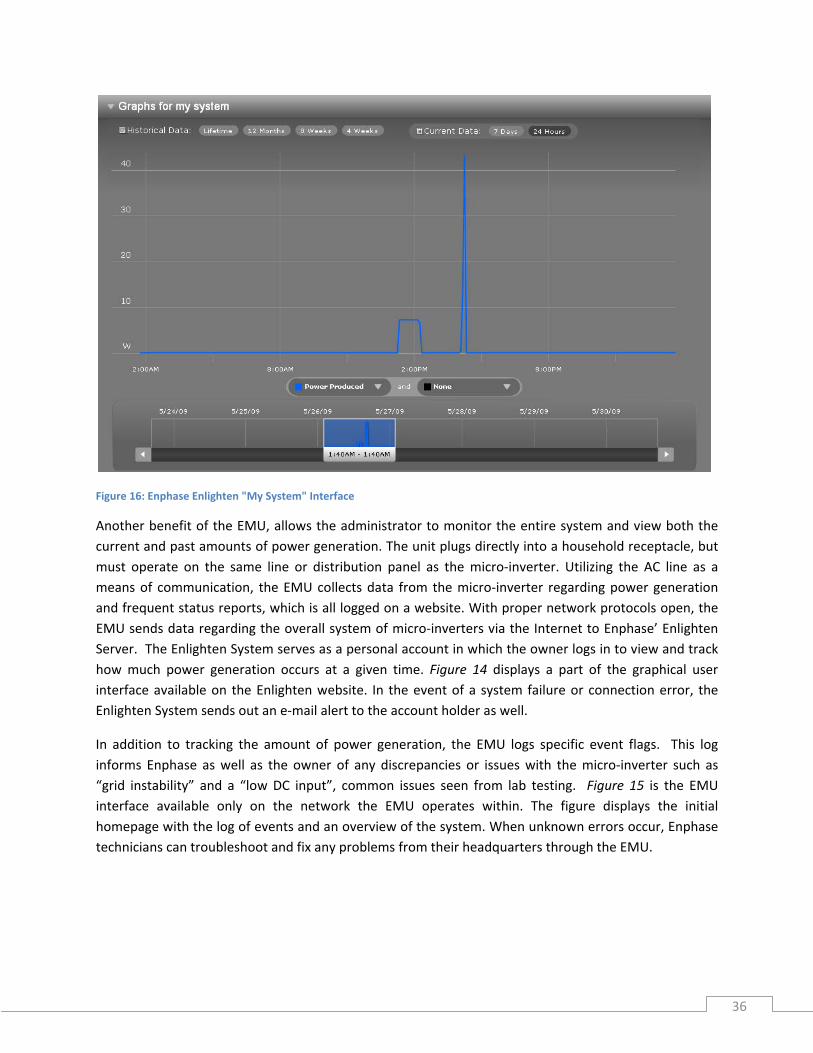
Figure 13: "My System" power harvest graph through Enphase portal
Full System Test with Wilmore DC Converter and Enphase microinverter #2 Test #6: 7.5A fuse protection between Wilmore and micro‐inverter (October 30, 2009)
Wilmore DC/DCConverter
Enphase Micro-inverter
120VAC
120VAC
Neutral
7.5A rated fuse
Building Power Grid
EMU
VDC
Fluctuating elliptical output
voltage
Figure 14: Full system configuration
31
Figure 15: "My system" Enphase portal view for full system setup
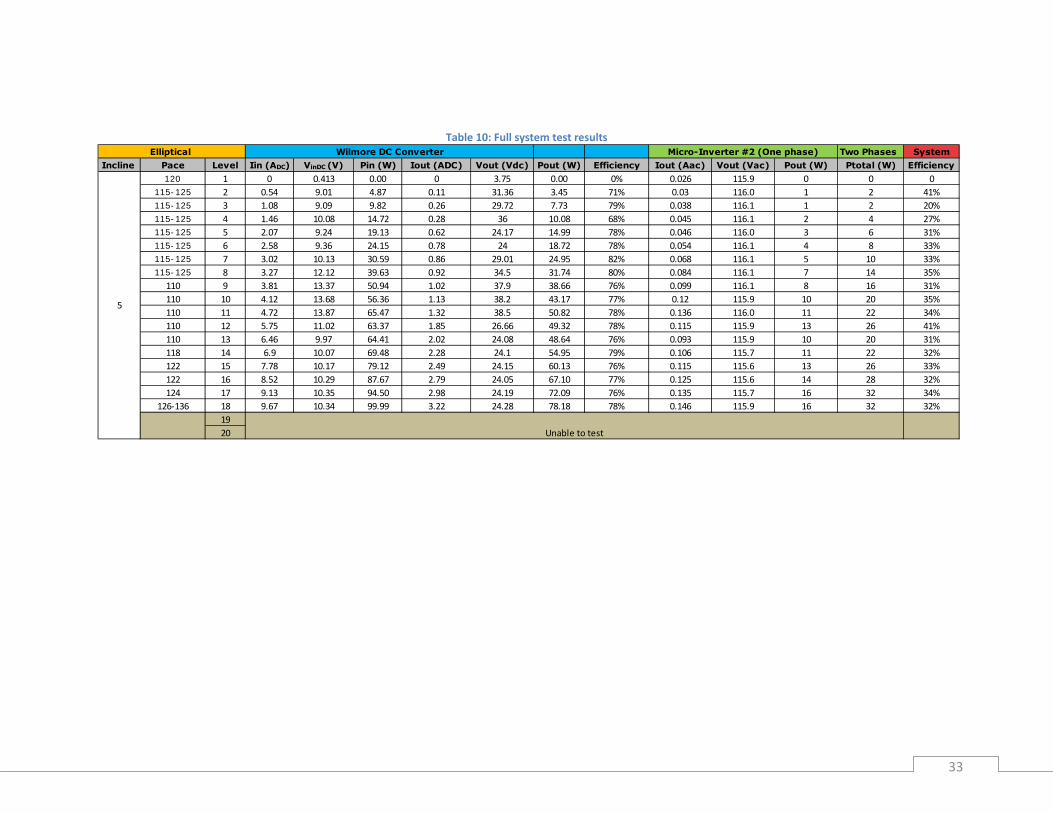
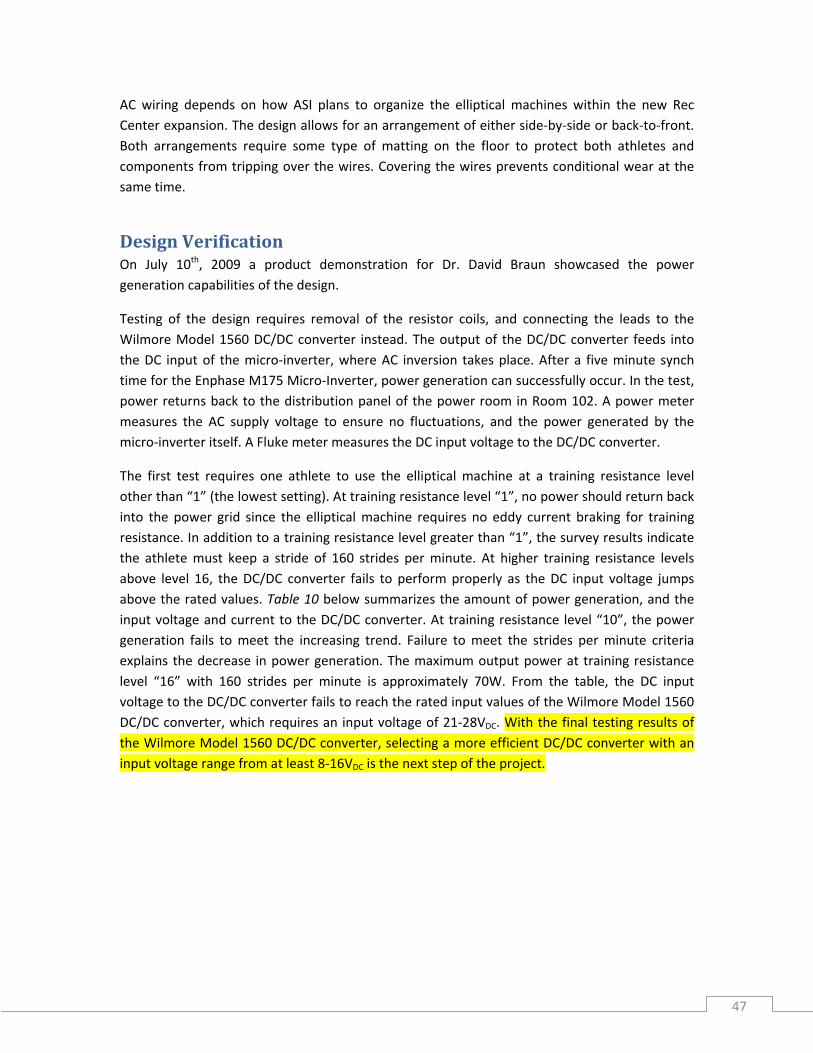
Under the full system test with the replacement micro‐inverter, we harvested 0 to 32W across a range of resistance levels shown in Table 10. The elliptical user maintained pace at around 120 strides per minute and 110 strides per minute at higher resistance settings. Prior testing conducted during the summer yielded high levels of generation harvested due to maintaining the pace at 160 strides per minute.
At higher resistance levels, if the user decreases pace, he or she feels a large spike of physical resistance against their feet. However, if the user maintains pace, the physical resistance remains constant. This raises the concern of maintaining normal operation of the elliptical. By removing the two 20 ohm resistive coils attached at the end of the machine, the resistance now comes from the Thevenin equivalent impedance looking into the Wilmore DC converter. As the user suddenly changes pace in their strides, he or she ultimately suddenly changes the amount of current outputted from the elliptical. Although the exact circuit layout of the Wilmore DC converter remains unknown, it utilizes inductors as most DC converter topologies do. We hypothesize that these inductors oppose the change in current which in turn creates the large spike in physical resistance. This concept will require further investigation in order to maintain normal elliptical operation.
32
Table 10: Full system test results
Two Phases SystemIncline Pace Level Iin (ADC) VinDC (V) Pin (W) Iout (ADC) Vout (Vdc) Pout (W) Efficiency Iout (Aac) Vout (Vac) Pout (W) Ptotal (W) Efficiency
Figure 16: Wilmore DC converter input characteristics
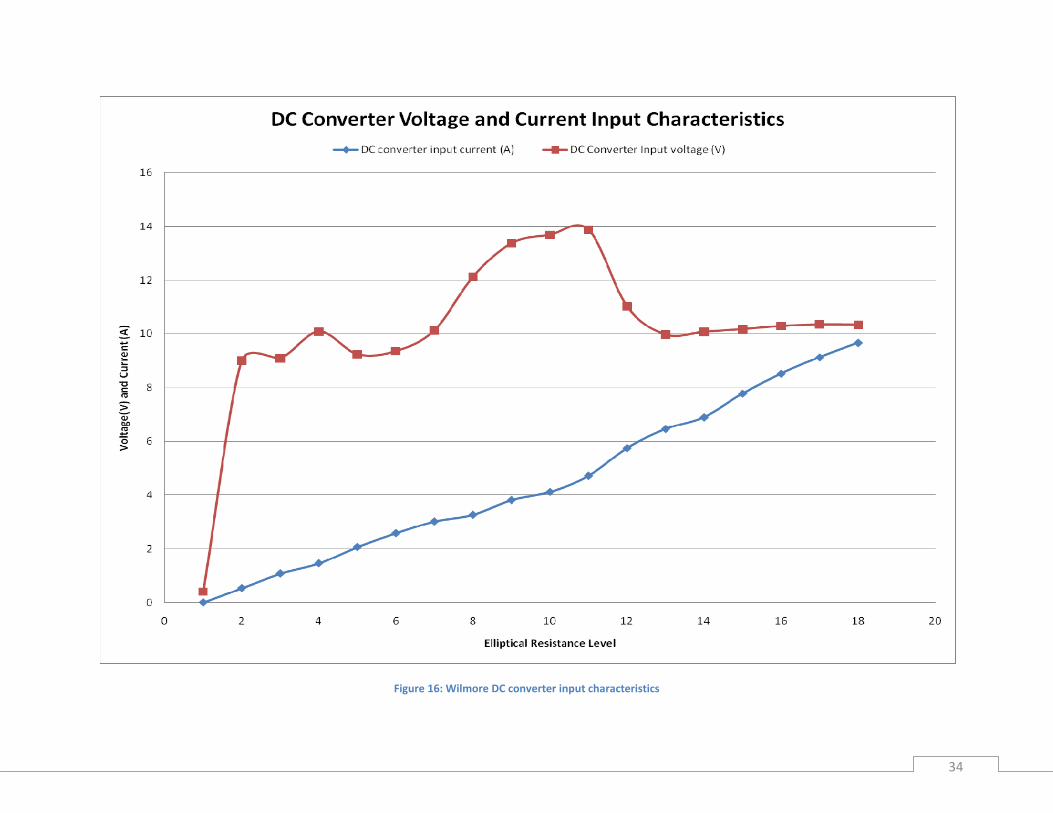
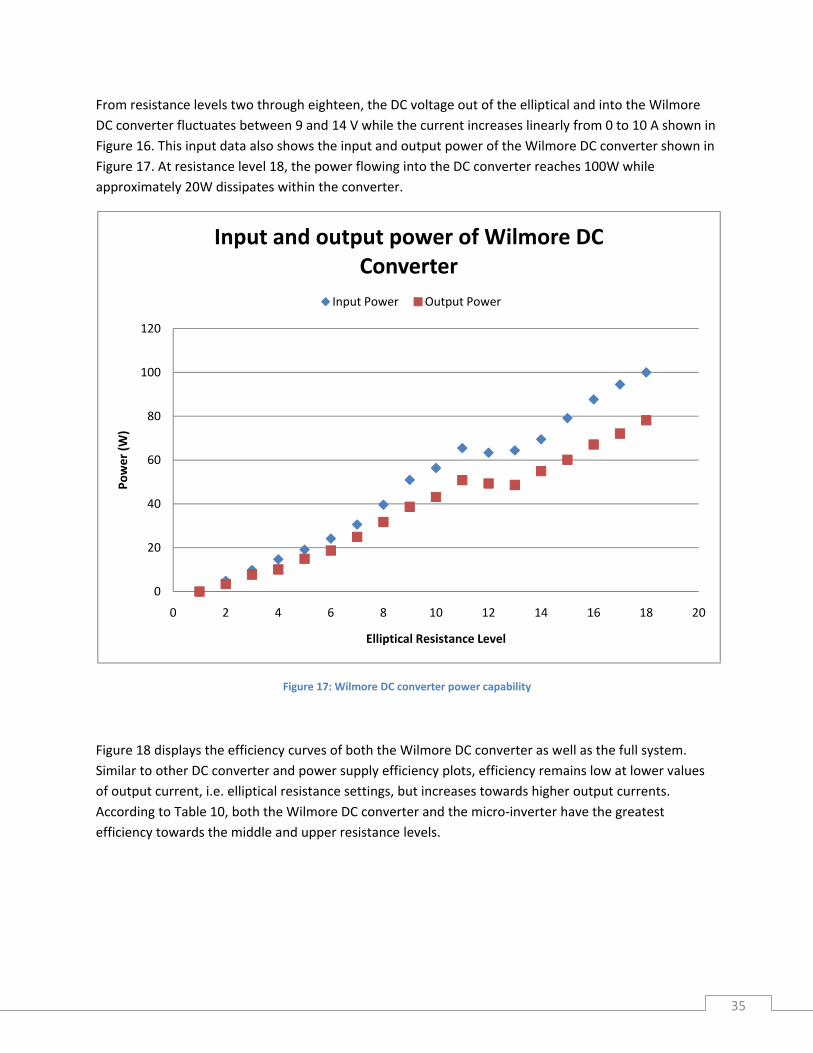
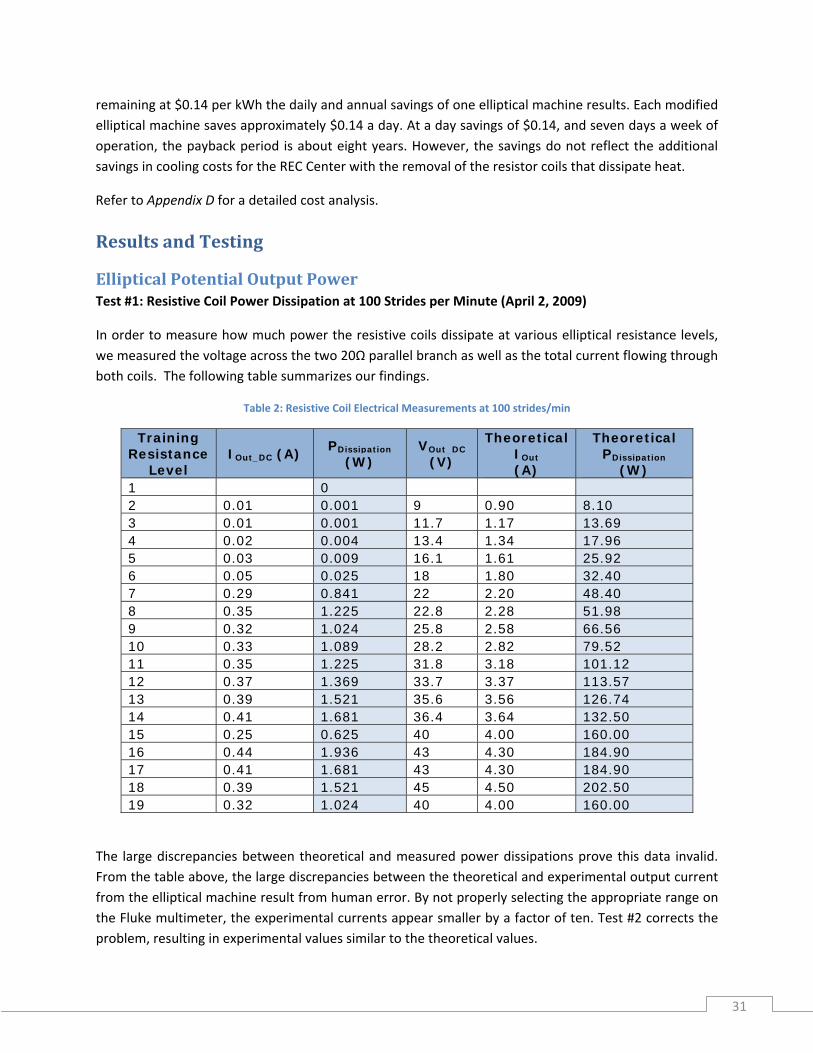
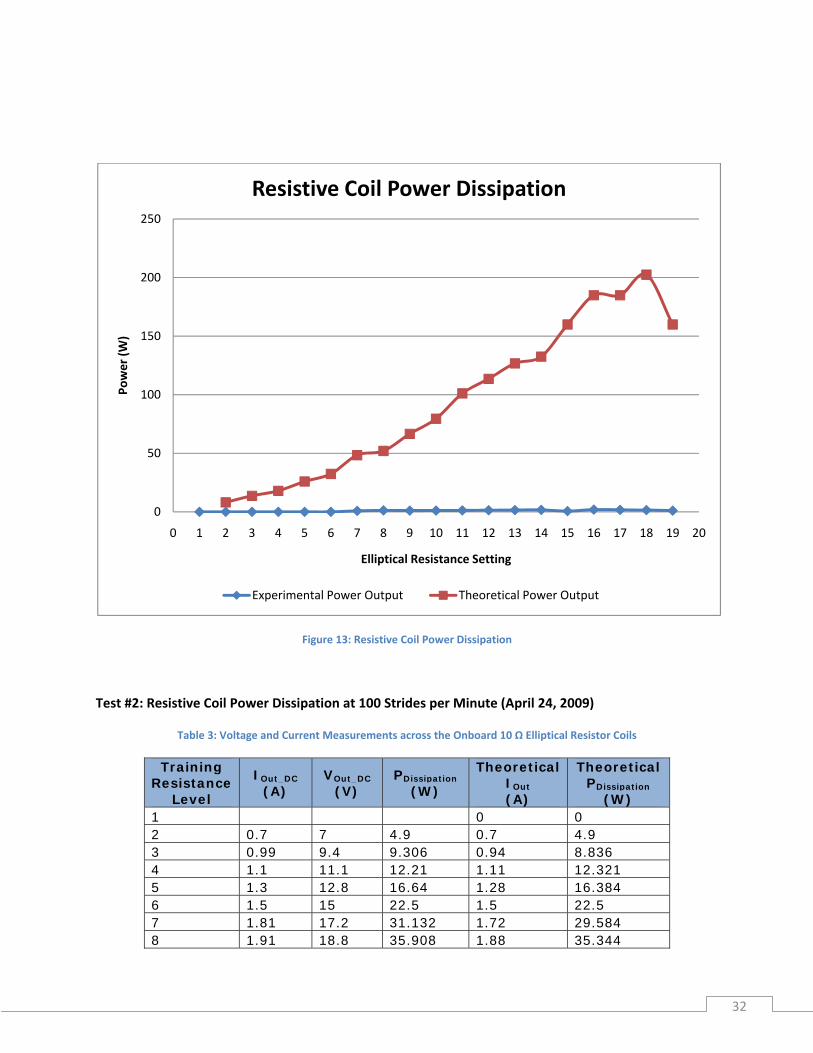
From resistance levels two through eighteen, the DC voltage out of the elliptical and into the Wilmore DC converter fluctuates between 9 and 14 V while the current increases linearly from 0 to 10 A shown in Figure 16. This input data also shows the input and output power of the Wilmore DC converter shown in Figure 17. At resistance level 18, the power flowing into the DC converter reaches 100W while approximately 20W dissipates within the converter.
0
20
40
60
80
100
120
0 2 4 6 8 10 12 14 16 18 20
Power (W
)
Elliptical Resistance Level
Input and output power of Wilmore DC Converter
Input Power Output Power
Figure 17: Wilmore DC converter power capability
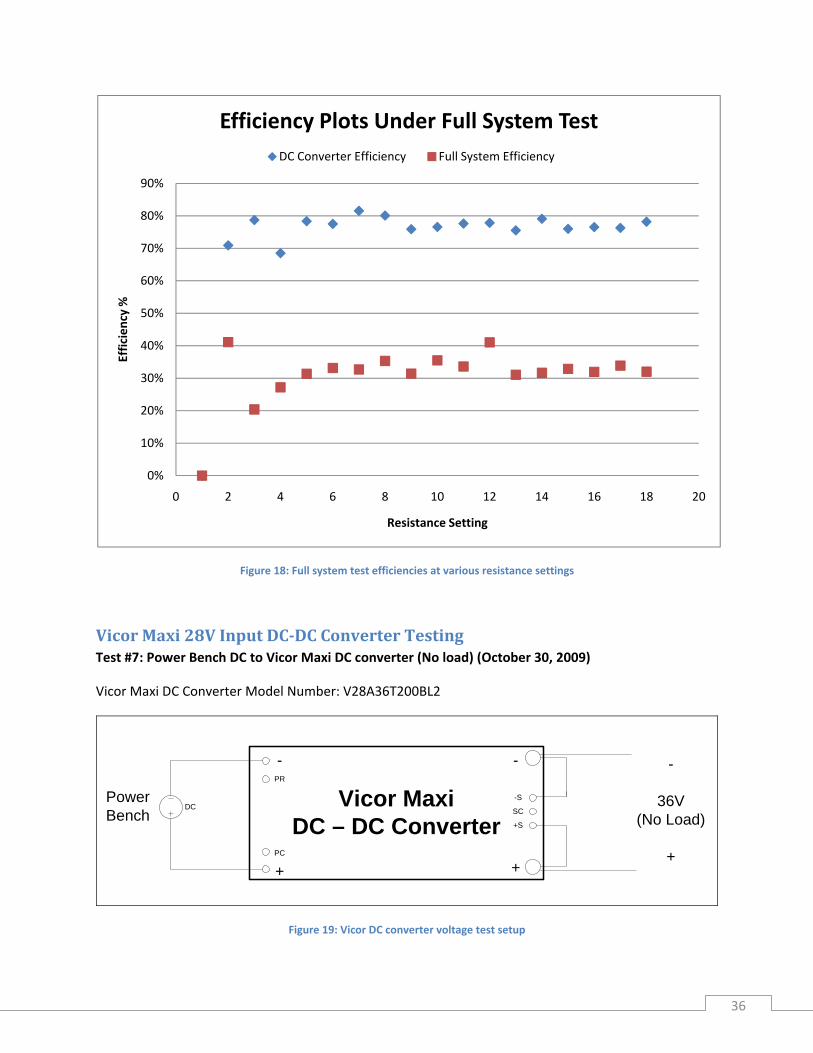
Figure 18 displays the efficiency curves of both the Wilmore DC converter as well as the full system. Similar to other DC converter and power supply efficiency plots, efficiency remains low at lower values of output current, i.e. elliptical resistance settings, but increases towards higher output currents. According to Table 10, both the Wilmore DC converter and the micro‐inverter have the greatest efficiency towards the middle and upper resistance levels.
35
36
Figure 18: Full system test efficiencies at various resistance settings
Vicor Maxi 28V Input DCDC Converter Testing Test #7: Power Bench DC to Vicor Maxi DC converter (No load) (October 30, 2009)
Vicor Maxi DC Converter Model Number: V28A36T200BL2
Vicor MaxiDC – DC Converter
DCPower Bench
-
36V(No Load)
+
-PR
PC
+
SC
-S
+S
+
-
Figure 19: Vicor DC converter voltage test setup
0%
10%
20%
30%
40%
50%
60%
70%
80%
90%
0 2 4 6 8 10 12 14 16 18 2
Efficiency %
Resistance Setting
Efficiency Plots Under Full System Test
0
DC Converter Efficiency Full System Efficiency
Table 11: Vicor Maxi DC converter pin assignments and specifications
Pin Name Function+ Positive The positive terminal for either the output or input‐ Negative The negative terminal for either the output or inputPR Parallel Operation Allows to connect multiple converters in parallelPC Primary Control Part of a module alarm/module enable or disable/supplySC Secondary Control Trim up or trim down output voltage‐S ‐Sense Senses negative output terminal+S +Sense Senses positive output terminal
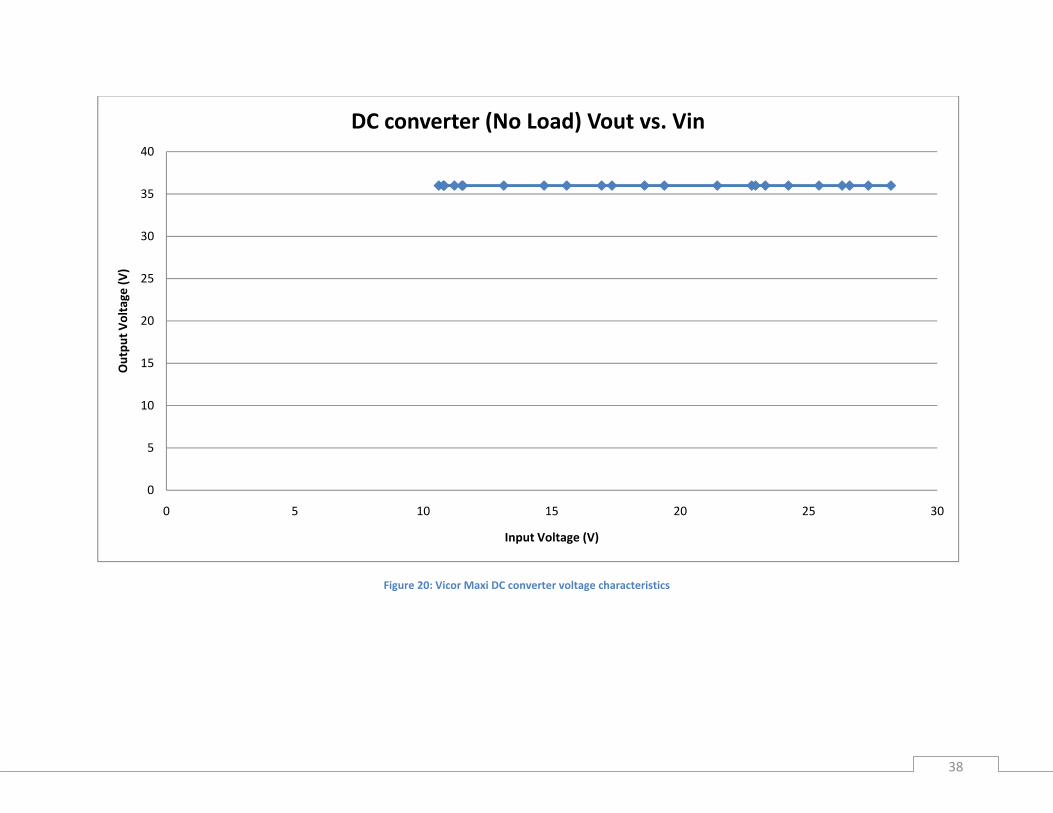
From our DC converter decision matrix, we chose to purchase and try incorporating the Vicor Maxi 28V input DC converter since it closely matches the desired specifications. Please note the tying of the output pins. The “‐“pin requires tying to the –S while the “+” ties to +S as specified in the data sheet. Table 11 defines the pins. Under no load, we applied voltage at its input to test its wide voltage capability. Table 12 outlines the results. We also observe when we lower the voltage too fast from around 22V to 10.9V, Vout falters from 36V to 18V. This probably occurs due to internal readjustments to the sudden voltage drop. Other than that, the DC converter maintains a constant output voltage of 36VDC under no load. The Vicor DC converter makes a high pitched ringing sound as the input voltage increases. As witnessed in transformer design labs (EE 433), a similar sound occurs at the core of a transformer at high frequencies. The sound increases in pitch as the voltage increases. Table 12 shows where the ringing begins and starts getting louder. Figure 20 graphs the voltage characteristics.
Figure 20: Vicor Maxi DC converter voltage characteristics
38
Test #8: Elliptical to Vicor Maxi DC converter (No load) (October 30, 2009)
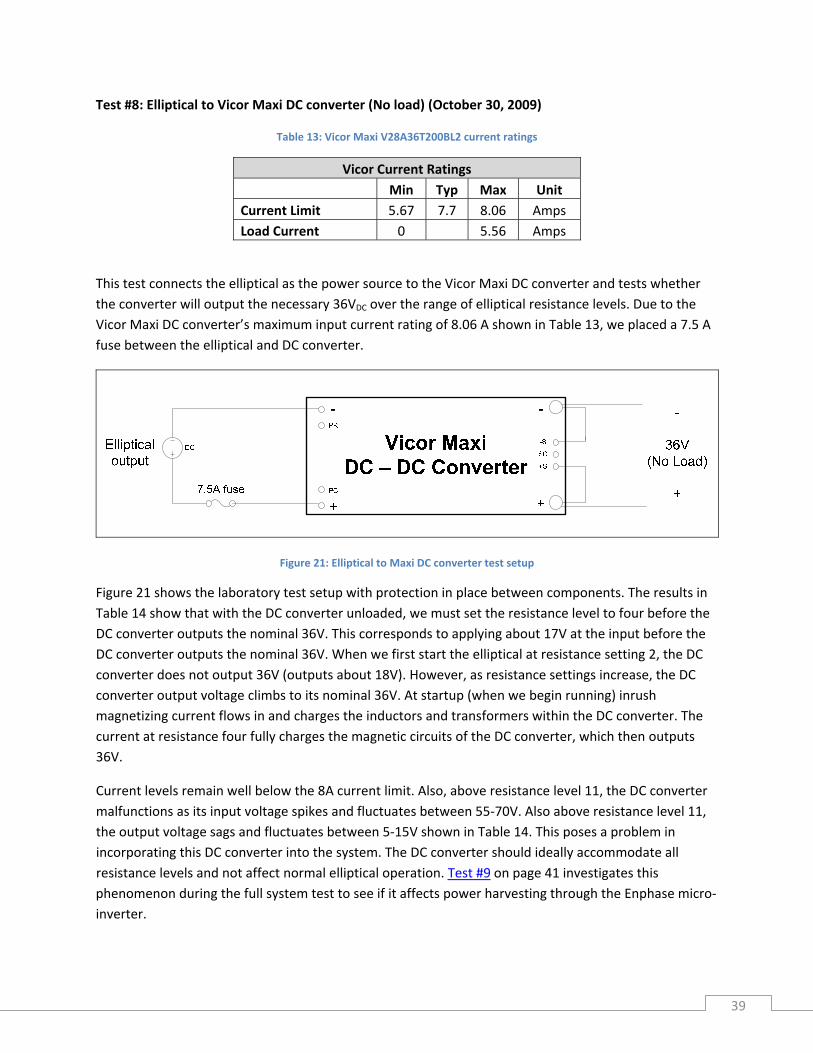
Table 13: Vicor Maxi V28A36T200BL2 current ratings
Vicor Current Ratings Min Typ Max Unit Current Limit 5.67 7.7 8.06 Amps Load Current 0 5.56 Amps
This test connects the elliptical as the power source to the Vicor Maxi DC converter and tests whether the converter will output the necessary 36VDC over the range of elliptical resistance levels. Due to the Vicor Maxi DC converter’s maximum input current rating of 8.06 A shown in Table 13, we placed a 7.5 A fuse between the elliptical and DC converter.
Figure 21: Elliptical to Maxi DC converter test setup
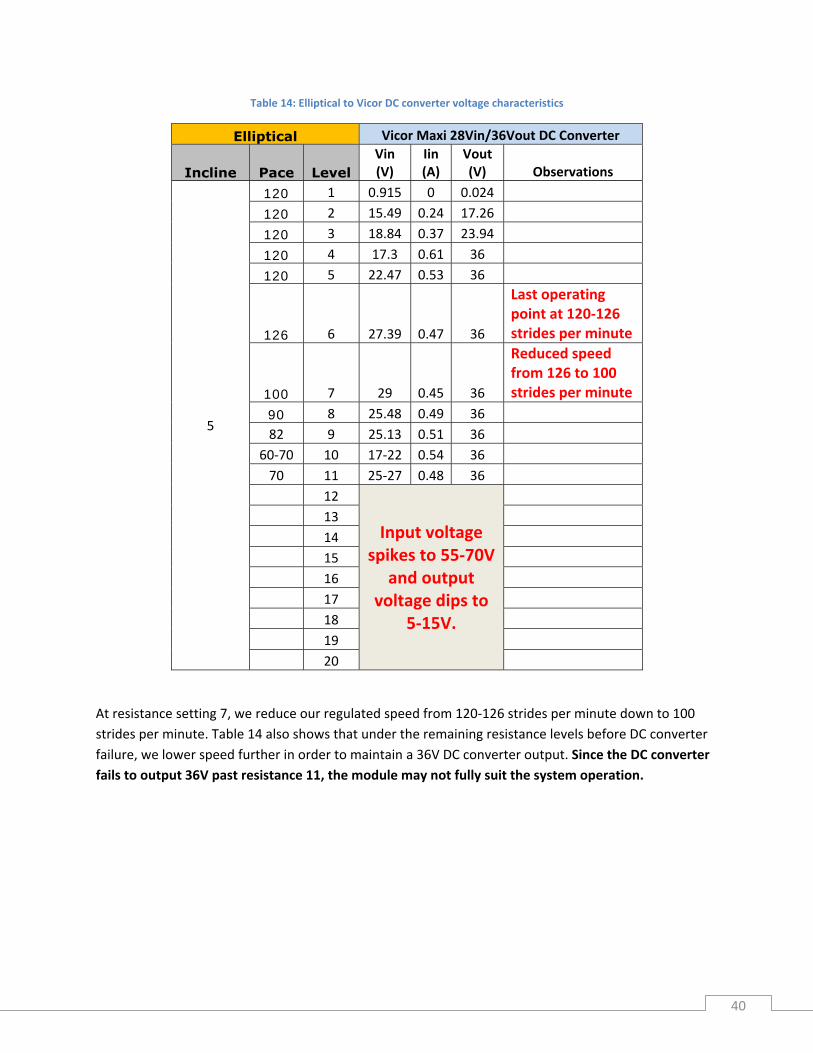
Figure 21 shows the laboratory test setup with protection in place between components. The results in Table 14 show that with the DC converter unloaded, we must set the resistance level to four before the DC converter outputs the nominal 36V. This corresponds to applying about 17V at the input before the DC converter outputs the nominal 36V. When we first start the elliptical at resistance setting 2, the DC converter does not output 36V (outputs about 18V). However, as resistance settings increase, the DC converter output voltage climbs to its nominal 36V. At startup (when we begin running) inrush magnetizing current flows in and charges the inductors and transformers within the DC converter. The current at resistance four fully charges the magnetic circuits of the DC converter, which then outputs 36V.
Current levels remain well below the 8A current limit. Also, above resistance level 11, the DC converter malfunctions as its input voltage spikes and fluctuates between 55‐70V. Also above resistance level 11, the output voltage sags and fluctuates between 5‐15V shown in Table 14. This poses a problem in incorporating this DC converter into the system. The DC converter should ideally accommodate all resistance levels and not affect normal elliptical operation. Test #9 on page 41 investigates this phenomenon during the full system test to see if it affects power harvesting through the Enphase micro‐inverter.
39
Table 14: Elliptical to Vicor DC converter voltage characteristics
Elliptical Vicor Maxi 28Vin/36Vout DC Converter
Incline Pace Level Vin (V)
Iin (A)
Vout (V) Observations
5
120 1 0.915 0 0.024
120 2 15.49 0.24 17.26
120 3 18.84 0.37 23.94
120 4 17.3 0.61 36
120 5 22.47 0.53 36
126 6 27.39 0.47 36
Last operating point at 120‐126 strides per minute
100 7 29 0.45 36
Reduced speed from 126 to 100 strides per minute
90 8 25.48 0.49 36 82 9 25.13 0.51 36
60‐70 10 17‐22 0.54 36 70 11 25‐27 0.48 36 12
Input voltage spikes to 55‐70V
and output voltage dips to
5‐15V.
13 14 15 16 17 18 19 20
At resistance setting 7, we reduce our regulated speed from 120‐126 strides per minute down to 100 strides per minute. Table 14 also shows that under the remaining resistance levels before DC converter failure, we lower speed further in order to maintain a 36V DC converter output. Since the DC converter fails to output 36V past resistance 11, the module may not fully suit the system operation.
40
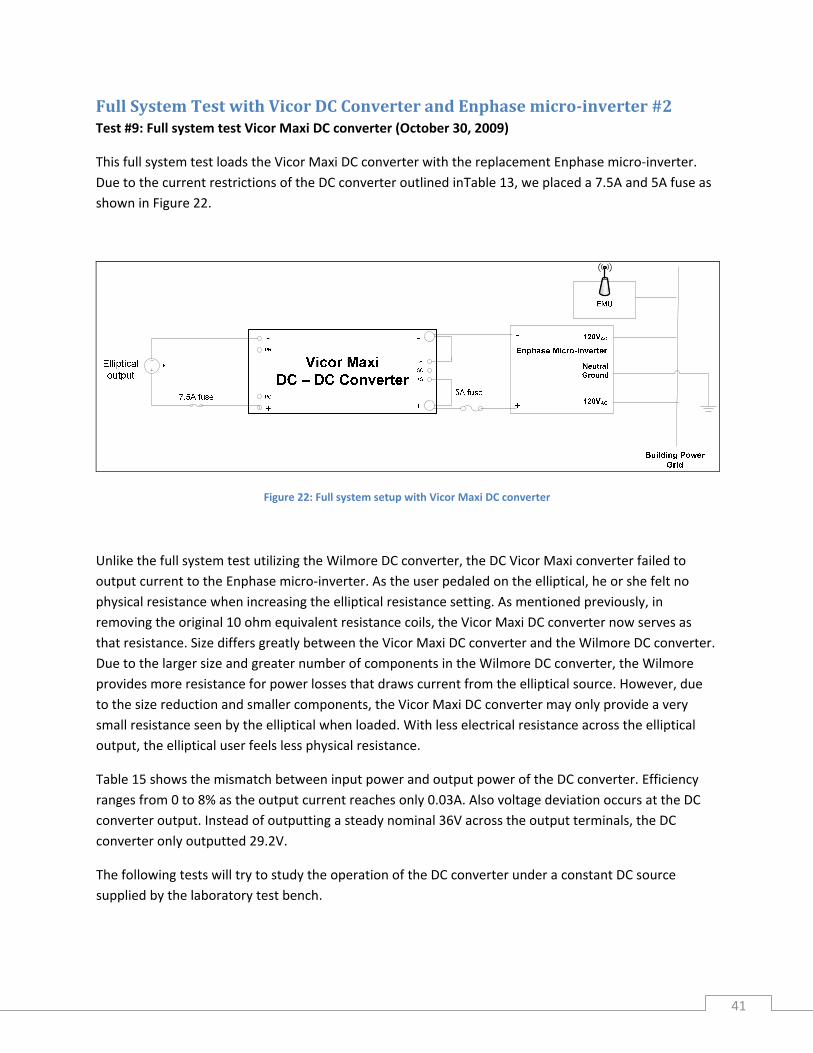
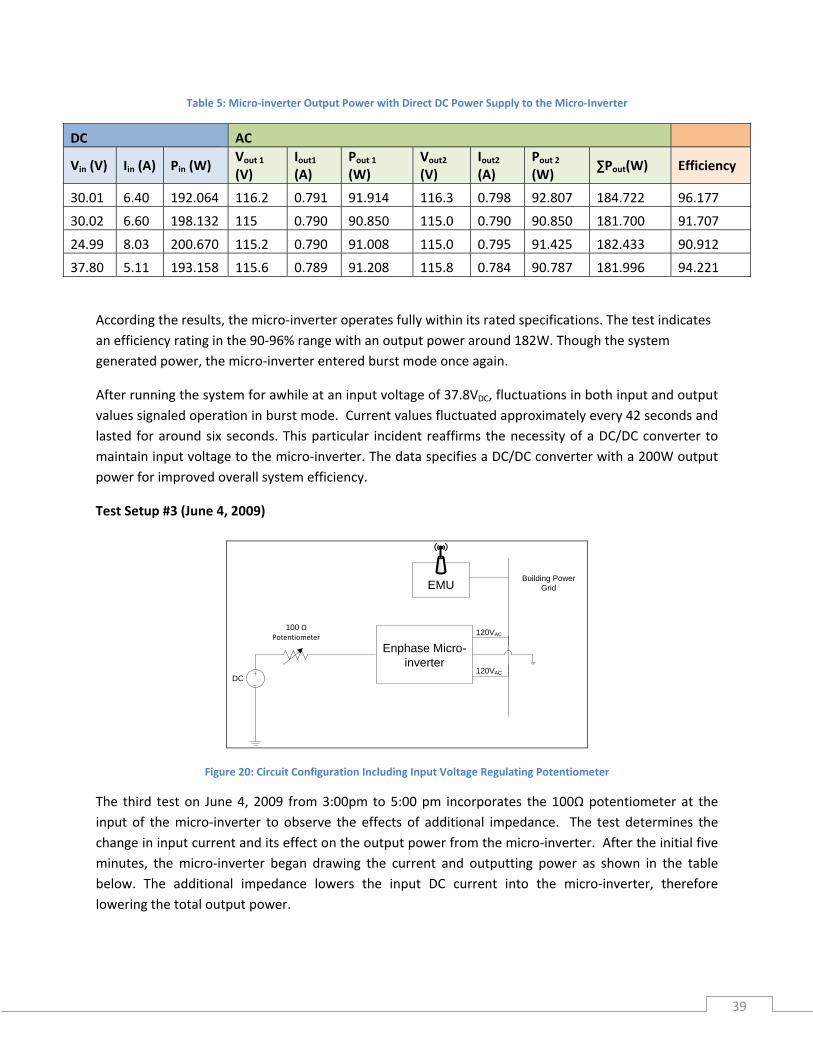
Full System Test with Vicor DC Converter and Enphase microinverter #2 Test #9: Full system test Vicor Maxi DC converter (October 30, 2009)
This full system test loads the Vicor Maxi DC converter with the replacement Enphase micro‐inverter. Due to the current restrictions of the DC converter outlined inTable 13, we placed a 7.5A and 5A fuse as shown in Figure 22.
Figure 22: Full system setup with Vicor Maxi DC converter
Unlike the full system test utilizing the Wilmore DC converter, the DC Vicor Maxi converter failed to output current to the Enphase micro‐inverter. As the user pedaled on the elliptical, he or she felt no physical resistance when increasing the elliptical resistance setting. As mentioned previously, in removing the original 10 ohm equivalent resistance coils, the Vicor Maxi DC converter now serves as that resistance. Size differs greatly between the Vicor Maxi DC converter and the Wilmore DC converter. Due to the larger size and greater number of components in the Wilmore DC converter, the Wilmore provides more resistance for power losses that draws current from the elliptical source. However, due to the size reduction and smaller components, the Vicor Maxi DC converter may only provide a very small resistance seen by the elliptical when loaded. With less electrical resistance across the elliptical output, the elliptical user feels less physical resistance.
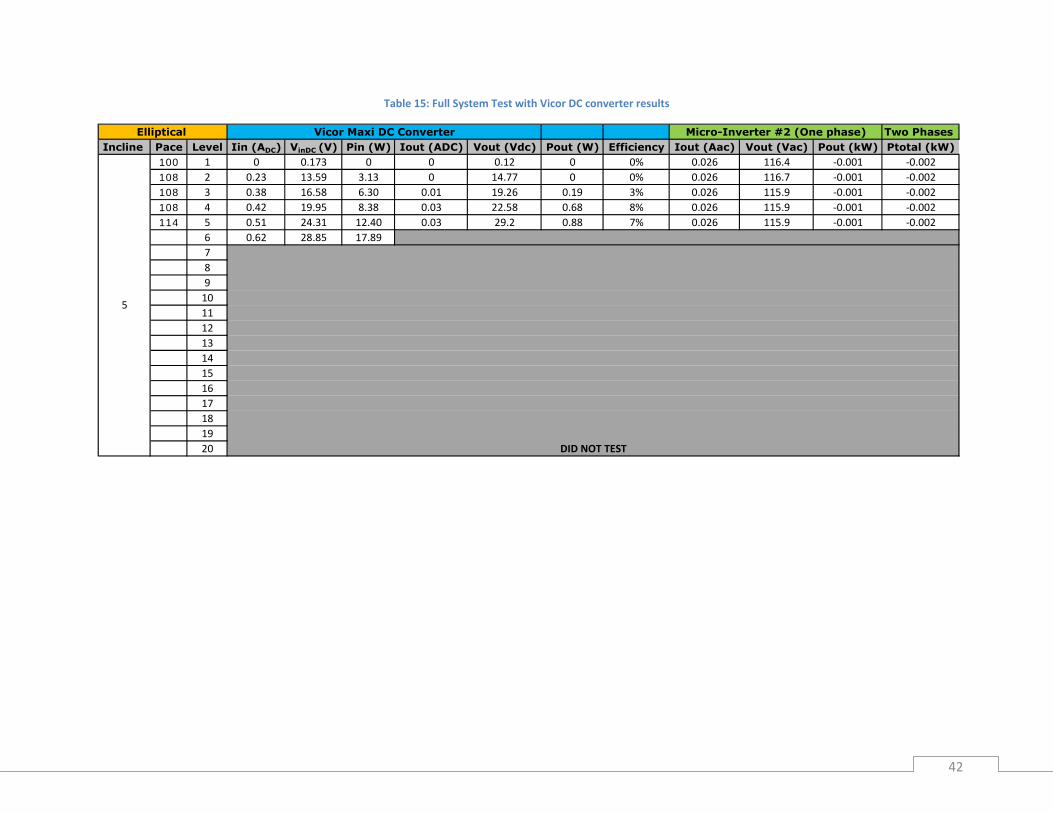
Table 15 shows the mismatch between input power and output power of the DC converter. Efficiency ranges from 0 to 8% as the output current reaches only 0.03A. Also voltage deviation occurs at the DC converter output. Instead of outputting a steady nominal 36V across the output terminals, the DC converter only outputted 29.2V.
The following tests will try to study the operation of the DC converter under a constant DC source supplied by the laboratory test bench.
41
Table 15: Full System Test with Vicor DC converter results
Two PhasesIncline Pace Level Iin (ADC) VinDC (V) Pin (W) Iout (ADC) Vout (Vdc) Pout (W) Efficiency Iout (Aac) Vout (Vac) Pout (kW) Ptotal (kW)
Vicor Maxi DC Converter Micro-Inverter #2 (One phase)
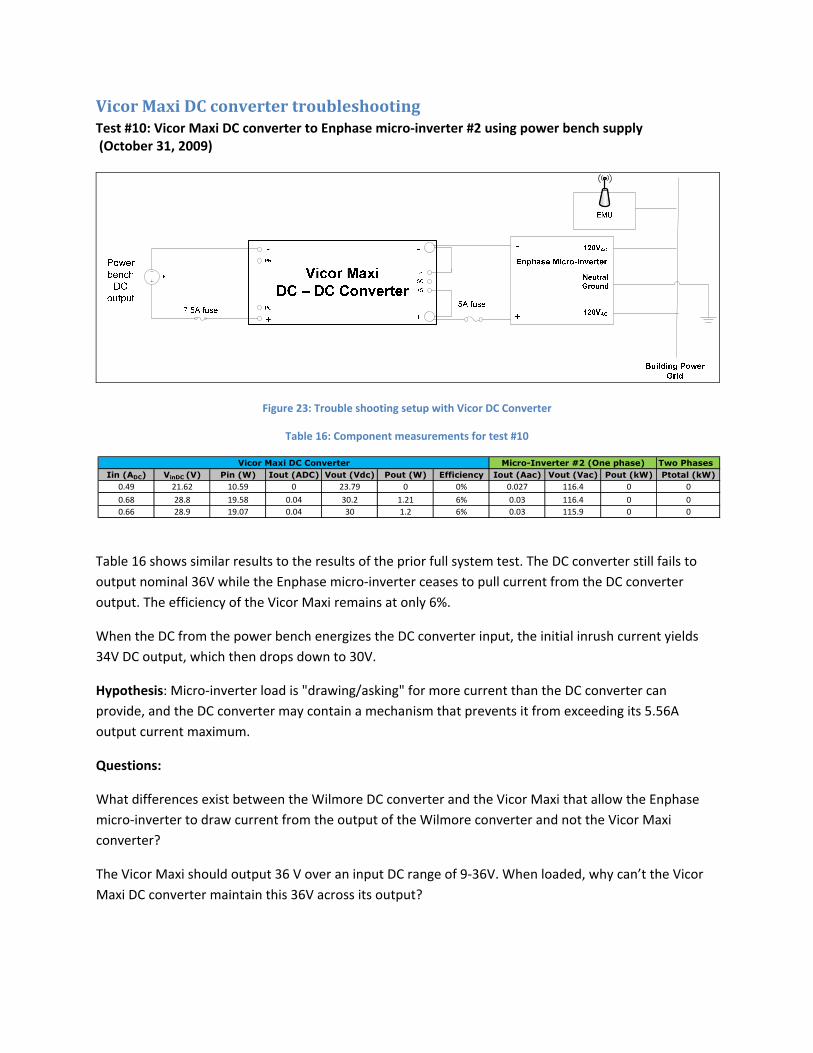
Table 16 shows similar results to the results of the prior full system test. The DC converter still fails to output nominal 36V while the Enphase micro‐inverter ceases to pull current from the DC converter output. The efficiency of the Vicor Maxi remains at only 6%.
When the DC from the power bench energizes the DC converter input, the initial inrush current yields 34V DC output, which then drops down to 30V.
Hypothesis: Micro‐inverter load is "drawing/asking" for more current than the DC converter can provide, and the DC converter may contain a mechanism that prevents it from exceeding its 5.56A output current maximum.
Questions:
What differences exist between the Wilmore DC converter and the Vicor Maxi that allow the Enphase micro‐inverter to draw current from the output of the Wilmore converter and not the Vicor Maxi converter?
The Vicor Maxi should output 36 V over an input DC range of 9‐36V. When loaded, why can’t the Vicor Maxi DC converter maintain this 36V across its output?
44
In order to answer these questions, the following tests troubleshoot the Vicor DC Maxi converter by applying resistive loads across its output.
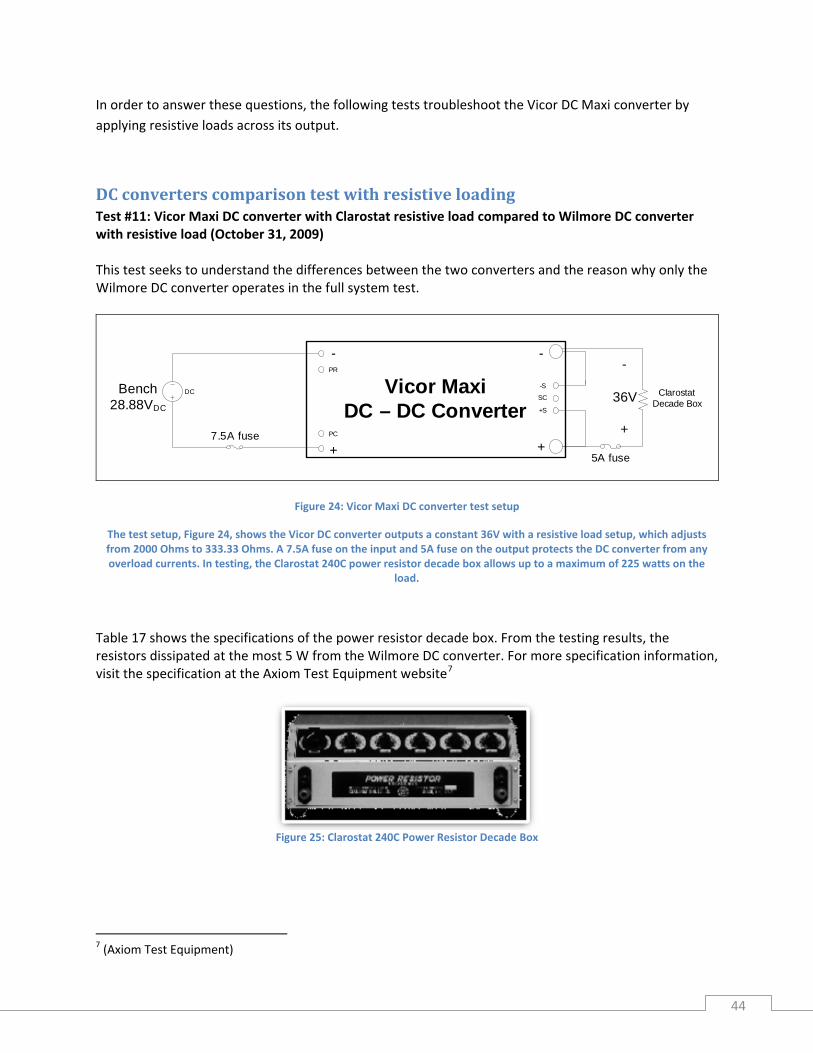
DC converters comparison test with resistive loading Test #11: Vicor Maxi DC converter with Clarostat resistive load compared to Wilmore DC converter with resistive load (October 31, 2009) This test seeks to understand the differences between the two converters and the reason why only the Wilmore DC converter operates in the full system test.
Vicor MaxiDC – DC Converter
DCBench 28.88VDC
-
36V
+
-PR
PC
+
SC
-S
+S
+
-
7.5A fuse
5A fuse
ClarostatDecade Box
Figure 24: Vicor Maxi DC converter test setup
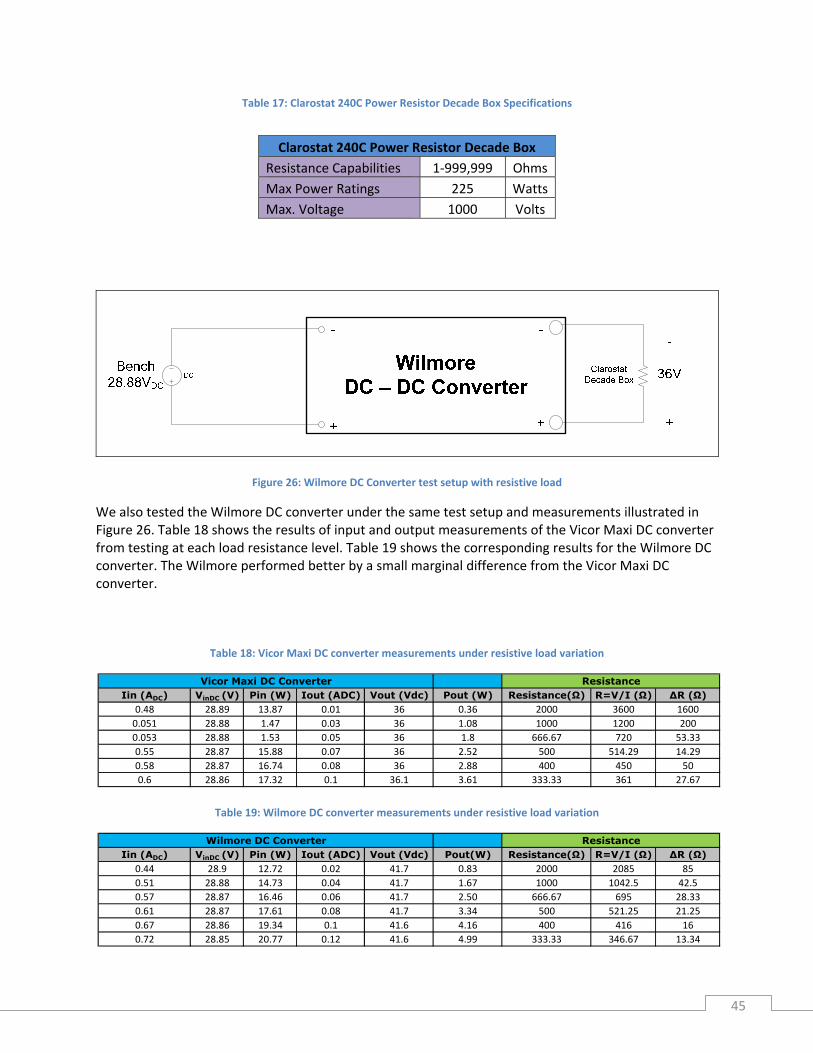
The test setup, Figure 24, shows the Vicor DC converter outputs a constant 36V with a resistive load setup, which adjusts from 2000 Ohms to 333.33 Ohms. A 7.5A fuse on the input and 5A fuse on the output protects the DC converter from any overload currents. In testing, the Clarostat 240C power resistor decade box allows up to a maximum of 225 watts on the
load.
Table 17 shows the specifications of the power resistor decade box. From the testing results, the resistors dissipated at the most 5 W from the Wilmore DC converter. For more specification information, visit the specification at the Axiom Test Equipment website7
Figure 25: Clarostat 240C Power Resistor Decade Box
7 (Axiom Test Equipment)
45
Table 17: Clarostat 240C Power Resistor Decade Box Specifications
Figure 26: Wilmore DC Converter test setup with resistive load
We also tested the Wilmore DC converter under the same test setup and measurements illustrated in Figure 26. Table 18 shows the results of input and output measurements of the Vicor Maxi DC converter from testing at each load resistance level. Table 19 shows the corresponding results for the Wilmore DC converter. The Wilmore performed better by a small marginal difference from the Vicor Maxi DC converter.
Table 18: Vicor Maxi DC converter measurements under resistive load variation
Table 19: Wilmore DC converter measurements under resistive load variation
Clarostat 240C Power Resistor Decade Box Resistance Capabilities 1‐999,999 Ohms Max Power Ratings 225 WattsMax. Voltage 1000 Volts
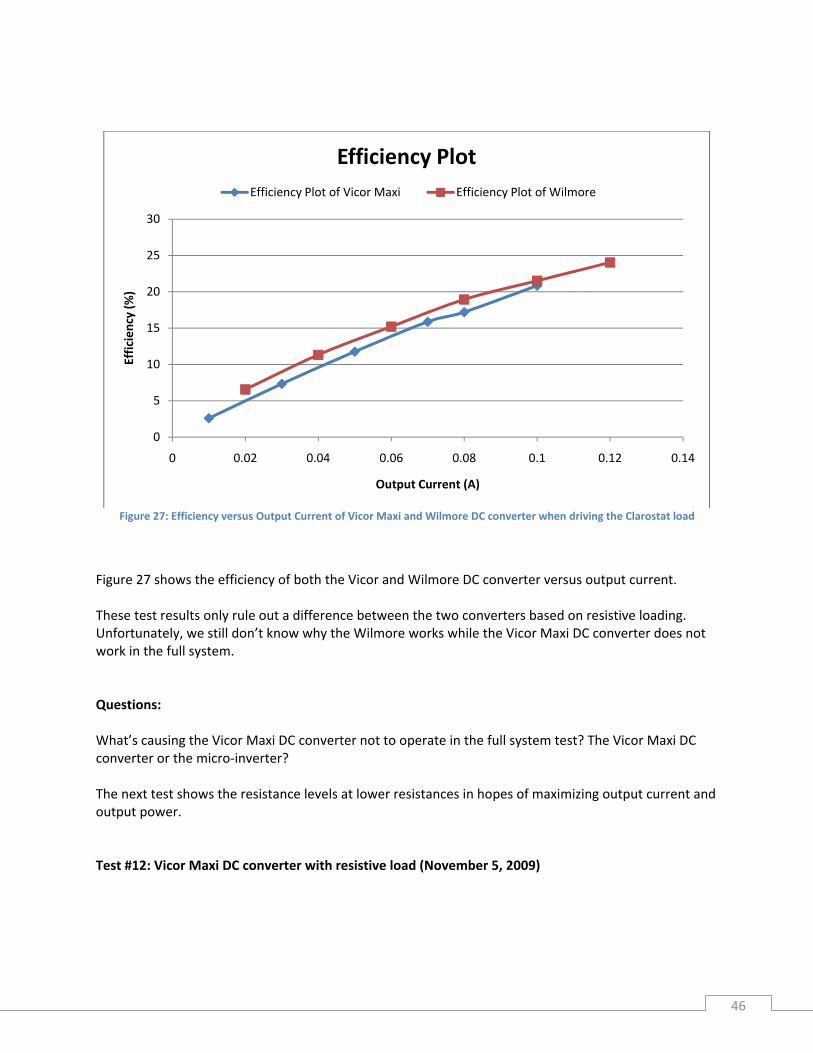
Figure 27: Efficiency versus Output Current of Vicor Maxi and Wilmore DC converter when driving the Clarostat load
0
5
10
15
20
25
30
0 0.02 0.04 0.06 0.08 0.1 0.12 0.14
Efficiency (%
)
Output Current (A)
Efficiency PlotEfficiency Plot of Vicor Maxi Efficiency Plot of Wilmore
Figure 27 shows the efficiency of both the Vicor and Wilmore DC converter versus output current. These test results only rule out a difference between the two converters based on resistive loading. Unfortunately, we still don’t know why the Wilmore works while the Vicor Maxi DC converter does not work in the full system. Questions: What’s causing the Vicor Maxi DC converter not to operate in the full system test? The Vicor Maxi DC converter or the micro‐inverter? The next test shows the resistance levels at lower resistances in hopes of maximizing output current and output power. Test #12: Vicor Maxi DC converter with resistive load (November 5, 2009)
46
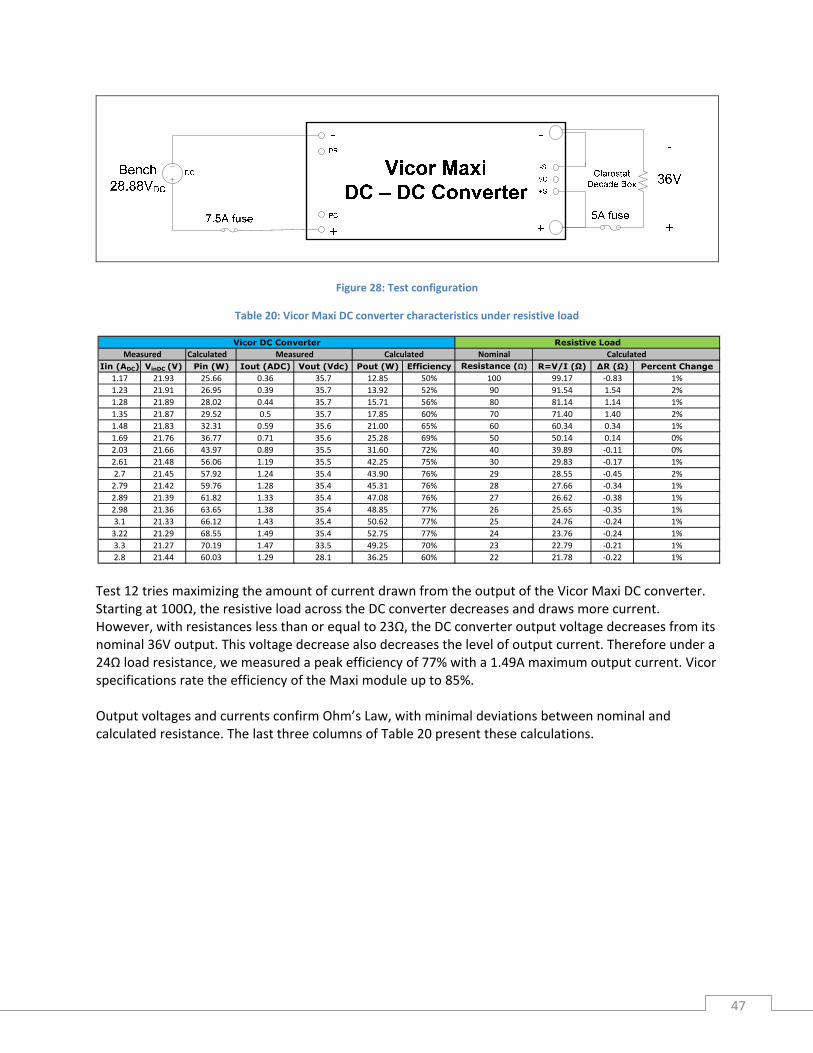
Figure 28: Test configuration
Table 20: Vicor Maxi DC converter characteristics under resistive load
Test 12 tries maximizing the amount of current drawn from the output of the Vicor Maxi DC converter. Starting at 100Ω, the resistive load across the DC converter decreases and draws more current. However, with resistances less than or equal to 23Ω, the DC converter output voltage decreases from its nominal 36V output. This voltage decrease also decreases the level of output current. Therefore under a 24Ω load resistance, we measured a peak efficiency of 77% with a 1.49A maximum output current. Vicor specifications rate the efficiency of the Maxi module up to 85%. Output voltages and currents confirm Ohm’s Law, with minimal deviations between nominal and calculated resistance. The last three columns of Table 20 present these calculations.
47
48
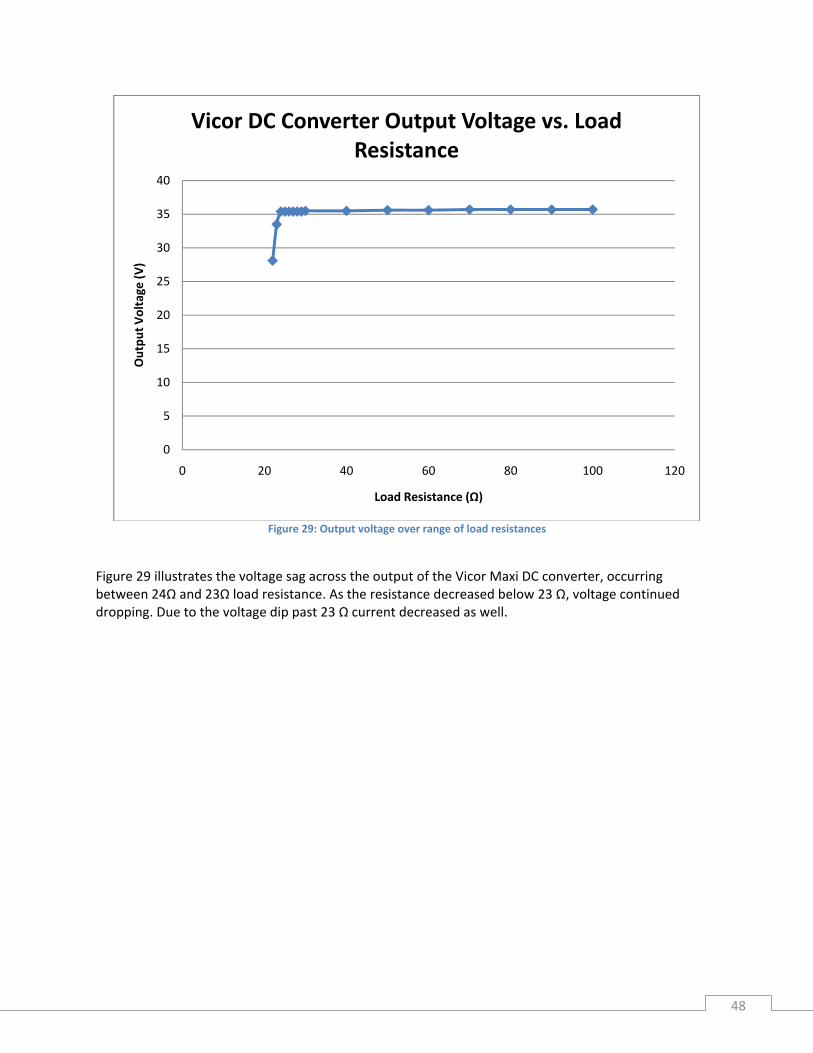
Figure 29: Output voltage over range of load resistances
Figure 29 illustrates the voltage sag across the output of the Vicor Maxi DC converter, occurring between 24Ω and 23Ω load resistance. As the resistance decreased below 23 Ω, voltage continued dropping. Due to the voltage dip past 23 Ω current decreased as well.
0
5
10
15
20
25
30
35
40
0 20 40 60 80 100
Outpu
t Voltage
(V)
Load Resistance (Ω)
Vicor DC Converter Output Voltage vs. Load Resistance
120
49
Figure 30: DC converter load current versus load resistance
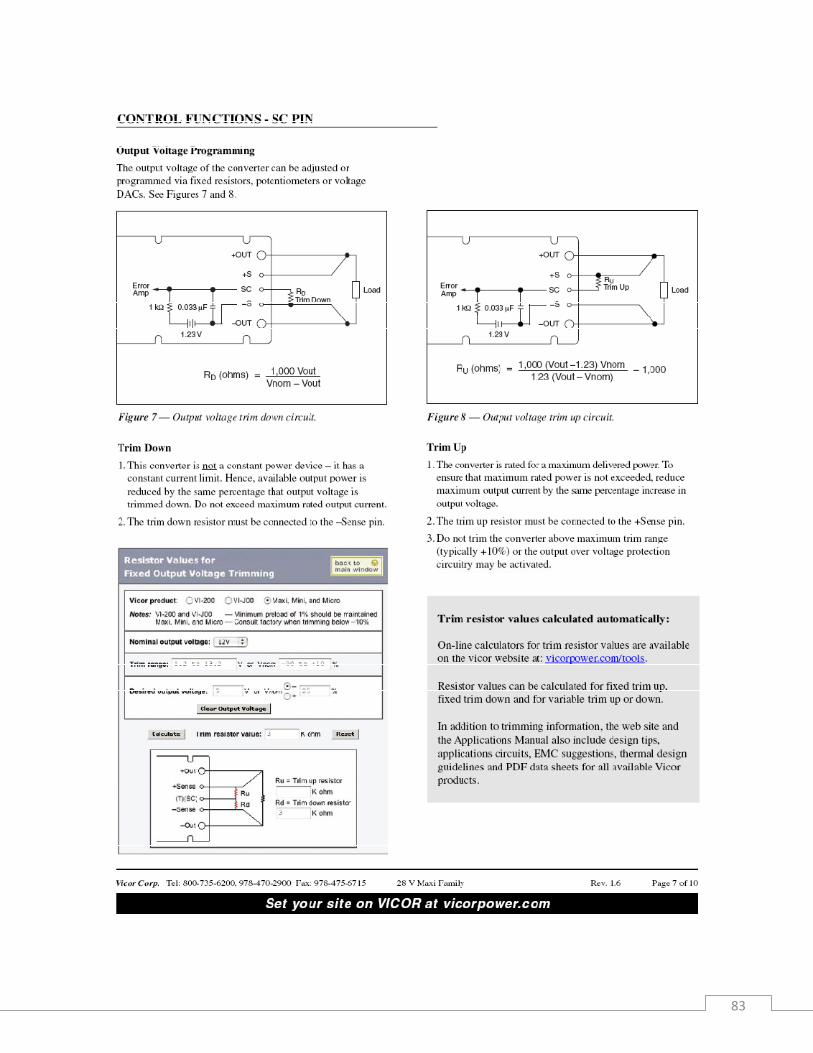
Instead of higher currents at lower load resistances, Figure 30 shows the output current of the Vicor Maxi DC converter decreasing below 23Ω. Speculation: The Vicor Maxi DC converter may contain onboard protection from output short circuit faults, reducing its output voltage as load resistance approaches zero. This test raises the following questions. Questions How do we achieve the maximum load current rating, 5.56A, listed in Table 13? What is causing the output voltage to drop below 36V at load resistances less than 24Ω?
0
0.2
0.4
0.6
0.8
1
1.2
1.4
1.6
0 20 40 60 80 100
Outpu
t Current (A
)
Load Resistance (Ω)
Vicor DC Converter Load Current vs. Load Resistance
120
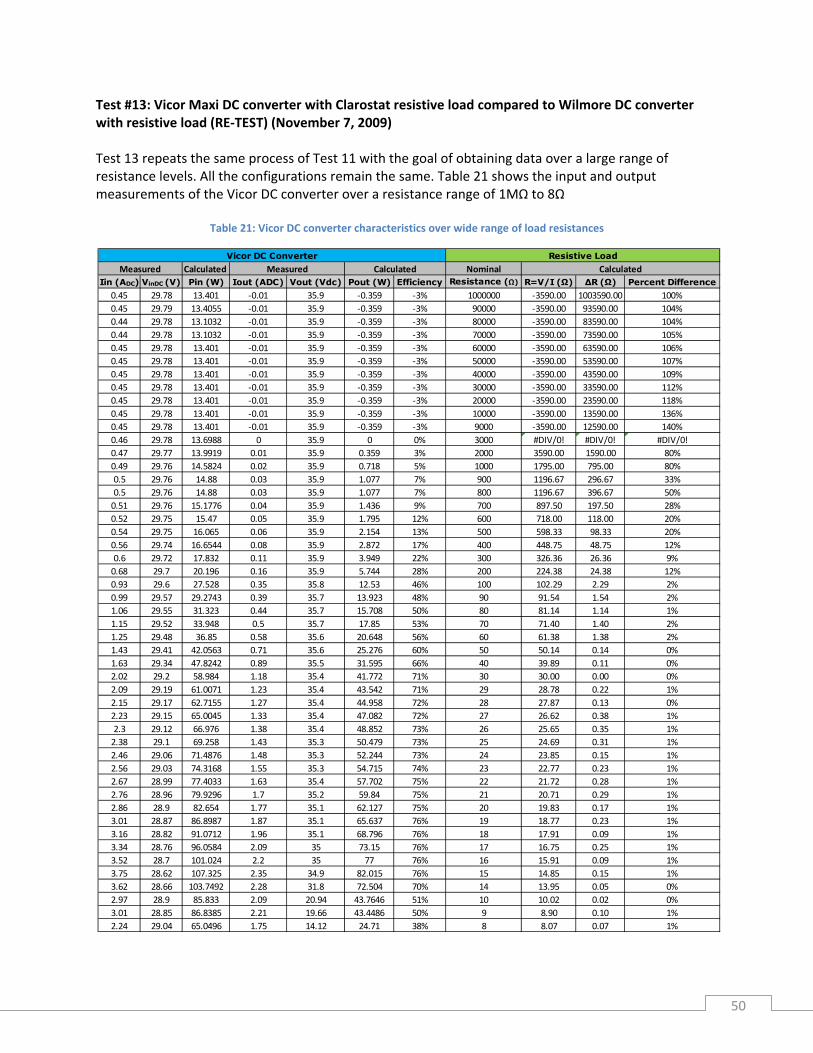
Test #13: Vicor Maxi DC converter with Clarostat resistive load compared to Wilmore DC converter with resistive load (RE‐TEST) (November 7, 2009) Test 13 repeats the same process of Test 11 with the goal of obtaining data over a large range of resistance levels. All the configurations remain the same. Table 21 shows the input and output measurements of the Vicor DC converter over a resistance range of 1MΩ to 8Ω
Table 21: Vicor DC converter characteristics over wide range of load resistances
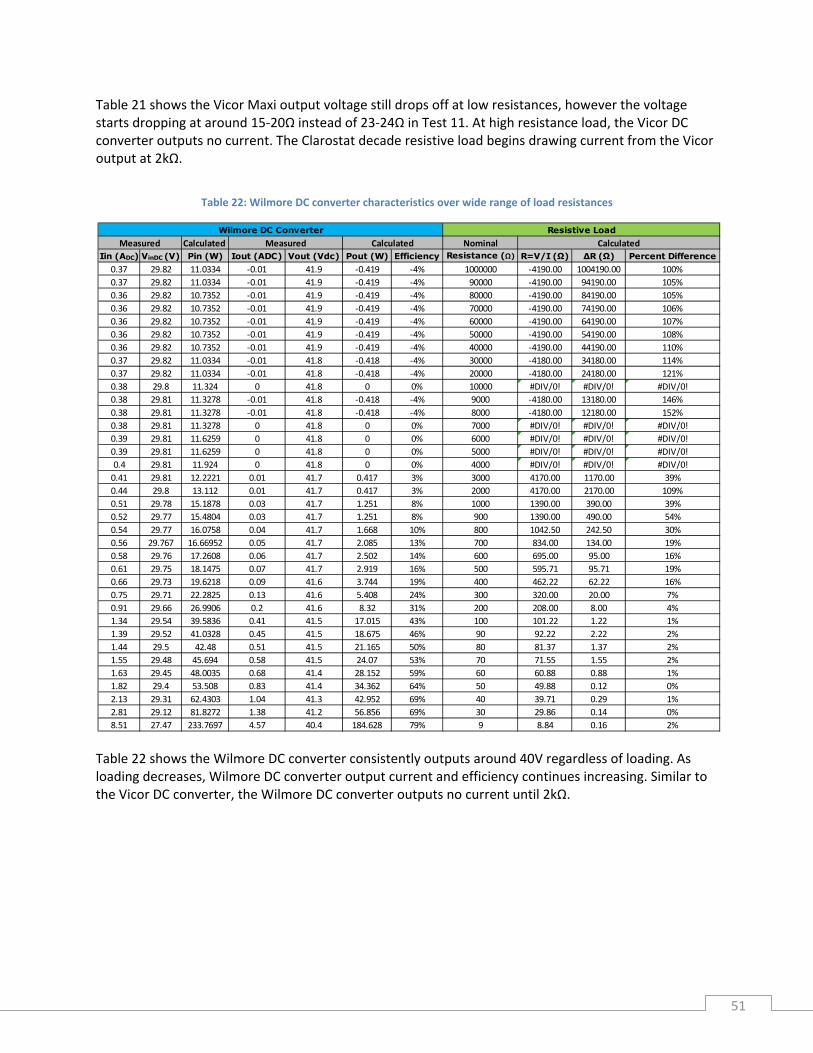
Table 21 shows the Vicor Maxi output voltage still drops off at low resistances, however the voltage starts dropping at around 15‐20Ω instead of 23‐24Ω in Test 11. At high resistance load, the Vicor DC converter outputs no current. The Clarostat decade resistive load begins drawing current from the Vicor output at 2kΩ.
Table 22: Wilmore DC converter characteristics over wide range of load resistances
Wilmore DC Converter Resistive LoadMeasured Measured Calculated Calculated
Table 22 shows the Wilmore DC converter consistently outputs around 40V regardless of loading. As loading decreases, Wilmore DC converter output current and efficiency continues increasing. Similar to the Vicor DC converter, the Wilmore DC converter outputs no current until 2kΩ.
51
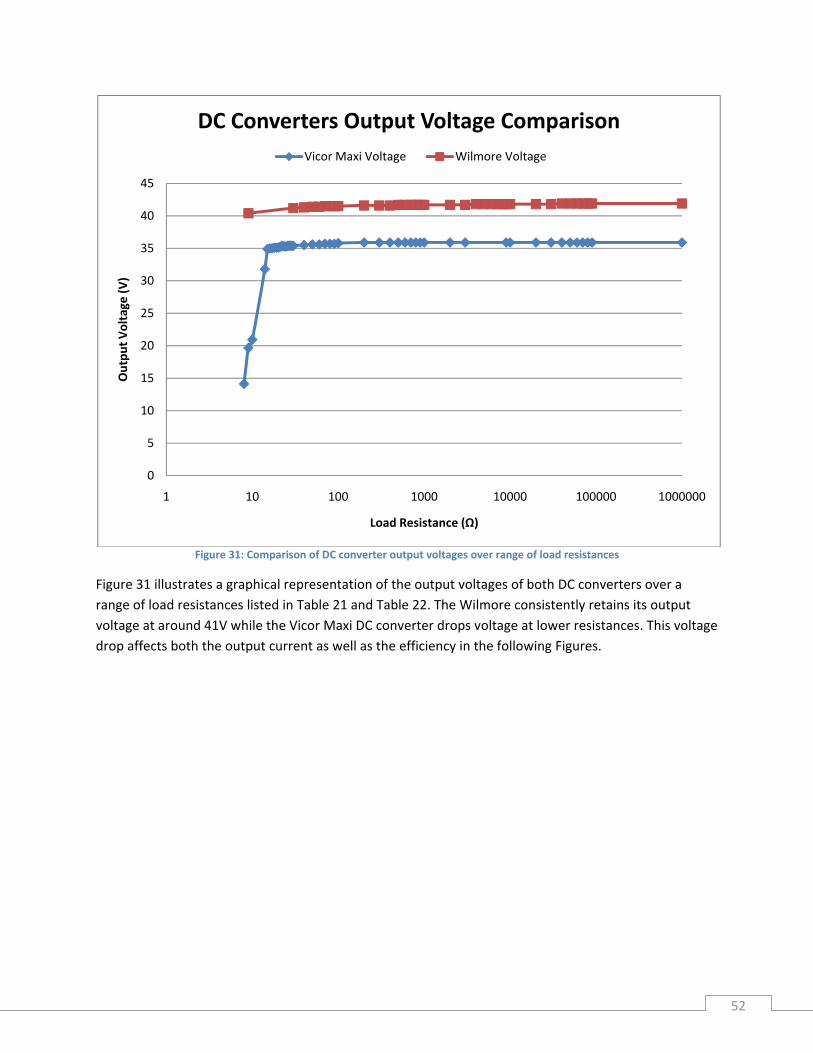
Figure 31: Comparison of DC converter output voltages over range of load resistances
0
5
10
15
20
25
30
35
40
45
1 10 100 1000 10000 100000 1000000
Outpu
t Voltage
(V)
Load Resistance (Ω)
DC Converters Output Voltage ComparisonVicor Maxi Voltage Wilmore Voltage
Figure 31 illustrates a graphical representation of the output voltages of both DC converters over a range of load resistances listed in Table 21 and Table 22. The Wilmore consistently retains its output voltage at around 41V while the Vicor Maxi DC converter drops voltage at lower resistances. This voltage drop affects both the output current as well as the efficiency in the following Figures.
52
0
0.5
1
1.5
2
2.5
3
3.5
4
4.5
5
1 10 100 1000 10000 100000 1000000
Curren
t (A)
Load Resistance (Ω)
DC Converters Output Current ComparisonVicor Output Current Wilmore Output Current
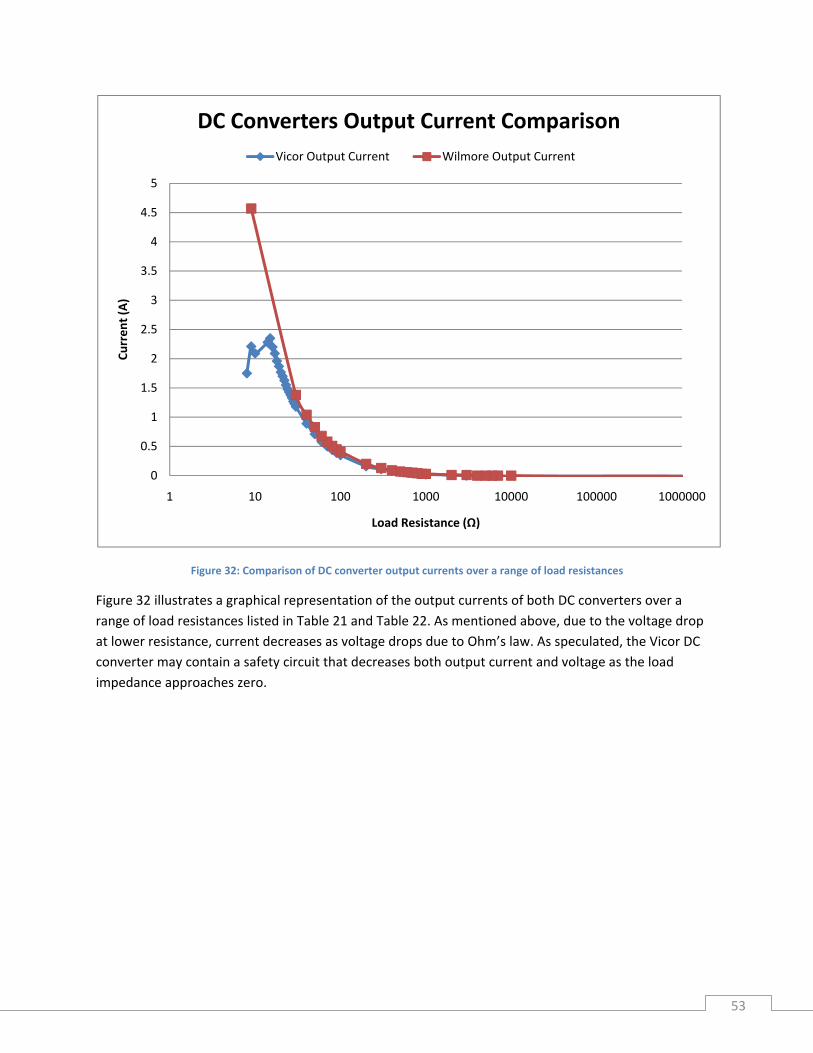
Figure 32: Comparison of DC converter output currents over a range of load resistances
Figure 32 illustrates a graphical representation of the output currents of both DC converters over a range of load resistances listed in Table 21 and Table 22. As mentioned above, due to the voltage drop at lower resistance, current decreases as voltage drops due to Ohm’s law. As speculated, the Vicor DC converter may contain a safety circuit that decreases both output current and voltage as the load impedance approaches zero.
53
0%
10%
20%
30%
40%
50%
60%
70%
80%
90%
1 10 100 1000 10000 100000 1000000
Efficiency (%
)
Load Resistance (Ω)
DC Converter Efficiencies ComparisonVicor Maxi Efficiency Wilmore Efficiency
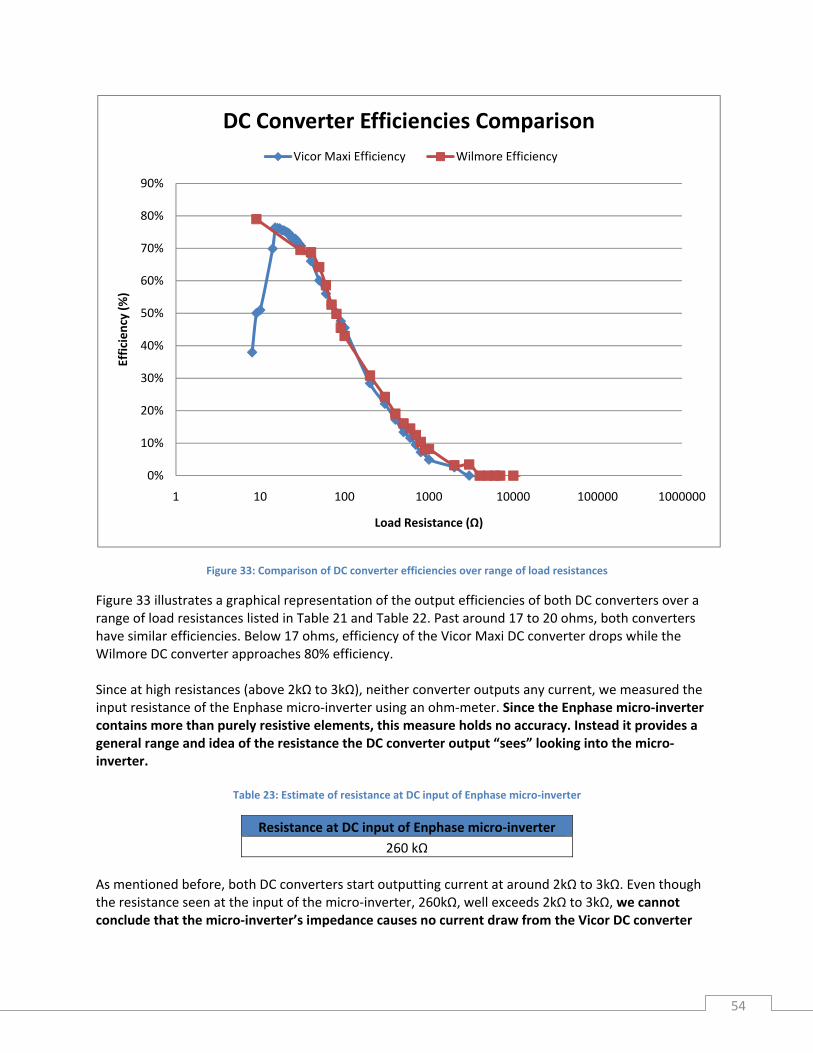
Figure 33: Comparison of DC converter efficiencies over range of load resistances
Figure 33 illustrates a graphical representation of the output efficiencies of both DC converters over a range of load resistances listed in Table 21 and Table 22. Past around 17 to 20 ohms, both converters have similar efficiencies. Below 17 ohms, efficiency of the Vicor Maxi DC converter drops while the Wilmore DC converter approaches 80% efficiency. Since at high resistances (above 2kΩ to 3kΩ), neither converter outputs any current, we measured the input resistance of the Enphase micro‐inverter using an ohm‐meter. Since the Enphase micro‐inverter contains more than purely resistive elements, this measure holds no accuracy. Instead it provides a general range and idea of the resistance the DC converter output “sees” looking into the micro‐inverter.
Table 23: Estimate of resistance at DC input of Enphase micro‐inverter
Resistance at DC input of Enphase micro‐inverter 260 kΩ
As mentioned before, both DC converters start outputting current at around 2kΩ to 3kΩ. Even though the resistance seen at the input of the micro‐inverter, 260kΩ, well exceeds 2kΩ to 3kΩ, we cannot conclude that the micro‐inverter’s impedance causes no current draw from the Vicor DC converter
54
output under full system testing. The fact that the Wilmore DC converter draws current during full system testing invalidates the micro‐inverter’s impedance as a cause for system failure. We are still trying to understand how and why the Wilmore out‐performs the Vicor Maxi DC converter. Vicor Customer Service Suggestions On Thursday, November 12, 2009, Vicor application’s engineer, John Kovacs received the test results from the resistive load testing in order to determine correct operation of the DC converter. Mr. Kovacs confirmed previous speculations during our testing (documented above) of an over‐current feature of the Vicor Maxi DC converter that occurs when current exceeds the 5.56A load current maximum rating. With the over‐current feature activating at 2.56A instead of the rated 5.56A maximum, Mr. Kovacs, concluded that the DC converter fails in proper operation. Per his review and due to the mismatch in operation from the DC converter model’s specification, we shipped the Vicor Maxi DC converter back to Vicor Corporation for troubleshooting. Appendix D lists Mr. Kovac’s suggestions of optimizing performance of the DC converter
Vicor Maxi Specification Verification after Return of DC Converter module from Vicor Corporation (Electronic Loading) After undergoing testing at Vicor Corporation in Andover, Massachusetts, Vicor technicians determined “no fault” and full operation of the returned Vicor Maxi DC converter. Test #14: Vicor Maxi Specification Verification using HP DC supply and BK Precision DC Electronic Load (December 1, 2009)
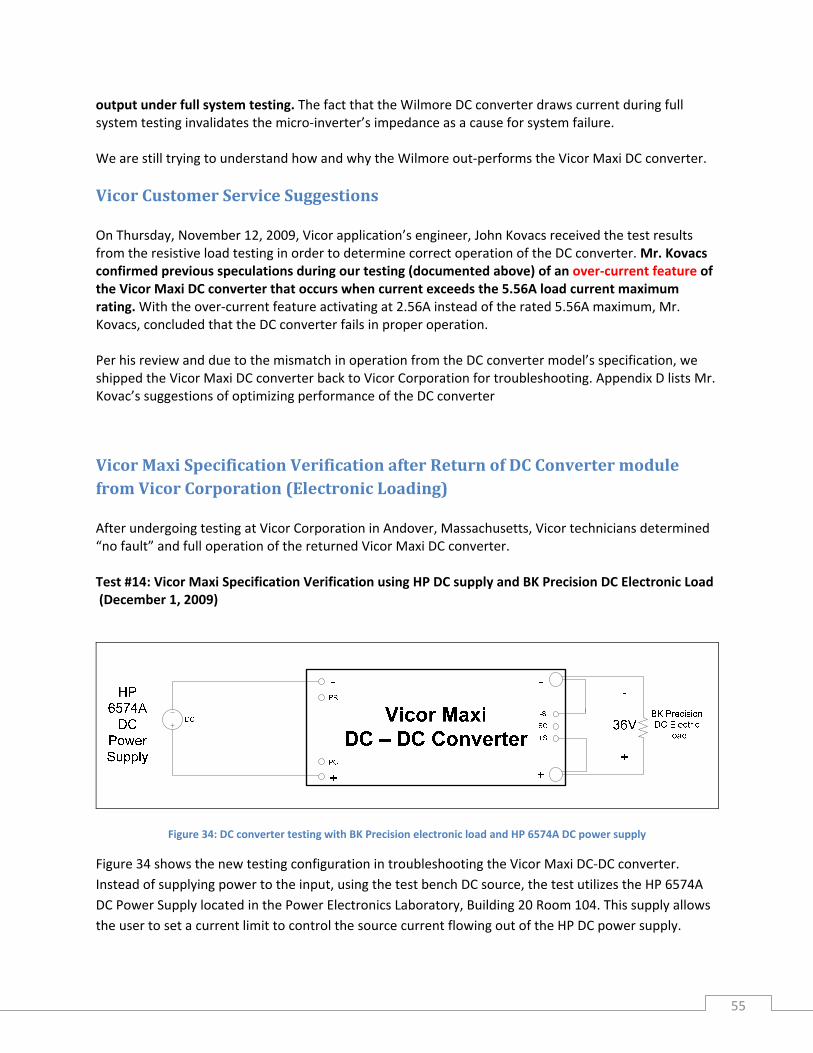
Figure 34: DC converter testing with BK Precision electronic load and HP 6574A DC power supply
Figure 34 shows the new testing configuration in troubleshooting the Vicor Maxi DC‐DC converter. Instead of supplying power to the input, using the test bench DC source, the test utilizes the HP 6574A DC Power Supply located in the Power Electronics Laboratory, Building 20 Room 104. This supply allows the user to set a current limit to control the source current flowing out of the HP DC power supply.
55
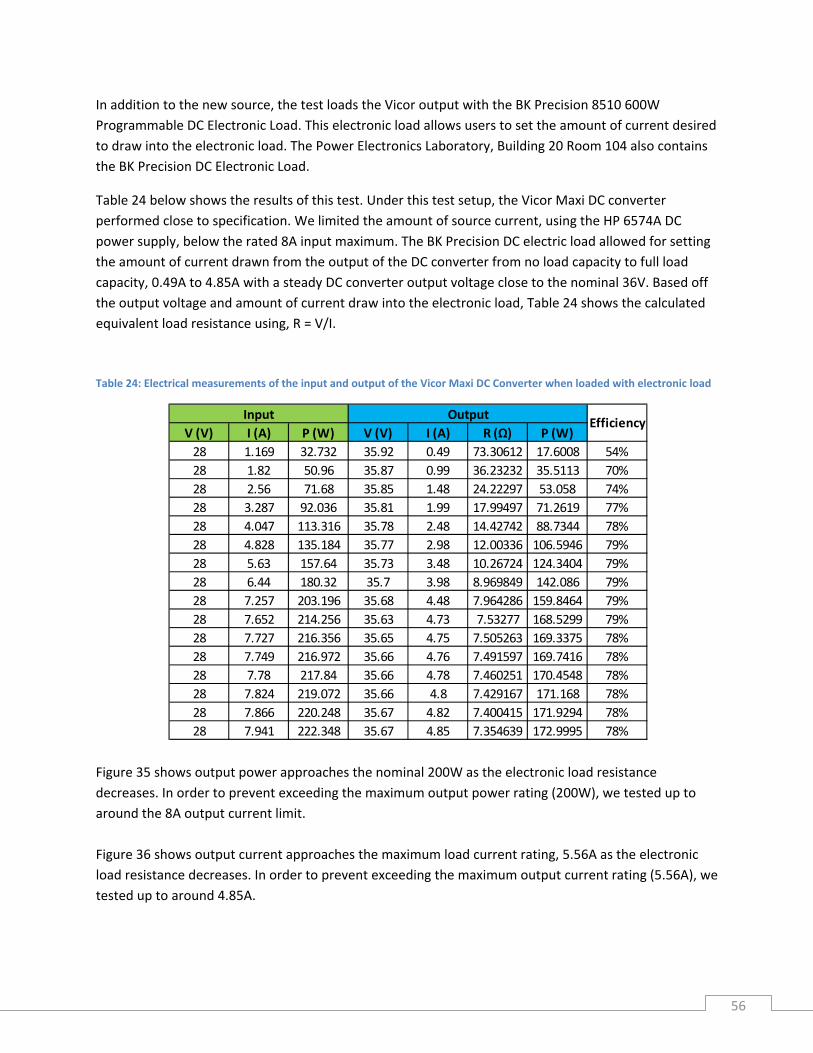
In addition to the new source, the test loads the Vicor output with the BK Precision 8510 600W Programmable DC Electronic Load. This electronic load allows users to set the amount of current desired to draw into the electronic load. The Power Electronics Laboratory, Building 20 Room 104 also contains the BK Precision DC Electronic Load.
Table 24 below shows the results of this test. Under this test setup, the Vicor Maxi DC converter performed close to specification. We limited the amount of source current, using the HP 6574A DC power supply, below the rated 8A input maximum. The BK Precision DC electric load allowed for setting the amount of current drawn from the output of the DC converter from no load capacity to full load capacity, 0.49A to 4.85A with a steady DC converter output voltage close to the nominal 36V. Based off the output voltage and amount of current draw into the electronic load, Table 24 shows the calculated equivalent load resistance using, R = V/I. Table 24: Electrical measurements of the input and output of the Vicor Maxi DC Converter when loaded with electronic load
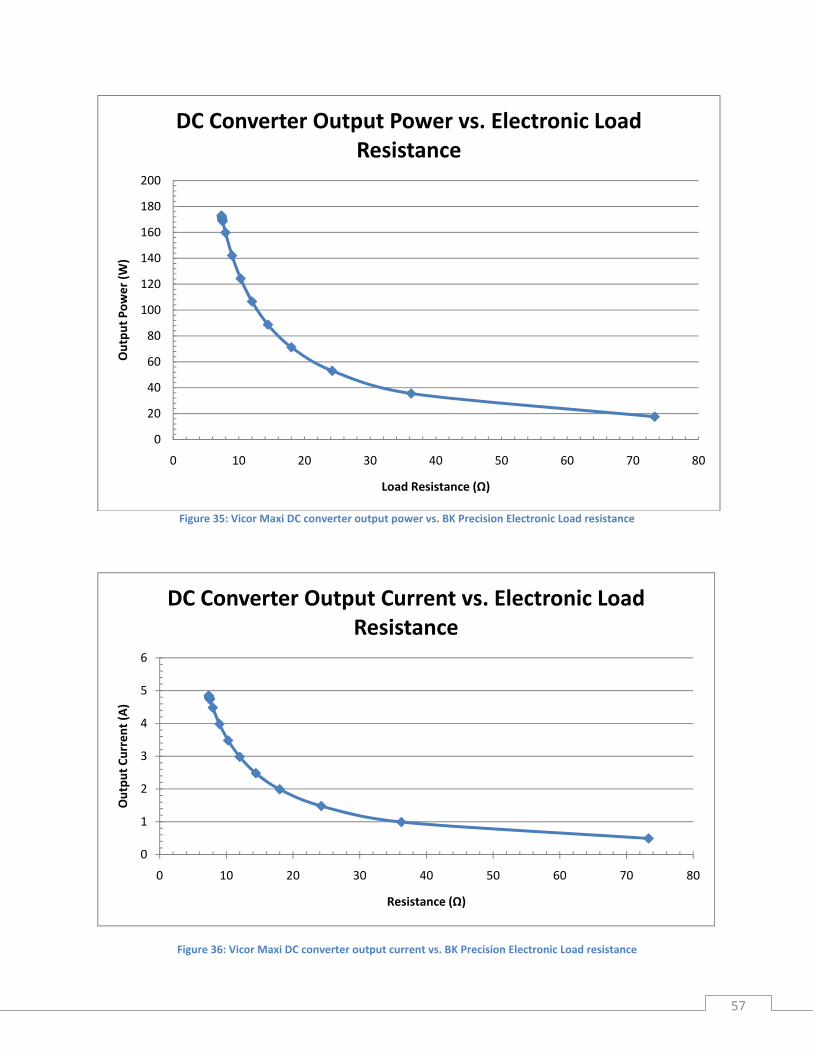
Figure 35 shows output power approaches the nominal 200W as the electronic load resistance decreases. In order to prevent exceeding the maximum output power rating (200W), we tested up to around the 8A output current limit. Figure 36 shows output current approaches the maximum load current rating, 5.56A as the electronic load resistance decreases. In order to prevent exceeding the maximum output current rating (5.56A), we tested up to around 4.85A.
56
57
Figure 35: Vicor Maxi DC converter output power vs. BK Precision Electronic Load resistance
Figure 36: Vicor Maxi DC converter output current vs. BK Precision Electronic Load resistance
0
20
40
60
80
100
120
140
160
180
200
0 10 20 30 40 50 60 70 8
Outpu
t Pow
er (W
)
Load Resistance (Ω)
DC Converter Output Power vs. Electronic Load Resistance
0
0
1
2
3
4
5
6
0 10 20 30 40 50 60 70 8
Outpu
t Current (A
)
Resistance (Ω)
DC Converter Output Current vs. Electronic Load Resistance
0
58
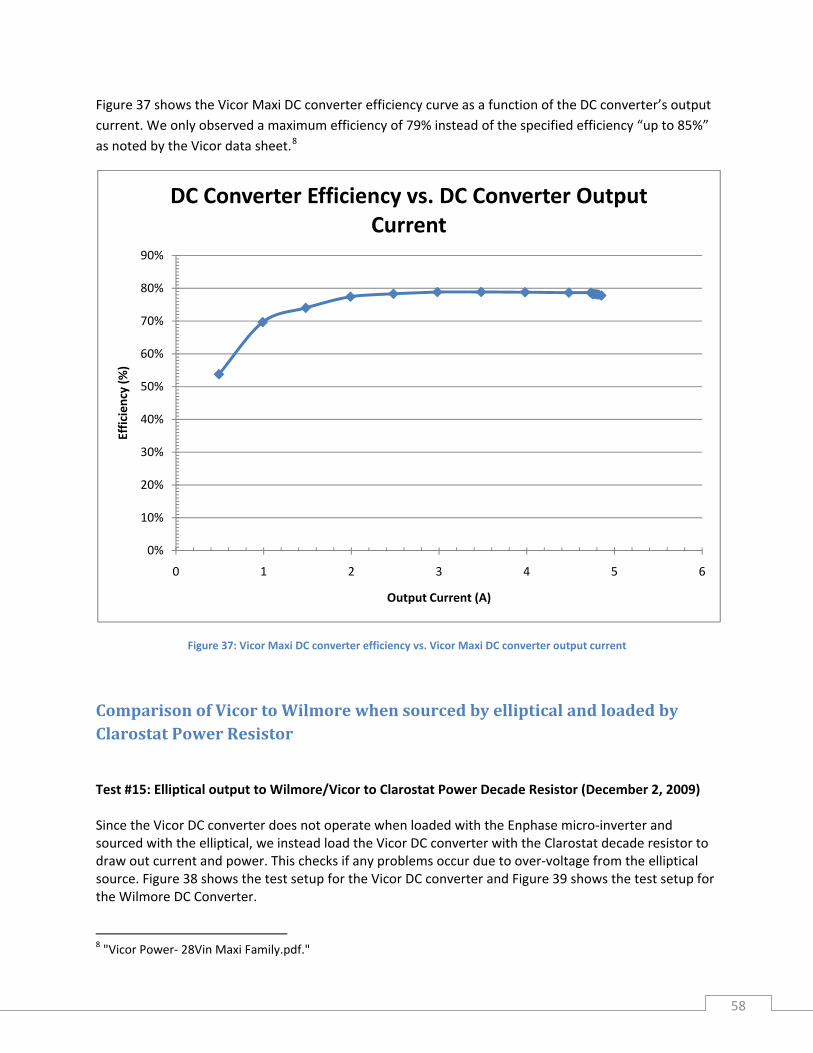
Figure 37 shows the Vicor Maxi DC converter efficiency curve as a function of the DC converter’s output current. We only observed a maximum efficiency of 79% instead of the specified efficiency “up to 85%” as noted by the Vicor data sheet.8
Figure 37: Vicor Maxi DC converter efficiency vs. Vicor Maxi DC converter output current
Comparison of Vicor to Wilmore when sourced by elliptical and loaded by Clarostat Power Resistor
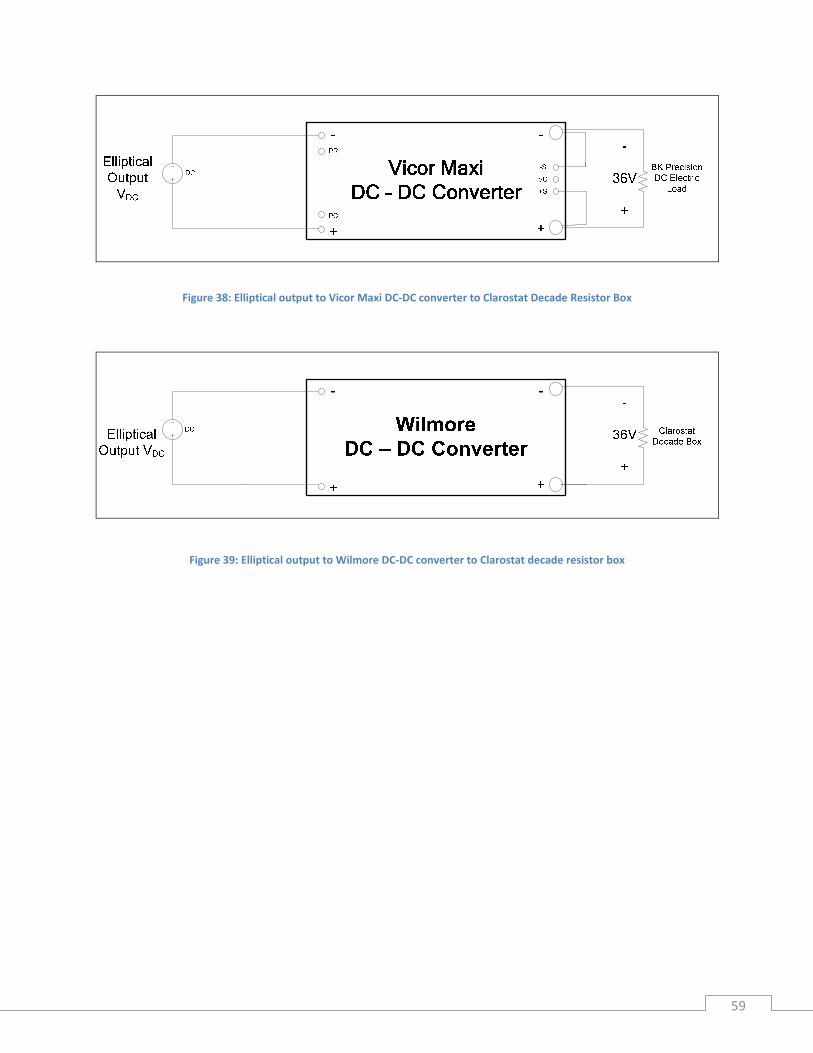
Test #15: Elliptical output to Wilmore/Vicor to Clarostat Power Decade Resistor (December 2, 2009) Since the Vicor DC converter does not operate when loaded with the Enphase micro‐inverter and sourced with the elliptical, we instead load the Vicor DC converter with the Clarostat decade resistor to draw out current and power. This checks if any problems occur due to over‐voltage from the elliptical source. Figure 38 shows the test setup for the Vicor DC converter and Figure 39 shows the test setup for the Wilmore DC Converter.
8 "Vicor Power‐ 28Vin Maxi Family.pdf."
0%
10%
20%
30%
40%
50%
60%
70%
80%
90%
0 1 2 3 4 5 6
Efficiency (%
)
Output Current (A)
DC Converter Efficiency vs. DC Converter Output Current
Figure 38: Elliptical output to Vicor Maxi DC‐DC converter to Clarostat Decade Resistor Box
Figure 39: Elliptical output to Wilmore DC‐DC converter to Clarostat decade resistor box
59
60
Table 25: Electrical measurements of input and output of Vicor DC converter when sourced by elliptical and loaded with Clarostat
The following lists additional testing conditions that yielded the results in Table 25.
• Elliptical speed maintained at 120 strides per minute • When elliptical switched to resistance 10, high pitched whining occurs from the Vicor Maxi DC
converter. The results in Table 25 suggest that an elliptical resistance setting beyond nine will output a voltage greater than the Vicor Maxi’s capability. The Vicor Maxi’s rating states a 9‐36V input. Beyond resistance setting nine, onboard protection in the Vicor Maxi shuts it off due to “over‐voltage,” yielding no power output. Table 26 provides the Vicor Maxi over‐voltage specifications.
min typ max unitOver-voltage turn off 36.3 37.8 39.6 Vdc
Vicor Maxi Over-voltage Specs
The results in Table 27 below show that when loaded with the Wilmore DC converter, the elliptical output voltage ranges up to 47.1 V under this test configuration. The Wilmore DC converter’s rating states an input voltage range of 21‐29V. Since the Wilmore contains no special protection mechanisms, beyond the rated 29V, it continues to output the rated 41V output at a constant current. As resistance levels increase, input power into the Wilmore DC converter increases as well while output power remains constant. This suggests that the excess power at the input dissipates within the Wilmore DC converter itself. The decrease in Wilmore converter efficiency highlights this fact as well, since essentially at resistance level 15, the converter outputs 36% of the power entering the Wilmore converter. As shown in Table 27, elliptical user lowers pace in order to protect the system equipment from power surging. As the user petals faster, the elliptical outputs slightly more current and voltage. Table 27: Electrical measurements of input and output of Wilmore DC converter when sourced by elliptical and loaded with
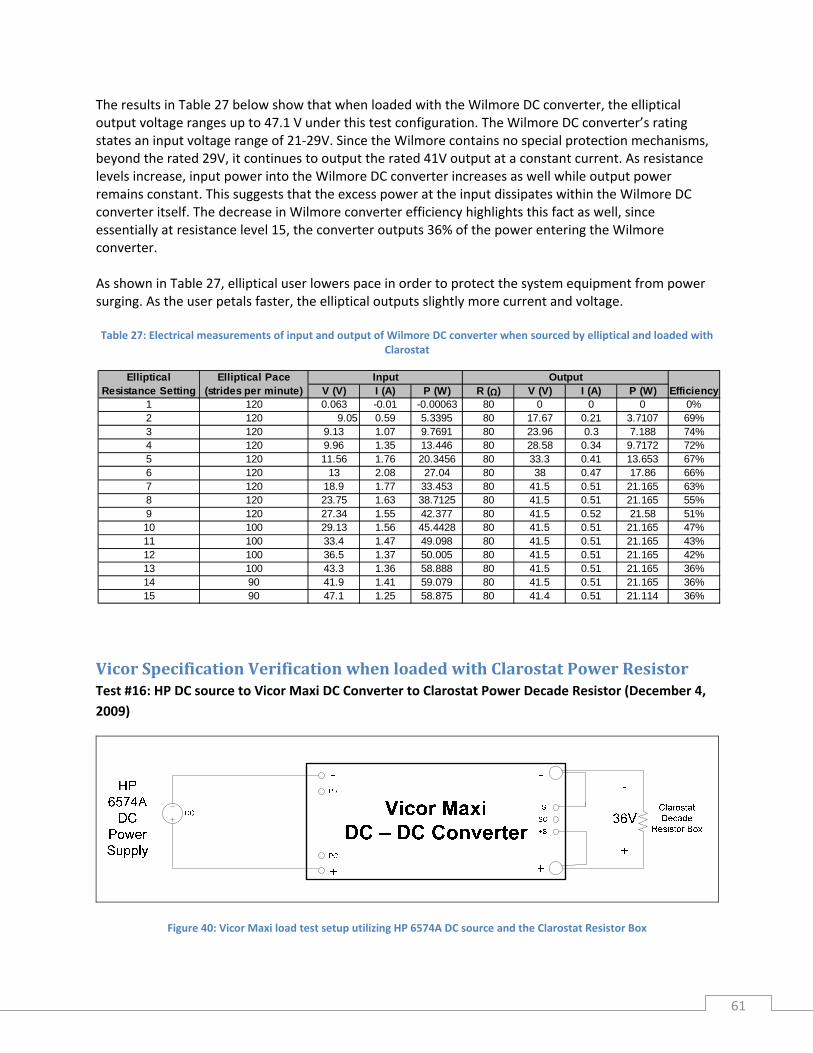
Vicor Specification Verification when loaded with Clarostat Power Resistor Test #16: HP DC source to Vicor Maxi DC Converter to Clarostat Power Decade Resistor (December 4, 2009)
Figure 40: Vicor Maxi load test setup utilizing HP 6574A DC source and the Clarostat Resistor Box
61
Unlike the test bench source utilized in Test 11, the HP 6574A DC power supply allows the user to set a current limit. We set this current limit to 7.5A in order to protect in the input of the Vicor Maxi DC converter (8A max input current). Figure 40 shows the test setup similar to the one used in Test 11. Table 28 shows the results to this test, which match the Vicor Maxi specification as well as the results to the previous resistive loading test that used the BK Precision electronic load, Table 24.
Table 28: VIcor maxi resistive loading test results using the HP DC source and the Clarostat decade box
We only took points at 9Ω and 8Ω since the Clarostat decade box has a 1.5A current rating above 9Ω. Below 8Ω, the current exceeds the Clarostat 5A current limit. Test #11 and #12 kept the resistance range above 9Ω in which the current limit on the Clarostat decade box rated at 1.5A. This 1.5A current limit prevented the DC converter output current from reaching its 5.56A maximum rating, proving correct DC converter operation under resistive loading.
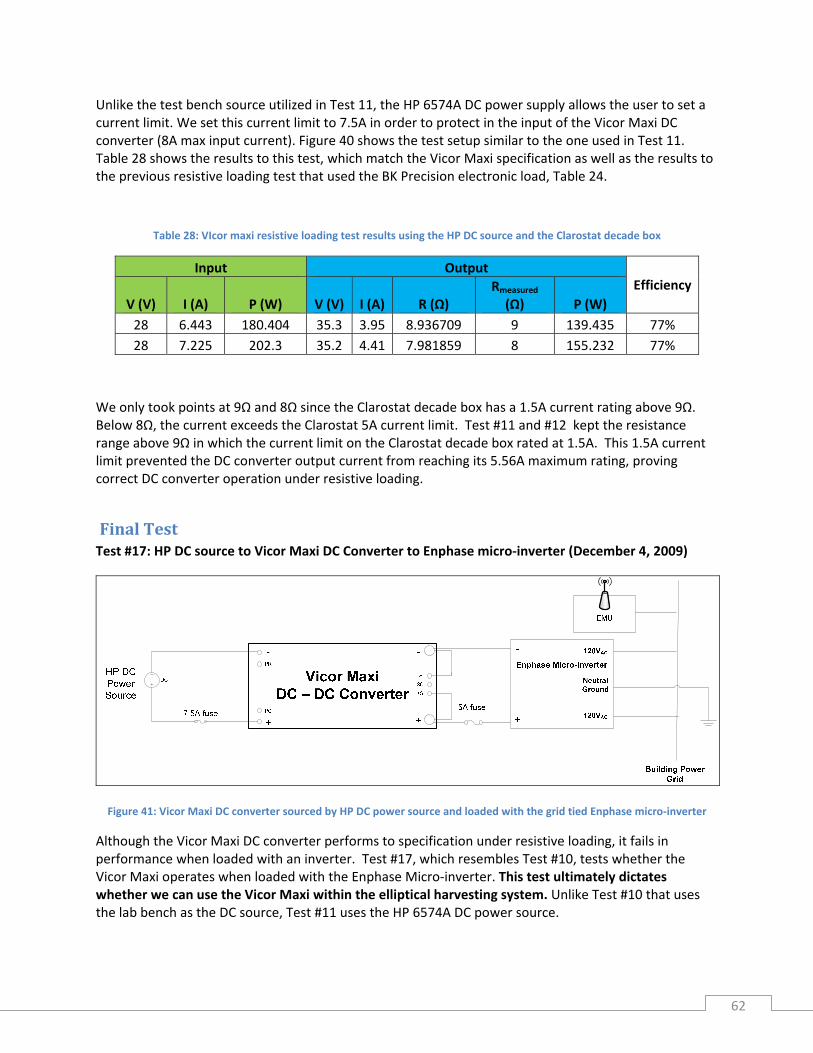
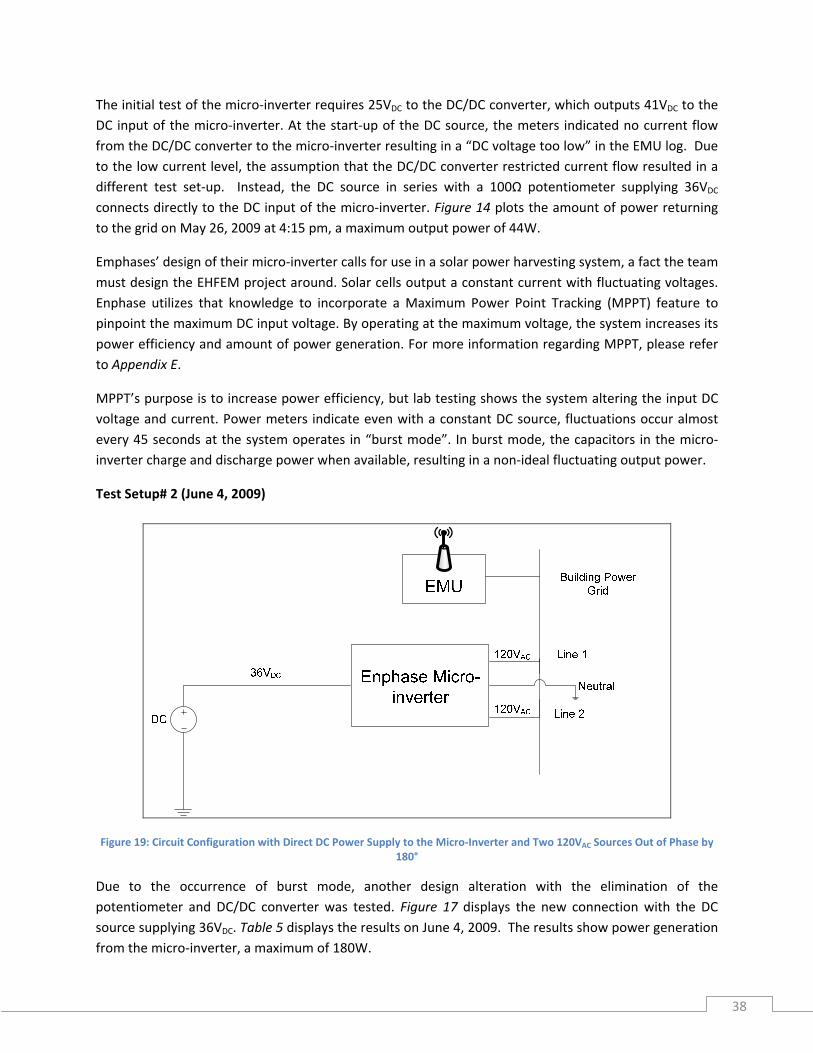
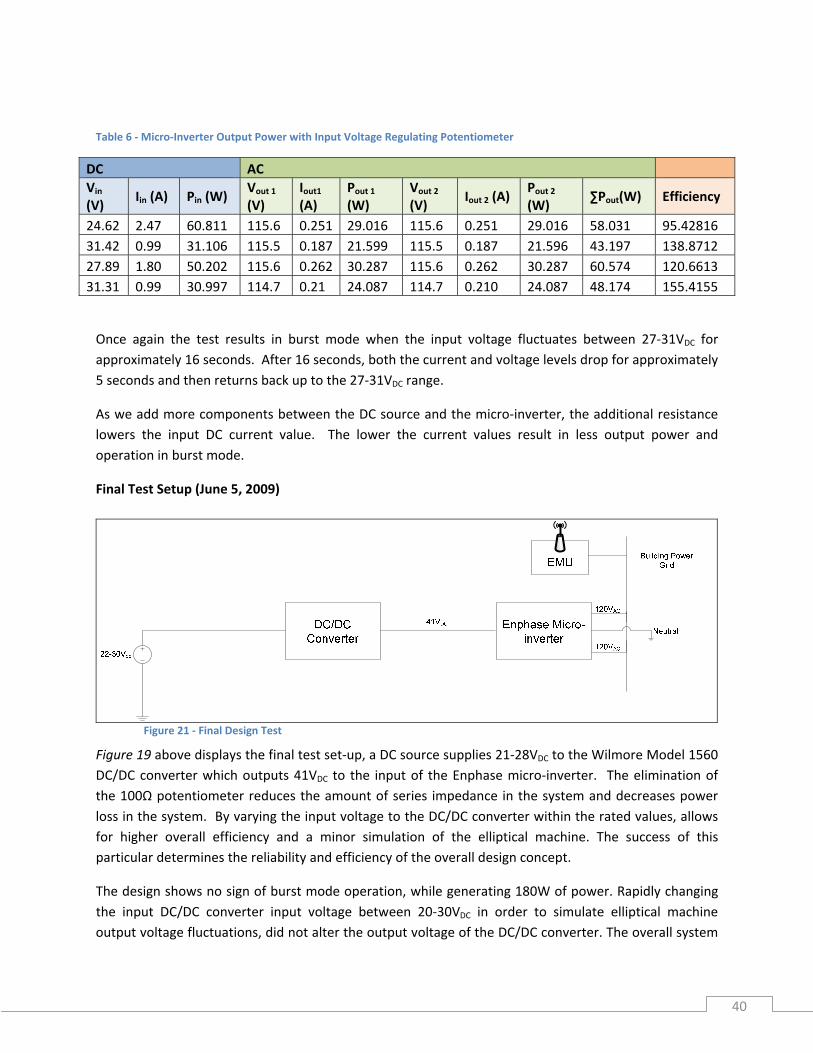
Final Test Test #17: HP DC source to Vicor Maxi DC Converter to Enphase micro‐inverter (December 4, 2009)
Figure 41: Vicor Maxi DC converter sourced by HP DC power source and loaded with the grid tied Enphase micro‐inverter
Although the Vicor Maxi DC converter performs to specification under resistive loading, it fails in performance when loaded with an inverter. Test #17, which resembles Test #10, tests whether the Vicor Maxi operates when loaded with the Enphase Micro‐inverter. This test ultimately dictates whether we can use the Vicor Maxi within the elliptical harvesting system. Unlike Test #10 that uses the lab bench as the DC source, Test #11 uses the HP 6574A DC power source.
62
Table 29: Vicor Maxi test results when sourced by the HP DC power source and loaded with the Enphase micro‐inverter
Enphase Micro‐inverterV (V) I (A) P (W) V (V) I (A) R (Ω) P (W) I (A)28 0.5 14 0.028 0.01 2.8 0.00028 0% 0.04
Input OutputEfficiency
Table 29 proves the Vicor Maxi 28V Wide Input DC converter will not work when loaded with the Enphase micro‐inverter due to internal protection mechanisms that prevent current from flowing into and out of the converter. Even though we set the HP 6574A DC power source to 28V with a current limit of 6.5A, the Maxi converter prevents any input current flow. Therefore the Vicor Maxi converter fails to output any current at the proper 36V into the Enphase micro‐inverter. When we remove the Enphase micro‐inverter load from the Vicor Maxi DC converter, we measure the nominal open circuit 36V DC across the DC converter output. In consulting with Vicor applications engineer John Kovacs as noted on page 76 of Appendix D, loading the Vicor Maxi DC converter with an inverter is the worst possible load case scenario since inverters chop up the incoming DC signal. This signal chopping creates harmonics and high voltage transients, which causes the Vicor Maxi DC converter to shutdown as shown in Table 29.
63
Chapter 4 Design Realization and Verification Design Realization The previous tests all suggest and conclude that the Vicor Maxi DC converter will not operate in the elliptical energy harvesting system (even when sourced by a constant DC input) due to a number of reasons listed below. Vicor Maxi DC Converter Input Over‐voltage Issues
1. Precor output voltage discrepancies when loaded with different loads
According to the tests listed below, the output voltage range of the Precor elliptical changes when loaded with various loads. This affects choosing an input range for an appropriate DC‐DC converter. • According to Table 3 in Appendix F on page 33, the potential output voltage range when
loaded with the original resistive coils is 8‐60V.
• Under the full system test that utilizes the Wilmore DC converter, output voltage from the elliptical never exceeds 11.30V. See Table 10 in Appendix F on page 48.
Test #8 and Test #15 show the Precor supplies overvoltage to the Vicor DC converter which causes protection mechanisms to shut the converter down.
• From Test #8 on page 39, the output voltage from the elliptical machine reaches up to
around 28V before the Vicor DC converter shuts down due to over voltage.
• In Table 27 on page 61, the Wimore DC converter, on the other hand continues to output the nominal 41V past its 21‐29V input operating range because it has no internal protection shutting it off. By increasing the resistance settings on the elliptical, the Wilmore DC converter input voltage increases, while the efficiency of the Wilmore DC converter decreases.
• When loaded with the Vicor Maxi DC converter as in Test #15 on page 58, the elliptical can
generate voltage over 30.9V. Above 30.9V, the Vicor Maxi DC converter outputs nothing. Vicor Maxi DC Converter “Output Over‐current/Low Load Resistance” Issues
2. The Vicor Maxi DC converter will not output any DC voltage when loaded with a low resistance load, i.e. the micro‐inverter, as shown by Table 29 on page 62. When the Vicor Maxi DC converter connects to the micro‐inverter, the equivalent resistance its sees is most likely very low; therefore the over‐current protection on the Vicor Maxi DC converter prevents any input or output current. It also outputs zero volts as shown in Table 29.
64
Design Verification Due to the incompatibility of the Vicor Maxi DC converter with the rest of the system, we verified that the initial design will not work. The Wilmore DC converter will not work either in the final system implementation because:
1. Its operating range does not match the system requirements. 2. It is too large to mount on the Elliptical machine. 3. Its casing contains holes for heating ventilation that poses safety risks when exposed to
hazardous gym conditions such as sweat and water bottles.
Despite the Vicor Maxi’s incompatibility with the rest of the system, the project verified the need for protective fuses and implemented these safety precautions into the system. These appropriately rated fuses protect the modules based on the current limits of the adjacent components. Note in the future, these fuses will need resizing depending on the ratings of the DC converter chosen to implement into the system. The project engineer must size the fuse based on the smallest current rating of the two components the fuse interfaces.
Chapter 5 Conclusion Through many testing configurations and troubleshooting, the Vicor Maxi DC converter fails to operate under the full system set up. Loading the Vicor Maxi DC converter with the Enphase micro‐inverter violates the Vicor Maxi converter’s operating range triggering internal alarms and protection, therefore causing it to shut off. We attributed one of the causes of this behavior to over‐current shutdown on the output. If the converter sees a low resistance across its output that draws an output current greater than the rated 5.56A, the converter will shut down. Over‐voltages on the input of the Vicor Maxi DC converter also shut down the converter. As discussed in the previous section, different loading yields different elliptical output voltages, making it difficult to know the exact input voltage range to size the DC converter under. After learning about the Vicor Maxi’s sensitivity to precise operating electric levels, the Vicor Maxi proves unfeasible for use in such an electrically dynamic application. Applications involving the Vicor Maxi discourage high transients in which the Precor elliptical outputs. Despite the incompatibility between the Vicor Maxi DC converter and self generating elliptical system, demonstrations held this quarter exposed faculty and students to the operating prototype system, which allowed users to generate up to 70‐80W back into the electric grid. While utilizing the Wilmore converter, this operational energy harvesting prototype provides a base case for future projects to optimize its capability. The project highlights the need for a custom built DC to DC converter to implement into the system. In custom building the DC converter, this future project will allow for higher levels of understanding in sizing and adjusting the DC converter circuit components during troubleshooting. Rather than dealing
65
with a commercial product and interfacing “black boxes” that may contain problematic protection mechanisms as witnessed during this project, a custom DC converter will provide flexibility in system implementation. In providing the engineer with this flexibility to designs components at a lower level of integration, he or she will design to the specific needs of the energy harvesting system as well as identify more opportunities for optimizing efficiency.
Recommendations Recommendations for the specifications of a custom built DC converter include:
• An input range from 0‐40V. o Note: We determined the range based off the voltage range seen under the original
resistive coil load test. As mentioned in the previous sections, this range changes depending on loading. Retest the open circuit voltage capabilities of the elliptical to verify the output range of the elliptical under different strides/min and resistance settings.
• An output voltage of 36V o The micro‐inverter operates best at this voltage as suggested by Enphase.
• In order to protect the Enphase micro‐inverter, the output current of the DC converter must not
exceed 8A. See the Enphase specifications in Table 6 on page 28. Use current limiting circuits or devices (i.e. fuses) between components to prevent over‐current and damaging devices.
• In order to utilize the existing mounting options on page 23, the DC converter needs to fit within the 3.25” x 6.75” space on the former resistive coil mounting bracket. See Figure 5: Former resistive coils mounting shelf measurements on page 24.
66
Appendix A: Photos of Inside the Enphase MicroInverter
AC
Figure 38 shows the inside of the Enphase micro‐inverter. The conduit running along the topside of the module that exits the two sides of the machine contains three wires (two black and one green/yellow). The two black wires return AC power back to the grid at 120VAC, while the green/yellow wire serves as a neutral between the two phases. The Enphase micro‐inverter allows for multiple inverters to connect in parallel to the grid. As you connect more and more micro‐inverters through this AC connection, you essentially elongate a 120VAC bus to which each inverter inverts DC to AC upon.
DC
The bottom wires entering through the bottom left contain the “hot” and “ground” DC input. The white tag on the bottom most wire indicates the ground wire. Core wound transformers and the two toroid inductors may play a role in converting this DC power along with the five capacitors on the right. The Spartan Xillinx FPGA allows for processing and possibly plays a role in registering data and interfacing with the EMU.
Figure 42: Inside of Enphase Micro‐Inverter
67
Appendix B: Mounting Design Diagrams
26.75”
28”
8.25”
Figure 43: Physical dimensions of clearance under elliptical trainer track
68
Figure 44: DC Converter Mounting Option 1
69
Figure 45: DC Converter Mounting Option 2
70
Figure 46: Micro‐Inverter Mounting Option 1
Figure 47: Micro‐Inverter Mounting Option 2
71
Figure 48: Micro‐Inverter Mounting Option 3
Figure 49: Micro‐Inverter Mounting Option 4
72
Figure 50: Wiring connection possibilities with other energy harvesting elliptical machines
73
Appendix C: Detailed Cost Analysis
The following tables estimate the daily and annual savings, as well as the payback period of the system. Since the gym typically operates between the hours of 8AM and 12AM, the hours of use varies from one to eighteen hours. A recent survey estimates 100W as the total amount of energy production during a session. Since the current REC Center equipment operates for most periods of the day, the amount of energy production in an hour converts to 0.1kWh. In February 2009, the Energy Information Administration averages the cost per kWh equal to $0.14 for the state of California. Therefore, for only one hour of usage per day it will take 78 years per elliptical machine in order to payback the cost of one modified elliptical machine. However, for ten hours of usage per day (a better approximation), the payback pe daily quation: riod becomes eight years. The and annual savings results from the following e
Day Savings $
Annual Savings 365 $
The payback period accounts for the initial cost of the modifications for the elliptical machine, as well as the annual savings of the system. An initial cost of $440 sums the retail price of the DC/DC converter and Enphase M175 Micro‐Inverter. The payback period the following equation: results from
Payback Period years
Table 30 ‐ Cost Analysis with Hours of Usage
Hours of Use
Day Savings
Annual Savings
Payback Period (yrs)
Energy Produced (kWh)
Cost per kWh
1 $0.01 $5.11 86.11 0.1 $0.14
2 $0.03 $10.22 43.05
3 $0.04 $15.33 28.70
4 $0.06 $20.44 21.53
5 $0.07 $25.55 17.22
6 $0.08 $30.66 14.35
7 $0.10 $35.77 12.30
8 $0.11 $40.88 10.76
9 $0.13 $45.99 9.57
10 $0.14 $51.10 8.61
11 $0.15 $56.21 7.83
12 $0.17 $61.32 7.18
13 $0.18 $66.43 6.62
14 $0.20 $71.54 6.15
15 $0.21 $76.65 5.74
16 $0.22 $81.76 5.38
74
17 $0.24 $86.87 5.07
18 $0.25 $91.98 4.78
As the hours of usage increases, the payback period decays exponentially. Starting at a payback period of 78 years for only one hour of usage, the system only takes roughly 4 years to breakeven at eighteen hours of usage. These values do not account for the potential reduction in cooling costs for the REC Center.
‐
10.00
20.00
30.00
40.00
50.00
60.00
70.00
80.00
90.00
0 2 4 6 8 10 12 14 16 18
Payb
ack
Peri
od (Y
ears
)
Hours of Use per Day
Payback Period Depending on Hours of Usage a Day
Figure 51 ‐ Payback Period as a Function of Hours of Use
75
Appendix D: Vicor Maxi DC Converter Technical Service Suggestions Vicor Applications Engineer John Kovacs – (408)‐774‐5517
INPUT
• DC converter has a very high input voltage impedance - Need to compensate - Use large capacitor across input of Vicor
At least 330uF to 1,000uF
• Monitor the input with an oscilloscope
• Regulate input - Use Zener diodes, MOV, transient suppressors - MOV‐metal oxide varistor (used in surge protectors to divert excess voltage)
OUTPUT
• Protect the DC converter output from the micro‐inverter
• “Loading the output of the DC converter to an inverter is the worst case scenario for the Vicor Maxi DC converter”
• Inverters chop up incoming DC o Noisy choppers create harmonics, high voltage transients o To protect from transients use
Series diode properly rated for 1,000V Reverse breakdown voltage will cut down the amplitude of incoming signal
• Place an LC filter o Located at input of inverter (output of DC converter) o Monitor output line of DC converter with an oscilloscope
DECOUPLING
1. Disconnect load and see if 36V is across the output 2. Connect resistive load and confirm specification 3. Connect DC/AC inverter
• Can use 12V car battery to source DC converter input
PRECAUTIONS
• Avoid hand soldering wires to pins o At high temperatures, solder may melt and seep into DC converter and short circuits
Axiom Test Equipment. Clarostat 240C Decade Resistor Box. 2008. 7 December 2009 <http://www.axiomtest.com/Clarostat_240C_Decade_Resistor_Box_CLA_240C_8033‐details.aspx>.
Bloyd, Stephanie. "Fitness Equipement Sales Decline." 01 July 2009. Club Industry:The Online Source for Fitness Business Professionals. 22 November 2009 <http://clubindustry.com/inside_manufacturers/0701‐equipment‐sales‐decline/>.
Encyclopedia of Business, 2 ed. "Profit Margin." December 1998. Reference for Business Encyclopedia of Business, 2 ed. 22 November 2009 <http://www.referenceforbusiness.com/encyclopedia/Per‐Pro/Profit‐Margin.html>.
Jonathan Chan, Christopher (Chris) Cinkornpumin, Michelle Lum, Jonathan Yuen. Energy Harvesting from Exercise Machines (EHFEM) Self‐generating Elliptical Machines. Senior Project. California Polytechnic State University, San Luis Obispo. San Luis Obispo: Cal Poly Senior Project, 2009, 2009.
SGMA. SGMA Says Fitness Participation Remains Stabe, Despite Decline in Fitness Sales. 6 October 2009. 21 November 2009 <http://www.sgma.com/press/176_SGMA‐Says‐Fitness‐Participation‐Remains‐Stable,‐Despite‐Decline‐in‐Fitness‐Sales>.
Traco Power. "DC/DC Converters TEP 150WI, Series 150 Watt." August 2009. Traco Power Excellence in Power Conversion. 28 September 2009 <http://www.tracopower.com/>.
Vicor Corporation . "Data Sheet BatMod Battery Charger Current Source Modules." August 2007. Vicor Power. 28 September 2009 <http://cdn.vicorpower.com/documents/datasheets/ds_batmod.pdf>.
—. "Vicor Power‐ 28Vin Maxi Family.pdf." October 2009. Vicor . 25 September 2009 <http://cdn.vicorpower.com/documents/datasheets/ds_28vin‐maxi‐family.pdf>.
Zahn Electronics, INC. DCDC12/36/160 Step Up DC/DC Converter. 2008. 28 September 2009 <http://zahninc.com/specD.html>.
87
88
Appendix F: Energy Harvesting from Exercise Machines Selfgenerating Elliptical Machines (Summer 2009)
Energy Harvesting From Exercise Machine (EHFEM)
Self‐generating Elliptical Machines
Senior Project Report
Jonathan Chan
Chris Cinkornpumin Michelle Lum Jonathan Yuen
August 24, 2009
Department of Electrical Engineering
2
Table of Contents Abstract ......................................................................................................................................................... 7
Planned Project Development Block Diagram .............................................................................................. 7
Expected Problems We May Encounter ................................................................................................. 10
Possible Design Concepts ............................................................................................................................ 11
Design Concept 1: Lithium Ion Battery Smart Load ................................................................................ 11
Sources of Income: .................................................................................................................................. 20
1. Power Energy Society (PES) ............................................................................................................ 20
2. HuSel – Cal Poly Humanitarian Service Learning Competition ....................................................... 20
If Manufactured on a Commercial Basis ................................................................................................. 22
Health and Safety ........................................................................................................................................ 26
Social and Political ...................................................................................................................................... 27
Design Choice and Implementation ............................................................................................................ 27
Safety and Maintenance ..................................................................................................................... 29
Enphase Envoy Management Unit (EMU) .............................................................................................. 29
Energy and Cost Analysis ............................................................................................................................ 30
Results and Testing ..................................................................................................................................... 31
Elliptical Potential Output Power ............................................................................................................ 31
Figure 11 ‐ U.S. Sources of Electricity in 2006............................................................................................. 24
Figure 12 ‐ Enphase Envoy Management Unit ............................................................................................ 30
Figure 13 ‐ Resistive Coil Power Dissipation ............................................................................................... 32
Figure 14 ‐ Elliptical Potential Output Power .............................................................................................. 33
Figure 15 ‐ Elliptical Output Power at 160 strides per minute ................................................................... 35
Figure 16 ‐ Enphase Enlighten "My System" Interface ............................................................................... 36
Figure 17 ‐ Elliptical System Overview for Troubleshooting ....................................................................... 37
Figure 18 ‐ Test Circuit Configuration with Two 120VAC Sources Out of Phase by 180° ............................. 37
Figure 19 ‐ Circuit Configuration with Direct DC Power Supply to the Micro‐Inverter and Two 120VAC
Sources Out of Phase by 180° ..................................................................................................................... 38
Figure 20 ‐ Circuit Configuration Including Input Voltage Regulating Potentiometer ................................ 39
Figure 21 ‐ Final Design Test ....................................................................................................................... 40
Figure 22 ‐ DC/DC converter test configuration ......................................................................................... 42
Figure 23 ‐ DC‐DC converter output power at various resistance settings ................................................ 44
Figure 24 ‐ Mounting of Enphase M175 Micro‐Inverter ............................................................................. 46
Figure 25 ‐ Energy Harvest on May 26, 2009 Testing (Micro‐inverter Test #1 → 40W) ............................. 54
Figure 26 – Energy Harvest on June 4, 2009 testing (Test #2 → 180W, Test #3 → 50W) .......................... 55
Figure 27 – Energy Harvest on June 5, 2009 testing (Test #4 → 180W) ..................................................... 55
Figure 28 ‐ Payback Period as a Function of Hours of Use ......................................................................... 57
Figure 29 ‐ Micro‐inverter internal voltage and current under constant current input and constant input
Table 10 ‐ Final Testing Power Generation ................................................................................................. 48
Table 11 ‐ Options for a DC/AC Inverter ..................................................................................................... 51
Table 12 ‐ Options for an AC/DC Inverter ................................................................................................... 51
Table 13 ‐ Options for an AC/DC Disconnect Switch................................................................................... 51
Table 14 ‐ Lowest Total Cost Combination ................................................................................................. 52
Table 15 ‐ Cost Analysis with Hours of Usage ............................................................................................. 56
6
Abstract In a global effort to integrate innovative technology and renewable energy, Cal Poly commits to the advancement of self‐generating power. Mandated by student demand, future plans for expansion of the current recreational center take effect. By the end of the 2012 academic school year, Associated Students Incorporated (ASI) plans to complete the recreation center expansion. In an effort to promote sustainable practices, the recreation Center intends to exceed the state of California standards for energy efficiency. In conjunction to the overall effort and the opening of the 2012 expansion, this project utilizes existing EFX 546i model of Precor elliptical machines and retrofits each machine with self‐generating capability. These reconfigured elliptical machines will convert excess heat loss to renewable energy for the entire Pacific Gas & Electric (PG&E) power grid. The accumulation of these minor efforts promotes the overall transition towards renewable, self‐generating power. Moreover, it helps ensure for us a sustainable, healthy future.
Planned Project Development Block Diagram
Test Elliptical EFX 546i Model. Determine output
power, voltage and current. Inverter output voltage
Stage 1 Stage 2
Feeding output voltage to distribution grid
Stage 3
AC/DC disconnect to distribution grid
Stage 4
Figure 1: Simplified block diagram
Functional Requirements An elliptical machine simulates the motion of walking and running without excess pressure on joints and muscles. A traditional elliptical machine requires an athlete’s physical exertions as the source of energy, while excess energy dissipates as heat. Our design incorporates similar self‐generating capabilities but introduces the concept of renewable energy. We intend to harvest the excess energy lost through heat from existing machines and feed it back to the PG&E power grid. In order to harvest this energy safely, we must follow several codes and regulations. In accordance to PG&E’s safety regulations and requirements, the design must have an accessible, visible, and lockable AC/DC disconnect. A DC disconnect isolates the DC components of a power system from its AC counterpart. It separates the power system from the rest of the REC Center’s electrical system, making for easier maintenance. An AC disconnect utilizes an inverter that balances the electrical output by the inverter with a transformer. The AC disconnect establishes the grid electricity to the power system.
This project seeks to provide the ASI rec center expansion project with a viable, experimental system design.
7
The following requirements mandate this system:
• Conform to all safety requirements outlined in UL 1741
• Conform to IEEE code 1547
• Conform to relevant safety requirements enforced by PG&E (state specific requirements)
• Conform to the National Electrical Code (NEC)
• No cost to ASI or Cal Poly
Underwriters Laboratories (UL1741) The UL listing sets standards and test procedures for public safety and reports the overall quality of any product, equipment, or material. UL standards ensure safety of products for both commercial and industrial use. Since the concept of harvesting energy requires the conversion of DC‐AC voltages, the UL 1741 standard is essential to our design. Listing UL 1741 incorporates the implementation of “inverters, converters, controllers, and interconnection system equipment for use with distributed energy resources” with utility interactive (grid‐connected) power systems. Below is a list of UL requirements stated in UL 1741 [A1]:
1.1 Utility‐interactive inverters, converters and ISE are intended to be operated in parallel with an electric power system (EPS) to supply power to common loads.
1.2 Test procedures for equipment interconnecting distributed resources with electric power systems must conform to the standards of IEEE.
1.3 Installation of equipment interconnecting distributed resources with electric power systems must conform to the National Electric Code (NEC) NFPA 70.
Institute of Electrical and Electronics Engineers (IEEE) Standard 1547 Traditionally, utility electric power systems do not consider the accommodation of active generation and storage at the distribution level. Since the elliptical machine adds power back to the power grid, IEEE classifies this system as “a standard interconnecting distributed resource of electric power systems.” IEEE Standard 1547demonstrates a model for ongoing success in establishing additional interconnection agreements, rules, and standards, on a national, regional, and state level. 2.1 The grounding scheme for the elliptical machine should not cause over voltages that exceed the
ratings of other equipment within the same electrical power system or disrupt the ground fault protection.
2.2 At the point of coupling between the generated voltage and supply voltage, no voltage fluctuation of ±5% of the supply voltage from PG&E.
2.3 When the electrical power system is de‐energized, the elliptical machine must not energize the line.
8
2.4 A readily accessible, lockable, visible‐break isolation device shall be located between the electrical power distribution system and the generated voltage.
2.5 The paralleling device is capable of withstanding 220% of the interconnection system rated voltage.
Pacific Gas & Electric (PG&E) Rule 21 – Generating Facility Interconnections Rule 21 describes the interconnection, operating and metering requirements for generating facilities connecting to Pacific Gas and Electric’s (PG&E) Distribution System over which the California Public Utilities Commission has jurisdiction. The protective functions and requirements of this Rule protect PG&E’s Distribution System and not the generating facility. The protective functions cannot affect PG&E’s capability of providing reliable service to its customers. 3.1 Over and under voltage trip functions and over and under frequency trip functions
3.2 A voltage and frequency sensing and time‐delay function to prevent the generating facility from energizing a de‐energized distribution system circuit. The function must prevent reconnecting with PG&E’s distribution system unless voltage and frequency is within a voltage range of 106V to 127V on a 120B basis, inclusive, and a frequency range of 59.3 Hz to 60.5 Hz.
3.3 Circuit breakers or other interrupting devices at the point of common coupling must be certified or “listed”. The generating facility’s design does not allow a single device to potentially compromise the safety and reliability of PG&E’s distribution system.
3.4 The facility shall furnish and install a ganged, manually‐operated isolating switch near the point of interconnection to isolate the generating facility from PG&E’s distribution system. The device does not have to be rated for load break nor provide over‐current protection.
National Electric Code (NEC) article 690 Solar Photovoltaic Systems The objective of the energy harvesting from elliptical machine follows guidelines from the National Electrical Code (NEC). The NEC, also known as National Fire Protection Association, NFPA, regulates residential and commercial electrical systems. The NEC describes the certain specifications for wiring, conduits, installations, circuit protection, lighting, etc. The nation follows the NEC to avoid any liability lawsuits. The National Electrical Code updates every three years; we reference the 2005 edition.
Article 690 describes the generation of electrical power production source with an output of ac or dc safety connecting to capable loads and the existing power system.
4.1 The output circuits need to be contained in a cable, outlet box, junction box, or branch circuits.
4.2 The inverter output circuit current has a maximum of the inverter continuous output current rating.
9
4.3 Circuit breakers must be controlled by manual operations to open and close and readily accessible. The indication of positions on and off shall be clearly illustrated. The ampere rating shall be seen on the circuit breaker in a durable manner.
4.4 A disconnecting switch for direct or alternating current shall be mounted within sight on the facility or in the inverter.
Primary Constraints Four limiting factors governing and influencing the approach to this project are:
• Designing based on findings through reverse engineering due to the lack of Precor Elliptical machine data sheets.
• Finding an appropriate point on the existing Precor Elliptical to harvest power.
• Choosing an appropriate DC to DC converter that matches the wide input voltage range and outputs a usable amount of harvested power.
• Implementing a safe and code‐abiding method to connect the harvested energy back into the electrical grid.
By reverse engineering the Precor Elliptical machine, the main issue is to understand how the resistive coils located on the back of the machine operate. Typical voltage and current measurements of these coils highlighted this point as a possible “tap in” node to harvest power. Through further testing, the elliptical machine outputs a wide‐range of DC voltages and currents, which influenced our search for an appropriate DC to DC converter.
Expected Problems We May Encounter Harvesting the thermal energy dissipating from the machine and converting it to usable electrical energy poses as one of the main issue in this project. The resistive coils located at the rear of the machine control the amount of opposing physical resistance for the user. At high resistance settings, the amount of heat dissipation increases. AC power supplying the magnetic generator provides power to the entire machine. An onboard converter changes the generated AC power into DC, which feeds into the onboard electronics (display board, heart monitor) as well as the resistive coils.
Tapping into the machine at the resistive coils poses questions about how it alters the user’s experience. The tap‐in point also determines the following design iterations necessary to fulfill our objectives. If the overall user experience changes, initial drawing schematics may require alteration.
10
11
Possible Design Concepts
Design Concept 1: Lithium Ion Battery Smart Load A Lithium Ion battery smart load provides a reliable and clean DC energy transfer source for the energy generated by the elliptical machine. The energy generated from the elliptical machine, transfers through a charge controller, to the Lithium‐ion battery, then discharges to the distribution grid once reaching full capacity. A series charge controller, similar to the one shown in figure 1 below, requires a 12V or 24V input voltage with 15M amp current limit.
Figure 2: Morningstar Series charge controller1
The concept of the charge controller monitors the amount of voltage charged to the battery allowing for proper discharge when reaching the max limit.
Lithium‐ion batteries are productive and efficient. They are compact, but have very high capacity limits, making them easy to implement in different mounting configurations. Both the size of the charge controller and the battery fit snug behind the railing near the resistive coils of the machine. Their load levels allow rechargeable batteries to store electric energy during peak load periods.
Limitations Rechargeable batteries offer economic and environmental benefits, but have lifetime and usage limitations. The aging of rechargeable batteries lead to a decrease in the depth of discharge (DOD), the percentage of nominal ampere‐hour capacity (100% meaning full discharge and 0% meaning no discharge). Since the capacity of the battery depends on the rate of discharge and allowable voltage at the end of discharge, the charge/discharge cycle will be greater when the DOD is lower on each cycle.
Reverse charging occurs when we apply reverse polarity to a battery or when one battery discharges faster than the other batteries connected to it in series. Possible countermeasures include ensuring correct polarity when charging and limiting the use of only one battery to handle voltage and current limits.
Design Concept 2: DC/DC Converter to Enphase MicroInverter (M175)
Figure 3 ‐ Enphase M175 Micro‐Inverter2
Design The specification of the Enphase Micro‐Inverter requires a steady 35V DC input voltage to function properly. If the input leads of the micro‐inverter connect directly to the elliptical machine, the onboard computer‐processing unit (CPU) shuts off due to the fluctuations in voltage. The micro‐inverter’s software identifies the fluctuation in voltage as a malfunction within the system and shuts the CPU down to prevent internal damage or damage to the AC line. By achieving a steady 35VDC into the micro‐inverter, the output is 240VAC at 60 Hz that tie directly into the power grid.
In terms of mounting, the DC/DC converter and micro‐inverter fit on the same pillar as the resistor coils. Each component fits on either side of the pillar, but the micro‐inverter mounts on the same side as the resistors. The arrangement allows the output cable to come out the rear of the elliptical machine.
Figure 4: Resistive coils mounted on back pillar
2 Enphase Energy [http://www.enphaseeneryg.com]
The use of an additional conduit to connect directly into the power grid system is necessary. If the designers layout the elliptical machines 3‐6 feet apart, the micro‐inverters can connect in series rather than requiring additional conduit per machine.
Figure 5: System layout for DC/DC to Enphase Micro‐inverter
Limitations The greatest limitation of the design is the resistive feature of the elliptical machine. Since the elliptical machine relies on eddy current braking to change the magnetic field in the rotor, the removal of the resistor coil poses a large problem. Depending on the input impedance of the DC/DC converter, resistance during the workout could either increase or decrease. Larger input impedance causes the resistance in the workout to decrease, while smaller input impedance increases the resistance of the workout.
Fluctuations of the DC voltage from the elliptical machine occur inevitably. The DC/DC converter requires a quick transient response time in order to provide a steady 35VDC to the micro‐inverter. If the voltage at the output of the DC/DC converter begins to swing ±2VDC, the micro‐inverter’s software determines a discrepancy and shuts off.
Since the elliptical machines do not feed into a single point or main grid‐tie inverter, there exists no centralized DC disconnect switch. When the elliptical machine operates at resistance level greater than “1,” it outputs DC power.
13
During the design‐build‐test cycle, a 240VAC voltage must be present at the output of the micro‐inverter for testing. When there is no voltage on the output, the micro‐inverter automatically shuts off in order to comply with utility company requirements.
Since the micro‐inverter utilizes a CPU, expect some heat generation off the micro‐inverter itself. The amount of heat differs depending on the amount of processing, but should generally be less than the heat from the resistor coils.
Due to the wide range of voltages across the resistor coils, challenges arise in finding and implementing a DC/DC converter that can handle an 8‐50VDC input. The scenario calls for limiting the voltage range to 8‐36VDC and sacrificing the higher end voltages. Since most users tend not to exercise at high resistance levels, the DC/DC converter may not affect the overall design.
Wiring becomes an issue with the Enphase micro‐inverter because it utilizes a proprietary cable. Expect costs to rise if the elliptical machines are far apart or a junction box to the power grid is inaccessible.
Advantages The micro‐inverter eliminates the single point of failure common in most solar panel installations. When the micro‐inverters connect in series, the unit allows AC voltage to continue down the line if one happens to fail, acting like a parallel circuit. Traditional solar panels connect in series, and the failure of one panel causes the overall system to fail.
Size of the micro‐inverter allows easy installation into the elliptical machine pillars. We will mount the micro inverter to this pillar, eliminating the need for external housing for components or for modifying the existing housing of the machine.
Meeting PG&E requirements become slightly easier with the onboard CPU of the micro‐inverter. With no voltage on the line, the micro‐inverter automatically shuts the system down and prevents energizing the line. In the presence of 240VAC, the system will function normal again. A single AC disconnect is compatible with the system as well.
The micro‐inverter allows for greater flexibility as well. If new machines with a similar configuration as the Precor elliptical machine arrive, we can easily install micro‐inverters that can connect with other micro‐inverters in the system. Micro‐inverters eliminate the need for additional conduits.
Micro‐inverter has high efficiencies. From recent tests, the elliptical machine dissipates approximately 200W in the form of heat. The Enphase micro‐inverter has a 95% efficiency rating, resulting in a theoretical 190W output.
Enphase offers another system to provide monitoring of all micro‐inverters as well. Faculty, students, and even alumni can access the information over the internet. The web page lets users view the total amount of power generated over a time period for each micro‐inverter within the system.
14
Design Concept 3: Direct AC Harvesting
Figure 6: Onboard generator utilizes eddy current braking
Direct AC harvesting requires a parallel connection across the onboard AC generator. From taking measurements from the elliptical, we found the onboard AC generator’s output fluctuates during initial start up. However, once the runner reaches a steady pace, the generator outputs a steady AC voltage.
Figure 7: AC voltage harvesting electrical concept
15
Figure 8: System layout for direct AC harvesting
Limitations Challenges of this project include maintaining a constant 120Vac and preventing any change in elliptical operation. Since the elliptical user is the prime operator for the onboard elliptical generator, the speed at which he or she runs at, determines the amount of AC voltage generated. Also achieving this constant output is possible only if the user runs at a constant pace.
The system requires a 120Vac potential in order to connect into the grid. Therefore, if the onboard generator does not output 120Vac, appropriately sized transformers need to step this voltage up.
By incorporating transformers, the design becomes more complicated, since the fluctuating generator output voltage may need to step up at different ratios. Transformers cannot accommodate fluctuating input voltages in order to yield a steady 120Vac. Since connection made across the AC generator is in parallel, it is unsure to know how it will affect the normal elliptical load. The elliptical machine powers itself from the AC generator, which powers the various functions on its display as well as regulates its eddy current braking system.
16
It is known that by placing the harvesting leads across the generator the amount of current flowing into the normal elliptical load lowers according to Kirchhoff’s Current Law. Therefore, the machine may not operate normally due to insufficient current.
Advantages Tapping into the generator (without affecting normal elliptical operations) avoids altering or removing the resistance coils, which may alter the user’s experience.
This cheaper design concept does not need additional costly modules such as DC/DC converters, standard inverters or micro‐inverters.
Anticipated Problems and Tentative Solutions
Resistive Coils Functionality 1.1 Problem: Is it possible to harvest electrical energy without removing the resistive coils, i.e. can we tap into the coils through a shunt or series connection and still maintain the elliptical resistive or “workout‐intensity” capabilities?
Solution: Yes, removal of the resistor coils will not alter the “workout‐intensity”. The micro‐inverter attempts to maximize output power, so it draws as much current as possible. The DC/DC converter allows current from the elliptical machine to flow unaltered, but boosts up the voltage. Though there exists no true way to test intensity, the elliptical machine feels to have the same workout‐intensity through all levels up to “14”.
VDC from resistive coils 120VAC
120VDC
DC/DC Converter
Inverter
Figure 9: Design Iteration A: Tapping into the resistive coils
Further issues and questions arise from this design setup.
1.2 Problem: The DC/DC converter has a designated range of input DC voltage, depending on the user’s workout intensity. Based on this assessment, what is the range of voltages we can input into the DC/DC converter in order to output an adequate voltage (120VDC) to feed back into the inverter?
Solution: If the DC output from the coils is not sufficient and fluctuating more than necessary, a new system design configuration should function at an optimal DC range. This range should meet the user’s
17
voltage level or exceed this optimal DC voltage value; the machine begins to feedback electrical energy into the grid. This idea requires further research and design.
For all three design ideas, our solutions must account for and provide for voltage sagging in order to keep the voltage at a usable level (120VAC) that can feed back to the grid.
In trying to harness energy from the coils, a basic understand how the resistive coils work is necessary. It is known that coils dissipate heat (P = I2R), however it is unsure how the coils operate physically. This poses the following question.
1.3 Problem: Do the coils dissipate more power at a higher “workout‐intensity” setting by means by of “increasing current and constant resistance” or does the electric resistance change at each setting?
Solution: Coil resistance remains constant while voltage and current of the resistor increases as elliptical resistance setting increases. Since both voltage and current increase are not exactly known, it is assumed it increases due to a controller on the elliptical.
DC/DC Converter In choosing the appropriate DC/DC converter, we need to specify input power, output power (120VDC), and power rating.
2.1 Problem: How can power rating be determined for the DC/DC Converter?
Solutions: Determine input power rating by the maximum rated input voltage multiplied by maximum input current. The same applies for the maximum output power rating.
Refer to the “Results and Testing” section below for numerical data.
Tying machines together and component housing issues 3.1 Problem: When tailoring our project specifically for the REC center, can we tie the machines together or will one of the proposed design iterations above be for each machine?
Solutions:
A. Tie them together efficiently (less equipment) B. Designing the system per machine increases productivity and avoids total system shutdown
if one machine falls offline.
Once determining the necessary components and configuration to harvest electrical energy, it is necessary to provide adequate housing and covering for these components to avoid exposure to hazards such as water, and human interaction. The following problems address housing and safety issues.
3.2 Problem: By tying together multiple machines to a centralized unit (i.e. DC/DC converter and inverter), how will housing/covering be provided to the unit?
Solutions:
18
A. Provide a wall mounted cabinet or box (similar to a central inverter system of a solar system) to which the outputs of each elliptical run into this central unit via appropriate interconnects (i.e. wiring may run through to the wall)
B. Floor mounted cabinet or box
3.3 Problem: On the other hand, if each elliptical requires its own set of components (i.e. DC/DC converter, inverter), how will we provide housing/covering to prevent exposure?
A. Design specialized external housing coverings that become extensions of the machine B. Design a wall mounted or floor mounted cabinet or box close to the machine which then
interconnects into a central point back into the grid C. Mount components on existing spaces of machine in which existing housing covers.
Voltage Regulation and Surge Protection From prior observation, we saw that an onboard “computer” or microcontroller controls against voltage spikes and regulates the voltage generated from the onboard generator. The machine uses this regulated voltage (approximately 6VDC in the machine’s display) to self‐power itself.
4.1 Problem: What are the balanced loads, over current, and surge protection requirements and regulations? What methods and designs can we employ to regulate voltage levels and avoid voltage spikes?
Solutions:
• PG&E code feedback from contacts
• NEC code book
• Solar project examples
• Professional references, facility engineers
Method and tap in point to the grid Through research, we observe that we can feed power back into the grid such as how a solar system feeds its energy back into an electric panel board. According to PG&E requirements, we cannot feedback renewable power directly into a wall receptacle. All voltages buses coming from sources of renewable energy generation (solar panels, reharvesting elliptical machines) must be regulated by AC or DC disconnect switches. PG&E enforces this regulation in order to disconnect all electrical lines during maintenance.
5.1 Problem: Connecting the harvested energy back into the grid.
Solutions:
A. Since this project is strictly tailored to the REC center expansion, consideration of design methods that meet codes without renovations and “opening up walls.” Implementing a design for specialized buses and interconnects located within the walls or encased in
19
20
conduits that run the harvested electrical energy through appropriate AC/DC disconnects and back into the local building panel board.
B. During the project‐testing phase, determine the actual method and specifics of grid connection after conducting feasibility analysis and conference calls with experts.
Economic According to the overall block diagram, the main components for the harvesting system include:
• Enphase Micro‐inverter ($209.95)
• Enphase Envoy Energy Management Unit o (Retail Price: $409.99 (no tax))
Purchase Price: $324.92 (shipping + tax)
• DC/DC converter ($100‐$300)
• AC disconnect switch
• DC disconnect switch
Sources of Income:
1. Power Energy Society (PES) – Possible source
Cal Poly’s Power Energy Society (PES) seeks to “enhance academic goals by providing information about the Power Engineering Industry”. With contributions from alumni, power companies, and external sources, PES offers funding for any research or projects related to the power community. An overall project proposal submission is required to qualify for any contribution provided by PES.
2. HuSel – Cal Poly Humanitarian Service Learning Competition – Main Contributor
The HuSel competition awards students involved in humanity research through clubs, class, or senior projects. All research needs to focus on humanitarian efforts, conducted as a team effort, and a structured timeline for completion. Each proposed research judge on innovation potential impact, and feasibility. All nominees receive an initial $500 contribution towards their research. Top three nominees receive an additional $500 reimbursement for project expenses.
On April 29, 2009, the Energy Harvesting from Elliptical Machines (E.H.F.E.M) became a nominee by the HuSel honors program. The initial $500 contributed to the purchase of the Enphase energy management unit (EMU). With the funding only supporting about a fraction of the total cost, extra motivation compelled us to be one of the top three nominees. The concept of energy harvesting competed against humanity research associated with filtering clean drinking water and efforts against human trafficking. At the presentation ceremony on June 3rd, 2009, E.H.F.E.M and the concept of reharvesting energy for Cal Poly was awarded the honor of third place. An additional $500 contribution supports funding for a suitable DC/DC converter for the final design.
Figure 10: E.H.F.E.M Gantt Chart
If Manufactured on a Commercial Basis • Estimated number of devices to be sold per year
Estimating the amount of Precor elliptical machines sold per year depends on the economic trend. From the Amer Sports corporation Financial Results 2008: “Due to the globally weak macro‐economic environment, the short‐term outlook for Precor remains uncertain. Many customers affected by the tight credit market and are postponing their investments into new fitness equipment. The long‐term fundamental drivers of the fitness market remain positive and Precor is strategizing for a rapid recovery as the broader economy begins to improve. Precor is focused on strengthening retail distribution in the US and geographical expansion.” http://www.amersports.com/media/releases/view/amer_sports_corporation_financial_results_2008‐ifrs.html Basing the estimates of units sold per year in the United States, we estimate Precor sells at least 500 elliptical machines. With the new modifications and trend of reusable energy the market for elliptical machines will increase, making the units sold per year at 800 units.
• Estimated manufacturing cost for each device
The average cost of a Precor Elliptical Unit is approximately $4633.90, as shown for each component in the table below. Assuming Precor uses and buys the products in the design, the cost of manufacturing consists of labor and accessories to mount the components on the elliptical machine. The total estimating cost for manufacturing is roughly 3% more than the manufacturing cost of the original self powering elliptical machine. Since the structure of the manufacturing price entails the company’s production spreadsheet, which is unavailable, our 3% cost difference incorporates the number of additional components needed.
• Estimated purchase price for each device With the additional costs from the modifications, a very rough purchasing price for each device is around $4650. The table below breaks up the components, manufacturers, and price. Purchasing the DC/DC converter will cost $200, the average cost of DC/DC converters. Table 1 ‐ Cost Estimate of Elliptical Machine with Design Modifications
Product Company Unit Price Enphase Products (30% discount) Enphase Micro –Inverter Enphase $209 Enphase Energy Management Unit To be purchased
Enphase $324.90
22
DC/DC converter Elliptical
Unknown
Precor
$200
$3900 Total $4633.90
• Estimated profit per year
Of Precor’s net sales, 309.1 million dollars, in 2008, America accounted for 72%. The future outlook of net sales in America can account increase above 72% of the net sales [2].
• Estimated cost for user to operate device, per unit time (specify time interval) Aside from the initial cost of installation, the system requires no monetary cost for the user to operate the device. Depending on how much power they generate there may be a margin of profit.
Manufacturability The elliptical machines generate its own power along with enough energy to supply power into PG&E's grid system. Each machine requires a generator, already existing on the machine, an AC/DC inverter, and a DC/DC converter. A design concept is shown in Figure 24 below. Challenges exist in placing each machine in the same vicinity in the gym where they connect in series to a specialized bus (located in the wall to fulfill safety requirements and avoid loose lines of wiring) that links the DC output of all elliptical machines together. The DC line runs through a DC/AC micro‐inverter to an AC circuit breaker and then taps back into the grid. PG&E regulations and specifications require AC and DC disconnects.
In order to implement energy harvesting elliptical machines, existing gyms need to undergo renovations to accommodate the necessary hardware, wiring, and protection this system requires. Like most renewable energy projects, gym facilities face large sums of initial cost to install the system and purchase the number of modified elliptical replacements. Following this upgrade, gyms need to rely on long time periods to break even or make a profit. The majority of the benefits fall toward sustainability and renewable energy rather than personal monetary profit; a concept that gym owners may feel less inclined to pursue.
A big obstacle of manufacturing is convincing customers to purchase machines for their facility with the knowledge that other building modifications are needed. Also, the machines are individually manufactured and cannot be bought as a whole. Since each machine is sold individually, the connection of the machine limits their location in the facility. The concept of renewable energy is highly influential to costumers that agree to such a commitment.
23
24
Environmental The accumulation of modified elliptical machines all contributing renewable, reusable electrical energy creates less of a burden and reliance on other methods of power generation. Most power generation today relies on processes such as petroleum, steam, nuclear, and coal. According to the Energy Information Administration, in 2006 coal accounted for approximately 50% of the sources of electricity in the U.S. The Union of Concerned Scientists states that burning coal is the number one cause of global warming, acid rain, smog, and air toxics. In order to reduce the environmental impact of today's methods of power generation, the modified elliptical machine is necessary for users to give back to their environment. With students and institutions more aware of recycling and the importance of renewable energy, Cal Poly’s faculty and students have the satisfaction of helping the environment along with their school. In conjunction with the Computer Engineering department, students are developing a program that monitors power generation and efficiency allowing athletes to track the amount of power generated and distributed to the power grid.
Figure 11 ‐ U.S. Sources of Electricity in 20063
Though renewable energy sources are technically sustainable, the manufacturing processes for the elliptical machine create environmental problems. The materials, industrial processes, and construction equipment tend to generate waste and pollution in the atmosphere. Creating the plastic that encases many parts of the elliptical machine results in nearly 20,000 tons of hazardous air pollutants according to the National Toxics Inventory (NTI). Wastewater from the plastic separation process bears many solvent residues as well. Manufacturing the steel for the elliptical machine includes air emissions, wastewater contaminants, hazardous and solid waste. According to the U.S. Environmental Protection Agency (EPA), cooking and iron making are the major contributors of environmental impacts. Recycled scrap metals also contain contaminants that require a lot of power for the process resulting in greenhouse gas emissions.
3 Energy Information Administration [ http://www.eia.doe.gov/cneaf/electricity/epa/epat1p1.html]
Sustainability The increasing trend of environmental consciousness leads to the discussion of sustainability. While global populations increase, an inevitable adverse effect in resource distribution occurs. However, our analysis not only includes the environmental impacts but also the economic and ethical approaches towards sustainability. The ideal belief of sustainability directly roots to the human population practices that allow the partitioning of natural goods to ensure future needs, it is necessary to achieve such goals through technological advances. An interpretation of sustainability explains a process of maintaining a constant state without altering future needs. This ultimately means innovation with the concept of “green” conservation and lessening of carbon footprints. In relation to engineering, “sustainability describes a condition in which natural systems and social systems survive and thrive together indefinitely” [1]. Due to important ecological problems such as pollution and global warming, implementing sustainable engineering practices can contribute to sustainability. As a result, there is a growing trend for sustainable and socially responsible products and services. Societies such as the Intergovernmental Panel on Climate Change (IPCC) monitor the effects of climate change due to human activity. IPCC assesses scientific literature to study impacts on human‐induced climate change and options for adaptation and mitigation. The IPCC and many others societies study the sustainability of ecosystem services. Ecosystem services are benefits from resources and processes supplied by nature. Three main concepts associated with ecosystem services are provisioning, regulating, and cultural. Provisioning incorporates food, water, and the energy to survive. Regulation is climate variation, any changes in climate mitigating diseases through storms. Cultural is the benefits of recreation and religion. The distinctive property of ecosystem services is that human demand of natural products in the case of clean drinking water or renewable energy. We are beginning to exceed earth’s ecological capacity requiring new innovations and advantages in technology and science. By fabricating sustainable products, such as a renewable elliptical machine, saving water and energy saves money and reduces environmental impact. There are four main concepts or “laws” of sustainability:
• Everything connects to everything else
• Everything must go somewhere
• Nature knows best and bats last
• There is no such thing as a free lunch [3]
Implementing these concepts help reduce and possibly eliminate environmental waste saving cost and materials during fabrication.
The PRECOR elliptical machine transforms an everyday exercise into usable energy. Normal elliptical machines dissipate excess power in the form of heat through resistors, but with modifications the energy returns to the power grid. By returning the energy back to the power grid, utility companies supply less power to the facility, ultimately saving costs and resources on both ends. The decrease in power consumption requires less burning of fossil fuels, resulting in lower emissions in the atmosphere.
25
Ethical The ethical implication relating to the use of the power generating elliptical machine surrounds the concept of human effort. Unlike other forms of renewable energy, the elliptical machine requires human effort to drive a built‐in generator. Solar and wind energy depend on abundant natural sources, while the elliptical machine depends on an inconsistent or unreliable source. If a gym owner implements the energy harvesting elliptical machines, costs of operating and maintaining a gym will decrease. The ethical issue revolves around compensation for the athlete or student, who attribute to the lowered cost for the owner. A main concern may surround the question of is it ethical to use students to generate electricity for the gym. Many athletes exercise for the reward of health and well being. By introducing a concept of renewable energy to an athlete’s routine, it may provide a sense of motivation to work harder. There is a sense of accomplishment from the idea of benefiting your body, school, and the environment all at the same time. Various human activist groups or environmental parties may disagree with this concept of using human subjects to power the gym, impacting the accreditation of the school.
Manufacturing the elliptical machines still produces amounts of pollution and emissions that contribute to global warming and nature endangerment. Determining whether the cost outweighs the benefits promotes greater ethical concerns. If the power‐generating machine becomes a standard, recycling the older machines arise other unsustainable practices. Greenhouse gas emissions are common during the recycling of metal and plastic materials. Expect to find tin/lead solder for connections on the control boards as well as many plastics for the external casing.
Health and Safety The PRECOR elliptical allows the user to experience an extensive workout through a regulated movement of their leg motion. The wheel moves at high speeds. Therefore, with the modifications of the elliptical, we must insure the safety of the user and his or her surrounding area. The machine's additional components may cause bulkiness on the sides, front or rear. Safely enclosing these modifications within the machine shall prevent any malfunctions from accidental liquid spills. These covering also may help gym users avoid the following accidents: injury after slippage of elliptical user while on the machine or injury of gym users harmed while passing by the elliptical. The elliptical workout stature does not alter with the addition of components to the machine. The user should experience the same intensity workout as felt from an unaltered machine. The health warnings remain the same as those stated in the manufacturer's user manual. By expecting future maintenance requirements; therefore it must be easily accessible for repair. Under maintenance, the worker moves the elliptical from the workout area to the maintenance room. Elliptical machines should undergo annual maintenance checks in which any nuts and bolts are tightened and the battery in the inverter is checked. The life span of the battery depends on the type of inverter used.
26
Social and Political In order to transfer energy back to the power grid, Pacific Gas and Electric (PG&E) requires two disconnect switches between the source and power meter. A minor political concern arises regarding who claims responsibility of the AC and DC disconnects switches when maintenance occurs on the transmission line. As the manufacturing costs for renewable energy sources decrease and sustainable practices become more relevant in society, utility companies should expect an increase for home installations of some sort of power generation. If PG&E assumes responsibility of all disconnect switches, and then additional employees are necessary for transmission line maintenance preparation. PG&E becomes solely responsible for incidents that may occur while employees perform any work on the transmission line or distribution gird. Suppose the customer assumes responsibility of all disconnect switches within the household. PG&E would post notices regarding the time, date, etc. of the maintenance work in advance. Additional safety procedures and more time in the field determine whether the transmission line is safe. Current technology cannot determine where power generation arises from if the transmission line is not de‐energized. If an accident occurs, the question becomes who endures the blame. Assuming the Precor elliptical machine is available in other gyms, customer may demand for a discount on the membership. A social issue regarding the project involves how gyms or institutions will ethically compensate for the human power generation. One of the agreements for lower membership fees or costs regards the lower energy costs for the gym or institution. Building lighting on average accounts for 10% of the energy costs, and should significantly decrease with the addition of power generating machines. However, gyms and institutions may argue that the principal cost of the machines offsets the energy benefits in the end. Though the elliptical machine provides renewable energy, manufacturing processes appear unsustainable.
Design Choice and Implementation
Enphase MicroInverter Concept
Overall Description The Enphase Micro‐Inverter design coincides with most project specifications and goals. The user’s experience on the elliptical machine remains intact, while power generation occurs seamlessly. A DC/DC converter regulates the DC input to the micro‐inverter, which inverts the voltage to a grid compliant 120VAC/240VAC. The micro‐inverter outputs a maximum of 183W, capable of powering many appliances or providing energy for lighting. As the user increases the training resistance level of the elliptical machine, larger currents flow resulting in higher power generation. Power generation does not suffer if another elliptical machine produces less as well.
DC/DC Converter The Wilmore Model 1560 DC/DC converter from Dr. Taufik’s power electronics laboratory provides a steady 41VDC into the micro‐inverter. The typical input voltage ranges from 21‐29VDC, with an adjustable
27
output voltage from 41‐75VDC. Output current ranges from 0‐25A, while the input current ranges from 0‐37.2A. The Wilmore outputs 800W resulting with an efficiency between 86%‐90%. As a requirement for the micro‐inverter, the Wilmore Model 1560 produces low output voltage ripple and noise. The isolated DC/DC converter only produces a 50mV peak‐to‐peak ripple voltage, reducing the chance of a micro‐inverter shutdown due to input voltage fluctuations. The Wilmore’s large size poses the greatest problem for mounting on the elliptical machine.
Trip to Petaluma – Envoy Management Unit (EMU) The Envoy Management Unit (EMU) communicates and allows for administrative control of each micro‐inverter in the system. As a requirement of IEEE 1547 standard, the Enphase micro‐inverter checks for a ground fault condition. The micro‐inverter indicates a ground fault error after initial cycling of AC and DC power with a long constant tone. The tone lasts for five minutes and results in a non‐operational micro‐inverter until the ground fault (GFDI) error clears via the EMU.
While attempting to generate power in the lab, a wrong connection to the grounding clip of the micro‐inverter resulted in a GFDI. Sharon Kirk, a customer service representative from Enphase Energy, suggested clearing the GFDI with an EMU. A face‐to‐face meeting set at Enphase Energy’s headquarters in Petaluma, California on May 15, 2009 provided contact with test engineers who provided an explanation of the micro‐inverter’s connections and software programming. The service engineer demonstrated the EMU webpage interface where most of the options and logging of events occur. A simple checkbox under the “Administrative” tab clears the GFDI. With new knowledge regarding the EMU, the inclusion of one unit in the design deemed necessary. The unit provides a log of all events, displays the overall system, lists each micro‐inverter, and grants Enphase representatives access to the system for troubleshooting.
Enphase MicroInverter The Enphase M175 Micro‐Inverter bridges the elliptical machine to the distribution grid. Mainly for photovoltaic (PV) systems, the micro‐inverter’s design maximizes energy harvest, increases system reliability, and simplifies installation and management. The built‐in software controls a Maximum Peak Power‐Point Tracker (MPPT) for each elliptical machine. In other words, the micro‐inverter extracts available power from each elliptical machine regardless of the performance of other elliptical machines in the system, resulting in maximum energy harvest.
The M175 micro‐inverter handles 210W of input power, operating at a peak power tracking voltage of 25‐40VDC. A DC voltage of 54VDC causes the micro‐inverter to power down, and requires an administrator to clear the fault on the Envoy Energy Management Unit. Input current values from 0‐8A do not pose a problem, but a short circuit current of 10A affects the performance of the system. The micro‐inverter outputs 175W of power at a line‐to‐line voltage of 240VAC or 120VAC from line‐to‐neutral.
By incorporating a micro‐inverter in each elliptical machine, no single point of failure arises in the system. Enphase Micro‐Inverters provide protection against most outdoor conditions, obtaining a NEMA6 rating. The enclosure provides protection against the entry and submersion of water,
28
temperatures up to 150°F (65°C), and damage from ice formation on the enclosure. Lastly, the Enphase Micro‐Inverter insures reliability of up to 119 years mean time between failures (MTBF).
Without including a central grid‐tie inverter, no risk of exposure to lethal 600VDC power exists. Simple low voltage wire, like standard American Wire Gauge (AWG) Number 12, connects from the DC/DC converter to the DC input of the micro‐inverter. An Envoy Energy Management Unit provides administration level management and monitoring of up to sixteen micro‐inverters in the system.
Safety and Maintenance Currently, the Wilmore Model 1560 DC/DC converter fails safety requirements. The external casing utilizes natural convection to lower operating temperatures. Holes at the top of the case allow moisture or water to fall onto major components of the DC/DC converter. A DC/DC converter meeting safety specifications will replace the Wilmore Model 1560 in Fall 2009.
Besides the NEMA6 enclosure rating, another safety feature of the Enphase M175 Micro‐Inverter involves transmission line conditions. The micro‐inverter stops energy production if the transmission line becomes de‐energized. Once the transmission line returns to supplying power, an administrator must login to the EMU to clear the fault. The micro‐inverter also incorporates a ground fault detector and interrupter (GFDI). If a difference or imbalance in currents arises in the positive and neutral wire, the circuit trips to prevent electric shock. The GFDI prevents leakage current of the capacitors from flowing into the neutral wire. When the GFDI “trips”, a continuous beep emits from the micro‐inverter and energy productions comes to a halt. Clearing the GFDI fault requires administrative login once again.
The system requires occasional condition‐based maintenance. Wires connecting the DC/DC converter to the elliptical machine and the DC/DC converter to the Enphase micro‐inverter may degrade over time or may encounter rotating parts in the elliptical machine. Signs of degradation include insulation burn, cracking, delaminating or wire splicing. Utilizing AWG No. 12 copper wire reduces the chances of degradation due to a current rating of 9.33A.
Enphase Envoy Management Unit (EMU) Serial Number: 030906000932 Rev 0301
The Enphase Envoy Management Unit (EMU) collects data of all micro‐inverters in a system and transmits the data to the Enlighten website, maintained by Enphase. On the Enlighten website, visitors can view the energy output of each micro‐inverter and administrators can manage the performance of the overall system. Since the micro‐inverters are grid‐tied, information about the system can be collected across existing power lines. The EMU simply plugs into any standard AC outlet and communicates with the micro‐inverters. An Ethernet cable between the EMU and a broadband router transmits information over the Internet. Enphase employees, who provide initial feedback of the system, analyze the data to ensure optimal performance. Information regarding the energy output of each micro‐inverter is available on the website. Visitors and students can observe the daily output of each micro‐inverter as well as determine which elliptical machines are commonly occupied on the Enlighten website. The EMU is a great tool for testing and monitoring because it assembles an internal database of all known Enphase Micro‐inverters at the site. At regular intervals, approximately five minutes, the EMU polls each Micro‐inverter for its energy data. The EMU reports any error conditions that affect itself or the Micro‐inverters within the system. Ground fault errors clears via the EMU rather than physically taking in the micro‐inverter to the Enphase headquarters located in Petaluma, CA. The initial synch time shortens from five minutes to ten seconds. Enphase employees will also have access to the micro‐inverters to update the software for better performance as well.
Energy and Cost Analysis The Enphase M175 Micro‐Inverter and DC/DC converter attribute to the major costs of the project. Each elliptical machine requires the two components in order to harvest energy. The Envoy EMU allows for administration control and monitoring and is not vital to the overall system. Modified elliptical machines require a total cost of approximately $400.
Three factors allow an estimation of the amount of savings for the REC Center expansion. By assuming ten hours of usage during the day, the production of about 0.100kWh, and the price of electricity 4 Enphase Energy [http://www.enphaseenergy.com]
remaining at $0.14 per kWh the daily and annual savings of one elliptical machine results. Each modified elliptical machine saves approximately $0.14 a day. At a day savings of $0.14, and seven days a week of operation, the payback period is about eight years. However, the savings do not reflect the additional savings in cooling costs for the REC Center with the removal of the resistor coils that dissipate heat.
Refer to Appendix D for a detailed cost analysis.
Results and Testing
Elliptical Potential Output Power Test #1: Resistive Coil Power Dissipation at 100 Strides per Minute (April 2, 2009)
In order to measure how much power the resistive coils dissipate at various elliptical resistance levels, we measured the voltage across the two 20Ω parallel branch as well as the total current flowing through both coils. The following table summarizes our findings.
Table 2: Resistive Coil Electrical Measurements at 100 strides/min
The large discrepancies between theoretical and measured power dissipations prove this data invalid. From the table above, the large discrepancies between the theoretical and experimental output current from the elliptical machine result from human error. By not properly selecting the appropriate range on the Fluke multimeter, the experimental currents appear smaller by a factor of ten. Test #2 corrects the problem, resulting in experimental values similar to the theoretical values.
Table 2 shows the measurement values taken from the elliptical machine. We measured current and voltage at the resistor output. We broke the circuit before the resistors to measure the current flowing
33
through. We also measured the voltage across the resistors. We took measurements under a constant speed of 100±3 strides per minute at the lowest incline. The name plate information reads two 20 Ω resistive coils wired in parallel, resulting in an equivalent resistance of 10Ω as verified with an ohmmeter. These data shows output power ranges from 0 to around 170 kW, implying that any components attached to this output such as DC/DC converters or inverters must match this power rating. The voltage range outputted from the elliptical machine ranges from 0 to 41.3V, while the current flowing through the resistors ranges from 0 to 4.08A. Note, the current measured through the resistors differs if we connect our harvesting leads across the onboard resistors due to current division. Currently, we face problems in drawing not enough current as well as voltage, since the majority of the current flows through these resistors rather than into the attached DC/DC converter.
Test #3: Elliptical Output Power at 160 Strides per Minute (May 18, 2009)
This test measures the output power at an increased pace. The elliptical user survey conducted on May 18, 2009 indicates the average pace is 160 strides per minute. Under this pace, the maximum output power doubles from 168 W at 100 strides per minute to 346.84 W. The elliptical user survey also indicates the typical resistance range between the five to ten levels, corresponding to 25 to 87 W.
Table 4: Elliptical Output Power at 160 strides per minute
Figure 15: Elliptical Output Power at 160 strides per minute
Enphase Microinverter Testing The Enphase Micro‐inverter has the following specifications from the Enphase Energy datasheet:
DC input characteristics: Recommended input power: 210W Maximum input DC voltage: 54V Peak power tracking voltage: 25V‐40V (36V ideal) Max input current: 8A
AC output characteristics: Maximum output power: 175W Nominal output current: 750mA Nominal voltage range: 240V/211V‐264V
As a safety feature, the micro‐inverter must sense a 240VAC source at the output in order to produce any power. When the micro‐inverter senses 240VAC, the operator hears a series of six long beeps. Immediately afterwards the micro‐inverter begins a start‐up process programmed by Enphase. After completion, a series of six long beeps indicates proper start‐up. Before power generation or DC inversion occurs, the micro‐inverter performs another series of checks of the AC signal for voltage and frequency synchronization. The process lasts at least five minutes, but the Envoy Management Unit (EMU) allows for shortening the time by entering the administrator tools.
35
Figure 16: Enphase Enlighten "My System" Interface
Another benefit of the EMU, allows the administrator to monitor the entire system and view both the current and past amounts of power generation. The unit plugs directly into a household receptacle, but must operate on the same line or distribution panel as the micro‐inverter. Utilizing the AC line as a means of communication, the EMU collects data from the micro‐inverter regarding power generation and frequent status reports, which is all logged on a website. With proper network protocols open, the EMU sends data regarding the overall system of micro‐inverters via the Internet to Enphase’ Enlighten Server. The Enlighten System serves as a personal account in which the owner logs in to view and track how much power generation occurs at a given time. Figure 14 displays a part of the graphical user interface available on the Enlighten website. In the event of a system failure or connection error, the Enlighten System sends out an e‐mail alert to the account holder as well.
In addition to tracking the amount of power generation, the EMU logs specific event flags. This log informs Enphase as well as the owner of any discrepancies or issues with the micro‐inverter such as “grid instability” and a “low DC input”, common issues seen from lab testing. Figure 15 is the EMU interface available only on the network the EMU operates within. The figure displays the initial homepage with the log of events and an overview of the system. When unknown errors occur, Enphase technicians can troubleshoot and fix any problems from their headquarters through the EMU.
36
Figure 17: Elliptical System Overview for Troubleshooting
Test Setup #1 (May 26, 2009)
DC/DCConverter
Enphase Micro-inverter
120VAC
120VAC
Neutral36VDC
Building Power Grid
100 Ω Potentiometer
EMU
DC
25VDC
Line 1
Line 2
Figure 18: Test Circuit Configuration with Two 120VAC Sources Out of Phase by 180°
37
The initial test of the micro‐inverter requires 25VDC to the DC/DC converter, which outputs 41VDC to the DC input of the micro‐inverter. At the start‐up of the DC source, the meters indicated no current flow from the DC/DC converter to the micro‐inverter resulting in a “DC voltage too low” in the EMU log. Due to the low current level, the assumption that the DC/DC converter restricted current flow resulted in a different test set‐up. Instead, the DC source in series with a 100Ω potentiometer supplying 36VDC connects directly to the DC input of the micro‐inverter. Figure 14 plots the amount of power returning to the grid on May 26, 2009 at 4:15 pm, a maximum output power of 44W.
Emphases’ design of their micro‐inverter calls for use in a solar power harvesting system, a fact the team must design the EHFEM project around. Solar cells output a constant current with fluctuating voltages. Enphase utilizes that knowledge to incorporate a Maximum Power Point Tracking (MPPT) feature to pinpoint the maximum DC input voltage. By operating at the maximum voltage, the system increases its power efficiency and amount of power generation. For more information regarding MPPT, please refer to Appendix E.
MPPT’s purpose is to increase power efficiency, but lab testing shows the system altering the input DC voltage and current. Power meters indicate even with a constant DC source, fluctuations occur almost every 45 seconds at the system operates in “burst mode”. In burst mode, the capacitors in the micro‐inverter charge and discharge power when available, resulting in a non‐ideal fluctuating output power.
Test Setup# 2 (June 4, 2009)
Figure 19: Circuit Configuration with Direct DC Power Supply to the Micro‐Inverter and Two 120VAC Sources Out of Phase by 180°
Due to the occurrence of burst mode, another design alteration with the elimination of the potentiometer and DC/DC converter was tested. Figure 17 displays the new connection with the DC source supplying 36VDC. Table 5 displays the results on June 4, 2009. The results show power generation from the micro‐inverter, a maximum of 180W.
38
Table 5: Micro‐inverter Output Power with Direct DC Power Supply to the Micro‐Inverter
According the results, the micro‐inverter operates fully within its rated specifications. The test indicates an efficiency rating in the 90‐96% range with an output power around 182W. Though the system generated power, the micro‐inverter entered burst mode once again.
After running the system for awhile at an input voltage of 37.8VDC, fluctuations in both input and output values signaled operation in burst mode. Current values fluctuated approximately every 42 seconds and lasted for around six seconds. This particular incident reaffirms the necessity of a DC/DC converter to maintain input voltage to the micro‐inverter. The data specifies a DC/DC converter with a 200W output power for improved overall system efficiency.
Test Setup #3 (June 4, 2009)
Enphase Micro-inverter
120VAC
120VAC
Building Power Grid
100 Ω Potentiometer
EMU
DC
Figure 20: Circuit Configuration Including Input Voltage Regulating Potentiometer
The third test on June 4, 2009 from 3:00pm to 5:00 pm incorporates the 100Ω potentiometer at the input of the micro‐inverter to observe the effects of additional impedance. The test determines the change in input current and its effect on the output power from the micro‐inverter. After the initial five minutes, the micro‐inverter began drawing the current and outputting power as shown in the table below. The additional impedance lowers the input DC current into the micro‐inverter, therefore lowering the total output power.
39
Table 6 ‐ Micro‐Inverter Output Power with Input Voltage Regulating Potentiometer
Once again the test results in burst mode when the input voltage fluctuates between 27‐31VDC for approximately 16 seconds. After 16 seconds, both the current and voltage levels drop for approximately 5 seconds and then returns back up to the 27‐31VDC range.
As we add more components between the DC source and the micro‐inverter, the additional resistance lowers the input DC current value. The lower the current values result in less output power and operation in burst mode.
Final Test Setup (June 5, 2009)
Figure 21 ‐ Final Design Test
Figure 19 above displays the final test set‐up, a DC source supplies 21‐28VDC to the Wilmore Model 1560 DC/DC converter which outputs 41VDC to the input of the Enphase micro‐inverter. The elimination of the 100Ω potentiometer reduces the amount of series impedance in the system and decreases power loss in the system. By varying the input voltage to the DC/DC converter within the rated values, allows for higher overall efficiency and a minor simulation of the elliptical machine. The success of this particular determines the reliability and efficiency of the overall design concept.
The design shows no sign of burst mode operation, while generating 180W of power. Rapidly changing the input DC/DC converter input voltage between 20‐30VDC in order to simulate elliptical machine output voltage fluctuations, did not alter the output voltage of the DC/DC converter. The overall system
40
efficiency resembles the micro‐inverter’s rating of 94%, slightly higher than expectations due to losses in the DC/DC converter.
In addition to the power meter readings, the table includes output power values from the EMU and Enphases’ Enlighten system. However, since the EMU collects data through period samples, the values may not align with that instance of time.
Please see Appendix C for Enphase Enlighten graphs of energy harvest at the time.
The test also examines the effect of a synchronization time set by Enphase as a safety feature. According to conversations with two Enphase test engineers, the micro‐inverter synchronization works as follow:
1. Connect both Lines 1 and 2 back to the grid (Bldg 20, Room 102 Power Lab Patch Board), 120VAC on each line while the Green neutral line connects to neutral.
2. At the instance of energizing both lines 1 and 2, listen immediately for six successive beeps indicating the micro‐inverter senses the grid at its output.
3. Wait approximately a minute for another succession of beeps to indicate completion of initial micro‐inverter start‐up sequence.
4. After the second series of beeps, time five minutes before power generation occurs. 5. After five minutes, a DC input of 25‐40VDC should yield power output back into the grid.
Three methods verify the five‐minute synchronization time of the micro‐inverter. The first method requires energizing lines one and two at the micro‐inverter output with 120VAC each and applying 25VDC into the DC/DC converter input at the same time, resulting in 41VDC at the input of the micro‐inverter. Approximately five minutes after the second series of beeps, the micro‐inverter should begin returning 180W back into the grid. This test insures in the case of a power outage during exercising, the micro‐inverter is still capable of generating power after the five‐minute synchronization time.
The second method energizes the micro‐inverter output in the same manner as above. However, rather than supplying a DC voltage to the micro‐inverter immediately upon energizing, a five‐minute interval takes place. After waiting the five‐minutes, the micro‐inverter receives a DC supply and should start to
41
generate power immediately. The test simulates the event of a power outage during off‐peak Rec Center times and no athlete is operating the elliptical machine.
The final method actually insures no five‐minute synchronization time occurs when athletes stop and go or exchange elliptical machines. When an athlete stops for a short period of time on the elliptical machine, essentially the input DC supply to the micro‐inverter is non‐existent. The micro‐inverter in this event would assume no sun for solar energy harvest is available, so it enters a sleep mode. However, for gym applications events such as these would occur normally, and could lead to less energy harvest if the micro‐inverter requires another five‐minute synchronization time. Simulating such an event requires switching the DC supply to the DC/DC converter on and off for short time intervals. Tests indicate that no five‐minute synchronization time occurs between athlete breaks or exchanges, providing an ideal scenario for the Rec Center application.
From the results of numerous tests, the five‐minute synchronization time will not affect productivity of energy harvesting. The five‐minute synchronization time is vital upon the first start‐up of the overall system. Once the AC source or grid displays no sign of instability the micro‐inverter generates power almost instantaneously. The five‐minute synchronization time will occur in the event of a power outage since the micro‐inverters shut off as a safety feature and require the clearing of a flag on the EMU administrative website. However, in the case of a gym scenario, the synchronization time is irrelevant when athletes take a break on the elliptical machine or exchange with another athlete.
Since the elliptical machine’s training resistance depends on the resistor coils at the rear machine, removing them and connecting the leads to a DC/DC converter instead provides a method of testing how the training resistance differs. At the output of the Wilmore Model 1560 DC/DC converter, a variable power resistor box provides a load and path for current flow. The initial value of the resistor box is 10Ω, just to observe if training resistance is still available with a DC/DC converter in the line. The difficult of this particular test is operating within the rated input voltage range (21‐28VDC) of the Wilmore Model 1560.
Figure 22: DC/DC converter test configuration
For the team, a varying training resistance rather than a constant training resistance occurs with the power resistor box at the output of the DC/DC converter. An explanation of the varying training resistance involves the short range input voltage of the DC/DC converter. When the voltages spike above or below the voltage range, the DC/DC converter shuts off resulting in no current flow and essentially no training resistance.
42
Table 8: Output power of DC/DC converter at each resistance level
Table 8 summarizes the input and output voltages and currents from the test configuration under a constant pace of 160 strides per minute. Notice that the higher training resistance, the more power dissipation across the power resistor box. The training resistance determines the amount of output current or field current to extract for eddy current braking. At training resistance level “14”, the DC/DC converter shut off and quits outputting power. The only explanation to resolve the issue is a large voltage spike from 14.09VDC to a value outside the operating limits of the Wilmore Model 1560 DC/DC converter.
This particular test indicates the ideal specifications for a DC/DC converter. The input voltage range should at least start at 8V and end at a value greater than 16V. Maximizing the energy harvest at multiple training resistances provides greater output power and overall system usability. An output power rating of 200W appears to suffice for connections with the Enphase micro‐inverter. Finding a DC/DC converter with these specifications is difficult and determining the average training resistance used by athletes is vital to determine which levels to sacrifice. However, prospects for future projects may include designing a DC/DC converter to meet these specifications.
Figure 23: DC‐DC converter output power at various resistance settings
Elliptical User Survey (May 18, 2009) As a method to determine typical settings for the elliptical machines, a survey involving some Cal Poly Rec Center users provides a better approximation. From the results in Table 9, must athletes exercise mostly between training resistance levels 5‐10. From previous testing, users would generate between 16‐55W of power at the common training resistance levels.
Other than training resistance level, pace also dictates the amount of power generation from the elliptical machines. The common pace for the athletes ranges from 150‐180 strides per minute. Test from this day forward, will be performed at a minimum of 160 strides per minute. The variance in speed and training resistance over the course of the workout program determines power generation as well. According to the survey, athletes increase, decrease, or remain constant in speed and resistance. Some also vary their speed and resistance throughout the workout programs or just increase both settings.
Table 9 ‐ EHFEM Student Survey Results
E.H.F.E.M Student Survey 1 2 3 4 5 6 7 8 9 10
How long do you exercise continuously on the elliptical machine?
25‐30 min
60 min 40 min 45‐60 min
30‐40 min
40 min 45 min 40 min 30 min
What typical resistance setting do you exercise at? (1‐20)
5‐10 7 8 7‐10 7‐9 7 8 8‐10 8
What typical pace do you exercise at? (Strides per minute)
180 75‐80 rpm
160‐180 160 150‐160 140‐150
During the period of exercise, describe the pace of a typical session:
a) a constant pace b) increasing pace c) decreasing pace
Increase @ end
B
Up and down
A
Up and down
A
B
A
A
During the period of exercise, how does the training resistance level vary?
a) a constant resistance b) increasing resistance c) decreasing resistance
Increase every 5 minutes
B
Up and down
Increase and
decrease at End
Up and down
A
A
B
A
Do you use any programmed exercise routines? Please specify:
None
None
Random
None
Interval
None
Weight loss
program
Incline
None
Design Realization
Since the EHFEM projects plans to continue for at least another quarter, mounting of the Enphase Micro‐Inverter or DC/DC converter will not take place until then. However, the design considers possible locations for both major components.
The Enphase Micro‐Inverter mounts directly underneath the ramp of the elliptical machine shown below. The ramp measures 2’‐4” long and 1’‐1½” wide, providing ample space and shielding of any liquid from contacting the micro‐inverter. At the lowest incline setting the ramp is still 10” from any metal contact of the elliptical machine. The Enphase M175 Micro‐Inverter measures 11” long, 5¾” wide, and 1½” deep with two mounting holes on one side. The ramp utilizes 3⁄16” diameter bolts, which fit into the mounting holes of the micro‐inverter as well. The only modification necessary in this case requires locating a longer 3⁄16” bolt to accommodate the micro‐inverter.
Figure 24 ‐ Mounting of Enphase M175 Micro‐Inverter
The DC input wires plan to run inside the center beam directly underneath the ramp. The center beam already contains cables connecting the onboard display to the onboard computer. Allowing for some slack, the DC wires must at least be 5’‐5¼” in length to run to the back of elliptical machine. The two resistor coils in the back circular housing is no longer necessary, so the DC converter will mount in its place. The previous wiring to the resistor coils becomes unnecessary as well, and wiring from the micro‐inverter to the DC/DC will run its place. The DC wires do not come into contact with the mechanical moving parts due to wiring mounts inside the housing.
46
AC wiring depends on how ASI plans to organize the elliptical machines within the new Rec Center expansion. The design allows for an arrangement of either side‐by‐side or back‐to‐front. Both arrangements require some type of matting on the floor to protect both athletes and components from tripping over the wires. Covering the wires prevents conditional wear at the same time.
Design Verification On July 10th, 2009 a product demonstration for Dr. David Braun showcased the power generation capabilities of the design.
Testing of the design requires removal of the resistor coils, and connecting the leads to the Wilmore Model 1560 DC/DC converter instead. The output of the DC/DC converter feeds into the DC input of the micro‐inverter, where AC inversion takes place. After a five minute synch time for the Enphase M175 Micro‐Inverter, power generation can successfully occur. In the test, power returns back to the distribution panel of the power room in Room 102. A power meter measures the AC supply voltage to ensure no fluctuations, and the power generated by the micro‐inverter itself. A Fluke meter measures the DC input voltage to the DC/DC converter.
The first test requires one athlete to use the elliptical machine at a training resistance level other than “1” (the lowest setting). At training resistance level “1”, no power should return back into the power grid since the elliptical machine requires no eddy current braking for training resistance. In addition to a training resistance level greater than “1”, the survey results indicate the athlete must keep a stride of 160 strides per minute. At higher training resistance levels above level 16, the DC/DC converter fails to perform properly as the DC input voltage jumps above the rated values. Table 10 below summarizes the amount of power generation, and the input voltage and current to the DC/DC converter. At training resistance level “10”, the power generation fails to meet the increasing trend. Failure to meet the strides per minute criteria explains the decrease in power generation. The maximum output power at training resistance level “16” with 160 strides per minute is approximately 70W. From the table, the DC input voltage to the DC/DC converter fails to reach the rated input values of the Wilmore Model 1560 DC/DC converter, which requires an input voltage of 21‐28VDC. With the final testing results of the Wilmore Model 1560 DC/DC converter, selecting a more efficient DC/DC converter with an input voltage range from at least 8‐16VDC is the next step of the project.
The final test simulates a gym environment with athletes operating the elliptical machines at different times or intervals. The test assures no five minute synch time is necessary before power generation occurs. In the test, observation of the power meter suffices as evidence for power generation. From observation, no five minute synch time occurs before power generation as the first athlete stops, and another athlete utilizes the machine immediately. The test requires this sequence to occur at two‐minute intervals before the next athlete utilizes the elliptical machine. At a ten‐minute interval, the design produces power immediately when the athlete utilizes the elliptical machine.
Conclusion Test results show the energy harvesting design for an elliptical machine is capable of producing a 120VAC/240VAC at 60Hz for returning power back to the distribution grid. A combination of the Wilmore Model 1560 DC/DC Converter and Enphase M175 Micro‐Inverter produces efficiency in the low 90% range. The project creates awareness of how much energy is lost in the form of heat on the elliptical machines, while promoting a sustainable and healthy lifestyle. The overall design of the system showcases the feasibility a manufacturer should consider when integrating energy harvesting in an elliptical machine. The two major components of the design add approximately $400 to the overall cost of the elliptical machine.
48
The potential energy production of multiple elliptical machines in a gym setting increases linearly. Home use tends to produce less energy than a gym setting because less time is spent on the elliptical machine. As seen in Appendix C, more usage of the machines increases both the daily and annual savings for electricity. The system tends to pay for itself in less than ten years as well.
Integration into the distribution grid of a residential or commercial property resembles solar panel installation. A connection to the circuit breaker is necessary to produce any energy power as a safety feature of the micro‐inverter. However, a connection into the distribution grid should require professional attention.
Recommendations The Wilmore Model 1560 provides a sufficient starting point for a prototype, but smaller DC/DC converters can provide the same functionality. In the fall of 2009, half of the team plans to purchase a 200W isolated DC/DC converter with funding from the HuSel program. A wide input DC voltage range allows for more energy production from the overall system compared to the Wilmore. The Vicor Maxi provides 200W output at 36VDC out with an input voltage range of 8‐36VDC. The Vicor also outputs at 85% efficiency with low noise sufficient for the Enphase micro‐inverter.
Another option for the team in the fall requires the building of a DC/DC converter specifically designed for this application. With guidance from Professor Taufik, the team plans to construct a DC/DC converter with a wide input voltage range from 5‐45VDC, a max input current of 5A, an output voltage of 36VDC, and an output power of 175W. The ratings insure maximum energy harvest from the elliptical machine.
A 240VAC line in the polymer laboratory would make testing of the overall elliptical machine more efficient. Testing of most of the components took place in the Power Lab or Room 102, rather than the polymer laboratory.
49
50
Appendix A: Initial Researched Components The tables below display the price and distributor of the components necessary for each design concept. None of the wiring costs appear in the tables because each design would require some sort of wiring. Table 11 ‐ Options for a DC/AC Inverter
Component Distributor Serial # List Price
300 Watt Power Inverter AIMS PWRI30012S $199.00
180 Watt Power Inverter AIMS PWRI18012S $129.00
190Watt 72VDC/240VAC Enphase Micro‐Inverter
Enphase M190‐72‐240‐S12 MC4 $209.95
Table 12 ‐ Options for an AC/DC Inverter
Component Distributor Serial # List Price
Low Profile Regulated Power Supply Acopian W15LT4800 $775.00
AC/DC Single Output Cosel U.S.A PAA150F‐12 $212.16
Switch Mode Power Supplies Single Output AC/DC Power Supply
Triad Magnetics
AWSP40‐12 $21.07
Table 13 ‐ Options for an AC/DC Disconnect Switch
Component Distributor Serial # List Price
Fusible AC Disconnect Switch GE Electric TPF60R $24.99
Fusible AC Disconnect Switch GE Electric TF60RCP $19.99
30 Amp Non Fusible Indoor Safety Switch
Your One Source
L111N $19.99
30 Amp Fusible Indoor Safety Switch Siemens Energy
LF211NU $26.99
Table 14 shows a total cost price estimate including the lowest cost components from each table above. Though the price reflects the lowest cost, compatibility between all the components still requires testing. The price reflects a start point into the future design considerations of the project. Once again the price fails to represent the wiring and modification costs.
51
52
Table 14 ‐ Lowest Total Cost Combination
Component Distributor Serial # List Price
180Watt Power Inverter AIMS PWRI18012S $129.00
Switch Mode Power Supplies Single Output AC/DC Power Supply
Triad Magnetics
AWSP40‐12 $21.07
Fusible A C Disconnect Switch GE Electric TF60RCP $19.99
30 Amp Fusible Indoor Safety Switch Siemens Energy
LF211NU $26.99
Total $197.05
Appendix B: Design Matrix
Lithium Ion Battery Smart Load
DC/DC Converter to Enphase Micro‐Inverter
Direct AC Harvesting DC/DC Converter to Grid‐Tied Inverter
Appendix C: Enphase Enlighten Graphs for MicroInverter Testing
Test #1
Figure 25 ‐ Energy Harvest on May 26, 2009 Testing (Micro‐inverter Test #1 → 40W)
54
Test #2
Test #3
Figure 26 – Energy Harvest on June 4, 2009 testing (Test #2 → 180W, Test #3 → 50W)
Test #4
Figure 27 – Energy Harvest on June 5, 2009 testing (Test #4 → 180W)
55
Appendix D: Detailed Cost Analysis
The following tables estimate the daily and annual savings, as well as the payback period of the system. Since the gym typically operates between the hours of 8AM and 12AM, the hours of use varies from one to eighteen hours. A recent survey estimates the total amount of energy production during a session is approximately 100W. Since the current Rec Center equipment is in use for most periods of the day, the conversion to the amount of energy production in an hour is equal to 0.1kWh. In February 2009, the Energy Information Administration averages the cost per kWh equal to $0.14 for the state of California. The initial payback period for only one hour of usage is 78 years per elliptical machine. However, ten hours of usage is a better approximation, resulting in an eight year payback period. The daily and annual savings res ults from the following equation:
Day Savings $
Annual Savings 365 $
The payback period accounts for the initial cost of the modifications for the elliptical machine, as well as the annual savings of the system. An initial cost of $400 sums the retail price of the DC/DC converter and Enphase M175 Micro‐Inverter. The payback period the following equation: results from
Payback Period
years
Table 15 ‐ Cost Analysis with Hours of Usage
Hours of Use
Day Savings
Annual Savings
Payback Period (yrs)
Energy Produced (kWh)
Cost per kWh
1 $0.01 $5.11 86.11 0.1 $0.14
2 $0.03 $10.22 43.05
3 $0.04 $15.33 28.70
4 $0.06 $20.44 21.53
5 $0.07 $25.55 17.22
6 $0.08 $30.66 14.35
7 $0.10 $35.77 12.30
8 $0.11 $40.88 10.76
9 $0.13 $45.99 9.57
10 $0.14 $51.10 8.61
11 $0.15 $56.21 7.83
12 $0.17 $61.32 7.18
13 $0.18 $66.43 6.62
14 $0.20 $71.54 6.15
15 $0.21 $76.65 5.74
16 $0.22 $81.76 5.38
56
57
17 $0.24 $86.87 5.07
18 $0.25 $91.98 4.78
As the hours of usage increases, the payback period decays exponentially. Starting at a payback period of 78 years for only one hour of usage, the system only takes roughly 5 years to breakeven at eighteen hours of usage. These values do not account for the potential reduction in cooling costs for the Rec Center.
Figure 28 ‐ Payback Period as a Function of Hours of Use
0.00
10.00
20.00
30.00
40.00
50.00
60.00
70.00
80.00
0 2 4 6 8 10 12 14 16 1
Payback Period (Years)
Hours of Use per Day
Payback Period Depending on Hours of Usage a Day
8
Appendix E: Maximum Power Point Tracking (MPPT)
Figure 29: Micro‐inverter internal voltage and current under constant current input and constant input voltage
The two graphs above show the current and voltages the micro‐inverter tracks during maximum power tracking.
Enphase designs the micro‐inverter to operate with a constant input current. The left plot shows the maximum point the micro‐inverter selects. This point maximizes both current and voltage, which maximizes power productivity.
Under constant voltage input, the micro‐inverter sees the plot on the right. As current increases, voltage increases as well. The micro‐inverter tries to maximize both current and voltage but cannot identify a specific maximum. Therefore it enters a type of burst mode where it picks several points along the curve to output at. In the lab, burst mode results in an output voltage and current fluctuation.
In order to fix the problem, a DC/DC converter with a steady output current provides an ideal input current for the micro‐inverter. Under constant current operation, the micro‐inverter will pinpoint maximum power outputs such as the one highlighted above.
58
Appendix F: Enphase M175 MicroInverter Datasheet
59
60
Appendix G: Wilmore Model 1560 DC/DC Converter Datasheet
61
62
63
References
[A1] UL code 1741 – modified 2007, “Inverters, converters, controllers, and interconnection system equipment for use with distributed energy resources”, http://ulstandardsinfonet.ul.com/scopes/scopes.asp?fn=1741.html
[A2] IEEE Std 1547‐2003, IEEE Standard for Interconnecting Distributed Resources with Electric Power Systems [A3] PG&E Rule21‐2005, PG&E Rule for Generating Facility Interconnections [A4] National Electrical Code ed.2005, Article 690, NEC Solar Photovoltaic Systems [1] S. R. Euston and W. E. Gibson, “The Ethic of Sustainability,” Earth Ethics 6, 1995 p. 5‐7. Available: http://www.iisd.org/sd/principle.asp?pid=31&display=1. [Accessed Jan. 16, 2009]. [2] Stock Exchange Release. (2009, February 5). Amer Sports Coperation Financial Results 2008 (IFRS). Retrieved May 11, 2009, from Amer Sports: http://www.amersports.com/media/releases/view/amer_sports_corporation_financial_results_2008‐ifrs.html [3] Wikipedia – Barry Commoner. (2008, February 20). "Barry Commoner, C250: Columbia Celebrates Columbians Ahead of their Time.". http://c250.columbia.edu/c250_celebrates/remarkable_columbians/barry_commoner.html.