17
Energy in Our Life Gymnázium, Brno, Vídeňská 47
| Date post: | 30-Dec-2015 |
| Category: |
Documents |
| Upload: | lisandra-lambert |
| View: | 22 times |
| Download: | 0 times |

Energy in Our Life
Gymnázium,
Brno,
Vídeňská 47

Energy in Our Life
presents
The summer electricity consumption measurementsand comparison with winter
At first…
…we would like to explain two questions from the winter measurements.
In winter…
• …we found a house with a very low consumption.
• However, in summer the consumption was the highest there!!!
• And, they had changed the electrometer in the meantime...
• So, we do not know if there was a mistake or if the consumption changed so much…

The school…
• …had also a very, very low consumption.
• First we were searching for another electrometer in the school – there was none.
• Our investigation went on...
• …and we found out that to get the right consumption the number on the electrometer must be multiplied by 40!

In summer we got these data
FamilyHouse or Flat
Electrical cooking
Electrical Heating
Air conditioner People Start (KWh) Week 1 Week 2 Week 3 Week 4 Total (KWh)
1 F N N N 4 1381 1411 1443 1474 1508 1272 F N N N 3 24712 24739 24770 24802 24835 1233 F N N N 2 494197 494235 494269 494305 494339 1424 F N N N 2 197771 197810 197852 197893 197929 1585 F N N N 3 303428 303496 303565 303633 303702 2746 F N N N 3 6923 6963 7008 7051 7093 1707 H Y Y N 4 12662 12712 12760 12809 12857 1958 F N N N 4 36131 36239 36337 36426 36515 3849 H N N N 5 39490 39593 39695 39787 39880 39010 F Y N N 4 1801 1864 1922 1980 2037 23611 F N N N 4 18848 18909 18977 19035 19096 24812 H Y N N 4 14415 14483 14550 14621 14688 27313 H Y Y N 3 4666 4740 4817 4899 4975 30914 F N N N 4 2045 2119 2193 2267 2340 29515 H Y N N 3 7622 7647 7671 7697 7720 9816 H N N N 4 576 739 920 1080 1255 67917 F N N N 3 23909 23947 23987 24025 24062 15318 H Y Y N 5 50773 50855 50930 51009 51091 31819 H N N N 3 49537 49684 49849 49997 50146 60920 F Y N N 4 9435 9484 9531 9577 9622 187
N N N 600 527480 528840 530520 532080 533800 6320SCHOOL

From the data we got some conclusions…
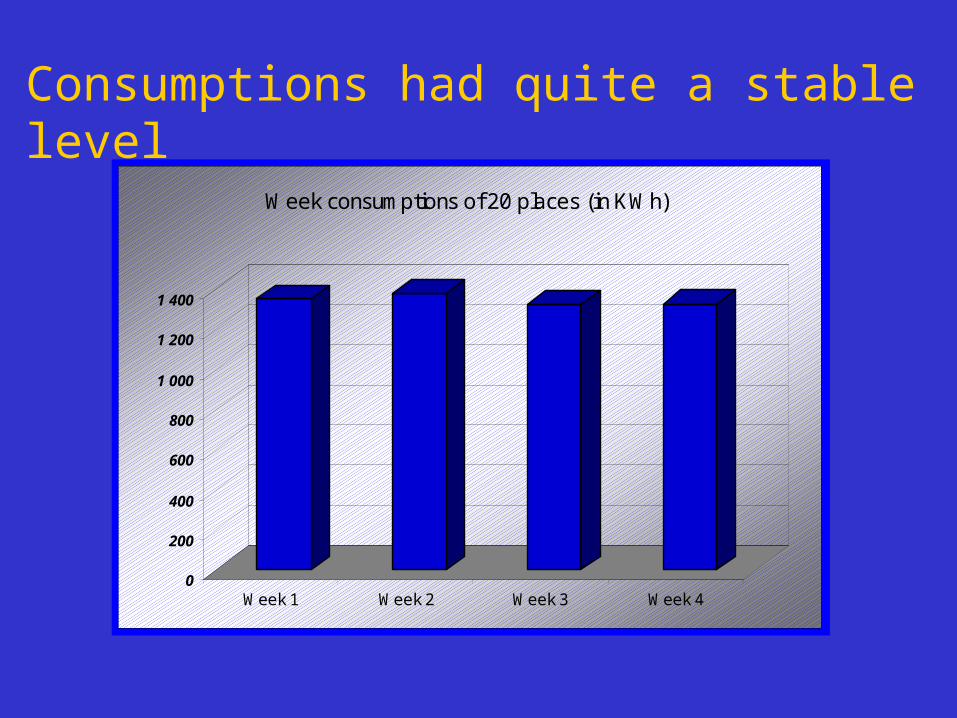
Consumptions had quite a stable level
0
200
400
600
800
1 000
1 200
1 400
Week 1 Week 2 Week 3 Week 4
Week consumptions of 20 places (in KWh)

Fam.House or Flat
Electr. cooking
Electr. heating
Air cond.
People Start End Total (KWh) KWh/ person
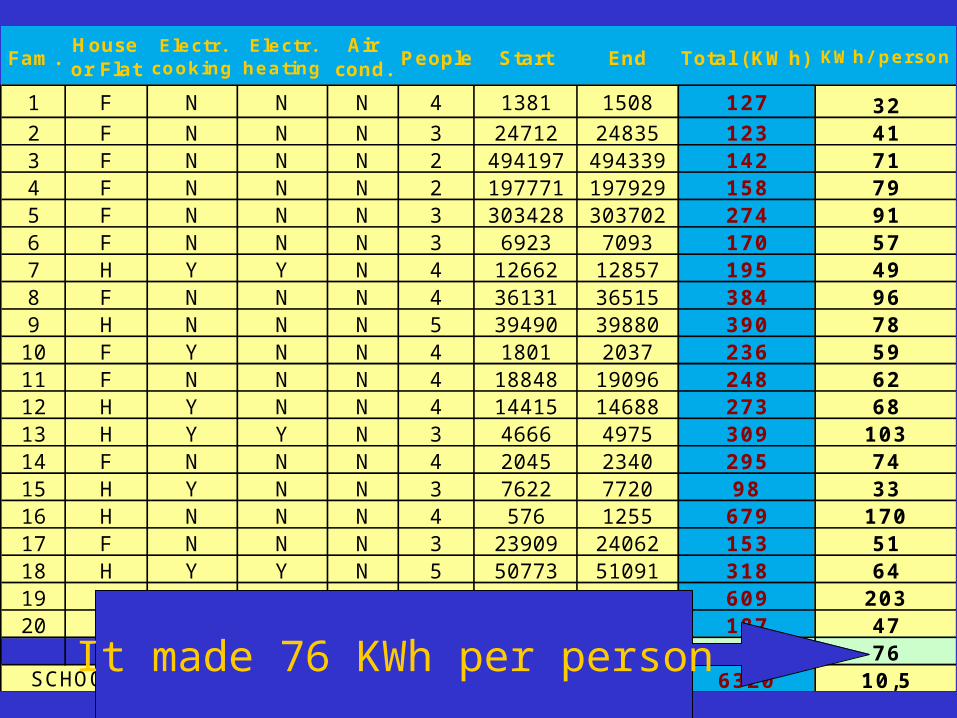
1 F N N N 4 1381 1508 127 322 F N N N 3 24712 24835 123 413 F N N N 2 494197 494339 142 714 F N N N 2 197771 197929 158 795 F N N N 3 303428 303702 274 916 F N N N 3 6923 7093 170 577 H Y Y N 4 12662 12857 195 498 F N N N 4 36131 36515 384 969 H N N N 5 39490 39880 390 7810 F Y N N 4 1801 2037 236 5911 F N N N 4 18848 19096 248 6212 H Y N N 4 14415 14688 273 6813 H Y Y N 3 4666 4975 309 10314 F N N N 4 2045 2340 295 7415 H Y N N 3 7622 7720 98 3316 H N N N 4 576 1255 679 17017 F N N N 3 23909 24062 153 5118 H Y Y N 5 50773 51091 318 6419 H N N N 3 49537 50146 609 20320 F Y N N 4 9435 9622 187 47
average 268 76N N N 600 527480 533800 6320 10,5SCHOOL
The average was 268 KWh
per place
Fam.House or Flat
Electr. cooking
Electr. heating
Air cond.
People Start End Total (KWh) KWh/ person
1 F N N N 4 1381 1508 127 322 F N N N 3 24712 24835 123 413 F N N N 2 494197 494339 142 714 F N N N 2 197771 197929 158 795 F N N N 3 303428 303702 274 916 F N N N 3 6923 7093 170 577 H Y Y N 4 12662 12857 195 498 F N N N 4 36131 36515 384 969 H N N N 5 39490 39880 390 7810 F Y N N 4 1801 2037 236 5911 F N N N 4 18848 19096 248 6212 H Y N N 4 14415 14688 273 6813 H Y Y N 3 4666 4975 309 10314 F N N N 4 2045 2340 295 7415 H Y N N 3 7622 7720 98 3316 H N N N 4 576 1255 679 17017 F N N N 3 23909 24062 153 5118 H Y Y N 5 50773 51091 318 6419 H N N N 3 49537 50146 609 20320 F Y N N 4 9435 9622 187 47
average 268 76N N N 600 527480 533800 6320 10,5SCHOOL
It made 76 KWh per person

Then we contrasted the summer results with the winter ones…

WINTER SUMMER
Total (KWh) KWh/ person Total (KWh) KWh/ person
160 40 127 32292 97 123 41156 78 142 71194 97 158 79327 109 274 91217 72 170 57330 83 195 49459 115 384 96565 113 390 78263 66 236 59285 71 248 62435 109 273 68537 179 309 103291 73 295 74122 41 98 3352 13 679 170176 59 153 51658 132 318 64686 229 609 203339 85 187 47327 93 268 76
9920 16,5 6320 10,5
In winter the average
was 327 KWhper place
In summer the average
was 268 KWhper place
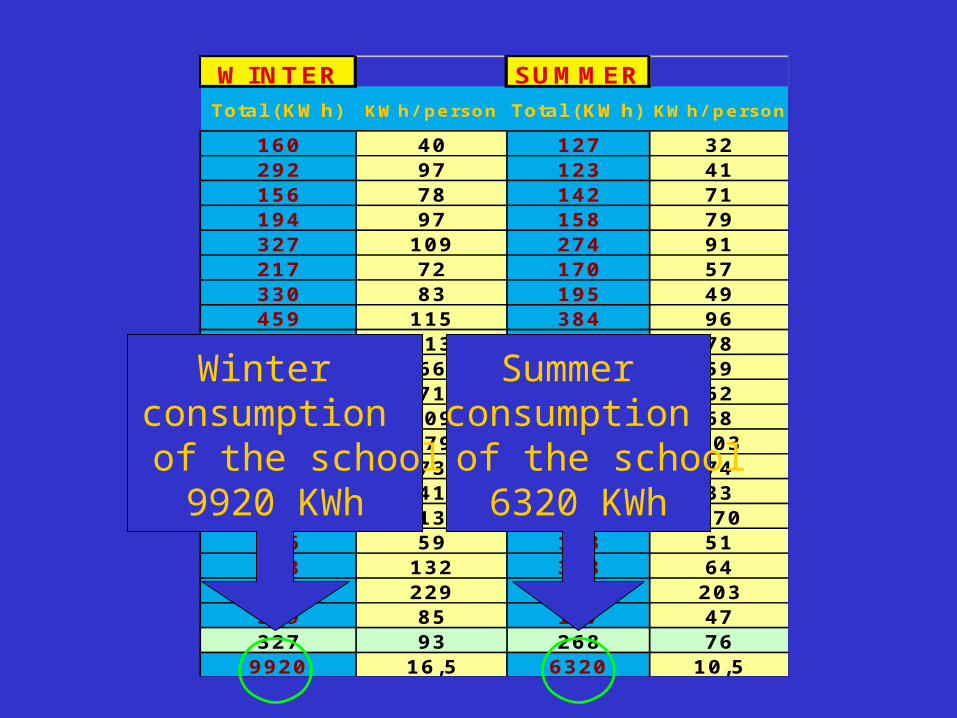
WINTER SUMMER
Total (KWh) KWh/ person Total (KWh) KWh/ person
160 40 127 32292 97 123 41156 78 142 71194 97 158 79327 109 274 91217 72 170 57330 83 195 49459 115 384 96565 113 390 78263 66 236 59285 71 248 62435 109 273 68537 179 309 103291 73 295 74122 41 98 3352 13 679 170176 59 153 51658 132 318 64686 229 609 203339 85 187 47327 93 268 76
9920 16,5 6320 10,5
Winter consumption of the school
9920 KWh
Summer consumption of the school
6320 KWh

Less consumption in summer. Why?
• In summer lights are switched on for shorter time than in winter.
• In summer people go more often out and do not sit at computer so much.
• In summer people cook less. • Some houses use electric heating in winter.• However, air condition is not common in our
country in summer yet.

What to do now
• We have to find ways how to manage energy - it means how to reduce energy consumption.
• It will be the main task of this project year!
• See you in Portugal and in France!
Thank you!

Energy in Our Life
This project has been funded with support from the European Commission, within the frame of the Lifelong Learning Programme. This presentation reflects the views only of the author, and the Commission cannot be held responsible for any use which may be made of the information contained therein.


