34
Energy management
Class# T08: Energy Markets Slide 2 of 53
ELECTRICITY
Energy management
Class# T08: Energy Markets Slide 3 of 53
National electricity generation
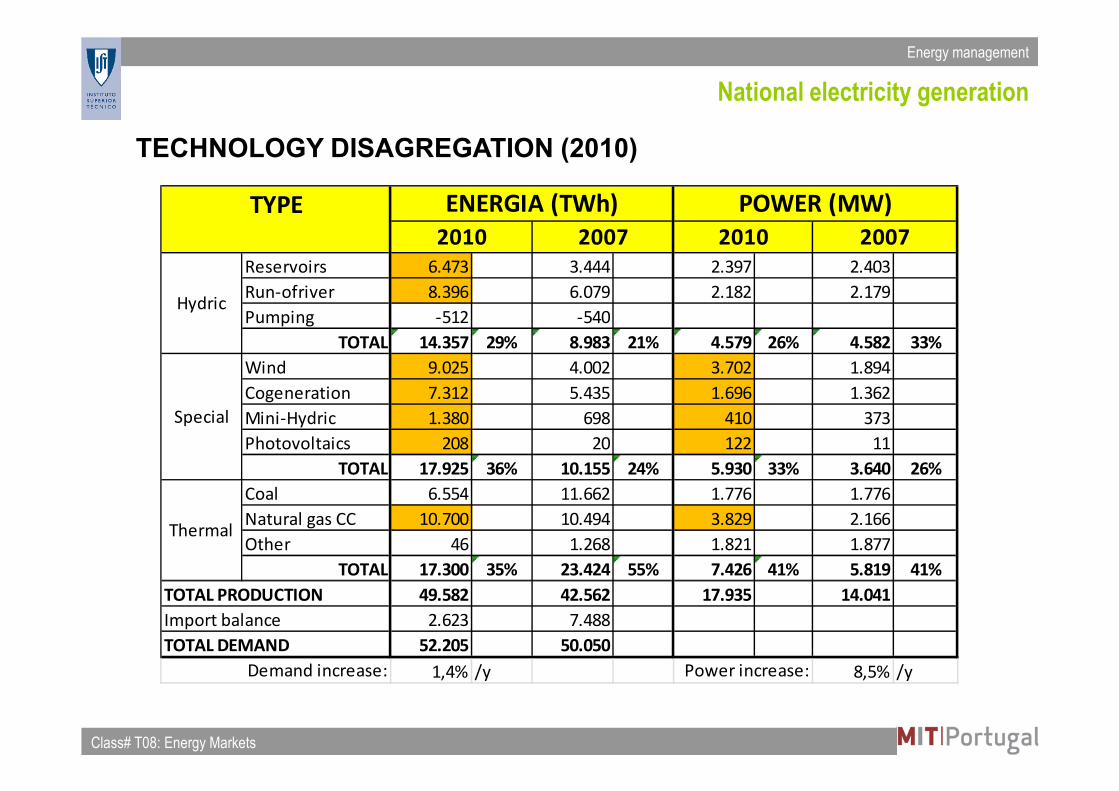
TECHNOLOGY DISAGREGATION (2010)
Reservoirs 6.473 3.444 2.397 2.403
Run-ofriver 8.396 6.079 2.182 2.179
Pumping -512 -540
TOTAL 14.357 29% 8.983 21% 4.579 26% 4.582 33%
Wind 9.025 4.002 3.702 1.894
Cogeneration 7.312 5.435 1.696 1.362
Mini-Hydric 1.380 698 410 373
Photovoltaics 208 20 122 11
TOTAL 17.925 36% 10.155 24% 5.930 33% 3.640 26%
Coal 6.554 11.662 1.776 1.776
Natural gas CC 10.700 10.494 3.829 2.166
Other 46 1.268 1.821 1.877
TOTAL 17.300 35% 23.424 55% 7.426 41% 5.819 41%
TOTAL PRODUCTION 49.582 42.562 17.935 14.041
Import balance 2.623 7.488
TOTAL DEMAND 52.205 50.050
1,4% /y 8,5% /y
2007
TYPE
Demand increase: Power increase:
Hydric
Special
Thermal
2010 2007
ENERGIA (TWh) POWER (MW)
2010
Energy management
Class# T08: Energy Markets Slide 4 of 53
National electricity generation
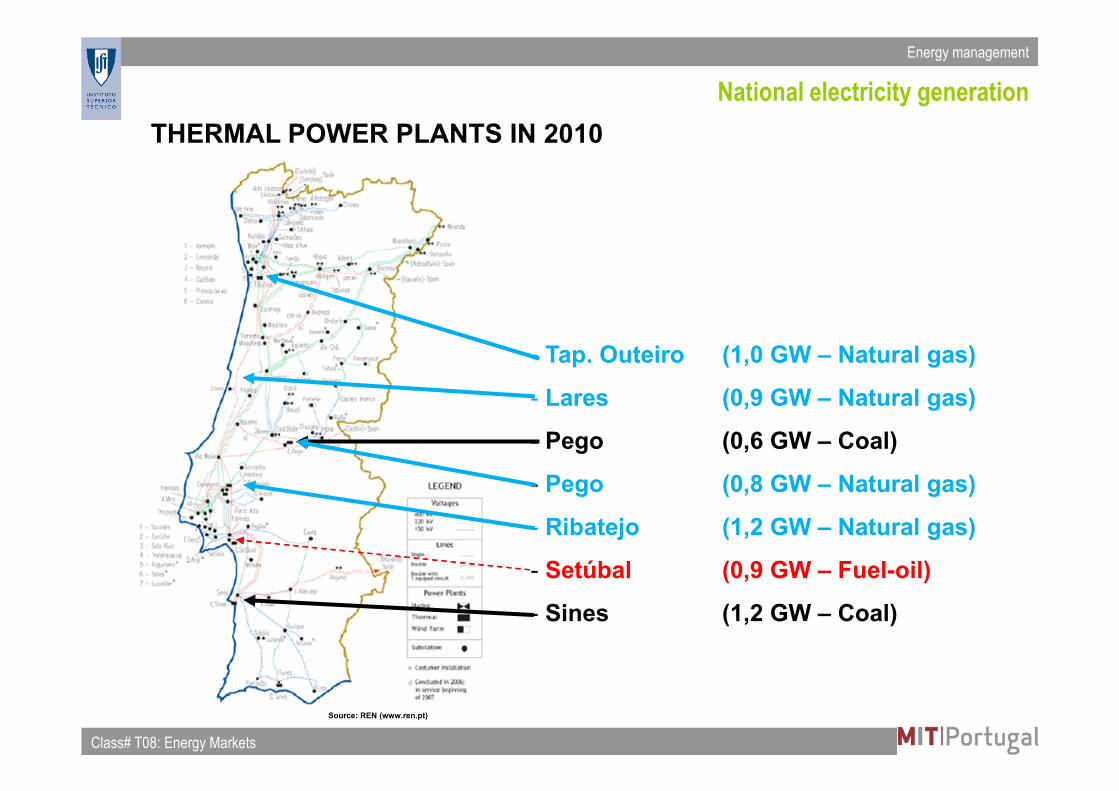
- Tap. Outeiro (1,0 GW – Natural gas)
- Lares (0,9 GW – Natural gas)
- Pego (0,6 GW – Coal)
- Pego (0,8 GW – Natural gas)
- Ribatejo (1,2 GW – Natural gas)
- Setúbal (0,9 GW – Fuel-oil)
- Sines (1,2 GW – Coal)
Source: REN (www.ren.pt)
THERMAL POWER PLANTS IN 2010
Energy management
Class# T08: Energy Markets Slide 5 of 53
National electricity generation
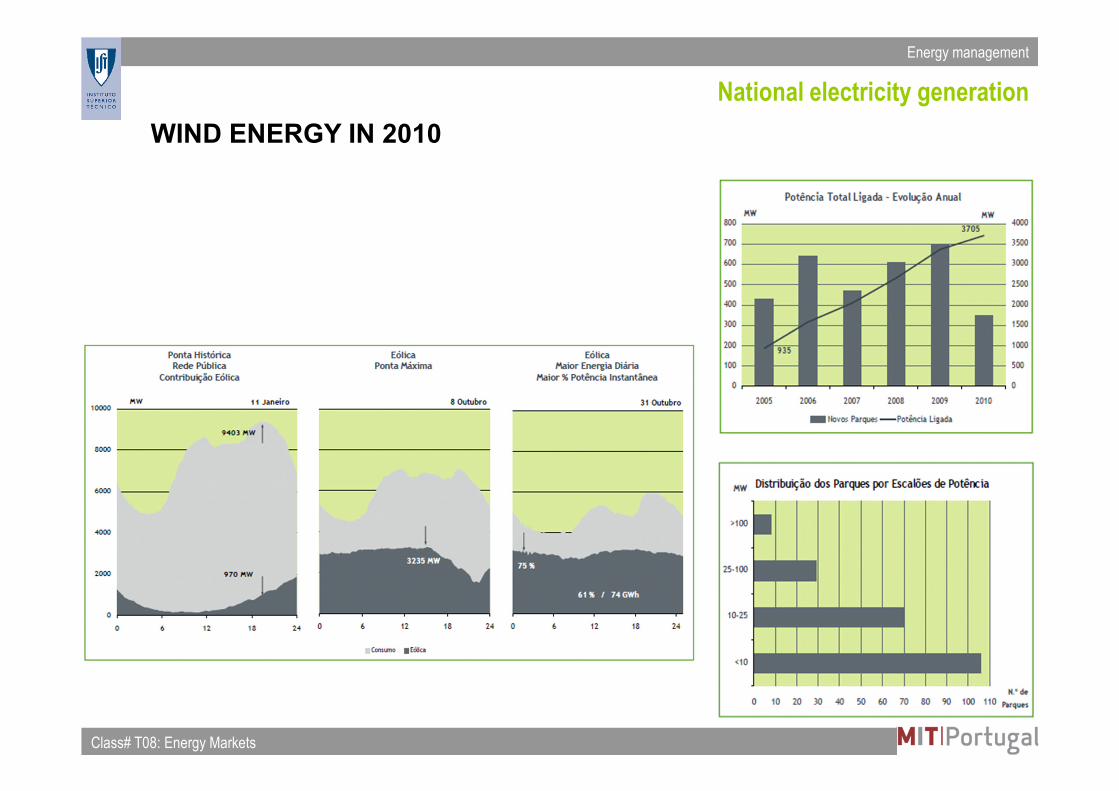
WIND ENERGY IN 2010
Energy management
Class# T08: Energy Markets Slide 6 of 53
National electricity consumption
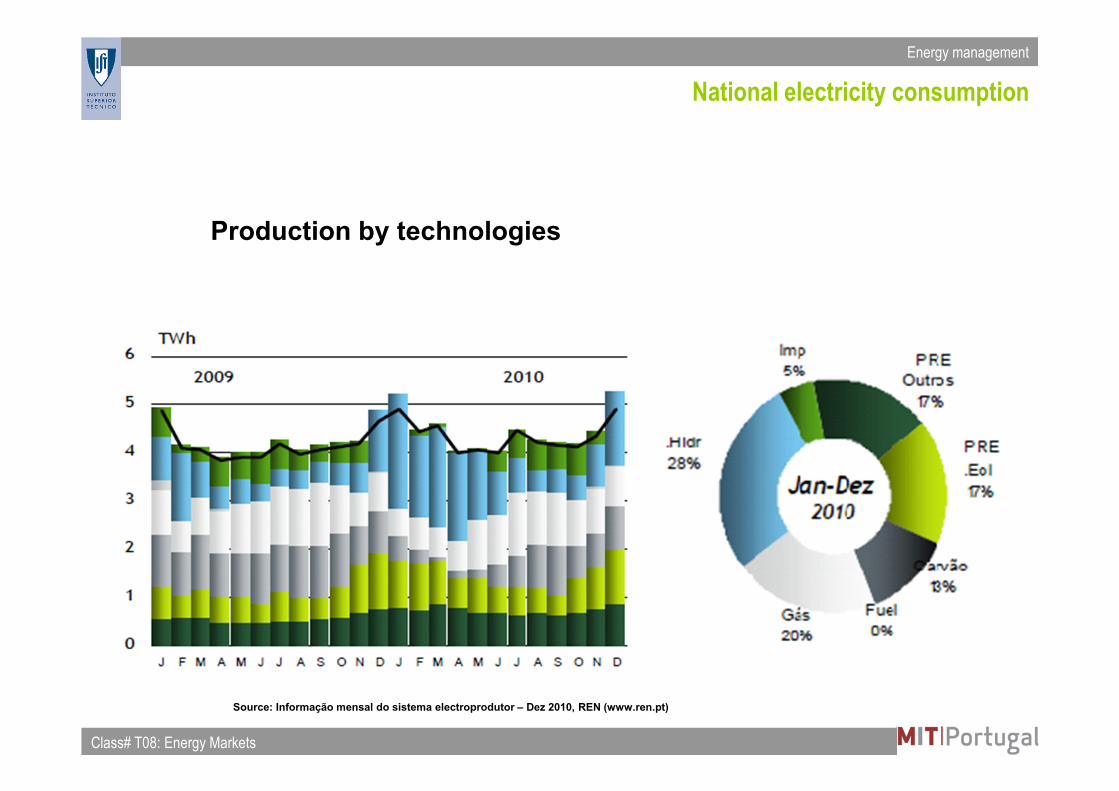
Production by technologies
Source: Informação mensal do sistema electroprodutor – Dez 2010, REN (www.ren.pt)
Energy management
Class# T08: Energy Markets Slide 7 of 53
National electricity consumption
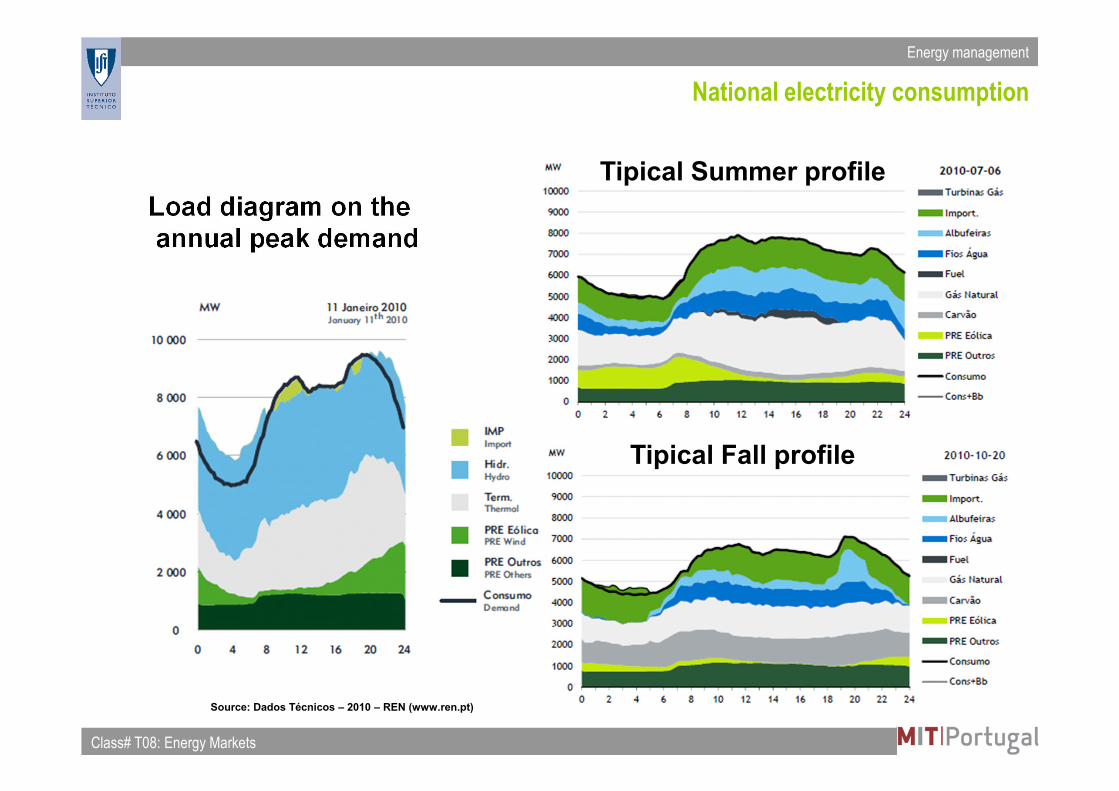
Load diagram on theannual peak demand
Source: Dados Técnicos – 2010 – REN (www.ren.pt)
Tipical Summer profile
Tipical Fall profile
Energy management
Class# T08: Energy Markets Slide 8 of 53
National electricity consumption
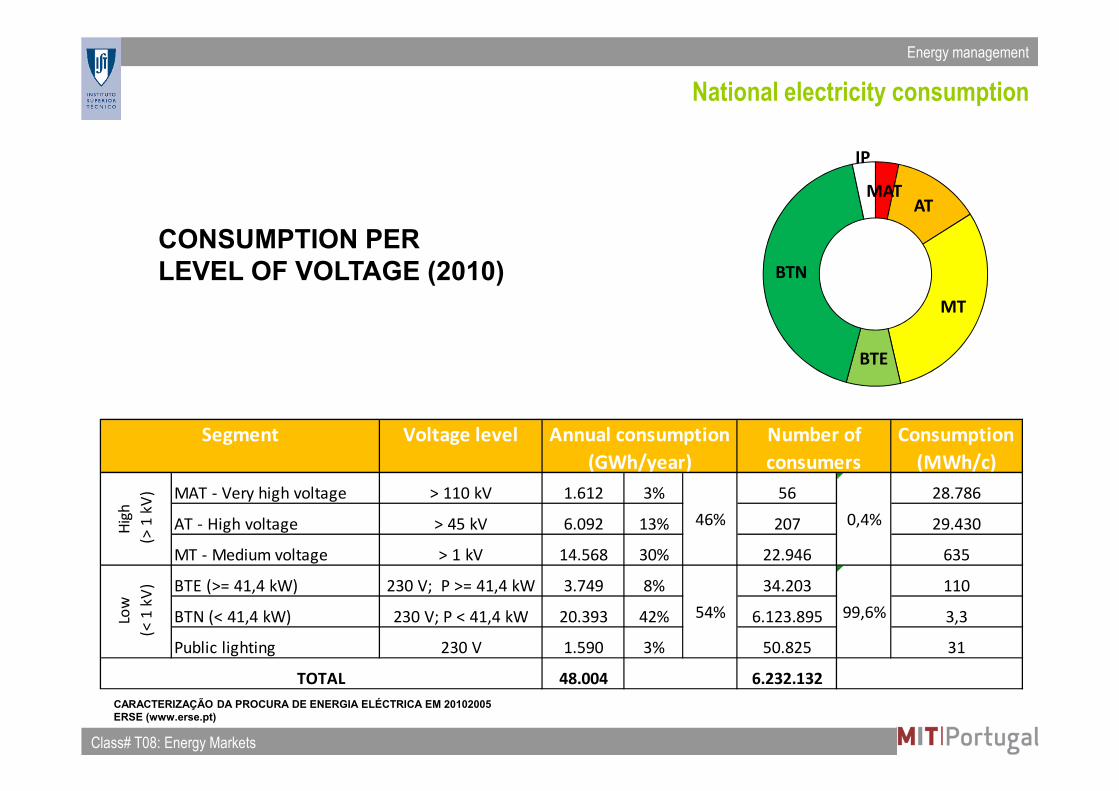
CONSUMPTION PER LEVEL OF VOLTAGE (2010)
CARACTERIZAÇÃO DA PROCURA DE ENERGIA ELÉCTRICA EM 20102005 ERSE (www.erse.pt)
MATAT
MT
BTE
BTN
IP
Voltage level Consumption
(MWh/c)
MAT - Very high voltage > 110 kV 1.612 3% 56 28.786
AT - High voltage > 45 kV 6.092 13% 207 29.430
MT - Medium voltage > 1 kV 14.568 30% 22.946 635
BTE (>= 41,4 kW) 230 V; P >= 41,4 kW 3.749 8% 34.203 110
BTN (< 41,4 kW) 230 V; P < 41,4 kW 20.393 42% 6.123.895 3,3
Public lighting 230 V 1.590 3% 50.825 31
48.004 6.232.132
Hig
h
(> 1
kV
)
Low
(< 1
kV
)
Segment
TOTAL
46%
54%
Annual consumption
(GWh/year)
0,4%
99,6%
Number of
consumers
Energy management
Class# T08: Energy Markets Slide 9 of 53
Electricity market liberalization
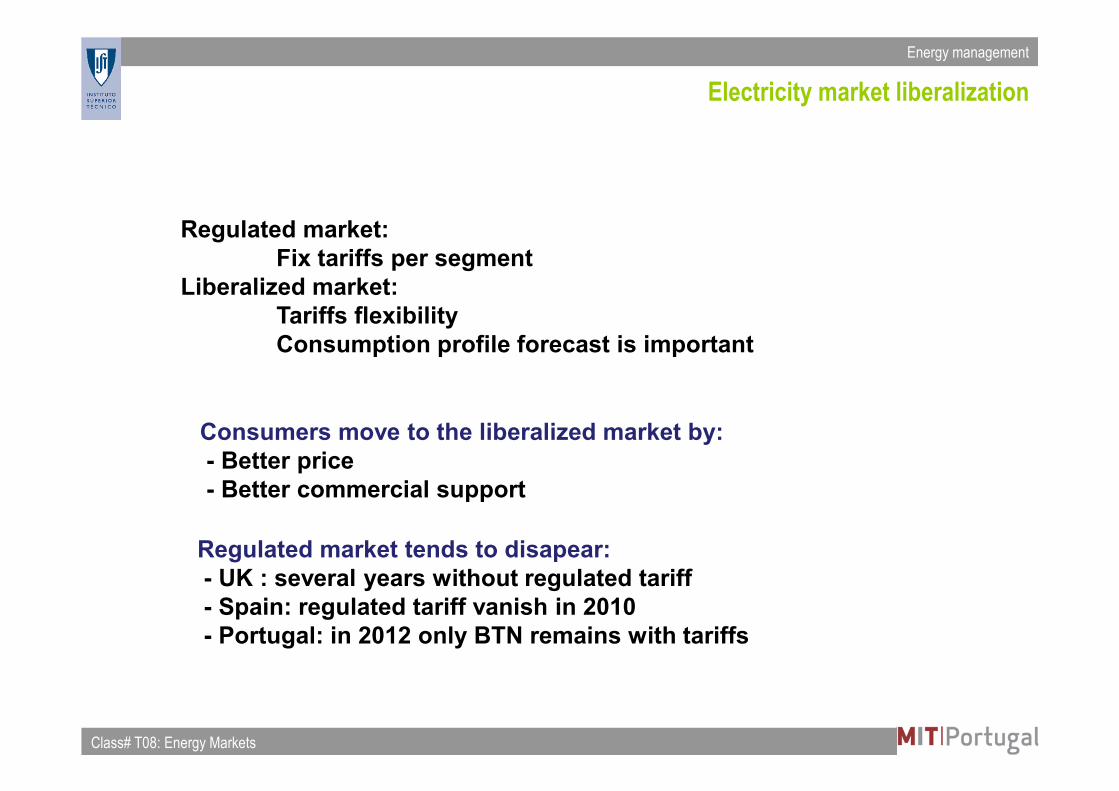
Regulated market:Fix tariffs per segment
Liberalized market:Tariffs flexibilityConsumption profile forecast is important
Consumers move to the liberalized market by:- Better price- Better commercial support
Regulated market tends to disapear:- UK : several years without regulated tariff- Spain: regulated tariff vanish in 2010- Portugal: in 2012 only BTN remains with tariffs
Energy management
Class# T08: Energy Markets Slide 10 of 53
Electricity market liberalization
Electricity cost in the liberalized market
The Supplier contracts electricity to be provided in 2 days, and informs the grid operator (REN) on the amount and hourly profile of the electricity that will be injected in the national grid:
Injected = Forecasted consumption + Grid losses
After the consumption, REN, calculated the effective consumption of the Supplier clients and charge by the deviation.
Deviation = Consumption + Grid losses – Injection
Additionally, the Supplier must pay for the use of the grid.
The price components are:
Cost = Production + Grid losses + Grid use
Energy management
Class# T08: Energy Markets Slide 11 of 53
Electricity market liberalization
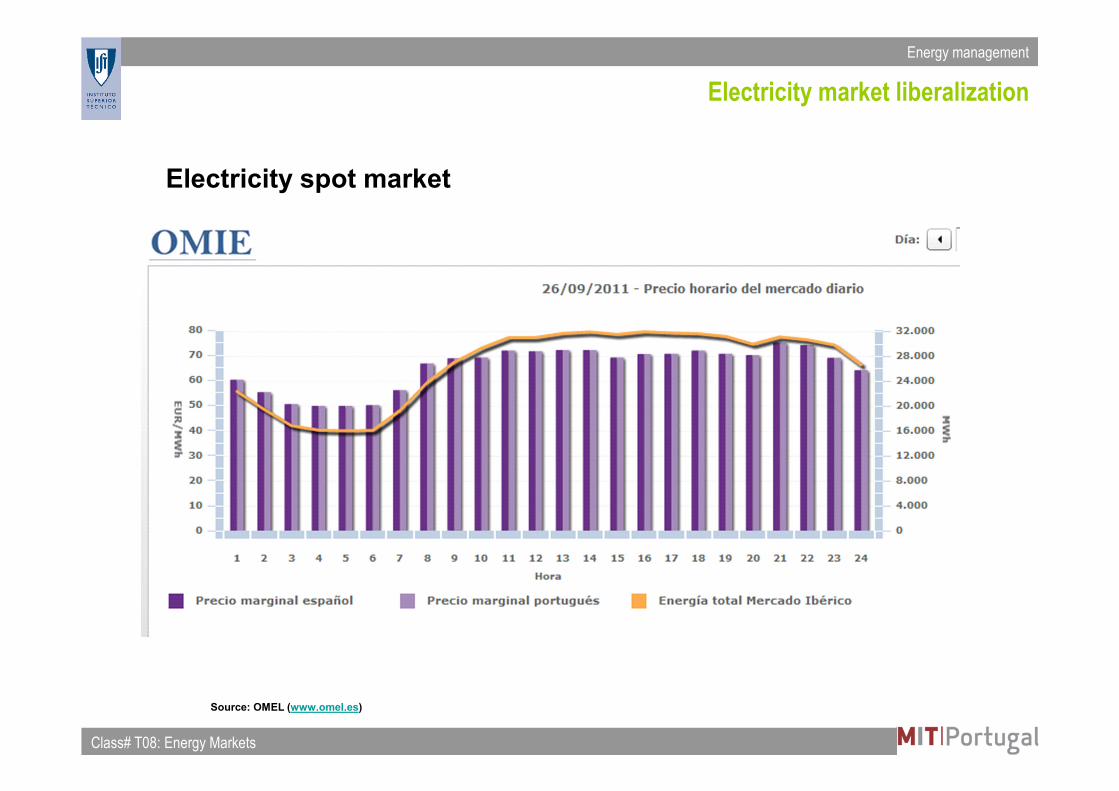
Electricity spot market
Source: OMEL (www.omel.es)
Energy management
Class# T08: Energy Markets Slide 12 of 53
Electricity market liberalization
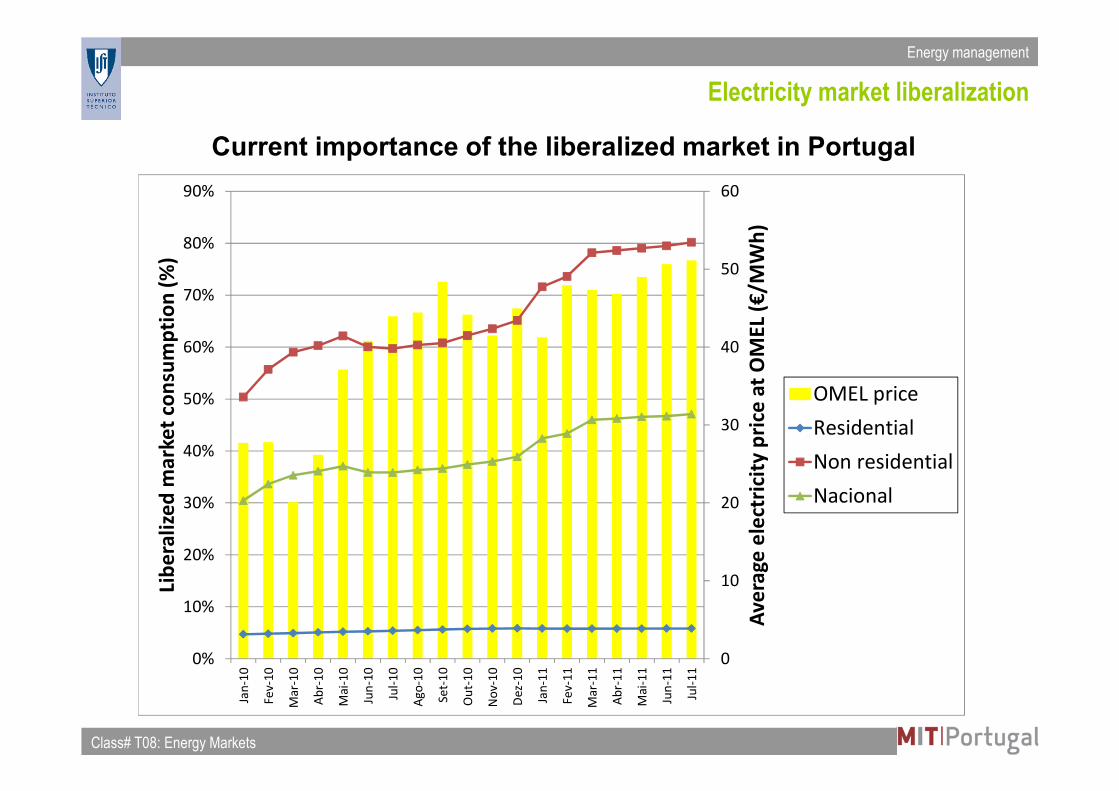
Current importance of the liberalized market in Portugal
Fonte: Resumo informativo Mercado Liberalizado em Dez/08 – ERSE (www.erse.pt)
0
10
20
30
40
50
60
0%
10%
20%
30%
40%
50%
60%
70%
80%
90%
Jan
-10
Fe
v-1
0
Ma
r-1
0
Ab
r-1
0
Ma
i-1
0
Jun
-10
Jul-
10
Ag
o-1
0
Se
t-1
0
Ou
t-1
0
No
v-1
0
De
z-1
0
Jan
-11
Fe
v-1
1
Ma
r-1
1
Ab
r-1
1
Ma
i-1
1
Jun
-11
Jul-
11
Av
era
ge
ele
ctri
city
pri
ce a
t O
ME
L (€
/MW
h)
Lib
era
lize
d m
ark
et
con
sum
pti
on
(%
)
OMEL price
Residential
Non residential
Nacional
Energy management
Class# T08: Energy Markets Slide 13 of 53
Regulated tariffs
Low voltage tariff structure
The bill has 2 components:
• Energy: The price depends on the Tariff type and Metering cycle
• Contrated power: Fix amount that depends of physical maximum power installed and Metering type
Contract options :
• Contracted power (in kVA)
• Tariff type: Simples, Bi-horária e Tri-horária
• Metring cycle (only for Bi-horária and Tri-horária): Daily cycle and weekly cycle
Energy management
Class# T08: Energy Markets Slide 14 of 53
Regulated tariffs
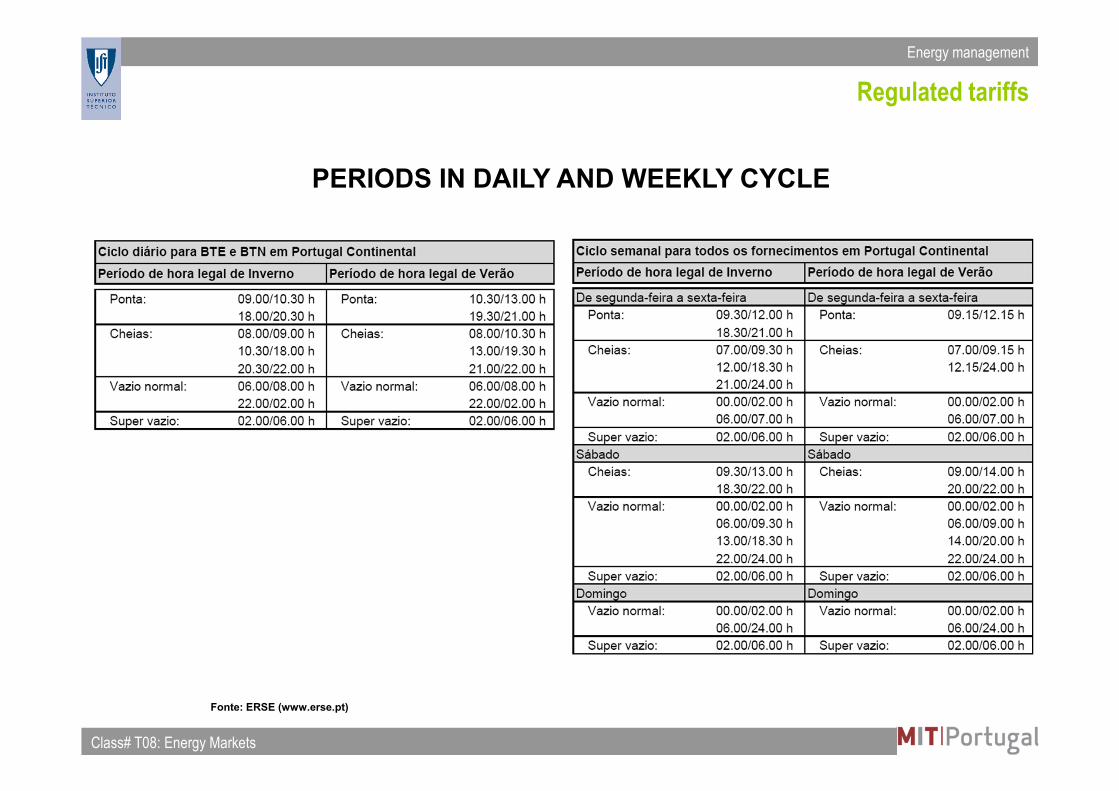
Fonte: ERSE (www.erse.pt)
PERIODS IN DAILY AND WEEKLY CYCLE
Energy management
Class# T08: Energy Markets Slide 15 of 53
Regulated tariffs
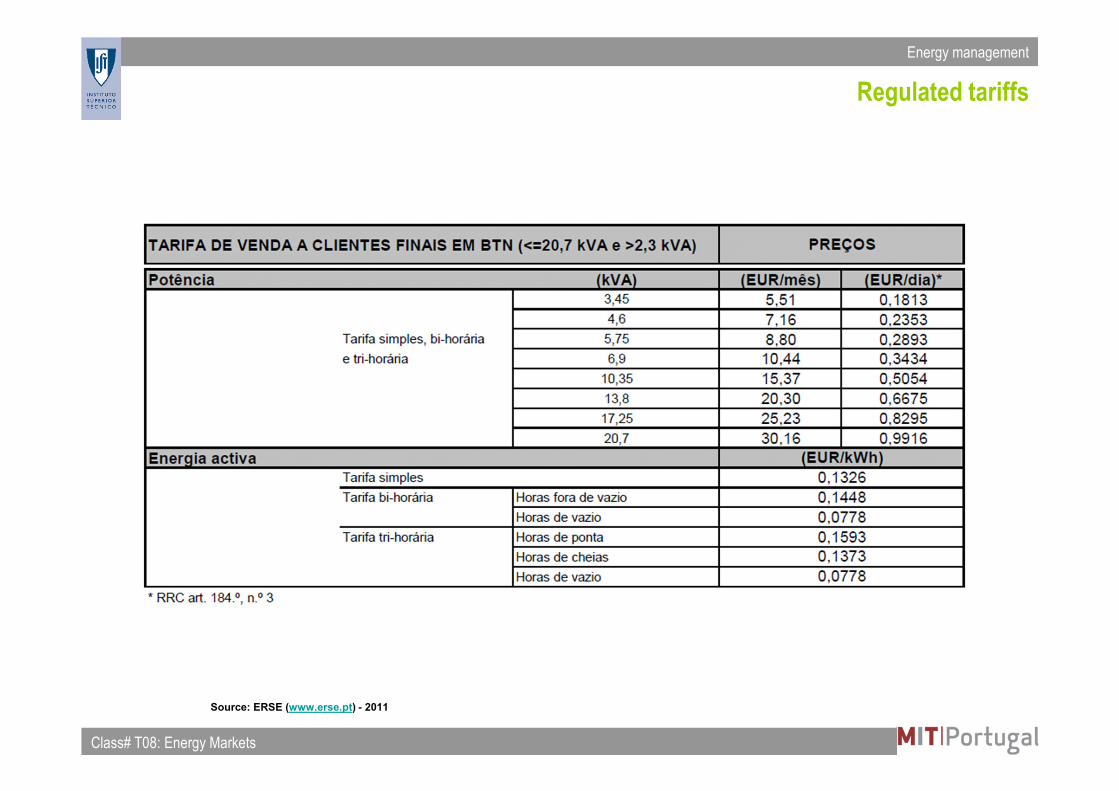
Source: ERSE (www.erse.pt) - 2011
Energy management
Class# T08: Energy Markets Slide 16 of 53
Regulated tariffs
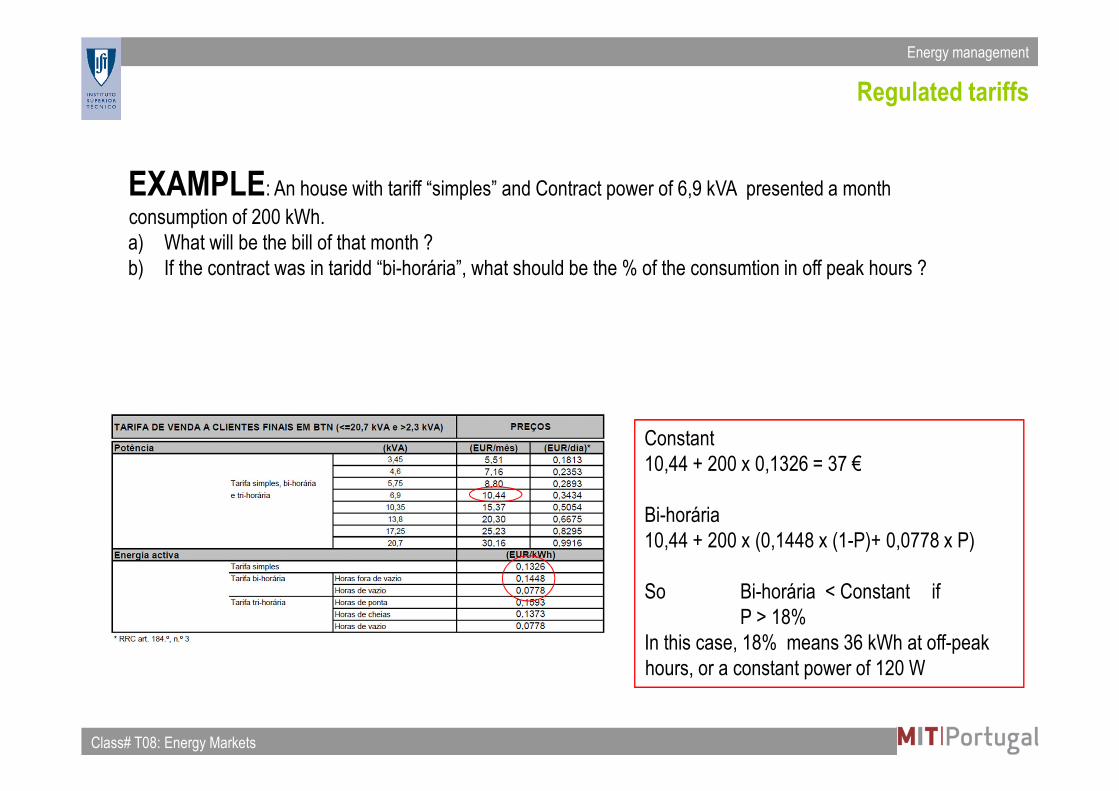
EXAMPLE: An house with tariff “simples” and Contract power of 6,9 kVA presented a month
consumption of 200 kWh.
a) What will be the bill of that month ?
b) If the contract was in taridd “bi-horária”, what should be the % of the consumtion in off peak hours ?
Constant
10,44 + 200 x 0,1326 = 37 €
Bi-horária
10,44 + 200 x (0,1448 x (1-P)+ 0,0778 x P)
So Bi-horária < Constant if
P > 18%
In this case, 18% means 36 kWh at off-peak
hours, or a constant power of 120 W
Energy management
Class# T08: Energy Markets Slide 17 of 53
Tarifas reguladas
Structure of the regulated tariff for medium, high and very high voltage.
The bill has three components:
• Fixed term: often negligible
• Energy: The unit price depends on the Price Option and Cycle Counting
• Power::
• Contracted power: is the biggest Maximum Power of the last 12 months, where the Maximum
Power is the maximum power in periods of 15 minutes, in the all month.
• Power at peak hours: Peak hours consumption / Monthly peak hours considered by ERSE
Price Options: Curta, Média ou Longa utilização
Cycle counting: Daily cycle, week cycle and week cycle optional
Note 1: The prices vary each trimester
Nota 2: The counting has 5 periods: ponta, cheia, vazio normal e super vazio
Energy management
Class# T08: Energy Markets Slide 18 of 53
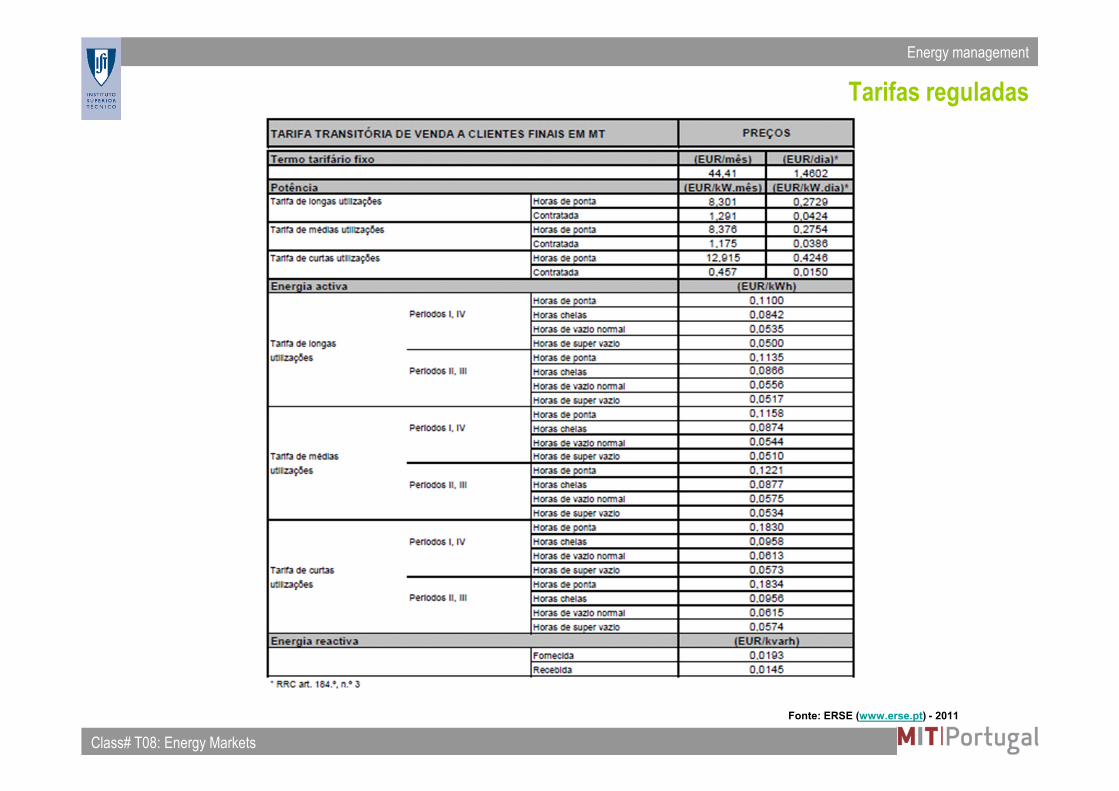
Tarifas reguladas
Fonte: ERSE (www.erse.pt) - 2011
Energy management
Class# T08: Energy Markets Slide 19 of 53
Regulated Tariffs
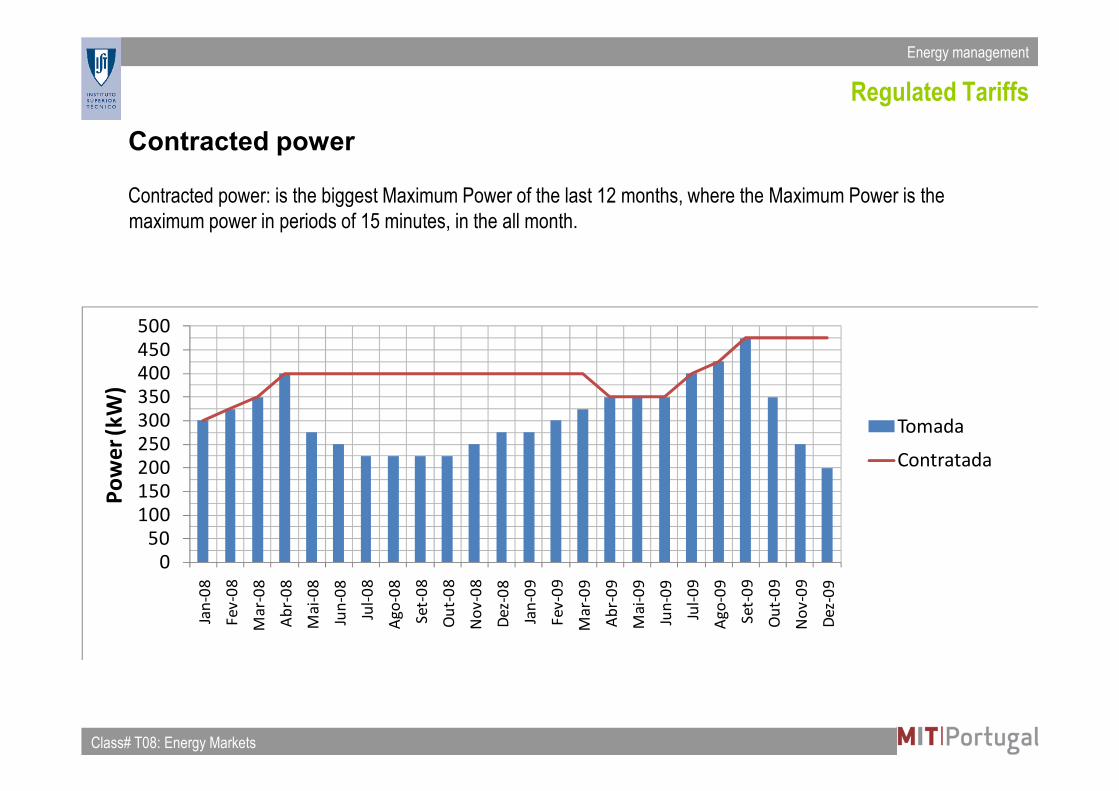
Contracted power
Contracted power: is the biggest Maximum Power of the last 12 months, where the Maximum Power is the
maximum power in periods of 15 minutes, in the all month.
0
50
100
150
200
250
300
350
400
450
500
Jan
-08
Fe
v-0
8
Ma
r-0
8
Ab
r-0
8
Ma
i-0
8
Jun
-08
Jul-
08
Ag
o-0
8
Se
t-0
8
Ou
t-0
8
No
v-0
8
De
z-0
8
Jan
-09
Fe
v-0
9
Ma
r-0
9
Ab
r-0
9
Ma
i-0
9
Jun
-09
Jul-
09
Ag
o-0
9
Se
t-0
9
Ou
t-0
9
No
v-0
9
De
z-0
9
Po
we
r (k
W)
Tomada
Contratada
Energy management
Class# T08: Energy Markets Slide 20 of 53
FUELS
Energy management
Class# T08: Energy Markets Slide 21 of 53
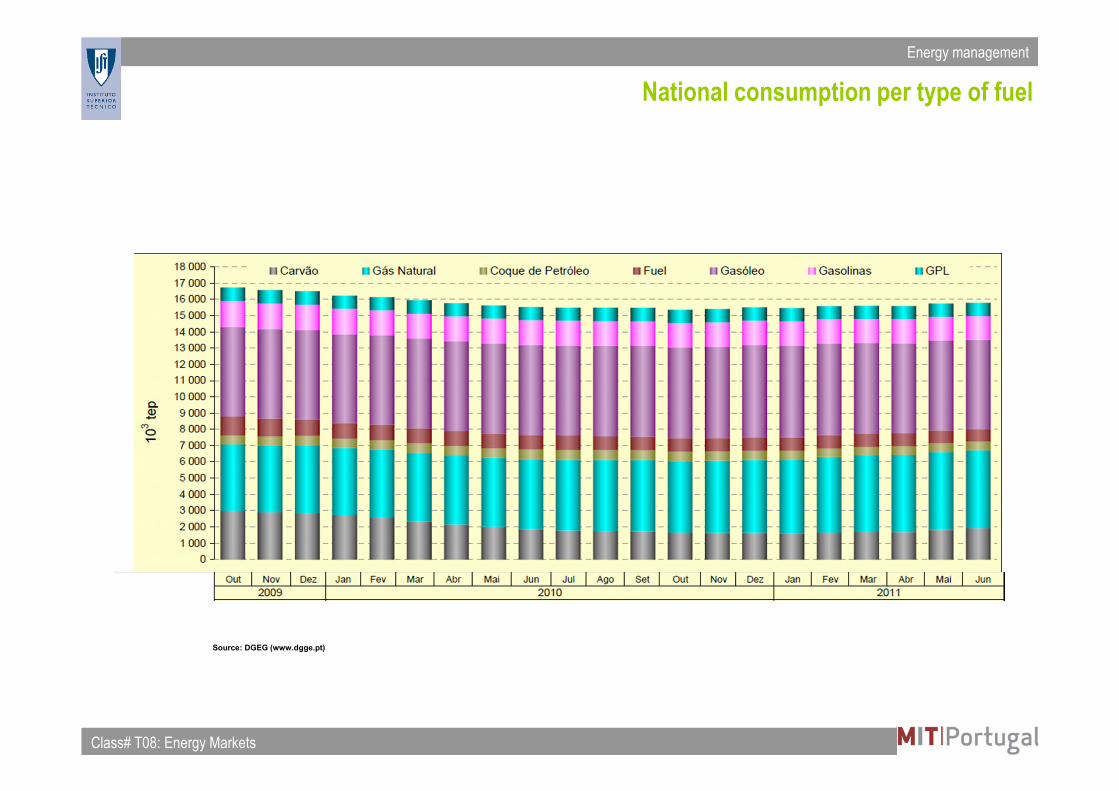
National consumption per type of fuel
Source: DGEG (www.dgge.pt)
Energy management
Class# T08: Energy Markets Slide 22 of 53
Portuguese natural gas market
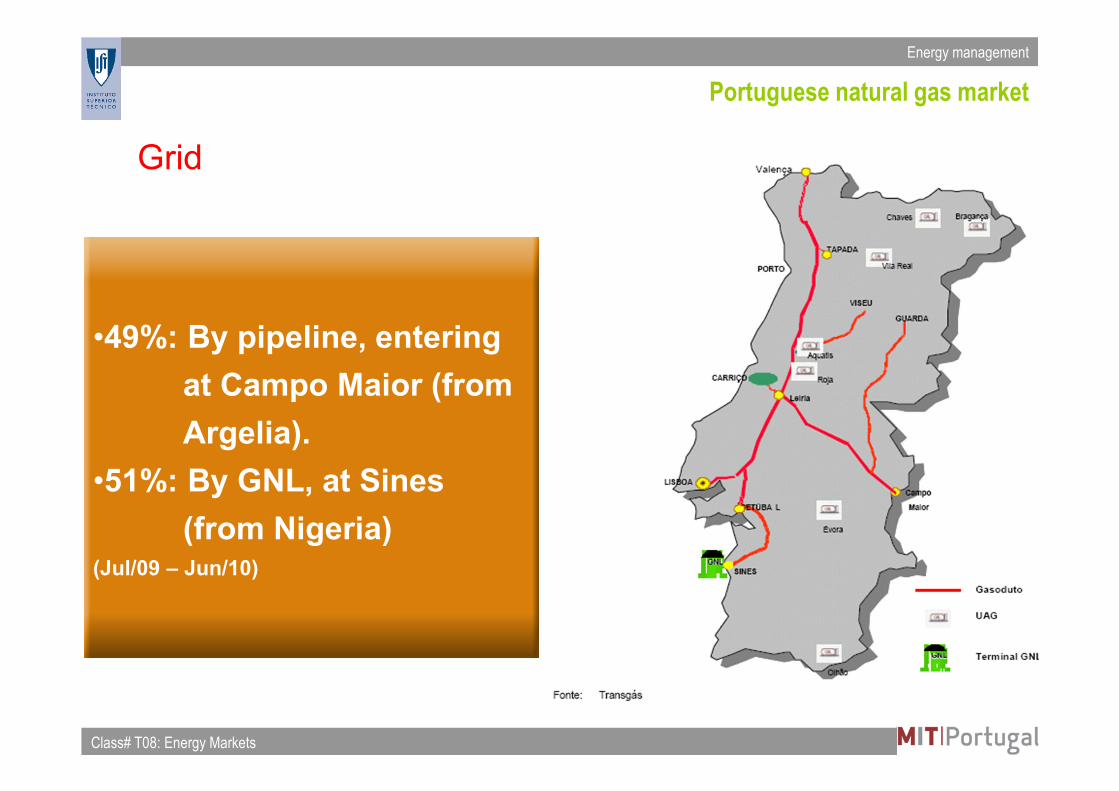
Grid
•49%: By pipeline, entering
at Campo Maior (from
Argelia).
•51%: By GNL, at Sines
(from Nigeria)(Jul/09 – Jun/10)
Energy management
Class# T08: Energy Markets Slide 23 of 53
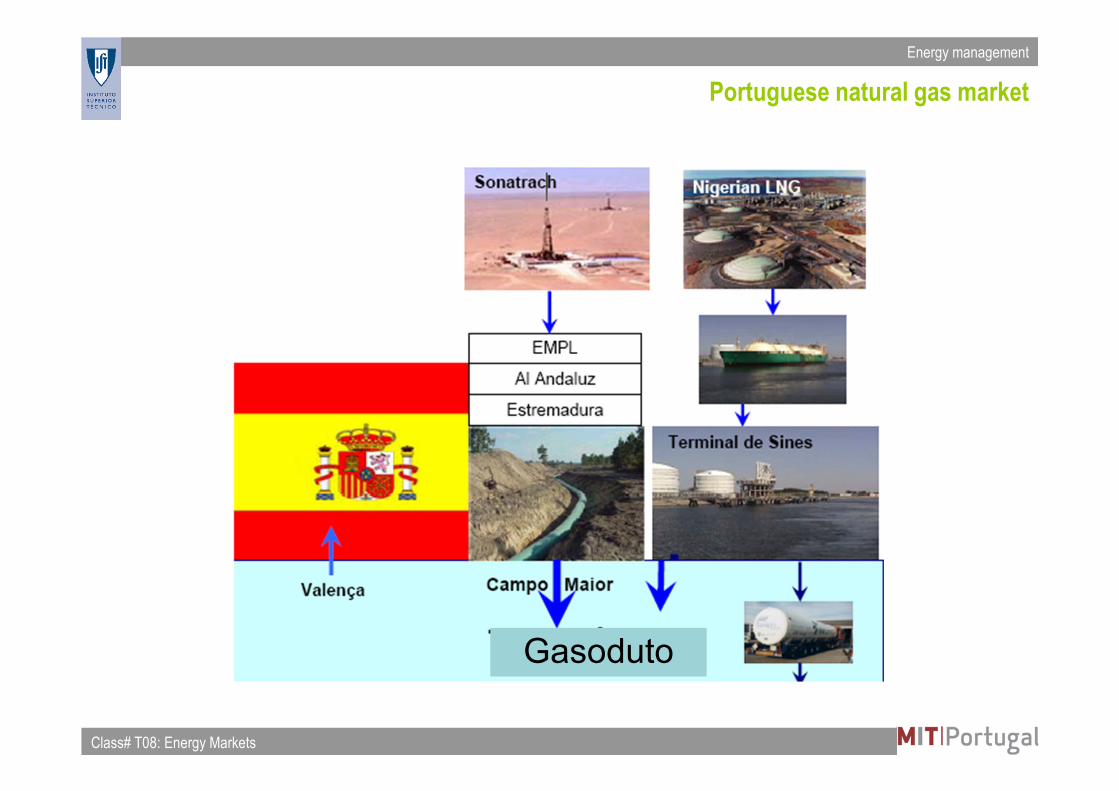
Gasoduto
Portuguese natural gas market
Energy management
Class# T08: Energy Markets Slide 24 of 53
Portuguese natural gas market
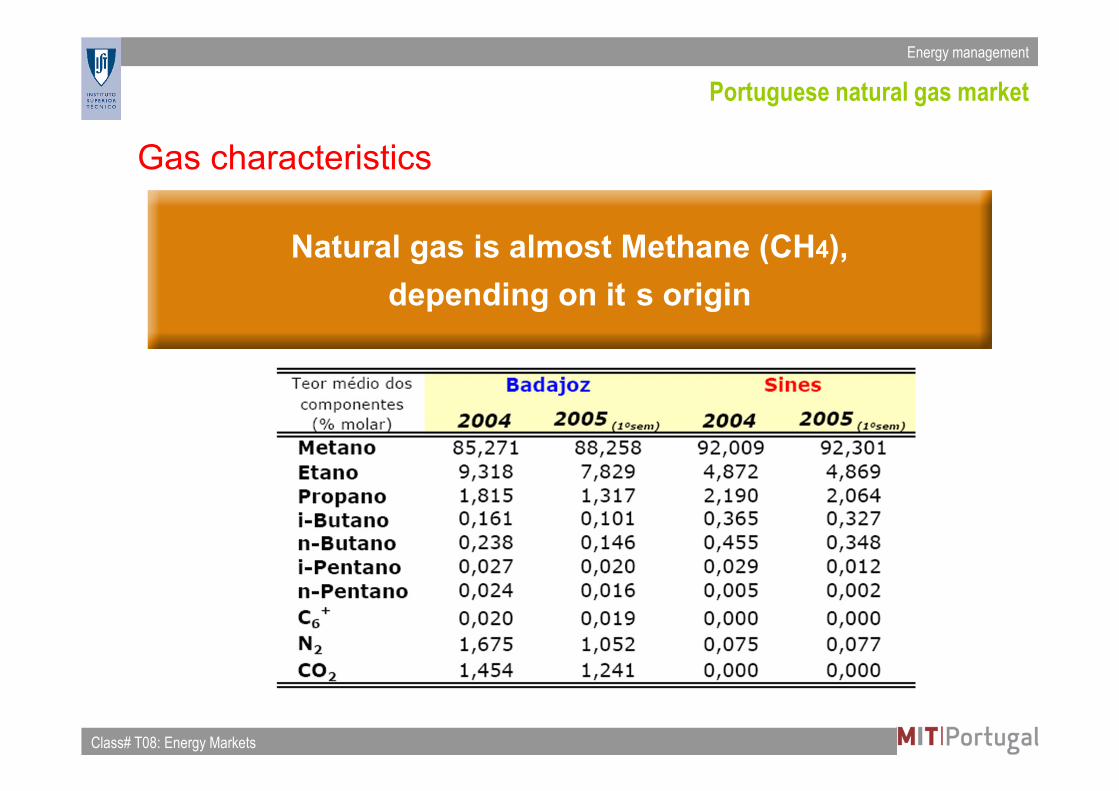
Gas characteristics
Natural gas is almost Methane (CH4),
depending on it s origin
Energy management
Class# T08: Energy Markets Slide 25 of 53
Portuguese natural gas market
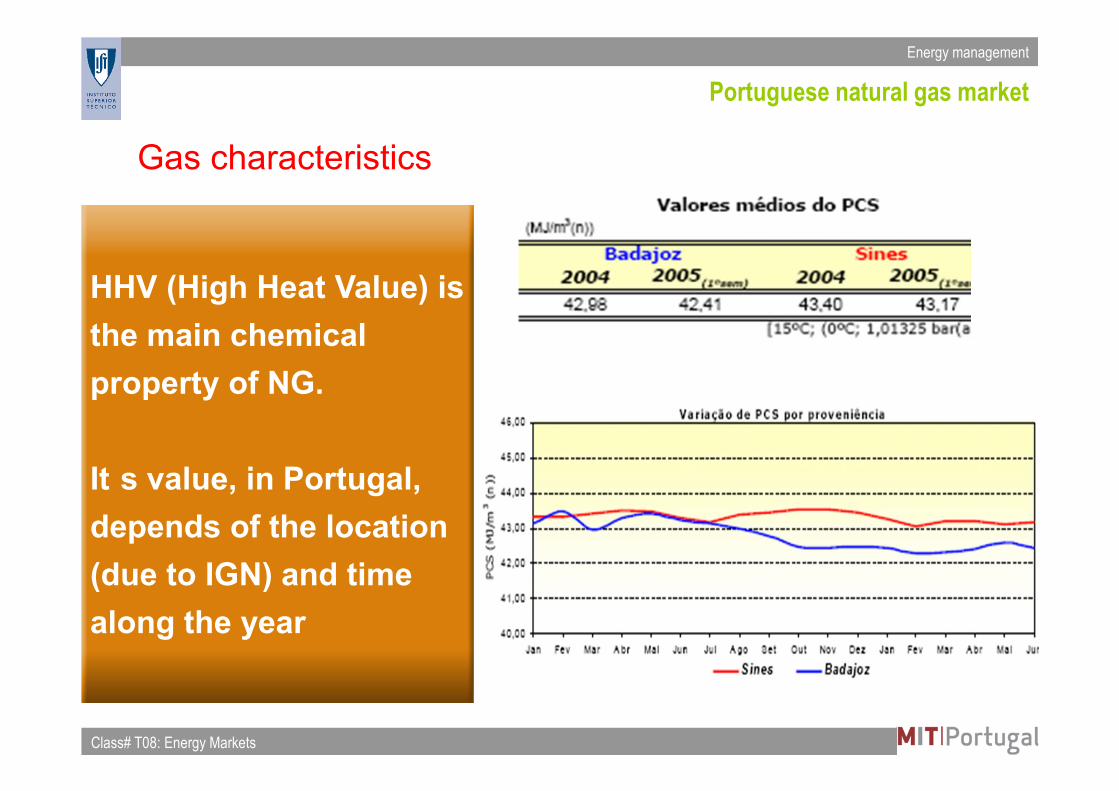
Gas characteristics
HHV (High Heat Value) is
the main chemical
property of NG.
It s value, in Portugal,
depends of the location
(due to IGN) and time
along the year
Energy management
Class# T08: Energy Markets Slide 26 of 53
Portuguese natural gas market
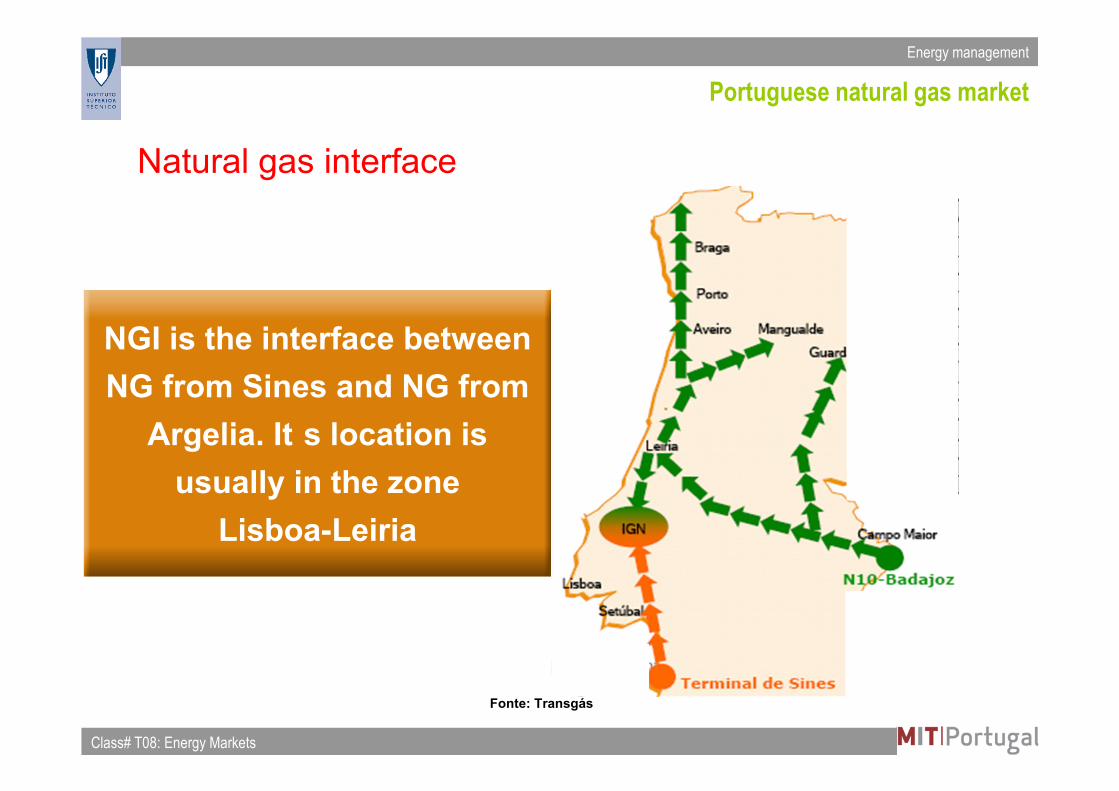
Natural gas interface
NGI is the interface between
NG from Sines and NG from
Argelia. It s location is
usually in the zone
Lisboa-Leiria
Fonte: Transgás
Energy management
Class# T08: Energy Markets Slide 27 of 53
Portuguese natural gas market
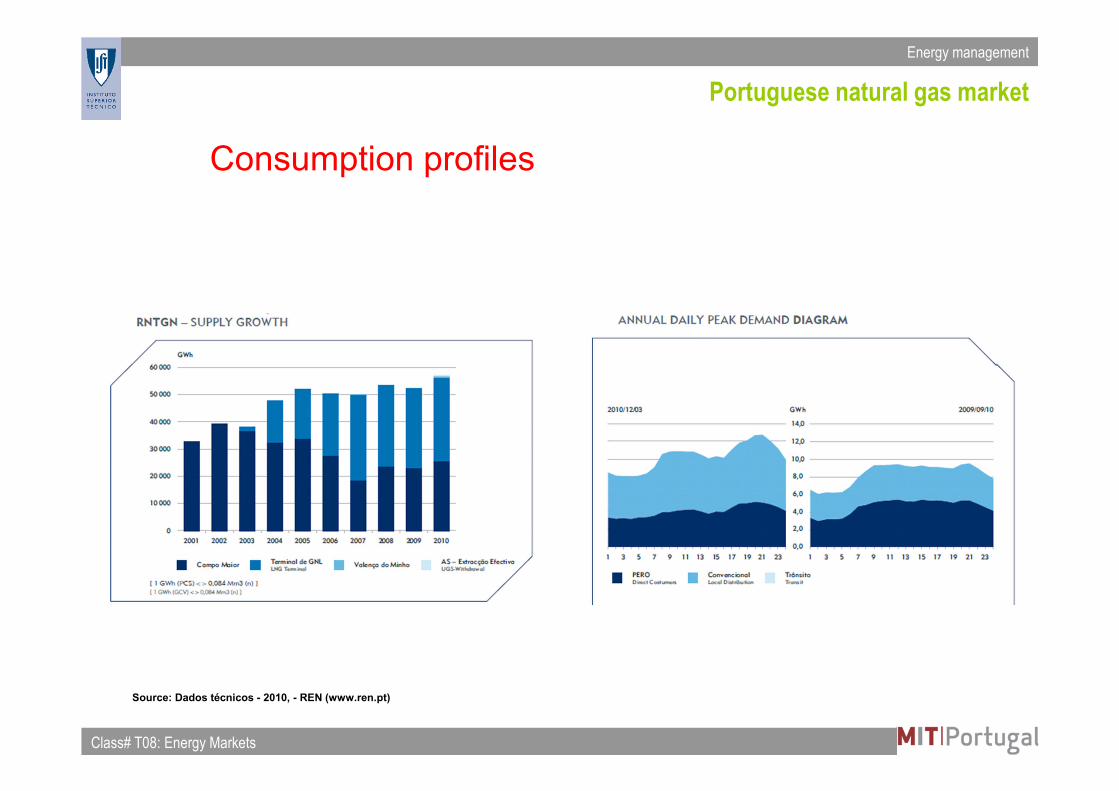
Consumption profiles
Source: Dados técnicos - 2010, - REN (www.ren.pt)
Energy management
Class# T08: Energy Markets Slide 28 of 53
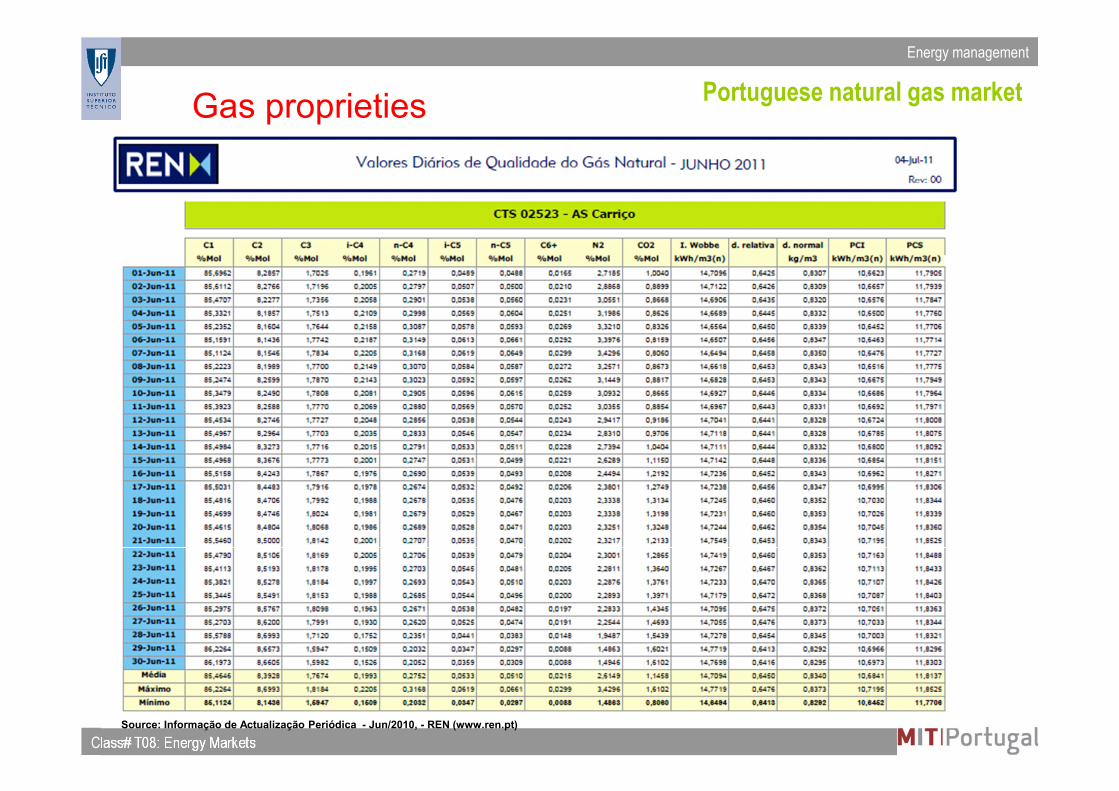
Portuguese natural gas marketGas proprieties
Source: Informação de Actualização Periódica - Jun/2010, - REN (www.ren.pt)
Energy management
Class# T08: Energy Markets Slide 29 of 53
Portuguese natural gas market
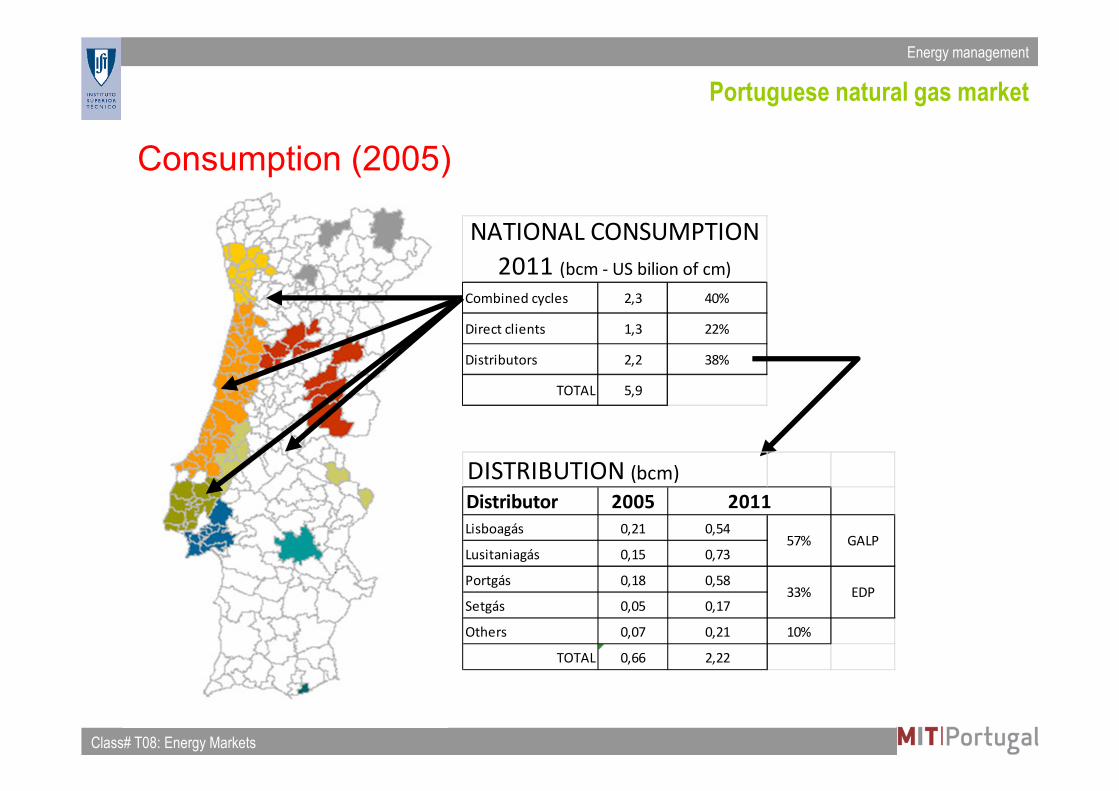
Consumption (2005)
Combined cycles 2,3 40%
Direct clients 1,3 22%
Distributors 2,2 38%
TOTAL 5,9
NATIONAL CONSUMPTION
2011 (bcm - US bilion of cm)
DISTRIBUTION (bcm)
Distributor 2005
Lisboagás 0,21 0,54
Lusitaniagás 0,15 0,73
Portgás 0,18 0,58
Setgás 0,05 0,17
Others 0,07 0,21 10%
TOTAL 0,66 2,22
57%
33%
GALP
EDP
2011
Energy management
Class# T08: Energy Markets Slide 30 of 53
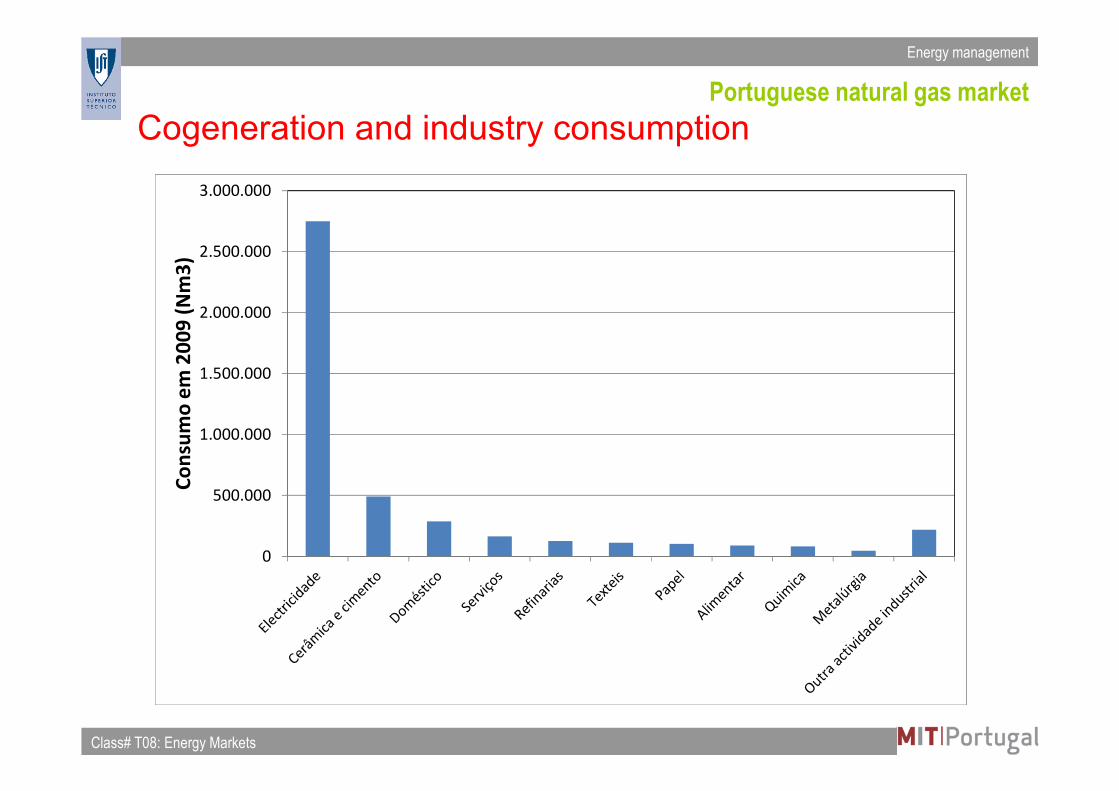
Portuguese natural gas market
Cogeneration and industry consumption
0
500.000
1.000.000
1.500.000
2.000.000
2.500.000
3.000.000C
on
sum
o e
m 2
00
9 (
Nm
3)
Energy management
Class# T08: Energy Markets Slide 31 of 53
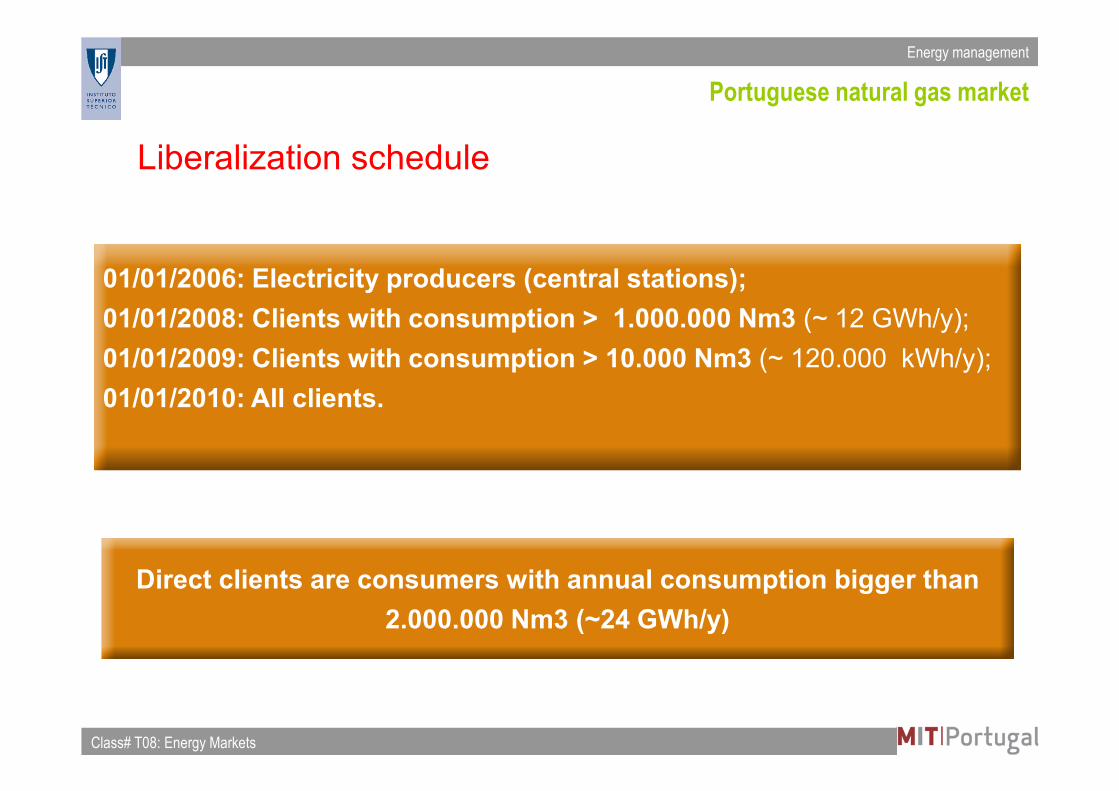
Portuguese natural gas market
Liberalization schedule
01/01/2006: Electricity producers (central stations);
01/01/2008: Clients with consumption > 1.000.000 Nm3 (~ 12 GWh/y);
01/01/2009: Clients with consumption > 10.000 Nm3 (~ 120.000 kWh/y);
01/01/2010: All clients.
Direct clients are consumers with annual consumption bigger than
2.000.000 Nm3 (~24 GWh/y)
Energy management
Class# T08: Energy Markets Slide 32 of 53
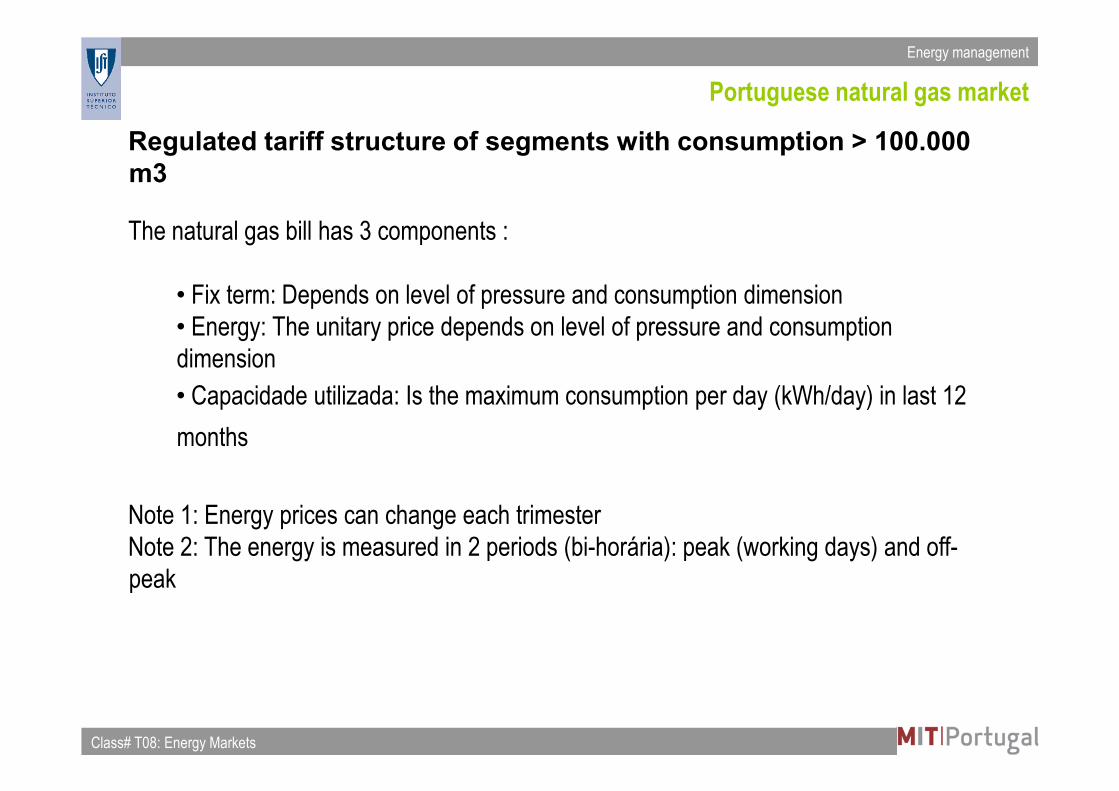
Portuguese natural gas market
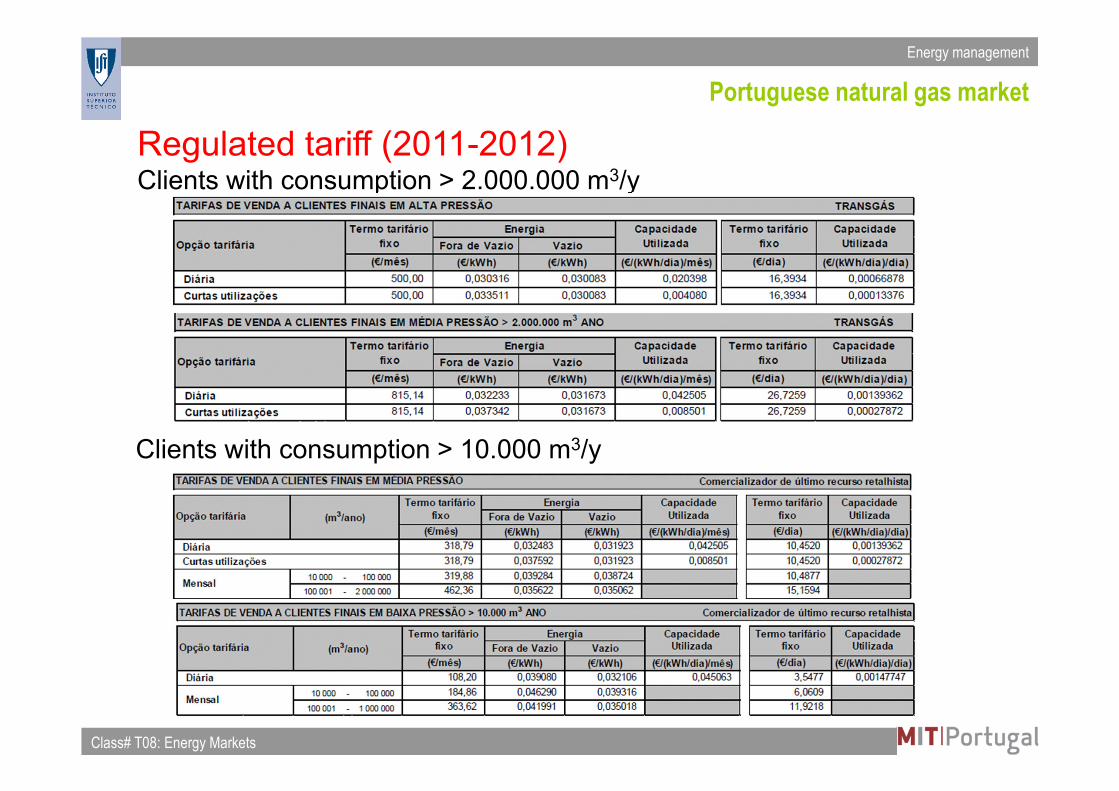
Regulated tariff structure of segments with consumption > 100.000 m3
The natural gas bill has 3 components :
• Fix term: Depends on level of pressure and consumption dimension
• Energy: The unitary price depends on level of pressure and consumption
dimension
• Capacidade utilizada: Is the maximum consumption per day (kWh/day) in last 12
months
Note 1: Energy prices can change each trimester
Note 2: The energy is measured in 2 periods (bi-horária): peak (working days) and off-
peak
Energy management
Class# T08: Energy Markets Slide 33 of 53
Portuguese natural gas market
Regulated tariff (2011-2012)Clients with consumption > 2.000.000 m3/y
Clients with consumption > 10.000 m3/y
Energy management
Class# T08: Energy Markets Slide 34 of 53
Portuguese natural gas market
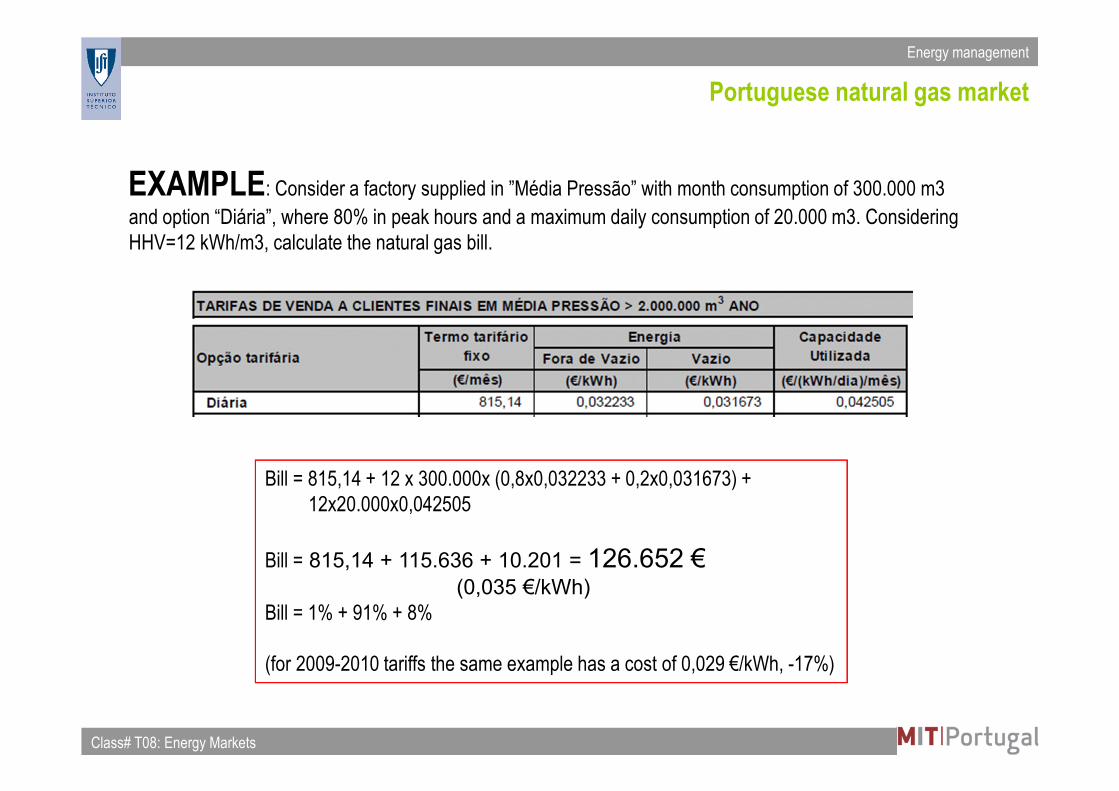
EXAMPLE: Consider a factory supplied in ”Média Pressão” with month consumption of 300.000 m3
and option “Diária”, where 80% in peak hours and a maximum daily consumption of 20.000 m3. Considering
HHV=12 kWh/m3, calculate the natural gas bill.
Bill = 815,14 + 12 x 300.000x (0,8x0,032233 + 0,2x0,031673) +
12x20.000x0,042505
Bill = 815,14 + 115.636 + 10.201 = 126.652 €(0,035 €/kWh)
Bill = 1% + 91% + 8%
(for 2009-2010 tariffs the same example has a cost of 0,029 €/kWh, -17%)