Page 1
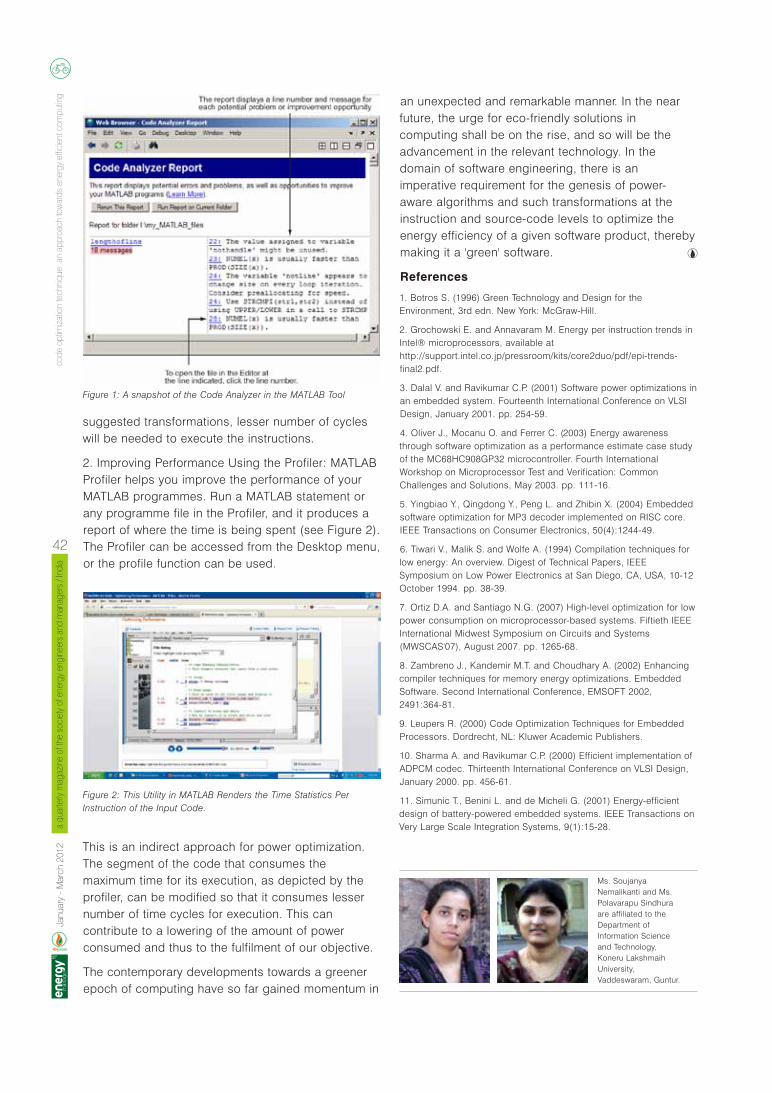
ISSN 0974 - 0996January - March | 2012 | Vol :: 05 | No :: 1
metering,monitoring andtargeting: The Gateway to
Efficient Energy Management
Utilizing your metered dataM&M – technologies that enable energy efficiency Energy meters and their reliabilityEnergy efficient computingWind power developments in Oceania
Page 3
gu
est
edit
ori
al
Registered Office :Energy Press | SEEM Bhavan | KRA-A79Kannammoola | Thiruvananthapuram | Kerala | IndiaTel : +91 - 471 - 2557607 | 3242323E : [email protected] : www.energyprofessional.in
dvances in energy metering and data collection technology have Aleft many energy users here in the UK with a problem: data flooding. The same is either happening already or will soon happen in many other countries including India, and the irony is that even if the flood of data were tamed, it would not necessarily provide information that is of real value for day-to-day management of energy. You might be able to see how much energy is being used, where, when, and for what; but you will not know whether the amount of energy you used was excessive or not. This is critical information because even in the best-run enterprise, things occasionally go wrong or are done incorrectly. From time controls being overridden to heat exchangers becoming fouled, from non-return valves failing to photocells being obscured, from air recirculation dampers sticking closed to employees stealing oil, your organisation is vulnerable to random energy waste which would be avoidable if somebody realised it had
ηoccurred. Inside this issue of energy manager magazine features a wealth of advice on how to measure consumption and collect the data. It would be a good idea to step back for a moment and consider how you can filter that data and turn it into information that actively supports your energy-saving efforts.
Now you will often hear the saying "you cannot manage what you do not measure" or words to that effect. Nobody knows who first said it or what they really said (which is why there are so many versions) but it does not matter, because in energy management that saying simply fails to tell the whole story. To manage energy you need two things: not just a measurement of actual consumption, but also an estimate of what it should have been. ISO 50001, the new management-systems standard for energy, puts it succinctly in section 4.6.1 (e) where it calls for "evaluation of actual versus expected consumption" (my italics). Meters give you actual consumption, but expected consumption must be calculated from other independent measurements. The process is not complex. Typically, a given stream of consumption will depend on things such as production throughputs, the outside air temperature, number of hours of darkness or other 'driving' factor-so called because their variation drives variation in consumption-and the trick is to establish, from historical patterns, what the normal relationship is between each metered consumption and its relevant driving factor or factors. The relationship can in each case be expressed as a mathematical formula. At the end of each week (say) the driving-factor values are entered into the formulae, and out come a set of expected consumptions.
Armed with both an actual and an expected consumption for each meter, you can evaluate the differences and (importantly) tabulate the financial costs of each of those differences. Now you can wave a
V.O. Vesma
Advisory Board
Dr. Bhaskar Natarajan | C-Quest Capital, India
Binu Parthan | REEEP, Vienna
Dr. Brahmanand Mohanty | Advisor, ADEMEM.C. Jain | President, SEEM, IndiaDr. B.G. Desai | Energy Expert, India
C. Jayaraman | SEEM, IndiaDr. Kinsuk Mitra | Winrock International, India
Dr. G. M. Pillai| WISE, India
Dr. N.P Singh | Advisor MNRE, India
Prof. P.R. Shukla | IIM Ahmedabad, India
Editorial Board
Prof. Ahamed Galal Abdo | Advisor Minister of
Higher Education, Egypt
Darshan Goswami | US Dept. of Energy, USA
Prof. (Dr.) Hab Jurgis Staniskis | Director, Institute
of Environmental Engg., Lithuania
Dr. R. Harikumar | General Secretary, SEEM, IndiaProf. P.A. Onwualu | DG, RMR&D Council, Nigeria
R.Paraman |Devki Energy Consultancy,India
Ramesh Babu Gupta | India
Dr. Rwaichi J.A. Minja | University of Dar Es
Salaam, Tanzania
Prof. (Dr.) R. Sethumadhavan | Anna University, India
Prof. Sujay Basu | CEEM, India
Editorial Consultant
Prof. (Dr.) K. K.Sasi |Amrita University, India
Guest Editor
Editor
K. Madhusoodanan|SEEM, India
Publishing Director
Santosh Goenka
Co-ordinating Editor
Sonia Jose | Energy Press, India
Book DesignBadusha Creatives
Translation Coordinator
R. Sudhir Kumar|CPRI, Bangalore
Financial ControllerK. K. Babu | Energy Press, India
Printed and Published by
G. Krishnakumar, Energy Press
for the Society of Energy Engineers and Managers
and printed at St Francis Press, Ernakulam, India
Disclaimer : The views expressed in the magazine
are those of the authors and the Editorial team |
SEEM | energy press | does not
take responsibility for the contents and opinions.
will not be responsible for errors,
omissions or comments made by writers,
interviewers or advertisers. Any part of this
publication may be reproduced with
acknowledgement to the author and magazine.
| Volume 05 | Number: 1
ISSN 0974 - 0996
Supported by::
V.O. Vesma
ηenergy manager
ηenergy manager
January - March 2012
...continued in page 62
After collection, comprehension
Jan
uary
- M
arc
h 2
01
2a
qua
rterly
mag
azin
e of
the
soci
ety
of e
nerg
y en
gin
eers
and
man
ager
s / I
ndia
03
Mr. Vilnis Vesma is a trainer and independent consultant in energy saving methods. He specializes in the analysis and interpretation of energy consumption data, and is a council member of the Energy Services and Technology Association, committee of the International Performance Measurement and Verification Protocol and served on the committee that wrote ISO 50001:2011. He is the author of two books on energy management and maintains a free web site providing information and advice for energy managers.
Page 4
edit
or'
s n
ote
con
ten
t
Cover Feature
Best Practice
Opinion
Energy Management
Renewable Energy
Global Focus
Sustainable Living
Maximum utilisation of metered data 06Raviraj Kadiyala
Metering and monitoring - enabling technologies to deliver energy efficiency 12Jasjeet Singh Hanjrah
In-circuit reliability of energy meters 16Rajesh Nimare
Hot and cold running savings 22Fluke
Free cooling: an energy conservation measure 25Balbir Singh and V. K. Sethi
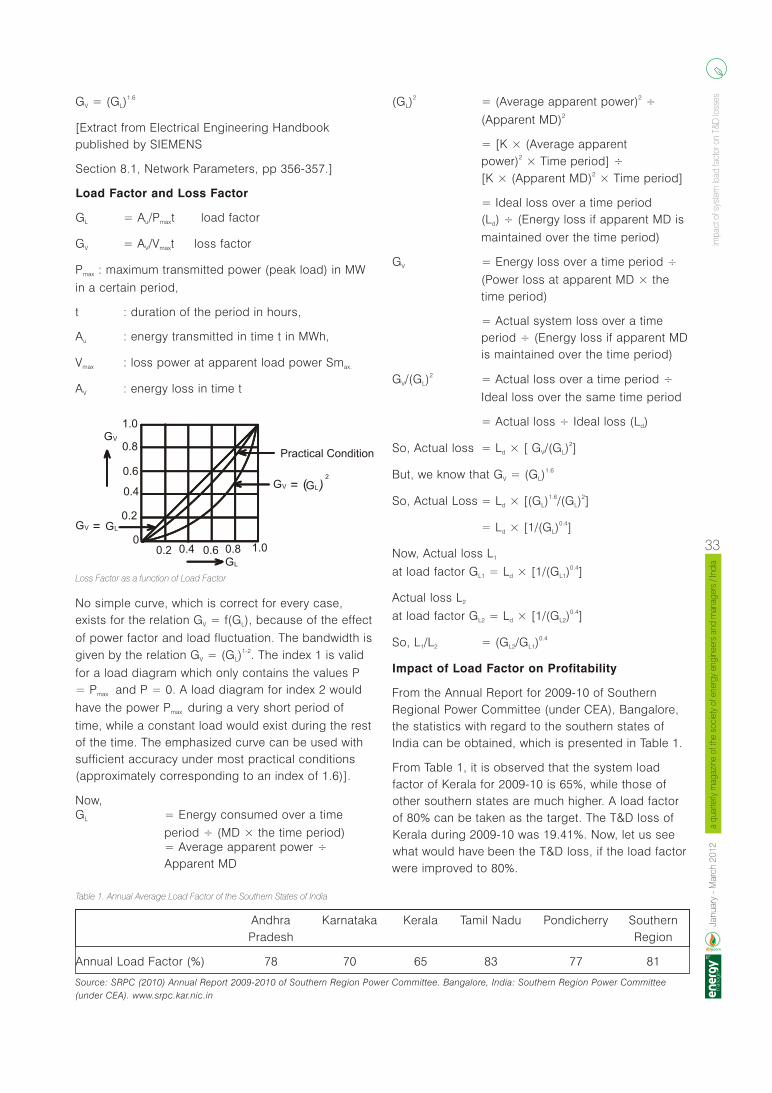
Impact of system load factor in transmission & distribution losses 30K. K. Babu
Energy efficient computing 37Soujanya Nemalikanti and Polavarupu Sindhura
Charring-briquetting : a novel cooking fuel technology 43B. P. Nema
Wind turbines for oceanic areas : innovations and developments 47Ron Steenbergen
Energy and environment symbiosis 54A. K. Jain
f all the investments that industrial units make to help Oreduce their energy spend, Energy Metering, Monitoring and Targeting System (MM&T) is undoubtedly the number one priority. Organisations implement monitoring and targeting systems from the Operational, Economic and Business perspectives. A recent study conducted by the Carbon Trust in over 1000 small businesses has concluded that on average an organisation could save 5% of its original energy expenses through M&T system. Other most recurrent benefits demonstrated through M&T programmes are better environmental performance, better production budgeting and provides support to environment management standards such as ISO 50001. It also helps in improving the prospects of obtaining financing for energy efficiency projects, better forecast of energy expenses leading to improved budgeting, and a diagnosis of energy waste in processes. It is true that at the industrial level (macro level), the key success factors for monitoring & targeting include process energy complexity, consistent production variables, significant energy costs and regulatory support, but the backbone of any successful energy monitoring and targeting programme, is advanced metering.
Advanced metering - a wise investment
Advanced metering is the most essential energy efficiency investment that any unit wishing to control its energy costs must make. The increased granularity of data provided by an advanced meter will assist units to implement a highly effective energy management programme. The accurate and regular consumption data derived from the advanced metering system mainly allows units to realize Base load reductions - for example by identifying unnecessary constant energy use, Process optimisation -as in the case of limiting the duration of high-energy use at the start and end of working schedules, and Peak usage reduction - analyzing timings and frequencies to establish the causes of peaks in energy usage, and understanding the causes in terms of specific activities or equipment.
Saving opportunities identified from advanced meter data can be pursued in several ways, including Information-based (behavioural) energy savings, Process-based energy savings as well as Investment-based energy savings. Combined with an understanding of how employees use energy across the business, possible information based/ behavioral savings can be identified and relevant behavioral changes can be targeted via a motivational programme. Advanced metering data can identify and quantify the effect of implementing these measures and monitor their impact over time. Typically costing nothing to implement, such savings foster a best practice approach to energy consumption within the organization. As mentioned before, data from advanced meters can also identify where processes can be optimised and quantify their impact. Energy savings can be achieved by changing the start-up and shutdown times of specific systems or by altering their power usage and temperature settings.
Advanced metering data can identify inefficiencies in equipment and infrastructure as well. The energy consumption of specific systems can be rated against manufacturers' specifications and more efficient equivalents, which can make or break a business case for an equipment upgrade or replacement. Though investment-based energy savings involve significant capital costs, the improvements have higher persistence levels than information-based or process based savings.
Though there are a variety of advanced metering solutions in the market, including the Fiscal meter, Clip-on, Secondary meter, Comms and HH, the half-hourly (HH) meters have become the most commonly used instruments for advanced metering systems. The half-hourly data can also be aggregated for billing purposes, avoiding the requirement for estimated bills.
Barriers to advanced metering, monitoring and targeting
Advanced metering for generating energy consumption information is only half of the story. What is more important is the analysis of data to relate consumption data with the production to evolve a meaningful benchmark to see whether it is a good, poor or an average performance. The interpretation needs to look at many factors such as capacity utilization level, ambient conditions, physics and chemistry of the process involved etc.
Although energy metering, monitoring and targeting is considered to be the most essential feature of energy management system, the key pillars for its successful implementation are people, system and technology.
The senior management needs to be committed for a culture change, moving the organization from one that considers energy consumption as a necessary cost to one which views energy as a resource that needs to be managed as effectively as the organization manages its raw materials or its workforce.
The organisation should ensure that managers responsible for energy consumption are accountable for it, one way to do this is to allocate energy budget to the individual production departments. The energy budget should be given as much emphasis as all other aspects of the production budget and energy performance should be included in the regular performance review and reward systems.
With the organisation motivated to identify energy saving ideas, the organisation needs to be in a position to implement the energy saving projects. Unlike other areas of production management, energy saving will tend to involve a large number of very small projects, hence the organisation requires the capability to identify, evaluate, design, engineer and manage the implementation of such projects.
Studies have demonstrated that SMEs using advanced metering can identify an average of 12% carbon savings and implement an average of 5% carbon savings through reduced utility consumption. But given the potential benefits of advanced metering, this technology definitely faces barriers, especially in gaining grounds among the SME community. And these emerge from both ends - from the customer as well as the supplier. Barriers from the Customer-side include a less than desirable level of awareness of advanced metering, linking energy use to costs and their transparency, availability of metering services, understanding of available service options and of course limited time and resources, those from the Supply-side point to the capacity of metering service providers, insufficient incentives for suppliers and concerns of stranded asset.
A small number of advanced metering service providers currently offer a range of different commercial services for business users, varying from remote collection of data from existing half-hourly meters to installing new advanced meters or providing 'clip-on' meter reading devices for existing
edit
or'
s n
ote
a q
uarte
rly m
agaz
ine
of th
e so
ciet
y of
ene
rgy
eng
inee
rs a
nd m
anag
ers
/ Ind
ia
04
Jan
uary
- M
arc
h 2
01
2
Jan
uary
- M
arc
h 2
01
2
a q
uarte
rly m
agaz
ine
of th
e so
ciet
y of
ene
rgy
eng
inee
rs a
nd m
anag
ers
/ Ind
ia
05
The road to efficient energy metering,monitoring and targeting
meters where compatible. However, there is currently a lack of full end-to-end metering services for the SME market. The smaller service providers tend to specialise in either data collection or meter installation and sometimes form strategic alliances with companies providing complementary services.
In light of the significant savings achievable through metering, it is essential that the potential benefits of advanced metering is widely understood. There is also a need to stimulate market demand by developing case studies that demonstrate the reduction in energy consumption and costs made possible using this technology. Also, steps to introduce a mandatory roll out of advanced meters for SMEs will ensure that a significant cost effective carbon saving opportunity is not missed.
K. Madhusoodanan
Editor
(Please contribute your articles and case studies to reach the editor at [email protected] or [email protected] )
Page 5
edit
or'
s n
ote
con
ten
t
Cover Feature
Best Practice
Opinion
Energy Management
Renewable Energy
Global Focus
Sustainable Living
Maximum utilisation of metered data 06Raviraj Kadiyala
Metering and monitoring - enabling technologies to deliver energy efficiency 12Jasjeet Singh Hanjrah
In-circuit reliability of energy meters 16Rajesh Nimare
Hot and cold running savings 22Fluke
Free cooling: an energy conservation measure 25Balbir Singh and V. K. Sethi
Impact of system load factor in transmission & distribution losses 30K. K. Babu
Energy efficient computing 37Soujanya Nemalikanti and Polavarupu Sindhura
Charring-briquetting : a novel cooking fuel technology 43B. P. Nema
Wind turbines for oceanic areas : innovations and developments 47Ron Steenbergen
Energy and environment symbiosis 54A. K. Jain
f all the investments that industrial units make to help Oreduce their energy spend, Energy Metering, Monitoring and Targeting System (MM&T) is undoubtedly the number one priority. Organisations implement monitoring and targeting systems from the Operational, Economic and Business perspectives. A recent study conducted by the Carbon Trust in over 1000 small businesses has concluded that on average an organisation could save 5% of its original energy expenses through M&T system. Other most recurrent benefits demonstrated through M&T programmes are better environmental performance, better production budgeting and provides support to environment management standards such as ISO 50001. It also helps in improving the prospects of obtaining financing for energy efficiency projects, better forecast of energy expenses leading to improved budgeting, and a diagnosis of energy waste in processes. It is true that at the industrial level (macro level), the key success factors for monitoring & targeting include process energy complexity, consistent production variables, significant energy costs and regulatory support, but the backbone of any successful energy monitoring and targeting programme, is advanced metering.
Advanced metering - a wise investment
Advanced metering is the most essential energy efficiency investment that any unit wishing to control its energy costs must make. The increased granularity of data provided by an advanced meter will assist units to implement a highly effective energy management programme. The accurate and regular consumption data derived from the advanced metering system mainly allows units to realize Base load reductions - for example by identifying unnecessary constant energy use, Process optimisation -as in the case of limiting the duration of high-energy use at the start and end of working schedules, and Peak usage reduction - analyzing timings and frequencies to establish the causes of peaks in energy usage, and understanding the causes in terms of specific activities or equipment.
Saving opportunities identified from advanced meter data can be pursued in several ways, including Information-based (behavioural) energy savings, Process-based energy savings as well as Investment-based energy savings. Combined with an understanding of how employees use energy across the business, possible information based/ behavioral savings can be identified and relevant behavioral changes can be targeted via a motivational programme. Advanced metering data can identify and quantify the effect of implementing these measures and monitor their impact over time. Typically costing nothing to implement, such savings foster a best practice approach to energy consumption within the organization. As mentioned before, data from advanced meters can also identify where processes can be optimised and quantify their impact. Energy savings can be achieved by changing the start-up and shutdown times of specific systems or by altering their power usage and temperature settings.
Advanced metering data can identify inefficiencies in equipment and infrastructure as well. The energy consumption of specific systems can be rated against manufacturers' specifications and more efficient equivalents, which can make or break a business case for an equipment upgrade or replacement. Though investment-based energy savings involve significant capital costs, the improvements have higher persistence levels than information-based or process based savings.
Though there are a variety of advanced metering solutions in the market, including the Fiscal meter, Clip-on, Secondary meter, Comms and HH, the half-hourly (HH) meters have become the most commonly used instruments for advanced metering systems. The half-hourly data can also be aggregated for billing purposes, avoiding the requirement for estimated bills.
Barriers to advanced metering, monitoring and targeting
Advanced metering for generating energy consumption information is only half of the story. What is more important is the analysis of data to relate consumption data with the production to evolve a meaningful benchmark to see whether it is a good, poor or an average performance. The interpretation needs to look at many factors such as capacity utilization level, ambient conditions, physics and chemistry of the process involved etc.
Although energy metering, monitoring and targeting is considered to be the most essential feature of energy management system, the key pillars for its successful implementation are people, system and technology.
The senior management needs to be committed for a culture change, moving the organization from one that considers energy consumption as a necessary cost to one which views energy as a resource that needs to be managed as effectively as the organization manages its raw materials or its workforce.
The organisation should ensure that managers responsible for energy consumption are accountable for it, one way to do this is to allocate energy budget to the individual production departments. The energy budget should be given as much emphasis as all other aspects of the production budget and energy performance should be included in the regular performance review and reward systems.
With the organisation motivated to identify energy saving ideas, the organisation needs to be in a position to implement the energy saving projects. Unlike other areas of production management, energy saving will tend to involve a large number of very small projects, hence the organisation requires the capability to identify, evaluate, design, engineer and manage the implementation of such projects.
Studies have demonstrated that SMEs using advanced metering can identify an average of 12% carbon savings and implement an average of 5% carbon savings through reduced utility consumption. But given the potential benefits of advanced metering, this technology definitely faces barriers, especially in gaining grounds among the SME community. And these emerge from both ends - from the customer as well as the supplier. Barriers from the Customer-side include a less than desirable level of awareness of advanced metering, linking energy use to costs and their transparency, availability of metering services, understanding of available service options and of course limited time and resources, those from the Supply-side point to the capacity of metering service providers, insufficient incentives for suppliers and concerns of stranded asset.
A small number of advanced metering service providers currently offer a range of different commercial services for business users, varying from remote collection of data from existing half-hourly meters to installing new advanced meters or providing 'clip-on' meter reading devices for existing
edit
or'
s n
ote
a q
uarte
rly m
agaz
ine
of th
e so
ciet
y of
ene
rgy
eng
inee
rs a
nd m
anag
ers
/ Ind
ia
04
Jan
uary
- M
arc
h 2
01
2
Jan
uary
- M
arc
h 2
01
2
a q
uarte
rly m
agaz
ine
of th
e so
ciet
y of
ene
rgy
eng
inee
rs a
nd m
anag
ers
/ Ind
ia
05
The road to efficient energy metering,monitoring and targeting
meters where compatible. However, there is currently a lack of full end-to-end metering services for the SME market. The smaller service providers tend to specialise in either data collection or meter installation and sometimes form strategic alliances with companies providing complementary services.
In light of the significant savings achievable through metering, it is essential that the potential benefits of advanced metering is widely understood. There is also a need to stimulate market demand by developing case studies that demonstrate the reduction in energy consumption and costs made possible using this technology. Also, steps to introduce a mandatory roll out of advanced meters for SMEs will ensure that a significant cost effective carbon saving opportunity is not missed.
K. Madhusoodanan
Editor
(Please contribute your articles and case studies to reach the editor at [email protected] or [email protected] )
Page 6
max
imum
util
isat
ion
of m
eter
ed d
ata
max
imum
util
isat
ion
of m
eter
ed d
ata
Jan
uary
- M
arc
h 2
01
2a
qua
rterly
mag
azin
e of
the
soci
ety
of e
nerg
y en
gin
eers
and
man
ager
s / I
ndia
07
Jan
uary
- M
arc
h 2
01
2a
qua
rterly
mag
azin
e of
the
soci
ety
of e
nerg
y en
gin
eers
and
man
ager
s / I
ndia
06
maximum utilisationof metered data
Raviraj Kadiyala
A successful metering strategy
requires more than installing
the meters. This article explains
how to derive maximum use of
metered data, especially from
interval metering and sub-
metering of energy
consumption in an
organization. While metered
data gives a direct view of the
energy consumption at each of
the facilities, it also acts as the
fundamental piece of
information in computing
appropriate efficiency metrics.
One of the significant merits of
having metered data over long
periods of time is in enabling
prediction of energy
consumption. Metered data
monitored through a central
system not only provide
auditable data, but also
dramatically reduce the time
required for data collection and
report preparation.
lmost all organizations acknowledge energy metering or sub-metering as a crucial element of energy Aefficiency in their facilities. With the maxim 'measure to save', over 5% of energy cost saving is often
pegged to granular metering.
Depending on the objective and availability of funds, sub-metering may be
considered to provide load-wise energy consumption details. In addition, advanced
meters make it possible to get time series data at pre-determined intervals. Over a
period of time, these measures can generate a huge quantum of valuable data.
Page 7
max
imum
util
isat
ion
of m
eter
ed d
ata
max
imum
util
isat
ion
of m
eter
ed d
ata
Jan
uary
- M
arc
h 2
01
2a
qua
rterly
mag
azin
e of
the
soci
ety
of e
nerg
y en
gin
eers
and
man
ager
s / I
ndia
07
Jan
uary
- M
arc
h 2
01
2a
qua
rterly
mag
azin
e of
the
soci
ety
of e
nerg
y en
gin
eers
and
man
ager
s / I
ndia
06
maximum utilisationof metered data
Raviraj Kadiyala
A successful metering strategy
requires more than installing
the meters. This article explains
how to derive maximum use of
metered data, especially from
interval metering and sub-
metering of energy
consumption in an
organization. While metered
data gives a direct view of the
energy consumption at each of
the facilities, it also acts as the
fundamental piece of
information in computing
appropriate efficiency metrics.
One of the significant merits of
having metered data over long
periods of time is in enabling
prediction of energy
consumption. Metered data
monitored through a central
system not only provide
auditable data, but also
dramatically reduce the time
required for data collection and
report preparation.
lmost all organizations acknowledge energy metering or sub-metering as a crucial element of energy Aefficiency in their facilities. With the maxim 'measure to save', over 5% of energy cost saving is often
pegged to granular metering.
Depending on the objective and availability of funds, sub-metering may be
considered to provide load-wise energy consumption details. In addition, advanced
meters make it possible to get time series data at pre-determined intervals. Over a
period of time, these measures can generate a huge quantum of valuable data.
Page 8
max
imum
util
isat
ion
of m
eter
ed d
ata
Jan
uary
- M
arc
h 2
01
2a
qua
rterly
mag
azin
e of
the
soci
ety
of e
nerg
y en
gin
eers
and
man
ager
s / I
ndia
08
max
imum
util
isat
ion
of m
eter
ed d
ata
Jan
uary
- M
arc
h 2
01
2a
qua
rterly
mag
azin
e of
the
soci
ety
of e
nerg
y en
gin
eers
and
man
ager
s / I
ndia
09
Presently, energy consumption is tracked at least
once a month at facility level, if not more often. This
helps to compare the energy consumption of a facility
and track any anomalies. Depending on the objective
and availability of funds, sub-metering may be
considered to provide load-wise energy consumption
details. In addition, advanced meters make it possible
to get time series data at pre-determined intervals.
Over a period of time, these measures can generate a
huge quantum of valuable data.
A successful metering strategy requires more than
installing the meters. This article explains how to
derive maximum use of metered data, especially from
interval metering and sub-metering of energy
consumption in an organization.
Benchmarking
In multi-facility organizations, it becomes imperative
for management teams to know how each of the
different facilities perform in terms of energy
consumption and efficiency. While metered data give
a direct view of the energy consumption, it also acts
as the fundamental piece of information in computing
appropriate efficiency metrics. The metrics used
could be ones like energy usage intensity (EUI), which
is kilowatt-hours per square metres or square feet, or
power usage effectiveness (PUE) in the case of
computer data centres which is the quotient of total
facility energy divided by IT energy. Irrespective of the
magnitude of energy consumption, these metrics not
only enable determining which facility is efficient, but
also enables organizations to set efficiency goals by
comparing energy consumption levels between peer
facilities and industry benchmarks.
Schedule Mismatch
Most organizations fix schedules of operation based
on work hours of employees, varying
equipment/business loads in different shifts, off-
hour/holiday/weekend schedules and so on which
impact energy consumption. Analyzing metered data
helps identify compliance to these schedules. Any
deviation observed is a potential area for energy
savings (Figure 1). In a facility where working hours
are from 9 a.m. to 6 p.m, it may be unjustifiable if the
energy consumption data indicate that 70% to 80% of
work hour energy consumption continues till 8 p.m.
The situation should be investigated and appropriate
corrective action taken.
Base Load
Data collected during off-hour periods indicate the
base load of a facility. It is the energy requirement of
the facility irrespective of any active operations.
Hence, it is the minimum amount of energy used by
the facility and indicates the minimum energy cost
incurred (Figure 1). However, the observed base load
may not be justifiable in all cases. By identifying the
loads that are expected to be operational, the actual
energy consumption data could be verified, and it
may turn out to be more than expected. Any reduction
that is subsequently achieved in the base load will
bring about maximum savings for single-shift facilities
and progressively to a lesser extent for extended
hours or multi-shift facilities.
Seasonality and Weather Impact
Energy consumption of facilities could follow a
seasonal pattern based on weather, business cycles
or holidays/festival periods. Analyzing the data over
longer time horizons of at least a year helps identify
such patterns. Checking whether these are in line with
known events or cycles could identify energy-saving
opportunities (Figure 2). Comparison can also be
done of cycles across multiple years, which can bring
out differences in consumption pattern. Investigation
Analyzing energy consumption data over
longer time horizons of at least a year
helps identify seasonal patterns based on
various factors. Checking whether these
are in line with known events or cycles
could identify energy-saving opportunities.
into the root cause of such differences would help
better control of energy consumption. Typical
optimizations here relate to thermal insulation of
facilities and equipment energy efficiency.
Load Breakup
One of the primary reasons for or benefits of sub-
metering is that it leads to an insight into load
breakup and identify loads that are sub-optimal in
energy efficiency. This could be either based on
absolute consumption details or in relation to other
load values. For example, in a data centre (Figure 3),
what is the heating, ventilation and air conditioning
(HVAC) load with respect to the IT load? The load
relationship can also be studied for different time
periods to understand the way it is changing. For
example, how is it varying between day and night,
work and off day, summer and winter and so on?
Such insights would help justify or improve energy
consumption.
Analytics and Forecasting
One of the significant merits of having metered data
over long periods of time is in enabling prediction of
energy consumption with improved accuracy, enabled
through metering and monitoring of different key
parameters. In day-to-day operations, the forecasted
consumption can be used as a reference to control
energy consumption proactively rather than reactively.
In day-to-day operations, the forecasted
consumption can be used as a reference
to control energy consumption proactively
rather than reactively. Analysis of metered
data on an ongoing basis would enable
organizations to leverage maximum
potential at the earliest opportunity. For
example, it could highlight spikes,
anomalies in usage pattern, growth or
drop in energy consumption, changes in
key impacting parameters and so on.
Fig 1. Schedule Mismatch Fig 2. Seasonal Consumption Pattern Fig 3. Load Distribution
Page 9
max
imum
util
isat
ion
of m
eter
ed d
ata
Jan
uary
- M
arc
h 2
01
2a
qua
rterly
mag
azin
e of
the
soci
ety
of e
nerg
y en
gin
eers
and
man
ager
s / I
ndia
08
max
imum
util
isat
ion
of m
eter
ed d
ata
Jan
uary
- M
arc
h 2
01
2a
qua
rterly
mag
azin
e of
the
soci
ety
of e
nerg
y en
gin
eers
and
man
ager
s / I
ndia
09
Presently, energy consumption is tracked at least
once a month at facility level, if not more often. This
helps to compare the energy consumption of a facility
and track any anomalies. Depending on the objective
and availability of funds, sub-metering may be
considered to provide load-wise energy consumption
details. In addition, advanced meters make it possible
to get time series data at pre-determined intervals.
Over a period of time, these measures can generate a
huge quantum of valuable data.
A successful metering strategy requires more than
installing the meters. This article explains how to
derive maximum use of metered data, especially from
interval metering and sub-metering of energy
consumption in an organization.
Benchmarking
In multi-facility organizations, it becomes imperative
for management teams to know how each of the
different facilities perform in terms of energy
consumption and efficiency. While metered data give
a direct view of the energy consumption, it also acts
as the fundamental piece of information in computing
appropriate efficiency metrics. The metrics used
could be ones like energy usage intensity (EUI), which
is kilowatt-hours per square metres or square feet, or
power usage effectiveness (PUE) in the case of
computer data centres which is the quotient of total
facility energy divided by IT energy. Irrespective of the
magnitude of energy consumption, these metrics not
only enable determining which facility is efficient, but
also enables organizations to set efficiency goals by
comparing energy consumption levels between peer
facilities and industry benchmarks.
Schedule Mismatch
Most organizations fix schedules of operation based
on work hours of employees, varying
equipment/business loads in different shifts, off-
hour/holiday/weekend schedules and so on which
impact energy consumption. Analyzing metered data
helps identify compliance to these schedules. Any
deviation observed is a potential area for energy
savings (Figure 1). In a facility where working hours
are from 9 a.m. to 6 p.m, it may be unjustifiable if the
energy consumption data indicate that 70% to 80% of
work hour energy consumption continues till 8 p.m.
The situation should be investigated and appropriate
corrective action taken.
Base Load
Data collected during off-hour periods indicate the
base load of a facility. It is the energy requirement of
the facility irrespective of any active operations.
Hence, it is the minimum amount of energy used by
the facility and indicates the minimum energy cost
incurred (Figure 1). However, the observed base load
may not be justifiable in all cases. By identifying the
loads that are expected to be operational, the actual
energy consumption data could be verified, and it
may turn out to be more than expected. Any reduction
that is subsequently achieved in the base load will
bring about maximum savings for single-shift facilities
and progressively to a lesser extent for extended
hours or multi-shift facilities.
Seasonality and Weather Impact
Energy consumption of facilities could follow a
seasonal pattern based on weather, business cycles
or holidays/festival periods. Analyzing the data over
longer time horizons of at least a year helps identify
such patterns. Checking whether these are in line with
known events or cycles could identify energy-saving
opportunities (Figure 2). Comparison can also be
done of cycles across multiple years, which can bring
out differences in consumption pattern. Investigation
Analyzing energy consumption data over
longer time horizons of at least a year
helps identify seasonal patterns based on
various factors. Checking whether these
are in line with known events or cycles
could identify energy-saving opportunities.
into the root cause of such differences would help
better control of energy consumption. Typical
optimizations here relate to thermal insulation of
facilities and equipment energy efficiency.
Load Breakup
One of the primary reasons for or benefits of sub-
metering is that it leads to an insight into load
breakup and identify loads that are sub-optimal in
energy efficiency. This could be either based on
absolute consumption details or in relation to other
load values. For example, in a data centre (Figure 3),
what is the heating, ventilation and air conditioning
(HVAC) load with respect to the IT load? The load
relationship can also be studied for different time
periods to understand the way it is changing. For
example, how is it varying between day and night,
work and off day, summer and winter and so on?
Such insights would help justify or improve energy
consumption.
Analytics and Forecasting
One of the significant merits of having metered data
over long periods of time is in enabling prediction of
energy consumption with improved accuracy, enabled
through metering and monitoring of different key
parameters. In day-to-day operations, the forecasted
consumption can be used as a reference to control
energy consumption proactively rather than reactively.
In day-to-day operations, the forecasted
consumption can be used as a reference
to control energy consumption proactively
rather than reactively. Analysis of metered
data on an ongoing basis would enable
organizations to leverage maximum
potential at the earliest opportunity. For
example, it could highlight spikes,
anomalies in usage pattern, growth or
drop in energy consumption, changes in
key impacting parameters and so on.
Fig 1. Schedule Mismatch Fig 2. Seasonal Consumption Pattern Fig 3. Load Distribution
Page 10
max
imum
util
isat
ion
of m
eter
ed d
ata
Jan
uary
- M
arc
h 2
01
2a
qua
rterly
mag
azin
e of
the
soci
ety
of e
nerg
y en
gin
eers
and
man
ager
s / I
ndia
10
Mr. Raviraj Kadiyala is a senior
consultant at Wipro EcoEnergy,
working in the field of energy
management services. His field of
work involves providing solutions to
organizations in sectors like
telecom, data centers and
commercial buildings across the
world to reduce and maintain
energy consumption/costs at
optimal levels.
max
imum
util
isat
ion
of m
eter
ed d
ata
Jan
uary
- M
arc
h 2
01
2a
qua
rterly
mag
azin
e of
the
soci
ety
of e
nerg
y en
gin
eers
and
man
ager
s / I
ndia
11Dynamic operating environments can provide energy-
saving opportunities on a continuous basis. Analysis
of metered data on an ongoing basis would enable
organizations to leverage maximum potential at the
earliest opportunity (Figure 4). For example, it could
highlight spikes, anomalies in usage pattern, growth
or drop in energy consumption, changes in key
impacting parameters and so on.
be possible to determine the efficiencies of
equipment like UPS and computer room air
conditioning (CRAC) units using sub-metered data.
However, metrics like energy efficiency ratio (EER)
used for CRAC units would require monitoring of
other associated parameters as well.
Peak Shaving/Shifting
Metered data can help in the classification of peak
loads into critical and non-critical. This insight can
then be used to determine if any of the peak loads
can be shifted to non-peak hours or if non-critical
loads can be reduced (Figure 5) thereby helping in
decreasing peak load charges. With the demand for
energy increasing and supply lagging behind, utility
companies face the challenge of meeting peak
demand requirements. While augmenting their peak
supply capacity, some utility companies offer demand
response programmes that incentivize end users to
reduce their demand. Analysis of metered data and
peak shaving/shifting would also make facilities
eligible to claim incentives from such programmes.
Contract Demand
It is typical of organizations to forecast their business
growth and the associated energy requirements while
applying for a contract demand from utilities. And the
projected demand would be much more than what is
required presently. This unutilized capacity comes at
an additional recurring cost, which is justified by
many to be worth the hassle/risk of getting additional
capacity at short notice. However, it would be a
worthwhile exercise to periodically review the
predicted business growth and energy requirement. It
may so happen that, due to business decisions or
turbulent market conditions, the actual energy
requirement will be much lower than the predicted
figures. Even considering the lead time for procuring
additional capacity, such instances may warrant
releasing of excess capacity and make the exercise
cash positive. Metered data provides a strong basis
for analyzing the peak demand requirement and the
demand growth that has actually been seen over a
period of time to make this call.
Loss Reduction
Quality of power has a bearing on performance
reliability, efficiency and life of equipment. Many
It may so happen that, due to business
decisions or turbulent market conditions,
the actual energy requirement will be
much lower than the figures predicted
while applying for a contract demand.
Even considering the lead time for
procuring additional capacity, such
instances may warrant releasing of excess
capacity and make the exercise cash
positive.
meters allow monitoring of data points that enable
determination of power quality, like power factor and
harmonics. Enabling them could highlight problem
areas which could then be addressed appropriately.
Utility Meter Faults and Billing Errors
The availability of sub-metering on main lines enables
one to detect any fault in the main utility meters.
Though rare, a faulty utility meter could go
undetected especially if it has been so over a period
of time. Installation of sub-meters enables one to
detect existing problems as well any new ones that
may arise. With a granular view into consumption,
metered data can be used to compute utility charges
independently. This can then be used to verify the
correctness of received invoices and reconcile with
utility companies.
Billing at Multi-tenanted Sites
In multi-tenanted facilities, contracts could be in place
that charge based on occupied area and not
necessarily on energy consumption. Metered data
can be used by organizations to renegotiate for
contracts that either do billing more in line with their
actual consumption or restructure them so that the
tenants are charged based on actuals.
Emissions Reporting
One of the big challenges in reporting emissions is
collecting reliable data on energy consumption.
Metered data monitored through a central system not
only provide auditable data, but also dramatically
reduce the time required for data collection and
report preparation.
Metering and monitoring requires investment. And, at
times, it becomes difficult to justify it. Moreover, it has
also been seen that at places where investments
have already been made, the use of data is restricted
only to a limited subset. It is the author's hope that
readers of this article would be able to tap the full
value of benefits realizable from their metered data.
Acknowledgements
The author acknowledges with gratitude the guidance
of Mr. Ravi Meghani in writing this article.
Equipment Efficiency
With appropriate levels of sub-metering, it is possible
to determine the actual performing efficiency of
equipment. This not only tells whether the units are
performing at expected levels, but also brings to
attention any maintenance needs when efficiency
drops unexpectedly. This prevents avoidable losses in
terms of energy as well as cost. For example, it would
Fig 4. Actual vs Predicted Consumption
Fig 5a. Pre Peak Load Shaving
Fig 5b. Post Peak Load Shaving
Page 11
max
imum
util
isat
ion
of m
eter
ed d
ata
Jan
uary
- M
arc
h 2
01
2a
qua
rterly
mag
azin
e of
the
soci
ety
of e
nerg
y en
gin
eers
and
man
ager
s / I
ndia
10
Mr. Raviraj Kadiyala is a senior
consultant at Wipro EcoEnergy,
working in the field of energy
management services. His field of
work involves providing solutions to
organizations in sectors like
telecom, data centers and
commercial buildings across the
world to reduce and maintain
energy consumption/costs at
optimal levels.
max
imum
util
isat
ion
of m
eter
ed d
ata
Jan
uary
- M
arc
h 2
01
2a
qua
rterly
mag
azin
e of
the
soci
ety
of e
nerg
y en
gin
eers
and
man
ager
s / I
ndia
11Dynamic operating environments can provide energy-
saving opportunities on a continuous basis. Analysis
of metered data on an ongoing basis would enable
organizations to leverage maximum potential at the
earliest opportunity (Figure 4). For example, it could
highlight spikes, anomalies in usage pattern, growth
or drop in energy consumption, changes in key
impacting parameters and so on.
be possible to determine the efficiencies of
equipment like UPS and computer room air
conditioning (CRAC) units using sub-metered data.
However, metrics like energy efficiency ratio (EER)
used for CRAC units would require monitoring of
other associated parameters as well.
Peak Shaving/Shifting
Metered data can help in the classification of peak
loads into critical and non-critical. This insight can
then be used to determine if any of the peak loads
can be shifted to non-peak hours or if non-critical
loads can be reduced (Figure 5) thereby helping in
decreasing peak load charges. With the demand for
energy increasing and supply lagging behind, utility
companies face the challenge of meeting peak
demand requirements. While augmenting their peak
supply capacity, some utility companies offer demand
response programmes that incentivize end users to
reduce their demand. Analysis of metered data and
peak shaving/shifting would also make facilities
eligible to claim incentives from such programmes.
Contract Demand
It is typical of organizations to forecast their business
growth and the associated energy requirements while
applying for a contract demand from utilities. And the
projected demand would be much more than what is
required presently. This unutilized capacity comes at
an additional recurring cost, which is justified by
many to be worth the hassle/risk of getting additional
capacity at short notice. However, it would be a
worthwhile exercise to periodically review the
predicted business growth and energy requirement. It
may so happen that, due to business decisions or
turbulent market conditions, the actual energy
requirement will be much lower than the predicted
figures. Even considering the lead time for procuring
additional capacity, such instances may warrant
releasing of excess capacity and make the exercise
cash positive. Metered data provides a strong basis
for analyzing the peak demand requirement and the
demand growth that has actually been seen over a
period of time to make this call.
Loss Reduction
Quality of power has a bearing on performance
reliability, efficiency and life of equipment. Many
It may so happen that, due to business
decisions or turbulent market conditions,
the actual energy requirement will be
much lower than the figures predicted
while applying for a contract demand.
Even considering the lead time for
procuring additional capacity, such
instances may warrant releasing of excess
capacity and make the exercise cash
positive.
meters allow monitoring of data points that enable
determination of power quality, like power factor and
harmonics. Enabling them could highlight problem
areas which could then be addressed appropriately.
Utility Meter Faults and Billing Errors
The availability of sub-metering on main lines enables
one to detect any fault in the main utility meters.
Though rare, a faulty utility meter could go
undetected especially if it has been so over a period
of time. Installation of sub-meters enables one to
detect existing problems as well any new ones that
may arise. With a granular view into consumption,
metered data can be used to compute utility charges
independently. This can then be used to verify the
correctness of received invoices and reconcile with
utility companies.
Billing at Multi-tenanted Sites
In multi-tenanted facilities, contracts could be in place
that charge based on occupied area and not
necessarily on energy consumption. Metered data
can be used by organizations to renegotiate for
contracts that either do billing more in line with their
actual consumption or restructure them so that the
tenants are charged based on actuals.
Emissions Reporting
One of the big challenges in reporting emissions is
collecting reliable data on energy consumption.
Metered data monitored through a central system not
only provide auditable data, but also dramatically
reduce the time required for data collection and
report preparation.
Metering and monitoring requires investment. And, at
times, it becomes difficult to justify it. Moreover, it has
also been seen that at places where investments
have already been made, the use of data is restricted
only to a limited subset. It is the author's hope that
readers of this article would be able to tap the full
value of benefits realizable from their metered data.
Acknowledgements
The author acknowledges with gratitude the guidance
of Mr. Ravi Meghani in writing this article.
Equipment Efficiency
With appropriate levels of sub-metering, it is possible
to determine the actual performing efficiency of
equipment. This not only tells whether the units are
performing at expected levels, but also brings to
attention any maintenance needs when efficiency
drops unexpectedly. This prevents avoidable losses in
terms of energy as well as cost. For example, it would
Fig 4. Actual vs Predicted Consumption
Fig 5a. Pre Peak Load Shaving
Fig 5b. Post Peak Load Shaving
Page 12
met
erin
g a
nd m
onito
ring
– e
nab
ling
tech
nolo
gie
s to
del
iver
ene
rgy
effic
ienc
yJa
nu
ary
- M
arc
h 2
01
2a
qua
rterly
mag
azin
e of
the
soci
ety
of e
nerg
y en
gin
eers
and
man
ager
s / I
ndia
13
Jan
uary
- M
arc
h 2
01
2a
qua
rterly
mag
azin
e of
the
soci
ety
of e
nerg
y en
gin
eers
and
man
ager
s / I
ndia
12 metering and monitoring -
enabling technologies to deliver energy efficiencyJasjeet Singh Hanjrah
Metering and monitoring are two key aspects
for measurement of energy consumption and
for the analysis of consumption behaviour.
While metering has a role in measuring
energy consumption, monitoring, as a first
step, helps to identify the key areas of
potential improvements. Data
analytics/business intelligence is another
area that tremendously helps distribution
utilities to perform data mining on metered
data and come up with consumer
consumption patterns. Based upon
measurements and analysis, remedial action
can be taken to achieve energy savings and
energy efficiency.
oday, our planet is trying hard to find solutions to Tsome of the most challenging environmental
problems like increasing carbon footprints and
concerns regarding sustainability and efficiency. The
most pressing need for any utility is to reduce the
carbon footprints while ensuring secure and reliable
supply of electricity. Moreover, the concern over
delivering energy with consistent reliability and
efficiency is not limited to a particular geographical
region. Such challenging environments re-emphasize
the norm 'what gets measured gets done' and
stresses upon the two key aspects for measuring
energy consumption and analyzing consumption
behaviour - Metering and Monitoring.
Monitoring is an integral area that contributes to
energy efficiency and is inevitably required to have
measurable results. This could be referred to as the
first step in pursuing the goal of saving kilo Watt
hours. Also, it is widely accepted that the energy
saved through optimization and efficient operation is
the greenest and cleanest energy 'produced', which is
referred to as 'negawatts'. Negawatts are known to
bring in significant amount of energy savings. A
recent IEE report found that rate payer-funded energy
efficiency and demand response programmes in the
United States in 2010 have saved enough negawatts
to power almost 10 million homes, representing
approximately 112 million Mega Watt hours (MWh) of
electricity.
A recent IEE report found that rate payer-
funded energy efficiency and demand
response programmes in the United
States in 2010 have saved enough
negawatts to power almost 10 million
homes, representing approximately 112
million MWh of electricity.
A close surveillance over domestic energy
usage can be done using an in-home
display (IHD), which helps to establish the
initial level of consumption and set a
target for achieving the negawatts. While
most appliances are marked with their
wattage, they rarely state how much
energy is getting wasted when they are in
the standby mode. Devices like the kill-a-
watt energy usage monitor lets you see
exactly where your electricity (and money)
is going and helps you focus on reducing
energy wastage at home.
A close surveillance over domestic energy usage can
be done using an in-home display (IHD). This not only
helps to establish the initial level of consumption, but
also helps to set up a target for achieving the
negawatts. This is applicable equally for domestic,
industrial and commercial consumers. There are
equipments that can continuously monitor the level of
consumption and can give us a beep sound if the
pre-defined usage limits are crossed. The HAN
(Home Automation) technology help consumers stay
aware of the energy consumption and also lends a
helping hand while making decisions from remote
locations (Smart home application interfaces help
through a web browser or smart phones).
There are devices available in the market, like the kill-
a-watt energy usage monitor, which help identify
energy wastage. While most appliances are marked
with their wattage, they rarely state how much energy
is getting wasted when they are in the standby mode.
The kill-a-watt lets you see exactly where your
electricity (and money) is going and helps you focus
on reducing energy wastage at home. Thus, it can be
concluded that while metering plays its own role in
measuring energy consumption, monitoring helps to
identify the key areas of potential improvements.
Metering is one of the key aspects for monitoring
energy consumption, discovering wastages or
Page 13
met
erin
g a
nd m
onito
ring
– e
nab
ling
tech
nolo
gie
s to
del
iver
ene
rgy
effic
ienc
yJa
nu
ary
- M
arc
h 2
01
2a
qua
rterly
mag
azin
e of
the
soci
ety
of e
nerg
y en
gin
eers
and
man
ager
s / I
ndia
13
Jan
uary
- M
arc
h 2
01
2a
qua
rterly
mag
azin
e of
the
soci
ety
of e
nerg
y en
gin
eers
and
man
ager
s / I
ndia
12 metering and monitoring -
enabling technologies to deliver energy efficiencyJasjeet Singh Hanjrah
Metering and monitoring are two key aspects
for measurement of energy consumption and
for the analysis of consumption behaviour.
While metering has a role in measuring
energy consumption, monitoring, as a first
step, helps to identify the key areas of
potential improvements. Data
analytics/business intelligence is another
area that tremendously helps distribution
utilities to perform data mining on metered
data and come up with consumer
consumption patterns. Based upon
measurements and analysis, remedial action
can be taken to achieve energy savings and
energy efficiency.
oday, our planet is trying hard to find solutions to Tsome of the most challenging environmental
problems like increasing carbon footprints and
concerns regarding sustainability and efficiency. The
most pressing need for any utility is to reduce the
carbon footprints while ensuring secure and reliable
supply of electricity. Moreover, the concern over
delivering energy with consistent reliability and
efficiency is not limited to a particular geographical
region. Such challenging environments re-emphasize
the norm 'what gets measured gets done' and
stresses upon the two key aspects for measuring
energy consumption and analyzing consumption
behaviour - Metering and Monitoring.
Monitoring is an integral area that contributes to
energy efficiency and is inevitably required to have
measurable results. This could be referred to as the
first step in pursuing the goal of saving kilo Watt
hours. Also, it is widely accepted that the energy
saved through optimization and efficient operation is
the greenest and cleanest energy 'produced', which is
referred to as 'negawatts'. Negawatts are known to
bring in significant amount of energy savings. A
recent IEE report found that rate payer-funded energy
efficiency and demand response programmes in the
United States in 2010 have saved enough negawatts
to power almost 10 million homes, representing
approximately 112 million Mega Watt hours (MWh) of
electricity.
A recent IEE report found that rate payer-
funded energy efficiency and demand
response programmes in the United
States in 2010 have saved enough
negawatts to power almost 10 million
homes, representing approximately 112
million MWh of electricity.
A close surveillance over domestic energy
usage can be done using an in-home
display (IHD), which helps to establish the
initial level of consumption and set a
target for achieving the negawatts. While
most appliances are marked with their
wattage, they rarely state how much
energy is getting wasted when they are in
the standby mode. Devices like the kill-a-
watt energy usage monitor lets you see
exactly where your electricity (and money)
is going and helps you focus on reducing
energy wastage at home.
A close surveillance over domestic energy usage can
be done using an in-home display (IHD). This not only
helps to establish the initial level of consumption, but
also helps to set up a target for achieving the
negawatts. This is applicable equally for domestic,
industrial and commercial consumers. There are
equipments that can continuously monitor the level of
consumption and can give us a beep sound if the
pre-defined usage limits are crossed. The HAN
(Home Automation) technology help consumers stay
aware of the energy consumption and also lends a
helping hand while making decisions from remote
locations (Smart home application interfaces help
through a web browser or smart phones).
There are devices available in the market, like the kill-
a-watt energy usage monitor, which help identify
energy wastage. While most appliances are marked
with their wattage, they rarely state how much energy
is getting wasted when they are in the standby mode.
The kill-a-watt lets you see exactly where your
electricity (and money) is going and helps you focus
on reducing energy wastage at home. Thus, it can be
concluded that while metering plays its own role in
measuring energy consumption, monitoring helps to
identify the key areas of potential improvements.
Metering is one of the key aspects for monitoring
energy consumption, discovering wastages or
Page 14
met
erin
g a
nd m
onito
ring
– e
nab
ling
tech
nolo
gie
s to
del
iver
ene
rgy
effic
ienc
yJa
nu
ary
- M
arc
h 2
01
2a
qua
rterly
mag
azin
e of
the
soci
ety
of e
nerg
y en
gin
eers
and
man
ager
s / I
ndia
14
met
erin
g a
nd m
onito
ring
– e
nab
ling
tech
nolo
gie
s to
del
iver
ene
rgy
effic
ienc
yJa
nu
ary
- M
arc
h 2
01
2a
qua
rterly
mag
azin
e of
the
soci
ety
of e
nerg
y en
gin
eers
and
man
ager
s / I
ndia
15
inefficiencies, detecting power theft and carving out
energy usage patterns as well as for measuring the
energy being produced at various generating stations.
While metering has been traditionally employed to
help distribution utilities in billing their consumers, the
concept of energy metering has taken a leap in the
world of smart metering and smart grids. In today's
era, there are various underlying enabling
technologies that help us to take corrective measures
and shift consumption patterns to realize energy
efficiency. A few of these enabling technologies would
be discussed here, but before we delve further into
this topic, the approach to achieve energy efficiency
should be defined.
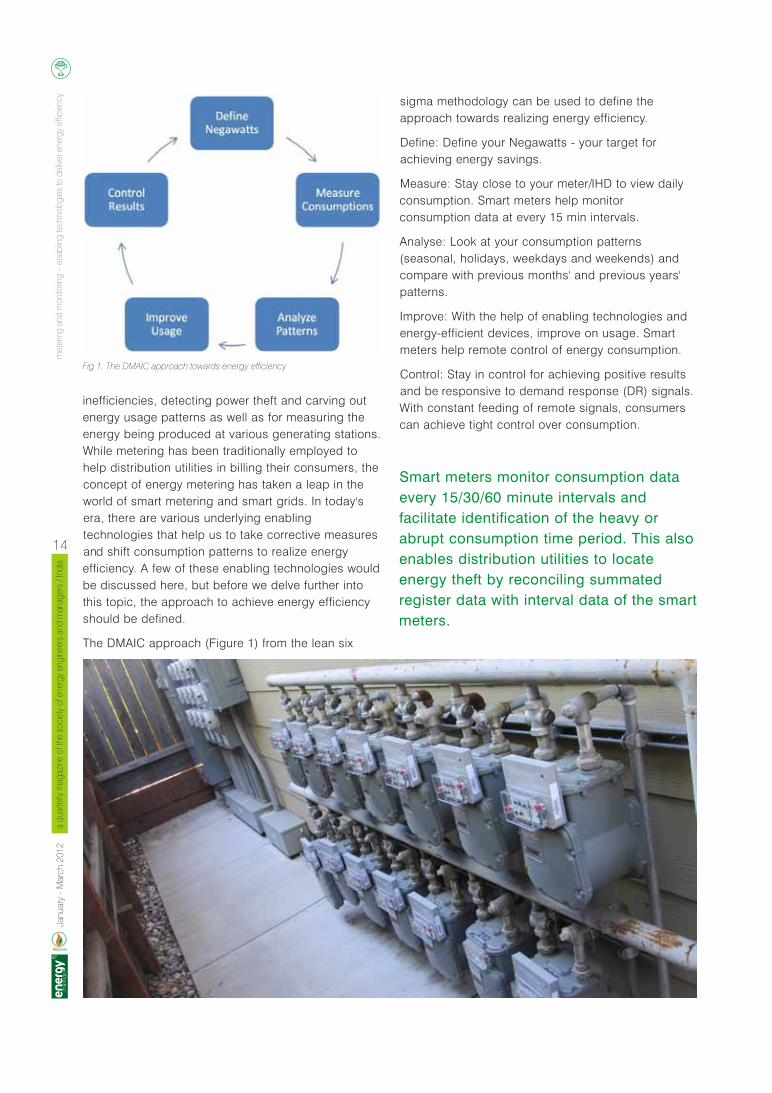
The DMAIC approach (Figure 1) from the lean six
sigma methodology can be used to define the
approach towards realizing energy efficiency.
Define: Define your Negawatts - your target for
achieving energy savings.
Measure: Stay close to your meter/IHD to view daily
consumption. Smart meters help monitor
consumption data at every 15 min intervals.
Analyse: Look at your consumption patterns
(seasonal, holidays, weekdays and weekends) and
compare with previous months' and previous years'
patterns.
Improve: With the help of enabling technologies and
energy-efficient devices, improve on usage. Smart
meters help remote control of energy consumption.
Control: Stay in control for achieving positive results
and be responsive to demand response (DR) signals.
With constant feeding of remote signals, consumers
can achieve tight control over consumption.
Smart meters monitor consumption data
every 15/30/60 minute intervals and
facilitate identification of the heavy or
abrupt consumption time period. This also
enables distribution utilities to locate
energy theft by reconciling summated
register data with interval data of the smart
meters.
Enabling Technologies (Distribution and Retail)
Monitoring your consumption at the most granular
levels requires AMI or smart metering in place. As
mentioned before, smart meters monitor consumption
data every 15-/30-/60-minute intervals and facilitate
identification of the heavy or abrupt consumption time
period. This also enables distribution utilities to locate
energy theft by reconciling summated register data
with interval data of the smart meters.
Along with AMI, HAN and demand response help in
monitoring real-time consumption, and utilities can
reap the benefits by sending signals to reduce energy
consumption during peak periods. Consumers can
remote control (ON/OFF/DIM) home appliances with
the HAN application interface in their smart devices
such as cell phones. One can also limit energy usage
with pre-configured algorithms or by taking ad hoc
decisions.
Data analytics/business intelligence is another area
that tremendously helps distribution utilities to
perform data mining on metered data and come up
with consumer consumption patterns. Utilities can
compare the usage data of specific consumers with
those of their peers and find out anomalies, which
generally indicate theft. Smart analytics also help
individuals to identify their abnormal or heavy
consumption periods/patterns, for example, times of
the day, specific days (festivals, functions) and so on,
and take necessary measures to reduce the usage.
They can also replace inefficient or ageing appliances
to gain more savings on bills by achieving energy
efficiency, which is also made possible by smart data
analytics.
Distribution utilities can go a step further to make
consumers save energy by opening energy innovation
centres, wherein the public can take a close look at
the latest options in lighting, heating, ventilation and
air-conditioning. Utilities can also help commercial
and industrial (C&I) consumers to bring in energy
audit experts who can offer valuable tips and
feedback to reduce their energy consumption
significantly.
Taking a look at the corporate sector in India and
abroad, data centres are mammoth consumers of
electricity. Energy consumption is a critical concern
for IT organizations worldwide as the cost of
operating data centers increases due to the growing
use of computing devices and rising energy costs. To
compound these factors, data centers that were
considered state of the art just 5 years ago are now
lagging behind in energy-efficient technologies. The
PUE metric allows data centres to make decisions
Fig 1. The DMAIC approach towards energy efficiency
Mr. Jasjeet Singh Hanjrah is a senior
consultant with Capgemini's EUC
Centre of Excellence and a member
of the Global Smart Energy Services
team. He has more than 6 years of
experience in the fields of smart
metering, smart grids, sustainable
utilities and smart cities. He has
previously worked for many utility
industry majors including HCL,
Siemens, ABB and Ferranti.
that increase efficiency, helping to achieve optimum
data centre facility utilization. To collect PUE data,
various items can be monitored for potential energy
savings, which include UPS and distribution losses, IT
load electrical energy utilization, total electrical energy
utilization by PAC units in the data centre, electrical
energy utilization for running make-up air units for the
data centre, electrical energy utilization for cooling
the UPS room, electrical energy utilization at the
chiller plant and energy utilization with respect to data
centre usage and the lighting load.
Based upon measurements and analysis, remedial
action can be taken which may include paralleling the
UPS to increase utilization levels, thereby increasing
efficiency and reducing distribution losses; increasing
the PAC temperature set point from 20 to 24 °C;
implementing humidity controls as needed; managing
airflow inside the data centre and managing the load
spread across the data centre floor.
There is a compelling need to achieve energy
efficiency, for which smart metering and smart
monitoring are essential aspects not only for
distribution utilities but for individual consumers as
well. Enabling technologies might be at our disposal,
but action has to be triggered by the human brain.
Awareness is the key, and definite measures need to
be taken to reap the benefits of existing technologies
by utilizing the possibilities of various media to reach
out to the consumers.
Relevant Websites
1- The Institute for Energy Efficiency
http://iee.ucsb.edu/
2- Tata Power http://www.tatapower.com/
3- http://www.intel.com
Enabling technologies might be at our
disposal, but action has to be triggered by
the human brain. Awareness is the key,
and definite measures need to be taken to
reap the benefits of existing technologies.
Page 15
met
erin
g a
nd m
onito
ring
– e
nab
ling
tech
nolo
gie
s to
del
iver
ene
rgy
effic
ienc
yJa
nu
ary
- M
arc
h 2
01
2a
qua
rterly
mag
azin
e of
the
soci
ety
of e
nerg
y en
gin
eers
and
man
ager
s / I
ndia
14
met
erin
g a
nd m
onito
ring
– e
nab
ling
tech
nolo
gie
s to
del
iver
ene
rgy
effic
ienc
yJa
nu
ary
- M
arc
h 2
01
2a
qua
rterly
mag
azin
e of
the
soci
ety
of e
nerg
y en
gin
eers
and
man
ager
s / I
ndia
15
inefficiencies, detecting power theft and carving out
energy usage patterns as well as for measuring the
energy being produced at various generating stations.
While metering has been traditionally employed to
help distribution utilities in billing their consumers, the
concept of energy metering has taken a leap in the
world of smart metering and smart grids. In today's
era, there are various underlying enabling
technologies that help us to take corrective measures
and shift consumption patterns to realize energy
efficiency. A few of these enabling technologies would
be discussed here, but before we delve further into
this topic, the approach to achieve energy efficiency
should be defined.
The DMAIC approach (Figure 1) from the lean six
sigma methodology can be used to define the
approach towards realizing energy efficiency.
Define: Define your Negawatts - your target for
achieving energy savings.
Measure: Stay close to your meter/IHD to view daily
consumption. Smart meters help monitor
consumption data at every 15 min intervals.
Analyse: Look at your consumption patterns
(seasonal, holidays, weekdays and weekends) and
compare with previous months' and previous years'
patterns.
Improve: With the help of enabling technologies and
energy-efficient devices, improve on usage. Smart
meters help remote control of energy consumption.
Control: Stay in control for achieving positive results
and be responsive to demand response (DR) signals.
With constant feeding of remote signals, consumers
can achieve tight control over consumption.
Smart meters monitor consumption data
every 15/30/60 minute intervals and
facilitate identification of the heavy or
abrupt consumption time period. This also
enables distribution utilities to locate
energy theft by reconciling summated
register data with interval data of the smart
meters.
Enabling Technologies (Distribution and Retail)
Monitoring your consumption at the most granular
levels requires AMI or smart metering in place. As
mentioned before, smart meters monitor consumption
data every 15-/30-/60-minute intervals and facilitate
identification of the heavy or abrupt consumption time
period. This also enables distribution utilities to locate
energy theft by reconciling summated register data
with interval data of the smart meters.
Along with AMI, HAN and demand response help in
monitoring real-time consumption, and utilities can
reap the benefits by sending signals to reduce energy
consumption during peak periods. Consumers can
remote control (ON/OFF/DIM) home appliances with
the HAN application interface in their smart devices
such as cell phones. One can also limit energy usage
with pre-configured algorithms or by taking ad hoc
decisions.
Data analytics/business intelligence is another area
that tremendously helps distribution utilities to
perform data mining on metered data and come up
with consumer consumption patterns. Utilities can
compare the usage data of specific consumers with
those of their peers and find out anomalies, which
generally indicate theft. Smart analytics also help
individuals to identify their abnormal or heavy
consumption periods/patterns, for example, times of
the day, specific days (festivals, functions) and so on,
and take necessary measures to reduce the usage.
They can also replace inefficient or ageing appliances
to gain more savings on bills by achieving energy
efficiency, which is also made possible by smart data
analytics.
Distribution utilities can go a step further to make
consumers save energy by opening energy innovation
centres, wherein the public can take a close look at
the latest options in lighting, heating, ventilation and
air-conditioning. Utilities can also help commercial
and industrial (C&I) consumers to bring in energy
audit experts who can offer valuable tips and
feedback to reduce their energy consumption
significantly.
Taking a look at the corporate sector in India and
abroad, data centres are mammoth consumers of
electricity. Energy consumption is a critical concern
for IT organizations worldwide as the cost of
operating data centers increases due to the growing
use of computing devices and rising energy costs. To
compound these factors, data centers that were
considered state of the art just 5 years ago are now
lagging behind in energy-efficient technologies. The
PUE metric allows data centres to make decisions
Fig 1. The DMAIC approach towards energy efficiency
Mr. Jasjeet Singh Hanjrah is a senior
consultant with Capgemini's EUC
Centre of Excellence and a member
of the Global Smart Energy Services
team. He has more than 6 years of
experience in the fields of smart
metering, smart grids, sustainable
utilities and smart cities. He has
previously worked for many utility
industry majors including HCL,
Siemens, ABB and Ferranti.
that increase efficiency, helping to achieve optimum
data centre facility utilization. To collect PUE data,
various items can be monitored for potential energy
savings, which include UPS and distribution losses, IT
load electrical energy utilization, total electrical energy
utilization by PAC units in the data centre, electrical
energy utilization for running make-up air units for the
data centre, electrical energy utilization for cooling
the UPS room, electrical energy utilization at the
chiller plant and energy utilization with respect to data
centre usage and the lighting load.
Based upon measurements and analysis, remedial
action can be taken which may include paralleling the
UPS to increase utilization levels, thereby increasing
efficiency and reducing distribution losses; increasing
the PAC temperature set point from 20 to 24 °C;
implementing humidity controls as needed; managing
airflow inside the data centre and managing the load
spread across the data centre floor.
There is a compelling need to achieve energy
efficiency, for which smart metering and smart
monitoring are essential aspects not only for
distribution utilities but for individual consumers as
well. Enabling technologies might be at our disposal,
but action has to be triggered by the human brain.
Awareness is the key, and definite measures need to
be taken to reap the benefits of existing technologies
by utilizing the possibilities of various media to reach
out to the consumers.
Relevant Websites
1- The Institute for Energy Efficiency
http://iee.ucsb.edu/
2- Tata Power http://www.tatapower.com/
3- http://www.intel.com
Enabling technologies might be at our
disposal, but action has to be triggered by
the human brain. Awareness is the key,
and definite measures need to be taken to
reap the benefits of existing technologies.
Page 16
in-c
ircui
t rel
iab
ility
of e
nerg
y m
eter
sJa
nu
ary
- M
arc
h 2
01
2a
qua
rterly
mag
azin
e of
the
soci
ety
of e
nerg
y en
gin
eers
and
man
ager
s / I
ndia
17
Jan
uary
- M
arc
h 2
01
2a
qua
rterly
mag
azin
e of
the
soci
ety
of e
nerg
y en
gin
eers
and
man
ager
s / I
ndia
16
in-circuit reliability of energy meters
Rajesh Nimare
Often, the root cause of poor reliability of
meters can be traced back to their poor
design or design with little or no head
room, compromise on component
selection and lack of controlled
manufacturing processes. The commonly
used procurement criterion of 'compliance
to metering standards', which prescribes
only the minimum requirements, does not
help in meter selection. This article
explains the impact of poor in-circuit
reliability of meters on customers and
utilit ies, explains the fundamentals of
reliability and concludes by helping
utilities to develop their own check list for
meter evaluation.
lectricity meters are ubiquitous in today's world Eand considering the importance of the electricity
they measure, it is absolutely necessary that they do
not fail. Unlike electro-mechanical meters, a well-
designed and well-manufactured electronic meter
generally does not wear out per se. But, in reality, the
percentage that fails exceeds 10% per year. Often,
the root cause of poor reliability of meters can be
traced back to their poor design or design with little
or no head room, compromise on component
selection and lack of controlled manufacturing
processes. The commonly used procurement criterion
of 'compliance to metering standards', which
prescribes only the minimum requirements, does not
help in meter selection. This article explains the
impact of poor in-circuit reliability of meters on
customers and the utility, explains the fundamentals
of reliability and concludes by helping utilities to
develop their own check list for meter evaluation.
Customer First
As an electricity customer, if you thought yourself
lucky if your meter is defective and you are getting a
zero-consumption or an average bill, think twice.
There is a bright chance that you will be levied a bill
in arrears to cover the billing based on average
consumption. This will be calculated based on the
maximum consumption measured in the 'window
months' after the meter is replaced. With consumption
increasing steadily, the arrears could run into several
tens of thousands of rupees. The duration for which
this charge would be levied will depend on whether
the new meter is installed after the 'season boundary'
and the time taken to change the meter. This leads to
a possibility of real-life disputes like, for example, if
Page 17
in-c
ircui
t rel
iab
ility
of e
nerg
y m
eter
sJa
nu
ary
- M
arc
h 2
01
2a
qua
rterly
mag
azin
e of
the
soci
ety
of e
nerg
y en
gin
eers
and
man
ager
s / I
ndia
17
Jan
uary
- M
arc
h 2
01
2a
qua
rterly
mag
azin
e of
the
soci
ety
of e
nerg
y en
gin
eers
and
man
ager
s / I
ndia
16
in-circuit reliability of energy meters
Rajesh Nimare
Often, the root cause of poor reliability of
meters can be traced back to their poor
design or design with little or no head
room, compromise on component
selection and lack of controlled
manufacturing processes. The commonly
used procurement criterion of 'compliance
to metering standards', which prescribes
only the minimum requirements, does not
help in meter selection. This article
explains the impact of poor in-circuit
reliability of meters on customers and
utilit ies, explains the fundamentals of
reliability and concludes by helping
utilities to develop their own check list for
meter evaluation.
lectricity meters are ubiquitous in today's world Eand considering the importance of the electricity
they measure, it is absolutely necessary that they do
not fail. Unlike electro-mechanical meters, a well-
designed and well-manufactured electronic meter
generally does not wear out per se. But, in reality, the
percentage that fails exceeds 10% per year. Often,
the root cause of poor reliability of meters can be
traced back to their poor design or design with little
or no head room, compromise on component
selection and lack of controlled manufacturing
processes. The commonly used procurement criterion
of 'compliance to metering standards', which
prescribes only the minimum requirements, does not
help in meter selection. This article explains the
impact of poor in-circuit reliability of meters on
customers and the utility, explains the fundamentals
of reliability and concludes by helping utilities to
develop their own check list for meter evaluation.
Customer First
As an electricity customer, if you thought yourself
lucky if your meter is defective and you are getting a
zero-consumption or an average bill, think twice.
There is a bright chance that you will be levied a bill
in arrears to cover the billing based on average
consumption. This will be calculated based on the
maximum consumption measured in the 'window
months' after the meter is replaced. With consumption
increasing steadily, the arrears could run into several
tens of thousands of rupees. The duration for which
this charge would be levied will depend on whether
the new meter is installed after the 'season boundary'
and the time taken to change the meter. This leads to
a possibility of real-life disputes like, for example, if
Page 18
in-c
ircui
t rel
iab
ility
of e
nerg
y m
eter
sJa
nu
ary
- M
arc
h 2
01
2a
qua
rterly
mag
azin
e of
the
soci
ety
of e
nerg
y en
gin
eers
and
man
ager
s / I
ndia
18
in-c
ircui
t rel
iab
ility
of e
nerg
y m
eter
sJa
nu
ary
- M
arc
h 2
01
2a
qua
rterly
mag
azin
e of
the
soci
ety
of e
nerg
y en
gin
eers
and
man
ager
s / I
ndia
19
you were away all the summer why should you pay
the hefty arrears and who will pay the arrears in case
of changed tenancy.
The Utility Too Suffers
On the flip side, the electricity distribution office in
your locality, whose primary job is to attend to outage
calls and line maintenance, with its aging workforce
and expanding customer base, has very few or no
resources for meter replacement. Replacing meters
involves a costly chain of back-office activities like
investment in meters; storage of meters under
standard, defined conditions; logistics; re-testing at
expensive meter test laboratories; warranty returns
and scrap management. At times, a meter defect like
a blown neutral results in a high voltage at the
customer's premises leading to burn-out of expensive
white goods. The aggrieved customer can sue the
utility and the already burdened utility engineers have
to attend court hearings, further worsening the
situation. Considering the present conservative
estimate of in-circuit meter failure of over 10% per
year, utilities are lucky if customers have thought of
improving meter reliability.
Who Loses?
What clearly emerges is that in-circuit failure of
electricity meters is a societal loss; its magnitude is
way higher than the cost of the meter or the electricity
it would have traded. Would you buy a local 'standard
compliant' music system or something of repute like
Sony when it is your money that is being spent?
Surely you would not want to build an electricity
infrastructure with unreliable meters that impact the
wider society. Utilities too realize the menace
associated with in-circuit failure of meters and try to
reduce their risk by a range of measures, for example,
demanding a prolonged warranty period (up to 10
years) to address the issue. However, such measures
have not yielded the expected results. Limited testing
facilities and technical specialists to establish the
cause of defects constrain utilities in making claims
At times, a meter defect like a blown
neutral results in a high voltage at the
customer's premises leading to burn-out
of expensive white goods. The aggrieved
customer can sue the utility and the
already burdened utility engineers have to
attend court hearings, further worsening
the situation.
under warranty. Therefore the question arises: can
utilities predict the performance of meters? Yes,
reliability engineering is all about that!
Need to Focus
Poor performance of meters causes customers to
lose trust in them and thus increases the liability a
utility faces. Hence, it is important that utilities create
a knowledge base on the reliability of metering assets
and use this knowledge for vendor evaluation and
meter procurement.
Utilities worldwide have identified in-circuit reliability
of meters as a key priority area (KPA) and have
created dedicated laboratories for evaluating
reliability, conducting failure analysis and running
sampling plans for meter procurement, a competitive
advantage. These plans are a well-kept secret.
The following sections review the fundamentals of
meter reliability, the vocabulary associated with it and
its measurement. Understanding an electronic meter's
block diagram should be a good starting point.
Components of an Energy Meter
The block diagram of an energy meter is shown in
Figure 1.
The key components of an energy meter that
determine its reliability are explained below:
Power supply
The power supply section comprises 35-40% of the
total component count in a meter, and its job is to
provide the regulated, low-voltage DC power needed
to drive the meter electronics. Being exposed to the
distribution network, the meter power supply has to
endure over/under voltage, sag/swell, transients,
resonance, switching surges and lightning impulses.
A meter reported 'dead' usually has the roots of its
failure in power supply failure, which accounts for
around 70% of all failures. Designers use high-
A meter reported 'dead' usually has the
roots of its failure in power supply failure,
which accounts for around 70% of all
cases. Designers use high-dissipation
resistors and voltage-clamping devices
such as pre-conditioners; however,
because they are costly and do not
directly add any value to compliance with
metering standards, this is often
neglected.
dissipation resistors and voltage-clamping devices
such as pre-conditioners; however, because they are
costly and do not directly add any value to
compliance with 'metering standards' (which define
the minimum criteria), this is often neglected.
Therefore, the entire power supply design continues
to be an area to examine while evaluating meter
reliability. There are two types of power supply used
in modern electronic meters: capacitor-based linear
power supply and switch mode power supply (SMPS).
Capacitor-based supplies use a capacitor divider
network to drop the input voltage (230 V) to a usable
value. An input capacitor, which experiences the
maximum stress, is the critical component in such
power supplies, and its rating (temperature, voltage)
determines the reliability of such meters. Utilities,
during procurement, should insist on the design
analysis of each component under stress.
Switch mode power supply (SMPS) is used in
advanced meters, which have higher power supply
requirements. In such designs, the supply voltage is
rectified, filtered and then switched to a high
frequency (to minimize transformer size) to create the
required low voltage which is further rectified and
filtered for powering up the meter. As the power
supply in the first stage is exposed to the electricity
supply, its endurance against voltage variation,
spikes, transients, dips and surges determines the
reliability of the energy meter.
Voltage transducer
Often a simple resistive divider is used to step down
the mains voltage to a measurable range. As the
long-term performance of the voltage divider depends
upon the selection of the resistor used, the utility
should critically examine this component to ensure
long-term performance.
Current transducer
Modern meters use either a miniature current
transformer or a shunt to step down the load current.
As the entire load current flows through the
transducer, the integrity of the current circuit is
important; it is important to take into consideration its
endurance during overload and short circuit. Often,
the no-power symbol appearing in a meter is due to
burning of the meter bus bar. As the current
transformer provides natural isolation between the
mains and the measurement circuit, its insulation
design should be examined for reliability. For designs
using a shunt as the current transducer, the method
of handling line surges and the transient load caused
by modern gadgets should be critically examined
during design evaluation.
Display
In modern meters, the display is invariably a liquid
crystal display (LCD); its performance depends upon
its specifications like tolerance to humidity and
temperature variation.
Real time clock (RTC)
The meter needs a battery backup to maintain the
clock running during transportation and power
outages. Usually the battery used for clock backup is
specified for performance during the off-power mode,
running to typically 2-4 years, and the shelf life of the
battery, which determines the product life. A utility
should evaluate the design of the RTC backup battery
to ensure that the meter is going to perform for the
committed duration. Derating the labelled
milliamperehour (mA-hr) of the battery is essential, as
there is a native variation of ±15% of its capacity
owing to the influence of ambient temperature.
Understanding Meter Performance: The 'Bathtub
Curve’
Over many years, and across a wide variety of
mechanical and electronic components and systems,
people have calculated empirical population failure
rates as the units age over time and have repeatedly
obtained a graph such as the one shown in Figure 2.
Because of the shape of this failure rate curve, it has
become widely known as the 'bathtub' curve.
Supply conditioning Power supply
Clock
Battery
Signal conditioning
Voltage transducer
Current transducer
Measurement
Display LCD
Storage (Memory)
Signal
Supply
conditioning
Fig 1. Block Diagram of an Energy Meter
Page 19
in-c
ircui
t rel
iab
ility
of e
nerg
y m
eter
sJa
nu
ary
- M
arc
h 2
01
2a
qua
rterly
mag
azin
e of
the
soci
ety
of e
nerg
y en
gin
eers
and
man
ager
s / I
ndia
18
in-c
ircui
t rel
iab
ility
of e
nerg
y m
eter
sJa
nu
ary
- M
arc
h 2
01
2a
qua
rterly
mag
azin
e of
the
soci
ety
of e
nerg
y en
gin
eers
and
man
ager
s / I
ndia
19
you were away all the summer why should you pay
the hefty arrears and who will pay the arrears in case
of changed tenancy.
The Utility Too Suffers
On the flip side, the electricity distribution office in
your locality, whose primary job is to attend to outage
calls and line maintenance, with its aging workforce
and expanding customer base, has very few or no
resources for meter replacement. Replacing meters
involves a costly chain of back-office activities like
investment in meters; storage of meters under
standard, defined conditions; logistics; re-testing at
expensive meter test laboratories; warranty returns
and scrap management. At times, a meter defect like
a blown neutral results in a high voltage at the
customer's premises leading to burn-out of expensive
white goods. The aggrieved customer can sue the
utility and the already burdened utility engineers have
to attend court hearings, further worsening the
situation. Considering the present conservative
estimate of in-circuit meter failure of over 10% per
year, utilities are lucky if customers have thought of
improving meter reliability.
Who Loses?
What clearly emerges is that in-circuit failure of
electricity meters is a societal loss; its magnitude is
way higher than the cost of the meter or the electricity
it would have traded. Would you buy a local 'standard
compliant' music system or something of repute like
Sony when it is your money that is being spent?
Surely you would not want to build an electricity
infrastructure with unreliable meters that impact the
wider society. Utilities too realize the menace
associated with in-circuit failure of meters and try to
reduce their risk by a range of measures, for example,
demanding a prolonged warranty period (up to 10
years) to address the issue. However, such measures
have not yielded the expected results. Limited testing
facilities and technical specialists to establish the
cause of defects constrain utilities in making claims
At times, a meter defect like a blown
neutral results in a high voltage at the
customer's premises leading to burn-out
of expensive white goods. The aggrieved
customer can sue the utility and the
already burdened utility engineers have to
attend court hearings, further worsening
the situation.
under warranty. Therefore the question arises: can
utilities predict the performance of meters? Yes,
reliability engineering is all about that!
Need to Focus
Poor performance of meters causes customers to
lose trust in them and thus increases the liability a
utility faces. Hence, it is important that utilities create
a knowledge base on the reliability of metering assets
and use this knowledge for vendor evaluation and
meter procurement.
Utilities worldwide have identified in-circuit reliability
of meters as a key priority area (KPA) and have
created dedicated laboratories for evaluating
reliability, conducting failure analysis and running
sampling plans for meter procurement, a competitive
advantage. These plans are a well-kept secret.
The following sections review the fundamentals of
meter reliability, the vocabulary associated with it and
its measurement. Understanding an electronic meter's
block diagram should be a good starting point.
Components of an Energy Meter
The block diagram of an energy meter is shown in
Figure 1.
The key components of an energy meter that
determine its reliability are explained below:
Power supply
The power supply section comprises 35-40% of the
total component count in a meter, and its job is to
provide the regulated, low-voltage DC power needed
to drive the meter electronics. Being exposed to the
distribution network, the meter power supply has to
endure over/under voltage, sag/swell, transients,
resonance, switching surges and lightning impulses.
A meter reported 'dead' usually has the roots of its
failure in power supply failure, which accounts for
around 70% of all failures. Designers use high-
A meter reported 'dead' usually has the
roots of its failure in power supply failure,
which accounts for around 70% of all
cases. Designers use high-dissipation
resistors and voltage-clamping devices
such as pre-conditioners; however,
because they are costly and do not
directly add any value to compliance with
metering standards, this is often
neglected.
dissipation resistors and voltage-clamping devices
such as pre-conditioners; however, because they are
costly and do not directly add any value to
compliance with 'metering standards' (which define
the minimum criteria), this is often neglected.
Therefore, the entire power supply design continues
to be an area to examine while evaluating meter
reliability. There are two types of power supply used
in modern electronic meters: capacitor-based linear
power supply and switch mode power supply (SMPS).
Capacitor-based supplies use a capacitor divider
network to drop the input voltage (230 V) to a usable
value. An input capacitor, which experiences the
maximum stress, is the critical component in such
power supplies, and its rating (temperature, voltage)
determines the reliability of such meters. Utilities,
during procurement, should insist on the design
analysis of each component under stress.
Switch mode power supply (SMPS) is used in
advanced meters, which have higher power supply
requirements. In such designs, the supply voltage is
rectified, filtered and then switched to a high
frequency (to minimize transformer size) to create the
required low voltage which is further rectified and
filtered for powering up the meter. As the power
supply in the first stage is exposed to the electricity
supply, its endurance against voltage variation,
spikes, transients, dips and surges determines the
reliability of the energy meter.
Voltage transducer
Often a simple resistive divider is used to step down
the mains voltage to a measurable range. As the
long-term performance of the voltage divider depends
upon the selection of the resistor used, the utility
should critically examine this component to ensure
long-term performance.
Current transducer
Modern meters use either a miniature current
transformer or a shunt to step down the load current.
As the entire load current flows through the
transducer, the integrity of the current circuit is
important; it is important to take into consideration its
endurance during overload and short circuit. Often,
the no-power symbol appearing in a meter is due to
burning of the meter bus bar. As the current
transformer provides natural isolation between the
mains and the measurement circuit, its insulation
design should be examined for reliability. For designs
using a shunt as the current transducer, the method
of handling line surges and the transient load caused
by modern gadgets should be critically examined
during design evaluation.
Display
In modern meters, the display is invariably a liquid
crystal display (LCD); its performance depends upon
its specifications like tolerance to humidity and
temperature variation.
Real time clock (RTC)
The meter needs a battery backup to maintain the
clock running during transportation and power
outages. Usually the battery used for clock backup is
specified for performance during the off-power mode,
running to typically 2-4 years, and the shelf life of the
battery, which determines the product life. A utility
should evaluate the design of the RTC backup battery
to ensure that the meter is going to perform for the
committed duration. Derating the labelled
milliamperehour (mA-hr) of the battery is essential, as
there is a native variation of ±15% of its capacity
owing to the influence of ambient temperature.
Understanding Meter Performance: The 'Bathtub
Curve’
Over many years, and across a wide variety of
mechanical and electronic components and systems,
people have calculated empirical population failure
rates as the units age over time and have repeatedly
obtained a graph such as the one shown in Figure 2.
Because of the shape of this failure rate curve, it has
become widely known as the 'bathtub' curve.
Supply conditioning Power supply
Clock
Battery
Signal conditioning
Voltage transducer
Current transducer
Measurement
Display LCD
Storage (Memory)
Signal
Supply
conditioning
Fig 1. Block Diagram of an Energy Meter
Page 20
Zone I - the burn-in period
The rapidly declining part of the curve, referred to as
the burn-in period or infant mortality stage, is
characterized by failures due to inherent component
weaknesses and manufacturing defects. This relates
to the practical observations with new energy meters,
where there is a surge of complaints of meter failing
within a few months of meter installation. With the
passage of time, the failure rate drops. Given that this
is the predicted behaviour, quality meter
manufacturers follow 'burn-in' processes, where
selected components and circuit cards go through a
burn-in in the factory before they are integrated into
the product. In essence, the infant mortality, which is
inevitable, should be precipitated and created before
supply to the utilities to prevent expensive in-circuit
failure. Utilities should include an evaluation of the
manufacturing technique as part of their tender
evaluation programme.
Value-conscious utilities realize the importance of the
manufacturing process (which cannot be measured
by metering standard compliance alone); hence they
run a dedicated 'vendor manufacturing capability
evaluation programme'. A series of open-ended
questionnaires are sent to the prospective vendors.
The qualification based on the written statement is
followed by an inspection of the factory, where the
processes, facilities, quality of people, in-work quality
test plan and in-circuit failure figures (past) are
audited. Often utilities seek the assistance of industry
experts in the field of manufacturing, reliability and
QC to frame the entire vendor evaluation programme
so that society gets the bang for its buck.
Zone II - useful life stage
This stage is characterized by a constant failure rate
due to random failures. There are techniques
available to predict the constant failure rate, and
utilities should demand their prediction model from
meter vendors as part of their procurement process.
Before going for a large procurement, a utility should
verify the performance on a small pilot quantity. There
are third-party specialist companies that provide such
evaluation services; however, considering continuity
of business, it is important that utilities develop their
own reliability assessment facility.
Zone III - Wear out period
This stage is characterized by an increasing failure
rate because of meter aging and meter deterioration.
Because modern electronic meters are largely made
up of semiconductor devices that have no real short-
term wear-out mechanism, the existence of a Zone III
for electronic systems is a sort of grey area. Usually
this area refers to the failing of batteries and fading of
the LCD. For most electronic components, Zone III is
relatively flat.
Reliability Prediction Modeling
There is a variety of reliability prediction modeling
techniques, which are classified into five main
categories such as Similar Equipment Technique,
Similar Complexity Technique, Prediction by Function
Technique, Part Count Technique and Stress Analysis
Technique. Utilities should focus on the details of
each technique and its applicability during reliability
assessment.
Accelerated life cycle test
Highly accelerated life test (HALT) is a stress test for
assessing product reliability. It is commonly applied
to electronic equipment and is performed to identify
design weaknesses in equipment. Thus it reduces to
a large extent the probability of in-service failures.
Progressively more severe environmental stresses are
Progressively severe environmental
stresses are applied, building up to a level
significantly beyond what the equipment
will see in-service. By this method,
weaknesses can be identified using a
small number of samples in the shortest
possible time and at the least expense.
applied building up to a level significantly beyond
what the equipment will see in-service. By this
method, weaknesses can be identified using a small
number of samples (sometimes one or two, but
preferably at least five) in the shortest possible time
and at the least expense. A second function of HALT
is that it characterizes the equipment under test and
identifies the equipment's safe operating limits and
design margins. Data from HALT are therefore used
as a basis for the design of an optimal HASS or ESS
test, which is used to screen every piece of
production equipment for latent manufacturing
defects and defective components. HASS (or highly
accelerated stress screening) is an extension of HALT,
but is applied during production.
There are a number of reasons why the electricity
meter reliability is an important attribute for the utility,
including
A utility's reputation is very closely
related to the reliability of its installations. The more
reliable a meter is, the more likely the utility is to have
a favourable reputation.
High reliability is a
mandatory requirement for customer satisfaction.
While a reliable meter may not dramatically affect
customer satisfaction in a positive manner, an
unreliable meter is sure to affect customer
satisfaction negatively.
The replacement and repair costs
will negatively affect profits, as well as attracting
unwanted negative attention. Introducing reliability
analysis is an important step in taking corrective
action.
The life cycle cost analysis can prove
that even if one vendor's initial cost of purchase might
be higher, the overall lifetime cost is lower than a
competitor's because the former's meter requires
fewer repairs or less maintenance.
With competition in the
utility business, utilities worldwide publish their
predicted reliability numbers to help gain an
advantage over their competition who either do not
publish their numbers or have lower numbers.
Reputation:
Customer Satisfaction:
Warranty Costs:
Cost Analysis:
Competitive Advantage:
Mr. Rajesh Nimare is DGM,
Business Development with
Secure Meters Ltd. He is a
Certified Energy Auditor with
19+ years of experience in the
metering domain and has
closely involved in projects
like pre-payment electricity
metering system for Brunei
and AMI development project.
Fig 2. The 'Bathtub' Curve Depicting Failure Rate of Energy Meters over Time
Typical to a discussion of reliability is the concept of
the bathtub curve. As shown in Figure 2, the curve
can be broken up into three portions.
There is a surge of complaints of meter
failing within a few months of installation.
With the passage of time, the failure rate
drops. Given that this is the predicted
behaviour, quality meter manufacturers
follow 'burn-in' processes, where selected
components and circuit cards go through
a burn-in in the factory before they are
integrated into the product.
in-c
ircui
t rel
iab
ility
of e
nerg
y m
eter
sJa
nu
ary
- M
arc
h 2
01
2a
qua
rterly
mag
azin
e of
the
soci
ety
of e
nerg
y en
gin
eers
and
man
ager
s / I
ndia
20
in-c
ircui
t rel
iab
ility
of e
nerg
y m
eter
sJa
nu
ary
- M
arc
h 2
01
2a
qua
rterly
mag
azin
e of
the
soci
ety
of e
nerg
y en
gin
eers
and
man
ager
s / I
ndia
21
Page 21
Zone I - the burn-in period
The rapidly declining part of the curve, referred to as
the burn-in period or infant mortality stage, is
characterized by failures due to inherent component
weaknesses and manufacturing defects. This relates
to the practical observations with new energy meters,
where there is a surge of complaints of meter failing
within a few months of meter installation. With the
passage of time, the failure rate drops. Given that this
is the predicted behaviour, quality meter
manufacturers follow 'burn-in' processes, where
selected components and circuit cards go through a
burn-in in the factory before they are integrated into
the product. In essence, the infant mortality, which is
inevitable, should be precipitated and created before
supply to the utilities to prevent expensive in-circuit
failure. Utilities should include an evaluation of the
manufacturing technique as part of their tender
evaluation programme.
Value-conscious utilities realize the importance of the
manufacturing process (which cannot be measured
by metering standard compliance alone); hence they
run a dedicated 'vendor manufacturing capability
evaluation programme'. A series of open-ended
questionnaires are sent to the prospective vendors.
The qualification based on the written statement is
followed by an inspection of the factory, where the
processes, facilities, quality of people, in-work quality
test plan and in-circuit failure figures (past) are
audited. Often utilities seek the assistance of industry
experts in the field of manufacturing, reliability and
QC to frame the entire vendor evaluation programme
so that society gets the bang for its buck.
Zone II - useful life stage
This stage is characterized by a constant failure rate
due to random failures. There are techniques
available to predict the constant failure rate, and
utilities should demand their prediction model from
meter vendors as part of their procurement process.
Before going for a large procurement, a utility should
verify the performance on a small pilot quantity. There
are third-party specialist companies that provide such
evaluation services; however, considering continuity
of business, it is important that utilities develop their
own reliability assessment facility.
Zone III - Wear out period
This stage is characterized by an increasing failure
rate because of meter aging and meter deterioration.
Because modern electronic meters are largely made
up of semiconductor devices that have no real short-
term wear-out mechanism, the existence of a Zone III
for electronic systems is a sort of grey area. Usually
this area refers to the failing of batteries and fading of
the LCD. For most electronic components, Zone III is
relatively flat.
Reliability Prediction Modeling
There is a variety of reliability prediction modeling
techniques, which are classified into five main
categories such as Similar Equipment Technique,
Similar Complexity Technique, Prediction by Function
Technique, Part Count Technique and Stress Analysis
Technique. Utilities should focus on the details of
each technique and its applicability during reliability
assessment.
Accelerated life cycle test
Highly accelerated life test (HALT) is a stress test for
assessing product reliability. It is commonly applied
to electronic equipment and is performed to identify
design weaknesses in equipment. Thus it reduces to
a large extent the probability of in-service failures.
Progressively more severe environmental stresses are
Progressively severe environmental
stresses are applied, building up to a level
significantly beyond what the equipment
will see in-service. By this method,
weaknesses can be identified using a
small number of samples in the shortest
possible time and at the least expense.
applied building up to a level significantly beyond
what the equipment will see in-service. By this
method, weaknesses can be identified using a small
number of samples (sometimes one or two, but
preferably at least five) in the shortest possible time
and at the least expense. A second function of HALT
is that it characterizes the equipment under test and
identifies the equipment's safe operating limits and
design margins. Data from HALT are therefore used
as a basis for the design of an optimal HASS or ESS
test, which is used to screen every piece of
production equipment for latent manufacturing
defects and defective components. HASS (or highly
accelerated stress screening) is an extension of HALT,
but is applied during production.
There are a number of reasons why the electricity
meter reliability is an important attribute for the utility,
including
A utility's reputation is very closely
related to the reliability of its installations. The more
reliable a meter is, the more likely the utility is to have
a favourable reputation.
High reliability is a
mandatory requirement for customer satisfaction.
While a reliable meter may not dramatically affect
customer satisfaction in a positive manner, an
unreliable meter is sure to affect customer
satisfaction negatively.
The replacement and repair costs
will negatively affect profits, as well as attracting
unwanted negative attention. Introducing reliability
analysis is an important step in taking corrective
action.
The life cycle cost analysis can prove
that even if one vendor's initial cost of purchase might
be higher, the overall lifetime cost is lower than a
competitor's because the former's meter requires
fewer repairs or less maintenance.
With competition in the
utility business, utilities worldwide publish their
predicted reliability numbers to help gain an
advantage over their competition who either do not
publish their numbers or have lower numbers.
Reputation:
Customer Satisfaction:
Warranty Costs:
Cost Analysis:
Competitive Advantage:
Mr. Rajesh Nimare is DGM,
Business Development with
Secure Meters Ltd. He is a
Certified Energy Auditor with
19+ years of experience in the
metering domain and has
closely involved in projects
like pre-payment electricity
metering system for Brunei
and AMI development project.
Fig 2. The 'Bathtub' Curve Depicting Failure Rate of Energy Meters over Time
Typical to a discussion of reliability is the concept of
the bathtub curve. As shown in Figure 2, the curve
can be broken up into three portions.
There is a surge of complaints of meter
failing within a few months of installation.
With the passage of time, the failure rate
drops. Given that this is the predicted
behaviour, quality meter manufacturers
follow 'burn-in' processes, where selected
components and circuit cards go through
a burn-in in the factory before they are
integrated into the product.
in-c
ircui
t rel
iab
ility
of e
nerg
y m
eter
sJa
nu
ary
- M
arc
h 2
01
2a
qua
rterly
mag
azin
e of
the
soci
ety
of e
nerg
y en
gin
eers
and
man
ager
s / I
ndia
20
in-c
ircui
t rel
iab
ility
of e
nerg
y m
eter
sJa
nu
ary
- M
arc
h 2
01
2a
qua
rterly
mag
azin
e of
the
soci
ety
of e
nerg
y en
gin
eers
and
man
ager
s / I
ndia
21
Page 22
Jan
uary
- M
arc
h 2
01
2a
qua
rterly
mag
azin
e of
the
soci
ety
of e
nerg
y en
gin
eers
and
man
ager
s / I
ndia
23
Jan
uary
- M
arc
h 2
01
2a
qua
rterly
mag
azin
e of
the
soci
ety
of e
nerg
y en
gin
eers
and
man
ager
s / I
ndia
22
hen Tektronix, a $1.1 billion global leader in Wtest, measurement and monitoring
instrumentation, scheduled a three-day energy audit,
Facilities and General Services Manager Joe Ohama
was pretty sure his groups would find opportunities to
save money. But he was surprised where they found
them. After participating in an energy audit at a sister
company that uncovered $365K in potential savings
from energy conservation and waste management
improvements, Ohama moved fast to schedule the
Tektronix audit.
"I looked at what it took to do the ‘kaizen,'" Ohama
said. "I had pretty much what I needed to do this in-
house and with Linc Facility Services, our facility
maintenance provider."
Tektronix had already been approached by Portland
General, its local utility, which was pulling together an
Industrial Energy Initiative through the Energy Trust of
Oregon, led by Strategic Energy Group. The goal was
to encourage 12 Oregon companies to come together
to share best practices related to industrial energy
usage. Ohama invited the group to be part of the
audit team, along with campus tenants.
In all, about 25 people assembled in Beaverton,
Oregon, for the three-day exercise. The group divided
into two teams-one to focus on electrical usage, one
hot and coldrunning savingsFluke
Energy audits do help in
finding opportunities to
save money, but it can
sometimes be surprising to
see where the audit team
finds these opportunities.
This article shows how
Tektronix, a global leader in
measurement and
monitoring instrumentation
discovered $510K in utility
savings in just three days.
The top areas of saving
included shutting down the
boiler in summer, foregoing
summer lawn watering,
turning off the fountain,
resetting chilled water to 45
°F and switching off PCs
during off hours.
charged with analyzing natural gas, water, waste and
everything else. Using a corporate energy audit
system for consistency, 72 hours later they had
identified $510K in estimated annual savings, with a
one-time investment of $233K. $378K of that annual
amount is possible in 2009. "We followed the audit
process, which breaks down all the different utilities,
and we focused in from there," Ohama says. "It's a
matter of looking at things on paper and going out
into the plant. It's a top down/bottom up approach."
Where they looked
This wasn't Tektronix's first energy audit, so some
easy areas of improvement that many companies find
had already been taken care of. "One of the biggest
things typically is lighting. We had done a lot of
lighting retrofits some time ago, so we didn't find as
much opportunity there." Even so, by updating a few
parts of their lighting management system and
hanging the settings, they still managed to identify an
additional $30K in annual savings. Where they did
find substantial savings was in their hot and chilled
water systems. "We're looking at actually shutting
down the boilers in the summertime," Ohama says.
"We have always run boilers and chillers 24/7. Now
we're doing some modifications that will allow us to
shut the boilers down in certain months, saving
Page 23
Jan
uary
- M
arc
h 2
01
2a
qua
rterly
mag
azin
e of
the
soci
ety
of e
nerg
y en
gin
eers
and
man
ager
s / I
ndia
23
Jan
uary
- M
arc
h 2
01
2a
qua
rterly
mag
azin
e of
the
soci
ety
of e
nerg
y en
gin
eers
and
man
ager
s / I
ndia
22
hen Tektronix, a $1.1 billion global leader in Wtest, measurement and monitoring
instrumentation, scheduled a three-day energy audit,
Facilities and General Services Manager Joe Ohama
was pretty sure his groups would find opportunities to
save money. But he was surprised where they found
them. After participating in an energy audit at a sister
company that uncovered $365K in potential savings
from energy conservation and waste management
improvements, Ohama moved fast to schedule the
Tektronix audit.
"I looked at what it took to do the ‘kaizen,'" Ohama
said. "I had pretty much what I needed to do this in-
house and with Linc Facility Services, our facility
maintenance provider."
Tektronix had already been approached by Portland
General, its local utility, which was pulling together an
Industrial Energy Initiative through the Energy Trust of
Oregon, led by Strategic Energy Group. The goal was
to encourage 12 Oregon companies to come together
to share best practices related to industrial energy
usage. Ohama invited the group to be part of the
audit team, along with campus tenants.
In all, about 25 people assembled in Beaverton,
Oregon, for the three-day exercise. The group divided
into two teams-one to focus on electrical usage, one
hot and coldrunning savingsFluke
Energy audits do help in
finding opportunities to
save money, but it can
sometimes be surprising to
see where the audit team
finds these opportunities.
This article shows how
Tektronix, a global leader in
measurement and
monitoring instrumentation
discovered $510K in utility
savings in just three days.
The top areas of saving
included shutting down the
boiler in summer, foregoing
summer lawn watering,
turning off the fountain,
resetting chilled water to 45
°F and switching off PCs
during off hours.
charged with analyzing natural gas, water, waste and
everything else. Using a corporate energy audit
system for consistency, 72 hours later they had
identified $510K in estimated annual savings, with a
one-time investment of $233K. $378K of that annual
amount is possible in 2009. "We followed the audit
process, which breaks down all the different utilities,
and we focused in from there," Ohama says. "It's a
matter of looking at things on paper and going out
into the plant. It's a top down/bottom up approach."
Where they looked
This wasn't Tektronix's first energy audit, so some
easy areas of improvement that many companies find
had already been taken care of. "One of the biggest
things typically is lighting. We had done a lot of
lighting retrofits some time ago, so we didn't find as
much opportunity there." Even so, by updating a few
parts of their lighting management system and
hanging the settings, they still managed to identify an
additional $30K in annual savings. Where they did
find substantial savings was in their hot and chilled
water systems. "We're looking at actually shutting
down the boilers in the summertime," Ohama says.
"We have always run boilers and chillers 24/7. Now
we're doing some modifications that will allow us to
shut the boilers down in certain months, saving
Page 24
hot a
nd c
old
runn
ing
sav
ing
sJa
nu
ary
- M
arc
h 2
01
2a
qua
rterly
mag
azin
e of
the
soci
ety
of e
nerg
y en
gin
eers
and
man
ager
s / I
ndia
24
natural gas." Instead of keeping the plant's boilers
fired up, Ohama's group plans to switch to localized
hot water tank systems capable of running targeted
smaller applications. Annual savings-$133K "One of
the biggest audit findings was the benefit of pulling in
people from our different user groups," he says.
"Manufacturing, engineering-getting everyone in the
room at the same time. For example, we've always
run compressed air at 110 pounds. We thought our
users needed that much. But our users said, 'We
really only need 100 pounds.' Annual savings-$7K. We
did the same thing with chilled water for
environmental and machinery cooling, going from
43.5 °F to 45 °F." Annual savings-$20K. No area was
overlooked. Foregoing the company's fountain saves
$45K; not watering the grass in the summer saves
$48K. Optimizing and calibrating air handlers garners
$9K; resizing the exhaust fan saves $15K, replacing
cafeteria spray nozzles saves $2K.
How they did it
If many of Ohama's biggest savings came from
comparing supply vs. demand, many other
incremental savings came from tried-and-true best
practices.
w Ohama tracks power consumption by building per
day and tracks consumption on specific loads with
individual power loggers. This both identifies and
confirms energy savings.
- In particular, the teams identified an opportunity to
reduce kWh used by the cooling tower, by adding a
VFD. The VFD will drive the cooling towers in
accordance with load demand, at an annual
savings of $39K.
- Running a power logger on the air compressor
mentioned above allowed the team to calculate
how much they would save from a 10-pound
compression reduction.
- The team surveyed kWh consumption at multiple
motors and VFDs and calculated ROI gains from
modulating operation, instead of running at 100 %.
w Identifying new opportunities to optimize air
handlers. By incorporating some new tuning
procedures into the existing preventive
maintenance schedule and evaluating the
percentage of outside air being conditioned,
Ohama's team hopes to save an additional $18K
annually.
w The team will also optimize the Central Plant
Operations (CPO) chiller, saving $2.6K. To do this,
the team increased parameters on the chiller
controls, so they could stage down to the small
chiller and still carry the load at 45 degrees.
They'll stay this course until the chilled water flow
demand increases in the summer.
- Using thermal imagers, the team surveyed their
buildings for thermal loss, air leaks, and vent leaks,
turning up $3k of annual savings opportunities.
- They also used thermal imagers to scan electrical
panels, looking for hot spots that could indicate
high resistance or connector malfunctions that
manifest as wasted heat energy.
- This summer the team is considering raising indoor
building temperatures from the previous standard
72 °F to a higher 77 °F. Doing this will require
resetting building temperature sensors and
controls, using the building management system,
and conducting ambient air temperature
measurements.
Off and running
Tektronix Chief Financial Officer Chuck McLaughlin
was pleased with the results of the energy audit. "Joe
and the team took the time to set themselves up for
success, brought the right people together and asked
the tough questions. Their results will serve as a great
stretch goal for other companies as the energy audits
continue." Identifying $510K of estimated annual
savings is a solid accomplishment for three days of
focus. But Ohama's work isn't done. In the coming
months, Ohama will be helping other companies run
similar energy audits. Who knows what they'll find-or
where they'll find it.
Page 25
Jan
uary
- M
arc
h 2
01
2a
qua
rterly
mag
azin
e of
the
soci
ety
of e
nerg
y en
gin
eers
and
man
ager
s / I
ndia
25free cooling: an energy
conservationmeasure
Balbir Singh and V K Sethi
The free-cooling concept has been
successfully implemented in
around 90 AC plants in BSNL,
Haryana, and has resulted in
considerable reduction in energy
consumption. The switch
room/equipment room in telephone
exchanges is cooled by pumping
cold air from outside through the
AC plant aided by the blowers of
package AC units.
Page 26
free
cool
ing
: an
ener
gy
cons
erva
tion
mea
sure
Jan
uary
- M
arc
h 2
01
2a
qua
rterly
mag
azin
e of
the
soci
ety
of e
nerg
y en
gin
eers
and
man
ager
s / I
ndia
26
free
cool
ing
: an
ener
gy
cons
erva
tion
mea
sure
Jan
uary
- M
arc
h 2
01
2a
qua
rterly
mag
azin
e of
the
soci
ety
of e
nerg
y en
gin
eers
and
man
ager
s / I
ndia
27
ajority of air-conditioning systems are based on Mthe re-circulated air system, in which
irrespective of the outside ambient conditions, the
conditioned space/equipment area is to be
maintained at the desired temperature level. The
required fresh air and return air are cooled by
refrigeration compressors. All telephone exchanges,
big and small, function under controlled conditions
and are air conditioned. The temperature is required
to be maintained at a certain level throughout the
year. Major exchanges are temperature sensitive, and
temperature is required to be maintained in the range
of 23 ± 3°C. There are around 100 air-conditioning
plants in BSNL exchanges in the state of Haryana,
and the capacity of these plants normally ranges from
21 TR to 50 TR; the majority being of 21 TR. Air-
conditioning plants are bulk consumers of energy,
and there exists a great potential for energy
conservation. It is to be noted that even a decrease of
indoor temperature by 1°C results in an increase of
energy consumption by 4%.
The Concept
In northern India the outdoor temperature during
winter (November to February) is quite low. Such
favourable outside conditions can be utilized for
maintaining the switch room/equipment room
temperature by pumping cold air from the outside into
the equipment room through the plant room by
running the blowers of package AC units. This
concept is known as free cooling. The normal
temperature of the cool air at the canvas connection
of a package AC unit is 13-14°C. So, when the
outside temp is <14°C, then no package AC unit is
required to be run. When the outside temperature is
even up to 20°C, the temperature in the switch
room/equipment room can be maintained by pumping
more air.
Design and Methodology
wThe air flow (in cubic feet per minute, CFM)
requirement for free cooling for a particular AC
plant is calculated on the basis of average running
of the number of AC package units during the
The normal temperature of the cooled air
at the canvas connection of a package AC
unit is 13-14°C. When the outside temp is
<14°C, no package AC unit is required to
be run.
winter season; for example, one package unit
means 5000 CFM.
wFree air from the outside is pumped into the
package room and further supplied to the switch
room through the blowers of package AC units.
wThe hot air from the switch room is thrown out
using an exhaust fan/damper, or by keeping the
doors open if feasible.
wThe system can be manual or automatic.
Manual:
The free-cooling system is started manually, and the
dampers are adjusted accordingly. The system is
operated when the outside temperature is <20°C. The
components used are as follows: A 24 SWG GI duct
with a mechanical filter, a 600 mm axial fan, a
damper, a contactor, cables and so on.
Automatic:
Free cooling will start working as and when the
outside temperature goes below 20°C and will turn
OFF when the temperature inside the switch room is
below 25.5°C; also the compressors will turn ON only
when free cooling is not working due to any fault or
when outside conditions are not favourable. In this
system, the louvers of the inlet and outlet fans shall
work automatically with the thrust of the air. The
components used are as follows: A 24 SWG GI sheet
duct with a mechanical filter, a 600-mm diameter axial
fan, a 450 mm exhaust fan, dampers, louvers, digital
temperature controllers, contactors, relays, control
wiring and cables, and so on.
Implementation
Pilot automated project:
A pilot project has been undertaken with an
automated system at the telephone exchange
building, Yamuna Nagar, Haryana. The desired inside
temperature is 25°C.
Whenever the outside temperature is
below 20°C, the fresh air and exhaust air
fans start working, sensing the outside
ambient temperature through a
temperature sensor. This air is sucked in
by the package AC units and supplied into
the conditioned space, and is drawn out
by the exhaust fans.
In this project, 10,000 CFM air is required to cool the
conditioned space, that is, switch room/equipment
room containing C-DoT and OCB exchange
equipment. Two 5000 CFM fans with mechanical
filters and suitable duct work are provided to push the
air into the existing AC plant room, and four 18"
exhaust fans with shutters in the return air path are
provided to exhaust the air into the atmosphere.
Whenever the outside temperature is below 20°C, the
fresh air and exhaust air fans start working, sensing
the outside ambient temperature through a
temperature sensor. This forced air is sucked in by
the package AC units and supplied into the
conditioned space, where, after taking the heat of the
equipment, it is exhausted by the exhaust fans. A
temperature sensor is provided in the switch room so
that when the temperature is about to go below 25°C
the system stops and turns ON only when the
temperature is about to increase from the desired
value of 25°C. This also adds further energy savings
by switching off the inlet and outlet air fans.
The general layouts of the system with and without
free cooling are as shown in Figures 1 and 2,
respectively. The control circuit is shown in Figure 3.
Figure 1: Layout Plan of AC Plant at the telephone Exchange, Yamunanagar (air circuit normal)
Switch room
X-MISSION
BTS
OFFICE
AC PLANTCONDENSORS
OMC
OFFICE
GREEN (SUPPLY AIR)RED (RETURN AIR)BLACK ( CONDENSOR AIR CIRCUIT)RETURN AIR PATH
CONDENSOR
AC PACKAGFE
Page 27
free
cool
ing
: an
ener
gy
cons
erva
tion
mea
sure
Jan
uary
- M
arc
h 2
01
2a
qua
rterly
mag
azin
e of
the
soci
ety
of e
nerg
y en
gin
eers
and
man
ager
s / I
ndia
26
free
cool
ing
: an
ener
gy
cons
erva
tion
mea
sure
Jan
uary
- M
arc
h 2
01
2a
qua
rterly
mag
azin
e of
the
soci
ety
of e
nerg
y en
gin
eers
and
man
ager
s / I
ndia
27
ajority of air-conditioning systems are based on Mthe re-circulated air system, in which
irrespective of the outside ambient conditions, the
conditioned space/equipment area is to be
maintained at the desired temperature level. The
required fresh air and return air are cooled by
refrigeration compressors. All telephone exchanges,
big and small, function under controlled conditions
and are air conditioned. The temperature is required
to be maintained at a certain level throughout the
year. Major exchanges are temperature sensitive, and
temperature is required to be maintained in the range
of 23 ± 3°C. There are around 100 air-conditioning
plants in BSNL exchanges in the state of Haryana,
and the capacity of these plants normally ranges from
21 TR to 50 TR; the majority being of 21 TR. Air-
conditioning plants are bulk consumers of energy,
and there exists a great potential for energy
conservation. It is to be noted that even a decrease of
indoor temperature by 1°C results in an increase of
energy consumption by 4%.
The Concept
In northern India the outdoor temperature during
winter (November to February) is quite low. Such
favourable outside conditions can be utilized for
maintaining the switch room/equipment room
temperature by pumping cold air from the outside into
the equipment room through the plant room by
running the blowers of package AC units. This
concept is known as free cooling. The normal
temperature of the cool air at the canvas connection
of a package AC unit is 13-14°C. So, when the
outside temp is <14°C, then no package AC unit is
required to be run. When the outside temperature is
even up to 20°C, the temperature in the switch
room/equipment room can be maintained by pumping
more air.
Design and Methodology
wThe air flow (in cubic feet per minute, CFM)
requirement for free cooling for a particular AC
plant is calculated on the basis of average running
of the number of AC package units during the
The normal temperature of the cooled air
at the canvas connection of a package AC
unit is 13-14°C. When the outside temp is
<14°C, no package AC unit is required to
be run.
winter season; for example, one package unit
means 5000 CFM.
wFree air from the outside is pumped into the
package room and further supplied to the switch
room through the blowers of package AC units.
wThe hot air from the switch room is thrown out
using an exhaust fan/damper, or by keeping the
doors open if feasible.
wThe system can be manual or automatic.
Manual:
The free-cooling system is started manually, and the
dampers are adjusted accordingly. The system is
operated when the outside temperature is <20°C. The
components used are as follows: A 24 SWG GI duct
with a mechanical filter, a 600 mm axial fan, a
damper, a contactor, cables and so on.
Automatic:
Free cooling will start working as and when the
outside temperature goes below 20°C and will turn
OFF when the temperature inside the switch room is
below 25.5°C; also the compressors will turn ON only
when free cooling is not working due to any fault or
when outside conditions are not favourable. In this
system, the louvers of the inlet and outlet fans shall
work automatically with the thrust of the air. The
components used are as follows: A 24 SWG GI sheet
duct with a mechanical filter, a 600-mm diameter axial
fan, a 450 mm exhaust fan, dampers, louvers, digital
temperature controllers, contactors, relays, control
wiring and cables, and so on.
Implementation
Pilot automated project:
A pilot project has been undertaken with an
automated system at the telephone exchange
building, Yamuna Nagar, Haryana. The desired inside
temperature is 25°C.
Whenever the outside temperature is
below 20°C, the fresh air and exhaust air
fans start working, sensing the outside
ambient temperature through a
temperature sensor. This air is sucked in
by the package AC units and supplied into
the conditioned space, and is drawn out
by the exhaust fans.
In this project, 10,000 CFM air is required to cool the
conditioned space, that is, switch room/equipment
room containing C-DoT and OCB exchange
equipment. Two 5000 CFM fans with mechanical
filters and suitable duct work are provided to push the
air into the existing AC plant room, and four 18"
exhaust fans with shutters in the return air path are
provided to exhaust the air into the atmosphere.
Whenever the outside temperature is below 20°C, the
fresh air and exhaust air fans start working, sensing
the outside ambient temperature through a
temperature sensor. This forced air is sucked in by
the package AC units and supplied into the
conditioned space, where, after taking the heat of the
equipment, it is exhausted by the exhaust fans. A
temperature sensor is provided in the switch room so
that when the temperature is about to go below 25°C
the system stops and turns ON only when the
temperature is about to increase from the desired
value of 25°C. This also adds further energy savings
by switching off the inlet and outlet air fans.
The general layouts of the system with and without
free cooling are as shown in Figures 1 and 2,
respectively. The control circuit is shown in Figure 3.
Figure 1: Layout Plan of AC Plant at the telephone Exchange, Yamunanagar (air circuit normal)
Switch room
X-MISSION
BTS
OFFICE
AC PLANTCONDENSORS
OMC
OFFICE
GREEN (SUPPLY AIR)RED (RETURN AIR)BLACK ( CONDENSOR AIR CIRCUIT)RETURN AIR PATH
CONDENSOR
AC PACKAGFE
Page 28
Er. Balbir Singh is the Chief
Engineer (E) at BSNL, Haryana and
Er. V.K.Sethi is the Sub Divisional
Engineer (E) at BSNL, Yamuna
Nagar.
free
cool
ing
: an
ener
gy
cons
erva
tion
mea
sure
Jan
uary
- M
arc
h 2
01
2a
qua
rterly
mag
azin
e of
the
soci
ety
of e
nerg
y en
gin
eers
and
man
ager
s / I
ndia
28
free
cool
ing
: an
ener
gy
cons
erva
tion
mea
sure
Jan
uary
- M
arc
h 2
01
2a
qua
rterly
mag
azin
e of
the
soci
ety
of e
nerg
y en
gin
eers
and
man
ager
s / I
ndia
29
Switch room
X-MISSION
BTS
OFFICE
AC PLANTCONDENSORS
OMC
OFFICE
GREEN (FREE OUTER COLD AIR)RED (HEATED EXHAUST AIR)RETURN AIR PATHSECTION LINE
CONDENSORAC PACKAGE5000CFM AIR INLET FAN
450 M HOT AIR EXH. FAN
OUTER COLD AIR
Figure 2. Layout Plan of the AC Plant at the Telephone Exchange at Yamunanagar (Free Cooling)
TC-1
NEUTRAL
TC-2
FREE AIREXHAUST
OUTSIDE TEMP. SENSOR
INDOOR TEMP SENSOR
Figure 3: Temperature Controller for Free Air Cooling in Winter (Schematic Diagram)
Table 1: Energy Conservation Achieved in the AC Plants of BSNL, Haryana, by Means of Free Cooling
The free-cooling concept has been successfully
implemented in around 90 AC plants in BSNL,
Haryana. It has resulted in considerable reduction in
energy consumption, as detailed in Table 1:
From Table 1, it is observed that there is a huge
potential for energy conservation by using the free-
cooling concept. In our practical experience, it has
been observed that the actual operating period of the
free-cooling concept is around 4½ months.
In appreciation of the achievement in
energy conservation in the office buildings
sector, BSNL Haryana has won three
National Energy Conservation Awards in
2010.
Benefits
wReduction in compressor running hours.
wIncreased compressor life
wLower energy cost
wLower CO emission2
In appreciation of the achievement in energy
conservation in the office buildings sector, BSNL
Haryana has won three National Energy Conservation
Awards in 2010. The awards were presented by
Honorable Minister of Power, Mr. Shushil Kumar
Shinde, on 14 December, 2010.
Sr. No. Description Result
1 No. of AC plants in which the free-cooling concept is implemented 90
2 Reduction in running of package AC units (at least one package unit
of 7 TR in each plant) 7 TR × 90 = 630 TR
3 No of working hours (round the clock) 24 h
4 Power consumption 1.8 kW/TR
5 Period of operation of free cooling (October to March) - 90 days × 24 h
restricted to 3 months for calculations purpose = 2160 h
6 Reduction in energy consumption in units 630 × 1.8 × 2160
= 24,49,440 kWh
7 Units consumed for running the free-cooling system 1.50 × 90 × 24
@ 1.50 kW per free-cooling system (in units) = 3,240 kWh
(which is negligible)
Visit http://www.energyprofessional.in/magazine.php?category=5and click on Subscribe Now button
Now pay online to subscribe to
Page 29
Er. Balbir Singh is the Chief
Engineer (E) at BSNL, Haryana and
Er. V.K.Sethi is the Sub Divisional
Engineer (E) at BSNL, Yamuna
Nagar.
free
cool
ing
: an
ener
gy
cons
erva
tion
mea
sure
Jan
uary
- M
arc
h 2
01
2a
qua
rterly
mag
azin
e of
the
soci
ety
of e
nerg
y en
gin
eers
and
man
ager
s / I
ndia
28
free
cool
ing
: an
ener
gy
cons
erva
tion
mea
sure
Jan
uary
- M
arc
h 2
01
2a
qua
rterly
mag
azin
e of
the
soci
ety
of e
nerg
y en
gin
eers
and
man
ager
s / I
ndia
29
Switch room
X-MISSION
BTS
OFFICE
AC PLANTCONDENSORS
OMC
OFFICE
GREEN (FREE OUTER COLD AIR)RED (HEATED EXHAUST AIR)RETURN AIR PATHSECTION LINE
CONDENSORAC PACKAGE5000CFM AIR INLET FAN
450 M HOT AIR EXH. FAN
OUTER COLD AIR
Figure 2. Layout Plan of the AC Plant at the Telephone Exchange at Yamunanagar (Free Cooling)
TC-1
NEUTRAL
TC-2
FREE AIREXHAUST
OUTSIDE TEMP. SENSOR
INDOOR TEMP SENSOR
Figure 3: Temperature Controller for Free Air Cooling in Winter (Schematic Diagram)
Table 1: Energy Conservation Achieved in the AC Plants of BSNL, Haryana, by Means of Free Cooling
The free-cooling concept has been successfully
implemented in around 90 AC plants in BSNL,
Haryana. It has resulted in considerable reduction in
energy consumption, as detailed in Table 1:
From Table 1, it is observed that there is a huge
potential for energy conservation by using the free-
cooling concept. In our practical experience, it has
been observed that the actual operating period of the
free-cooling concept is around 4½ months.
In appreciation of the achievement in
energy conservation in the office buildings
sector, BSNL Haryana has won three
National Energy Conservation Awards in
2010.
Benefits
wReduction in compressor running hours.
wIncreased compressor life
wLower energy cost
wLower CO emission2
In appreciation of the achievement in energy
conservation in the office buildings sector, BSNL
Haryana has won three National Energy Conservation
Awards in 2010. The awards were presented by
Honorable Minister of Power, Mr. Shushil Kumar
Shinde, on 14 December, 2010.
Sr. No. Description Result
1 No. of AC plants in which the free-cooling concept is implemented 90
2 Reduction in running of package AC units (at least one package unit
of 7 TR in each plant) 7 TR × 90 = 630 TR
3 No of working hours (round the clock) 24 h
4 Power consumption 1.8 kW/TR
5 Period of operation of free cooling (October to March) - 90 days × 24 h
restricted to 3 months for calculations purpose = 2160 h
6 Reduction in energy consumption in units 630 × 1.8 × 2160
= 24,49,440 kWh
7 Units consumed for running the free-cooling system 1.50 × 90 × 24
@ 1.50 kW per free-cooling system (in units) = 3,240 kWh
(which is negligible)
Visit http://www.energyprofessional.in/magazine.php?category=5and click on Subscribe Now button
Now pay online to subscribe to
Page 30
Jan
ua
ry -
Ma
rch
2012
a q
uarte
rly m
agaz
ine
of th
e so
ciet
y of
ene
rgy
eng
inee
rs a
nd m
anag
ers
/ Ind
ia
30
imp
act o
f sys
tem
load
fact
or o
n T&
D lo
sses
Jan
uary
- M
arc
h 2
01
2a
qua
rterly
mag
azin
e of
the
soci
ety
of e
nerg
y en
gin
eers
and
man
ager
s / I
ndia
31
n going through the annual administration report Oof Kerala State Electricity Board (KSEB) for
2009-10, it is learnt that during this period the T&D
loss came down to 19.41% from 20.45% (1.04%
reduction) in the previous year [1]. This was achieved
through the execution of the following improvement
works: commissioning of 266.4 km of EHT lines, 25
EHT sub-stations, 3398 km of HT lines, 7838 km of LT
lines and 5790 distribution transformers.
The system load factor of KSEB during 2009-10 was
65%, which is very low as compared to the other
southern states of India (see Table 1) [2]. Nothing is
seen mentioned in the report regarding measures to
improve the load factor. In this context, it is
worthwhile to make a study of the impact of system
load factor on T&D loss reduction and the
consequent increase in profitability of power utilities,
with a focus on the Kerala system.
Here it is attempted to make a theoretical study of the
impact of system load factor on T&D losses.
Ideal System Loss (Ld)
The ideal condition of loading of a system occurs
when the load factor is 100%.
Let us consider a case in which a uniform apparent
power of X units flows for a time period T, such that
the energy consumption for the period is Q units.
Load Factor = 100%
Energy consumption = Q units
Average apparent power = X units
Current, I = X/E (where E is a
constant that depends
on voltage etc.)
System loss depends on apparent power and not on
active power.
2System loss = D × I ×T (where D is
a constant that depends
on system parameters
such as Impedance etc.)
2= D × (X/E) × T
2= (D/E ) × (average 2apparent power) ×
time period
= K × (average apparent 2power) × time period
2(where K = D/E )
This is the minimum possible system loss for any
given time period and the given system parameters.
impact ofsystem load factor
on T&D lossesK K Babu
The system load factor of the Kerala
State Electricity Board (KSEB) during
2009-10 was 65%, which is very low
as compared to the other southern
states of India. It is worthwhile to
make a study of the impact of system
load factor on transmission and
distribution (T&D) loss reduction and
the consequent increase in
profitability of power utilities, with a
focus on the Kerala system. The study
shows that an annual savings up to
Rs.99.2894 crores can be achieved
through improvement in load factor.
Page 31
Jan
ua
ry -
Ma
rch
2012
a q
uarte
rly m
agaz
ine
of th
e so
ciet
y of
ene
rgy
eng
inee
rs a
nd m
anag
ers
/ Ind
ia
30
imp
act o
f sys
tem
load
fact
or o
n T&
D lo
sses
Jan
uary
- M
arc
h 2
01
2a
qua
rterly
mag
azin
e of
the
soci
ety
of e
nerg
y en
gin
eers
and
man
ager
s / I
ndia
31
n going through the annual administration report Oof Kerala State Electricity Board (KSEB) for
2009-10, it is learnt that during this period the T&D
loss came down to 19.41% from 20.45% (1.04%
reduction) in the previous year [1]. This was achieved
through the execution of the following improvement
works: commissioning of 266.4 km of EHT lines, 25
EHT sub-stations, 3398 km of HT lines, 7838 km of LT
lines and 5790 distribution transformers.
The system load factor of KSEB during 2009-10 was
65%, which is very low as compared to the other
southern states of India (see Table 1) [2]. Nothing is
seen mentioned in the report regarding measures to
improve the load factor. In this context, it is
worthwhile to make a study of the impact of system
load factor on T&D loss reduction and the
consequent increase in profitability of power utilities,
with a focus on the Kerala system.
Here it is attempted to make a theoretical study of the
impact of system load factor on T&D losses.
Ideal System Loss (Ld)
The ideal condition of loading of a system occurs
when the load factor is 100%.
Let us consider a case in which a uniform apparent
power of X units flows for a time period T, such that
the energy consumption for the period is Q units.
Load Factor = 100%
Energy consumption = Q units
Average apparent power = X units
Current, I = X/E (where E is a
constant that depends
on voltage etc.)
System loss depends on apparent power and not on
active power.
2System loss = D × I ×T (where D is
a constant that depends
on system parameters
such as Impedance etc.)
2= D × (X/E) × T
2= (D/E ) × (average 2apparent power) ×
time period
= K × (average apparent 2power) × time period
2(where K = D/E )
This is the minimum possible system loss for any
given time period and the given system parameters.
impact ofsystem load factor
on T&D lossesK K Babu
The system load factor of the Kerala
State Electricity Board (KSEB) during
2009-10 was 65%, which is very low
as compared to the other southern
states of India. It is worthwhile to
make a study of the impact of system
load factor on transmission and
distribution (T&D) loss reduction and
the consequent increase in
profitability of power utilities, with a
focus on the Kerala system. The study
shows that an annual savings up to
Rs.99.2894 crores can be achieved
through improvement in load factor.
Page 32
imp
act o
f sys
tem
load
fact
or o
n T&
D lo
sses
Jan
uary
- M
arc
h 2
01
2a
qua
rterly
mag
azin
e of
the
soci
ety
of e
nerg
y en
gin
eers
and
man
ager
s / I
ndia
32
imp
act o
f sys
tem
load
fact
or o
n T&
D lo
sses
Jan
uary
- M
arc
h 2
01
2a
qua
rterly
mag
azin
e of
the
soci
ety
of e
nerg
y en
gin
eers
and
man
ager
s / I
ndia
33
That means, it is the Ideal system loss.
So, ideal system loss, Ld = K × (average apparent 2power) × time period (1)
Also, system loss if apparent maximum demand (MD)
is maintained during the time period
2= K × (apparent MD) ×
time period (2)
Note that Ld changes when there is any change in the
constant K.
The Actual Loss can be worked out based
on the relation between load factor (G ) L
and loss factor (G ). In fact, loss factor is V
the 'load factor of losses'. It is defined as
the ratio of actual energy loss during a
particular period to the energy loss
assuming peak apparent demand
throughout the period.
Load Factor and Loss Factor
In actual practice, ideal loading never occurs and the
actual system loss will be more than Ld. Losses in
series elements are related to the square of the
current flow. It is possible to establish a relationship
between peak demand on a system and the average
technical losses, through consideration of load factor
(G ) and loss factor (G ).L V
The Actual Loss can be worked out based on the
relation between G and G . In fact, loss factor is the L V
'load factor of losses'. It is defined as the 'ratio of
actual energy loss during a particular period to the
energy loss assuming peak apparent demand
throughout the period'.
G = Energy loss over a time period ÷ (Power V
loss at apparent MD × the time period)
G = Energy consumed over a time period ÷ L
(MD × the time period)
According to the Electrical Engineering Hand Book
published by SIEMENS, (the relevant extract is given
below) we get the following relation [3]:
1.6G = (G )V L
[Extract from Electrical Engineering Handbook
published by SIEMENS
Section 8.1, Network Parameters, pp 356-357.]
Load Factor and Loss Factor
G = A /P t load factorL u max
G = A /V t loss factorV V max
P : maximum transmitted power (peak load) in MW max
in a certain period,
t : duration of the period in hours,
A : energy transmitted in time t in MWh,u
V : loss power at apparent load power Smmax ax,
A : energy loss in time tV
No simple curve, which is correct for every case,
exists for the relation G = f(G ), because of the effect V L
of power factor and load fluctuation. The bandwidth is 1-2given by the relation G = (G ) . The index 1 is valid V L
for a load diagram which only contains the values P
= P and P = 0. A load diagram for index 2 would max
have the power P during a very short period of max
time, while a constant load would exist during the rest
of the time. The emphasized curve can be used with
sufficient accuracy under most practical conditions
(approximately corresponding to an index of 1.6)].
Now,G = Energy consumed over a time L
period ÷ (MD × the time period)= Average apparent power ÷
Apparent MD
2(G ) = (Average apparent power) ÷ L
2(Apparent MD)
= [K × (Average apparent 2power) × Time period] ÷
2[K × (Apparent MD) × Time period]
= Ideal loss over a time period
(L ) ÷ (Energy loss if apparent MD is d
maintained over the time period)
G = Energy loss over a time period ÷ V
(Power loss at apparent MD × the
time period)
= Actual system loss over a time
period ÷ (Energy loss if apparent MD
is maintained over the time period)
2G /(G ) = Actual loss over a time period ÷ V L
Ideal loss over the same time period
= Actual loss ÷ Ideal loss (L )d
2So, Actual loss = L × [ G /(G ) ]d V L
1.6But, we know that G = (G )V L
1.6 2So, Actual Loss = L × [(G ) /(G ) ]d L L
0.4= L × [1/(G ) ] d L
Now, Actual loss L 1
0.4at load factor G = L × [1/(G ) ]L1 d L1
Actual loss L 2
0.4at load factor G = L × [1/(G ) ]L2 d L2
0.4 So, L /L = (G /G )1 2 L2 L1
Impact of Load Factor on Profitability
From the Annual Report for 2009-10 of Southern
Regional Power Committee (under CEA), Bangalore,
the statistics with regard to the southern states of
India can be obtained, which is presented in Table 1.
From Table 1, it is observed that the system load
factor of Kerala for 2009-10 is 65%, while those of
other southern states are much higher. A load factor
of 80% can be taken as the target. The T&D loss of
Kerala during 2009-10 was 19.41%. Now, let us see
what would have been the T&D loss, if the load factor
were improved to 80%.
2
Andhra Karnataka Kerala Tamil Nadu Pondicherry Southern
Pradesh Region
Annual Load Factor (%) 78 70 65 83 77 81
Source: SRPC (2010) Annual Report 2009-2010 of Southern Region Power Committee. Bangalore, India: Southern Region Power Committee
(under CEA). www.srpc.kar.nic.in
Table 1. Annual Average Load Factor of the Southern States of India
Loss Factor as a function of Load Factor
1.0
0.8
0.6
0.4
0.2
00.2 0.4 0.6 0.8 1.0
GV
GV = GL
GV = GL( (2
Practical Condition
GL
Page 33
imp
act o
f sys
tem
load
fact
or o
n T&
D lo
sses
Jan
uary
- M
arc
h 2
01
2a
qua
rterly
mag
azin
e of
the
soci
ety
of e
nerg
y en
gin
eers
and
man
ager
s / I
ndia
32
imp
act o
f sys
tem
load
fact
or o
n T&
D lo
sses
Jan
uary
- M
arc
h 2
01
2a
qua
rterly
mag
azin
e of
the
soci
ety
of e
nerg
y en
gin
eers
and
man
ager
s / I
ndia
33
That means, it is the Ideal system loss.
So, ideal system loss, Ld = K × (average apparent 2power) × time period (1)
Also, system loss if apparent maximum demand (MD)
is maintained during the time period
2= K × (apparent MD) ×
time period (2)
Note that Ld changes when there is any change in the
constant K.
The Actual Loss can be worked out based
on the relation between load factor (G ) L
and loss factor (G ). In fact, loss factor is V
the 'load factor of losses'. It is defined as
the ratio of actual energy loss during a
particular period to the energy loss
assuming peak apparent demand
throughout the period.
Load Factor and Loss Factor
In actual practice, ideal loading never occurs and the
actual system loss will be more than Ld. Losses in
series elements are related to the square of the
current flow. It is possible to establish a relationship
between peak demand on a system and the average
technical losses, through consideration of load factor
(G ) and loss factor (G ).L V
The Actual Loss can be worked out based on the
relation between G and G . In fact, loss factor is the L V
'load factor of losses'. It is defined as the 'ratio of
actual energy loss during a particular period to the
energy loss assuming peak apparent demand
throughout the period'.
G = Energy loss over a time period ÷ (Power V
loss at apparent MD × the time period)
G = Energy consumed over a time period ÷ L
(MD × the time period)
According to the Electrical Engineering Hand Book
published by SIEMENS, (the relevant extract is given
below) we get the following relation [3]:
1.6G = (G )V L
[Extract from Electrical Engineering Handbook
published by SIEMENS
Section 8.1, Network Parameters, pp 356-357.]
Load Factor and Loss Factor
G = A /P t load factorL u max
G = A /V t loss factorV V max
P : maximum transmitted power (peak load) in MW max
in a certain period,
t : duration of the period in hours,
A : energy transmitted in time t in MWh,u
V : loss power at apparent load power Smmax ax,
A : energy loss in time tV
No simple curve, which is correct for every case,
exists for the relation G = f(G ), because of the effect V L
of power factor and load fluctuation. The bandwidth is 1-2given by the relation G = (G ) . The index 1 is valid V L
for a load diagram which only contains the values P
= P and P = 0. A load diagram for index 2 would max
have the power P during a very short period of max
time, while a constant load would exist during the rest
of the time. The emphasized curve can be used with
sufficient accuracy under most practical conditions
(approximately corresponding to an index of 1.6)].
Now,G = Energy consumed over a time L
period ÷ (MD × the time period)= Average apparent power ÷
Apparent MD
2(G ) = (Average apparent power) ÷ L
2(Apparent MD)
= [K × (Average apparent 2power) × Time period] ÷
2[K × (Apparent MD) × Time period]
= Ideal loss over a time period
(L ) ÷ (Energy loss if apparent MD is d
maintained over the time period)
G = Energy loss over a time period ÷ V
(Power loss at apparent MD × the
time period)
= Actual system loss over a time
period ÷ (Energy loss if apparent MD
is maintained over the time period)
2G /(G ) = Actual loss over a time period ÷ V L
Ideal loss over the same time period
= Actual loss ÷ Ideal loss (L )d
2So, Actual loss = L × [ G /(G ) ]d V L
1.6But, we know that G = (G )V L
1.6 2So, Actual Loss = L × [(G ) /(G ) ]d L L
0.4= L × [1/(G ) ] d L
Now, Actual loss L 1
0.4at load factor G = L × [1/(G ) ]L1 d L1
Actual loss L 2
0.4at load factor G = L × [1/(G ) ]L2 d L2
0.4 So, L /L = (G /G )1 2 L2 L1
Impact of Load Factor on Profitability
From the Annual Report for 2009-10 of Southern
Regional Power Committee (under CEA), Bangalore,
the statistics with regard to the southern states of
India can be obtained, which is presented in Table 1.
From Table 1, it is observed that the system load
factor of Kerala for 2009-10 is 65%, while those of
other southern states are much higher. A load factor
of 80% can be taken as the target. The T&D loss of
Kerala during 2009-10 was 19.41%. Now, let us see
what would have been the T&D loss, if the load factor
were improved to 80%.
2
Andhra Karnataka Kerala Tamil Nadu Pondicherry Southern
Pradesh Region
Annual Load Factor (%) 78 70 65 83 77 81
Source: SRPC (2010) Annual Report 2009-2010 of Southern Region Power Committee. Bangalore, India: Southern Region Power Committee
(under CEA). www.srpc.kar.nic.in
Table 1. Annual Average Load Factor of the Southern States of India
Loss Factor as a function of Load Factor
1.0
0.8
0.6
0.4
0.2
00.2 0.4 0.6 0.8 1.0
GV
GV = GL
GV = GL( (2
Practical Condition
GL
Page 34
(ABT) regime, there will be a monetary benefit if
there is any reduction in demand during the low-
frequency period.
Action Plan for Achieving Loss Reduction by
Improvement of System Load Factor
Load factor can be improved only by flattening of the
load curve. It can be done only by limiting the evening
peak and by creating additional demand during off-
peak periods.
A detailed and in-depth study is needed for
implementing appropriate measures to improve the
load factor and thus reduce the system loss.
References
1. KSEB (2010) Annual Administration Report 2009-2010 of Kerala
State Electricity Board. Trivandrum, India: Kerala State Electricity
Board.
2. SRPC (2010) Annual Report 2009-2010 of Southern Region
Power Committee. Bangalore, India: Southern Region Power
Committee (under CEA). www.srpc.kar.nic.in.
3. SIEMENS (1981) Electrical Engineering Handbook. New Delhi,
India: New Age International (P) Limited.
We know that
0.4L /L = (G /G )1 2 L2 L1
0.4So, L = L × (G /G )2 I L1 L2
T&D Loss at 65%
load factor, L = 19.41% (i.e., 0.1941) 1
Suppose the load factor is improved to 80%
T&D loss at 80% 0.4load factor, L = L × (G /G )2 I L1 L2
0.4 = 0.1941 × (0.65/0.80)= 0.1941 × 0.920 = 0.1786 (i.e., 17.86%)
Reduction in T&D Loss = (19.41 - 17.86)%= 1.55%
Annual energy sold = 14,047.75 M.U.
during 2009-10 (million units)
Annual reduction in
T&D Loss = 217.74 M.U.
Per unit cost of energy = Rs. 4.56
Annual Savings due to improvement in load factor =
Rs.99.2894 Crores
Additional Savings Due to Improvement in Load
Factor
1. Capacity enhancement of the system (generation,
transmission and distribution) is usually
necessitated to meet the evening peak demand. If
load factor is improved, evening peak will be
reduced and consequently there will be savings
due to the reduction in capital investment.
2. The frequency will usually be low during the
evening peak. Under the availability-based tariff
Capacity enhancement of the system
(generation, transmission and distribution)
is usually necessitated to meet the
evening peak demand. If load factor is
improved, evening peak will be reduced
and consequently there will be savings
due to the reduction in capital investment.
Load factor can be improved only by
flattening of the load curve. It can be done
only by limiting the evening peak and by
creating additional demand during off-
peak periods.
Mr. K. K. Babu, MSEEM is a former
Deputy Chief Engineer of the Kerala
State Electricity Board. He has
30 years of experience in Design,
Planning, Construction, Operation and
Maintenance of various Electrical
Installations (LT, HT & EHT). He has
also actively involved in Energy Audits,
Grid Management, Load Generation
Balance and Water Management.
imp
act o
f sys
tem
load
fact
or o
n T&
D lo
sses
Jan
uary
- M
arc
h 2
01
2a
qua
rterly
mag
azin
e of
the
soci
ety
of e
nerg
y en
gin
eers
and
man
ager
s / I
ndia
34
Page 35
Subscribe NowFor any queries about Energy Manager:
Please call +91 471 2557607 or e-mail us at [email protected] for assistance
Subscribe to for:
authoritative, accessible editorial, exciting analysis of energy sector
fascinating, in-depth reporting and coverage of current topics on energy efficiency
articles on energy efficiency, conservation and management- from policy to business, ground-breaking technologies, research, best practices and case studies
valued opinion on hot topics from key players
dedicated pages of advertisement and showcasing of EE products
Published by: Supported by:
Energy Press, SEEM Bhavan, KRA - A79, Kannammoola, Trivandrum - 695 011, Kerala, IndiaT: 0471 - 3242323 T/F: 0471 - 2557607 E mail : [email protected] www.energyprofessional.in
The Quarterly Magazine ofSociety of Energy Engineers and Managers (SEEM) Published by ENERGY PRESS
Send your DD or at par Cheque in favour of Energy Press,payable at Thiruvananthapuram
Subscription rates are as follows:
Individuals
Period Issues Cover priceINR. (USD)
3 years 12 2500 (115)
1 year 4 1000 (45)
Institutions
3 years 12 4000 (180)
1 year 4 1500 (70)
Pay online at: http://energyprofessional.in/subscribe.php
Page 36
Jan
uary
- M
arc
h 2
01
2a
qua
rterly
mag
azin
e of
the
soci
ety
of e
nerg
y en
gin
eers
and
man
ager
s / I
ndia
37
code optimization technique:an approach towards
energy efficient computingSoujanya Nemalikanti and Polavarapu Sindhura
Moving towards a 'greener' era of
computing, it is the need of the hour to
consider high-performance systems that
are energy efficient and thereby are lesser
heat and carbon emitters. The conventional
approach, on software grounds, includes
redefining algorithms that focus on the
reduction of time complexity and space
complexity of programmes. The authors
propose a novel approach that takes into
consideration power optimization, with
respect to making an algorithm more
energy-efficient.
Page 37
Jan
uary
- M
arc
h 2
01
2a
qua
rterly
mag
azin
e of
the
soci
ety
of e
nerg
y en
gin
eers
and
man
ager
s / I
ndia
37
code optimization technique:an approach towards
energy efficient computingSoujanya Nemalikanti and Polavarapu Sindhura
Moving towards a 'greener' era of
computing, it is the need of the hour to
consider high-performance systems that
are energy efficient and thereby are lesser
heat and carbon emitters. The conventional
approach, on software grounds, includes
redefining algorithms that focus on the
reduction of time complexity and space
complexity of programmes. The authors
propose a novel approach that takes into
consideration power optimization, with
respect to making an algorithm more
energy-efficient.
Page 38
Jan
uary
- M
arc
h 2
01
2a
qua
rterly
mag
azin
e of
the
soci
ety
of e
nerg
y en
gin
eers
and
man
ager
s / I
ndia
38
cod
e op
timiz
atio
n te
chni
que
: an
app
roac
h to
war
ds
ener
gy
effic
ient
com
put
ing
cod
e op
timiz
atio
n te
chni
que
: an
app
roac
h to
war
ds
ener
gy
effic
ient
com
put
ing
Jan
uary
- M
arc
h 2
01
2a
qua
rterly
mag
azin
e of
the
soci
ety
of e
nerg
y en
gin
eers
and
man
ager
s / I
ndia
39
o begin with, 'green' computing is defined as "the Tstudy and practice of designing, manufacturing,
using, and disposing of computers, servers, and
associated subsystems - such as monitors, printers,
storage devices, and networking and communications
systems - efficiently and effectively with minimal or no
impact on the environment." This definition was
proposed by Samir Botros in Green Technology and
Design for the Environment [1].
With the advent of novel technologies to address
complex problems in the world of computation, the
focal point, to a large extent, remains to be the
performance factor, marring the consequences that it
renders to the milieu around in the form of carbon
and heat emissions affecting humans and the
environment equally. Thence is the yearning for eco-
friendly alternatives that consume less units of power
for execution and also save your money.
Case Studies
1. Fine-grained green computing
'Fine-grained green computing' refers to running a
programme efficiently and effectively via a subtle
power control on each computing resource such as
CPU, memory, registers, peripherals, clock and power
supply. A simple power cut as a whole, like in coarse-
grained green computing, yields less leverage on
manipulating energy consumption in light of the
characteristics and the context of a specific
application. Table 1 shows a green-computing version
of the 'Hello World' programme with respect to the
coarse-grained and the fine-grained green-computing
methodologies. The code on the left shows a coarse-
grained green-computing programme in which the
programme's execution is in the full-power mode,
disregarding whether the program is using memory
Fine-grained green computing' refers to
running a programme efficiently and
effectively via a subtle power control on
each computing resource such as CPU,
memory, registers, peripherals, clock and
power supply. A simple power cut as a
whole, like in coarse-grained green
computing, yields less leverage on
manipulating energy consumption in light
of the characteristics and the context of a
specific application.
banks or I/O peripherals. Note that the system is set
to the full-power mode when an external event occurs
such as a key pressing or a peripheral interrupt.
Therefore, on entry into the programme, the system is
assumed to be in the full-power mode [2].
With fine-grained green computing (the code on the
right-hand side of Table 1), only the required memory
banks and I/O peripherals are activated for the
programme. The number of memory banks that
should be activated and the I/O peripherals that
should be turned on really depend on the underlying
application. This approach allows energy
consumption of the system components to be fine-
tuned, and will further reduce power consumption, as
low-power modes do for the CPU alone.
2. Power-aware merge algorithm
Components other than CPU will require another
control unit in the system. However, this will increase
the complexity of the design, and some algorithms
may have to be redesigned to achieve this objective.
Note that it seems plausible that the green code at
the right-hand side of Table 1 involves a higher
number of instructions and thus consumes more
power. Actually, it is the idle power consumption that
makes the non-green code drain more current than
the green code.
A big portion of power consumption is attributed to
the memory in which programmes and their data are
stored. Thus, a compact design of code and data
structures is a key to power reduction. For example, a
regular merge sort algorithm will waste about 50% of
memory space in storing sub-type elements, as in the
A big portion of power consumption is
attributed to the memory in which
programmes and their data are stored.
Thus, a compact design of code and data
structures is a key to power reduction.
case of, say, a 32-bit CPU sorting 16-bit short
integers. Two problems arise: First, it doubles the
memory space requirement to store the data, and,
therefore, it may not take advantage of turning off
unused memory banks to save power. Second, it
requires two times more memory loads than if the
data were to be sorted in a compact form, for
example, two short integers are stored in a 32-bit
memory space. Table 2 illustrates a power-aware
merge algorithm that reduces memory power
consumption and size by 50%, and increases
programme efficiency by eliminating a half of the
lengthy memory accesses (assuming that all auto
variables i, j, k and n can be allocated to registers).
The idea of the power-aware merge algorithm is to
pack two short integers into one word, which is the
basic unit for the CPU, when loading data into
registers. Each load instruction will actually load two
short integers. The operations of this merge algorithm
are similar to those of a traditional one. The only
difference is the three 'if' statements to check whether
the indices have reached 2.
The asymptotic time complexity will remain the same,
that is, O(n), but the actual run time will be shorter if
m > 4, where m is the number of times the memory
access is slower as compared to CPU instructions.
The following depicts the time complexity of the
merge algorithm of the original version and that of the
power-aware version shown in Table 2.
T (n) = nm + n
T'(n) = nm/2 + 3n
Table 1: A Green-Computing Version of the 'Hello World' Program for
Coarse-Grained (Left) and Fine-Grained (Right) Green Computing
Programme HelloWorld_c Programme HelloWorld_f
print "Hello World\n" activate(memory_bank)
low_power_mode() activate(io)
print "Hello World\n"
deactivate(memory_bank)
deactivate(io)
low_power_mode()
Table 2: A Power-Aware Merge Algorithm for Memory Power and Size
Reduction
Merge (A, L, R)
n = k = 0;
i = j = 2;
while(not (empty(L) or empty(R))) {
if (i = 2)
W1 = head(L);
i = 0;
if (j = 2)
W2 = head(R);
j = 0;
if (W1[i] > W2[j])
w[k++] = W2[j++];
else
w[k++] = W1[j++];
if k = 2
A[n++] = w;
k = 0;
end of while
// append the rest of lists to A
if (notempty(L)) append L to A
elseif (notempty(R)) append R to A
Page 39
Jan
uary
- M
arc
h 2
01
2a
qua
rterly
mag
azin
e of
the
soci
ety
of e
nerg
y en
gin
eers
and
man
ager
s / I
ndia
38
cod
e op
timiz
atio
n te
chni
que
: an
app
roac
h to
war
ds
ener
gy
effic
ient
com
put
ing
cod
e op
timiz
atio
n te
chni
que
: an
app
roac
h to
war
ds
ener
gy
effic
ient
com
put
ing
Jan
uary
- M
arc
h 2
01
2a
qua
rterly
mag
azin
e of
the
soci
ety
of e
nerg
y en
gin
eers
and
man
ager
s / I
ndia
39
o begin with, 'green' computing is defined as "the Tstudy and practice of designing, manufacturing,
using, and disposing of computers, servers, and
associated subsystems - such as monitors, printers,
storage devices, and networking and communications
systems - efficiently and effectively with minimal or no
impact on the environment." This definition was
proposed by Samir Botros in Green Technology and
Design for the Environment [1].
With the advent of novel technologies to address
complex problems in the world of computation, the
focal point, to a large extent, remains to be the
performance factor, marring the consequences that it
renders to the milieu around in the form of carbon
and heat emissions affecting humans and the
environment equally. Thence is the yearning for eco-
friendly alternatives that consume less units of power
for execution and also save your money.
Case Studies
1. Fine-grained green computing
'Fine-grained green computing' refers to running a
programme efficiently and effectively via a subtle
power control on each computing resource such as
CPU, memory, registers, peripherals, clock and power
supply. A simple power cut as a whole, like in coarse-
grained green computing, yields less leverage on
manipulating energy consumption in light of the
characteristics and the context of a specific
application. Table 1 shows a green-computing version
of the 'Hello World' programme with respect to the
coarse-grained and the fine-grained green-computing
methodologies. The code on the left shows a coarse-
grained green-computing programme in which the
programme's execution is in the full-power mode,
disregarding whether the program is using memory
Fine-grained green computing' refers to
running a programme efficiently and
effectively via a subtle power control on
each computing resource such as CPU,
memory, registers, peripherals, clock and
power supply. A simple power cut as a
whole, like in coarse-grained green
computing, yields less leverage on
manipulating energy consumption in light
of the characteristics and the context of a
specific application.
banks or I/O peripherals. Note that the system is set
to the full-power mode when an external event occurs
such as a key pressing or a peripheral interrupt.
Therefore, on entry into the programme, the system is
assumed to be in the full-power mode [2].
With fine-grained green computing (the code on the
right-hand side of Table 1), only the required memory
banks and I/O peripherals are activated for the
programme. The number of memory banks that
should be activated and the I/O peripherals that
should be turned on really depend on the underlying
application. This approach allows energy
consumption of the system components to be fine-
tuned, and will further reduce power consumption, as
low-power modes do for the CPU alone.
2. Power-aware merge algorithm
Components other than CPU will require another
control unit in the system. However, this will increase
the complexity of the design, and some algorithms
may have to be redesigned to achieve this objective.
Note that it seems plausible that the green code at
the right-hand side of Table 1 involves a higher
number of instructions and thus consumes more
power. Actually, it is the idle power consumption that
makes the non-green code drain more current than
the green code.
A big portion of power consumption is attributed to
the memory in which programmes and their data are
stored. Thus, a compact design of code and data
structures is a key to power reduction. For example, a
regular merge sort algorithm will waste about 50% of
memory space in storing sub-type elements, as in the
A big portion of power consumption is
attributed to the memory in which
programmes and their data are stored.
Thus, a compact design of code and data
structures is a key to power reduction.
case of, say, a 32-bit CPU sorting 16-bit short
integers. Two problems arise: First, it doubles the
memory space requirement to store the data, and,
therefore, it may not take advantage of turning off
unused memory banks to save power. Second, it
requires two times more memory loads than if the
data were to be sorted in a compact form, for
example, two short integers are stored in a 32-bit
memory space. Table 2 illustrates a power-aware
merge algorithm that reduces memory power
consumption and size by 50%, and increases
programme efficiency by eliminating a half of the
lengthy memory accesses (assuming that all auto
variables i, j, k and n can be allocated to registers).
The idea of the power-aware merge algorithm is to
pack two short integers into one word, which is the
basic unit for the CPU, when loading data into
registers. Each load instruction will actually load two
short integers. The operations of this merge algorithm
are similar to those of a traditional one. The only
difference is the three 'if' statements to check whether
the indices have reached 2.
The asymptotic time complexity will remain the same,
that is, O(n), but the actual run time will be shorter if
m > 4, where m is the number of times the memory
access is slower as compared to CPU instructions.
The following depicts the time complexity of the
merge algorithm of the original version and that of the
power-aware version shown in Table 2.
T (n) = nm + n
T'(n) = nm/2 + 3n
Table 1: A Green-Computing Version of the 'Hello World' Program for
Coarse-Grained (Left) and Fine-Grained (Right) Green Computing
Programme HelloWorld_c Programme HelloWorld_f
print "Hello World\n" activate(memory_bank)
low_power_mode() activate(io)
print "Hello World\n"
deactivate(memory_bank)
deactivate(io)
low_power_mode()
Table 2: A Power-Aware Merge Algorithm for Memory Power and Size
Reduction
Merge (A, L, R)
n = k = 0;
i = j = 2;
while(not (empty(L) or empty(R))) {
if (i = 2)
W1 = head(L);
i = 0;
if (j = 2)
W2 = head(R);
j = 0;
if (W1[i] > W2[j])
w[k++] = W2[j++];
else
w[k++] = W1[j++];
if k = 2
A[n++] = w;
k = 0;
end of while
// append the rest of lists to A
if (notempty(L)) append L to A
elseif (notempty(R)) append R to A
Page 40
cod
e op
timiz
atio
n te
chni
que
: an
app
roac
h to
war
ds
ener
gy
effic
ient
com
put
ing
Jan
uary
- M
arc
h 2
01
2a
qua
rterly
mag
azin
e of
the
soci
ety
of e
nerg
y en
gin
eers
and
man
ager
s / I
ndia
40
cod
e op
timiz
atio
n te
chni
que
: an
app
roac
h to
war
ds
ener
gy
effic
ient
com
put
ing
Jan
uary
- M
arc
h 2
01
2a
qua
rterly
mag
azin
e of
the
soci
ety
of e
nerg
y en
gin
eers
and
man
ager
s / I
ndia
41
where T(n) is the time complexity of the original
algorithm and T'(n) is that of the power-aware
algorithm.
However, the energy complexity for the original
version is 2 times as much as that of the power-aware
version if the data memory is much larger than the
programme memory. Therefore, it is necessary to
perform fine-grained tuning of the power consumption
of an algorithm. To reap that benefit, an algorithm will
typically be redesigned.
Similarly, when green computing is applied to
operating systems, especially its scheduler would
have to handle per-process requirements in order to
optimally control all peripherals in terms of power
consumption. If dynamic voltage scaling (DVS) were
to be added, the scheduler would have to consider
CPU power supply in light of the deadlines and
priorities of a task. Often there are situations where
lower voltage may end up consuming more power for
completing a task. Perhaps, the most difficult task is
to find where to sneak in green computing and how it
improves system performance.
A Novel Approach
There are two possible domains in which the study
can progress: One is software, and the other
hardware. On the grounds of software issues, there
are four approaches with reference to a typical
C/C++ programme, for instance. Source code and
instruction-level optimizations appear to be an
alternative in low power consumption analysis [3-5].
First, the use of some special operators in the source
code can contribute remarkably towards lowering
power consumption during its execution. This
technique is termed as 'algorithmic transformation'.
These special operators include:
1. Shorthand operators like +=, *=, /=, %=, -=, &=,
|=, ^=, ~=, <<= and >=
2. Increment/Decrement operators like ++, --. For
example, the assignment instruction n = n + 1 can
be replaced with the increment operator n++ or ++n
requiring only two cycles as against by the former that
requires three cycles for that instruction.
3. Tertiary operators like the conditional operator (test
condition ? expr1:expr2, syntactically) instead of
larger blocks of compound statements like 'If-elseif-
else' to compute a selection-based task.
Second, the use of operands from the registers rather
than from the memory will prove to be an appreciable
deal. An instruction using register operands costs up
to 300 mA of current per cycle, whereas the memory
read/write operations cost in the range of 430-530 mA
per cycle. Since the register set is limited and hence
cannot be used for applications with larger memory
requirement, the next alternative is seen in the form of
storing operands using caches. Further, the code
transformations available in recent scenarios help
improve the cache hit ratios and make it a better
option as compared to registers. This technique is
associated with memory management, as illustrated
by Tiwari et al. [6].
An instruction using register operands
costs up to 300 mA of current per cycle,
whereas the memory read/write operations
cost in the range of 430-530 mA per cycle.
Since the register set is limited and hence
cannot be used for applications with larger
memory requirement, the next alternative
is seen in the form of storing operands
using caches.
The use of inline functions has a
significant impact on power requirement.
In function inlining, the body of a function
is inserted directly into the code structure
where it is used.
Third, the technique of loop unrolling is being
considered. Loop unrolling is an optimization
technique where the body of a loop is copied several
times. This prevents the amount of power consumed
in the overhead otherwise caused during the change
in control flow due to loop transformations and
iterations. Since loop unrolling has been shown to
yield good results in terms of low power consumption
for the Intel 8051 platform in previous literature, there
seems to be a good sign for the validity of this
approach, as demonstrated by Ortiz and Santiago
[7].
Fourth, the use of inline functions has a significant
impact on power requirement. In function inlining, the
body of a function is inserted directly into the code
structure where it is used. Also, variable declaration is
used to replace variable types used in other methods,
which tend to lower power consumption [8].
There are several important works on source code-
level optimization. Source code-level optimization for
execution time has been studied extensively by
Leupers [9]. Leupers [9] and Sharma and Ravikumar
[10] classified source code optimization techniques
as machine-independent and machine-dependent. In
terms of source code optimization for power
reduction, Simunic et al. [11] classified code
optimization techniques into algorithmic, data-flow
and instruction-flow optimization. In our study, we
used algorithmic optimization since it does not take
into consideration the target platform. Dalal and
Ravikumar [3] studied software-dependent
components such as arithmetic circuits, data busses
and memories, as a way to lower power consumption
in embedded applications. Sharma and Ravikumar
[10] presented a study of the implementation of the
ADPCM codec benchmark. In this work, optimization
techniques applied at the source code level were
classified into structural and machine-dependent
optimization.
Tool Talk
MATLAB software serves as an apposite tool for the
analysis of the subject being researched here. The
following are a few relevant utilities available in this
tool.
1. Code Analyzer Report: It displays potential errors
and problems, as well as opportunities for
improvement, in MATLAB programmes. It displays a
message for each line of MATLAB code and
determines how it might be improved. For example, a
common message is that a variable is defined but
never used, as shown in Figure 1. By performing the
Page 41
cod
e op
timiz
atio
n te
chni
que
: an
app
roac
h to
war
ds
ener
gy
effic
ient
com
put
ing
Jan
uary
- M
arc
h 2
01
2a
qua
rterly
mag
azin
e of
the
soci
ety
of e
nerg
y en
gin
eers
and
man
ager
s / I
ndia
40
cod
e op
timiz
atio
n te
chni
que
: an
app
roac
h to
war
ds
ener
gy
effic
ient
com
put
ing
Jan
uary
- M
arc
h 2
01
2a
qua
rterly
mag
azin
e of
the
soci
ety
of e
nerg
y en
gin
eers
and
man
ager
s / I
ndia
41
where T(n) is the time complexity of the original
algorithm and T'(n) is that of the power-aware
algorithm.
However, the energy complexity for the original
version is 2 times as much as that of the power-aware
version if the data memory is much larger than the
programme memory. Therefore, it is necessary to
perform fine-grained tuning of the power consumption
of an algorithm. To reap that benefit, an algorithm will
typically be redesigned.
Similarly, when green computing is applied to
operating systems, especially its scheduler would
have to handle per-process requirements in order to
optimally control all peripherals in terms of power
consumption. If dynamic voltage scaling (DVS) were
to be added, the scheduler would have to consider
CPU power supply in light of the deadlines and
priorities of a task. Often there are situations where
lower voltage may end up consuming more power for
completing a task. Perhaps, the most difficult task is
to find where to sneak in green computing and how it
improves system performance.
A Novel Approach
There are two possible domains in which the study
can progress: One is software, and the other
hardware. On the grounds of software issues, there
are four approaches with reference to a typical
C/C++ programme, for instance. Source code and
instruction-level optimizations appear to be an
alternative in low power consumption analysis [3-5].
First, the use of some special operators in the source
code can contribute remarkably towards lowering
power consumption during its execution. This
technique is termed as 'algorithmic transformation'.
These special operators include:
1. Shorthand operators like +=, *=, /=, %=, -=, &=,
|=, ^=, ~=, <<= and >=
2. Increment/Decrement operators like ++, --. For
example, the assignment instruction n = n + 1 can
be replaced with the increment operator n++ or ++n
requiring only two cycles as against by the former that
requires three cycles for that instruction.
3. Tertiary operators like the conditional operator (test
condition ? expr1:expr2, syntactically) instead of
larger blocks of compound statements like 'If-elseif-
else' to compute a selection-based task.
Second, the use of operands from the registers rather
than from the memory will prove to be an appreciable
deal. An instruction using register operands costs up
to 300 mA of current per cycle, whereas the memory
read/write operations cost in the range of 430-530 mA
per cycle. Since the register set is limited and hence
cannot be used for applications with larger memory
requirement, the next alternative is seen in the form of
storing operands using caches. Further, the code
transformations available in recent scenarios help
improve the cache hit ratios and make it a better
option as compared to registers. This technique is
associated with memory management, as illustrated
by Tiwari et al. [6].
An instruction using register operands
costs up to 300 mA of current per cycle,
whereas the memory read/write operations
cost in the range of 430-530 mA per cycle.
Since the register set is limited and hence
cannot be used for applications with larger
memory requirement, the next alternative
is seen in the form of storing operands
using caches.
The use of inline functions has a
significant impact on power requirement.
In function inlining, the body of a function
is inserted directly into the code structure
where it is used.
Third, the technique of loop unrolling is being
considered. Loop unrolling is an optimization
technique where the body of a loop is copied several
times. This prevents the amount of power consumed
in the overhead otherwise caused during the change
in control flow due to loop transformations and
iterations. Since loop unrolling has been shown to
yield good results in terms of low power consumption
for the Intel 8051 platform in previous literature, there
seems to be a good sign for the validity of this
approach, as demonstrated by Ortiz and Santiago
[7].
Fourth, the use of inline functions has a significant
impact on power requirement. In function inlining, the
body of a function is inserted directly into the code
structure where it is used. Also, variable declaration is
used to replace variable types used in other methods,
which tend to lower power consumption [8].
There are several important works on source code-
level optimization. Source code-level optimization for
execution time has been studied extensively by
Leupers [9]. Leupers [9] and Sharma and Ravikumar
[10] classified source code optimization techniques
as machine-independent and machine-dependent. In
terms of source code optimization for power
reduction, Simunic et al. [11] classified code
optimization techniques into algorithmic, data-flow
and instruction-flow optimization. In our study, we
used algorithmic optimization since it does not take
into consideration the target platform. Dalal and
Ravikumar [3] studied software-dependent
components such as arithmetic circuits, data busses
and memories, as a way to lower power consumption
in embedded applications. Sharma and Ravikumar
[10] presented a study of the implementation of the
ADPCM codec benchmark. In this work, optimization
techniques applied at the source code level were
classified into structural and machine-dependent
optimization.
Tool Talk
MATLAB software serves as an apposite tool for the
analysis of the subject being researched here. The
following are a few relevant utilities available in this
tool.
1. Code Analyzer Report: It displays potential errors
and problems, as well as opportunities for
improvement, in MATLAB programmes. It displays a
message for each line of MATLAB code and
determines how it might be improved. For example, a
common message is that a variable is defined but
never used, as shown in Figure 1. By performing the
Page 42
cod
e op
timiz
atio
n te
chni
que
: an
app
roac
h to
war
ds
ener
gy
effic
ient
com
put
ing
Jan
uary
- M
arc
h 2
01
2a
qua
rterly
mag
azin
e of
the
soci
ety
of e
nerg
y en
gin
eers
and
man
ager
s / I
ndia
42
Ms. Soujanya
Nemalikanti and Ms.
Polavarapu Sindhura
are affiliated to the
Department of
Information Science
and Technology,
Koneru Lakshmaih
University,
Vaddeswaram, Guntur.
suggested transformations, lesser number of cycles
will be needed to execute the instructions.
2. Improving Performance Using the Profiler: MATLAB
Profiler helps you improve the performance of your
MATLAB programmes. Run a MATLAB statement or
any programme file in the Profiler, and it produces a
report of where the time is being spent (see Figure 2).
The Profiler can be accessed from the Desktop menu,
or the profile function can be used.
an unexpected and remarkable manner. In the near
future, the urge for eco-friendly solutions in
computing shall be on the rise, and so will be the
advancement in the relevant technology. In the
domain of software engineering, there is an
imperative requirement for the genesis of power-
aware algorithms and such transformations at the
instruction and source-code levels to optimize the
energy efficiency of a given software product, thereby
making it a 'green' software.
References
1. Botros S. (1996) Green Technology and Design for the
Environment, 3rd edn. New York: McGraw-Hill.
2. Grochowski E. and Annavaram M. Energy per instruction trends in
Intel® microprocessors, available at
http://support.intel.co.jp/pressroom/kits/core2duo/pdf/epi-trends-
final2.pdf.
3. Dalal V. and Ravikumar C.P. (2001) Software power optimizations in
an embedded system. Fourteenth International Conference on VLSI
Design, January 2001. pp. 254-59.
4. Oliver J., Mocanu O. and Ferrer C. (2003) Energy awareness
through software optimization as a performance estimate case study
of the MC68HC908GP32 microcontroller. Fourth International
Workshop on Microprocessor Test and Verification: Common
Challenges and Solutions, May 2003. pp. 111-16.
5. Yingbiao Y., Qingdong Y., Peng L. and Zhibin X. (2004) Embedded
software optimization for MP3 decoder implemented on RISC core.
IEEE Transactions on Consumer Electronics, 50(4):1244-49.
6. Tiwari V., Malik S. and Wolfe A. (1994) Compilation techniques for
low energy: An overview. Digest of Technical Papers, IEEE
Symposium on Low Power Electronics at San Diego, CA, USA, 10-12
October 1994. pp. 38-39.
7. Ortiz D.A. and Santiago N.G. (2007) High-level optimization for low
power consumption on microprocessor-based systems. Fiftieth IEEE
International Midwest Symposium on Circuits and Systems
(MWSCAS'07), August 2007. pp. 1265-68.
8. Zambreno J., Kandemir M.T. and Choudhary A. (2002) Enhancing
compiler techniques for memory energy optimizations. Embedded
Software. Second International Conference, EMSOFT 2002,
2491:364-81.
9. Leupers R. (2000) Code Optimization Techniques for Embedded
Processors. Dordrecht, NL: Kluwer Academic Publishers.
10. Sharma A. and Ravikumar C.P. (2000) Efficient implementation of
ADPCM codec. Thirteenth International Conference on VLSI Design,
January 2000. pp. 456-61.
11. Simunic T., Benini L. and de Micheli G. (2001) Energy-efficient
design of battery-powered embedded systems. IEEE Transactions on
Very Large Scale Integration Systems, 9(1):15-28.
Figure 1: A snapshot of the Code Analyzer in the MATLAB Tool
This is an indirect approach for power optimization.
The segment of the code that consumes the
maximum time for its execution, as depicted by the
profiler, can be modified so that it consumes lesser
number of time cycles for execution. This can
contribute to a lowering of the amount of power
consumed and thus to the fulfilment of our objective.
The contemporary developments towards a greener
epoch of computing have so far gained momentum in
Figure 2: This Utility in MATLAB Renders the Time Statistics Per
Instruction of the Input Code.
Page 43
Jan
uary
- M
arc
h 2
01
2a
qua
rterly
mag
azin
e of
the
soci
ety
of e
nerg
y en
gin
eers
and
man
ager
s / I
ndia
43
charring-briquetting:
a novel cookingfuel technology
Nema B P
Organic material can be charred and crushed into powder, which
can then be mixed with a binder and briquetted into compact solid
fuel like charcoal. The char briquettes are equivalent to charcoal in
burning characteristics and combustion efficiency. The Central
Institute of Agricultural Engineering (CIAE), Bhopal, has designed
and developed a high-capacity charring kiln, which can take a
charge of 100 kg crop residues in one run, yielding about 35-40 kg
of good quality char, and a power-operated briquetting machine,
which is basically a full-screw horizontal extruder machine similar to
plastic extruders/food product extruders.
Page 44
Table 1: Brief Specifications of the CIAE-Developed Charring Kiln and
Briquetting Machine.
CIAE charring kiln
Overall length 1100 mm
Overall diameter 800 mm
Material of construction MS sheets (3 mm),
MS flat (35 × 5) and
rod (12 mm dia)
Weight 75-80 kg
Capacity (char output) 80 kg/day
CIAE power-operated briquetting machine
Overall length 1.6 m
Overall width 3.0 m
Overall height 1.0 m
Size of the prime mover 3.75 kW electric motor
Barrel diameter 21 cm
Barrel Length 42 cm
No of screws 1
Pitch of the screw 20.7 cm
No of exit tubes 5
Length of the exit tube 7 cm
Diameter of the exit tube 3 cm
Power transmission Through belt and pulley
Jan
uary
- M
arc
h 2
01
2a
qua
rterly
mag
azin
e of
the
soci
ety
of e
nerg
y en
gin
eers
and
man
ager
s / I
ndia
44
char
ring
–briq
uetti
ng: a
nov
el c
ooki
ng fu
el te
chno
log
y
char
ring
–briq
uetti
ng: a
nov
el c
ooki
ng fu
el te
chno
log
y
Jan
uary
- M
arc
h 2
01
2a
qua
rterly
mag
azin
e of
the
soci
ety
of e
nerg
y en
gin
eers
and
man
ager
s / I
ndia
45
n rural areas fuel wood, cow dung and crop waste Iare used as kitchen fuel. Apart from these, people
use twigs, hard stalk/straw and so on, as such, to
build fire for cooking and heating. These fuels have
low heat output per unit of fuel used and release a lot
of gases harmful for human health. Over the above,
charcoal is a preferred fuel because it produces a
hot, long-lasting, virtually smokeless fire. In earlier
days, people were using the charcoal obtained from
partially burnt wood remaining at the end of the
routine cooking process. There also existed a practice
of turning powdery coal into balls for use as fuel.
Nevertheless, biofuels accounted for 80% of their
kitchen energy needs.
In rural areas, according to one expert's opinion, in
coming years there will be sufficient food but
insufficient fuel to cook the food, as the rate of
In the years to come, there will be
sufficient food but insufficient fuel to cook
the food in rural areas as well as among
the urban poor, which can be attributed to
the higher rate of deforestation as
compared to that of afforestation.
deforestation is very high in comparison to the
afforestation rate. The rural population is unable to
shift to commercial fuels due to their low purchasing
power and the limited availability of commercial fuels.
Urban poor (25-30% of the urban population) are also
heavily dependent on biofuel due to short supply of
commercial fuels like kerosene and liquefied
petroleum gas. Although a good number of Indian
villages are electrified, the supply of electricity is very
erratic and uncertain in the villages.
Evolution of the Design
Organic material can be charred and crushed into a
powder. The powdery char can then be mixed with a
binder and briquetted into a compact solid fuel like
charcoal. The char briquettes are equivalent to
charcoal in burning characteristics and combustion
efficiency. In the context of using loose biomass for
charring and briquetting, the following issues were
considered:
1. Performing the charring process locally, thus
avoiding collection and transportation of biomass in
large quantities and over long distances
2. Converting low-density biomass of poor thermal
efficiency into char
3. Converting the char thus produced into briquettes
at low pressure, requiring low energy input.
Charring Kiln
A number of charring kilns for processing biological
waste into charcoal, developed by various
organizations like the Tropical Products Institute (TPI),
London; Tongon, Tonga; Indian Institute of Technology
(IIT), Delhi, and Jawaharlal Nehru Krishi
Viswavidyalaya (JNKVV), Jabalpur, were evaluated at
the Central Institute of Agricultural Engineering
(CIAE), Bhopal, with crop residues and other locally
available forest wastes. Stationary charring kilns
require water to extinguish the fire after operation,
which necessitates some time before starting again.
Portable kilns do not produce the desired quality of
char due to improper air control, except the Tongon-
designed kiln. The study concluded that the 'Tongon'
kiln was better than other kilns in terms of the quality
and quantity of char, except that it was neither
economically viable nor ergonomically suitable. To
overcome the problems in existing charring kilns, a
high-capacity charring kiln was designed and
developed which can take a charge of 100 kg crop
residues in one run, yielding about 35-40 kg of good-
quality char. The kiln consists of a metallic cylinder
having a diameter of 800 mm and a length of 1100
mm. Both ends of the cylinder are closed. A
transverse rectangular lid of 550 mm × 450 mm is
provided on its side to serve as the feed inlet (for
specifications of the kiln see Table 1). A batch of 100
kg of crop residues is fed gradually and ignited. The
crop residues get converted into char in about 2-4 h
and yield about 35-40% charred material.
Performance of the machine
Charring of biomass is done at a low rate of heating,
and hence requires a sufficiently long time for the
reaction. The CIAE kiln was extensively evaluated with
soybean crop residue, and pigeon pea and cotton
stalks. About 100 kg of biomass was charged into the
kiln in one batch, and good-quality char was obtained
in a total time period of about 4 h. A char yield of 36%
was realized with cotton and pigeon pea stalks, and
40% with soyabean residue, with a high calorific value
of 15.0-17.5 MJ/kg. Long-duration evaluation of the
kiln over an extended period of more than 3 years
revealed that, on an average, 80 kg char per day can
be produced with one kiln in two batches. Two
unskilled workers were needed, and cost of operation
was Rs 270/q.
Briquetting Machine
A briquetting machine suitable for use in a village
setting should be able to meet the following
requirements:
A char yield of 36% was realized with
cotton and pigeon pea stalks, and 40%
with soyabean residue, with a high
calorific value of 15.0-17.5 MJ/kg. Long-
duration evaluation of the kiln over an
extended period of more than 3 years
revealed that, on an average, 80 kg char
per day can be produced with one kiln in
two batches.
Page 45
Table 1: Brief Specifications of the CIAE-Developed Charring Kiln and
Briquetting Machine.
CIAE charring kiln
Overall length 1100 mm
Overall diameter 800 mm
Material of construction MS sheets (3 mm),
MS flat (35 × 5) and
rod (12 mm dia)
Weight 75-80 kg
Capacity (char output) 80 kg/day
CIAE power-operated briquetting machine
Overall length 1.6 m
Overall width 3.0 m
Overall height 1.0 m
Size of the prime mover 3.75 kW electric motor
Barrel diameter 21 cm
Barrel Length 42 cm
No of screws 1
Pitch of the screw 20.7 cm
No of exit tubes 5
Length of the exit tube 7 cm
Diameter of the exit tube 3 cm
Power transmission Through belt and pulley
Jan
uary
- M
arc
h 2
01
2a
qua
rterly
mag
azin
e of
the
soci
ety
of e
nerg
y en
gin
eers
and
man
ager
s / I
ndia
44
char
ring
–briq
uetti
ng: a
nov
el c
ooki
ng fu
el te
chno
log
y
char
ring
–briq
uetti
ng: a
nov
el c
ooki
ng fu
el te
chno
log
y
Jan
uary
- M
arc
h 2
01
2a
qua
rterly
mag
azin
e of
the
soci
ety
of e
nerg
y en
gin
eers
and
man
ager
s / I
ndia
45
n rural areas fuel wood, cow dung and crop waste Iare used as kitchen fuel. Apart from these, people
use twigs, hard stalk/straw and so on, as such, to
build fire for cooking and heating. These fuels have
low heat output per unit of fuel used and release a lot
of gases harmful for human health. Over the above,
charcoal is a preferred fuel because it produces a
hot, long-lasting, virtually smokeless fire. In earlier
days, people were using the charcoal obtained from
partially burnt wood remaining at the end of the
routine cooking process. There also existed a practice
of turning powdery coal into balls for use as fuel.
Nevertheless, biofuels accounted for 80% of their
kitchen energy needs.
In rural areas, according to one expert's opinion, in
coming years there will be sufficient food but
insufficient fuel to cook the food, as the rate of
In the years to come, there will be
sufficient food but insufficient fuel to cook
the food in rural areas as well as among
the urban poor, which can be attributed to
the higher rate of deforestation as
compared to that of afforestation.
deforestation is very high in comparison to the
afforestation rate. The rural population is unable to
shift to commercial fuels due to their low purchasing
power and the limited availability of commercial fuels.
Urban poor (25-30% of the urban population) are also
heavily dependent on biofuel due to short supply of
commercial fuels like kerosene and liquefied
petroleum gas. Although a good number of Indian
villages are electrified, the supply of electricity is very
erratic and uncertain in the villages.
Evolution of the Design
Organic material can be charred and crushed into a
powder. The powdery char can then be mixed with a
binder and briquetted into a compact solid fuel like
charcoal. The char briquettes are equivalent to
charcoal in burning characteristics and combustion
efficiency. In the context of using loose biomass for
charring and briquetting, the following issues were
considered:
1. Performing the charring process locally, thus
avoiding collection and transportation of biomass in
large quantities and over long distances
2. Converting low-density biomass of poor thermal
efficiency into char
3. Converting the char thus produced into briquettes
at low pressure, requiring low energy input.
Charring Kiln
A number of charring kilns for processing biological
waste into charcoal, developed by various
organizations like the Tropical Products Institute (TPI),
London; Tongon, Tonga; Indian Institute of Technology
(IIT), Delhi, and Jawaharlal Nehru Krishi
Viswavidyalaya (JNKVV), Jabalpur, were evaluated at
the Central Institute of Agricultural Engineering
(CIAE), Bhopal, with crop residues and other locally
available forest wastes. Stationary charring kilns
require water to extinguish the fire after operation,
which necessitates some time before starting again.
Portable kilns do not produce the desired quality of
char due to improper air control, except the Tongon-
designed kiln. The study concluded that the 'Tongon'
kiln was better than other kilns in terms of the quality
and quantity of char, except that it was neither
economically viable nor ergonomically suitable. To
overcome the problems in existing charring kilns, a
high-capacity charring kiln was designed and
developed which can take a charge of 100 kg crop
residues in one run, yielding about 35-40 kg of good-
quality char. The kiln consists of a metallic cylinder
having a diameter of 800 mm and a length of 1100
mm. Both ends of the cylinder are closed. A
transverse rectangular lid of 550 mm × 450 mm is
provided on its side to serve as the feed inlet (for
specifications of the kiln see Table 1). A batch of 100
kg of crop residues is fed gradually and ignited. The
crop residues get converted into char in about 2-4 h
and yield about 35-40% charred material.
Performance of the machine
Charring of biomass is done at a low rate of heating,
and hence requires a sufficiently long time for the
reaction. The CIAE kiln was extensively evaluated with
soybean crop residue, and pigeon pea and cotton
stalks. About 100 kg of biomass was charged into the
kiln in one batch, and good-quality char was obtained
in a total time period of about 4 h. A char yield of 36%
was realized with cotton and pigeon pea stalks, and
40% with soyabean residue, with a high calorific value
of 15.0-17.5 MJ/kg. Long-duration evaluation of the
kiln over an extended period of more than 3 years
revealed that, on an average, 80 kg char per day can
be produced with one kiln in two batches. Two
unskilled workers were needed, and cost of operation
was Rs 270/q.
Briquetting Machine
A briquetting machine suitable for use in a village
setting should be able to meet the following
requirements:
A char yield of 36% was realized with
cotton and pigeon pea stalks, and 40%
with soyabean residue, with a high
calorific value of 15.0-17.5 MJ/kg. Long-
duration evaluation of the kiln over an
extended period of more than 3 years
revealed that, on an average, 80 kg char
per day can be produced with one kiln in
two batches.
Page 46
char
ring
–briq
uetti
ng: a
nov
el c
ooki
ng fu
el te
chno
log
yJa
nu
ary
- M
arc
h 2
01
2a
qua
rterly
mag
azin
e of
the
soci
ety
of e
nerg
y en
gin
eers
and
man
ager
s / I
ndia
46
1. It must be inexpensive and easy to operate.
2. It must be repairable and must be economical with
regard to energy consumption.
3. It must be suitable for a variety of biomass and
should not require sophisticated storage space for
the raw material or finished product.
Keeping these basic concepts in view, a power-
operated briquetting machine, which is basically a full
screw horizontal extruder machine similar to plastic
extruders/food product extruders, was developed by
CIAE (Table 1).
Performance of the machine
Char is converted into briquettes very easily even at
low pressure. The briquettes prepared from the
charred biomass can serve as an excellent domestic
fuel. The volume of the briquettes was only 9-11% of
the original feed material, that is, biomass. Therefore,
it may be concluded that this integrated technology
helps to save on transportation charges of feed
material. The briquettes can be produced
economically using a power-operated machine having
a capacity of 75 kg/h and using 10% cow dung as
binder.
Specific Features of the Charring-and-Briquetting
Technology
1. Easy handling of crop residues
2. Less space required for storage of briquettes due
to reduction in volume
3. Easy to use in traditional and improved sigris
4. Simple and low-cost
5. Eco-friendly and hence reduced smoke density in
kitchen
6. High thermal efficiency
7. Technology suitable for rural entrepreneurship
Economics of Operation
Cost economics was worked out for a system of six
charring kilns and one briquetting machine with a
production capacity of 500 kg briquettes per day. Life
of the charring kilns was considered as 3 years and
that of the briquetting machine as 10 years with an
annual usage of 1200 h. After considering the cost of
operation of the charring kilns and briquetting
machine, the estimated annual profit was Rs 97,800.
Farmers, entrepreneurs, village artisans,
village extension officers and engineers
from state government were trained in the
use of the charring kiln and briquetting
machine. Under the operational research
project, briquettes were supplied to more
than 500 families in the nearby villages for
use in improved cook stoves.
Present Status of the Technology
A number of demonstrations were conducted in the
nearby villages to create awareness. Farmers,
entrepreneurs, village artisans, village extension
officers and engineers from state government were
trained in the use of the charring kiln and briquetting
machine. Under the operational research project,
briquettes were supplied to more than 500 families in
the nearby villages for use in improved cook stoves.
Improved Cook stove: Specific features
1. Radiation and
convection losses
have been
considerably
reduced by
enclosing the
burning
charcoal/briquettes
within two concentric
aluminium reflectors
between which an
insulating layer of
asbestos cloth of 3-5
mm thickness is riveted firmly.
2. There is a saving of 60% expenditure in the
operation of the improved sigri over the traditional
method of chulah and fuel wood.
3. CO emission into the breathing zone is 2-3 ppm
from the improved sigri, as compared to the
emission of 12-15 ppm from a single-mouth
chulah.
4. The improved sigri is portable, with a weight of
only 2.0 kg.
Mr. B P Nema is Principal Scientist
at Central Institute of Agricultural
Engineering, ICAR, Bhopal
Page 47
Jan
uary
- M
arc
h 2
01
2a
qua
rterly
mag
azin
e of
the
soci
ety
of e
nerg
y en
gin
eers
and
man
ager
s / I
ndia
47
wind turbinesfor oceanic areas:
innovations anddevelopments
Ron Steenbergen
Two of the continuing problems faced by wind power development in most
areas of the world are the inability to make real inroads into the use of diesel
in power systems (the 'penetration rate') and the inability to accurately
forecast the expected generation from wind turbines ('dispatchability'). This
article discusses the innovations in the wind power industry in recent months
on these two major issues and the ongoing development of wind power to
improve its applicability in grid-connected and off-grid situations.
Page 48
different approaches and different
technical solutions. Even the simplest of
solutions may achieve substantial fuel
savings if the right approach is adapted.
There is no unique solution for wind-diesel coupling.
Attention is often focused on integrated systems with
very high penetration rates. They may be the best
solution when financial and technical means are
considered. However, the concept cannot be applied
to all locations. Different contexts require different
approaches and different technical solutions. Even
the simplest of solutions may achieve substantial fuel
savings if the right approach is adapted.
Jan
uary
- M
arc
h 2
01
2a
qua
rterly
mag
azin
e of
the
soci
ety
of e
nerg
y en
gin
eers
and
man
ager
s / I
ndia
48
win
d tu
rbin
es fo
r oce
anic
are
as: i
nnov
atio
ns a
nd d
evel
opm
ents
win
d tu
rbin
es fo
r oce
anic
are
as: i
nnov
atio
ns a
nd d
evel
opm
ents
Jan
uary
- M
arc
h 2
01
2a
qua
rterly
mag
azin
e of
the
soci
ety
of e
nerg
y en
gin
eers
and
man
ager
s / I
ndia
49
ind turbines have a long and productive history Win oceanic areas, including the Pacific and
Indian Oceans and other similar regions around the
world. Wind power plays a vital role in delivering
mainstream renewable energy in a sustainable
manner and is one of the most widely available,
commercial and proven forms of renewable energy
that can be deployed in the 'oceanic island' context.
Power from wind is able to compete commercially
with that of diesel generation in many regions and
has helped usher in economic development in many
poor countries.
Even though many successful wind energy projects
have been developed in oceanic regions, they had
faced a number of challenges and difficulties. Typical
challenges include areas being prone to cyclones,
remoteness, low accessibility and lack of suitable
cranes. Two of the continuing problems faced by wind
power development in most areas of the world are the
inability to make real inroads into the use of diesel in
power systems (the 'penetration rate') and the inability
to accurately forecast the expected generation from
wind turbines ('dispatchability'). This article will
discuss the innovations in the wind power industry in
recent months on these two major issues and provide
a taste of the ongoing development of wind power to
improve its applicability in grid-connected and off-grid
situations.
Increasing the Penetration Rate
Historically, when fuel prices were significantly lower
than they are today, remote locations were supplied
with electricity by diesel units in majority of cases, as
the technology is reliable, mature and well known.
However, evolution of fuel prices, together with
increasing reliability of alternative energy sources, has
spurred the emergence of a new market for megawatt
(MW)-scale hybrid systems, capable of meeting the
increasing power demand. Wind energy is often used
as the main means of reducing the dependency on
diesel.
Attention has been focused on a few
operating systems or concepts featuring
advanced components and controls,
sometimes performing remarkably well
and achieving high fuel savings. Such
systems are, however, very costly and
require a high level of technical
competence, and often need public
subsidies. In remote locations with very
little infrastructure and technical means,
such skill levels are seldom available, not
to mention the financial means or
subsidies.
In industrialized countries, much effort has been put
in the development of high-penetration wind systems.
Attention has been focused on a few operating
systems or concepts featuring advanced components
and controls, sometimes performing remarkably well
and achieving high fuel savings. Such systems are,
however, very costly and require a high level of
technical competence, and often need public
subsidies. In remote locations with very little
infrastructure and technical means, such skill levels
are seldom available, not to mention the financial
means or subsidies. Such solutions are therefore hard
to implement or not sustainable in an island context.
Comparatively little attention has been paid to
solutions designed for meeting such needs, although
they concern a much larger share of the population
and represent a larger market. Hybrid systems
suitable for such locations require a sturdy and
proven design, reliable, replicable and easy to
maintain. The new generation of wind-diesel (low
load) systems, now implemented in the megawatt
range, have taken up this challenge. With a
sophisticated architecture comprising of wind
turbines, low-load diesel power plants and a control
system ensuring optimal management of and
dialogue between the wind and diesel plants, they
can achieve an annual average wind penetration of
between 30% and 40%, with low wind energy losses,
and do not demand new competencies from the utility
staff - diesel sets are off-the-shelf models but sized to
match the wind turbine.
Efforts have also been underway to achieve 50% or
higher average wind penetration, while keeping the
industrial vision for reliability of the system and
deployment on remote island grids. The idea is to
have an integrated solution for grid management
support together with forecast elements. This allows
utilities to have a clear vision of how much energy will
be available in the coming hours, anticipating the
wind level and the load curve, thus overcoming wind
resource variability.
The production units of an effective wind-diesel hybrid
system added to a weak grid should contribute to
grid support to reach high penetration rates. In
particular, they should provide the following services:
wLow-voltage ride through: the production unit
remains connected to help pass a fault on the grid.
wFrequency and voltage regulation: by adjusting the
input of active and reactive power to the grid
wOperational power reserve: input power to help
pass a major fault on the grid
wAnticipation of power production: help the utility
manage the number and type of production units to
run at an efficient load factor in order to increase wind
penetration; wind turbines should behave like a diesel
generator for a stipulated time period.
There is no unique solution for wind-diesel
coupling. Different contexts require Figure 1: Demonstrated Payback Period for Wind-Diesel Systems
Figure 2: Schematic Representation of Wind-Diesel System Control
Page 49
different approaches and different
technical solutions. Even the simplest of
solutions may achieve substantial fuel
savings if the right approach is adapted.
There is no unique solution for wind-diesel coupling.
Attention is often focused on integrated systems with
very high penetration rates. They may be the best
solution when financial and technical means are
considered. However, the concept cannot be applied
to all locations. Different contexts require different
approaches and different technical solutions. Even
the simplest of solutions may achieve substantial fuel
savings if the right approach is adapted.
Jan
uary
- M
arc
h 2
01
2a
qua
rterly
mag
azin
e of
the
soci
ety
of e
nerg
y en
gin
eers
and
man
ager
s / I
ndia
48
win
d tu
rbin
es fo
r oce
anic
are
as: i
nnov
atio
ns a
nd d
evel
opm
ents
win
d tu
rbin
es fo
r oce
anic
are
as: i
nnov
atio
ns a
nd d
evel
opm
ents
Jan
uary
- M
arc
h 2
01
2a
qua
rterly
mag
azin
e of
the
soci
ety
of e
nerg
y en
gin
eers
and
man
ager
s / I
ndia
49
ind turbines have a long and productive history Win oceanic areas, including the Pacific and
Indian Oceans and other similar regions around the
world. Wind power plays a vital role in delivering
mainstream renewable energy in a sustainable
manner and is one of the most widely available,
commercial and proven forms of renewable energy
that can be deployed in the 'oceanic island' context.
Power from wind is able to compete commercially
with that of diesel generation in many regions and
has helped usher in economic development in many
poor countries.
Even though many successful wind energy projects
have been developed in oceanic regions, they had
faced a number of challenges and difficulties. Typical
challenges include areas being prone to cyclones,
remoteness, low accessibility and lack of suitable
cranes. Two of the continuing problems faced by wind
power development in most areas of the world are the
inability to make real inroads into the use of diesel in
power systems (the 'penetration rate') and the inability
to accurately forecast the expected generation from
wind turbines ('dispatchability'). This article will
discuss the innovations in the wind power industry in
recent months on these two major issues and provide
a taste of the ongoing development of wind power to
improve its applicability in grid-connected and off-grid
situations.
Increasing the Penetration Rate
Historically, when fuel prices were significantly lower
than they are today, remote locations were supplied
with electricity by diesel units in majority of cases, as
the technology is reliable, mature and well known.
However, evolution of fuel prices, together with
increasing reliability of alternative energy sources, has
spurred the emergence of a new market for megawatt
(MW)-scale hybrid systems, capable of meeting the
increasing power demand. Wind energy is often used
as the main means of reducing the dependency on
diesel.
Attention has been focused on a few
operating systems or concepts featuring
advanced components and controls,
sometimes performing remarkably well
and achieving high fuel savings. Such
systems are, however, very costly and
require a high level of technical
competence, and often need public
subsidies. In remote locations with very
little infrastructure and technical means,
such skill levels are seldom available, not
to mention the financial means or
subsidies.
In industrialized countries, much effort has been put
in the development of high-penetration wind systems.
Attention has been focused on a few operating
systems or concepts featuring advanced components
and controls, sometimes performing remarkably well
and achieving high fuel savings. Such systems are,
however, very costly and require a high level of
technical competence, and often need public
subsidies. In remote locations with very little
infrastructure and technical means, such skill levels
are seldom available, not to mention the financial
means or subsidies. Such solutions are therefore hard
to implement or not sustainable in an island context.
Comparatively little attention has been paid to
solutions designed for meeting such needs, although
they concern a much larger share of the population
and represent a larger market. Hybrid systems
suitable for such locations require a sturdy and
proven design, reliable, replicable and easy to
maintain. The new generation of wind-diesel (low
load) systems, now implemented in the megawatt
range, have taken up this challenge. With a
sophisticated architecture comprising of wind
turbines, low-load diesel power plants and a control
system ensuring optimal management of and
dialogue between the wind and diesel plants, they
can achieve an annual average wind penetration of
between 30% and 40%, with low wind energy losses,
and do not demand new competencies from the utility
staff - diesel sets are off-the-shelf models but sized to
match the wind turbine.
Efforts have also been underway to achieve 50% or
higher average wind penetration, while keeping the
industrial vision for reliability of the system and
deployment on remote island grids. The idea is to
have an integrated solution for grid management
support together with forecast elements. This allows
utilities to have a clear vision of how much energy will
be available in the coming hours, anticipating the
wind level and the load curve, thus overcoming wind
resource variability.
The production units of an effective wind-diesel hybrid
system added to a weak grid should contribute to
grid support to reach high penetration rates. In
particular, they should provide the following services:
wLow-voltage ride through: the production unit
remains connected to help pass a fault on the grid.
wFrequency and voltage regulation: by adjusting the
input of active and reactive power to the grid
wOperational power reserve: input power to help
pass a major fault on the grid
wAnticipation of power production: help the utility
manage the number and type of production units to
run at an efficient load factor in order to increase wind
penetration; wind turbines should behave like a diesel
generator for a stipulated time period.
There is no unique solution for wind-diesel
coupling. Different contexts require Figure 1: Demonstrated Payback Period for Wind-Diesel Systems
Figure 2: Schematic Representation of Wind-Diesel System Control
Page 50
Case Study 1 - Coral Bay, Australia
Technology flywheel, low-load gensets,
full automation
Installed capacity Wind: 3 x 275 kW
Diesel: 7 x 320 kW modified
for low load
Flywheel: 500 kW
Peak load 700 kW
The system is designed to achieve a very high wind
penetration rate with high power quality. Integration of
all components was considered from the beginning.
wThe size of the power station allows flexible
management of operating power. Diesel gensets
are modified to run at a low load factor to leave
room for wind energy and to limit the number of
starts, thus reducing maintenance costs.
wThe wind turbines are rated in such a way to match
the size of the diesel generator.
wFor periods of very high wind penetration, a
flywheel supports the stability of the grid and
provides high power quality.
wManagement of the power station, flywheel, wind
turbines and the load is fully automated.
Installation of the system benefitted from subsidies
from the authorities in accordance with their
renewable energy policy.
Case Study 2 - Devil's Point, Vanuatu
Technology Conventional diesel power
station, manual management of
coupling, no storage
Installed capacity Wind: 11 x 275 kW
Diesel: 2 x 4.1 MW + 4 x 1 MW +
10 MW in Vila
Peak load 11 MW
Approach: The asset owner chose to proceed step by
step, for a gradual insertion of wind turbines in the
energy mix. The idea is both to gradually assimilate
the management of a new technology and to test the
impact of wind energy on the local grid.
2007: The existing conventional power station is
based on low-speed diesel generators. A single 275
kW wind turbine is installed as a pilot project.
2008: Ten additional 275 kW wind turbines are added,
together with four containerized high-speed diesel
generators. The capability of the grid to absorb wind
fluctuations is assessed; operators learn to adapt the
management of the power station to the wind profile
and wind turbine response.
Next step: The asset owner is considering the
installation of additional 275 kW wind turbines to
reach 30% average wind penetration and the
extension of the high-speed diesel capacity of the
power station. Automation of the whole system is an
option, but may not be necessary at the moment.
The system does not benefit from any subsidy for
equipment installation, nor from any customer tariff
policy or fuel pricing policy. Although the average
income per capita of the country is quite low, the tariff
policy actually reflects the true cost of energy
production. Wind energy is thus cheaper than diesel,
resulting in effective fuel savings and reduction of
operating cost.
After the first year of operation, as of December 2009:
Average wind penetration: 17% (source: Unelco)
Instantaneous penetration: >60% (source: Unelco)
With the extension of the wind farm to include more
275 kW wind turbines, the average wind penetration is
expected to rise to 30%.
win
d tu
rbin
es fo
r oce
anic
are
as: i
nnov
atio
ns a
nd d
evel
opm
ents
Jan
uary
- M
arc
h 2
01
2a
qua
rterly
mag
azin
e of
the
soci
ety
of e
nerg
y en
gin
eers
and
man
ager
s / I
ndia
50
win
d tu
rbin
es fo
r oce
anic
are
as: i
nnov
atio
ns a
nd d
evel
opm
ents
Jan
uary
- M
arc
h 2
01
2a
qua
rterly
mag
azin
e of
the
soci
ety
of e
nerg
y en
gin
eers
and
man
ager
s / I
ndia
51
Figure 5: Devil's Point Wind Farm, Vanuatu
guarantee. Forecasts of 48 or 72 hours in
advance can also be offered, with a
consequent reduction in accuracy and
guarantee.
Predictability - Forecasting Wind Energy
Production
Thanks to the extensive experience with weak grids,
especially in islands, wind turbines can now offer
solutions to address utility concerns: grid support to
reach higher wind penetration rates, while avoiding
the two drawbacks of high-penetration systems,
namely, cost and technical complexity. These systems
can then lend themselves to providing accurate
forecasts of power generation from a wind farm by as
much as 24 hours in advance with a 95% guarantee.
Forecasts of 48 or 72 hours in advance can also be
offered, with a consequent reduction in accuracy and
guarantee.
Recent innovations that provide flexibility, certainty
and adaptability for accurate energy forecasts include
a number of differing technologies.
1. The AC-DC-AC drive (back-to-back converter)
buffers power quality fluctuations and also
Figure 3: Example of an Automated Flywheel System for High
Penetration Stability
Average wind penetration: 70% (source: Powercorp)
Instantaneous penetration: up to 98% (source:
Powercorp)
The flywheel ensures frequency and voltage stability
at high wind penetration and serves as a power
reserve for very short time periods (see Figure 4).
Figure 4: Performance Graph of the System with Flywheel Installed
Figure 6: Wind Farm Output in Grid Supply
These systems can then lend themselves
to providing accurate forecasts of power
generation form a wind farm by as much
as 24 hours in advance with a 95%
Page 51
Case Study 1 - Coral Bay, Australia
Technology flywheel, low-load gensets,
full automation
Installed capacity Wind: 3 x 275 kW
Diesel: 7 x 320 kW modified
for low load
Flywheel: 500 kW
Peak load 700 kW
The system is designed to achieve a very high wind
penetration rate with high power quality. Integration of
all components was considered from the beginning.
wThe size of the power station allows flexible
management of operating power. Diesel gensets
are modified to run at a low load factor to leave
room for wind energy and to limit the number of
starts, thus reducing maintenance costs.
wThe wind turbines are rated in such a way to match
the size of the diesel generator.
wFor periods of very high wind penetration, a
flywheel supports the stability of the grid and
provides high power quality.
wManagement of the power station, flywheel, wind
turbines and the load is fully automated.
Installation of the system benefitted from subsidies
from the authorities in accordance with their
renewable energy policy.
Case Study 2 - Devil's Point, Vanuatu
Technology Conventional diesel power
station, manual management of
coupling, no storage
Installed capacity Wind: 11 x 275 kW
Diesel: 2 x 4.1 MW + 4 x 1 MW +
10 MW in Vila
Peak load 11 MW
Approach: The asset owner chose to proceed step by
step, for a gradual insertion of wind turbines in the
energy mix. The idea is both to gradually assimilate
the management of a new technology and to test the
impact of wind energy on the local grid.
2007: The existing conventional power station is
based on low-speed diesel generators. A single 275
kW wind turbine is installed as a pilot project.
2008: Ten additional 275 kW wind turbines are added,
together with four containerized high-speed diesel
generators. The capability of the grid to absorb wind
fluctuations is assessed; operators learn to adapt the
management of the power station to the wind profile
and wind turbine response.
Next step: The asset owner is considering the
installation of additional 275 kW wind turbines to
reach 30% average wind penetration and the
extension of the high-speed diesel capacity of the
power station. Automation of the whole system is an
option, but may not be necessary at the moment.
The system does not benefit from any subsidy for
equipment installation, nor from any customer tariff
policy or fuel pricing policy. Although the average
income per capita of the country is quite low, the tariff
policy actually reflects the true cost of energy
production. Wind energy is thus cheaper than diesel,
resulting in effective fuel savings and reduction of
operating cost.
After the first year of operation, as of December 2009:
Average wind penetration: 17% (source: Unelco)
Instantaneous penetration: >60% (source: Unelco)
With the extension of the wind farm to include more
275 kW wind turbines, the average wind penetration is
expected to rise to 30%.
win
d tu
rbin
es fo
r oce
anic
are
as: i
nnov
atio
ns a
nd d
evel
opm
ents
Jan
uary
- M
arc
h 2
01
2a
qua
rterly
mag
azin
e of
the
soci
ety
of e
nerg
y en
gin
eers
and
man
ager
s / I
ndia
50
win
d tu
rbin
es fo
r oce
anic
are
as: i
nnov
atio
ns a
nd d
evel
opm
ents
Jan
uary
- M
arc
h 2
01
2a
qua
rterly
mag
azin
e of
the
soci
ety
of e
nerg
y en
gin
eers
and
man
ager
s / I
ndia
51
Figure 5: Devil's Point Wind Farm, Vanuatu
guarantee. Forecasts of 48 or 72 hours in
advance can also be offered, with a
consequent reduction in accuracy and
guarantee.
Predictability - Forecasting Wind Energy
Production
Thanks to the extensive experience with weak grids,
especially in islands, wind turbines can now offer
solutions to address utility concerns: grid support to
reach higher wind penetration rates, while avoiding
the two drawbacks of high-penetration systems,
namely, cost and technical complexity. These systems
can then lend themselves to providing accurate
forecasts of power generation from a wind farm by as
much as 24 hours in advance with a 95% guarantee.
Forecasts of 48 or 72 hours in advance can also be
offered, with a consequent reduction in accuracy and
guarantee.
Recent innovations that provide flexibility, certainty
and adaptability for accurate energy forecasts include
a number of differing technologies.
1. The AC-DC-AC drive (back-to-back converter)
buffers power quality fluctuations and also
Figure 3: Example of an Automated Flywheel System for High
Penetration Stability
Average wind penetration: 70% (source: Powercorp)
Instantaneous penetration: up to 98% (source:
Powercorp)
The flywheel ensures frequency and voltage stability
at high wind penetration and serves as a power
reserve for very short time periods (see Figure 4).
Figure 4: Performance Graph of the System with Flywheel Installed
Figure 6: Wind Farm Output in Grid Supply
These systems can then lend themselves
to providing accurate forecasts of power
generation form a wind farm by as much
as 24 hours in advance with a 95%
Page 52
win
d tu
rbin
es fo
r oce
anic
are
as: i
nnov
atio
ns a
nd d
evel
opm
ents
Jan
uary
- M
arc
h 2
01
2a
qua
rterly
mag
azin
e of
the
soci
ety
of e
nerg
y en
gin
eers
and
man
ager
s / I
ndia
52
w
w
wprovides reactive power even without active power
production
wprovides a baseplate for embedded battery storage
or development of super-capacity supplements.
2. Battery storage plugged on to the DC bus of the
AC-DC-AC link provides power reserve for grid
support and easier production unit management.
Several working modes are possible:
wProduction: the wind turbine produces the
maximum power depending on wind conditions
wStorage (from the wind turbine or from the grid):
storage is done by transferring power from the DC
bus to the batteries
wPower reserve call: if grid frequency drops below a
pre-defined threshold, extra power is supplied from
batteries to the DC bus, which is then injected to
support the grid. Warning is sent to the utility to
take appropriate action before the reserve is
exhausted (1/4 hour).
3. Production forecast: Together with the embedded
turbine power reserve, power forecast at 72 h/48 h/24
h allows the utility to plan production and optimize its
spinning reserve:
wPower production is based on weather forecasts,
which are very reliable today
wThanks to forecast reliability, batteries are little
used as power reserve, thus reducing wear cycles.
wPower production can be adjusted with either
storage or power limitation and remain stable for
30 min
With grid support capability, wind energy no longer
belongs to the intermittent sources of power, allowing
ensures compliance to all grid codes
provides fault-ride-through capability
Battery storage plugged on to the DC bus
of the AC-DC-AC link provides power
reserve for grid support and easier
production unit management. Several
working modes are possible.
Mr. Ron Steenbergen is the
Managing Director of
Projectioneering Pvt Ltd and has
over 30 years of technical,
environmental and project
management experience in
renewable energy development.
Figure 7: Example of Forecast (red) v Actual (green) Generation
of a Wind Project
higher penetration rates of wind energy on small
grids, at a reasonable cost and avoiding complex
solutions.
These innovative uses of a traditional technology
improve the technology's abilities in
wgenuine reduction of fuel usage in diesel-
dominated power systems
wlong-term sustainability of commercially viable
renewables
wforecasting the generation output for the following
day
wimproved power quality and power system
reliability
wmanaging demand and load in power system
dispatch
These processes also lend themselves to further
innovation by incorporating low-cost technologies under
development at present such as battery storage or super
capacity to provide energy buffering.
Note: This article was prepared based upon a presentation made by
the author to the Pacific Power Association 2011 Conference in Guam.
Page 54
Jan
ua
ry -
Ma
rch
2012
a q
uarte
rly m
agaz
ine
of th
e so
ciet
y of
ene
rgy
eng
inee
rs a
nd m
anag
ers
/ Ind
ia
54
Jan
ua
ry -
Ma
rch
2012
a q
uarte
rly m
agaz
ine
of th
e so
ciet
y of
ene
rgy
eng
inee
rs a
nd m
anag
ers
/ Ind
ia
55
ith the high growth rate of the Indian Weconomy, energy needs are growing rapidly.
India ranks fifth in the world in terms of energy
consumption. The average annual growth rate of
energy consumption is growing at about 6% per
annum with economy growth pegged at 7-8%. This
will lead to a growing gap between demand and
supply of commercial energy, resulting in an
increasing dependence on imported oil.
The total energy consumption of the country in
2007-08 was 570 million tonnes of oil equivalent
(MTOE) of which 745 was from commercial sources
like coal, oil, hydro and so on, while 265 was from
non-commercial sources. The total energy
consumption is expected to rise threefold to 1836
MTOE by 2031-32 of which 90% will be accounted
for by commercial energy.
In India, during the period 1960-2007, the use of
commercial sources of energy increased 10-fold
and electricity use increased by 100 times. In the
non-commercial sector, India uses 200 million
tonnes of fuel wood, apart from large quantities of
energy and environment
symbiosisA.K. Jain
Indian cities are facing a grim situation
in terms of energy. To tackle this
situation, there is a need to evolve a
multi-pronged and multi-disciplinary
approach. The basic premise of a
sustainable, energy-efficient city is
conservation of transport fuels and
energy. A sustainable urban structure
begins with the urban region, the city
and its hinterland; the sustainability of
each is dependent on the other. At the
level of the city, a 'walkable'
community provides the fundamental
building block in creating a
sustainable urban form.
Page 55
Jan
ua
ry -
Ma
rch
2012
a q
uarte
rly m
agaz
ine
of th
e so
ciet
y of
ene
rgy
eng
inee
rs a
nd m
anag
ers
/ Ind
ia
54
Jan
ua
ry -
Ma
rch
2012
a q
uarte
rly m
agaz
ine
of th
e so
ciet
y of
ene
rgy
eng
inee
rs a
nd m
anag
ers
/ Ind
ia
55
ith the high growth rate of the Indian Weconomy, energy needs are growing rapidly.
India ranks fifth in the world in terms of energy
consumption. The average annual growth rate of
energy consumption is growing at about 6% per
annum with economy growth pegged at 7-8%. This
will lead to a growing gap between demand and
supply of commercial energy, resulting in an
increasing dependence on imported oil.
The total energy consumption of the country in
2007-08 was 570 million tonnes of oil equivalent
(MTOE) of which 745 was from commercial sources
like coal, oil, hydro and so on, while 265 was from
non-commercial sources. The total energy
consumption is expected to rise threefold to 1836
MTOE by 2031-32 of which 90% will be accounted
for by commercial energy.
In India, during the period 1960-2007, the use of
commercial sources of energy increased 10-fold
and electricity use increased by 100 times. In the
non-commercial sector, India uses 200 million
tonnes of fuel wood, apart from large quantities of
energy and environment
symbiosisA.K. Jain
Indian cities are facing a grim situation
in terms of energy. To tackle this
situation, there is a need to evolve a
multi-pronged and multi-disciplinary
approach. The basic premise of a
sustainable, energy-efficient city is
conservation of transport fuels and
energy. A sustainable urban structure
begins with the urban region, the city
and its hinterland; the sustainability of
each is dependent on the other. At the
level of the city, a 'walkable'
community provides the fundamental
building block in creating a
sustainable urban form.
Page 56
ener
gy
and
env
ironm
ent s
ymb
iosi
sJa
nu
ary
- M
arc
h 2
01
2a
qua
rterly
mag
azin
e of
the
soci
ety
of e
nerg
y en
gin
eers
and
man
ager
s / I
ndia
56
ener
gy
and
env
ironm
ent s
ymb
iosi
sJa
nu
ary
- M
arc
h 2
01
2a
qua
rterly
mag
azin
e of
the
soci
ety
of e
nerg
y en
gin
eers
and
man
ager
s / I
ndia
57
cow dung and agricultural waste. The increasing
energy consumption is having a direct bearing on the
environment and economy.
Among the commercial sources of energy, coal and
lignite contribute about 59%, oil and natural gas
about 37%, and hydro-electric and nuclear power
around 4%. Thus, the main source of energy is the
stored hydrocarbons (96%) under the earth's crust,
which are being utilized liberally. At present, over 70%
of the oil requirements are met from imported
sources. The cost of energy is ever increasing, and
the lack of development of non-conventional energy
sources is making the energy situation more
challenging.
Energy, Emissions and Environment
Production, conversion and use of energy play a
significant role in global warming, which affects the
environment. In the coming decades, global
environment issues can dictate the patterns of energy
use. The principal international energy issues revolve
around supply interruptions and their implications for
energy security and price stability, and the impact of
energy production and consumption on regional and
global environments.
The use of coal on a worldwide basis will increase at
an average rate of 1.6% per year. But in India its use
will be almost double by 2025 or so. The total
recoverable reserves of coal around the world are
estimated at 1088 billion tons, out of which India's
reserve is around 100 billion tons. Between 1996 and
2020, use of coal for electricity generation in India is
projected to rise by 3% per year. India is expected to
increase its consumption of electricity at an average
annual rate of 4.9% from 1996 to 2020. In future
years, coal-based energy generation will face tough
challenges as far as environmental pollution is
concerned.
The automobile sector and thermal power plants are
the major contributors towards atmospheric pollution.
Combustion of coal, oil and natural gas accounts for
roughly three-quarters of all carbon dioxide
The use of coal on a worldwide basis will
increase at an average rate of 1.6% per
year. But in India its use will be almost
double by 2025 or so.
emissions. The industrial sector accounts for more
than one-third of the global carbon dioxide emission
from fossil fuel combustion (excluding the power
sector), the residential and commercial sector 32%,
and the transport sector a bit over 21%.
Development of eco-friendly energy supply opens up
enormous opportunities for international cooperation.
It is important to structure pricing mechanisms,
relations with other countries and commercial
transactions in a manner that meets the long-term
objectives of adequate and sustainable energy.
Renewable Sources of Energy
Harnessing of renewable energy aims not only
increasing energy generation but also helping to
restore a pollution-free environment. It is estimated
that India has the potential of generating more than
1,00,000 MW from non-conventional sources of
energy. Table 1 indicates the potential of various
renewable energy resources.
Table 1: Renewable Energy Resources Potential
In the Indian context, energy efficiency and alternative
energy sources offer the biggest scope for cutting
carbon dioxide emissions. Two missions - Solar
Mission and Enhanced Energy Efficiency Mission -
have been constituted by the Government of India to
address these issues.
The town or city depends on its hinterland
for food and water, clean air and open
space, and, looking to the future, for
biomass for fuel. The hinterland depends
on the town or city as a market for its
produce and for employment and
services. Sustainable planning demands a
more holistic and integrated approach to
the urban region, which recognizes the
interdependence and potential of both
town and country.
Urban Structure and Transport for Energy
Efficiency
In the context of surging oil prices and increasing
energy demand, urban planning assumes a critical
role. The solution to the huge energy demand lies
beyond enhancing power generation. It is the form of
the city structure, zoning controls, land use and
density pattern, together with architecture, building
and management options, which have to be tackled
in a holistic manner. The basic premise of a
sustainable, energy-efficient city is conservation of
transport fuels and energy. Sustainable urban
structure begins with the urban region, the city and its
hinterland; the sustainability of each is dependent on
the other. The town or city depends on its hinterland
for food and water, clean air and open space, and,
looking to the future, for biomass for fuel. The
hinterland depends on the town or city as a market
for its produce and for employment and services.
Sustainable planning demands a more holistic and
integrated approach to the urban region, which
Page 57
ener
gy
and
env
ironm
ent s
ymb
iosi
sJa
nu
ary
- M
arc
h 2
01
2a
qua
rterly
mag
azin
e of
the
soci
ety
of e
nerg
y en
gin
eers
and
man
ager
s / I
ndia
56
ener
gy
and
env
ironm
ent s
ymb
iosi
sJa
nu
ary
- M
arc
h 2
01
2a
qua
rterly
mag
azin
e of
the
soci
ety
of e
nerg
y en
gin
eers
and
man
ager
s / I
ndia
57
cow dung and agricultural waste. The increasing
energy consumption is having a direct bearing on the
environment and economy.
Among the commercial sources of energy, coal and
lignite contribute about 59%, oil and natural gas
about 37%, and hydro-electric and nuclear power
around 4%. Thus, the main source of energy is the
stored hydrocarbons (96%) under the earth's crust,
which are being utilized liberally. At present, over 70%
of the oil requirements are met from imported
sources. The cost of energy is ever increasing, and
the lack of development of non-conventional energy
sources is making the energy situation more
challenging.
Energy, Emissions and Environment
Production, conversion and use of energy play a
significant role in global warming, which affects the
environment. In the coming decades, global
environment issues can dictate the patterns of energy
use. The principal international energy issues revolve
around supply interruptions and their implications for
energy security and price stability, and the impact of
energy production and consumption on regional and
global environments.
The use of coal on a worldwide basis will increase at
an average rate of 1.6% per year. But in India its use
will be almost double by 2025 or so. The total
recoverable reserves of coal around the world are
estimated at 1088 billion tons, out of which India's
reserve is around 100 billion tons. Between 1996 and
2020, use of coal for electricity generation in India is
projected to rise by 3% per year. India is expected to
increase its consumption of electricity at an average
annual rate of 4.9% from 1996 to 2020. In future
years, coal-based energy generation will face tough
challenges as far as environmental pollution is
concerned.
The automobile sector and thermal power plants are
the major contributors towards atmospheric pollution.
Combustion of coal, oil and natural gas accounts for
roughly three-quarters of all carbon dioxide
The use of coal on a worldwide basis will
increase at an average rate of 1.6% per
year. But in India its use will be almost
double by 2025 or so.
emissions. The industrial sector accounts for more
than one-third of the global carbon dioxide emission
from fossil fuel combustion (excluding the power
sector), the residential and commercial sector 32%,
and the transport sector a bit over 21%.
Development of eco-friendly energy supply opens up
enormous opportunities for international cooperation.
It is important to structure pricing mechanisms,
relations with other countries and commercial
transactions in a manner that meets the long-term
objectives of adequate and sustainable energy.
Renewable Sources of Energy
Harnessing of renewable energy aims not only
increasing energy generation but also helping to
restore a pollution-free environment. It is estimated
that India has the potential of generating more than
1,00,000 MW from non-conventional sources of
energy. Table 1 indicates the potential of various
renewable energy resources.
Table 1: Renewable Energy Resources Potential
In the Indian context, energy efficiency and alternative
energy sources offer the biggest scope for cutting
carbon dioxide emissions. Two missions - Solar
Mission and Enhanced Energy Efficiency Mission -
have been constituted by the Government of India to
address these issues.
The town or city depends on its hinterland
for food and water, clean air and open
space, and, looking to the future, for
biomass for fuel. The hinterland depends
on the town or city as a market for its
produce and for employment and
services. Sustainable planning demands a
more holistic and integrated approach to
the urban region, which recognizes the
interdependence and potential of both
town and country.
Urban Structure and Transport for Energy
Efficiency
In the context of surging oil prices and increasing
energy demand, urban planning assumes a critical
role. The solution to the huge energy demand lies
beyond enhancing power generation. It is the form of
the city structure, zoning controls, land use and
density pattern, together with architecture, building
and management options, which have to be tackled
in a holistic manner. The basic premise of a
sustainable, energy-efficient city is conservation of
transport fuels and energy. Sustainable urban
structure begins with the urban region, the city and its
hinterland; the sustainability of each is dependent on
the other. The town or city depends on its hinterland
for food and water, clean air and open space, and,
looking to the future, for biomass for fuel. The
hinterland depends on the town or city as a market
for its produce and for employment and services.
Sustainable planning demands a more holistic and
integrated approach to the urban region, which
Page 58
recognizes the interdependence and potential of both
town and country.
At the level of the city, a 'walkable' community
provides the fundamental building block in creating a
sustainable urban form. The concept is based on a
poly-centric urban structure in which a town or city
comprises a network of distinct but overlapping
communities, each focused on a city, district or local
centre, and within which people can access on foot
most of the facilities and services needed for day-to-
day living. Each of these communities is defined by
the walking catchment or 'ped-shed' around the
centre. This is generally taken to be 800 m, equating
to a 10-minute walk.
In a large metropolitan city like Delhi, the concept of
the poly-centric structure has to be adopted, with new
centres being created along the railways, metro and
transport corridors; this can be described as the
'centres and routes' model. In this model, town
centres are the principal community focus, but there
are also linear communities developing along the
main movement routes between the centres and
especially along the principal routes. In other places,
different structures can be seen reflecting the
differences in geography, landform and economy. All
urban areas may not be within the walking catchment
of a centre. However, the proportion of areas lying
beyond walking distance of a centre increases with
distance from the city centre, reflecting both
diminishing densities of population and more widely
spread movement routes. As such, the following
planning and urban design principles can be drawn
out:
wWork centres, major institutions and services to be
focused along public transit corridors, at the
convergence of movement routes and around key
facilities such as metro stations.
wCreating a walkable neighbourhood: All local hubs
should be within easy walking and cycling
distance. Integrated planning of intra-urban and
inter-urban transport can bring about a new pattern
of urban population distribution, settlement
structure and industrial growth, and lead to
environmental conservation. This will require re-
examining of the concept of single land use zoning
and city structure which should be based on
conservation of transport.
wReorganization of land use and urban renewal,
including the circulation pattern.
w
consideration of parking requirements,
pedestrianization and efficient use of road right of
way.
wIntegration of bus and tram routes with metro rail,
rail corridors, LRT and waterways.
wIntegration of bus and rail stations and terminals
with dispersal facilities and services such as
parking and taxi stands.
w Introduction of integrated traffic and transit
operation, control and management, and setting
up of a unified metropolitan regional transport
authority for planning and implementation.
wExploring the potential of using subterranean
space for transport and parking.
wEncouraging the use of cycles and NMV transport.
Planning and Building Design
The materials used in construction, their energy
content and compatibility with climatic conditions,
and the environmental performance of buildings are
inter-linked. It is necessary to rationalize the use of
building materials for conservation of energy and
environmental efficiency of the built environment. By a
proper approach and a comprehensive strategy,
energy efficiency and economy can be achieved.
Besides through the use of energy-efficient building
materials, the energy demand in buildings can be
substantially reduced by proper designing of walls,
roofs, windows and lighting. Improved insulation of
walls and roofs can reduce the heating and cooling
load by 25%. Improved multi-pane windows can
reduce the air-conditioning and heating load
significantly.
Rationalization of land use and density with due
Zero-fossil energy development (ZED)
envisages an urban form and design of a
passive building envelope that reduces
the demand for heat and power to the
point where it becomes economically
viable to use the energy from renewable
resources. This involves a holistic
approach combining the issues and
actions at various levels of planning,
design and construction.
Zero-Fossil Energy Development Protocols
Zero-fossil energy development (ZED) envisages an
urban form and design of a passive building envelope
that reduces the demand for heat and power to the
point where it becomes economically viable to use
the energy from renewable resources. This involves a
holistic approach combining the issues and actions at
various levels of planning, design and construction.
The following checklist is a summary of the guidelines
that should be considered for site analysis, planning,
and the design and specification process. Attention at
an early stage is vital, because a scheme cannot be
redeemed if the basic concept has not addressed
efficiency.
a. Site Planning: Ensure that the proposed building
is appropriately oriented and sensitive to the
natural features and micro-climate of the site.
Assess its micro-climatic character, taking into
account exposure, shelter, natural shading of
buildings, interaction of buildings, solar access
through the seasons, atmospheric pollution, water
and drainage, and noise gradients across the site.
Minimize earth movements and excavations where
possible. Respect ground water levels, and
design to manage surface water through natural
processes. Avoid formation of heat islands and
inversion effect due of layout planning.
b. Form and Orientation: Minimize solar heat gain
during summer and maximize the same in winter
to reduce the need for additional cooling and
lighting, thus reducing the demand for energy.
Design to reduce the surface area for heat
transfer through fabric by avoiding elongated thin
forms and spread-out low-density developments.
Compact forms are preferred, subject to the
conservation policies. Group buildings for
clustered multiple uses/time zoning of buildings
and spaces where appropriate.
c. Building Volume and Envelope: Generally, avoid
over-sized interior heights and spaces when
ener
gy
and
env
ironm
ent s
ymb
iosi
sJa
nu
ary
- M
arc
h 2
01
2a
qua
rterly
mag
azin
e of
the
soci
ety
of e
nerg
y en
gin
eers
and
man
ager
s / I
ndia
58
ener
gy
and
env
ironm
ent s
ymb
iosi
sJa
nu
ary
- M
arc
h 2
01
2a
qua
rterly
mag
azin
e of
the
soci
ety
of e
nerg
y en
gin
eers
and
man
ager
s / I
ndia
59
Page 59
recognizes the interdependence and potential of both
town and country.
At the level of the city, a 'walkable' community
provides the fundamental building block in creating a
sustainable urban form. The concept is based on a
poly-centric urban structure in which a town or city
comprises a network of distinct but overlapping
communities, each focused on a city, district or local
centre, and within which people can access on foot
most of the facilities and services needed for day-to-
day living. Each of these communities is defined by
the walking catchment or 'ped-shed' around the
centre. This is generally taken to be 800 m, equating
to a 10-minute walk.
In a large metropolitan city like Delhi, the concept of
the poly-centric structure has to be adopted, with new
centres being created along the railways, metro and
transport corridors; this can be described as the
'centres and routes' model. In this model, town
centres are the principal community focus, but there
are also linear communities developing along the
main movement routes between the centres and
especially along the principal routes. In other places,
different structures can be seen reflecting the
differences in geography, landform and economy. All
urban areas may not be within the walking catchment
of a centre. However, the proportion of areas lying
beyond walking distance of a centre increases with
distance from the city centre, reflecting both
diminishing densities of population and more widely
spread movement routes. As such, the following
planning and urban design principles can be drawn
out:
wWork centres, major institutions and services to be
focused along public transit corridors, at the
convergence of movement routes and around key
facilities such as metro stations.
wCreating a walkable neighbourhood: All local hubs
should be within easy walking and cycling
distance. Integrated planning of intra-urban and
inter-urban transport can bring about a new pattern
of urban population distribution, settlement
structure and industrial growth, and lead to
environmental conservation. This will require re-
examining of the concept of single land use zoning
and city structure which should be based on
conservation of transport.
wReorganization of land use and urban renewal,
including the circulation pattern.
w
consideration of parking requirements,
pedestrianization and efficient use of road right of
way.
wIntegration of bus and tram routes with metro rail,
rail corridors, LRT and waterways.
wIntegration of bus and rail stations and terminals
with dispersal facilities and services such as
parking and taxi stands.
w Introduction of integrated traffic and transit
operation, control and management, and setting
up of a unified metropolitan regional transport
authority for planning and implementation.
wExploring the potential of using subterranean
space for transport and parking.
wEncouraging the use of cycles and NMV transport.
Planning and Building Design
The materials used in construction, their energy
content and compatibility with climatic conditions,
and the environmental performance of buildings are
inter-linked. It is necessary to rationalize the use of
building materials for conservation of energy and
environmental efficiency of the built environment. By a
proper approach and a comprehensive strategy,
energy efficiency and economy can be achieved.
Besides through the use of energy-efficient building
materials, the energy demand in buildings can be
substantially reduced by proper designing of walls,
roofs, windows and lighting. Improved insulation of
walls and roofs can reduce the heating and cooling
load by 25%. Improved multi-pane windows can
reduce the air-conditioning and heating load
significantly.
Rationalization of land use and density with due
Zero-fossil energy development (ZED)
envisages an urban form and design of a
passive building envelope that reduces
the demand for heat and power to the
point where it becomes economically
viable to use the energy from renewable
resources. This involves a holistic
approach combining the issues and
actions at various levels of planning,
design and construction.
Zero-Fossil Energy Development Protocols
Zero-fossil energy development (ZED) envisages an
urban form and design of a passive building envelope
that reduces the demand for heat and power to the
point where it becomes economically viable to use
the energy from renewable resources. This involves a
holistic approach combining the issues and actions at
various levels of planning, design and construction.
The following checklist is a summary of the guidelines
that should be considered for site analysis, planning,
and the design and specification process. Attention at
an early stage is vital, because a scheme cannot be
redeemed if the basic concept has not addressed
efficiency.
a. Site Planning: Ensure that the proposed building
is appropriately oriented and sensitive to the
natural features and micro-climate of the site.
Assess its micro-climatic character, taking into
account exposure, shelter, natural shading of
buildings, interaction of buildings, solar access
through the seasons, atmospheric pollution, water
and drainage, and noise gradients across the site.
Minimize earth movements and excavations where
possible. Respect ground water levels, and
design to manage surface water through natural
processes. Avoid formation of heat islands and
inversion effect due of layout planning.
b. Form and Orientation: Minimize solar heat gain
during summer and maximize the same in winter
to reduce the need for additional cooling and
lighting, thus reducing the demand for energy.
Design to reduce the surface area for heat
transfer through fabric by avoiding elongated thin
forms and spread-out low-density developments.
Compact forms are preferred, subject to the
conservation policies. Group buildings for
clustered multiple uses/time zoning of buildings
and spaces where appropriate.
c. Building Volume and Envelope: Generally, avoid
over-sized interior heights and spaces when
ener
gy
and
env
ironm
ent s
ymb
iosi
sJa
nu
ary
- M
arc
h 2
01
2a
qua
rterly
mag
azin
e of
the
soci
ety
of e
nerg
y en
gin
eers
and
man
ager
s / I
ndia
58
ener
gy
and
env
ironm
ent s
ymb
iosi
sJa
nu
ary
- M
arc
h 2
01
2a
qua
rterly
mag
azin
e of
the
soci
ety
of e
nerg
y en
gin
eers
and
man
ager
s / I
ndia
59
Page 60
designing for specific uses and functions. Thermal
characteristics of the building envelope, roof and
walls should be compatible with all U and R
values of insulation.
d. Ventilation/Air-conditioning: Use natural
ventilation. Consider the use of atria to achieve
some of these requirements and to provide
amenity space for building users. Minimize the
use of air-conditioning. Consider the interaction
between energy and ventilation strategies to
balance potentially conflicting demands. Avoid the
use of wet cooling where air-conditioning is
installed. Explore new methods of cooling, for
example, passive energy draft cooling (PEDC),
high-efficiency chilling, earth embedded cooling
and the thermal storage system.
e. Lifts: Consider building forms and heights to
economize the reliance on lifts, while meeting the
needs of people with mobility problems.
f. Resource Recovery: Specify the reuse of materials
arising from demolition onsite and recycled
materials bought in from other sites locally.
Shuttering and so on should be reused wherever
possible, rather than destroyed on completion.
Allocate space for future recycling of waste glass
and a composite facility, where appropriate.
g. Greenery: Landscape of the building should
improve the micro-climate and visual amenity, by
shading, greenery, green roof, climbing plants on
walls, window boxes and balcony gardens.
h. Internal Layout: To reduce the need for artificial
light and for optimum heat efficiency, cluster the
uses that need similar environmental conditions.
Avoid open plans to allow for better control of
services by the users.
I. Windows/Doors: Consider the percentage of
fenestration on different facades and plan to
minimize the number of different temperature
zones. Use southerly orientation for passive solar
gain. Consider the type of glazing and
summer/winter ventilation. Use blinds, curtains,
shutters, draught lobbies and air curtains. Design
super-windows that reduce heat loss.
j. Materials: Avoid over-designed structures,
footings and so on that may result in waste of
materials. Consider alternative foundations and
structures where appropriate. Specify timbers
from sustainable forests. Minimize the use of
chemicals and hazardous materials.
k. Flexibility: Plan the duct routes in such a way as
to facilitate future changes in requirements.
l. Plant location: To reduce distribution losses to a
minimum, locate plants close to areas of high
energy consumption. Lag pipe runs to high
specifications; use low-temperature storage, time
controls and intelligent systems.
m. Waste heat recovery: Consider the use of a heat
exchanger if the building is mechanically
ventilated.
n. Building fabric: Specify insulation standards
above the current regulations, where possible.
Avoid the use of CFC-blown insulation.
o. Lighting installation: Energy-efficient lighting
fixtures (LED, CFL, T-5 lamps, electronic chokes
etc.) should be used, along with automatic
sensors to control and avoid unnecessary energy
use. Consider time and intensity controls rather
than general illumination. Benchmarks should be
as per the Energy Conservation Building Code
(ECBC).
p. Wall-to-window ratio (WWR), U Factor, solar heat
gain coefficient (SHGC) and visible light
transmittance (VLT) values: ECBC 2007 2recommends a maximum U factor of 3.3 W/m /K,
an SHGC of 0.25 for a WWR of 40%, and an
SHGC of 0.2 for a WWR of 40-60%. A glazing area
in excess of 60% of gross external wall area is not
recommended. The VLT value linked to WWR
should be as per ECBC. SHGC value is
particularly critical for south, east and west
facades. Glazing U factor and SHGC should be
minimized, whereas VLT should be maximized.
q. Controls: Employ controls that can respond to
internal and external conditions. Time and
temperature should be sensor-/bionic-controlled
according to the need of the occupants.
r. Decorative Finishes: Light-coloured finishes
improve lighting conditions and reduce the
intensity of light required.
s. Details/Standards of Work: Ceiling joints,
insulation, ventilation and thermal installations
should all be checked to ensure that the work has
been carried out to a high standard.
t. Operation: A user-friendly manual for occupants
should be provided to explain the efficient
operation of building and equipment.
u. Commissioning: Before occupancy, a building
should be flushed to remove solvents, gases,
Mr. A.K. Jain is the Ex.
Commissioner (Planning) of Delhi
Development Authority. He is a
member of the UN Habitat Research
Advisory Committee and a visiting
faculty at Delhi School of Planning
and Architecture.
vapours, smells and so on that could affect future
users. Check the performance of machinery
components and equipment against standards,
and put right any defect found that could have
major long-term effects on the energy
consumption of the building.
v. Incentives: Incentives, training and user
participation for energy efficiency and energy
savings should be encouraged.
Indian cities are facing a grim situation in terms of
energy. Unless a holistic and well-worked out
approach is evolved, the scenario would be even
worse, with the galloping economic development and
ever-growing urbanization. To tackle this situation,
there is a need to evolve a multi-pronged and multi-
disciplinary approach. This should begin with
increasing power generation and transmission
capacity and mobilizing private sector resources.
Parallel actions should be taken for conservation of
natural resources and exploring renewable and non-
conventional sources of energy including geothermal
heat and energy from wastes, bio mass and so on. At
the same time, it is necessary to resort to
management reforms, energy distribution
management and audit, adoption of energy-efficient
fuels, upgradation of technology and equipment,
energy tariff reforms, and controlling thefts and
losses. The key to future is a cybernetic form of
sustainable energy, which integrates symbiosis,
recycling and energy chains.
Space and energy are the basic dimensions of the
universe. There is a uterine relationship between the
Parallel actions should be taken for
conservation of natural resources and
exploring renewable and non-conventional
sources of energy including geothermal
heat and energy from wastes, bio mass
and so on. At the same time, it is
necessary to resort to management
reforms, energy distribution management
and audit, adoption of energy-efficient
fuels, upgradation of technology and
equipment, energy tariff reforms, and
controlling thefts and losses.
two. Unless there is a synergy between land use
planning, transportation and energy, we may not be
able to achieve sustainable development. An
important aspect of the space and energy symbiosis
is rediscovering ecological and non-conventional
sources of energy, in place of animate energy and
man-made sources.
Bibliography
1. CSE (Centre for Science & Environment), India-Environment
Report, New Delhi.
2. DDA (2007) Master Plan for Delhi-2021. New Delhi: Ministry of
Urban Development, Govt. of India.
3. GOI (1998) Development Alternatives, Environmental Priorities of
India. New Delhi: Govt. of India.
4. Girardet H. (1997) 'Sustainable cities - A Contradiction in Terms?'
In Satterwaite D. (ed.) Sustainable Cities. London: Earthscan
Publishers.
5. GOI (2001) Census of India Reports. New Delhi: Govt. of India.
6. Second United Nations Conference on Human Settlements,
(Habitat II), Istanbul 1996, India National Report. New Delhi: Ministry
of Urban Affairs & Employment.
7. Planning Commission, GOI (2007) Approach to 11th 5-Year Plan.
New Delhi: Govt. of India.
8. Hough M. (1995) Cities & Natural Process. London: Routeledge.
9. Israel A. (1992) Issues for Infrastructure management in the 1990s.
Washington, D.C.: World Bank.
10. Jain A.K. (2010) Making Infrastructure Work. New Delhi:
Discovery Publishers.
11. Jain A.K. (2001) Ecology and Natural Resource Management for
Sustainable Development. New Delhi: Management Publishing Co.
12. McHarg I. (1969) Design with Nature. New York: Natural History
Press.
13. Ministry of Urban Development, GOI (1988) Report of the National
Commission on Urbanisation. New Delhi: Govt. of India.
14. Rees W.E. (1997) Ecological Footprints and Urban Transportation,
Velocity. Barcelona.
15. Steinberg F. (1995) 'Sustainable Human Settlement Development
- Is It Possible?' Unpublished paper.
16. UNCED (1992) Local Agenda 21, RIO, World Environment
Conference, 1992.
17. World Bank (1994) World Development Report: Infrastructure for
Development. Washington, D.C.
18. World Resource Institute (WRI)/United Nations Environment
Programme/United Nations Development Programme and World Bank,
World Resources 2006-07: A Guide to the Global Environment.
ener
gy
and
env
ironm
ent s
ymb
iosi
sJa
nu
ary
- M
arc
h 2
01
2a
qua
rterly
mag
azin
e of
the
soci
ety
of e
nerg
y en
gin
eers
and
man
ager
s / I
ndia
60
ener
gy
and
env
ironm
ent s
ymb
iosi
sJa
nu
ary
- M
arc
h 2
01
2a
qua
rterly
mag
azin
e of
the
soci
ety
of e
nerg
y en
gin
eers
and
man
ager
s / I
ndia
61
Page 61
designing for specific uses and functions. Thermal
characteristics of the building envelope, roof and
walls should be compatible with all U and R
values of insulation.
d. Ventilation/Air-conditioning: Use natural
ventilation. Consider the use of atria to achieve
some of these requirements and to provide
amenity space for building users. Minimize the
use of air-conditioning. Consider the interaction
between energy and ventilation strategies to
balance potentially conflicting demands. Avoid the
use of wet cooling where air-conditioning is
installed. Explore new methods of cooling, for
example, passive energy draft cooling (PEDC),
high-efficiency chilling, earth embedded cooling
and the thermal storage system.
e. Lifts: Consider building forms and heights to
economize the reliance on lifts, while meeting the
needs of people with mobility problems.
f. Resource Recovery: Specify the reuse of materials
arising from demolition onsite and recycled
materials bought in from other sites locally.
Shuttering and so on should be reused wherever
possible, rather than destroyed on completion.
Allocate space for future recycling of waste glass
and a composite facility, where appropriate.
g. Greenery: Landscape of the building should
improve the micro-climate and visual amenity, by
shading, greenery, green roof, climbing plants on
walls, window boxes and balcony gardens.
h. Internal Layout: To reduce the need for artificial
light and for optimum heat efficiency, cluster the
uses that need similar environmental conditions.
Avoid open plans to allow for better control of
services by the users.
I. Windows/Doors: Consider the percentage of
fenestration on different facades and plan to
minimize the number of different temperature
zones. Use southerly orientation for passive solar
gain. Consider the type of glazing and
summer/winter ventilation. Use blinds, curtains,
shutters, draught lobbies and air curtains. Design
super-windows that reduce heat loss.
j. Materials: Avoid over-designed structures,
footings and so on that may result in waste of
materials. Consider alternative foundations and
structures where appropriate. Specify timbers
from sustainable forests. Minimize the use of
chemicals and hazardous materials.
k. Flexibility: Plan the duct routes in such a way as
to facilitate future changes in requirements.
l. Plant location: To reduce distribution losses to a
minimum, locate plants close to areas of high
energy consumption. Lag pipe runs to high
specifications; use low-temperature storage, time
controls and intelligent systems.
m. Waste heat recovery: Consider the use of a heat
exchanger if the building is mechanically
ventilated.
n. Building fabric: Specify insulation standards
above the current regulations, where possible.
Avoid the use of CFC-blown insulation.
o. Lighting installation: Energy-efficient lighting
fixtures (LED, CFL, T-5 lamps, electronic chokes
etc.) should be used, along with automatic
sensors to control and avoid unnecessary energy
use. Consider time and intensity controls rather
than general illumination. Benchmarks should be
as per the Energy Conservation Building Code
(ECBC).
p. Wall-to-window ratio (WWR), U Factor, solar heat
gain coefficient (SHGC) and visible light
transmittance (VLT) values: ECBC 2007 2recommends a maximum U factor of 3.3 W/m /K,
an SHGC of 0.25 for a WWR of 40%, and an
SHGC of 0.2 for a WWR of 40-60%. A glazing area
in excess of 60% of gross external wall area is not
recommended. The VLT value linked to WWR
should be as per ECBC. SHGC value is
particularly critical for south, east and west
facades. Glazing U factor and SHGC should be
minimized, whereas VLT should be maximized.
q. Controls: Employ controls that can respond to
internal and external conditions. Time and
temperature should be sensor-/bionic-controlled
according to the need of the occupants.
r. Decorative Finishes: Light-coloured finishes
improve lighting conditions and reduce the
intensity of light required.
s. Details/Standards of Work: Ceiling joints,
insulation, ventilation and thermal installations
should all be checked to ensure that the work has
been carried out to a high standard.
t. Operation: A user-friendly manual for occupants
should be provided to explain the efficient
operation of building and equipment.
u. Commissioning: Before occupancy, a building
should be flushed to remove solvents, gases,
Mr. A.K. Jain is the Ex.
Commissioner (Planning) of Delhi
Development Authority. He is a
member of the UN Habitat Research
Advisory Committee and a visiting
faculty at Delhi School of Planning
and Architecture.
vapours, smells and so on that could affect future
users. Check the performance of machinery
components and equipment against standards,
and put right any defect found that could have
major long-term effects on the energy
consumption of the building.
v. Incentives: Incentives, training and user
participation for energy efficiency and energy
savings should be encouraged.
Indian cities are facing a grim situation in terms of
energy. Unless a holistic and well-worked out
approach is evolved, the scenario would be even
worse, with the galloping economic development and
ever-growing urbanization. To tackle this situation,
there is a need to evolve a multi-pronged and multi-
disciplinary approach. This should begin with
increasing power generation and transmission
capacity and mobilizing private sector resources.
Parallel actions should be taken for conservation of
natural resources and exploring renewable and non-
conventional sources of energy including geothermal
heat and energy from wastes, bio mass and so on. At
the same time, it is necessary to resort to
management reforms, energy distribution
management and audit, adoption of energy-efficient
fuels, upgradation of technology and equipment,
energy tariff reforms, and controlling thefts and
losses. The key to future is a cybernetic form of
sustainable energy, which integrates symbiosis,
recycling and energy chains.
Space and energy are the basic dimensions of the
universe. There is a uterine relationship between the
Parallel actions should be taken for
conservation of natural resources and
exploring renewable and non-conventional
sources of energy including geothermal
heat and energy from wastes, bio mass
and so on. At the same time, it is
necessary to resort to management
reforms, energy distribution management
and audit, adoption of energy-efficient
fuels, upgradation of technology and
equipment, energy tariff reforms, and
controlling thefts and losses.
two. Unless there is a synergy between land use
planning, transportation and energy, we may not be
able to achieve sustainable development. An
important aspect of the space and energy symbiosis
is rediscovering ecological and non-conventional
sources of energy, in place of animate energy and
man-made sources.
Bibliography
1. CSE (Centre for Science & Environment), India-Environment
Report, New Delhi.
2. DDA (2007) Master Plan for Delhi-2021. New Delhi: Ministry of
Urban Development, Govt. of India.
3. GOI (1998) Development Alternatives, Environmental Priorities of
India. New Delhi: Govt. of India.
4. Girardet H. (1997) 'Sustainable cities - A Contradiction in Terms?'
In Satterwaite D. (ed.) Sustainable Cities. London: Earthscan
Publishers.
5. GOI (2001) Census of India Reports. New Delhi: Govt. of India.
6. Second United Nations Conference on Human Settlements,
(Habitat II), Istanbul 1996, India National Report. New Delhi: Ministry
of Urban Affairs & Employment.
7. Planning Commission, GOI (2007) Approach to 11th 5-Year Plan.
New Delhi: Govt. of India.
8. Hough M. (1995) Cities & Natural Process. London: Routeledge.
9. Israel A. (1992) Issues for Infrastructure management in the 1990s.
Washington, D.C.: World Bank.
10. Jain A.K. (2010) Making Infrastructure Work. New Delhi:
Discovery Publishers.
11. Jain A.K. (2001) Ecology and Natural Resource Management for
Sustainable Development. New Delhi: Management Publishing Co.
12. McHarg I. (1969) Design with Nature. New York: Natural History
Press.
13. Ministry of Urban Development, GOI (1988) Report of the National
Commission on Urbanisation. New Delhi: Govt. of India.
14. Rees W.E. (1997) Ecological Footprints and Urban Transportation,
Velocity. Barcelona.
15. Steinberg F. (1995) 'Sustainable Human Settlement Development
- Is It Possible?' Unpublished paper.
16. UNCED (1992) Local Agenda 21, RIO, World Environment
Conference, 1992.
17. World Bank (1994) World Development Report: Infrastructure for
Development. Washington, D.C.
18. World Resource Institute (WRI)/United Nations Environment
Programme/United Nations Development Programme and World Bank,
World Resources 2006-07: A Guide to the Global Environment.
ener
gy
and
env
ironm
ent s
ymb
iosi
sJa
nu
ary
- M
arc
h 2
01
2a
qua
rterly
mag
azin
e of
the
soci
ety
of e
nerg
y en
gin
eers
and
man
ager
s / I
ndia
60
ener
gy
and
env
ironm
ent s
ymb
iosi
sJa
nu
ary
- M
arc
h 2
01
2a
qua
rterly
mag
azin
e of
the
soci
ety
of e
nerg
y en
gin
eers
and
man
ager
s / I
ndia
61
Page 62
magic wand. By ranking this table in descending cost order, you will have, at the top of
page one, all your most important problems, ranked by their apparent avoidable costs.
I call this the overspend league table. When this logic is built into software (it can be
done in Excel) the energy manager's job suddenly becomes very quick and simple:
look at what is at top of the list, and if any of the deviations are significant in cost terms,
ask the people in charge of those parts of the enterprise what might have caused the
discrepancies. Given more space I might add one or two minor refinements but the key
idea is managing unexpected waste by reporting and ranking the apparent costs of
unexplained losses. Once the data are assembled it is quick-it usually takes less than a
minute a week almost regardless of the size of the enterprise-and it requires no
professional knowledge of
energy management
because all the
professional expertise is
'embedded' in the formulae
for expected consumption.
This means the task can be
delegated. The energy
manager who adopts this
approach soon develops a
reputation for asking the
right question of the right
person at the right time
when unexpected hidden
energy waste has occurred.
Any method can be used
for gathering data, from
manual meter readings
through to high-frequency
data collected by automatic
meter reading systems,
SCADA systems, or indirect
estimates from hours-run
records, ammeters, and
pulse counters. But note:
where high volumes of
automatic meter readings
are being collected, it is no
longer necessary to
examine charts of every
meter every week. The
overspend league table will
tell you which ones are
worth looking at.
Energy managers seldom
adopt this simple strategy,
which has the potential to
bring to his table the right
balance of data and
information amidst
legislative and market
pressures, as well as data
volume. Expensive
metering systems might not
always be the right solution,
the trick lies in not letting
your metering system
drown you in data and
making sure that you don't
miss the big picture.
...continued from page 03
Jan
uary
- M
arc
h 2
01
2a
qua
rterly
mag
azin
e of
the
soci
ety
of e
nerg
y en
gin
eers
and
man
ager
s / I
ndia
62
gu
est
edit
ori
al
Page 63
Introduction to Power QualityDavid Chapman
Power quality and energy efficiencyAngelo Baggini and Franco Bua
Capacitors in a Harmonic-rich EnvironmentStefan Fassbinder
Integrated Earthing Systems (Earthing Grid)Rob Kersten & Frans van Pelt
Resilient and Reliable Power Supply in a Modern Office BuildingAngelo Baggini& Hans De Keulenaer
Electricity Systems for HospitalsAngelo Baggini
Life Cycle Costing - The BasicsDiedertDebusscher (Forte)
To advertise, contact Energy Press @:
SEEM BhavanKRA A 79, KannammoolaThiruvananthapuram, Kerala, India - 695011Phone: +91 944 635 7607 | +91 471 255 7607 E- Mail: [email protected] : www.energyprofessional.in
The first ever exclusive supplement on
Power QualityThe APQI - Energy Press Power Quality Supplement
ηComing soon with Apr-Jun 2012 issue of energy manager
Page 64
Why can it be a good idea for you to promote your services or products here?
nenergy manager is the only magazine in India exclusively focusing on Energy Efficiency
nCirculated all over India in print to more than 5000 key personalities
nGet an additional promotion to 50,000 readers through Energy Snippets, our monthly e-newsletter
nCombined reader database covers Certified Energy Professionals, Engineering & Technical Institutions, Accredited ESCOs & Energy Consultants, Energy Intensive Industries (DCs), EE & RE Equipment Manufacturers, Consultants, Planners and Architects, Distributors and Marketing Agencies, Political & Executive decision makers, Policy Bodies, NGOs and International Organizations
η
To strike a deal, call us at 9446357607 or mail us at [email protected]
This space could be yours.