Spring 2003 ISSUE FOCUS: Assessments and Optimizations Lead to Energy Improvements Steam energy accounts for a significant amount of the total industrial process energy use in U.S. industries. Because U.S. industries represent an impor- tant national interest and a large portion of the nation's overall energy use, it is impor- tant not only to understand how these industries use energy, but especially how they generate and use steam. Combining data from the Manufacturing Energy Con- sumption Survey 1994 (MECS) with energy use estimates for key processes and products, the report Steam System Oppor- tunity Assessment for the Pulp and Paper, Chemical Manufac- turing, and Petroleum Refining Industries (recently published by the Industrial Technologies Program) provides an analysis of the steam generation and steam improvement opportu- nities in the three target industries. According to MECS data, the amounts of fuel used to generate steam in the target industries were: • Pulp and paper manufacturing: 2,221 trillion British thermal units (Btu) • Chemical manufacturing: 1,540 trillion Btu • Petroleum refining: 1,675 trillion Btu. The report also estimates the amount of steam generated by fuel, the amount of steam purchased, and the total amount of steam available to these industries. The amount of steam as a percentage of total energy used by each industry was also determined: • Pulp and paper manufacturing: 84% • Chemical manufacturing: 47% • Petroleum refining: 51%. Pulp and Paper Industry Manufacturing plants in the pulp and paper industry vary by size, level of integration, process technology, wood type, and final product type. The energy used by fully inte- grated plants can be combined with total industry production to estimate the total thermal energy used by the pulp and paper industry. This method assumed that a fully integrated pulp and paper plant uses the same amount of energy to produce a ton of product that an equivalent supply chain of plants that are not integrated would use. Ide- ally, the energy data reported in the MECS is consistent with the results of this bottom-up view of the process energy use. The estimated steam energy requirements for these 14 major pulp and paper products are presented in Figure 1. The product steam energy use requirements varied between 4 and 483 trillion Btu. The sources of the steam in pulp and paper manufacturing include recovery boil- ers (at chemical pulping facilities), power boilers, and waste heat recovery boilers. Steam Assessment Gauges Energy Savings Potential for Industries T O F E N E R G Y D E P A R T M E N U E N I T E D S T A T S O F A E R I C A M (continued on page 2) “TURNING INFORMATION INTO ENERGY SOLUTIONS FOR INDUSTRY” INDUSTRIAL TECHNOLOGIES PROGRAM Energy Matters IN THIS ISSUE Steam Assessment Gauges Energy Savings Potential for Industries . . . . . . . 1 Fan System Optimization Improves Production, Saves Energy at Cement Plant . . . . . . . . . . . . . . . . . . . . . . . . . . 4 A Symptoms Approach to Identifying Efficiency Improvement Opportunities . . . . . . . . 4 Pump System Optimization Saves Energy, Improves Productivity at a Paper Mill . . . . . . . . . . . . . . . . . . . . . . . . . . . . . 6 Caraustar Industries Energy Assessment Provides a Company-Wide Model . . . . . . . . . . . 6 New Reference Manual Available for Compressed Air Systems . . . . . . . . . . . . . . . 8 Compressed Air System Project Improves Efficiency and Production at Harland Publishing Facility . . . . . . . . . . . . . . .9 Texas Technology Showcase Update . . . . . . . . .9 Coming Events . . . . . . . . . . . . . . . . . . . . . . . . 12 Building a company-wide energy assessment. See page 6. U.S. Department of Energy Energy Efficiency and Renewable Energy Bringing you a prosperous future where energy is clean abundant, reliable, and affordable An analysis of steam generation and steam improvement opportunities in three target industries.
Transcript
Spring 2003
I S S U E F O C US : Assessments and OptimizationsLead to Energy Improvements
Steam energy accounts for asignificant amount of the totalindustrial process energy use inU.S. industries. Because U.S.industries represent an impor-tant national interest and alarge portion of the nation'soverall energy use, it is impor-tant not only to understandhow these industries useenergy, but especially how theygenerate and use steam.
Combining data from theManufacturing Energy Con-sumption Survey 1994 (MECS)with energy use estimates forkey processes and products,the report Steam System Oppor-tunity Assessment for the Pulpand Paper, Chemical Manufac-turing, and Petroleum RefiningIndustries (recently publishedby the Industrial TechnologiesProgram) provides an analysisof the steam generation andsteam improvement opportu-nities in the three target industries.
According to MECS data, the amounts offuel used to generate steam in the targetindustries were:• Pulp and paper manufacturing: 2,221
trillion British thermal units (Btu)• Chemical manufacturing: 1,540 trillion Btu• Petroleum refining: 1,675 trillion Btu.
The report also estimates the amount ofsteam generated by fuel, the amount ofsteam purchased, and the total amount ofsteam available to these industries. Theamount of steam as a percentage of totalenergy used by each industry was also determined:• Pulp and paper manufacturing: 84%• Chemical manufacturing: 47%• Petroleum refining: 51%.
Pulp and Paper IndustryManufacturing plants in the pulp and paper
industry vary by size, level of integration,
process technology, wood type, and finalproduct type. The energy used by fully inte-grated plants can be combined with totalindustry production to estimate the totalthermal energy used by the pulp and paperindustry. This method assumed that a fullyintegrated pulp and paper plant uses thesame amount of energy to produce a ton ofproduct that an equivalent supply chain ofplants that are not integrated would use. Ide-ally, the energy data reported in the MECS isconsistent with the results of this bottom-upview of the process energy use.
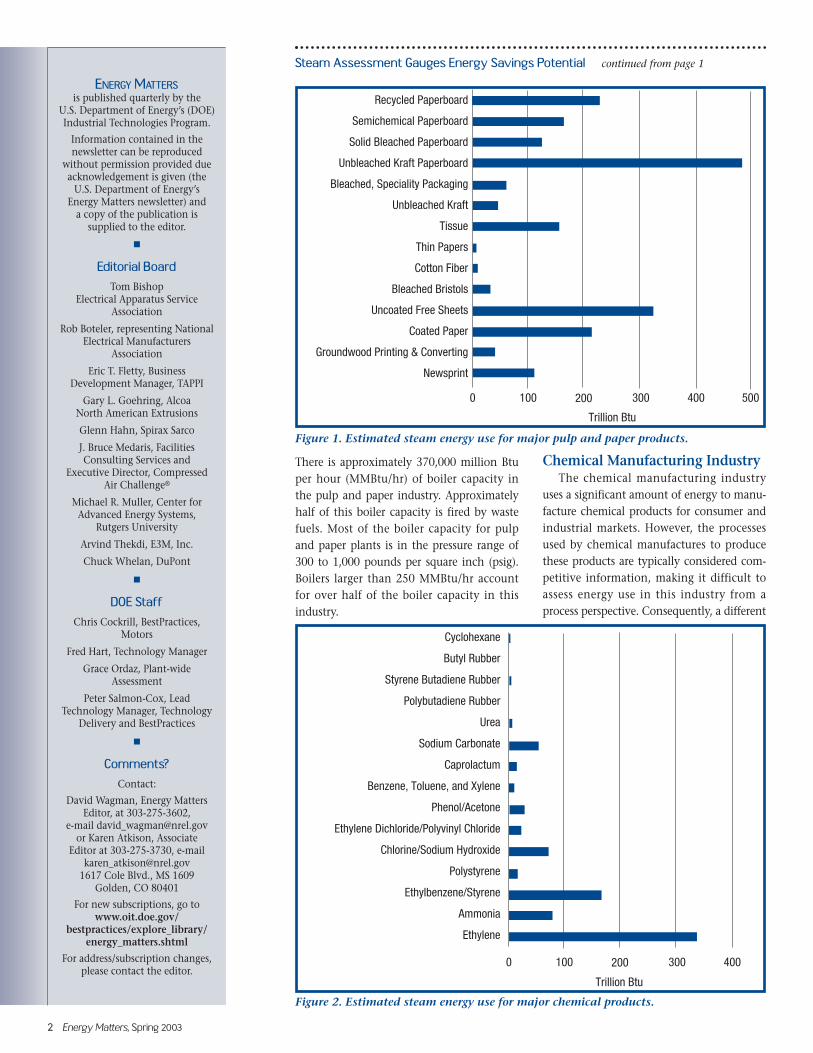
The estimated steam energy requirementsfor these 14 major pulp and paper productsare presented in Figure 1. The product steamenergy use requirements varied between 4 and 483 trillion Btu.
The sources of the steam in pulp andpaper manufacturing include recovery boil-ers (at chemical pulping facilities), powerboilers, and waste heat recovery boilers.
Steam Assessment Gauges Energy Savings Potential for Industries
T OF ENERGYD
EPA
RTMEN
U
E
NIT
ED
STAT S OFA
ER
ICA
M
(continued on page 2) �
“ T U R N I N G I N F O R M A T I O N I N T O E N E R G Y S O L U T I O N S F O R I N D U S T R Y ”
I N D U S T R I A L T E C H N O L O G I E S P R O G R A M
Building a company-wide energyassessment. See page 6.
U.S. Department of Energy Energy Efficiency and Renewable EnergyBringing you a prosperous future where energy isclean abundant, reliable, and affordable
An analysis of steam generation and steam improvementopportunities in three target industries.
2 Energy Matters, Spring 2003
There is approximately 370,000 million Btuper hour (MMBtu/hr) of boiler capacity inthe pulp and paper industry. Approximatelyhalf of this boiler capacity is fired by wastefuels. Most of the boiler capacity for pulpand paper plants is in the pressure range of300 to 1,000 pounds per square inch (psig).Boilers larger than 250 MMBtu/hr accountfor over half of the boiler capacity in thisindustry.
Chemical Manufacturing IndustryThe chemical manufacturing industry
uses a significant amount of energy to manu-facture chemical products for consumer andindustrial markets. However, the processesused by chemical manufactures to producethese products are typically considered com-petitive information, making it difficult toassess energy use in this industry from aprocess perspective. Consequently, a different
Steam Assessment Gauges Energy Savings Potential continued from page 1
Figure 1. Estimated steam energy use for major pulp and paper products.
Figure 2. Estimated steam energy use for major chemical products.
Recycled Paperboard
Semichemical Paperboard
Solid Bleached Paperboard
Unbleached Kraft Paperboard
Bleached, Speciality Packaging
Unbleached Kraft
Tissue
Thin Papers
Cotton Fiber
Bleached Bristols
Uncoated Free Sheets
Coated Paper
Groundwood Printing & Converting
Newsprint
0 100 200 300
Trillion Btu
400 500
Cyclohexane
Butyl Rubber
Styrene Butadiene Rubber
Polybutadiene Rubber
Urea
Sodium Carbonate
Caprolactum
Benzene, Toluene, and Xylene
Phenol/Acetone
Ethylene Dichloride/Polyvinyl Chloride
Chlorine/Sodium Hydroxide
Polystyrene
Ethylbenzene/Styrene
Ammonia
Ethylene
0 100 200 300
Trillion Btu
400
ENERGY MATTERSis published quarterly by the
U.S. Department of Energy’s (DOE)Industrial Technologies Program.
Information contained in thenewsletter can be reproduced
without permission provided dueacknowledgement is given (the
U.S. Department of Energy’s Energy Matters newsletter) and
a copy of the publication is supplied to the editor.
■
Editorial Board
Tom BishopElectrical Apparatus Service
Association
Rob Boteler, representing NationalElectrical Manufacturers
Association
Eric T. Fletty, Business Development Manager, TAPPI
Gary L. Goehring, Alcoa North American Extrusions
Glenn Hahn, Spirax Sarco
J. Bruce Medaris, Facilities Consulting Services and
Executive Director, CompressedAir Challenge®
Michael R. Muller, Center forAdvanced Energy Systems,
Rutgers University
Arvind Thekdi, E3M, Inc.
Chuck Whelan, DuPont
■
DOE Staff
Chris Cockrill, BestPractices,Motors
Fred Hart, Technology Manager
Grace Ordaz, Plant-wide Assessment
Peter Salmon-Cox, Lead Technology Manager, Technology
Delivery and BestPractices
■
Comments?
Contact:
David Wagman, Energy MattersEditor, at 303-275-3602,
For address/subscription changes,please contact the editor.
approach to assessing chemical industrysteam generation and use is required.Because a relatively small number of chemi-cal products account for most of the indus-try's energy use, evaluating the processesused to manufacture these high energy-usechemical products can provide a reasonablyaccurate assessment of how energy—specifi-cally steam energy—is used.
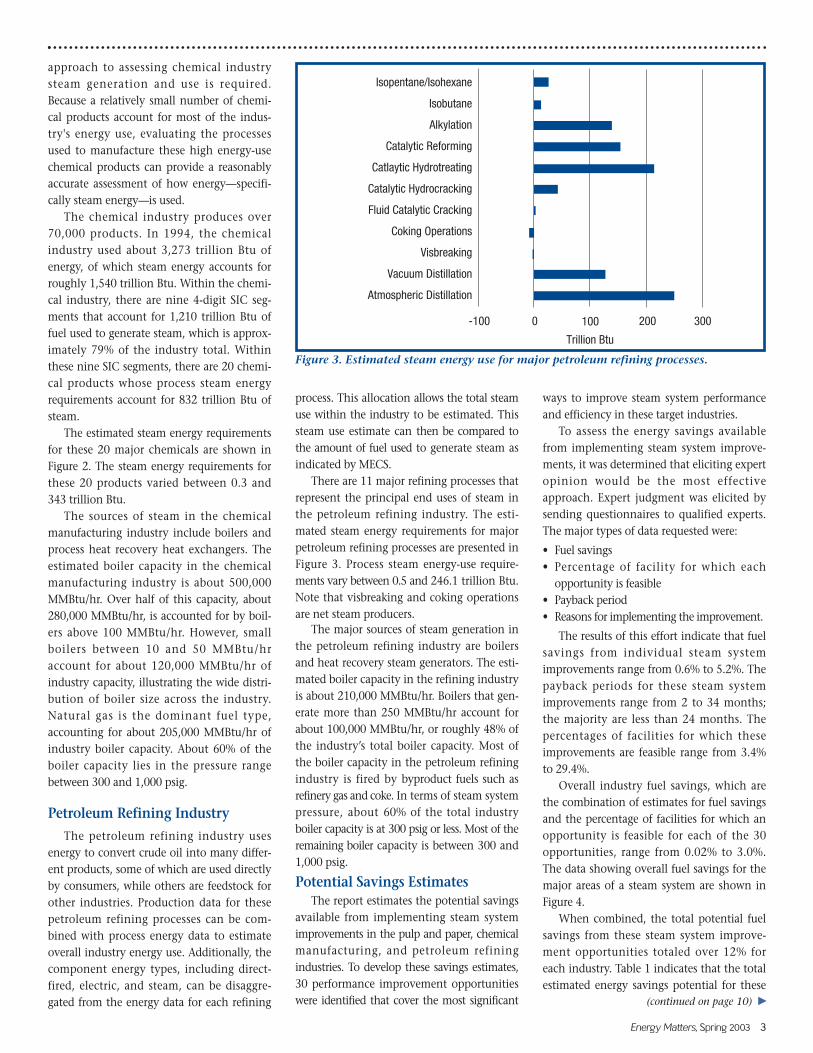
The chemical industry produces over70,000 products. In 1994, the chemicalindustry used about 3,273 trillion Btu ofenergy, of which steam energy accounts forroughly 1,540 trillion Btu. Within the chemi-cal industry, there are nine 4-digit SIC seg-ments that account for 1,210 trillion Btu offuel used to generate steam, which is approx-imately 79% of the industry total. Withinthese nine SIC segments, there are 20 chemi-cal products whose process steam energyrequirements account for 832 trillion Btu ofsteam.
The estimated steam energy requirementsfor these 20 major chemicals are shown inFigure 2. The steam energy requirements forthese 20 products varied between 0.3 and343 trillion Btu.
The sources of steam in the chemicalmanufacturing industry include boilers andprocess heat recovery heat exchangers. Theestimated boiler capacity in the chemicalmanufacturing industry is about 500,000MMBtu/hr. Over half of this capacity, about280,000 MMBtu/hr, is accounted for by boil-ers above 100 MMBtu/hr. However, smallboilers between 10 and 50 MMBtu/hraccount for about 120,000 MMBtu/hr ofindustry capacity, illustrating the wide distri-bution of boiler size across the industry. Natural gas is the dominant fuel type,accounting for about 205,000 MMBtu/hr ofindustry boiler capacity. About 60% of theboiler capacity lies in the pressure rangebetween 300 and 1,000 psig.
Petroleum Refining Industry
The petroleum refining industry usesenergy to convert crude oil into many differ-ent products, some of which are used directlyby consumers, while others are feedstock forother industries. Production data for thesepetroleum refining processes can be com-bined with process energy data to estimateoverall industry energy use. Additionally, thecomponent energy types, including direct-fired, electric, and steam, can be disaggre-gated from the energy data for each refining
process. This allocation allows the total steamuse within the industry to be estimated. Thissteam use estimate can then be compared tothe amount of fuel used to generate steam asindicated by MECS.
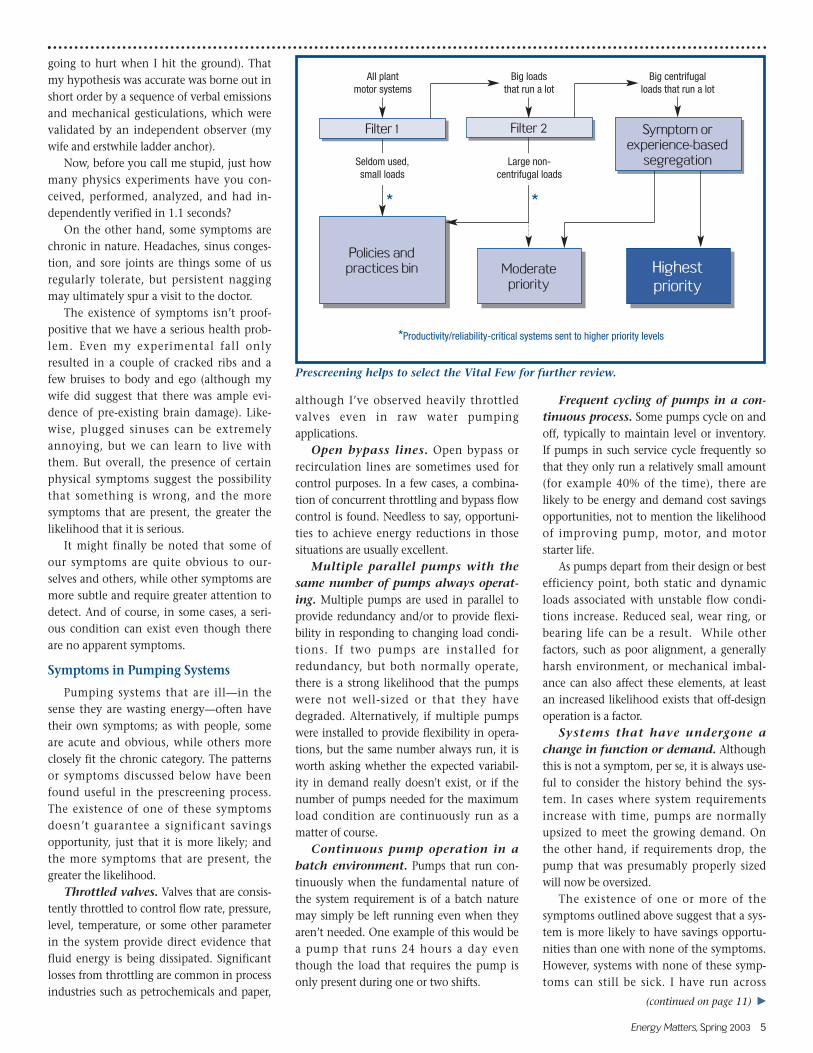
There are 11 major refining processes thatrepresent the principal end uses of steam inthe petroleum refining industry. The esti-mated steam energy requirements for majorpetroleum refining processes are presented inFigure 3. Process steam energy-use require-ments vary between 0.5 and 246.1 trillion Btu.Note that visbreaking and coking operations are net steam producers.
The major sources of steam generation inthe petroleum refining industry are boilersand heat recovery steam generators. The esti-mated boiler capacity in the refining industryis about 210,000 MMBtu/hr. Boilers that gen-erate more than 250 MMBtu/hr account forabout 100,000 MMBtu/hr, or roughly 48% ofthe industry’s total boiler capacity. Most ofthe boiler capacity in the petroleum refiningindustry is fired by byproduct fuels such asrefinery gas and coke. In terms of steam systempressure, about 60% of the total industryboiler capacity is at 300 psig or less. Most of theremaining boiler capacity is between 300 and1,000 psig.
Potential Savings EstimatesThe report estimates the potential savings
available from implementing steam systemimprovements in the pulp and paper, chemicalmanufacturing, and petroleum refiningindustries. To develop these savings estimates,30 performance improvement opportunitieswere identified that cover the most significant
ways to improve steam system performanceand efficiency in these target industries.
To assess the energy savings availablefrom implementing steam system improve-ments, it was determined that eliciting expertopinion would be the most effectiveapproach. Expert judgment was elicited bysending questionnaires to qualified experts.The major types of data requested were:
• Fuel savings• Percentage of facility for which each
opportunity is feasible• Payback period• Reasons for implementing the improvement.
The results of this effort indicate that fuelsavings from individual steam systemimprovements range from 0.6% to 5.2%. Thepayback periods for these steam systemimprovements range from 2 to 34 months;the majority are less than 24 months. Thepercentages of facilities for which theseimprovements are feasible range from 3.4%to 29.4%.
Overall industry fuel savings, which arethe combination of estimates for fuel savingsand the percentage of facilities for which anopportunity is feasible for each of the 30opportunities, range from 0.02% to 3.0%.The data showing overall fuel savings for themajor areas of a steam system are shown inFigure 4.
When combined, the total potential fuelsavings from these steam system improve-ment opportunities totaled over 12% foreach industry. Table 1 indicates that the totalestimated energy savings potential for these
Energy Matters, Spring 2003 3
(continued on page 10) �
Figure 3. Estimated steam energy use for major petroleum refining processes.
Isopentane/Isohexane
Isobutane
Alkylation
Catalytic Reforming
Catlaytic Hydrotreating
Catalytic Hydrocracking
Fluid Catalytic Cracking
Coking Operations
Visbreaking
Vacuum Distillation
Atmospheric Distillation
-100 0 100 200 300
Trillion Btu
In 1999, Ash Grove Cement Companyimplemented an optimization project on afan system in its Durkee, Oregon, cementplant. Because of a severe vibration problem,the plant’s fan system would often fail andrequired frequent repairs to the ductworkand adjoining machinery. Working withMagnaDrive plant personnel replaced thefan’s belt drive with an Adjustable SpeedDrive (ASD) system to improve fan systemcontrol and lower its energy consumption.This change eliminated the vibration prob-lem and improved the system’s airflow con-trol and energy efficiency.
The project yielded annual maintenanceand energy cost savings of $16,000 andenergy savings of 175,000 kilowatt-hours(kWh). In addition, the fan system’simproved reliability allowed the plant toachieve its desired production level. The totalproject cost was approximately $13,500,which gave the Durkee plant a simple pay-back of 10 months.
Proper optimization of a fan system canhave substantial benefits that go beyond
energy savings. In the case of the AshGrove plant, the design of the bag-house’s fan system led to excessivevibration. This excessive vibrationimposed heavy maintenance costs onthe plant and seriously hindered theplant’s productivity. Replacing theexisting belt-driven drive with an ASDeliminated the source of the system’smaintenance burden, which improvedthe plant’s productivity and reducedits energy consumption. The ASDallowed for the energy savings and bet-ter performance by accurately match-ing the appropriate fan speed to thesystem demand. The new drive alsoallows the system to operate reliably because,instead of being controlled by dampers,which caused the original vibration problem,airflow is now controlled by the ASD. This typeof drive can be applied in many ventilationor fan systems that require variable output tomeet changing load patterns. In addition, anASD can improve the performance of othersystems such as blowers, pumps, compres-sors, grinders, mills, and conveyors.
Take a look at what others in your indus-try have done to increase their energy savings by reading their case studies. You canview these documents at http://www.oit.doe.gov/bestpractices/case_studies.shtml.Or, order a document from the IndustrialTechnologies Program Clearinghouse. Youcan e-mail the Clearinghouse at [email protected], or call 800-862-2086. ●
4 Energy Matters, Spring 2003
Fan System Optimization Improves Production, Saves Energy at Cement Plant
By Don Casada, Diagnostic Solutions, LLC,Knoxville, TN
Previous Energy Mattersarticles (1, 2) broachedthe subject of the needto focus efforts for bothreliability and energypurposes on those systems with the greatestpotential for improvement or savingsopportunities. As an example, the fact that arelatively small percentage of the motorpopulation was responsible for most of theenergy consumption in U.S. industryimplied the need to focus system–(not com-ponent–) level evaluations on large equip-ment that runs a lot.
But in many industrial facilities, manybig pieces of equipment run most of thetime. In this article, we'll focus on pumpingsystems, and use a different approach—thepresence of certain symptoms—to furtherprescreen opportunities for savings.
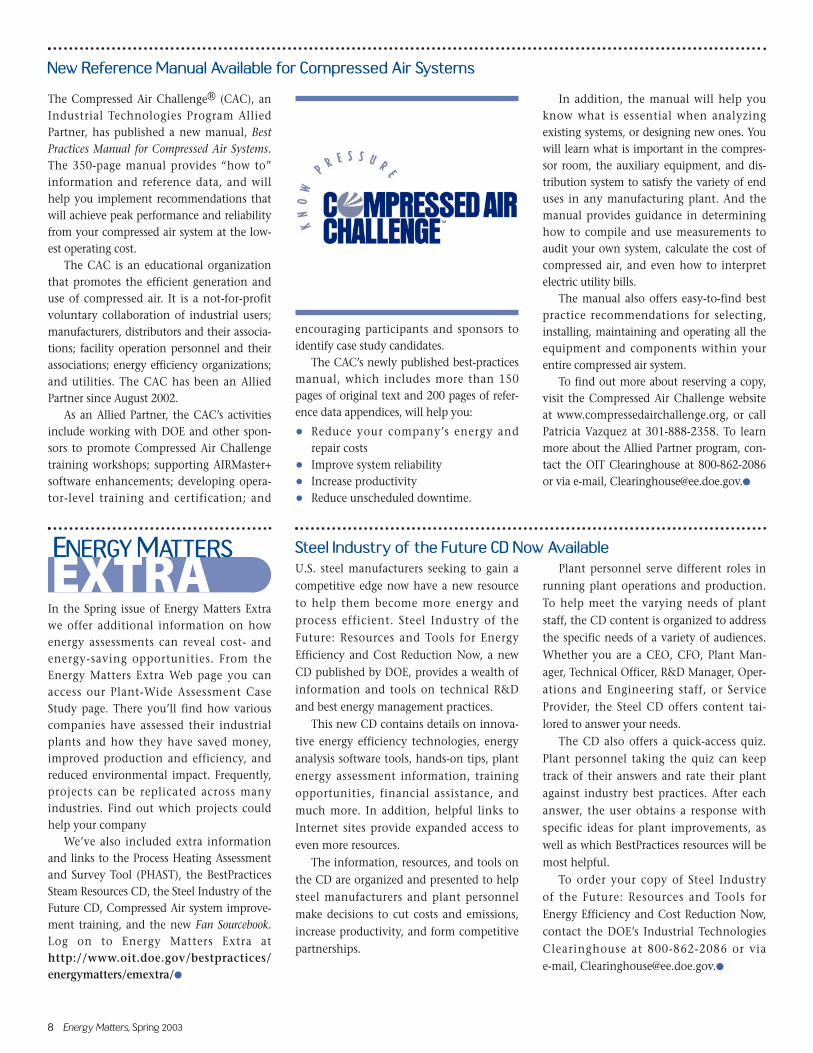
The goal of prescreening is to identifyand prioritize the systems where we’re most
likely to find significant opportunities forimprovement or savings. Although thesymptoms we will discuss are specific topumping systems, analogous conditionsexist in other fluid handling systems, suchas fan systems.
Pumping systems share a number ofcommon features with people, and readersmight find it helpful to consider them in ananalogous sense. For example, both peopleand pumping systems:
• Are composed of a variety of components
• Require external sources of energy andenergy conversion devices to keep themgoing, and
• Have a device that keeps fluid moving,but at a rate and pressure controlled byother components and factors.It also turns out that symptoms, both in
people and in pumping systems, can behelpful indicators of health.
Symptoms in People
While we are encouraged, particularly aswe get older, to get periodic checkups of one
form or another, we still rely on symptoms toserve as primary indicators of physical andmental health.
In some cases, the symptoms are acuteand obvious. I recently conducted an un-planned verification of several laws ofphysics; in particular, the relationshipbetween potential and kinetic energy.
A 4-inch-diameter poplar limb which Ihad just cut hit the ground and in a combat-ive demonstration of its resilience, sprungand knocked out from beneath me the unse-cured ladder upon which I was perched. Upuntil this arboreal rebellion, I was about 20feet off the ground, chainsaw in hand. Recognizing that this situation was in realitya once-in-a-lifetime experimental opportu-nity (of the variety that often culminates alifetime), I quickly ensured that a majorsource of external thermodynamic andkinetic energy (the chainsaw) would not con-fuse the experimental results (I tossed it offto the side). Even though this was anunplanned test, I was able to quickly developan experimental hypothesis (that it was
New mechanical ASD installed on the baghousefan system.
Performance Optimization Tips: A Symptoms Approach to Identifying EfficiencyImprovement Opportunities
going to hurt when I hit the ground). Thatmy hypothesis was accurate was borne out inshort order by a sequence of verbal emissionsand mechanical gesticulations, which werevalidated by an independent observer (mywife and erstwhile ladder anchor).
Now, before you call me stupid, just howmany physics experiments have you con-ceived, performed, analyzed, and had in- dependently verified in 1.1 seconds?
On the other hand, some symptoms arechronic in nature. Headaches, sinus conges-tion, and sore joints are things some of usregularly tolerate, but persistent naggingmay ultimately spur a visit to the doctor.
The existence of symptoms isn’t proof-positive that we have a serious health prob-lem. Even my experimental fall onlyresulted in a couple of cracked ribs and afew bruises to body and ego (although mywife did suggest that there was ample evi-dence of pre-existing brain damage). Like-wise, plugged sinuses can be extremelyannoying, but we can learn to live withthem. But overall, the presence of certainphysical symptoms suggest the possibilitythat something is wrong, and the moresymptoms that are present, the greater thelikelihood that it is serious.
It might finally be noted that some ofour symptoms are quite obvious to our-selves and others, while other symptoms aremore subtle and require greater attention todetect. And of course, in some cases, a seri-ous condition can exist even though thereare no apparent symptoms.
Symptoms in Pumping Systems
Pumping systems that are ill—in thesense they are wasting energy—often havetheir own symptoms; as with people, someare acute and obvious, while others moreclosely fit the chronic category. The patternsor symptoms discussed below have beenfound useful in the prescreening process.The existence of one of these symptomsdoesn’t guarantee a significant savingsopportunity, just that it is more likely; andthe more symptoms that are present, thegreater the likelihood.
Throttled valves. Valves that are consis-tently throttled to control flow rate, pressure,level, temperature, or some other parameterin the system provide direct evidence thatfluid energy is being dissipated. Significantlosses from throttling are common in processindustries such as petrochemicals and paper,
although I’ve observed heavily throttledvalves even in raw water pumping applications.
Open bypass lines. Open bypass orrecirculation lines are sometimes used forcontrol purposes. In a few cases, a combina-tion of concurrent throttling and bypass flowcontrol is found. Needless to say, opportuni-ties to achieve energy reductions in those situations are usually excellent.
Multiple parallel pumps with thesame number of pumps always operat-ing. Multiple pumps are used in parallel toprovide redundancy and/or to provide flexi-bility in responding to changing load condi-tions. If two pumps are installed forredundancy, but both normally operate,there is a strong likelihood that the pumpswere not well-sized or that they havedegraded. Alternatively, if multiple pumpswere installed to provide flexibility in opera-tions, but the same number always run, it isworth asking whether the expected variabil-ity in demand really doesn't exist, or if thenumber of pumps needed for the maximumload condition are continuously run as amatter of course.
Continuous pump operation in abatch environment. Pumps that run con-tinuously when the fundamental nature ofthe system requirement is of a batch naturemay simply be left running even when theyaren’t needed. One example of this would bea pump that runs 24 hours a day eventhough the load that requires the pump isonly present during one or two shifts.
Frequent cycling of pumps in a con-tinuous process. Some pumps cycle on andoff, typically to maintain level or inventory.If pumps in such service cycle frequently sothat they only run a relatively small amount(for example 40% of the time), there arelikely to be energy and demand cost savingsopportunities, not to mention the likelihoodof improving pump, motor, and motorstarter life.
As pumps depart from their design or bestefficiency point, both static and dynamicloads associated with unstable flow condi-tions increase. Reduced seal, wear ring, orbearing life can be a result. While other factors, such as poor alignment, a generallyharsh environment, or mechanical imbal-ance can also affect these elements, at leastan increased likelihood exists that off-designoperation is a factor.
Systems that have undergone achange in function or demand. Althoughthis is not a symptom, per se, it is always use-ful to consider the history behind the sys-tem. In cases where system requirementsincrease with time, pumps are normallyupsized to meet the growing demand. Onthe other hand, if requirements drop, thepump that was presumably properly sizedwill now be oversized.
The existence of one or more of thesymptoms outlined above suggest that a sys-tem is more likely to have savings opportu-nities than one with none of the symptoms.However, systems with none of these symp-toms can still be sick. I have run across
Energy Matters, Spring 2003 5
(continued on page 11) �
Prescreening helps to select the Vital Few for further review.
Moderatepriority
Filter 2
All plantmotor systems
Big loadsthat run a lot
Big centrifugalloads that run a lot
*Productivity/reliability-critical systems sent to higher priority levels
Policies andpractices bin Moderate
priorityHighestpriority
Seldom used,small loads
Large non-centrifugal loads
* *
Filter 1 Symptom orexperience-based
segregation
In 2000, Caraustar in partnership with DOE conducted plant-wide energy assessments at two ofits recycled paperboard mills, the Chesapeake Mill in Baltimore, Maryland, and the RittmanMill in Rittman, Ohio. The assessments identified potential opportunities for systems andprocess efficiency improvements that could result in important energy savings and improvedproductivity. The projects would particularly improve the efficiency of plant steam systems andwould substantially decrease dependence on purchased electricity and fuel. Annual cost savingswere estimated at $1.2 million and $370,000 at the Rittman and Chesapeake mills, respectively.
Table 1 lists the systems and processed identified in the assessment of the Chesapeake Millto have the greatest opportunity for energy savings. Table 2 provides assessment results for theRittman Mill.
Caraustar is a major manufacturer of recycled paperboard and converted paperboard products. Caraustar operates over 100 facilities in the United States along with plants in Mexicoand the United Kingdom. Caraustar manufactures its products primarily from recovered fiberderived from recycled paperstock. At its 16 paperboard mills, Caraustar produces various gradesof uncoated and clay-coated recycled paperboard both for internal consumption and for sale tocustomers in four principal markets. In addition to the mills, Caraustar’s facilities include tubeand core converting plants, composite container plants, folding carton plants, and speciality converting plants.
Large quantities of electricity, natural gas, coal, and oil are used in the production of recy-cled paperboard. Caraustar purchases electricity and natural gas for all its facilities, but also pur-chases significant quantities of fuel oil and coal for many of its recycled paperboard mills.
6 Energy Matters, Spring 2003
Pump System OptimizationSaves Energy, ImprovesProductivity at a Paper MillIn 2000, Daishowa America implemented aproject on the effluent pumping system at itspaper mill in Port Angeles, Washington.Chronic maintenance issues and risingenergy costs led personnel at the mill toreview the pumping system for energy efficiency opportunities. This review allowedmill personnel to devise a system-level pro-ject that decreased the pumping system’senergy consumption. The project involvedinstalling Adjustable Speed Drives (ASDs) ontwo of the system’s three pumps. The ASDs’replaced the system’s control scheme, whichpreviously relied on bypass and throttlingvalves. This upgrade allowed the system tooperate more effectively, yielding annualenergy savings of $32,000 and 700,000 kilowatt-hours (kWh).
The project also eliminated problems thatled to excessive maintenance costs, resultingin an annual $10,000 maintenance savings.The total project cost was $75,000. Totalannual savings were $42,000, which yields asimple payback of just over 21 months.
Having the proper control scheme inplace is critical for a pumping system to oper-ate efficiently. Relying on bypass and throt-tling valves to control a pumping system canlead to energy waste and excessive mainte-nance requirements. At the Port Angeles mill,using bypass and throttling valves causedmill personnel to operate the pumps at agreater capacity than was necessary, and inways that placed great stress on the processpiping and internal system components.Operating the pumps this way led to energywaste by moving 2,200 gallons per minute inexcess of the process’s requirements.
The project on the Port Angeles mill’seffluent pumping system reduced the sys-tem’s flow rate by 31% and allowed onepump to operate at variable load, reducingenergy consumption.
Take a look at what others in your indus-try have done to increase their energy savings by reading their case studies. You canview these documents at http://www.oit.doe.gov/bestpractices/case_studies.shtml.Or, order a document from the IndustrialTechnologies Program Clearinghouse. Youcan e-mail the Clearinghouse at [email protected], or call 800-862-2086.●
Caraustar Industries Energy Assessment Provides a Company-Wide Model
TABLE 1. SYSTEMS AND PROCESSES EVALUATED FOR ENERGY EFFICIENCY IMPROVEMENTS ATCARAUSTAR’S CHESAPEAKE MILL
Renovate vapor-absorption systems and use n/a n/a n/adirect stack gas heat recovery from boilers
(continues) �
Energy Matters, Spring 2003 7
Energy accounts for 15% to 25% of eachmill’s total operating expenses, and is thirdonly to raw material and labor in a mill’soperating cost structure.
Caraustar has made a commitment tocontinually maintain and improve its paper-board mills. During the past 5 years, Caraus-tar has spent over $30 million annually incapital expenditures, primarily to expandand upgrade its paperboard production, andto convert capacity by acquiring and main-taining state-of-the-art machinery and technology.
Assessment OverviewCaraustar has historically monitored the
cost per ton of paper produced in its MillGroup. As a result of this study, the companyhas also begun to document energy costs forthe Industrial and Consumer Products andPackaging divisions.
Caraustar conducted the plant-wideenergy assessment in association with Ster-ling Energy Services, LLC. The project waspartially funded by the Department ofEnergy’s (DOE) Industrial Technologies Pro-gram. The assessment team conducted com-prehensive plant energy efficiency reviewsusing a systems approach combined withindustry standard practices. Opportunitiesfor energy savings were identified and docu-mented, then evaluated and prioritized basedon potential for energy savings. Maintenancepractices and operating procedures were also reviewed for their impact on energy efficiency.Assessment Implementation
The assessment team first developed com-plete lists of the energy-consuming produc-tion and mill utility processes (steam,compressed air, and on-site power produc-tion). The team conducted detailed audits ofthe processed believed to have the greatestenergy savings potential.
The areas investigated included:• Steam systems• Cogeneration assessment• Waste heat recovery• Motor analysis• Compressed air systems• Lighting systems• Electric variable speed drive analysis.Seven specific systems and processes were
evaluated in detail for efficiency improve-ment or cost reductions for the Chesapeakemill.
(Caraustar closed the Chesapeake mill inthe spring of 2000 because of overcapacity in
the industry and otherissues. In spite of this clo-sure, Caraustar realized thatthe assessment’s findingswere valid for similar facilities.)
The systems and processesevaluated at the Chesapeakemill included:
• Backpressure steam turbine generator
• Boiler feed pump variable speed electricdrive
• Boiler feed pump steam turbine drive
• Paper machine #2 variable speed electricdrive retrofit
• Vapor -absorpt ion system boiler stack heat recovery
• Stock pulper fill water heat exchangers
• Improved insulation of steam pipes.Six systems and processes were also evalu-
ated for efficiency improvements at theRittman mill. These included:
• Project requirements analysis for mill cogeneration (replacement or retrofit of existing operations)
• Benchmarking mill operations’ energy use
• Pulper fill water heat exchangers• Modifications to steam injection stock
heater• Coater oven steam requirement effi-
ciency or elimination• Heat recovery for vapor-absorption system.
Actions Identified in the AssessmentThe plant-wide studies concentrated on
identification of energy efficiency improve-ments for Caraustar’s Chesapeake andRittman mills, with an extended focus on thedevelopment of efficiency concepts thatcould be transferred to other Caraustar facili-ties. Many of the efficiency measures identi-fied and evaluated in this assessment willbenefit other Caraustar mills as well as thoseof other recycled paperboard manufacturers.These include:
• Pulper fill water heat exchangers• Steam pipe insulation.The application of these energy efficiency
measures is being reviewed for other Caraus-tar mills. In addition to the energy efficiencymeasures identified, other measures werefound that did not offer immediate benefitsfor either Chesapeake or Rittman, but shouldoffer some benefits to other Caraustar loca-tions. These measures include:
• Boiler forced draft fan variable speed drives
• Paper machine dryer section drive retrofits.
Before initiating the two mill energyassessments, Caraustar had already under-taken a project to inventory electric motorsat selected mills to identify savings opportu-nities that could be realized from implemen-tation of a formal motor managementprogram. The plant-wide energy assessmentpermitted the project team to accelerate themotor management effort. As a result,Caraustar has implemented a corporate procurement program for electric motors,power transmission, and related industrialequipment that has reduced the cost of purchasing these items, and boosted theopportunities to improve the overall effi-ciency of each plant’s motor inventory. Theplant-wide energy assessment project hasbeen an important component in extendingCaraustar’s focus on energy efficiency andcost reduction measures in all divisions.
(continued on page 11) �
Paperboard production may be significantly improvedwith energy saving measures initiated through a detailed evaluation process.
8 Energy Matters, Spring 2003
New Reference Manual Available for Compressed Air Systems
The Compressed Air Challenge® (CAC), anIndustrial Technologies Program Allied Partner, has published a new manual, BestPractices Manual for Compressed Air Systems.The 350-page manual provides “how to”information and reference data, and willhelp you implement recommendations thatwill achieve peak performance and reliabilityfrom your compressed air system at the low-est operating cost.
The CAC is an educational organizationthat promotes the efficient generation anduse of compressed air. It is a not-for-profitvoluntary collaboration of industrial users;manufacturers, distributors and their associa-tions; facility operation personnel and theirassociations; energy efficiency organizations;and utilities. The CAC has been an AlliedPartner since August 2002.
As an Allied Partner, the CAC’s activitiesinclude working with DOE and other spon-sors to promote Compressed Air Challengetraining workshops; supporting AIRMaster+software enhancements; developing opera-tor-level training and certification; and
encouraging participants and sponsors toidentify case study candidates.
The CAC’s newly published best-practicesmanual, which includes more than 150pages of original text and 200 pages of refer-ence data appendices, will help you:
• Reduce your company’s energy andrepair costs
• Improve system reliability
• Increase productivity
• Reduce unscheduled downtime.
In addition, the manual will help youknow what is essential when analyzing existing systems, or designing new ones. Youwill learn what is important in the compres-sor room, the auxiliary equipment, and dis-tribution system to satisfy the variety of enduses in any manufacturing plant. And themanual provides guidance in determininghow to compile and use measurements toaudit your own system, calculate the cost ofcompressed air, and even how to interpretelectric utility bills.
The manual also offers easy-to-find bestpractice recommendations for selecting,installing, maintaining and operating all theequipment and components within yourentire compressed air system.
To find out more about reserving a copy,visit the Compressed Air Challenge websiteat www.compressedairchallenge.org, or callPatricia Vazquez at 301-888-2358. To learnmore about the Allied Partner program, con-tact the OIT Clearinghouse at 800-862-2086or via e-mail, [email protected].●
Steel Industry of the Future CD Now AvailableU.S. steel manufacturers seeking to gain acompetitive edge now have a new resourceto help them become more energy andprocess efficient. Steel Industry of theFuture: Resources and Tools for Energy Efficiency and Cost Reduction Now, a newCD published by DOE, provides a wealth ofinformation and tools on technical R&Dand best energy management practices.
This new CD contains details on innova-tive energy efficiency technologies, energyanalysis software tools, hands-on tips, plantenergy assessment information, trainingopportunities, financial assistance, andmuch more. In addition, helpful links toInternet sites provide expanded access toeven more resources.
The information, resources, and tools onthe CD are organized and presented to helpsteel manufacturers and plant personnelmake decisions to cut costs and emissions,increase productivity, and form competitivepartnerships.
Plant personnel serve different roles inrunning plant operations and production.To help meet the varying needs of plantstaff, the CD content is organized to addressthe specific needs of a variety of audiences.Whether you are a CEO, CFO, Plant Man-ager, Technical Officer, R&D Manager, Oper-ations and Engineering staff, or ServiceProvider, the Steel CD offers content tai-lored to answer your needs.
The CD also offers a quick-access quiz.Plant personnel taking the quiz can keeptrack of their answers and rate their plantagainst industry best practices. After eachanswer, the user obtains a response withspecific ideas for plant improvements, aswell as which BestPractices resources will bemost helpful.
To order your copy of Steel Industry of the Future: Resources and Tools forEnergy Efficiency and Cost Reduction Now,contact the DOE’s Industrial TechnologiesClearinghouse at 800-862-2086 or via e-mail, [email protected].●
In the Spring issue of Energy Matters Extrawe offer additional information on howenergy assessments can reveal cost- andenergy-saving opportunities. From theEnergy Matters Extra Web page you canaccess our Plant-Wide Assessment CaseStudy page. There you’ll find how variouscompanies have assessed their industrialplants and how they have saved money,improved production and efficiency, andreduced environmental impact. Frequently,projects can be replicated across manyindustries. Find out which projects couldhelp your company
We’ve also included extra informationand links to the Process Heating Assessmentand Survey Tool (PHAST), the BestPracticesSteam Resources CD, the Steel Industry of theFuture CD, Compressed Air system improve-ment training, and the new Fan Sourcebook.Log on to Energy Matters Extra athttp://www.oit.doe.gov/bestpractices/energymatters/emextra/●
EXTRAENERGY MATTERS
Energy Matters, Spring 2003 9
More than 470 energy professionals, govern-ment officials and researchers from across thecountry convened in Houston in March forthe 2003 Texas Technology Showcase. Thethree-day event provided an opportunity tosee energy-efficient process technologies andbest energy management practices that arenow emerging in the chemical and refiningindustries.
The U.S. Department of Energy and theTexas Industries of the Future sponsored theevent, and showcased 7 chemical producersand refiners in the Houston area. Somecompanies presented energy reduction technologies via educational sessions whileothers hosted tours of their Houston-areafacilities. Showcase companies profiled dur-ing the event included: Calpine, ChevronPhillips Chemical Company, Dow Chemi-cal, ExxonMobil, Merisol, Rohm and HaasTexas Inc., and Valero Energy Corporation.
There was also a powerful roster of
speakers at the event. Jim Gallogly, presi-dent and CEO, Chevron Phillips ChemicalCompany LP, was the keynote speaker. Inhis presentation, “From Smokestacks toEmerald Cities,” Gallogly focused on tellingthe chemical industry’s story better and on theimportance of having a better story to tell.
Other speakers included David Garman,assistant secretary, Energy Efficiency andRenewable Energy, U.S. Department ofEnergy; Chairman Robert J. Huston, TexasCommission on Environmental Quality, and
Commissioner Victor Carrillo, Texas RailroadCommission. Garman, Huston, and Carrillodiscussed legislative and related issues,detailing national and Texas developments.
Other highlights from the 2003 TexasTechnology Showcase included:• It provided a forum for industry, political
and governmental leaders to worktogether, showcase industry best prac-tices, new technologies, and partnershipsthat will change the way the chemicaland refining industries tackle emissionsreduction and improve efficiency
• Government, industry and researchershad the chance to tour Houston-areapetrochemical facilities and see first-hand how the Showcase companies areworking to improve energy efficiencyand address environmental concerns
• It facilitated communication betweenpetrochemical companies to discuss
Compressed Air System Project Improves Efficiency and Production at Harland Publishing Facility
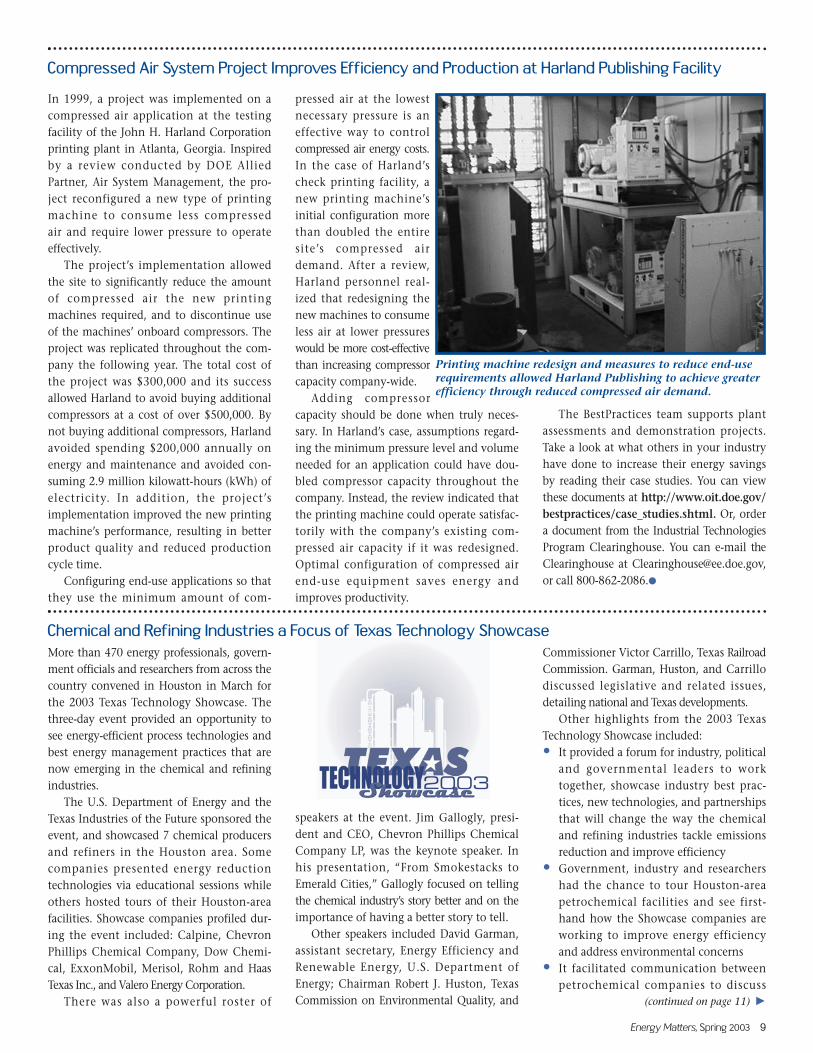
In 1999, a project was implemented on acompressed air application at the testingfacility of the John H. Harland Corporationprinting plant in Atlanta, Georgia. Inspiredby a review conducted by DOE Allied Partner, Air System Management, the pro-ject reconfigured a new type of printingmachine to consume less compressed air and require lower pressure to operateeffectively.
The project’s implementation allowedthe site to significantly reduce the amountof compressed air the new printingmachines required, and to discontinue useof the machines’ onboard compressors. Theproject was replicated throughout the com-pany the following year. The total cost ofthe project was $300,000 and its successallowed Harland to avoid buying additionalcompressors at a cost of over $500,000. Bynot buying additional compressors, Harlandavoided spending $200,000 annually onenergy and maintenance and avoided con-suming 2.9 million kilowatt-hours (kWh) ofelectricity. In addition, the project’s implementation improved the new printingmachine’s performance, resulting in betterproduct quality and reduced productioncycle time.
Configuring end-use applications so thatthey use the minimum amount of com-
pressed air at the lowestnecessary pressure is aneffective way to controlcompressed air energy costs.In the case of Harland’scheck printing facility, anew printing machine’sinitial configuration morethan doubled the entiresite’s compressed airdemand. After a review,Harland personnel real-ized that redesigning thenew machines to consumeless air at lower pressureswould be more cost-effectivethan increasing compressorcapacity company-wide.
Adding compressorcapacity should be done when truly neces-sary. In Harland’s case, assumptions regard-ing the minimum pressure level and volumeneeded for an application could have dou-bled compressor capacity throughout thecompany. Instead, the review indicated thatthe printing machine could operate satisfac-torily with the company’s existing com-pressed air capacity if it was redesigned.Optimal configuration of compressed air end-use equipment saves energy andimproves productivity.
The BestPractices team supports plantassessments and demonstration projects.Take a look at what others in your industryhave done to increase their energy savingsby reading their case studies. You can viewthese documents at http://www.oit.doe.gov/bestpractices/case_studies.shtml. Or, ordera document from the Industrial TechnologiesProgram Clearinghouse. You can e-mail theClearinghouse at [email protected],or call 800-862-2086.●
Printing machine redesign and measures to reduce end-userequirements allowed Harland Publishing to achieve greaterefficiency through reduced compressed air demand.
(continued on page 11) �
Chemical and Refining Industries a Focus of Texas Technology Showcase
10 Energy Matters, Spring 2003
30 steam system improvement opportunitiesis 674 trillion Btu.
This data illustrates two key results.• Individual fuel saving opportunities can
be significant, especially because facili-ties can often implement several steam system improvements. Because most payback periods are less than 2 years, these improvements are generally worth considering.
• Total potential energy savings associatedwith steam improvements are significant,amounting to over 12% for each target industry.
The BestPractices Steam program hasdeveloped a number of software tools andresources that can be used to identify thetypes of steam improvement opportunitiesillustrated in the Steam Assessment. Thesetools include:
• The Steam System Scoping Tool (SSST), a simple self-assessment tool that can be used to assess the major steam systembest practice areas
• The Steam System Survey Guide, a technical reference document that pro-vides details on how to calculate the magnitude of potential steam savings for key improvement areas
• The new Steam System Assessment Tool (SSAT), a spreadsheet-based steam system opportunity assessment tool that can be used to demonstrate the magnitude—energy, cost, and emission savings—for major steam system improvment opportunities
• The 3E-Plus Insulation Appraisal soft-ware, that can be used to determine energy, cost, and emissions savings associated with improving insulation on steam piping systems.
The BestPractices Steam program alsooffers a 1-day Steam System Training courseon a regional basis, and will be developing aSteam Tool Certification Training program inthe near future.
To download a complete copy of theSteam Assessment, visit http://www.oit.doe.gov/cfm/fullarticle.cfm/id=691.●
Steam Assesment Gauges Energy Savings continued from page 3
Figure 4. Total industry fuel savings for each part of the steam system.
0 0.50 1.00 1.50
Industry Fuel Savings (%)
Note that the Recovery, all the End-Use Opportunities, the Distribution, and the Generation categories include multiple opportunities.
2.00 2.50 3.00
SO—Plant-Wide Testing/Maintenance
SO—Insulation
SO—Steam Trap Management
SO—Water Treatment
Combined Heat and Power
Recovery
EU—Petroleum Refining
EU—Chemical Manufacturing
EU—Pulp and Paper
Distribution
Generation
Legend:SO = Special OpportunitiesEU = End Use
TABLE 1. TOTAL POTENTIAL STEAM SYSTEM ENERGY SAVINGS BY INDUSTRY
Industry Fuel Fuel Used to Generate Savings PotentialIndustry Savings (%) Steam (Trillion Btu) (Trillion Btu)
Pulp and Paper 12.5 2,221 278
Chemical Manufacturing 12.4 1,540 191
Petroleum Refining 12.2 1,675 205
Total 674
Updates Energize Decision Toolsfor Industry CDA newly updated version of the DecisionTools for Industry CD is now available, featuring an even more robust portfolio ofassessment tools. The CD includes updates tothe highly useful MotorMaster+ software(version 4.0) and AirMaster+ software programs (version 1.0.9), and two new tools:the Steam System Assessment Tool (SSAT)and the Process Heating Assessment and Survey Tool (PHAST).
The SSAT software can be applied to yoursteam system to demonstrate the energy,cost, and emissions savings of key potentialimprovement opportunities. The SSAT is areliable screening tool that contains the keyfeatures of typical steam systems, includingboilers, steam turbines, condensate systems,and deaerators.
SSAT offers a graphical model of a genericsteam system for up to 3 steam pressureheaders (high, medium, and low). You canenter data for your own plant conditions,including fuel type and cost, electricity, watercosts, initial boiler efficiency, header pres-sures, and turbine efficiencies. The toolallows you to evaluate “what if?” scenariosfor a wide range of key improvement opportunities.
PHAST provides an introduction toprocess heating methods and tools toimprove thermal efficiency of heating equip-ment. Use the tool to survey process heatingequipment that uses fuel, steam, or electric-ity, and identify the most energy-intensiveequipment. You can also perform an energy(heat) balance on selected equipment (furnaces) to identify and reduce non-productive energy use. Compare performanceof the furnace under various operating condi-tions and test “what-if” scenarios.
Also updated on the same CD is theSteam System Scoping Tool (version 1.0d) toinclude Visual Basic as well as Excel useroptions.
The software suite offered on the DecisionTools for Industry CD also includes 3E Plus,designed to help determine whether boilersystems can be optimized by insulating boilersteam lines. The software allows you to calcu-late the most economical thickness of indus-trial insulation for a variety of operatingconditions.
To obtain your copy of the Decision Toolsfor Industry CD, contact the DOE’s IndustrialTechnologies Clearinghouse at 800-862-2086or [email protected].●
Energy Matters, Spring 2003 1 1
A Symptoms Approachcontinued from page 5
Texas Showcase continued from page 9
Caraustar continued from page 7 About the Office of Energy Efficiencyand Renewable Energy
A Strong Energy Portfolio for a Strong AmericaEnergy efficiency and clean, renewable energywill mean a stronger economy, a cleaner envi-ronment, and greater energy independence forAmerica. By investing in technology break-throughs today, our nation can look forwardto a more resilient economy and secure future.
Far-reaching technology changes will be essen-tial to America's energy future. Working with awide array of state, community, industry, anduniversity partners, the U.S. Department ofEnergy's Office of Energy Efficiency andRenewable Energy invests in a portfolio ofenergy technologies that will:
• Conserve energy in the residential, commer-cial, industrial, government, and transporta-tion sectors
• Increase and diversify energy supply, with a focus on renewable domestic sources
• Upgrade our national energy infrastructure • Facilitate the emergence of hydrogen
technologies as a vital new “energy carrier.”
The OpportunitiesBiomass ProgramUsing domestic, plant-derived resources to meetour fuel, power, and chemical needsBuilding Technologies ProgramHomes, schools, and businesses that use lessenergy, cost less to operate, and ultimately, gener-ate as much power as they useDistributed Energy & Electric Reliability ProgramA more reliable energy infrastructure and reducedneed for new power plantsFederal Energy Management ProgramLeading by example, saving energy and taxpayerdollars in federal facilities FreedomCAR & Vehicle Technologies ProgramLess dependence on foreign oil, and eventualtransition to an emissions-free, petroleum-freevehicleGeothermal Technologies ProgramTapping the earth’s energy to meet our heat andpower needsHydrogen, Fuel Cells & Infrastructure Technologies ProgramPaving the way toward a hydrogen economy andnet-zero carbon energy futureIndustrial Technologies ProgramBoosting the productivity and competitiveness ofU.S. industry through improvements in energyand environmental performanceSolar Energy Technology ProgramUtilizing the sun’s natural energy to generateelectricity and provide water and space heating Weatherization & Intergovernmental ProgramAccelerating the use of today's best energy-efficient and renewable technologies in homes,communities, and businesses Wind & Hydropower Technologies ProgramHarnessing America's abundant natural resourcesfor clean power generation
To learn more, visit www.eere.energy.gov
systems with savings potential of 40% ormore even when none of these symptomswas present.
But since all of us have a finite amountof time, and hopefully our time is worthsomething to someone, it is incumbentupon us to use it wisely. I’ve personallyfound the symptom-based prescreening tobe very helpful, and hope you might find itbeneficial as well.
Diagnosis and Prescription
When the symptoms of health problemsor energy opportunities appear to warrantit, measurements and analyses are often per-formed to establish the magnitude of theproblem. If the magnitude is significantenough, the evaluation of possible treat-ments may be pursued.
But it is important to recognize thatthere is no panacea in either the human orthe energy system domains. The best treat-ment for an ailment in humans maydepend on multiple factors such as age,other health problems, and our ability topay the costs. Likewise, external factors suchas the electric rate structure, implementa-tion costs of alternatives, current and anticipated company financial health mustbe considered.
So how do we quantify the potential savings opportunities in systems that appearto be worth exploring? And even more fun-damentally, what do we do with all the systems that don’t fit our prescreening criteria—either because they're small, don’toperate a lot, or don’t exhibit any of thesesymptoms?
We’ll try to address those questions infuture articles.
References1. RCM—Gateway to a World Class
Maintenance Program, Anthony M. (Mac)Smith, Energy Matters, January/February,2000.
2. Performance Optimization Tips—TheVital Few, Don Casada, Energy Matters, September/October, 2000.●
BESTPRACTICES STEAM RESOURCESCD AVAILABLE
The BestPractices Steam Resources CD offerssteam-savvy users all the latest BestPracticessteam information on one pocket-sized CD.
If it has to do with steam, it’s on this newCD: market assessments and tip sheets, stand-alone software tools, information on BestPrac-tices services, even contacts and ideas fornetworking and training.
If you are looking for ways to increase yourplant’s productivity, reduce energy costs, and decrease emissions through steam efficiency, this CD is a good source to get youstarted.
To order your copy of the BestPracticesSteam Resources CD, contact DOE’s Industrial Technologies Clearinghouse at 800-862-2086 or [email protected].
For plant-wide assessment program information, contact Grace Ordaz of theDepartment of Energy’s Industrial Technolo-gies Program by phone at 202-586-8350 orby e-mail at [email protected]. Fortechnical details about the assessments, visitwww.oit.doe.gov/bestpractices/fact-sheets/amcast.pdf, or contact Bob Leach of the Oak Ridge National Laboratory byphone at 865-946-1352 or by e-mail [email protected].●
strategies for joint projects and partnershipsthat would help reduce emissions, waste,and costs while improving energy efficiency.Sponsors of the 2003 Texas Technology
Showcase who promoted the event to theirmembership, mailing lists, customers, andothers included: American Institute ofChemical Engineers; American PetroleumInstitute; Center for Energy and Environ-mental Resources at the University of Texas;Council of Industrial Boiler Owners; EastHarris County Manufacturers Association;Greater Houston Partnership; NationalPetrochemical & Refiners Association; SouthTexas Section of the American Institute ofChemical Engineers; State Energy Conserva-tion Office of the Texas Comptroller of Pub-lic Accounts; Texas A&M UniversityIndustrial Assessment Center; Texas Chemi-cal Council; Texas Commission on Environ-mental Quality; and the Texas Council onEnvironmental Technology.
More information on the Texas Technol-ogy Showcase is available at www.show-casetexas.org ●
This document was produced for the Office ofEnergy Efficiency and Renewable Energy at the U.S. Department of Energy (DOE) by the National Renewable Energy Laboratory, a DOE national laboratory.DOE/GO-102003-1720 • Spring 2003
T OF ENERGYD
EPA
RTMEN
U
E
NIT
ED
STAT S OFA
ER
ICA
M
Printed with a renewable-source ink on paper containingat least 50% wastepaper, including 20% postconsumerwaste
National Renewable Energy Laboratory1617 Cole BoulevardGolden, CO 80401-3393
PRSRT STDU.S. Postage
PAIDPermit No. 258
Golden, ColoradoBestPracticesThe Industrial Technologies Program’s BestPractices initiative and its Energy Matters newsletter introduce industrial endusers to emerging technologies and well-proven, cost-saving opportunities in motor,steam, compressed air, and other plant-widesystems.
FUNDAMENTALS OF COMPRESSED AIR WORKSHOP, DENVER, CO■ Aug 19, 2003
For more information, contact Roy Tiley, (410) 997-7778
NEVADA ENERGY FAIR , ELKO, NV■ Aug 25 - Aug 29, 2003
For more information, contact Michael Canty, Mining Team Lead, (202) 586-8119
NORTH AMERICAN DIE CASTING ASSOCIATION (NADCA) ■ Sep 15 - Sep 18, 2003
For more information, contact Harvey Wong, Metal Casting Team Lead, (202) 586-9235
MOTOR SYSTEMS MANAGEMENT END USER TRAINING, CHARLESTON, WV■ Sep 24, 2003
For more information, contact Roy Tiley, (410) 997-7778
PUMP, STEAM AND COMPRESSED AIR TRAINING, HOUSTON, TX ■ Oct 27 - Oct 29, 2003
For more information, contact David Salem, Chemical and Petroleum Team, (202) 586-8710
Coming Events
DOE Regional Office Representatives
■ David Godfrey, Atlanta, GA, 404-562-0568
■ Scott Hutchins, Boston, MA, 617-565-9765
■ Brian Olsen, Chicago, IL, 312-886-8479
■ Jack Jenkins, Denver, CO, 303-275-4824
■ Chris Cockrill, Seattle, WA, 816-873-3299
■ Joseph Barrett, Philadelphia, PA, 215-656-6957
INFORMATIONCLEARINGHOUSE
Do you have questions about using energy-efficient process and
utility systems in your industrial facility?Call the Industrial Technologies Program’sInformation Clearinghouse for answers, Monday through Friday 9:00 a.m. to 8:00 p.m. (EST).
Fax: 360-586-8303, or access our homepage at www.oit.doe.gov/clearinghouse.